ITAN in brief - ESPON
4
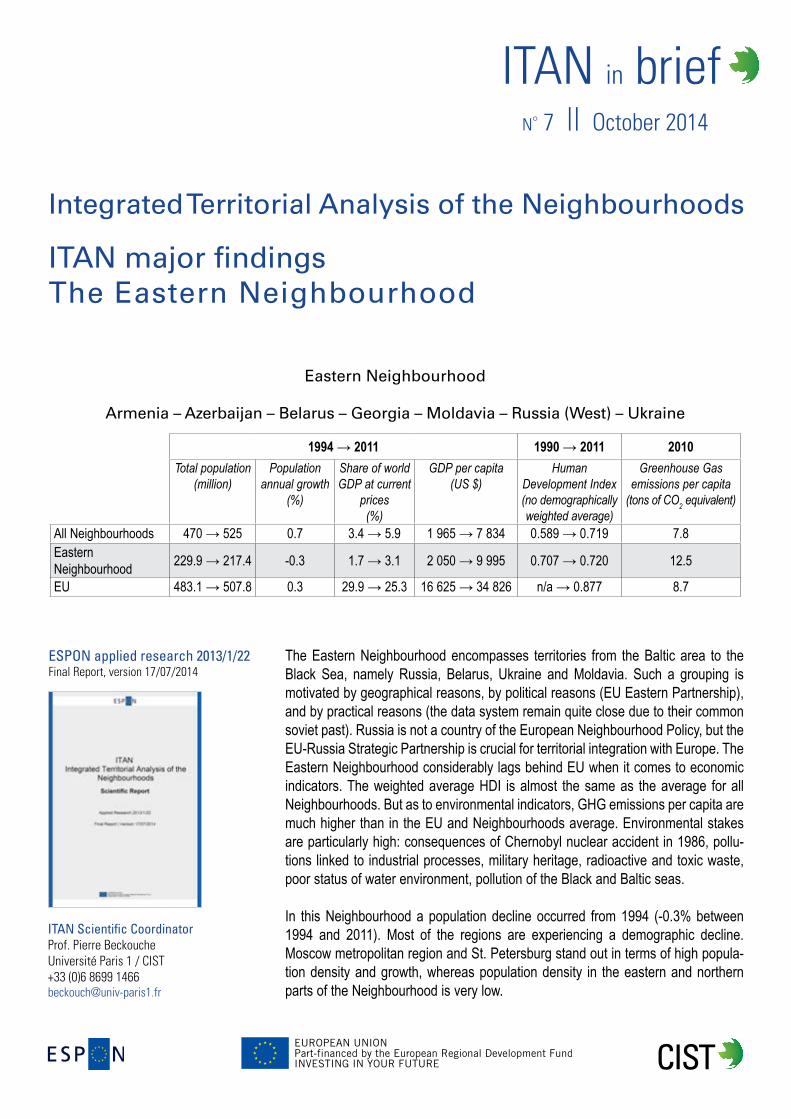
N ° 7 || October 2014 ITAN in brief Integrated Territorial Analysis of the Neighbourhoods ITAN major findings The Eastern Neighbourhood The Eastern Neighbourhood encompasses territories from the Baltic area to the Black Sea, namely Russia, Belarus, Ukraine and Moldavia. Such a grouping is motivated by geographical reasons, by political reasons (EU Eastern Partnership), and by practical reasons (the data system remain quite close due to their common soviet past). Russia is not a country of the European Neighbourhood Policy, but the EU-Russia Strategic Partnership is crucial for territorial integration with Europe. The Eastern Neighbourhood considerably lags behind EU when it comes to economic indicators. The weighted average HDI is almost the same as the average for all Neighbourhoods. But as to environmental indicators, GHG emissions per capita are much higher than in the EU and Neighbourhoods average. Environmental stakes are particularly high: consequences of Chernobyl nuclear accident in 1986, pollu- tions linked to industrial processes, military heritage, radioactive and toxic waste, poor status of water environment, pollution of the Black and Baltic seas. In this Neighbourhood a population decline occurred from 1994 (-0.3% between 1994 and 2011). Most of the regions are experiencing a demographic decline. Moscow metropolitan region and St. Petersburg stand out in terms of high popula- tion density and growth, whereas population density in the eastern and northern parts of the Neighbourhood is very low. Eastern Neighbourhood Armenia – Azerbaijan – Belarus – Georgia – Moldavia – Russia (West) – Ukraine 1994 → 2011 1990 → 2011 2010 Total population (million) Population annual growth (%) Share of world GDP at current prices (%) GDP per capita (US $) Human Development Index (no demographically weighted average) Greenhouse Gas emissions per capita (tons of CO 2 equivalent) All Neighbourhoods 470 → 525 0.7 3.4 → 5.9 1 965 → 7 834 0.589 → 0.719 7.8 Eastern Neighbourhood 229.9 → 217.4 -0.3 1.7 → 3.1 2 050 → 9 995 0.707 → 0.720 12.5 EU 483.1 → 507.8 0.3 29.9 → 25.3 16 625 → 34 826 n/a → 0.877 8.7 ESPON applied research 2013/1/22 Final Report, version 17/07/2014 ITAN Scientific Coordinator Prof. Pierre Beckouche Université Paris 1 / CIST +33 (0)6 8699 1466 [email protected]
Transcript of ITAN in brief - ESPON
n° 7 || October 2014
ITAN in brief
Integrated Territorial Analysis of the Neighbourhoods
ITAN major findingsThe Eastern Neighbourhood
The Eastern Neighbourhood encompasses territories from the Baltic area to the Black Sea, namely Russia, Belarus, Ukraine and Moldavia. Such a grouping is motivated by geographical reasons, by political reasons (EU Eastern Partnership), and by practical reasons (the data system remain quite close due to their common soviet past). Russia is not a country of the European Neighbourhood Policy, but the EU-Russia Strategic Partnership is crucial for territorial integration with Europe. The Eastern Neighbourhood considerably lags behind EU when it comes to economic indicators. The weighted average HDI is almost the same as the average for all Neighbourhoods. But as to environmental indicators, GHG emissions per capita are much higher than in the EU and Neighbourhoods average. Environmental stakes are particularly high: consequences of Chernobyl nuclear accident in 1986, pollu-tions linked to industrial processes, military heritage, radioactive and toxic waste, poor status of water environment, pollution of the Black and Baltic seas.
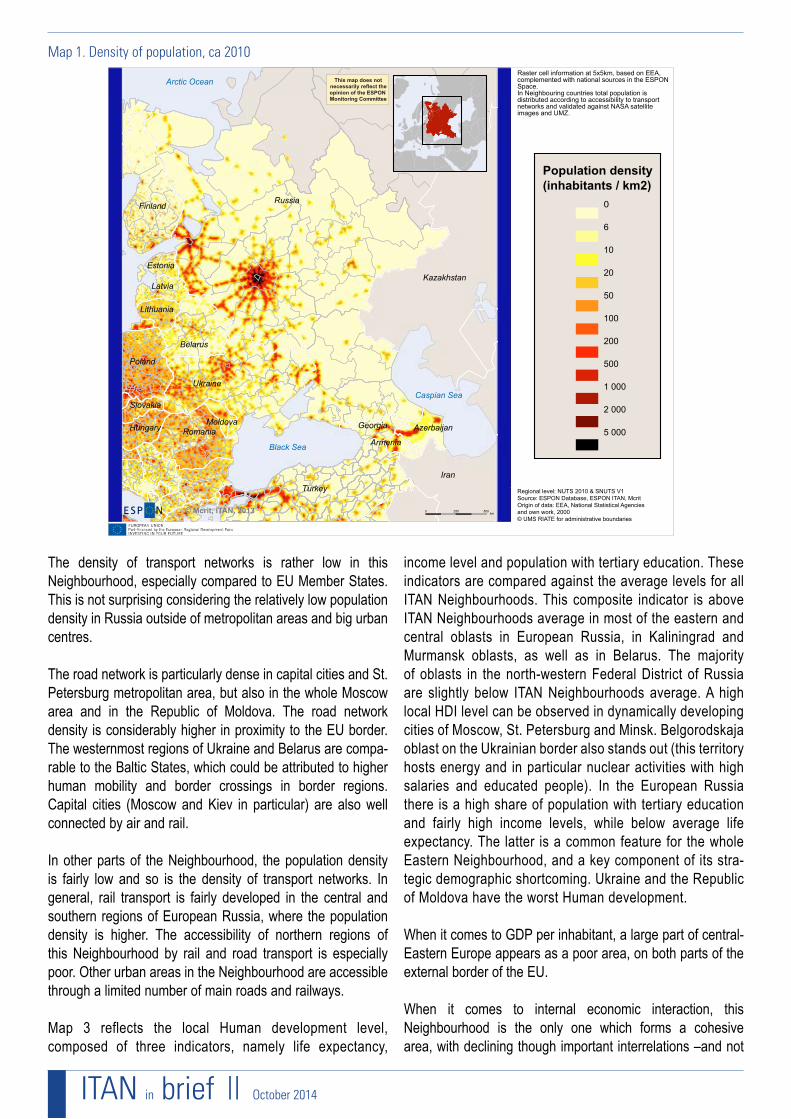
In this Neighbourhood a population decline occurred from 1994 (-0.3% between 1994 and 2011). Most of the regions are experiencing a demographic decline. Moscow metropolitan region and St. Petersburg stand out in terms of high popula-tion density and growth, whereas population density in the eastern and northern parts of the Neighbourhood is very low.
Eastern Neighbourhood
Armenia – Azerbaijan – Belarus – Georgia – Moldavia – Russia (West) – Ukraine
1994 → 2011 1990 → 2011 2010Total population
(million)Population
annual growth (%)
Share of world GDP at current
prices (%)
GDP per capita (US $)
Human Development Index (no demographically weighted average)
Greenhouse Gas emissions per capita
(tons of CO2 equivalent)
All Neighbourhoods 470 → 525 0.7 3.4 → 5.9 1 965 → 7 834 0.589 → 0.719 7.8Eastern Neighbourhood 229.9 → 217.4 -0.3 1.7 → 3.1 2 050 → 9 995 0.707 → 0.720 12.5
EU 483.1 → 507.8 0.3 29.9 → 25.3 16 625 → 34 826 n/a → 0.877 8.7
ESPON applied research 2013/1/22Final Report, version 17/07/2014
ITAN Scientific CoordinatorProf. Pierre BeckoucheUniversité Paris 1 / CIST+33 (0)6 8699 [email protected]
ITAN in brief || October 2014
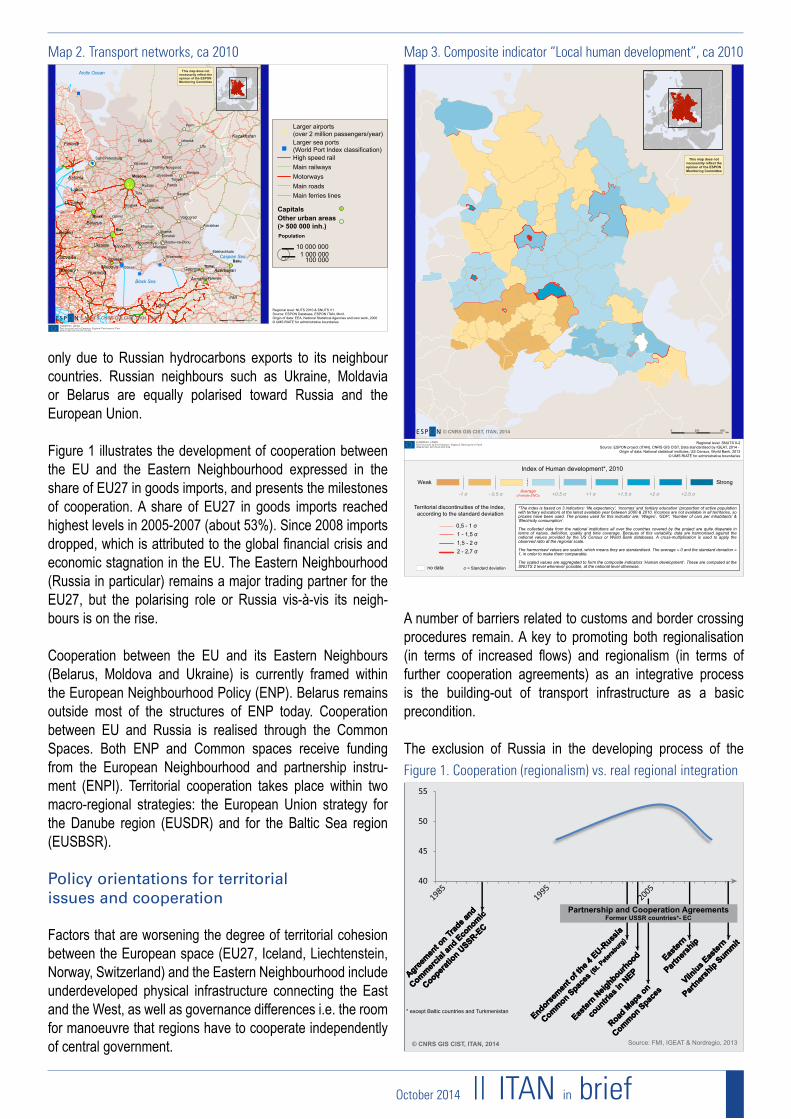
The density of transport networks is rather low in this Neighbourhood, especially compared to EU Member States. This is not surprising considering the relatively low population density in Russia outside of metropolitan areas and big urban centres.
The road network is particularly dense in capital cities and St. Petersburg metropolitan area, but also in the whole Moscow area and in the Republic of Moldova. The road network density is considerably higher in proximity to the EU border. The westernmost regions of Ukraine and Belarus are compa-rable to the Baltic States, which could be attributed to higher human mobility and border crossings in border regions. Capital cities (Moscow and Kiev in particular) are also well connected by air and rail.
In other parts of the Neighbourhood, the population density is fairly low and so is the density of transport networks. In general, rail transport is fairly developed in the central and southern regions of European Russia, where the population density is higher. The accessibility of northern regions of this Neighbourhood by rail and road transport is especially poor. Other urban areas in the Neighbourhood are accessible through a limited number of main roads and railways.
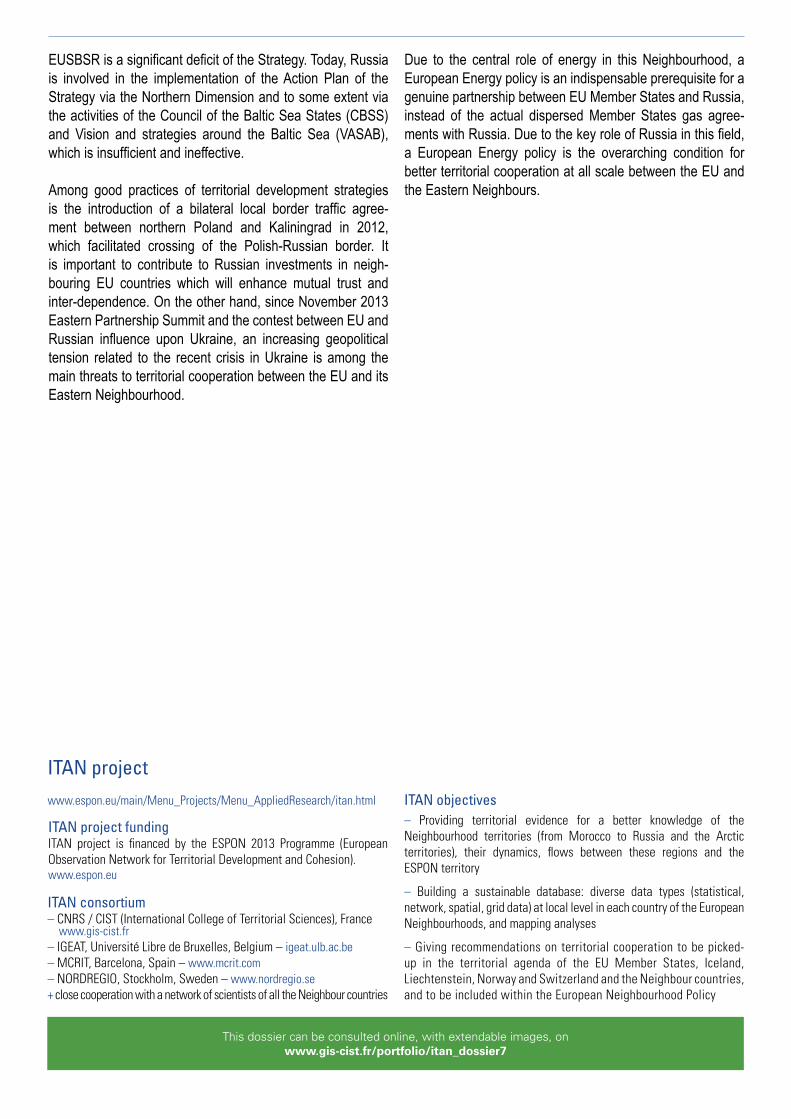
Map 3 reflects the local Human development level, composed of three indicators, namely life expectancy,
income level and population with tertiary education. These indicators are compared against the average levels for all ITAN Neighbourhoods. This composite indicator is above ITAN Neighbourhoods average in most of the eastern and central oblasts in European Russia, in Kaliningrad and Murmansk oblasts, as well as in Belarus. The majority of oblasts in the north-western Federal District of Russia are slightly below ITAN Neighbourhoods average. A high local HDI level can be observed in dynamically developing cities of Moscow, St. Petersburg and Minsk. Belgorodskaja oblast on the Ukrainian border also stands out (this territory hosts energy and in particular nuclear activities with high salaries and educated people). In the European Russia there is a high share of population with tertiary education and fairly high income levels, while below average life expectancy. The latter is a common feature for the whole Eastern Neighbourhood, and a key component of its stra-tegic demographic shortcoming. Ukraine and the Republic of Moldova have the worst Human development.
When it comes to GDP per inhabitant, a large part of central-Eastern Europe appears as a poor area, on both parts of the external border of the EU.
When it comes to internal economic interaction, this Neighbourhood is the only one which forms a cohesive area, with declining though important interrelations –and not
2
Map 1. Density of population, ca 2010
Regional level: NUTS 2010 & SNUTS V1Source: ESPON Database, ESPON ITAN, McritOrigin of data: EEA, National Statistical Agenciesand own work, 2000© UMS RIATE for administrative boundaries
This map does notnecessarily reflect theopinion of the ESPONMonitoring Committee
© Mcrit, ITAN, 2013 0 500250km
Black Sea
Caspian Sea
Arctic Ocean
Russia
Kazakhstan
TurkeyIran
Georgia
Armenia
Azerbaijan
Finland
Estonia
Latvia
Lithuania
Poland
Romania
Ukraine
Moldova
Slovakia
Hungary
Belarus
Raster cell information at 5x5km, based on EEA, complemented with national sources in the ESPONSpace.In Neighbouring countries total population isdistributed according to accessibility to transportnetworks and validated against NASA satelliteimages and UMZ.
Population density(inhabitants / km2)
0
6
10
20
50
100
200
500
1 000
2 000
5 000
October 2014 || ITAN in brief
only due to Russian hydrocarbons exports to its neighbour countries. Russian neighbours such as Ukraine, Moldavia or Belarus are equally polarised toward Russia and the European Union.
Figure 1 illustrates the development of cooperation between the EU and the Eastern Neighbourhood expressed in the share of EU27 in goods imports, and presents the milestones of cooperation. A share of EU27 in goods imports reached highest levels in 2005-2007 (about 53%). Since 2008 imports dropped, which is attributed to the global financial crisis and economic stagnation in the EU. The Eastern Neighbourhood (Russia in particular) remains a major trading partner for the EU27, but the polarising role or Russia vis-à-vis its neigh-bours is on the rise.
Cooperation between the EU and its Eastern Neighbours (Belarus, Moldova and Ukraine) is currently framed within the European Neighbourhood Policy (ENP). Belarus remains outside most of the structures of ENP today. Cooperation between EU and Russia is realised through the Common Spaces. Both ENP and Common spaces receive funding from the European Neighbourhood and partnership instru-ment (ENPI). Territorial cooperation takes place within two macro-regional strategies: the European Union strategy for the Danube region (EUSDR) and for the Baltic Sea region (EUSBSR).
Policy orientations for territorial issues and cooperation
Factors that are worsening the degree of territorial cohesion between the European space (EU27, Iceland, Liechtenstein, Norway, Switzerland) and the Eastern Neighbourhood include underdeveloped physical infrastructure connecting the East and the West, as well as governance differences i.e. the room for manoeuvre that regions have to cooperate independently of central government.
A number of barriers related to customs and border crossing procedures remain. A key to promoting both regionalisation (in terms of increased flows) and regionalism (in terms of further cooperation agreements) as an integrative process is the building-out of transport infrastructure as a basic precondition.
The exclusion of Russia in the developing process of the
3
Map 2. Transport networks, ca 2010
"
"
"""
"
Ufa
Perm
Odesa
Penza
Kazan
Samara
Ryazan
Saratov
Lipetsk
Izhevsk
Voronezh
Tolyatti
Yaroslavl
Volgograd
Ulyanovsk
Krasnodar
Astrakhan
Kryvyy RihZaporizhzhya Rostov-na-Donu
Saint Petersburg
Nizhniy Novgorod
Kiev
Baku
Minsk
Moscow
Tbilisi
Yerevan
Chisinau
Tula
Gomel
LuhanskKharkov
Donetsk
Bryansk
MariupolMakhachkala
#
#
#
#
###
Black Sea
Caspian Sea
Arctic Ocean
RussiaKazakhstan
TurkeyIran
Georgia
Armenia
Azerbaijan
Finland
Estonia
Latvia
Lithuania
Poland
Romania
Ukraine
Moldova
Slovakia
Hungary
Belarus
0 500250km
Regional level: NUTS 2010 & SNUTS V1Source: ESPON Database, ESPON ITAN, Mcrit.Origin of data: EEA, National Statistical Agencies and own work, 2000© UMS RIATE for administrative boundaries
This map does notnecessarily reflect theopinion of the ESPONMonitoring Committee
© Mcrit & CNRS GIS CIST, ITAN, 2013
#Larger airports(over 2 million passengers/year)
"Larger sea ports(World Port Index classification)High speed railMain railwaysMotorwaysMain roadsMain ferries lines
Capitals
Population
100 000
10 000 000
Other urban areas(> 500 000 inh.)
1 000 000
Map 3. Composite indicator “Local human development”, ca 2010
This map does notnecessarily reflect theopinion of the ESPONMonitoring Committee
0 500250km© CNRS GIS CIST, ITAN, 2014
Regional level: SNUTS 0-2Source: ESPON project (ITAN), CNRS GIS CIST, Data standardised by IGEAT, 2014 -
Origin of data: National statistical institutes, US Census, World Bank, 2013© UMS RIATE for administrative boundaries
Index of Human development*, 2010
no data
*The index is based on 3 indicators: ‘life expectancy’, ‘incomes’ and ‘tertiary education’ (proportion of active population with tertiary education) at the latest available year between 2000 & 2010. Incomes are not available in all territories, so proxies have been used. The proxies used for this indicator are: ‘Wages’, ‘GDP’, ‘Number of cars per Inhabitants’ & ‘Electricity consumption’.
The collected data from the national institutions all over the countries covered by the project are quite disparate in terms of nature, definition, quality and time coverage. Because of this variability, data are harmonised against the national values provided by the US Census or World Bank databases. A cross-multiplication is used to apply the observed ratio at the regional scale.
The harmonised values are scaled, which means they are standardised. The average = 0 and the standard deviation = 1, in order to make them comparable.
The scaled values are aggregated to form the composite indicators ‘Human development’. These are computed at the SNUTS 2 level whenever possible, at the national level otherwise.
Weak StrongAverage
of whole ENCs-1 σ - 0,5 σ +0,5 σ +1,5 σ +2,5 σ+1 σ +2 σ
Territorial discontinuities of the index, according to the standard deviation
2 - 2,7 σ 1,5 - 2 σ 1 - 1,5 σ 0,5 - 1 σ
σ = Standard deviation
Figure 1. Cooperation (regionalism) vs. real regional integration
© CNRS GIS CIST, ITAN, 2014 Source: FMI, IGEAT & Nordregio, 2013
1985
Agreemen
t on Tr
ade a
nd
Commercial
and Eco
nomic
Cooperatio
n USSR-E
C
Agreemen
t on Tr
ade a
nd
Commercial
and Eco
nomic
Cooperatio
n USSR-E
C
40
45
50
55
19952005
Endorsemen
t of th
e 4 EU-R
ussia
Common Spaces
(St. P
etersb
urg)
Endorsemen
t of th
e 4 EU-R
ussia
Common Spaces
(St. P
etersb
urg)
Easter
n Neig
hbourhood
countri
es in
NEP
Easter
n Neig
hbourhood
countri
es in
NEP
Road M
aps o
n
Common Spaces
Road M
aps o
n
Common Spaces
* except Baltic countries and Turkmenistan
Easter
n
Partners
hip
Easter
n
Partners
hip
Vilnius E
aster
n
Partners
hip Summit
Vilnius E
aster
n
Partners
hip Summit
Partnership and Cooperation AgreementsFormer USSR countries*- EC
EUSBSR is a significant deficit of the Strategy. Today, Russia is involved in the implementation of the Action Plan of the Strategy via the Northern Dimension and to some extent via the activities of the Council of the Baltic Sea States (CBSS) and Vision and strategies around the Baltic Sea (VASAB), which is insufficient and ineffective.
Among good practices of territorial development strategies is the introduction of a bilateral local border traffic agree-ment between northern Poland and Kaliningrad in 2012, which facilitated crossing of the Polish-Russian border. It is important to contribute to Russian investments in neigh-bouring EU countries which will enhance mutual trust and inter-dependence. On the other hand, since November 2013 Eastern Partnership Summit and the contest between EU and Russian influence upon Ukraine, an increasing geopolitical tension related to the recent crisis in Ukraine is among the main threats to territorial cooperation between the EU and its Eastern Neighbourhood.
Due to the central role of energy in this Neighbourhood, a European Energy policy is an indispensable prerequisite for a genuine partnership between EU Member States and Russia, instead of the actual dispersed Member States gas agree-ments with Russia. Due to the key role of Russia in this field, a European Energy policy is the overarching condition for better territorial cooperation at all scale between the EU and the Eastern Neighbours.
This dossier can be consulted online, with extendable images, onwww.gis-cist.fr/portfolio/itan_dossier7
ITAN project fundingITAN project is financed by the ESPON 2013 Programme (European Observation Network for Territorial Development and Cohesion).www.espon.eu
ITAN objectives– Providing territorial evidence for a better knowledge of the Neighbourhood territories (from Morocco to Russia and the Arctic territories), their dynamics, flows between these regions and the ESPON territory
– Building a sustainable database: diverse data types (statistical, network, spatial, grid data) at local level in each country of the European Neighbourhoods, and mapping analyses
– Giving recommendations on territorial cooperation to be picked-up in the territorial agenda of the EU Member States, Iceland, Liechtenstein, Norway and Switzerland and the Neighbour countries, and to be included within the European Neighbourhood Policy
ITAN projectwww.espon.eu/main/Menu_Projects/Menu_AppliedResearch/itan.html
ITAN consortium– CNRS / CIST (International College of Territorial Sciences), France
www.gis-cist.fr– IGEAT, Université Libre de Bruxelles, Belgium – igeat.ulb.ac.be– MCRIT, Barcelona, Spain – www.mcrit.com– NORDREGIO, Stockholm, Sweden – www.nordregio.se+ close cooperation with a network of scientists of all the Neighbour countries