“Italy and Sweden: a comparative analysis of financing and ...426419/FULLTEXT01.pdfthe conclusion...
52
“Italy and Sweden: a comparative analysis of financing and health services provision” Mariano Marco Supervisor: Jose’ Ferraz Nunes Examiner: Bengt Kjellén Master´s Thesis in International Business 15 ECTS Department of Economics and informatics University West Trollhättan, Sweden Spring term 2010
Transcript of “Italy and Sweden: a comparative analysis of financing and ...426419/FULLTEXT01.pdfthe conclusion...
“Italy and Sweden: a comparative analysis of financing and
health services provision”
Mariano Marco
Supervisor: Jose’ Ferraz Nunes
Examiner: Bengt Kjellén
Master´s Thesis in International Business 15 ECTS
Department of Economics and informatics
University West Trollhättan, Sweden
Spring term 2010

2
I would like to thank all the persons that
have given me their support throughout the process of conducting my thesis. Furthermore I
would like to utter my gratitude to my tutor, Josè Ferraz Nunes, for his advice and availability
throughout my research. This work is dedicated to my family, my friends and..... of course to
my- self

3
Abstract
The present study focuses on the financing and provision of health services in Italy and in
Sweden. The purpose is to compare Italian and Swedish health system with respect to these
aspects. The intention is to provide new insights to how the financing and provision health care
system in Italy and Sweden are organized and make a comparison analyzing different quantitative
data. The study is organized in two part: one “qualitative, based on literature review, and one
“statistical” based on critical analysis of data. In the theoretical part the financing flow of Italian
and Sweden public health care system, which incentives are awarded to providers and which
health services are provided, are reviewed. The statistical part shows how many resources
(human and technological) are involved in the delivery process. The main findings, discussed in
the conclusion section, suggest the need to improve the fairness in the financial contribution for
the Sweden and the need for Italy to undertake cost-control and rationalization measures. Further
research and especially greater availability of data remains to be done in order to make more
complete the comparison.

4
Table of content
1) Introduction………………………………………….…………. 5 1.1 Functions of health system………………………………………………………….. 7
1.2 Purpose and outline of the study…………………… …………………….. 9
2) Background……………………………………………………. 10 2.1 Literature review…………………………………………………………………. .. 10 2.2 Italian and Swedish health care system: a “basic” comparison………………….. 13
3) Methodology………………………………………………….. 21
4) Results………………………………………………………… 23 4.1 How financial resources are collected from citizens ………………………………… 23 4.2 How financial resources are allocated to providers…………………………………. 31
4.2 How providers deliver health care services to citizens……………………………… 36
5) Discussion…………………………………………………….. 45
6) Conclusion……………………………………………………. 48
7) Bibliography………………………………………………….. 50

5
1.Introduction:
1.1“ What is a health system
In today’s complex world, it came be difficult to say exactly what a health system is, what it
consists of, and where it begins and ends. A health system comprises all organizations,
institutions and resources devoted to producing actions whose primary intent is to improve health.
It includes the resources, actors and institutions related to the financing, regulation and provision
of health actions. This primary intent criterion leads to a broad definition of the health system.
Formal health services, including the professional delivery of personal medical attention, are
clearly within these boundaries. So are actions by traditional healers, and all use of medication,
whether prescribed by a provider or not. So is home care of the sick, which is how somewhere
between 70% and 90% of all sickness is managed (Kleinman, 1978). Such traditional public
health activities as health promotion and disease prevention, and other health-enhancing
interventions that efforts to improve road and vehicle safety where the primary intent is to reduce
road traffic accidents. Hence, the general education system is outside the “boundaries”, because
the primary intent of education is not to improve health, but specifically health-related education
is included (Murray et Frenk, 1999). Health systems have three fundamental objectives that
should be routinely monitored by all countries and should form the main basis for assessing
health system performance:
• Improving the health of the population they serve
• Responding to people’s expectations
• Providing financial protection against the costs of ill-health
Better health (…” a state of physical and mental well-being necessary to live a meaningful,
pleasant and productive life.”) is the “raison d’etre” of a health system, and unquestionably its
primary or defining goal: if health systems did not contribute to improved health we would
choose not to have them. This means making the health status of the entire population as good as
possible over people´s whole life cycle, taking account of both premature mortality and disability
(Donabedian, 1972). Other systems in society may contribute greatly to the population’s health,
but not as their primary goal (e.g. the education system makes a large difference to health, but its
defining goal is to educate).
The second intrinsic goal is to enhance the responsiveness of the health system to the legitimate
expectations of the population. It is not a measure of how the system responds to health needs
which shows up in health outcomes, but of how the system performs relative to non-health
aspects, meeting or not meeting a population’s expectations of how it should be treated by
providers of prevention, care or non-personal services (world Health report, 2000).
Responsiveness has two major components; the first component can be called ‘‘respect for
human beings as persons’’, and it captures aspects of the interaction of individuals with the health
system that often have an important ethical dimension. It includes:

6
- Respect for dignity: Health systems might be able to achieve higher levels of health by
incarcerating individuals with a communicable disease or sterilizing individuals with a genetic
disorder, but this would be a violation of basic human rights (Pernick,1997 and Leavitt, 1995) .
Respect for dignity also includes interactions with providers, such as courtesy and sensitivity to
potentially embarrassing moments of clinical interrogation or physical exploration (World
Medical association, 1981 & 1995 et Smith, 1981).
- Respect for individual autonomy. The individual should be able to act autonomously when
making choices about his/her own health. Individuals, when competent, or their agents, should
have the right to choose what interventions they do and do not receive (Brock, 1993 et Faden,
Beauchamp, King, 1993).
- Respect for confidentiality. When interacting with the health system, individuals should have
the right to preserve the confidentiality of their personal health information or determine who has
access to one’s personal health information( Rylance, 1999 et Beauchamp T, Childress J, 1989).
The second component can be called ‘‘client orientation’’, and it includes several dimensions of
consumer satisfaction that are not a function of health improvement.
It includes:
-Prompt attention to health needs: immediate attention in emergencies, and reasonable waiting
time for non- emergencies.
- Basic amenities: the basic amenities of health services, such as clean waiting rooms or adequate
beds and food in hospitals, are aspects of care that are often highly valued by the population
(Bernhart, 1999)
- Access to social support networks for individuals receiving care: an expectation of access to
social support is not only an instrumental goal, because it may enhance health outcomes, but it is
also an intrinsically valued attribute (Gilson, Alilio, Heggenhougen, 1994)
- Choice of institution and individual providing care: concerns choice of provider, or freedom to
select which individual or organization delivers one’s care
The third goal concerns fairness in financial contribution, and means that the risk each
household faces, due to the costs of the health system, are distributed according to ability to pay
rather than to the risk of illness. A health system in which individuals or household are
sometimes forced into poverty through their purchase of needed care, or forced to do without it
because of the cost, is unfair. This situation characterizes most poor countries in which at least
part of the population is inadequately protected from financial risks (Fabricant, Kamara, Mills,
1999). Paying for health care can be unfair in two different ways. It can expose families to large
unexpected expenses, that is, costs that could not be foreseen and have to be paid out of pocket at
the moment of utilization of services rather than being covered by some kind of prepayment. Or it
can impose regressive payments, in which those least able to contribute pay proportionately more
than the better- off.

7
1.2 Functions of health system
As shown in Fig.1 below in every health system organization have to perform four basic
functions: (Murray et Frenk, 1999) 1) financing; 2) provision; 3) stewardship and 4) resource
generation.
Fig.1 Functions of Health system
Sources: WHO
Health system financing is the process by which revenues are collected from primary and
secondary sources, accumulated in fund pools and allocated to provider activities. For the
purposes of analysis, it is useful to divide health system financing into three sub-functions:
revenue collection, fund pooling and purchasing.
• Revenue collection: refers to the mobilization of money from primary sources (households and
firms) and secondary sources (governments and donor agencies). Funds can be mobilized through
eight basic mechanisms: out-of-pocket payments, voluntary insurance rated by income, voluntary
insurance rated by risk, compulsory insurance, general taxes, earmarked taxes, donations from
nongovernmental organizations and transfers from donor agencies.
• Fund pooling: refers to the accumulation of revenues for the common advantage of participants.
Indeed pooling means that financial resources in the pool are no longer tied to a particular
contributor and contributors share financial risk
• Purchasing: is the process through which revenues that have been collected in fund pools are
allocated to institutional or individual providers to deliver a set of interventions. Purchasing can
range from simple budgeting exercises in highly integrated public systems, where the government
Financing
Revenue Collection
Fund pooling
Purchasing
Provision
Personal
Health
services
Non Personal
Health services
S
TE
WA
RD
ES
HIP
R
ES
OU
RC
E G
EE
RA
TIO
N

8
collects revenue through general taxation and allocates it to programmes and facilities for staff
and other costs, to more complicated strategies where specified units of inputs, outputs or
outcomes are purchased.
The second function concerns the provision of health services and refers to the combination of
inputs into a production process that takes place in a particular organizational setting and that
leads to the delivery of a series of interventions. In analyzing provision, it is useful to keep in
mind the conventional distinction between personal and non-personal health services. The former
refer to services that are consumed directly by an individual, whether they are preventive,
diagnostic, therapeutic or rehabilitative, and whether they generate externalities or not. The latter
refer to actions that are applied either to collectivities (e.g., mass health education) or to the non-
human components of the environment (e.g. basic sanitation). Health system are not limited to
institutions that finance or provide services, but include a diverse group of organizations that
produce inputs to those services, particularly human resources, physical resources such as
facilities and equipment, and knowledge. This function refers to resource generation and
encompasses universities and other educational institutions research centres, and companies
producing specific technologies such as pharmaceutical products, devices and equipment
(Roemer, 1991). The fourth function is called stewardship because concerns the careful and
responsible management of something entrusted to one’s care (Meriam Webster´s deluxe
dictionary, 1998). People entrust their bodies and their money to the health system, which has a
responsibility to protect the former and use the latter wisely and well. The government is called
on the play the role of a steward, because it spends revenues that people are required to pay
through takes and social insurance, and because it makes many of the rules that are followed in
private and voluntary transactions. It also own facilities on trust from the citizens. Private insurers
and practitioners, however, perform this function in only a slightly restricted degree, and a part of
the state´s task as the overall steward or trustee of the system is to see to it that private
organizations and actors also act carefully and responsibility. The concepts embraces more than
just regulation, and when properly conducted has a pervasive influence on all the workings of the
system.

9
1.3 Purpose and outline of the study
The purpose of my study is to compare Italian and Swedish health system with respect to
financing and provision of services. The intention is to provide new insights to how the financing
and provision health care system in Italy and Sweden are organized and make a comparison
analyzing different quantitative data. This led me towards the development of following research
questions, including:
- How health systems are financed?
- Which incentives are awarded to providers?
- Which resources ( human and technological) and units are involved in the “delivery”?
- Which health services are provided?
The study is organized in two part: one “qualitative, based on literature review, and one
“statistical” based on analysis of data. The content of each chapters is briefly outlined below.
The background, in the chapter 2, is divided in two paragraphs; in the first one is brought up the
key elements from prior literature that relates to this study. It means that were selected all the
documents, magazines, articles, web sites that helped me in the process of conducting this thesis.
In this chapter I present prior research conducted in this field in order to be used as a benchmark
to the results and chosen methodology; in the second one is made a basic comparison between
Italian and Sweden health system concerning how administrative structure is organized and what
are the main leading principles that regulate health system; in this part is made also a first
analysis about the data with respect to development of National Health system expenditures.
In the chapter 3 I present and describe the method used to compare the financing and services
provision in the different systems and the procedure of how the data are collected, processed and
analyzed. Furthermore I present and explain the qualitative criteria that were applied to the
results of my study. In the last part of this chapter I discussed the limitations about the collection
of the data. In the chapter 4 I present the results from data analysis and answer to the questions
above. This section is the “hearth” of my thesis and is divided into two major parts. First part is
more qualitative and I compare the two different Italian and Swedish health systems with respect
to financing and services provision. The second part is empirical because I interpret the results
and the index that I have obtained by channelizing what is most relevant for the reader in order to
assess if the system works fluently and efficiently. In the chapter 5 I discuss the findings in
connection to earlier literature made in the area and offer concluding remarks in the next chapter.
10
2.Background
2.1 Literature review
There are a number of studies aiming at analyzing the internal structure of health care systems.
The study by World Health Organization (WHO) through an analytical description of both
health systems, especially Swedish health system, allowed me to deepen and collect relevant
information for my study. World health organization is the directing and coordinating authority
on international health within the United Nations’ system. WHO experts produce health
guidelines and standards, and help countries to address public health issues. It ,also, supports and
promotes health research. Through report conducted by WHO experts, governments can jointly
tackle global health problems and improve people’s well-being. My focus was especially on
Swedish and Italian health system profile that provided a detailed description of both health care
systems, of reforms and policy initiatives. As I explained above each profile is produced by
country experts in collaboration with the Observatory’s research directors and staff. Health
system profiles seek to provide relevant information to support policy-makers and analysts in the
development of health systems in Europe. They can be used:
• to learn in detail about different approaches to the organization, financing and delivery of health
services and the role of the main actors in health systems
• to describe the institutional framework, the process, content and implementation of health care
reform programs
to highlight challenges and areas that require more in-depth analysis
• to provide a tool for the dissemination of information on health systems and the exchange of
experiences of reform strategies between policy-makers and analysts in different countries
The profiles are based on a template that, revised periodically, provides detailed guidelines and
specific questions, definitions, and suggestions for data sources. Authors draw on multiple data
sources for the compilation of Health systems profiles, ranging from national statistics, national
and regional policy documents, and published literature. In addition the Observatory supplies
quantitative data in the form of a set of standard comparative figures for each country, drawing
on the European HFA database. The HFA database contains more than 600 indicators defined by
the World Health Organization (WHO) Regional Office for Europe for the purpose of monitoring
Health for All policies in Europe.
In order to analyze data I focused on Organization Co-operation and development (OECD)
health data 2009 that offered me a comprehensive and detailed source of comparable statistics
data on health and health system across 30 OECD member governments, including Canada, the
United States, the European community, Australia and Japan. Although health system differ
widely in their design, in the inputs they use and the outcomes that attain, policy makers in all
OECD countries share the common overall goal of achieving high- performing health systems.
These policy objectives include:

11
- Improving population health status and health outcomes of medical interventions
- Fostering adequate and equitable access to care
- Increasing health- system responsiveness
- Increasing the efficiency of health systems
- Ensuring sustainable costs and financing
Thus OECD health data can be an essential tool for health researchers and policy advisors in
governments, the private sector and the academic community, to carry out comparative analyses
and draw lessons from international comparisons of diverse health care systems. Covering the
period 1960 to 2009, this interactive database can be used for comparative analyses on:
� Health status
� Risk factors to health (including smoking and obesity)
� Health care resources and utilization (including the supply and activities of doctors)
� Long-term care resources and utilization
� Health expenditure and its financing
� Social protection (including public health coverage and private health insurance)
� Pharmaceutical markets
The collection and analysis data allowed me to make a comparison based on quantitative
indicators with respect to some aspects related to financing and provision
In the first part of introduction I analyzed the “World Health report 2000- Health system
performance” and a study realized by Murray and Frenk (“a framework for assessing the
performance of Health systems”). The first report examines and compares aspects of health
systems around the world. It provides conceptual insights into the complex factors that explain
how health systems perform, and offers practical advice on how to assess performance and
achieve improvements with available resources. The main purpose of the report is to provide
countries, donor agencies, international organizations and others with the information they need
to help them make policy and funding decisions. The principal writers were Philip Musgrove,
Andrew Creese, Alex Preker, Christian Baeza, Anders Anell and Thomson Prentice, with
contributions from Andrew Cassels, Debra Lipson, Dyna Arhin Tenkorang and Mark Wheeler.
Through the reading of this study I deepened the concept of health system and especially I
answered to question as what makes for a good health system, what makes a health system fair,
how do we know whether a health system is performing as well as it could, that are subject of
public debate in most countries around the world. In effect before analyzing the difference
between Italian and Swedish health systems with respect financing and provision, is necessary
understand foremost how a health system should be defined in order to extend our field of
concern beyond the provision of public and personal health services, and encompass other key
areas of public policy that have an impact on people’s health. World Health report suggests that
the boundaries of health systems should encompass all actions whose primary intent is to improve
and promote citizen’s health. It is also important understand what are the goals of a health
system. Clearly, their defining purpose is to improve and protect health, but they have other

12
intrinsic goals. These are concerned with fairness in the way people pay for health care, and with
how systems respond to people’s expectations with regard to how they are treated. Where health
and responsiveness are concerned, achieving a high average level is not good enough: the goals
of a health system must also include reducing inequalities, in ways that improve the situation of
the worst-off. The attainment in relations to these goals provides the basis for measuring the
performance of health system. The study by Murray and Frenk focuses on how to measure the
health system performance with respect to goal attainment and to the resource available; if
policy-makers are to act on measures of performance, they need a clear understanding of the key
functions that health systems have to undertake. The study defines four key functions:
stewardship (a broader concept than regulation); financing (including revenue collection, fund
pooling and purchasing); service provision (for personal and non-personal health services); and
resource generation (including personnel, facilities and knowledge). By investigating these four
functions and how they combine, it is possible not only to understand the proximate determinants
of health system performance, but also to contemplate major policy challenges.
In the second part of introduction in order to make a “first” comparison between Italian and
Swedish health system I analyzed a study conducted by Vittorio Maio, PharmD and Lamberto
Manzoni (“The Italian Health Care system: W.H.O ranking versus public perception) that
focuses on Italian Health care system trying to answer to question such What makes the Italian
health care system so appealing? What important health outcomes has the Italian health system
accomplished? And what perceptions and expectations does the Italian population have of its
health system?. This study, by describing the socioeconomic and political issues of the country,
focuses and illustrates the principles on which the Italian health system is grounded, examines its
structure and organization, and defines achieved health care outcomes. For the achievement of
my work purpose has been very important the analysis of the study conducted by Anders Anell –
“Swedish Health care under pressure” about Swedish health care system. The study focuses on
the structure of the Swedish health care system and is divided into three sections; In the first
section, the present structure of the health-care system is described, together with a summary of
recent changes in the organization and funding of services and the development of expenditures.
The following two sections discuss changes in incentives at the macro- and micro-levels as well
as issues related to access and outcomes from a population perspective. This section looks more
closely at the flow of funds to local governments and health-care providers, and at the resulting
incentives. In the first subsection, special emphasis is placed on budget allocation at the macro-
level, and on the ambition to compensate local governments for differences in need and income.
The second subsection discusses payment to health-care providers.
13
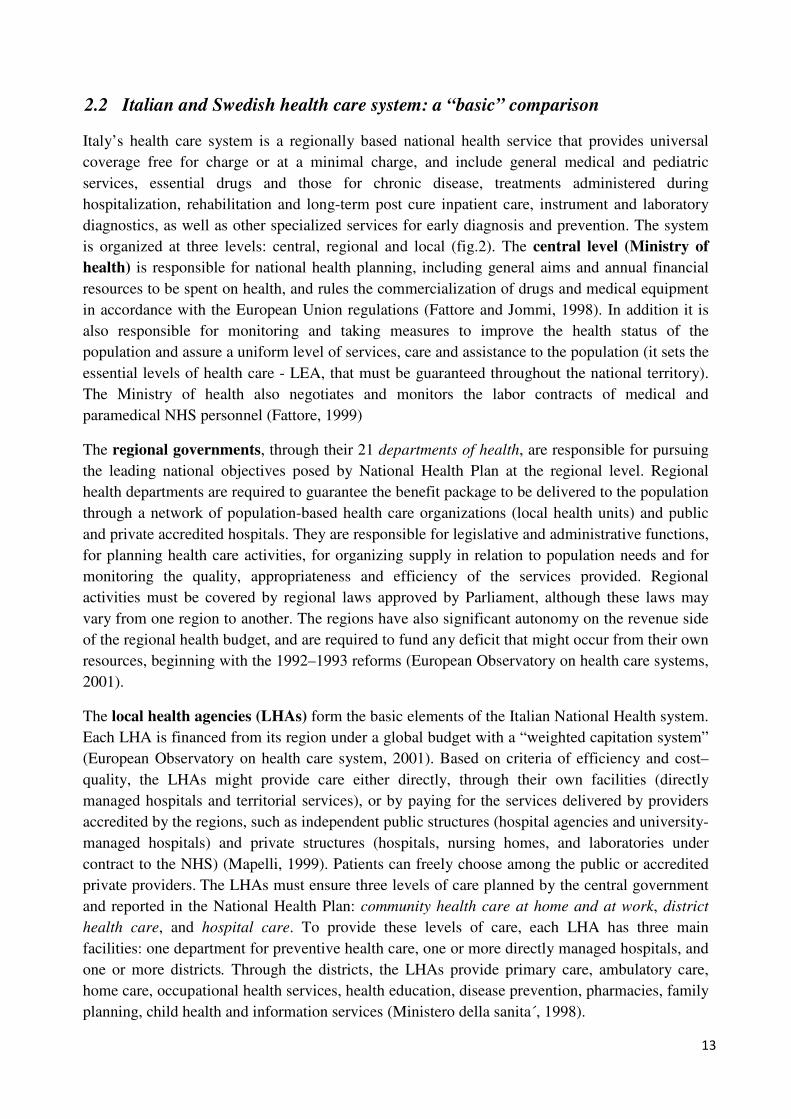
2.2 Italian and Swedish health care system: a “basic” comparison
Italy’s health care system is a regionally based national health service that provides universal
coverage free for charge or at a minimal charge, and include general medical and pediatric
services, essential drugs and those for chronic disease, treatments administered during
hospitalization, rehabilitation and long-term post cure inpatient care, instrument and laboratory
diagnostics, as well as other specialized services for early diagnosis and prevention. The system
is organized at three levels: central, regional and local (fig.2). The central level (Ministry of
health) is responsible for national health planning, including general aims and annual financial
resources to be spent on health, and rules the commercialization of drugs and medical equipment
in accordance with the European Union regulations (Fattore and Jommi, 1998). In addition it is
also responsible for monitoring and taking measures to improve the health status of the
population and assure a uniform level of services, care and assistance to the population (it sets the
essential levels of health care - LEA, that must be guaranteed throughout the national territory).
The Ministry of health also negotiates and monitors the labor contracts of medical and
paramedical NHS personnel (Fattore, 1999)
The regional governments, through their 21 departments of health, are responsible for pursuing
the leading national objectives posed by National Health Plan at the regional level. Regional
health departments are required to guarantee the benefit package to be delivered to the population
through a network of population-based health care organizations (local health units) and public
and private accredited hospitals. They are responsible for legislative and administrative functions,
for planning health care activities, for organizing supply in relation to population needs and for
monitoring the quality, appropriateness and efficiency of the services provided. Regional
activities must be covered by regional laws approved by Parliament, although these laws may
vary from one region to another. The regions have also significant autonomy on the revenue side
of the regional health budget, and are required to fund any deficit that might occur from their own
resources, beginning with the 1992–1993 reforms (European Observatory on health care systems,
2001).
The local health agencies (LHAs) form the basic elements of the Italian National Health system.
Each LHA is financed from its region under a global budget with a “weighted capitation system”
(European Observatory on health care system, 2001). Based on criteria of efficiency and cost–
quality, the LHAs might provide care either directly, through their own facilities (directly
managed hospitals and territorial services), or by paying for the services delivered by providers
accredited by the regions, such as independent public structures (hospital agencies and university-
managed hospitals) and private structures (hospitals, nursing homes, and laboratories under
contract to the NHS) (Mapelli, 1999). Patients can freely choose among the public or accredited
private providers. The LHAs must ensure three levels of care planned by the central government
and reported in the National Health Plan: community health care at home and at work, district
health care, and hospital care. To provide these levels of care, each LHA has three main
facilities: one department for preventive health care, one or more directly managed hospitals, and
one or more districts. Through the districts, the LHAs provide primary care, ambulatory care,
home care, occupational health services, health education, disease prevention, pharmacies, family
planning, child health and information services (Ministero della sanita´, 1998).

14
Fig.2
Organization of Italy’s health care system
Central level
Regional level
.
Services Co-payment
Local level
Parliament
Government National Bdg
Ministry of Health
11 departments
IRCCS A
Agency for
Regional
Health Care
Services
Regional health
departements (21) Regional Bdg
Regional
agencies for
health
Local health
units (228)
Health
districts
Hospitals
Health
promotion
divisions
Public hospital
trusts (78)
Private
accredited
hospitals
Legend:
Administration and planning
----------- Policy and legislation
A
- National bodies
- National institute of Public
Health
-National Health Council
-National institute of
occupational
Regional
Goverments
Citizens
Patients

15
The Italian National Health System follows a model similar to that developed by the British
National Health Service (Beveridge Model) in that it provides universal health care coverage
throughout the Italian State as a ”single payer” financing from general revenues. However the
Italian NHS is more decentralized because of a recent strong policy of devolution(L.3/2001) that
have radically transformed the NHS giving the 20 regions political, administrative and financial
responsibility regarding the provision and financing of health care. In particular Italian NHS
should be organized according to the following principles (Ministero della sanità,1999):
- Human dignity: Every individual has to be treated with equal dignity and have equal rights
regardless of personal characteristics and role in society.
- Protection: The individual health has to be protected with appropriate preventive measures and
interventions.
- Need: Everyone has access to health care and available resources to meet the primary health care
needs.
- Solidarity: Available resources have to be primarily allocated to support groups of people,
individuals and certain diseases that are socially, clinically and epidemiologically important.
- Effectiveness and appropriateness: Resources must be addressed towards services whose
effectiveness is grounded and individuals that might especially benefit from them. Priority should
be given to interventions that offer greater efficacy in relation to costs.
- Equity: Any individual must have access to the health care system with no differentiation or
discrimination among citizens and no barrier at the point of use
The Italian Health care system is considered among the most advanced in the world, with
excellent results in terms of health care and well-being. How it explained above the health system
provides universal coverage for the entire population, with services provided for free or at modest
cost at the point of consumption with the best standards of medical assistance: Italian doctors are
well trained and very passionate about their profession and their private hospitals are comparable
with any country. The latest reforms, in fact, considered human resources as a strategic factor in
enhancing health care quality and patient satisfaction. Training allows health professionals to
improve their skills and develop a new professional culture; it is no longer seen as a preparatory
activity to be undertaken solely before practice but involves participating in courses, meetings
and seminars. The reforms that have occurred in Italy gave considerable attention also to the
quality of health care especially on its three main components: input (quality of infrastructures
and human resources), process (appropriateness and timeliness of interventions) and outcome
(health status and patient satisfaction). In particular the National Health Plan for 1998-2000
established procedure for institutional “accreditation” of public and private providers, based on
assessing the quality of their infrastructure and human resources and a national program on
guidelines by assessing the effectiveness and appropriateness of health care interventions.

16
In the 21st century Italy will strive to offer quality health care services by seeking to control the
high costs through a rationalization measures. However, because of its fundamental
characteristics, the Italian health care system will certainly face other important challenges: to
create and develop an efficient system capable of preserving the principles of egalitarianism and
solidarity, and to find fair financial mechanisms that overcome regional discrepancies.
The Swedish health care system is a regionally based, publicly operated health service. It is
organized into three levels (Fig.): the national, regional and local (Observatory, 2005)
The regional component, operating through the county councils, together with central
government, forms the basis of the health care system. Overall responsibility for the health care
sector rests, at the national level, with the Ministry of Health and Social Affairs. The principal
responsibility of the Ministry of Health and Social Affairs is to ensure that the health care system
runs efficiently; It prepares cabinet business and deals with policy matters and legislation in
health care, social welfare services and health insurance and allocates financial assistance
directed at very specific treatments, and acts as a supervisor of activities in the county councils. It
collaborate with other central government bodies. The most important are the Medical
Responsibility Board, the Medical Products Agency, the Swedish Council on Technology
Assessment in Health Care, the Pharmaceutical Benefits Board and the National Institute of
Public Health (Observatory, 2005)
The 21 county councils play a dominant role in Swedish healthcare. According to the Health Care
Act of 1982, ‘every county council shall offer good health and medical services to persons living
within its boundaries’, and they shall promote the health of all residents (The Swedish Health
care act, 1982). The county councils also regulate the payment of private health care providers
(regulate the establishment of new private practices and the number of patients that private
practitioners can visit during year).
At the local level there are 290 municipalities with their own areas of responsibility. The
traditional organization of the municipalities involves a municipal executive board (leads and
coordinates the entire municipality´s business and acts as a supervisor for the committees), a
municipal council (make decisions about taxes, goals and budgets for all community-run
businesses, and about the organization and tasks of the committees) and several local
government committees. The responsibilities of a municipality include issues relating to the
immediate environment of the citizens, (schools, social welfare services, roads, water, sewerage,
energy, etc). Besides providing financial assistance, social services in Sweden cover child care,
school health services, environmental hygiene, and care of the elderly, the disabled and long-term
psychiatric patients. Patients who have been fully medically treated and have been discharged
from acute care or geriatric hospitals also fall within the remit of the municipalities. As it showed
in the figure 3, the 290 municipalities offers benefits package to citizens through public nursing
home and home care (Fig.3 below)

17
Fig.3 Organization of Swedish’s health care system
Legend:
Sos National Board of Health and welfare
HSAN Medical Responsibility Board
MPA Medical Products Agency
SBU Swedish Council on Technology assessment in Health care
TLV The Dental and Pharmaceutical Benefits Agency
NIPH National Institute of Public Health
FK Swedish social insurance agency
National level
Parliament
Government
Ministry of health
and social affairs
Central agencies and
bodies
(Sos,HSAN,MPA,SBU,
TLV,NIPH,FK)
Federation of Swedish
County Councils
Swedish Association of
Local Authorities
Local level
290 municipalities
(local authorities)
Special housing
and home care for
elderly and
disabled people
Regional level
18 county councils,
2 regions and
1 municipality
(regional authority)
8 regional hospitals in 6 medical
care regions
20 central county hospitals and
40 districts county hospitals
Approx. 1100 health centres

18
The Swedish health care system is primarily funded through taxation. Both county councils and
municipalities have the right to levy proportional income taxes on their respective populations
and these make up 70% of their revenues (Landstingsfo¨rbundet, 2004). Swedish health system is
organized following three principles:
- “Human dignity” means that all human beings have an equal entitlement to dignity, and should
have the same rights, regardless of their status in the community
- ”Need and Solidarity” means that those in greatest need take precedence in medical care
- “Cost-Effectiveness” means that when a choice has to be made from different health care
options, there should be a reasonable relationship between the costs and the effects ( outcomes),
measured in terms of improved health and improved quality of life
Despite several decades of important reforms, numerous challenges for the Swedish health care
system remain. There is a need for integration between hospital care, primary care and
institutional care, especially in the provision of services for the elderly, and for those with
disabilities or mental illness; there is a need to strengthen primary care and home-based care and
to find a way of tackling the shortage of skilled personnel in the municipal sector; as for many
other countries the cost containment remains an important challenge; the difficulties in defining
division of responsibility for health care provision between central government, county councils
and municipalities need to be tackled. Effective interventions are needed for tackling increasing
social inequality in health care in Sweden, especially with regard to dental services. At the
opposite side we can argue the health status of the Swedish population is one of the best in the
world. The main strenghts of the Swedish system include the provision of health care services to
everybody on the basis of need, democratic control and local accountability, control over total
expenditures and an effective management of clinical activities.
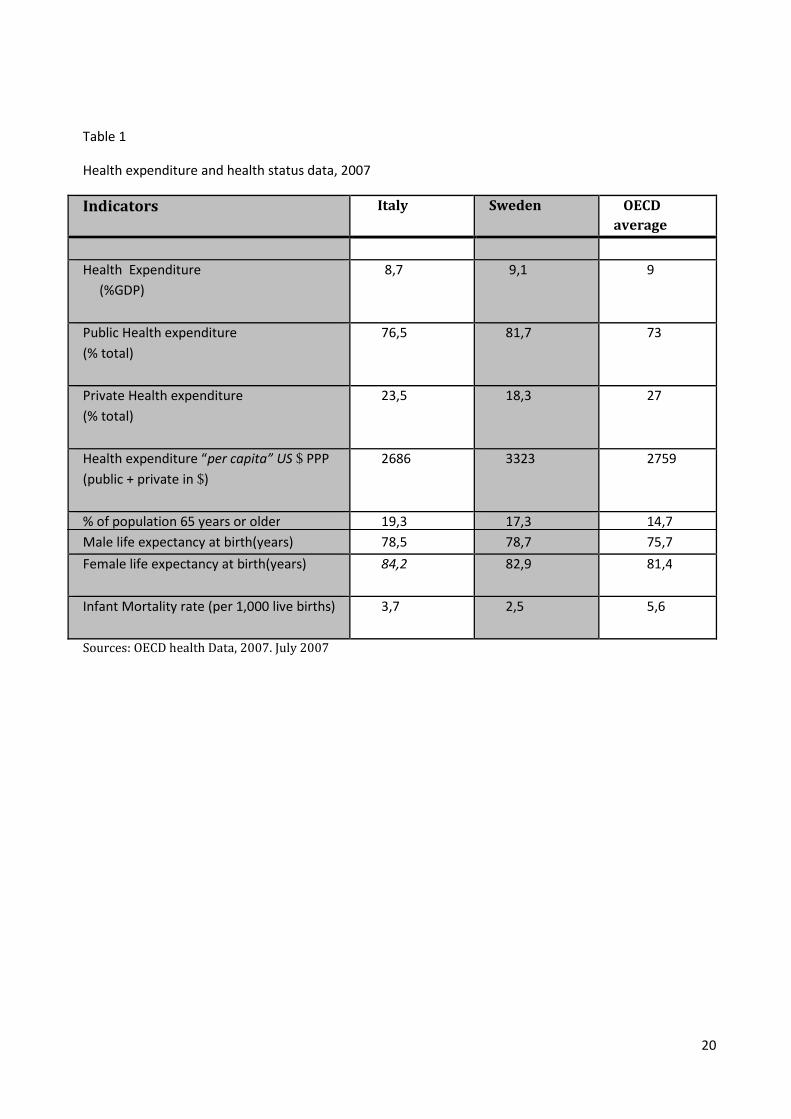
In the table 1 below are summarized values of the expenditure and health status key indicators
reported in Italy and Sweden. The Italian National Health system is the third largest health care
system in the European Union, behind Germany and France with total health expenditure
amounted to 8,7% of the Italian Gross Domestic Product (GDP) in 2007, with 76,5% of public
expenditure and 23,5% of private expenditure; in 1960, health care expenditure was 82%
public and 18% private. A such thick increase can be explained by citizens’ dissatisfaction due to
non appropriateness of services offered by the public system and to the co-payments growth
(Donatini A et al, 2001). Health expenditure as a proportion of GDP increased steadily until
1992: from 3.9% in 1960 to 6.6% in 1978, when the NHS was established, to 7,7% in 1990,
peaking in 1992 (8,0%), declining to 7,3% in 1995, stabilizing at 7,8% from 1997 to 1999 and
then increasing in the last years. Since 1992 various measures have been introduced to contain
NHS expenditure. These can be classified in two broad groups: the first one concerns cost-
containment measures aimed at increasing productivity, such as financial accountability at the
regional level, spending ceilings on goods and services, measures to contain personnel
expenditure, and closure of small hospitals; in the second group can be included the other
measures aimed to contain the demand for health care by patients, such as co-pays on drugs and
outpatient specialist care (Mapelli, 1995 et Abel-Smith B, Mossialos, 1994).

19
In 2007 pharmaceutical expenditures represented 19,3% of total health care costs. Although
Italy has one of the lowest public shares of total health care expenditure among the EU countries,
the volume of public health care expenditure remains an important issue for the government, both
at the national and at the regional level, mainly because of the existence of a large public deficit.
The expenditure for each person was 2686 $ and, by comparing this data with the OECD
average, it means health system spend less with respect to other 30 countries (OECD average was
2759 $ in 2007). The two most widely measures to assess health care outcomes, life expectancy
and infant mortality indicate that Italy has a very healthy population compared to the other OECD
countries. Life expectancy at birth has increased over the last 20 years. In 1987 was 73,1 years
for man and 79,6 for women, while in 2007 was 78,5 for man and 84,2 for women (OECD
average was 75,7 for man and 81,4 for women). The infant mortality rate remains one of the
highest in the EU, although it underwent the second largest decline during the 1990s and in 2007
it was 3,7 deaths each 1,000 live births (OECD Health data, 2009).With respect to OECD average
it is important to note Italy has a high percentage of elderly population (19,3%; OECD average
17,3%). It means that being vulnerable groups, it will consume more resources for the system due
to disease’s treatment, more health care resources (technological and human), more length of
stay, more occupancy rate hospital beds.
Data concerning health- care expenditures in Sweden are rather poor. Until 1999, the
municipalities did not separate expenditures for health care to the elderly, and this has posed
problems when comparing total health-care expenditures in Sweden with those of other OECD
countries. Total health care expenditures as percentage of Gross Domestic Product (GDP) have
been stable between 1993 and 1997, but between 1997 and 2003 total expenditures increased
faster than GDP; during this period health care as proportion of GDP rose from 8,1 to 9,3 %. In
the last three years (2004-2007) total expenditures on health fell from 9,4 to 9,1 % (see Table 1).
The public share of total health care expenditure has continuosly decreased during the past
decades (in 1980 was 92,5 % GDP and in 2007 81,7%). This is mainly due to increasing cost-
sharing, as health care with a high degree of patient co-payment (e.g. drugs, dental care) has
increased, while health care with a low degree of patient co-payment (e.g. inpatient care) has
decreased. The pharmaceutical expenditure amounted to 13,4% and it is very low with respect
to OECD countries. In comparison with OECD- data for other EU countries health care
expenditure is very high and in 2007 was almost 3323 $ per capita ( OECD average in 2007 was
2759 $. Analyzing the health expenditure development it is important noting in the last ten years
(Between 1997 and 2007) health care expenditure “per capita” is almost doubled (in 1997 was
1887 $). As well as in Italy, also in Sweden we find a elderly high percentage (17,3%). Life
expectancy in Sweden is among the highest of the Nordic countries: in 2007 it was 82,9 years for
women and 78,7 years for men. During the past 30 years, the average life expectancy rose by 5.5
years, and Sweden currently has one of the world’s oldest populations. Infant mortality
decreased substantially during the same period, from 11 to 2,5 deaths per 1000 live births in 1970
and 2007, respectively. This decrease can be explained with the commitment, by the County
councils, to give full immunization coverage to all the children; in 2007, 96% of them are
covered by the vaccination against measles, 99% of them are covered by the vaccination against
diphteria, tetanus and pertussis and 57% against influenza (Oecd Health Data, 2009).
20
Table 1
Health expenditure and health status data, 2007
Indicators Italy Sweden OECD
average
Health Expenditure
(%GDP)
8,7 9,1 9
Public Health expenditure
(% total)
76,5 81,7 73
Private Health expenditure
(% total)
23,5 18,3 27
Health expenditure “per capita” US $ PPP
(public + private in $)
2686 3323 2759
% of population 65 years or older
Male life expectancy at birth(years)
19,3
78,5
17,3
78,7
14,7
75,7
Female life expectancy at birth(years)
84,2 82,9 81,4
Infant Mortality rate (per 1,000 live births)
3,7 2,5 5,6
Sources: OECD health Data, 2007. July 2007

21
3. Methodology
In my thesis the comparison between Italian and Swedish health care system with respect to
financing and services provision is studied by using a framework deriving mainly from several
literature sources. In other words my work is a “combination” of detailed context description and
data analysis in order to ease the readers to focus on the most obvious differences. The method
used to describe the framework was especially a “reviewing of prior literature” that allowed me
to focus just on relevant documents that detailed these aspects. In other words exploring the
existing literature allowed me to identify the following issues connected with the area of
financing and service provision in Swedish health care system
• What is already known about this area?
• What research methods and research strategies have been employed in studying this
area?
• Are there any unanswered research questions in this area?
• Which questions need to be deepened?
To make more clear the comparison, how I explained above, especially with respect to health
service provision, the content analysis (where is explained how care services are provided to meet
the health-related needs of the population and which resources are involved in the delivery
process is integrated with collect, structured observation and analysis data. It is important to
clarify that are not taken in consideration all data, but those actually relevant to make clear the
comparison. This data concern the number of practicing physicians and of nursing, dentistry and
midwifery personnel involved in the “delivery process”, hospital and acute care beds (to indicate
the availability of inpatient services) and also resource technological involved (to assess the care
intensity provided to restore health´s patient) as well as magnetic resonance imaging units and
Computed Tomography Scanners, in other words all data that allowed me to understand the
appropriateness degree of the health system to meet the population´s expectations.
In data processing I adopted a rational and critical approach; i took in consideration three
qualitative criteria; the first one refers to the credibility of data interpretation; this criterion
allowed me to ensure a high level of congruence between concepts and observation; with the
second one I tried to elaborate them in order to can be generalized and applied across different
settings(transferability); the final one refers to the ability to convince the readers that the data
are plausible and the importance of them in the process conducting of my thesis
(confirmability).

22
Limitations:
- In table 2 was considered the year 2001 because it was the first year of implementation of fiscal
federalism. It was interesting to evaluate the main public regional financing sources and total
amount of these in order to compare with the public sources of total county councils revenue (
tab.4)
- In the tables 3 and 5 was analyzed out-of – pocket payments trend in the last six years for Italian
and Swedish health system with respect to public and private (OOP payments+ private health
insurance) expenditure. Was taken in consideration the period from 2002 to 2007 because it is a
good benchmark for the study for both the systems
- In the tables 7 and 9, about hospital structures in Italy and Sweden, has been take in consideration
the years 2004 for the inability to finding latest data for Sweden. Data as well as number of
public inpatient care, number of public inpatient care per 1000 inhabitants or private accredited
beds per 1000 inhabitants were not available for Sweden, as well as in 18 of 30 OECD countries.
- In the tables 8 and 10 was examined the organization of both health systems with respect to
human and technological units involved in the “delivery process”. The period taken in
consideration was the years 2006 for the great variability of health systems in the use of
resources. Data related to number of CT scanner and Magnetic Resonance Imaging units in
Sweden are from 1999 (latest year for which data has been reported).

23
4. Results:
How financial resources are collected from citizens
Italy
The Italian NHS is funded mainly by general tax revenue (European observatory, 2001). The
recent fiscal reform (D.lgs 56/2000) has introduced important changes with respect to Italian
health system financing by transfer power to the regions in managing financial resources, so that
health care funding has become a regional responsibility (Taroni, 2000). It means the National
Health Fund, which had been the main sources of financing since the NHS was established (D.lgs
833/1978), was abolished in 2001. From 2001, Italian National Health System is financed by this
kind of regional taxes (see also fig.4 below)
- A piggy- back regional tax (IRPEF). Personal Income Tax rates range from 23% to 43% (from
01/01/2007). In addition, it is also allowed for each region to modify the total regional IRPEF
rate from 0,9% to 1,4% depending on the level of income and region of residence
(Taroni, 2000)
- A set amount of the petrol excise tax per litre (€0,13); regions have also the right to increase the
petrol excise by up to €0.026 per litre
- Regional share on the value added of companies (corporations, partnership and self-
employer workers) and on the salaries paid to public-sector employees (IRAP- imposta
regionale attivita´ produttive). The companies´ value added is taxed at 4,25% but the taxes on
public sector salaries is 9,6% on the first 20.660 € and 3,8% on the following 56.820 €. Starting
2001 the regions have the power to raise the rate by up to 1 percentage point
Because of extreme differences in fiscal autonomy that exist among 21 regions, in addition, a
fixed proportion (25,7%) of the indirect value-added taxes (VAT) is used to build a ”National
Solidarity Fund”, which is primarily intended to redistributed funds to the regions that are unable
to raise sufficient resources (European observatory, 2001). This tax compensates almost 94% of
the funds abolished (tabl.2)

24
Tab.2 - Regional Sources of public health care financing: 2001
Sources of financing MLD
LIRE
%
Regional revenue from petrol excise tax
Regional revenue from additional IRPEF
Revenue from VAT
Total Regions revenues
156
3.373
53.127
56.656
0,3
6
93,7
100,0
Source: N. Dirindin
The mechanism that allocates funds to the regions has changed several times to more
homogeneously distribute resources and decentralize budget responsibilities among regions. In
2001, the first years of operation of the National Solidarity Fund, regions received a VAT quota
based on historical spending to keep the regional financial situation unchanged. Since 2001 the
distribution of funds to the regions is based on a ”per capita allocation” (weighted capitation),
which takes into account the regional population age distribution, mortality rates and indicators of
consumption of health care services. Redistribution is not left to the initiative of regional
governments: in fact, as the state collects VAT revenue, all transfers are from the central
government to the regions, representing the national sum per person needed to cover the essential
health care levels guaranteed by the Italian NHS. (Ministero della Sanita´, 1998). Fig. 4 shows
the new flows of financing of the NHS from 2001 onwards, after the National Health Fund is
abolished and the changes mentioned above are implemented.

25
Fig.4 Financing flow in Italian Healthcare system
Other programmes (out-of pocket payments)
Central level
Other programmes
(OOP payments)
Regional level Governemnts Citizens
Source: Observatory, 2001
On the private health care complementary sources of financing concern out-of pocket payments
and voluntary health insurance. Italy has two main out-of pocket payments; the first one is
demand side-cost sharing: a co-payment (ticket) for diagnostic procedures, pharmaceuticals and
specialist visits. The second one is direct payment by users (user charges) for the purchase of
private health care services and over-the-counter drugs ( Mapelli, 1999). Analyzing OECD health
data, can be estimated that, in 2007, out-of-pocket payments represented 20,2% of total health
care expenditure and, in the same year, each household used to pay 542 $ for the private health
care. In the last six years (from 2002 to 2007) data show the share of out-of-pocket payments
decreased by 2,2 % ( it fell from 22,4 to 20,2 with respect to total health expenditure) and out-of-
pocket payments per capita increased by 44 $ at purchasing power parity (see tab.3 Below)
(OECD health data, 2009)
Ministry of Health
National
Solidarity
Fund
National
Budget
Income taxes
Regional
budget Regional Health authorities
Regional Health departments
Regional Health Fund
Weighted
capitation
Value- added taxes
(national share 74,3%)
Regional share 25,7%)
IRAP
(national share 10-35%
Regional share 65-90% )
Additional regional
income tax (0,9%- 1,4%)
Other regional
taxes

26
Tab.3 – out-of-pocket payments trend in the last six years with respect to public and private
expenditure
Health expenditure 2002 2003 2004 2005 2006 2007
Public expenditure % total exp
Private expenditure% total exp
74,5
25,5
74,5
25,5
76
24
76,2
23,8
76,8
23,2
76,5
23,5
OOP payments % total exp. 22,4 22,4 21,2 20,5 19,9 20,2
Public expend. per capita $ PPP 1656 1692 1822 1933 2054 2056
OOP payments per capita $ PPP 498 508 508 519 533 542
Source: OECD health Data, 2007. July 2007
There are two types of demand for private health insurance: corporate, where companies cover
their employees and sometimes also their families; non-corporate with individuals buying
insurance for themselves or for their families (voluntary health insurance). How it showed in the
tab.3 in 2007 private expenditure represented 23,5% of total health care expenditure in Italy and
out-of- pocket payments represented 20,2% of the latter. It means the remaining 3,3% came from
premiums paid to private health insurance funds (OECD health data, 2009).
Sweden
As in Italy, also Swedish Health care financing system is primarily through local taxes revenues.
In Sweden the financing of health care services is decentralized to the local level, in fact, both the
county councils and municipalities have the right to levy proportional income taxes on their
respective population. The county councils and the municipalities also generate income by the
national government payments (through subsidies and general state grants) and by user
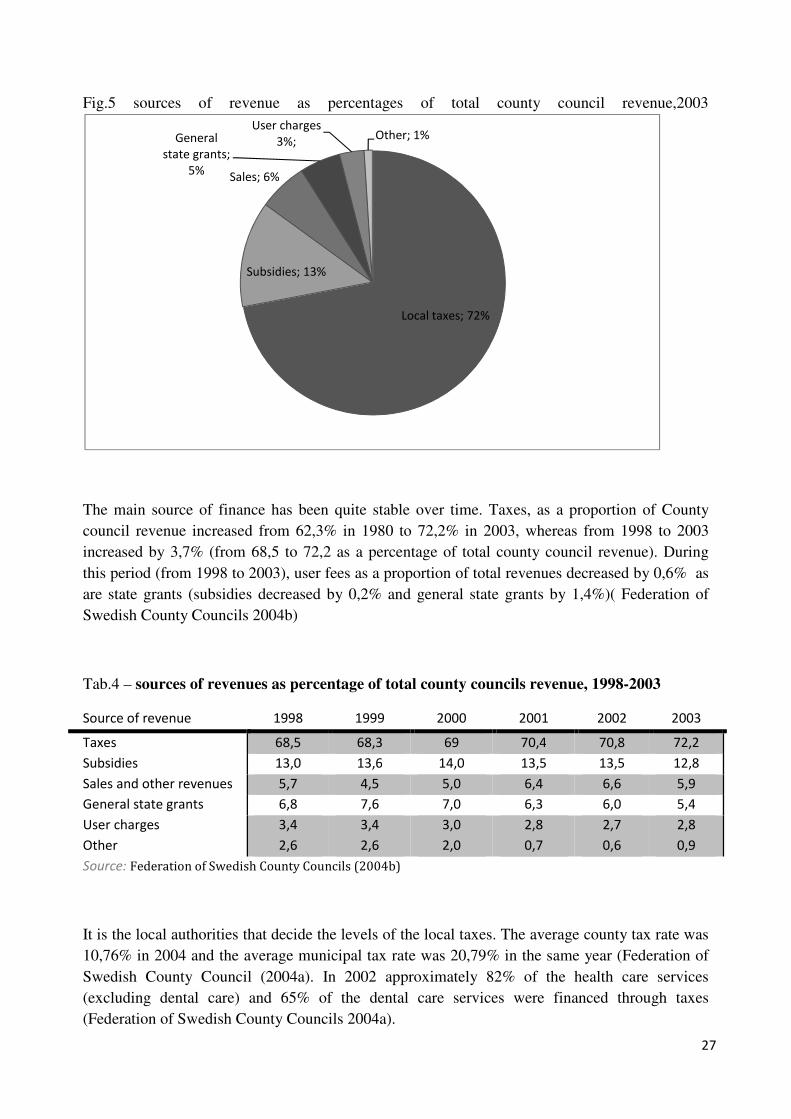
charges (out-of pocket payments) (see Fig.6). As it showed in Fig.5, in 2003, 72.2% of the
county council revenues originated from taxes (Federation of Swedish County Councils 2004b);
the remainder consisted of: state grants 18% (subsidies and general state grants), user charges,
3% and other sources 7% (Federation of Swedish County Councils 2004a). State grants are partly
based on a formula that reallocates resources across local governments with the purpose to give
every county council and municipality the possibility to provide services of similar standards in
their respective geographical area, irrespective of differences in average income and/or need. One
part of the new formula gives compensation based on differences in income across local
governments. Another part gives a similar compensation based on a combination of demographic
(age and average life expectancy) and socioeconomic (number of single households) factors to
adjust for differences in need , and on geographical factors (special compensation for small
county councils and county councils in sparsely populated northern Sweden) to adjust for
differences in expected cost of services. For municipalities compensation is based on
demographic (age and sex) and socioeconomic (professional background of retired people and
number of single households) factors. (Diderichsen et al. 1997)
27
Fig.5 sources of revenue as percentages of total county council revenue,2003
The main source of finance has been quite stable over time. Taxes, as a proportion of County
council revenue increased from 62,3% in 1980 to 72,2% in 2003, whereas from 1998 to 2003
increased by 3,7% (from 68,5 to 72,2 as a percentage of total county council revenue). During
this period (from 1998 to 2003), user fees as a proportion of total revenues decreased by 0,6% as
are state grants (subsidies decreased by 0,2% and general state grants by 1,4%)( Federation of
Swedish County Councils 2004b)
Tab.4 – sources of revenues as percentage of total county councils revenue, 1998-2003
Source of revenue 1998 1999 2000 2001 2002 2003
Taxes 68,5 68,3 69 70,4 70,8 72,2
Subsidies 13,0 13,6 14,0 13,5 13,5 12,8
Sales and other revenues 5,7 4,5 5,0 6,4 6,6 5,9
General state grants 6,8 7,6 7,0 6,3 6,0 5,4
User charges
Other
3,4
2,6
3,4
2,6
3,0
2,0
2,8
0,7
2,7
0,6
2,8
0,9
Source: Federation of Swedish County Councils (2004b)
It is the local authorities that decide the levels of the local taxes. The average county tax rate was
10,76% in 2004 and the average municipal tax rate was 20,79% in the same year (Federation of
Swedish County Council (2004a). In 2002 approximately 82% of the health care services
(excluding dental care) and 65% of the dental care services were financed through taxes
(Federation of Swedish County Councils 2004a).
Local taxes; 72%
Subsidies; 13%
Sales; 6%
General
state grants;
5%
User charges
3%; Other; 1%

28
Fig.6- Financing flow in Swedish health care
Taxes
Employer payroll fees
Income taxes
Income taxes
Per- diem Mixed payment
Mixed payment
Mixed payment
Mixed payment
Subsidised prices
Subsidised prices
O.O.P paym.
National Government
National Social Insurance
Board
21 county councils
290 municipalities
Specialist care
Care of the elderly
Primary care
Dental care below 20 years
Prescribed pharmaceuticals
and OTC
Dental care above 20 years Population
Employers
Patients

29
On the private health care complementary sources of financing concern out-of pocket payments
(charge users) and voluntary health insurance. Analyzing OECD health data (see tab.5), can be
estimated that, in 2007, out-of-pocket payments represented 15,9% of total health care
expenditure and, in the same year, each household paid 528 $ for the private health care. In the
last six years (from 2002 by 2007) data show the percentage of out-of-pocket payments increased
by 0,4 % (it increased from 15,5 to 15,9 with respect to total health expenditure) and out-of-
pocket payments per capita increased by 109 $ at purchasing power parity (see tab.5 below)
(OECD health data, 2009)
Tab.5 – out-of-pocket payments trend in the last six years with respect to public and private
expenditure
Health expenditure 2002 2003 2004 2005 2006 2007
Public expenditure % total exp
Private expenditure% total exp
82,1
17,9
82,5
17,5
81,8
18,2
81,6
18,4
81,6
18,4
81,7
18,3
OOP payments % total exp. 15,5 15,4 15,9 16,3 16,2 15,9
Public expend. per capita $ PPP 2213 2334 2413 2415 2548 2716
OOP payments per capita $ PPP 419 435 470 482 507 528
Source: OECD health Data, 2007. July 2007
In 2003 the County Councils received SKr 5130 million in patients’ fees and other fees
(including those for dental care), which accounted for 2.8% of the county councils’ total revenues
(Federation of Swedish County Councils 2004b) ( see Tab.4). In 2004 the fee for consulting a
physician in primary health care varied from SKr 100 to SKr 150 (approximately €11–17) among
the county councils. In the same year, the fee for consulting a specialist at a hospital varied
between SKr 200 and SKr 300. For inpatient care, normally a fee of SKr 80 per day is charged,
but reductions are possible for pensioners and those in low-income groups (Federation of
Swedish County Councils 2004a). The ceiling for individual co-payments for prescribed drugs is
separated from the other health care services and is administered by the National Corporation of
Swedish Pharmacies. Co-payments for prescribed drugs are uniform throughout the country and
are fully determined by the Government. The patient has to pay the full cost for prescribed drugs,
up to SKr 900 (100 €) , after which level the subsidy gradually increases up to a 100% subsidy
(above SKr 4300 - 478 €) Within a 12-month period, the maximum co-payment is SKr 1800
(€200) for prescribed drugs. Dental care is provided free of charge to all children and adolescents
(up to the age of 20 years). Adults receive a financial subsidy, from the national dental insurance
system for basic dental care which is paid directly to the provider, and pay the difference between
the subsidy and the actual price of services. For certain more expensive dental procedures, there
is a special high cost protection system ,for patients above 64 years, whereby a patient pays a
maximum of SKr 7700 (€ 850) for a 12- month period of treatment.

30
For the elderly and handicapped a total maximum of 100 euro (900 SEK) applies for all health-
care and dental services during a 12-month period and the patient’s out-of pocket payments
depend on the level of service and care together with the number of hours of assistance accorded
per month( Anell,2004).
The market for voluntary health insurance is small in comparison with other EU countries, but
its importance is growing (in 2007 was 2,4 of private expenditure). In 2003 about 200.000
inhabitants (2,3% of the population) had supplementary insurance; the main benefit being the
possibility to jump waiting- list for elective treatment and also quick access to a specialist in
ambulatory care when necessary.

31
How financial resources are allocated to providers
Italy
Hospital care in Italy has always represented the largest share of health care expenditure and his
reimbursement mechanisms have been altered in attempts to curb the expenditure. Especially the
1992 reform envisaged widespread changes in financing of hospital care as well as the switch
from cost-reimbursement mechanism (or global budget, based on historical expenditure, where
even if the planned expenditure are exceeded, overall health interventions declared are financed
with an uncontrolled health spending growing) to prospective payment system (classified by
international system DRGs) for both inpatient and outpatient procedures. In figure 7 it showed
the funds allocation process by the region to each Local Health Authorities; it is established on
the basis of the number of residents, the frequency of health consumption per age, and sex,
mortality rates, and different epidemiological local indicators (Roversi Monaco F, 2000). In turn,
each LHA finances its own directly managed hospitals and facilities, “hospital trusts” and private
accredited facilities in its territory.
Fig.7 Funds allocation process in Italy
Households Companies
Ticket Incentives
and
insurance
premium
Regional
sources
Regions
LHA
General
Practitioners Hospitals Pharmacies
Outpatients
department
Preventive
services
32
The introduction of a hospital care financing system, where hospitals are remunerated on the
basis of health services provided according to pre-determinate and all-inclusive fees (see below)
for each hospitalization, aimed to stimulate hospitals to reduce their production costs and to
achieve a reviewing process to ensure appropriateness in the resource´s provision and use
Diagnosis-related groups (DRGs) refer a system for classifying patient care by relating common
characteristics such as diagnosis, treatment and age. For each DRG, a lot of resources are
absorbed in the hospitals that vary for the time (length of stay), for the care´s intensity and for
procedures´ complexity used in the health care. Usually the way to calculate tariffs associated to
each hospitalization´s category concerns overall resources absorbed in the care process taking in
consideration direct cost related to delivery process (health personnel costs, equipments,
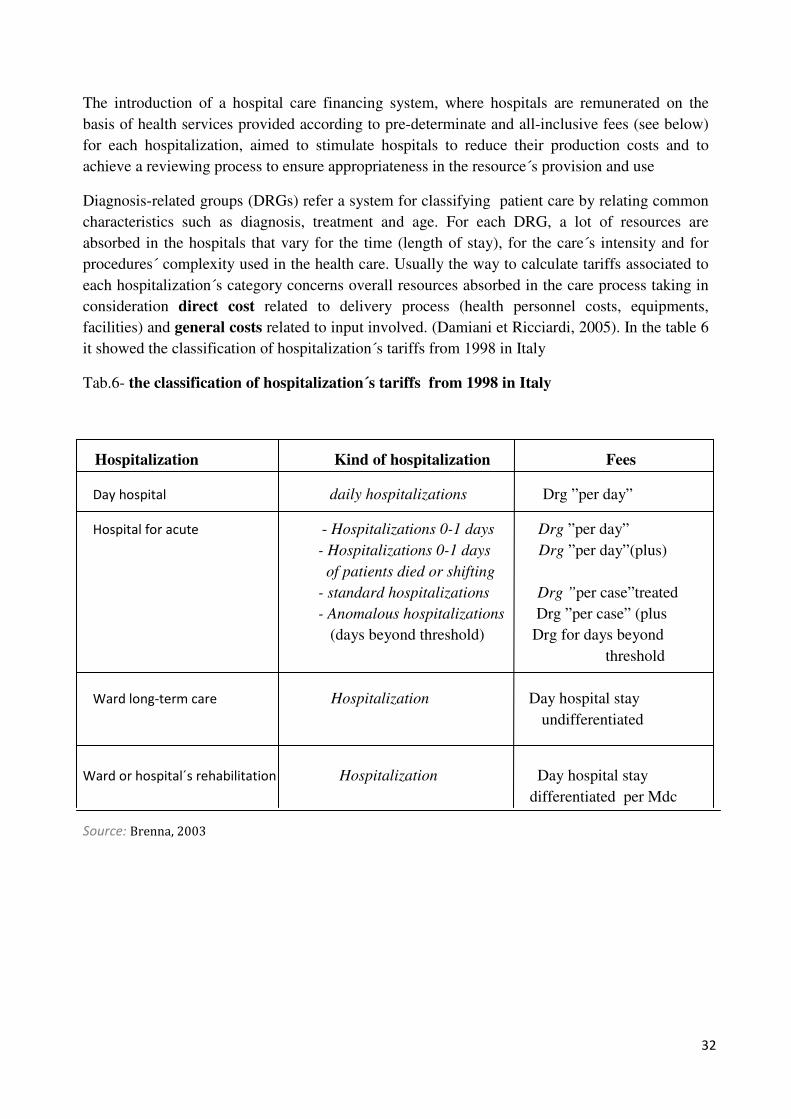
facilities) and general costs related to input involved. (Damiani et Ricciardi, 2005). In the table 6
it showed the classification of hospitalization´s tariffs from 1998 in Italy
Tab.6- the classification of hospitalization´s tariffs from 1998 in Italy
Hospitalization Kind of hospitalization Fees
Day hospital daily hospitalizations Drg ”per day”
Hospital for acute - Hospitalizations 0-1 days Drg ”per day”
- Hospitalizations 0-1 days Drg ”per day”(plus)
of patients died or shifting
- standard hospitalizations Drg ”per case”treated
- Anomalous hospitalizations Drg ”per case” (plus
(days beyond threshold) Drg for days beyond
threshold
Ward long-term care Hospitalization Day hospital stay
undifferentiated
Ward or hospital´s rehabilitation Hospitalization Day hospital stay
differentiated per Mdc
Source: Brenna, 2003

33
The hospitalization´s categories are classified according to 498 Drg and aggregate in 25 Mdc
(Major diagnostic categories) and differentiated in: 1) Ordinary hospitalizations for acute; 2)
hospitalization in day hospital; 3) hospitalizations in ward long-term care and 4) hospitalizations
in wards or rehabilitation´s hospitals. Ordinary hospitalizations and in day hospital fees are based
on Drg, whereas for the long-term care a undifferentiated fee is fixed (for each day in hospital)
and for the rehabilitation the fee is differentiated for Mdc. Finally in the ordinary hospitalization
for acute there are several fees for each Drg, according to: 1) hospitalizations 0-1 days ; 2)
hospitalizations 0-1 days with died or moved patient (usually this kind of hospitalizations have a
double rate with respect to hospitalizations without died or shifting); 3) standard hospitalizations;
4) anomalous hospitalizations with days in hospital beyond average (in this case to the standard
fee for the hospitalization there are also a daily fee to remunerate the marginal cost of days
exceeding the standard length (Brenna, 2003)
DRG-associated tariffs are established at a regional level, although the Ministry of Health sets the
ceiling for the regional tariffs (Taroni F, 1996). After the introduction of the DRG-based hospital
financing system, Italy saw a decrease in the mean length of stay and in the number of hospital
admissions.
The 1992 and 1999 reforms have completely redefined the payment system connected with
general practitioner activities; as an incentive towards containing costs and reducing referrals to
hospital for specific specialist treatments, the payment system has been split into three parts:
fixed, variable and additional parts. The fixed part is determined on a capitation basis. The
payment system is therefore determined by multiplying the per capita payment by the number of
patients enrolled on the physician list. The latest collective agreement (CCNL sanita´, biennio
2006-2007) has fixed the per capita payment between €15.50 and €21.20 according to the number
of years since the general practitioner received a degree. In addition, physicians who set up a joint
medical practice (medical association or partnership aiming to provide continuous care for
ordinary activities) get a 6% increase, with additional payments for protecting physicians against
risks and for physicians working exclusively within the NHS. For example, the fixed
compensation for a physician who received a degree 10 years previously working full time for the
NHS and with 1500 patients can reach €42 400. The agreement also has fixed the maximum
number of patients each physician can have on his or her list. Full-time general practitioners and
pediatricians can have up to 1500 and 800 patients, respectively, and the limits for part-time
physicians are 500 and 400. When a general practitioner or pediatrician devotes more than 5
hours per week to private practice, the maximum number of patients is reduced proportionately
by 37.5 patients for each additional hour in private practice above the 5 hours per week.
Physicians who have higher limits (1800 for general practitioners and 1000 for pediatricians) as a
result of previous laws and agreements can keep them. The variable part comprises fees from
users for specific treatments, including minor surgery, preventive activities, therapies and post-
surgery follow up. The fixed and variable parts are common to all general practitioners and are
established nationally, but each region decides whether to apply expenditure budgets and
estimates the budget itself. The additional part is a reward for effective cost containment: a
proportion of the positive difference between expected and actual expenditure, including the cost
of pharmaceuticals, laboratory tests and therapeutic treatments prescribed by the general
practitioner. The same payment structure applies to pediatricians, but per capita payments are

34
higher than those for general practitioners because they have fewer patients. Payments vary
between €35.10 and €49.10 depending on experience. Hence, the fixed compensation for a
pediatrician working full time for the NHS and with 800 patients who received a degree 10 years
previously is about €37 200. (Observatory,2001). Unlike general practitioners, hospital
physicians are paid a salary by a hospital. The 1992 reform drastically changed the organization
of hospital physicians by replacing several professional categories with first-level and second-
level physicians. Physicians at first level have support and cooperation duties as defined by the
medical officer in charge of the hospital unit. Second-level physicians (dirigente medico di
secondo livello) usually have duties connected with organizing and managing the hospital unit.
Further, they help in choosing the most appropriate therapeutic, diagnostic and preventive
treatments for patients. The payment structure follows the hierarchical structure based on two
levels; the first-level physicians earn about €41 300 per year, and second-level physicians receive
about €62 000, including nights and weekends on call for both types (Observatory, 2001). Unlike
physicians, nurses in Italy do not constitute a separate professional category but occupy the
higher level of a wider hierarchical structure of nonmedical NHS employees that includes
technicians, clerks, caretakers and administrative staff. Similar to other public workers, their
payment structure is therefore defined by a national collective agreement (CCNL) negotiated
every 33 years by representatives of the trade unions and of the government. The 1998 agreement
simplified the structure by reducing the number of levels to four, each characterized by different
requirements in terms of skills, duties and training. First-level employees (group A) have simple
duties and generally include auxiliary workers and caretakers (15-17000€ to year). Group B
includes more skilled workers, such as assistant technicians and administrative staff with little
responsibility (17000-20000 €). The highest levels, groups C (19000-23000 €) and D (21000-
28000 €), comprise mainly nurses together with midwives, dietitians and technicians working in
such areas as radiology, orthopedics and ophthalmology, as well as higher-level administrative
staff. Aside from specific professional duties, group D workers (such as ward sisters) also have
decision making responsibility and play a significant role in organizing the delivery of health care
(CCNL sanita´ relativo al biennio 2006-2007). Aside from restructuring the professional
hierarchy, the reform has also reassessed the payment scheme to stimulate professional
motivation by acknowledging and remunerating individual employees’ skills. Hence, each non-
medical employee in the NHS (including nurses) receives a basic wage and productivity
rewards. The basic wage is determined by the level in the hierarchical structure, taking into
account duties, responsibilities and training profile. Productivity rewards are part of the more
general incentive scheme that ties a portion of the wage to the results achieved by the employee.
In particular, results are measured both at the individual level and in health care centres (by the
medical director and the nurses´ officier), with rewards going to the employees who successfully
improve the quality of their performance and contribute to increasing the overall productivity and
performance of the health care unit (Observatory, 2001)

35
Sweden
In Sweden usually there are two or more districts within every county council, each with
responsibility for hospital services and primary care over a geographic area. Most county councils
have decentralized a great deal of the financial responsibility to health care districts, through
global budgets. Activities such as psychiatry, geriatrics and emergency services are normally
financed on the historical expenditure system (cost-reimbursement mechanism). Resource-
allocation principles vary among the county councils. It means that in about half of the county
councils payments to both hospitals and primary care centres are based on global budgets and
among the others a smaller group of about five county councils ( Bohus, Dalarna, Stockholm,
Sörmland and Skäne) continued to develop per-case payments (Diagnosis-related-groups) with
aiming to solve Swedish health care major problems as well as the long waiting-lists and a lack
of incentives for providers to increase health care output owing to fixed budget (Anell,2004). In
another group of a similar size, payment for primary care is moving in the direction of capitation,
whereas global budgets are used for all other services. Capitation model include a negotiation
between the purchasing organization and hospital health care provide and the establishment of
financial and activity contracts. These contracts are often based on a fixed prospective per-case
payments (based on diagnosis-related groups) and complemented with price (determined by
historical costs and negotiations between purchaser and provider) or volume ceilings and quality
components. For example in 1993 cost control measures for Bohus, Stockholm, Skäne and
Sörmland concerned payments reduced if actual volumes exceed budgeted target and for Dalarna
cost control measures were oriented to cost ceilings and volume discounts (Anell A, Svarvar P,
1994).
As most providers in Swedish healthcare are publicly owned physicians, dentists, pharmacists
and other professional groups are mainly salaried employees. Exceptions to this rule can be found
among private health- care providers and dental clinics, which use a mixture of salaries,
capitation and fee-for-service payments to professional staff (Anell, 2004). In 2003, physicians
employed by the county councils earned SKr 48 100 (€5300) per month on average. This includes
compensation for work done and for being on call during non-regular working hours. The
corresponding salaries for nurses were SKr 23 000 (€2600) in the same period. Dentists made,
on average, SKr 35 300 (€3900) per month. As a comparison, the average monthly salary in 2003
for all employees in the county council sector was SKr 24 100 (€2700) (Statistics Sweden 2004e).

36
How providers deliver health care services to citizens
Italy
The Italian NHS is a huge organization with almost 650.000 employees, over 1.000 hospitals and
16.000 ambulatory facilities. It also relies on private accredited health structures and different
types of health professionals under contract with the NHS (Mapelli,1999)
Universal coverage entitles all citizens, regardless of their social status, to equal access to
essential health care services, services that are necessary and appropriate to promoting,
maintaining, and restoring health in the population. Essential health services are provided free of
charge, or at a minimal charge, and include general medical and pediatric services; essential
drugs and those for chronic diseases; treatments administered during hospitalization;
rehabilitation and long-term post acute inpatient care; instrument and laboratory diagnostics, as
well as other specialized services for early diagnosis and prevention.
NHS with own facilities engages to provide those services that can be divided in three categories:
1) Primary care; 2) Secondary care; 3) Tertiary care
Primary care is provided mainly by general practitioners and pediatricians and on-call physicians
and concern the promotion, prevention and protection patient´s health status, counseling, health
education, diagnosis and treatment of low complexity acute and chronic illness (low specialized
knowledge concentration and technology intensity) taking the patient´s burden and continuity of
health care. The secondary care concern specialized complex care (acute patient, diagnostic and
therapeutic deepening). The tertiary care concern specialized care ultra-complex with high degree
of technological engagement and ultra-specialized knowledge (Damiani et Ricciardi, 2005)
Regions provide these services to citizens through a network of public and private health care
structures and providers that can be divided into four different categories: 1) local health units 2)
public hospital trusts 3) National Institutes for Scientific Research 4) private accredited
providers (Observatory, 2001)
Local health units are responsible for delivering the benefit package (primary care) by directly
providing services through own facilities or through by funding hospital trusts and private
accredited providers (acute and long-term hospital, diagnostic laboratories, nursing homes,
outpatient specialistics and general practitioners). In according to 1999 reform (Article 3,
Legislative Decree 229/1999), local health units have to guarantee equal access to services for all
citizens, the efficacy of preventive, curative and rehabilitation interventions and efficiency in the
production and distribution of services (Damiani et Ricciradi,2005).
Local health units are organized in three macro-levels (see pag.13 fig. 2): 1) health district 2)
directly managed acute care and rehabilitation hospitals 3) health promotion division.
Health district are geographical unit responsible for ensuring the accessibility, continuity and
timeliness of primary care, non- hospital- based specialist medicine and residential and semi-
residential care to their assigned populations. The number of districts in each local health unit
depends on its size and on other geographical and demographical characteristics
Health districts also have the role of encouraging an inter- sectoral approach to health promotion
and ensuring integration between different levels of care and between health services and social
services. The health district, therefore, represents both an operational structure for providing
services and a vehicle for promoting health projects that integrate various operational structures,
in accordance with the strategic plans of the region and the local health unit. The general manager

37
of the health district has to be supported by a coordinating office to achieve these objectives. This
office includes general practitioners (primary care physicians), pediatricians and specialists to
promote the integration of health care and social services, which is also accomplished by
developing and disseminating general organizational guidelines. (Observatory, 2001).
Directly managed acute care and rehabilitation hospitals (presidi ospedalieri) provide
hospital-based acute inpatient, outpatient and rehabilitation care. These hospitals usually provide
only secondary care
Health promotion division is responsible for: 1) hygiene and public health, including infectious
and parasitic disease prophylaxis, health promotion and education and preventing environmental
hazards; this activity area is primarily concerned with promoting appropriate lifestyles 2) food
control (production, processing, preservation, commerce and transport), preventing food-related
disease and nutritional surveillance (preventing obesity and malnutrition, etc.); 3)preventing
occupational diseases and accidents by promoting safe behavior and 4) veterinary medicine
(surveillance of animal stock health, hygiene of food production and animal food safety and
control)
Public hospital trusts provide highly specialized tertiary hospital care (inpatient and outpatient).
Starting in 1992 (D.lgs 421/92), the conditions for obtaining trust status are a divisional
organizational structure, the existence of at least three clinical units considered by the law as
“highly specialized”, a complete accident and emergency department with an intensive care unit
and a particularly complex case mix (Damiani and Ricciard,2005).
National Institutes for Scientific Research (IRCCS) are research-oriented hospitals operating at
the local level. In addition to research funding, the Institutes receive a global budget that covers
inpatient and outpatient care and specific health care services, such as intensive care and
transplants (Observatory, 2001)
Private accredited providers provide ambulatory, hospital treatment and/or diagnosis services
financed by the NHS. The regional health departments regulate this participation through the
authorization and accreditation system. It means that authorized organizations can receive public
funding after having been accredited by the departments of health. Accreditation is conditional on
several structural, organizational and technological prerequisites defined at the regional level.
Other additional conditions set by regional health departments include a formal acceptance of the
financing scheme, formal acceptance of the external system for auditing the quality of care,
legitimacy and correctness of annual reimbursement claims, availability of quality peer-review
programs, participation by users in systematically reviewing the quality of the services provided,
adoption of health service charts and acceptance of control based on clinical results. Specialized
ambulatory services, including visits and diagnostic and curative activities are provided either by
local health units or by accredited public and private facilities with which local health units have
agreements and contracts. People are allowed to access specialist care only after approval by their
general practitioner, who is responsible for the referral. Once the general practitioner has
authorized the visit or the procedure, people are free to choose their provider among those
accredited by the NHS. A 100% co-payment with a maximum of €52 is required as an additional
source of financing and in an attempt to moderate the use of specialist ambulatory. Tests for
monitoring chronic conditions and treatment requested by people with low income are provided

38
free of charge. Hospital care is delivered mainly by public structures (672 in 2004, corresponding
to 51, 85% of the total) which provide both outpatient and inpatient services. Nevertheless, local
health units also contract out services to 624 private hospitals (48,18% in 2004), especially not-
for-profit institutions (Ministry of Health, 2008). Hospital services are free or at nominal charges
at the point of use and, four basic services- general medicine, surgery, pediatrics and gynecology-
are available in most general hospitals. The hospital beds in health facilities are not evenly
distributed among Italian regions. In 2004, in fact, Italy had 4 hospital beds per 1000 inhabitants
but southern regions had fewer than 3,6 beds per 1000 inhabitants, whereas the northern regions
had more than 4,1. In 2004 the average length of stay was 7,7 days (Ministry of Health, 2008),
continuing the downward trend of recent years. It measures the duration of a single episode of
hospitalization and it is calculated by subtracting day of admission from day of discharge. In the
table 7 below it is summarized the hospital structures in Italy for the period 2004. It is important
also note the overuse of nurse assistant per occupied bed. The data, in fact, show twenty units
more of staff with respect to hospital beds; it could be generate the risk of inefficiency and waste
of financial resources. Also the average inpatient care length of stay is not evenly distributed
among Italian regions; in 2004 data show that in the southern regions average length of stay
correspond to 6, 5 days and in the northern regions 8,3 days (Ministry of health, 2008).

39
Source: Adapted from the following databases: 1) OECD Health data,2009 2) Ministry of health of Italy
Pharmacies have the monopoly of drugs sales, but are subject to numerous clauses (Ministry of
health, 1999). There are almost 16,000 pharmacies distributed across the country. In general
pharmacies are privately owned by pharmacists, who act as independent contractors under the
NHS. There are only 1,129 public pharmacies, owned mainly by municipalities and managed by
pharmacists employed by municipalities and paid by salary (Ministry of health, 1999). By law
both private and public pharmacies are licensed to sell commercial products and, on behalf of the
NHS, pharmaceuticals, which include medication drugs and dietary goods (Observatory, 2001).
Consumers can only purchase pharmaceuticals if they have prescriptions from their general
practitioners. By 1994, in order to control pharmaceutical spending, regulatory power was
concentrated on a national technical body, the Committee for Drugs, which is made up of 14
clinicians and pharmacologists nominated by the regions and the Ministry of Health. This
Committee radically redefined the positive list (national therapeutic formulary), regrouping drugs
into four co-pay classes (A, B, C and H). Class A includes drug for essential and chronic diseases
that are covered by the NHS except for a minimal flat contribution by the patient (ticket). Class B
consists of other drugs satisfying primary therapeutic requirement whose cost is shared at 50% by
the consumer. Class C includes all other drugs that have no clinical documentation supporting
their efficacy, are more costly than Class A drugs, are used to treat minor or inexpensive illness
and do not require a prescription. Consumers are responsible for the total cost of class C drugs. In
the Class H are classified drugs provided by hospitals. (Garattini S, 1995)
Table 7 Hospital Structures in Italy in 2004
Total inpatient care beds 232.160
Total inpatient care beds per 1000 inhab. 4
Public inpatient care beds 178.596
Public inpatient care beds per 1000 inhab. 3,1
Total acute care beds per 1000 inhab. 3,4
Private accredited beds per 1000 inhab. 0,9
Inpatient care occupancy rate (%) 77,2%
Average inpatient care lenght of stay( days) 7,7
Physician per 100 beds hospital 52,4
Nurse assistant per 100 beds hospital 122,4

40
In the table 8 it is, also, summarized the organization of the Italian Health System with respect to
human and technological units are involved in the delivery process. The number of health care
professional increased in Italy during the last years; the total number of NHS employees
increased by 642.000 (Mapelli, 1999) in 1999 to 652.587( Ministry of Health, 2008) in 2006.
There are 3.019 Guardia Medica (On-call Physicians) stations employing 13304 doctors in Italy
(Ministry of Health, 2008).They are available during holidays, nights and weekends, providing
after- hours medical care and services when GPs and pediatricians are not available. The number
of General Practitioners (GPs) and pediatricians was 46.678 and 7526 respectively. From the
1999 to 2006 data show the pediatricians number increased by 1839 units and GPs number
decreased by 7832 (OECD health data, 2009). In the last years also the number of health care
technological resources increased (OECD health data, 2009). In fact, how is summarized in the
table below, in 2006 the number of magnetic resonances (MRI) and computed tomography
scanners (CT scanners) per 1 milion of population was respectively 16,9 (0,5 per 1000
inhabitants) and 29,1 (0,6 per 1000 inhabitants) ( OECD health data, 2009). In the same year the
total number of ultrasonographics was 2323, 3,9 per 1000 inhabitants (Ministry of Health, 2008).
Source: Adapted from the following databases: 1) OECD Health data,2009 2) Ministry of health of Italy
Table 8 Organization of Italian Health
System in 2006
Number of GPs 46.678
Number of Nurses and midwives 403.000
Pediatricians 7.526
Dentistry 37.000
On-call Physicians 13.304
Physicians working in hospitals( public and
private)
121.558
Practicing physicians per 1000 inhab. 3,69
Practicing nurses per 1000 inhab.
7,07
GPs per 10.000 inhab 7,9
Health personnel per 1.000 inhab.
11,07
number of magnetic resonances per 1 milion 16,9
number of CT scanners per 1 milion 29,1
Total number of ultrasonographics 2323
41
Sweden
The aim of national public health efforts is to improve public health and reduce differences in
health between different population groups and geographic regions. People should have the same
opportunities to enjoy good health, irrespective of gender, class, ethnic background or disability.
This is reflected in the national public health objective adopted by the central government, which
is “to improve public health for the groups in society that are the most disadvantaged from a
health perspective”. In April 2003, the Government adopted a Bill entitled “Public Health
Objectives” with the purpose to improve public health and reduce differences in health between
various population groups. New public policies efforts in Swedish focus on health promotion
compared to the former. The advantage of concentrating on health promotion is that public health
work will become more effective when focused on factors that determine health instead of the
diseases themselves. Initiatives aimed at creating good conditions for healthy lifestyles across the
population are included in the policies for public health. These initiatives include programmes
targeted at preventing the harmful effects of alcohol, drug and tobacco abuse and gambling
addiction, and at promoting physical activity, healthy diet habits and sexual and reproductive
health. Furthermore, communicable disease control, such as the prevention of HIV/AIDS, is part
of this policy area.
The aim of the primary care sector is to improve the general health of the population and to treat
diseases and injuries that do not require hospitalization. The primary care services include both
basic curative care and preventive services delivered through the local primary health care
centres (Districts). According to the Health and Medical Services Act, primary health care in
Sweden shall “without limitations regarding diseases, age or patient-group seek to fulfill the
population’s need for basic medical treatment, care, preventive services and rehabilitation which
do not require the hospitals’ medical and technical resources or other special
competence”(Observatory, 2005). Primary health care is responsible for guiding the patient to the
right level within the health system and include vaccination programmes for children pregnancy
checkups, health examinations and consultations, as well as certain types of treatment.
According to a government decision in 1995, all physicians in primary care must be specialists in
general practice and provide treatment, advice and prevention (district medical officers); others
directly employed at this level are nurses, midwives, physiotherapists and gynaecologists, who
also constitute part of the health-centre staff. The general practitioner usually provides the first
health service contact for adults or elderly people who have mainly physical health problems or
minor mental health problems (people with more serious mental health problem usually go
directly to psychiatric services). In many cases, the general practitioner also provides the first
health-service contact for children, although this function is shared with paediatricians and
district nurses. Specifically female health problems are mostly covered by obstetricians,
gynaecologists, district nurses or midwives. District nurses play a special role because often they
make a first assessment of patients and, if necessary, direct them to the health centre’s general
practitioners or refer them to the hospital. They are also involved in home care, and regularly
make home visits, especially to the elderly. However, they do not have sole medical
responsibility, but act, instead, under the supervision of physicians. Even if primary care is
mainly publicly provided, there are also private providers at this level. Most private providers
have contracts with a county council and are reimbursed with public funds for seeing patients.

42
Very few private physicians receive direct remuneration from their patients for consultation and
treatment. Every physician who intends to offer private health care must report this to the
National Board of Health and Welfare (Observatory, 2005)
For conditions requiring secondary health care, medical services are provided at county and
regional hospitals. The hospitals for acute care in Sweden are divided into district county
hospitals, central county hospitals and regional hospitals (see also fig.3), depending on their size
and degree of specialization. In the approximately 40 district county hospitals, there are at least
four specialties: internal medicine, surgery, radiology, and anaesthesiology. The medical
competence and equipment available at the central county hospitals enables the treatment of
almost all types of disease, including psychiatric problems. They have resources for both
emergencies and specialized medical treatment and offers a broad range of specialties, available
via departments. Currently, there are approximately 20 central county hospitals in Sweden, i.e.
one hospital for each county council area. Regional hospitals provide an extensive range of
medical specialties, and have a broader spectrum of specialists and subspecialist fields than
county hospitals. According to legislation, regional care encompasses those few patients who
present especially difficult problems; this demands cooperation among a number of highly trained
specialists, as well as specialist equipment that is costly and difficult to use. Regional care also
encompasses diseases that occur so rarely that physicians at county level lack experience as to
their treatment (Ministry of Health and Social Affairs 2004). There are eight regional hospitals in
Sweden, of which seven are affiliated with a medical school and also function as research and
teaching hospitals. For highly specialized care (tertiary care), Sweden is divided into six large
medical care regions, within which the county councils cooperate to provide the population
tertiary healthcare services. This is coordinated by National Specialized Medical Care within the
National Board of Health and Welfare.
Between 1993 and 2004, the total number of hospital beds was reduced by more than 40%. In
1993, the total number of beds per 1000 people was 5.5; however, in 2004, the number of beds
had decreased to 2,9 beds per 1000 people (Federation of Swedish County Councils 2004b). The
reduction in the number of beds in Sweden has resulted in a reduction in the average length of
stay. In 1993, the average length of stay was 7.9 days and in 2004, it had dropped to 6.10 days(
National Board of Health and Welfare, 2004). The decreasing number of beds together with the
reduction in the average length of stay have led to an increase in the hospitalization rate and the
rate of patient turnover (Observatory, 2005). The number of acute hospital beds per 1000
inhabitants in Sweden is low compared with other countries in western Europe (OECD countries
average was 3,9 per capita). The number of such beds has dropped from 4.1 to 2.2 per 1000
inhabitants during the same period in Sweden (see table 9). It means that in the absolute values
there are approximately 238 inpatient care hospital beds each 100.000 inhabitants (Swedish
Association of Local Authorities and Regions- SALAR )

43
Source: Adapted from the following databases: 1) OECD Health data,2009 2) National Board of health and welfare
All pharmaceuticals in Sweden are distributed and sold to the general public by the state-owned
National Corporation of Swedish Pharmacies. It operates hospital pharmacies under one-year
contracts with the county councils, as well as community pharmacies. There are 900 pharmacies
nationwide and another 1000 accredited agents – mainly grocery stores in rural areas. Before a
new drug or medical product can be sold, it must be approved and registered by Medical Products
Agency (MPA), a national authority responsible for regulation and surveillance of the
development, manufacture and sale of drugs and other medicinal products. From 2008, a state
expert agency (Dental and Pharmaceutical Benefits Agency – TLV), deals to evaluate and decide
which medicines and dental care procedures are to be reimbursed by the society and makes its
decisions primarily based on the cost-effectiveness (i.e. whether or not the cost of the treatment is
reasonable in relation to the good it does). It has also the responsability for monitoring
profitability on the pharmacy market with the objective to increase the services availability
without corresponding rising costs for patients and county councils. In order to base the decisions
on the best available evidence and material TLV collaborate with other agencies that are the
Social Insurance Agency (FK), Medical Products Agency, Swedish Council on Technology
assessment in Health care (SBU), and the Board of Health and Welfare (SoS). (http://www.tlv.se)
Table 9 Hospital Structures in Sweden in
2004
Total inpatient care beds 27088
Total inpatient care beds per 1000 inhab. 2,9
Public inpatient care beds Data not
available
Public inpatient care beds per 1000 inhab. Data not
available
Total acute care beds per 1000 inhab. 2,2
Private accredited beds per 1000 inhab. Data not
available
Inpatient care occupancy rate (%) 60%
Average inpatient care lenght of stay( days) 6,10

44
In the table 10 below it is, finally, summarized the organization of the Swedish Health System
with respect to human and technological units involved in the delivery process in 2006.
Source: OECD Health data,2009
In 2006, 29.190 registered physicians and 91. 000 registered nurses were employed in the county
council sector in Sweden (Health data, 2009); Sweden employ more resources in the health sector
than most other OECD countries; in 2006 in fact Sweden had 3.58 physicians per 1000
inhabitants compared with an average of 2.9 in OECD countries and 10,83 practicing nurses per
capita, compared to an OECD average of 9. During the past decade there has been rapid growth
in the availability of diagnostic technologies such as computed tomography (CT) scanners and
magnetic resonance imaging (MRI) units in most OECD countries. In Sweden, the number of
MRIs increased over time from about 1 per million population in 1989 to 7.9 in 1999 (latest year
for which data has been reported). The number of CT scanners as well rapidly expanded over time, up
to 14.2 CT scanners per million population in 1999 (latest year for which data has been reported-
OECD health data, 2009 )
Table 10 Organization of Swedish health
system in 2006
Number of GPs 5.326
Number of Nurses and midwives 97.005
Dentistry
7.270
Practicing physicians per 1000 inhab. 3,58
Practicing nurses per 1000 inhab.
10,83
GPs per 10.000 inhab 6,43
Physicians working in hospitals( public and
private)
29.190
Health personnel per 1000 inhab 3,2
number of magnetic resonances per 1 milion 7,9
number of CT scanners per 1 milion 14,2

45
Discussion
The purpose of this study has been to make a comparison between Italian and Sweden health
system with respect to financing and health services provision. This has been achieved by
examining how financial resources are collected from citizens (how occurs the distribution
mechanism of payments from citizens to regional level), how financial resources are allocated to
providers and how providers deliver health care services to citizens. Analyzing the prior literature
and collecting data I believe there are a lot of differences between this two health systems even
though logic underlying these two systems could seem the same.
The consequences due to distribution of payments from citizens to regional level is different.
As it showed in the figure 4 the public financing flow in Italian Health care is funded mainly by
income taxes levied from central government; the remaining revenues come from Regions
through indirect taxes as Value-added taxes, whose share for national budget is 74,3% and share
for National Solidarity Fund figure out 25,7%, and direct taxes as well as IRAP, whose share for
National Budget figure out 10-35% and share for Regional Budget is 65-90%, and Additional
regional income tax (IRPEF) that finance entirely the Regional Budget. The financing flow in
Sweden Health care (Fig.6) is different because it appears to be major decentralized to local
level, County councils and municipalities have the right to levy proportional income taxes on
their respective population. Sweden financing system is primarily founded on local taxes
revenues. County councils finance public Health system, also, through direct transfer from
Central State (subsidies and state grants) and sales. As it showed in Fig.5, in 2003, 72.2% of the
county council revenues originated from local taxes; the remainder consisted of: state grants 18%
(subsidies and general state grants), and other sources 7%. It means that Swedish Health system
is founded on a regressive payment system because local taxes are collected at increasingly lower
rates as income level increases. However, the financing in Italian Health system is founded
mainly on progressive and proportional payment system. In fact IRPEF (income tax rate) is a
progressive tax, because his share range from 23% (for income between 0 and EUR 15000) to
43% (for income exceeding EUR 75000). In addition a regional city tax may range from 0.9% to
1.4%, depending on the region in which the individual lives; IRAP is a proportional tax because
under IRAP self employed individuals are subject to a tax rate of 4.25% applied to productive
activity exercised, even if this may be increased by up to 1% by individual regions. Finally
Value-added taxes is a proportional tax and, as it explained in the section related to financing, a
fixed proportion of this tax (25,7%) is used to build the National Solidarity Fund in order to
compensate the differences in fiscal autonomy among 21 regions (see ”How financial resources are
collected from citizens” section)

46
The mechanism by which financial resources are allocated to providers is different. In Italy the
1992 reform (D.lgs 502/1992) envisaged widespread changes in financing of hospitals as well as
the switch from cost-reimbursement mechanism (or global budget, where even if planned
expenditure are exceeded, overall health interventions declared are still financed) to prospective
payment system (where hospitals are remunerated on the basis of health services provided
according to pre-determinate fees for each hospitalization, (see tab.6). It means, how it showed in
the Fig.7, each regions receives financial resources from citizens (households through income
taxes and companies through other regional taxes) and allocates this funds to each LHA (local
health unit) on the basis of the number of residents, the frequency of health consumption per age,
per sex, mortality rates and different epidemiological local indicators. In turn each LHA finances
its own directly managed hospitals and facilities, “hospital trusts” and private accredited facilities
in its territory through prospective payment system, classified by international system DRGs for
both inpatient and outpatient procedures. In Sweden prior literature shows resource- allocation
principles vary among the county councils. It means that in 2004 about half of the county
councils payments to primary care centres are based on global budgets ( cost-reimbursement
mechanism) and among others a smaller group of about five county councils ( Bohus, Dalarna,
Stockholm, Sörmland and Skäne) continued to develop prospective payment system ( Drg) with
aiming to solve Swedish health care major problems as well as the long waiting-lists and a lack of
incentives for providers to increase health care output owing to fixed budget. Local governments
(County councils and Municipalities) receive funds from Central Government and from citizens,
taking into account demographic (age and average life), socioeconomic (number of single
households) and geographical (special compensation for small county councils) indicators, and
allocate financial resources to their facilities (8 regional hospitals, 20 county hospitals, 40
districts county hospitals, 1100 health centres and special housings and home care for elderly and
disabled people.(see “how financial resources are allocated to providers” section)
In Italy the payment structure for physicians follow the hierarchical structure based on two levels;
the first level physicians that have support and cooperation duties as defined by the medical
officer in charge of the hospital unit, earn about €41 300 per year, and second-level physicians,
that have duties connected with organizing and managing the hospital unit receive about €62 000
(€5100 per month), including nights and weekends on call for both types. Usually a Swedish
physician, employed by the county councils, earns SKr 48 100 (€5300) per month on average
and includes compensation for work done and for being on call during non-regular working
hours. In Italy unlike physicians, nurses do not constitute a separate professional category but
occupy the higher level of a wider hierarchical structure of nonmedical NHS employee including
technicians, clerks, caretakers and administrative staff; their payment structure is defined by a
National Collective Agreement and divided in four levels: first-level employees (group A) have
simple duties and generally include auxiliary workers and caretakers (15-17000€ to year); second
level (Group B) includes more skilled workers, such as assistant technicians and administrative
staff with little responsibility (17000-20000 €). The highest levels, groups C (19000-23000 €) and
D (21000-28000 €), comprise mainly nurses together with midwives, dietitians and technicians
working in such areas as radiology, orthopedics and ophthalmology, as well as higher-level
47
administrative staff. In Sweden nurses constitute a separate professional category and use to earn
SKr 23 000 (€2600) per month.
The units and the human and technological resources involved in the delivery process of
health care services are different. In Italy Regions provide primary, secondary and tertiary care
through local health units, divided in health districts, directly managed acute care and
rehabilitation hospitals and health promotion division, public hospital trusts, National
Institutes for Scientific Research and private accredited providers (Fig.2). Swedish Health
system provide the same benefit package through local primary health care centres, for basic
curative care and preventive services (primary care), district county hospitals, regional
hospitals that provide an extensive range of medical specialties and central county hospital that
have resources for both emergencies and specialized medical treatment offering to patients a
broad range of specialties. This facilities are directly owned and managed by County Councils;
for elderly care and for disabled people the 290 municipalities manage directly special housing
and home care( see fig.3).
In 2004 data showed total inpatient care beds in Italian hospital structure is much greater than
Sweden (232.160 and 27088 respectively) and it is coherent with the County Council policy
(between 1993 and 2003) to reduce the number of hospital beds by more than 40%. Each 1000
inhabitants may benefit about 4 inpatient care beds in Italian facilities and 2,9 beds in Sweden.
Total acute care beds each 1000 inhabitants is major in Italy (3,4) than Sweden (2,2) but both
have a low value if compared with other countries (average= 4,1 each 1000 inhabitants). In the
same year the average length of stay that measure the duration of a single episode of
hospitalization was major in Italy than Sweden, 7,7 days and 6,10 respectively ( Tab. 7 and 9). In
the Tables 8 and 10 are instead summarized data that refer to different organization of health
systems in 2006. Health data show a limited use of health personnel in Sweden hospital with
respect to Italian hospital. For example the number of GPs was 46.678 (7,9 each 10.000
inhabitants) in Italy and 5.326 (6,43 each 10.000 inhabitants) in Sweden; the number of dentists
employed in NHS was 37.000 in Italy and 7270 in Sweden; the number of nurses and midwives
was 403.000 in Italy and 97.005 in Sweden. In the latter two cases data showed that though there
are more dentists, nurses and midwives in Italy with respect to Sweden, the percentage of health
staff each 10.000 inhabitants is major in Sweden. In fact in 2006 there was 8 dentists in Sweden
each 10.000 inhabitants (in Italy 6) and the number of nursing and midwifery, for the same range
of population, was 109 in Sweden and 72 in Italy. The number of physician working in the
public and private hospitals is major in Italy( 121.558 units) than in Sweden( 29.190 units), and
each 1000 inhabitants may benefit of about 3,69 physicians in Italy and 3,58 in Sweden. Data
showed, in the same period, the number of technological units involved in the delivery process is
major in Italy than in Sweden; for example the number of Magnetic Resonance Unit was 16,9
units in Italian hospitals and almost half in Swedish hospitals (7,9 units) each 1 million of
inhabitants as well as the total number of CT scanners that was 29,1 units and 14,2 each 1 million
of inhabitants respectively. (see “How providers deliver health care services to citizens”)

48
Conclusions
In conclusion from my research work emerge some interesting aspects that should be clear:
- The analysis of the different financing flow of public health care shows a different distribution of
payment. Particularly it should be clear that the payment collecting system that finance Swedish
public healthcare is unfair because citizens with high income levels use to pay less with respect to
citizens with low income. It means that the principle of fairness in financial contribution (third
goal that each health system should achieve- see introduction page 5) is violated because those
least able to contribute pay proportionately more than the better-off. However in Italy the
distribution of payments that occur within public health system is certainly more fair because
rich people use to pay more than poor people. It means the poor households don´t pay an
excessive share of their income in obtaining needed health care and rich households pay
according to their ability to generate income.
- The analysis of different shares of total health spending shows in 2007, Sweden invested more
on health care system (9,1% GDP) with respect to Italy (8,7%) and to other OECD countries (9%
GDP); the share of public health expenditure is major in Sweden than Italy (81,7 and 76,5
respectively), while percentage of private health expenditure is growing in Italy and it is major
than Sweden( 23,5% and 18,3% respectively), even if both are below OECD countries average
(27%) (Tabl.1). More precisely data shows the percentage of out-of-pocket payments on total
expenditure was 20,2% in Italy (Tab.3) and 15,9% in Sweden (Tab.5) and the use of voluntary
private health insurance is major in Italy (3,3% of total private expenditure) than Sweden
(2,4%)
- The analysis of health care resources involved in the delivery process in 2004 shows the number
of resources involved by responding to citizens´ needs is significantly higher in Italy than
Sweden. Total inpatient care beds in Italian hospital structure is much greater than Sweden
(232.160 and 27088 respectively); total acute care beds each 1000 inhabitants is major in Italy
(3,4) than in Sweden( 2,2); in 2006 the number of GPs was 46.678 in Italy and 5.326 in
Sweden; the number of dentists employed in NHS was 37.000 in Italy and 7270 in Sweden; the
number of nurses and midwives was 403.000 in Italy and 97.005 in Sweden. The number of
physician working in the public and private hospitals is major in Italy (121.558 units) than in
Sweden (29.190 units). Italy has a greater supply of advanced technological equipment than
Sweden because the number of Magnetic Resonance Unit was 16,9 units in Italian hospitals and
almost half in Swedish hospitals (7,9 units) each 1 million of inhabitants as well as the total
number of CT scanners that was 29,1 units and 14,2 each 1 million of inhabitants respectively.
Taking in consideration not the absolute value but the number of health care resources each
10.000 inhabitants emerge some interesting considerations concerned that the share of health
staff, involved in the delivery process, each 10.000 inhabitants is major in Sweden than in Italy.
It means that for example in 2006 the number of dentists in Sweden was 8 each 10.000

49
inhabitants while in Italy was 6 and the number of nursing and midwifery employed in NHS,
for the same range of population, was 109 in Sweden and 72 in Italy. It means in Italy there are
too many “providers”, which tend to increase the health expenditure, but poorly allocated on
national territory, while in Sweden the providers allocation is done in a more rational and
efficient way, offering a high quality of health care services and taking into account, at the same
time, cost-control and rationalization measures (between 1993 and 2003 the number of hospital
beds was reduced by more than 40%).
I hope with this work I gave new insights about this two health systems in order to encourage the
reader to reflect about what should be done to improve the functioning of both. I hope, also, that
in future data, that are unavailable now, can be found easily; further research and more empirical
testing remains to be done in order to make more complete the comparison.

50
Bibliography
1. Abel-Smith B, Mossialos E. Cost containment and health care reform: a study of the European
Union. Health Policy.1994;28:89-132
2. Anell A, Swedish Healthcare under pressure. The Swedish Institute for Health Economics (IHE),
Sweden 2004
3. Anell A, Svarvar P. Landstingens förnyelse av organization och styrsystem. IHE: Lund,1994)
4. Antonio Brenna. Manuale di economia sanitaria: per un'allocazione razionale delle risorse,Cis
Editore, Milano 2003
5. Beauchamp T, Childress J. Principles of biomedical ethics. Third edition. Oxford, Oxford
University Press, 1989
6. Bernhart MH et al. Patient satisfation in developing countries. Social science and medicine,
1999, 48 (8): 989-996
7. Brock D. Life adn death: philosophical essays in biomedical ethics. Cambridge, Cambridge
University Press, 1993
8. Contratto collettivo nazionale di lavoro del personale del comparto del Servizio Sanitario
Nazionale, quadriennio normativo 2006-2009 e biennio economico 2006-2007
9. Damiani G., Ricciardi G., 2005: Manuale di programmazione e organizzazione sanitaria.
Idelson Gnocchi
10. Diderichsen F, Varde E, Whitehead M (1997). Resource allocation to health authorities: the
quest for an equitable formula in Britain and Sweden. BMJ 315:875–888
11. Diridin N. Federalismo fiscale e tutela della salute. Un percorso di responsabilizzazione delle
regioni o il presupposto per cambiamenti strutturali
12. Donabedian A. Models for organizing the delivery of personal health services, and criteria for
evaluating them. Milbank Memorial Fund Quarterly, 1972, 50 (4): 103-154
13. Donatini A, Rico A, D’Ambrosio MG, et al. Healthcare systems in transition: Italy. European
Observatory on Health care systems, April 2001
14. DRGs and the Medicare program: implications for medical technology: a technical
memorandum. July 1983
15. European Observatory on Health Care systems in transitions: Italy 2001
16. European Observatory on Health Care systems. Health care systems in Transition- Sweden,
2005
17. Fabricant S, Kamara C, Mills A. Why the poor pay more: household curative expenditure in
rural Sierra Leone. International Journal of health planning and management, 1999, 14: 179-
1999
18. Faden RR, Beauchamp TL, King NM. A history and theory of informed consent. Oxford,
Oxford University Press, 1986
19. Fattore G, Jommi C. The new pharmaceutical policy in Italy. Health policy. 1998; 46: 21-41
20. Fattore G. Clarifying the scope of Italian NHS coverage. Is it feasible? Is it desiderable? Health
policy. 1999; 50: 123-142
21. Federation of Swedish County Councils [Landstingsförbundet] (2004b). Sjukvårdsdata i Fokus
[Health care data in focus].

51
.
22. Federation of Swedish County Councils [Landstingsförbundet] (2004a). Statistisk årsbok för
landsting 2004 [Statistical yearbook for county councils 2004]. Stockholm, Landstingsförbundet.
23. Garattini S. Cultural shift in Italy´s drugs policy. Lancet. 1995;346:5-6
24. GilsonL, Alilio M, Heggenhougen K. Community satisfation with primary health care services:
an evaluation undertaken in the Morogoro region of Tanzania. Social science and medicine ,1994,
39 (6): 767-780
25. http://www.tlv.se
26. Kleinman A. Concepts and a model for the comparison of medical systems as cultural systems.
Social science and medicine, 1978, 12: 85-93
27. Landstingsfo¨rbundet. Statistisk A˚rsbok fo¨r Landstingen 2004. Landstingsfo¨rbundet
Stockholm 2004
28. Leavitt J. ”Thypoid Mary” strikes back: bacteriological theory and practice in early twentieth
century public health, Isis, 1995,86 (4): 617-618
29. Mapelli V. Cost containment measures in the Italian health care system. Pharmacoeconomics
1995;8:85-90
30. Mapelli V. Il sistema sanitario italiano. Società Editrice Il Mulino, Bologna, 1999
31. Meriam Webster´s deluxe dictionary. Pleasantville, New York/ Montreal, Reader´s Digest, 1998
32. Ministero della Sanita´. Piano Sanitario Nazionale 1998-2000. Suppl.ord.n. 201, Gazzetta
Ufficiale, 288 (12 December) 1998
33. Ministero della Sanita´. Piano Sanitario Nazionale 1998-2000. Suppl. Ord. N. 201, Gazzetta
Ufficiale, 288(12 December) 1998
34. Ministero della sanità, World Health organization, European Center for Environment and
Health. Health in Italy in the 21st century. Rome: WHO European, 1999
35. Ministry of Health and Social Affairs [Socialdepartementet] (2004).Promemoria om
överlämnande av ansvaret för driften av sjukhus till privata entreprenörer [Memorandum
regarding the responsibility of contracting out hospital care], Memorandum S2004/4905/HS.
Regeringskansliet, Stockholm, Socialdepartementet
36. Ministero della Sanità. Annuario Statistico Italiano, 2008
37. Murray CJL, Frenk J. A framework for health system performance assessment. Geneve, World
Health Organization, 1999
38. National Board of Health and Welfare, 2004
39. OECD. Health Data. Paris: OECD, 2009
40. Pernick, M. Eugenics and public Health in American History. American Journal of public
health, 1997, 87 (11): 1767-1772
41. Roemer MI. National Health systems of the world Vol.1: the countries. New York, Oxford
University Press, 1991
42. Roversi Monaco F. Il nuovo servizio sanitario nazionale. Maggioli Editore, Rimini 2000
43. Rylance G. Privacy dignity, and confidentiality: interview study with structured questionnarie.
British medical journal, 1999, 318: 301
44. Smith AM. Dignity and medical procedures. Journal of medical Ethics, 1981, 7 (2): 88-90
45. Statistics Sweden [Statistiska Centralbyrån] (2004e). Löner och sysselsättning inom
landstingskommunal sektor 2003 [Salary and employment in the county council sector 2003].
Sveriges officiella statistik, Statistiska meddelanden

52
46. Taroni F. DRG/ROD e nuovo sistema di finanziamento degli ospedali. Il Pensiero Scientifico
Editore, Roma, 1996.
47. Taroni F. Devolving responsability for funding and delivering health care in Italy. Euro
observer. 2000;2(1)
48. The Swedish Health Care Act. § 3, 1982
49. World Medical association. Declaration of Lisbon, 1981 and 1995
50. World Heatlh report 2000- Health systems: improving performance
.