It Takes a Network to Build an Ocean Observing...
14
Maritime Museum of San Diego 18 In the last twenty years oceanographers have put in place large observing systems to keep tabs on how the ocean works and how it is changing. Today, NOAA maintains the TAO array along the Pacific’s equator to observe and predict the evolution of El Niños and La Niñas. A global array of instruments includes autonomous floats that bob up and down to a mile depth, expendable probes dropped from commercial vessels, and drifters that measure surface currents and observe changes in the ocean over seasons to decades. The technology to observe broad expanses of the ocean is the product of a remarkable period of progress born of the realization during World War II that knowledge of the ocean had value, and it was enabled by the technological explosion during the Cold War and Sputnik era. It is, most of all, the product of a network of scientists and engineers enticed by the opportunity to do and learn new things in the ocean. Scripps Institution of Oceanography (SIO) is a leader in that global network because, as this article tries to tell, Scripps is itself a network of people and ideas. WWII began a remarkable change in how the ocean was studied. Historically, oceanographers had observed the subsurface ocean using water-sampling devices lowered from isolated seagoing research vessels, inferred currents from water properties using the same pressure-velocity relation employed by meteorologists to infer winds from pressure measurements, and measured surface temperature with samples lifted aboard in buckets. Perhaps, because repeated measurements were rare, the ocean circulation was thought of as basically steady, perturbed by small-scale phenomena and capped by a thin near-surface layer that responded to the wind. El Niño was known along the west coast of South America, but its global extent and relation to global climate were unknown. As Dr. Knox’s companion article explains, 1 the realities of acoustic propagation made the variations of the ocean in time and space important and resulted in MBTs and XBTs (mechanical and expendable It Takes a Network to Build an Ocean Observing System By Russ E. Davis, Ph.D. bathythermographs) that enabled any boat or ship to measure temperature several hundred feet below the surface. This was the first serious effort to proliferate ocean measurements. Scientifically, it was important in enabling repeated and far-flung measurements. This was the first step toward today’s global observing system that observes marine weather, tracks the El Niño and La Niña cycles, observes the changing temperature of the ocean that contributes to sea- level rise, and monitors the rate at which the ocean’s circulation transports heat from the tropics to the poles. This article describes the network of pioneers who made it possible to maintain large-scale ocean observing systems. Early Moorings S hips traveling at speeds fast compared with ocean currents give a picture of the ocean’s spatial structure, but not how it changes in time. To do that, measurements must be sustained at one place. From the late 1950s through the 1970s two groups, more or less simultaneously, began to develop “moorings” (instrument systems that were temporarily anchored to the bottom and then returned to the surface for recovery) in order to gather the needed “time series”. One group was led by Bill Richardson, at Woods Hole Oceanographic Institution (WHOI), and another by John Isaacs, at SIO. John Isaacs, an inventive professor at Scripps, who knew how to leave an impression on all he met, was one of the first to see how the observational reach of ships could be extended using “free vehicles”. These relatively small packages 2 were dropped from a ship, reached the bottom where they might stay for hours, and then returned to the surface to be located by radar and recovered. Free vehicles collected multiple samples in the water column, or on the bottom, from a ship that was otherwise engaged. The potential to measure near bottom currents this way fostered an effort at Scripps to develop a current meter for light- weight moorings. The resulting current meter 3 used
Transcript of It Takes a Network to Build an Ocean Observing...

M a r i t i m e M u s e u m o f S a n D i e g o18
In the last twenty years oceanographers have put in place large observing systems to keep tabs on how the ocean works and how it is changing. Today, NOAA maintains the TAO array along the Pacific’s equator to observe and predict the evolution of El Niños and La Niñas. A global array of instruments includes autonomous floats that bob up and down to a mile depth, expendable probes dropped from commercial vessels, and drifters that measure surface currents and observe changes in the ocean over seasons to decades. The technology to observe broad expanses of the ocean is the product of a remarkable period of progress born of the realization during World War II that knowledge of the ocean had value, and it was enabled by the technological explosion during the Cold War and Sputnik era. It is, most of all, the product of a network of scientists and engineers enticed by the opportunity to do and learn new things in the ocean. Scripps Institution of Oceanography (SIO) is a leader in that global network because, as this article tries to tell, Scripps is itself a network of people and ideas.
WWII began a remarkable change in how the ocean was studied. Historically, oceanographers had observed the subsurface ocean using water-sampling devices lowered from isolated seagoing research vessels, inferred currents from water properties using the same pressure-velocity relation employed by meteorologists to infer winds from pressure measurements, and measured surface temperature with samples lifted aboard in buckets. Perhaps, because repeated measurements were rare, the ocean circulation was thought of as basically steady, perturbed by small-scale phenomena and capped by a thin near-surface layer that responded to the wind. El Niño was known along the west coast of South America, but its global extent and relation to global climate were unknown.
As Dr. Knox’s companion article explains,1 the realities of acoustic propagation made the variations of the ocean in time and space important and resulted in MBTs and XBTs (mechanical and expendable
It Takes a Network to Build an
Ocean Observing SystemBy Russ E. Davis, Ph.D.
bathythermographs) that enabled any boat or ship to measure temperature several hundred feet below the surface. This was the first serious effort to proliferate ocean measurements. Scientifically, it was important in enabling repeated and far-flung measurements. This was the first step toward today’s global observing system that observes marine weather, tracks the El Niño and La Niña cycles, observes the changing temperature of the ocean that contributes to sea-level rise, and monitors the rate at which the ocean’s circulation transports heat from the tropics to the poles. This article describes the network of pioneers who made it possible to maintain large-scale ocean observing systems.
Early Moorings
Ships traveling at speeds fast compared with ocean currents give a picture of the ocean’s spatial structure, but not how it changes in time.
To do that, measurements must be sustained at one place. From the late 1950s through the 1970s two groups, more or less simultaneously, began to develop “moorings” (instrument systems that were temporarily anchored to the bottom and then returned to the surface for recovery) in order to gather the needed “time series”. One group was led by Bill Richardson, at Woods Hole Oceanographic Institution (WHOI), and another by John Isaacs, at SIO.
John Isaacs, an inventive professor at Scripps, who knew how to leave an impression on all he met, was one of the first to see how the observational reach of ships could be extended using “free vehicles”. These relatively small packages2 were dropped from a ship, reached the bottom where they might stay for hours, and then returned to the surface to be located by radar and recovered. Free vehicles collected multiple samples in the water column, or on the bottom, from a ship that was otherwise engaged. The potential to measure near bottom currents this way fostered an effort at Scripps to develop a current meter for light-weight moorings. The resulting current meter3 used

19Maritime Technology Innovation in the Pacific: Past, Present and Future
Russ E. Davis grew up on the San Francisco peninsula and received a B.S from UC Berkeley and a Ph. D. from Stanford in Chemical Engineering fluid mechanics. He joined the Scripps Institution of Oceanography in 1967. His interests have included waves and turbulence in the ocean, air-sea interaction, large-scale ocean circulation and its effect on climate. From his thesis days, he has trusted observations and had a healthy skepticism about descriptions of how the world works that are drawn from models. He taught courses in waves, fluid mechanics, and methods of observational analysis before retiring in 2007. He is a member of the National Academy of Science.
a vane to orient into the current and a Savonius rotor to measure current speed. Rotor speed, sensed optically, and current direction from a compass-driven low-torque potentiometer, were recorded on a Rustrack chart recorder.4 Bottom currents in the deep ocean being very weak, the rotor was made to respond to very slow flow (less than 1 cm/s). This capability and a compact configuration made the Isaacs meter useful into the 1990s.
t the same time, SIO and WHOI were both developing tall moorings to carry multiple instruments and span full
ocean depths for months or years. These huge structures of wire and/or rope were supported by flotation at the surface (surface moorings), or below the surface (subsurface moorings) and were held in place until recovery by anchors frequently weighing
over a thousand pounds. The lengthy development of these complex moorings has been called “an experimental war against Murphy’s Law,” because the unanticipated problems were myriad. Moorings were lost to strong currents that broke them, to shark bites that severed the mooring lines, and hardware that lost its strength with time in service. These challenges were overcome by large teams of dedicated, ingenious and, above all, patient scientists and engineers.
At Scripps, interest focused on air-sea interaction. In the 1960s, Isaacs and others noticed that persistent sea-surface temperature patterns in the North Pacific were correlated with seasonal and annual weather patterns over the Pacific and North America and this relation became a focus of Scripps research for decades. Isaacs’
goal was to use surface moorings to see what was happening in the North Pacific to link air and sea. His group explored various mooring configurations, including the first taut-nylon mooring lines and catamaran surface buoys, with the aim of making long-term surface weather observations and measuring upper ocean temperature profiles.
Bumble Bee buoys, whose shape and yellow and red stripes gave the impression of a giant floating bee, were stationed in the central North Pacific to discover the dynamics of long-lasting sea-surface temperature anomalies associated with climate patterns over the U.S.Courtesy Scripps Institution of Oceanography Archives, UC San Diego Library
A

M a r i t i m e M u s e u m o f S a n D i e g o20
This eventually led to the “Bumble Bee buoy,”5 whose surface appearance was that of a yellow and red striped bee floating on the ocean. Thermistors placed in the mooring line, or a single thermometer raised and lowered by a winch measured temperature at depth, while air temperature, barometric pressure and wind speed were measured on the buoy. The signature feature of the buoys was a recording system based on a movie camera photographing a panel of electrical gauges indicating voltages from the various sensors.
The pinnacle of Bumble Bee technology came during the North Pacific Experiment (NORPAX) that studied large-scale air-sea interaction and climate variability. Multiple widely spaced Bumble Bee moorings were maintained in the central North Pacific from 1968 to 1972. It was planned to replace them with commercially developed Monster Buoys6 that were 12-meter discus buoys weighing 50 tons. The capital and maintenance costs of these buoys were, however, so high that ONR and NSF reorganized NORPAX to be led by Charles Cox, a renowned Scripps oceanographer known best for his pioneering studies of microstructure (the tiniest scales of velocity and temperature variability in the ocean). Remarkably, Cox had no trouble moving from these tiny signals to the size of ocean basins and the observing system he organized is discussed below.
Compared with SIO, Richardson’s group emphasized currents and the ocean well below the surface layer. As was learned later, the ocean is stirred by “mesoscale eddies”, the oceanic analogues of the atmosphere’s weather systems that are strongest on the western side of each ocean. This was a big challenge to Richardson’s efforts to get moorings to survive in the western North Atlantic, adding to the sharks that attacked mooring lines deeper in the Atlantic, and the way the polypropylene, first used as mooring line, was structurally inferior to the nylon adopted later. At first the ocean won and, in 1967, all of a seven-mooring array vanished before recovery. But the WHOI
Buoy Group was determined, well-funded and took a methodical approach to perfecting both surface and subsurface moorings. By the mid-1970s their moorings were reliable for many months, much had been learned about currents in the western North Atlantic from them, and the technology was developed into the basic form that was used for years. The story of this heroic battle is succinctly summarized in “Building Them Tough, Bringing them Back.”7
The Swallow Float Revolutionhile this pioneering mooring work was
going on at SIO and WHOI, the British oceanographer John C. Swallow began
measuring deep subsurface currents by following acoustically tracked “floats” as they drifted at depth, carried by the currents. His floats were made of aluminum tubing that was strong enough to resist the pressure of the mid-depth ocean and light enough to be neutrally buoyant (with the same overall density as seawater). Swallow discovered that such a float would be less compressible than seawater, so if it was a little negatively buoyant at the surface it would sink until its density matched the water density,
at which point it would float on the ocean’s density gradient while being carried along by currents.
In post-war England materials suitable for floats were scarce, so Swallow used aluminum scaffold tubing subjected to caustic baths to adjust its wall thickness. These “Swallow floats”8 were fitted with acoustic pingers that could be tracked from a ship if it stayed within a few miles range. These simple devices became a prime example of Scripps Professor Walter Munk’s insightful saying: Every time we look at the ocean with a new instrument we learn something. Based on infrequent low-resolution historical ship surveys in the 1960s, currents were believed to be weak (a few millimeters per second) and to vary little over months and hundreds of kilometers. When Swallow and WHOI oceanographer Henry Stommel set out to measure deep ocean currents, their Swallow floats immediately belied
John Swallow prepares an early Swallow Float for deployment, while the ships’ cat looks on curiously.
Courtesy of John Swallow
W

21Maritime Technology Innovation in the Pacific: Past, Present and Future
conventional wisdom: the floats moved fast and changed direction in 50 km.
Swallow’s discovery was revolutionary. Stommel, Alan Robinson, of Harvard, and Carl Wunsch, of MIT, were energized to discover the structure and dynamics of whatever Swallow had observed. Under NSF funding, they assembled the first large-scale collaborative ocean study, the Mid-Ocean Dynamics Experiment (MODE) that involved U.S. and Soviet Union observers and modelers. Their goal was to develop the analog of weather maps for an ocean region and to use these to learn the phenomenon’s dynamics using the day’s best numerical models. Using a remarkably objective and cooperative procedure, the MODE team designed a regional array matched to their scientific question, setting a high bar for designing future observing arrays. MODE stretched over the first half of the 1970s and provided a high quality description and dynamical diagnosis of what are now called “mesoscale eddies” (that had made WHOI’s mooring work so difficult).
I n addition to hydrographic sampling from ships and WHOI moorings,
MODE designers had a much improved current-following float to work with. The original Swallow float demanded nearly constant tending by an expensive ship. Tom Rossby, of the University of Rhode Island, and Doug Webb (WHOI) used low-frequency acoustic tracking in the SOFAR channel (the acoustic waveguide that traps sound transmission well below the surface in the MODE region). This extended tracking range well beyond 1000 km. These “SOFAR Floats”9 were huge (600 pounds) projectors that efficiently transmitted sound to distant moored or bottom mounted listening stations that located them. Freed from ships, SOFAR floats made practical long-duration measurements of currents around the world. Later, Rossby10 improved on the SOFAR float by reversing the roles of large sound sources and listening stations. In this RAFOS (SOFAR reversed) system, a few large sound sources are moored and many small listening stations are carried by floats that tracked themselves from received signals. This greatly increased the feasibility of deploying large arrays of current-following floats.
The huge SOFAR float looms over its inventors Tom Rossby and Doug Webb. Courtesy of Doug Webb

M a r i t i m e M u s e u m o f S a n D i e g o22
Regional and Global Observing Systems
The expensive NORPAX plans for Monster Buoys made Cox realize that moorings were impractical for covering ocean basins. He directed attention toward developing a mix of more sustainable observing tools that could observe air-sea interaction over large areas. These tools included XBTs dropped from commercial vessels and aircraft, satellite measurements of surface temperature, satellite-tracked surface drifting buoys, and Acoustic Doppler Current Profilers (ADCPs) measuring upper-ocean currents from research vessels. XBTs were already widely used, but their accuracy was uncertain and Meredith Sessions and Tim Barnett, of Scripps, made advances understanding and correcting for the errors.11 Satellite sea-surface temperature (SST) observations disclosed complex patterns associated with major currents and nearly ubiquitous mesoscale eddies, but their SST accuracy was low because the intervening atmosphere affected satellite calibration. Drifting surface buoys were used to reference the satellite measurements.
Surface currents have been measured by tracking something drifting on the surface since pre-history. Until the advent of satellite tracking, the surface drifter and observer had to be reasonably close for visual or radar contact. Satellites provided tracking, so the challenge became making the drifter follow upper-ocean currents rather than being blown by the wind. This was done by attaching “drogues” (parachutes or other pliant structures that were hard to drag through the water) to the drifters. The challenge was to make the whole thing hang together for months while following currents. NORPAX testing of heavy weather
buoy performance brought tragedy. The same Bill Richardson who began the WHOI Buoy Project and Wayne Hill of SIO were using the RV Gulf Stream to test the survivability of NORPAX designs off Maine, in January 1975. For reasons never fully understood, the ship and all hands were lost at sea during what were typically unpleasant but not extreme conditions. Gerald McNally continued the NORPAX drifter program and gathered results that showed dramatic year-to-year changes in the surface circulation of the North Pacific.12
detour in time is required to explain Cox’s proposal to develop ADCPs so that ships could measure upper ocean currents in NORPAX.
Fred N. Spiess, a veteran of 13 WWII submarine patrols and recipient of Bronze and Silver Stars, brought to Scripps an imagination that made things happen. As head of the Marine Physical Laboratory, he led the development of the Floating Instrument Platform (FLIP) as a platform for acoustics research and Deep Tow, one of the first remotely operated vehicles to survey the ocean bottom at great depth. FLIP is a unique vehicle/platform that has the bow of a ship and the after-body
of a submarine.13 This structure allows the stern to be flooded until the hull is vertical, leaving FLIP’s bow sticking above the surface. In this vertical configuration, FLIP is a very stable platform that responds little to the sea or swell. It was first used for research related to military needs, particularly acoustics, but over time civilian research uses emerged.
Spiess and graduate student Rob Pinkel saw that FLIP could hold steady very large acoustic transducers to form narrow sound beams. When the sound from these
Floating Instrument Platform FLIP becoming vertical. Courtesy Scripps Institution of Oceanography Archives, UC San Diego Library
A

23Maritime Technology Innovation in the Pacific: Past, Present and Future
beams scattered off small particles, typically zooplankton, it would return with a frequency that was Doppler shifted by the scatterer motion, which is essentially the water’s motion. With multiple beams and appropriate processing, ocean velocity could be profiled. Pinkel developed large acoustic transducers mounted to FLIP and a Doppler processing system that was efficient at measuring velocity. He used this pioneering system to probe ocean currents, internal waves, zooplankton migration and stirring in the ocean’s upper kilometer.14
hen Cox saw Ametek-Straza’s ship’s log, which measured ship motion over the bottom using a Doppler shift principal, he
suggested adapting it to profile currents in the way Pinkel did. Lloyd Regier, Scripps’ Shipboard Computer Group and I collaborated with Fran Rowe and Kent Deines, of Ametek, to add equipment to the ship’s log on RV Thomas Washington to extract the Doppler signal. Myriad problems, including ship noise, bubbles that scattered the acoustic beams, and errors in ship compasses and navigation, had to be solved, but by 1978 the ADCP system worked reliably down to about 100 meters.15 When WHOI put our plans to work on one of their ships, Ametek saw a commercial opportunity and developed a shipboard Doppler unit with improved performance. At the same time, Rowe and Deines left Ametek to start RD Instrument (RDI) and developed their own shipboard ADCP. Today, most research vessels carry an ADCP.
With the success of the shipboard unit, we contracted with RDI to build a self-contained ADCP for moorings. This required miniaturizing everything, adjusting the side-lobes of the acoustic beams to avoid sound reflections off the mooring line, finding a low-power onboard processor
Pinkel’s Doppler profilers mounted on the submersible part of FLIP.Courtesy of Rob Pinkel
W

M a r i t i m e M u s e u m o f S a n D i e g o24
and recorder for the data, and adjusting the Doppler processing scheme. RDI solved these problems, but our testing was delayed because they kindly delivered our prototypes to another new customer. Eventually, we deployed five ADCPs on surface moorings in the Gulf of Alaska to study oceanic response to winter storms.16 Over nine months encompassing the winter of 1987, the ADCPs worked well except that the tape recorders in units looking down from surface buoys stopped when the first large storms arrived to shake their mechanical tape-transport systems. Today, ADCPs are the standard for current measurements from moorings.
TOGA/TAO s NORPAX was putting new elements of today’s ocean observing systems into the North Pacific to study
persistent sea-surface temperature anomalies, scientific interest in climate variability shifted to the equatorial zone in the Pacific. The reasons for this shift were: modeling and theoretical studies indicated that the ocean’s influence on the atmosphere was greatest at the equator; time series analyses suggested a connection between the ocean phenomenon El Niño and atmospheric anomalies; and the feasibility of sustained measurements in the equatorial zone had been demonstrated. When David Halpern moved from WHOI to NOAA’s Pacific Marine Environmental Lab (PMEL), he used his understanding of WHOI mooring technology to establish successful moorings near the equator. Stan Hayes accelerated this effort by developing a new class of mooring buoys with real time data transmission and greater reliability; he established a small equatorial array in 1984.
Standard ATLAS Mooring
Diagram of an ATLAS mooring in the Tropical Ocean Atmosphere (TAO) array.
M a r i t i m e M u s e u m o f S a n D i e g o24
A

25Maritime Technology Innovation in the Pacific: Past, Present and Future
A productive collaboration of NOAA and university scientists initiated the Tropical Ocean Global Atmosphere (TOGA) experiment, which extended from 1985 through 1994.
s the name indicates, TOGA studied how changes in and over the tropical ocean impacted global climate on seasonal and
interannual time scales. Much of TOGA was concerned with new and promising models and one TOGA modeler argued that only one mooring was needed to verify them. Nevertheless, the heart of TOGA was: the Tropical Ocean Atmosphere (TAO) array of equatorial moorings; a ship to service the TAO moorings that also carried out surveys using hydrographic and ADCP sampling; and an extensive array of surface drifters to observe currents. Today, TOGA is credited with establishing the ability to forecast seasonal climate variability, particularly over the Americas, more than six months in advance.17
The TAO array was a technical triumph that remains part of today’s global ocean observing system. Scientific leaders of the effort were Stan Hayes and Mike McPhaden, but the backbone was Hugh Milburn, who made improving the TAO moorings a well-organized engineering project. A big problem was the high cost of servicing the array. This made extending the servicing interval and streamlining sensor servicing essential to minimize ship time. Milburn’s team studied failures and inspections and learned; new materials and methods were introduced and procedures improved. By 1994 performance was good, except where vandalism was endemic. The full TAO array included 70 moorings that measured wind, air temperature and humidity, as well as ocean temperature at 10 depths down to 500 m. The utility of TAO data to long-range weather forecasting led NOAA to continue the array after TOGA. Technical improvement continued and the western end of the array was replaced by the allied
Two PMEL technicians service a TAO-array buoy.Courtesy PMEL, the Seattle NOAA Lab
Japanese TRITON moorings in 1998. TAO remains a mainstay of today’s global ocean observations.
Professor Pearn (Peter) Niiler, who joined Scripps in 1982, was best known for his theoretical skills, but his long interest in tropical dynamics taught him that the ocean was more complex than the TOGA models suggested. Niiler argued successfully to add surface current observations well outside the narrow
equatorial zone covered by TAO. Niiler helped organize and implement the TOGA surface drifter program that described tropical surface circulation and measured surface temperatures to reference NOAA satellite measurements, which by themselves had unacceptable errors. The utility of this drifter program led to its continuation after TOGA. Niiler had the dream to map the circulation of the world’s oceans. He was irrepressibly creative in art, science and life, so after TOGA he continued to improve satellite-tracked surface drifters, analyze drifter data, and seek funds for a global drifter program.
World Ocean Circulation Experiment
As TOGA was gathering data, another international group was planning the World Ocean Circulation Experiment (WOCE) with the intent of understanding how the ocean transports heat from the tropics to the poles (where it radiates back to space) and what might cause the climate to change over decades to centuries. WOCE was led by Carl Wunsch (MODE) and Worth Nowlin from Texas A&M. The plan was to measure transports through various top-to-bottom sections crossing all the world oceans from shore to shore. Ships would measure density and a large number of ocean tracers across these sections and use density to infer velocity. Contrasts with old data would describe climate change over decades and tracers with built in clocks (like the decay of unstable isotopes) provided measures of the age (usually since touching the atmosphere) of the sampled waters.
A

M a r i t i m e M u s e u m o f S a n D i e g o26
Niiler and I argued for broad-scale direct measurements of velocity to supplement the inferences made from the ship sections. Niiler had improved surface drifters18 so that the effect of wind on their measurements was small and they survived for up to two years. He encouraged WOCE to deploy these devices globally. Impressed by the ability of Swallow floats to observe subsurface currents and of the ability of satellites to track surface drifters, I proposed global deployment of (yet to-be-developed) floats that would drift at depth like a Swallow float, but occasionally rise to the surface to be located.
The World Climate Research Program was convinced that a global array of accurate surface drifters was central to the global ocean observing system that would support both WOCE
and tropical climate research. Niiler organized the international Global Drifter Program (GDP), achieving cooperation between nations and an agreement to use only designs with sufficiently low errors from
wind and wave forcing that the resulting data set would have uniformly high quality.
As this program was put in place, Niiler continued
improving drifters to measure surface
winds and, amazingly, considering these buoys were frequently
submerged by waves, atmospheric sea level
pressure. The pressure buoys were of particular use
in weather prediction in the mostly water-covered Southern
Hemisphere. The GDP array reached its target size of 2005
with deployment of the 1250th buoy and continues
today with an expanding suite of sensors.
I contracted with Doug Webb (of the SOFAR float) to develop
the new surface-tracked subsurface float. He engaged in a several-year search for ingenious ways to make floats change their buoyancy to change depth. I was aware of the Cartesian Diver19 that Charles Cox (the NORPAX leader) had built to profile up and down while measuring turbulence, and when the time for testing before WOCE became short, I insisted that we abandon exotic buoyancy devices and use batteries and an electric motor to power the volume changes of our profiling float, as Cox had. By 1986, we were
Pictured is the Tristar surface drifter, which consists of a tent-like drogue and two spherical balls.Courtesy the Author
Labrador Sea deployment of profiling float with vanes that measured vertical currents.Courtesy of George Tupper

27Maritime Technology Innovation in the Pacific: Past, Present and Future
testing the prototype of what became the Autonomous Lagrangian Circulation Explorer (ALACE). ALACEs20 descended to 1000 m depth, drifted for about a month, rose to the surface for locating, and then dove again. Typical lifetimes were 60 dive-cycles over five years. The first deployments in the Southern Ocean were exciting as our prototypes travelled two-thirds of the way around the world in the Circumpolar Current. During the 1990s, Scripps deployed 534 ALACE floats in the South Pacific, Indian Ocean and Southern Ocean. SIO developed an improved “SOLO” float that reported profiles. Some SOLOS, augmented with circumferential propeller blades to measure the vertical component of ocean motion in wintertime deep convection, were deployed in the Labrador Sea. After years of data were gathered, it was possible to produce the first maps of broad-scale currents based on direct measurements.21, 22
Argo and Underwater Gliders
group led by Dean Roemmich (SIO) was quick to realize that a global array of profiling floats equipped
with accurate salinity, temperature and pressure sensors was feasible and could continuously observe geostrophic currents and the transport and storage of heat and freshwater that define the ocean’s role in climate. Roemmich’s group convinced the NOAA Administrator James Baker that the float array, he called Argo, would fulfill part of NOAA’s ocean mission. The group also lobbied U.S. scientists, leadership of the World Climate Research Program, and international scientific groups that the idea was feasible and worthwhile. Baker committed the U.S. to pay for half the array and, with his assistant Stan Wilson, convinced the governments of thirty nations to support the other half. Extensive international planning led to an agreement that produced a global, uniformly distributed array of over 3000 floats profiling to 2000 m depth every ten days.
The upper drawing shows the dive cycle of an Argo float. The lower pair of charts show how Argo increases measurement density. Top chart shows all measurements from 1950 to 2001 that reach 1000 m depth. The lower chart shows the location of all 2000-m Argo profiles from 2007 through 2011. Courtesy the Argo Program
A
M a r i t i m e M u s e u m o f S a n D i e g o28
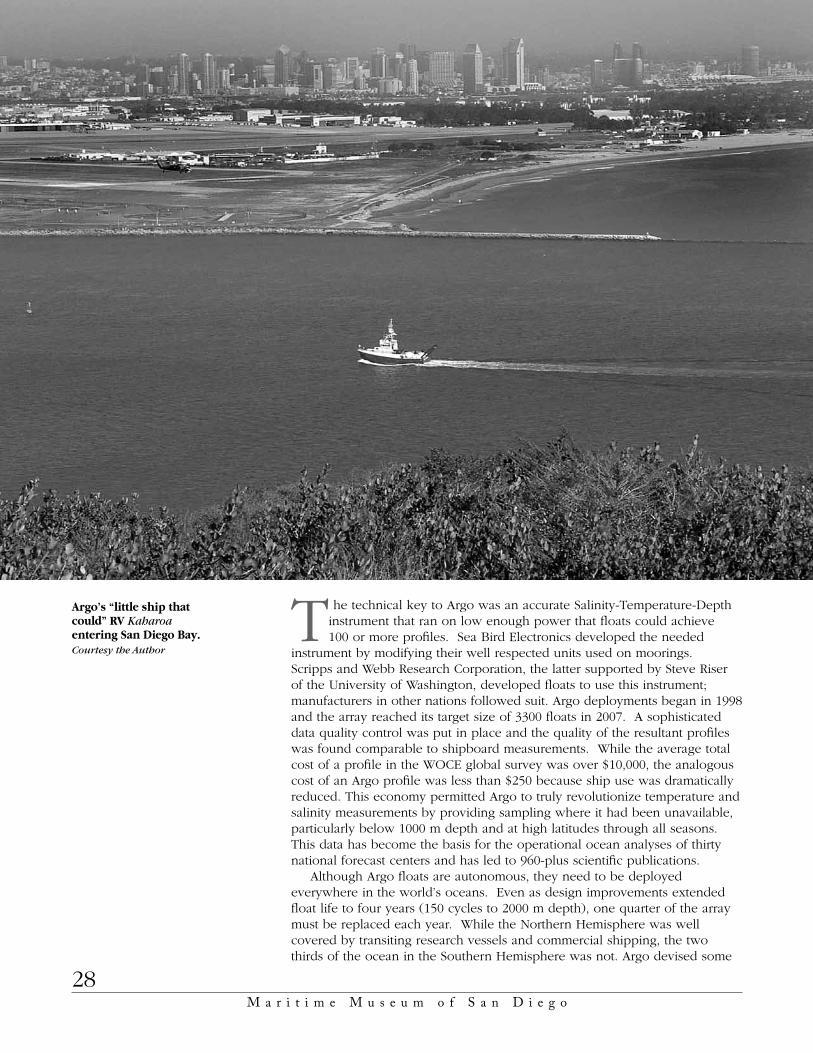
The technical key to Argo was an accurate Salinity-Temperature-Depth instrument that ran on low enough power that floats could achieve 100 or more profiles. Sea Bird Electronics developed the needed
instrument by modifying their well respected units used on moorings. Scripps and Webb Research Corporation, the latter supported by Steve Riser of the University of Washington, developed floats to use this instrument; manufacturers in other nations followed suit. Argo deployments began in 1998 and the array reached its target size of 3300 floats in 2007. A sophisticated data quality control was put in place and the quality of the resultant profiles was found comparable to shipboard measurements. While the average total cost of a profile in the WOCE global survey was over $10,000, the analogous cost of an Argo profile was less than $250 because ship use was dramatically reduced. This economy permitted Argo to truly revolutionize temperature and salinity measurements by providing sampling where it had been unavailable, particularly below 1000 m depth and at high latitudes through all seasons. This data has become the basis for the operational ocean analyses of thirty national forecast centers and has led to 960-plus scientific publications.
Although Argo floats are autonomous, they need to be deployed everywhere in the world’s oceans. Even as design improvements extended float life to four years (150 cycles to 2000 m depth), one quarter of the array must be replaced each year. While the Northern Hemisphere was well covered by transiting research vessels and commercial shipping, the two thirds of the ocean in the Southern Hemisphere was not. Argo devised some
Argo’s “little ship that could” RV Kaharoa entering San Diego Bay.Courtesy the Author

29Maritime Technology Innovation in the Pacific: Past, Present and Future
unique and cost-effective solutions. A small (28 m length overall, crew of 6) New Zealand research vessel, RV Kaharoa, deployed nearly 1000 Argo floats in the South Pacific and South Indian Oceans. Without that ship, Argo would not be a global array. The multi-national structure of Argo allowed discovery of some even smaller Argo deployment vessels including the 20 m staysail schooner Lady Amber that launched 20 floats between Cape Town and Fremantle, and SRV Discovery (18 m motor/sailing catamaran) that deployed 15 floats along the Pacific equator.
While ALACE was being developed, Henry Stommel (see Swallow float and MODE) published a bit of science fiction predicting a global array of small unmanned submarines that moved very slowly by gliding, as they cycled up and down in the manner of profiling floats. As SIO struggled to make ALACE reliable, Doug Webb turned to developing such a vehicle, soon called an underwater glider. Anxious to accelerate slow progress, the Office of Naval Research funded glider developments at Webb Research, University of Washington and Scripps. This effort led to three different glider designs,23 each with somewhat different strengths.
ith the ability to fly 1000-4000 km, autonomous gliders are not ready for the global coverage Stommel imagined, but they have
proven particularly attractive when launched by a small boat. They are being used in regional observations around the world, including the Arctic. For example, gliders off the coast of Central and Southern California are continuously monitoring alongshore flow, eddies, upwelling, and planktonic response to seasonal and climate variability. They have documented the northward flowing undercurrent and Davidson flow, as well as phytoplankton and zooplankton clustering around oceanic fronts. As interest in the coastal ocean grows, a fleet of gliders may well come to supplement Argo sampling around the ocean’s perimeter where Argo sampling density is inadequate and gliders are efficient.
An autonomous underwater glider carrying a salinity-temperature-depth sensor, Acoustic Doppler Profiler that measures shear and acoustic backscatter from zooplankton, and a chlorophyll fluorometer to observe phytoplankton. Courtesy Robert Todd
W
29Maritime Technology Innovation in the Pacific: Past, Present and Future

M a r i t i m e M u s e u m o f S a n D i e g o30
M a r i t i m e M u s e u m o f S a n D i e g o30
ConclusionsBetween WWII and the present, oceanography has matured
from a specialty of a few physicists and geographers working with occasional ship-based profiles of the ocean. Today’s science is based on dynamical principles and a rapidly growing base of global ocean observations. The questions being addressed have gone from “where does the water go,” to the fundamentals of how energy from the wind and solar insolation cascade from scales of thousands of kilometers to millimeters and how this process distributes heat and the nutrients that support marine life. Forecast agencies in many nations receive data daily from all over the globe and use it to predict everything from where an oil spill might go, to whether next winter will be cold or warm, dry or wet, in locations around the world.
T his progress depended on developments and teams that were led by energetic and innovative people who were, frankly, having a ball inventing new things and using them
to discover how the ocean works. As is true of most history, oceanographers tend to think of the major steps along this road as being carried out by a few now-famous individuals like John Swallow, Bill Richardson, Charles Cox, Doug Webb, Peter Niiler and Dean Roemmich. This is correct, but as I hope this article shows, the truth is that the effort was much more distributed. Much depended on the Cold War and space race that brought new technologies, like satellites and micro-electronics, that we could borrow. Beyond that, there was a network of ideas shared by a network of people around the world. There was little money to be made in this effort, but the rewards of intellectual stimulation and satisfaction when things worked were much more effective motivation. Scripps Institution of Oceanography played an important role in this progress, and it remains today a place where ideas can be implemented and proven out.
References1 Knox, R.A. “Mare Incognitum,”
Mains’l Haul, this issue.2 Isaacs, J.D., and G. Schick.
“Deep-Sea Free Vehicle,” Deep-Sea Research, 7 (1960), 61-67.
3 Schick, G.B., J.D. Isaacs and M.H. Sessions, “Autonomous Instruments in Oceanographic Research,” In Marine Sciences Instrumentation, 4 (1968) 203-230, editor F. Alt.
4 In the pre-digital age, Rustrack recorders measured small signals using repetitive hammer strikes to the needle of a magnetic meter movement to mark pressure sensitive paper that was slowly advanced.
5 Isaacs, J.D., G.B. Schick, M.H. Sessions and R.A. Schwartzlose, “Development and Testing of Taut-Nylon Moored Instrument Stations,” Scripps Institution of Oceanography Reference Series, 65-5 (1965).
6 Petre, J.W., and R. Devereaux, “The Monster Buoy – A Progress Report for July 1967,” In Marine Science Instrumentation, 4 (1968) 434-443, editor F. Alt.
7 Winner, C. “Building Them Tough, Bringing them Back,” Oceanus online: www.whoi.edu/home/ oceanus_images/buoy50.html

31Maritime Technology Innovation in the Pacific: Past, Present and Future
31Maritime Technology Innovation in the Pacific: Past, Present and Future
8 Swallow, J.C. “A Neutrally-Buoyant Float for Measuring Deep Currents,” Deep-Sea Research, 3 (1955) 74-81.
9 Rossby, T., and D. Webb, “Observing Abyssal Motion by Tracking Swallow Floats in the SOFAR Channel,” Deep-Sea Research, 17 (1970) 359-365.
10 Rossby, T., D. Dorson and J. Fontaine, “The RAFOS System,” Journal of Atmospheric and Oceanic Technology, 6 (1986) 672-679.
11 Sessions, M.H., and T.P. Barnett, “The Airborne Expendable Bathythermograph for Oceanographic Measurements,” Deep-Sea Research, 8 (1976) 779-782.
12 Kirwan, A.D., G.J. McNally, E. Reyna and W.J. Merrell. “The Near-Surface Circulation of the Eastern North Pacific,” Journal of Physical Oceanography, 8 (1978) 937-945.
13 Fisher, F.H., and F.N. Spiess, “FLIP – Floating Instrument Platform,” Journal of the Acoustical Society of America, 33 (1963) 1633-1644.
14 Pinkel, R. “Upper Ocean Internal Wave Observations from FLIP,” Journal of Geophysical Research – Oceans, 80 (1975) 3892-3910.
15 Regier, L. “Mesoscale Current Fields Observed with a Shipboard Profiling Acoustic Current Meter,” Journal of Physical Oceanography, 12, 880-886.
16 Dohan, K., and R.E. Davis. “Mixing in the Transition Layer During Two Storm Events,” Journal of Physical Oceanography, 41 (2011) 42-66.
17 McPhaden, M.J., A.J. Busalacchi, R. Cheney, J.R. Donguy, K.S. Gage, D, Halpern, M. Ji, P. Julian, G. Meyers, G.T. Mitchum, P.P Niiler, J. Piaut, R.W Reynolds, N. Smith, K. Takeuchi, “The Tropical Ocean-Global Atmosphere Observing System: A Decade of Progress,” Journal of Geophysical Research, 103 (1998) 14,169-14, 240.
18 Niiler, P.P., R.E. Davis and H.J. White, “Water-following Characteristics of a Mixed Layer Drifter,” Deep-Sea Research, 34 (1987) 1867-1882.
19 Duda, T.F., C.S. Cox and T.K. Deaton, “The Cartesian Diver: A Self-profiling Lagrangian Velocity Recorder,” Journal of Atmospheric and Oceanic Technology, 5 (1988) 16-33.
20 Davis, R.E., D.C. Webb, L.A. Regier and J. Dufour, “The Autonomous Lagrangian Circulation Explorer (ALACE).” Journal of Atmospheric and Oceanic Technology, 9 (1991) 264-285.
21 Davis, R.E. “Intermediate-depth Circulation of the Indian and South Pacific Oceans Measured by Autonomous Floats.” Journal of Physical Oceanography, 35, (2005) 683-707.
22 Lavender, K.L., W.B. Owens and R.E. Davis, “The Mid-depth Circulation of the Subpolar North Atlantic Ocean as Measured by Subsurface Floats.” Deep-Sea Research, I, 52, (2005) 767-785.
23 Davis, R.E., C.E. Eriksen and C.P. Jones, “Autonomous Buoyancy-Driven Underwater Gliders,” in The Technology and Applications of Autonomous Underwater Vehicles (Taylor and Francis: London, G. Griffiths, ed. 2002), 324 pp.