It is made available under a CC-BY-NC-ND 4.0 International ... · Consortium, Chun Jimmie Ye, Alkes...
24
1 Transethnic genetic correlation estimates from summary statistics support widespread non-additive effects Brielin C. Brown, Asian Genetic Epidemiology Network-Type 2 Diabetes (AGEN-T2D) Consortium, Chun Jimmie Ye, Alkes L. Price, Noah Zaitlen Abstract The increasing number of genetic association studies conducted in multiple populations provides unprecedented opportunity to study how the genetic architecture of complex phenotypes varies between populations, a problem important for both medical and population genetics. Here we develop a method for estimating the transethnic genetic correlation; the correlation of causal variant effect sizes at SNPs common in populations. Unlike some prior approaches, we take advantage of the entire spectrum of SNP associations and utilize only summary-level GWAS data, thereby avoiding the computational costs and privacy concerns associated with genotype-level information while remaining scalable to hundreds of thousands of individuals and millions of SNPs. We apply our method to gene expression, rheumatoid arthritis, and type-two diabetes data and overwhelmingly find that the genetic correlation is significantly less than 1. We argue that this is evidence for the presence of non-additive or differential tagging effects that modify the marginal effect sizes at SNPs common in both populations. Our method is implemented in a python package called popcorn. Introduction Many complex human phenotypes vary dramatically in their distributions between populations due to a combination of genetic and environmental differences. For example, northern Europeans are on average taller than southern Europeans 1 and African Americans have an increased rate of hypertension relative to European Americans 2 . The genetic contribution to population phenotypic differentiation is driven by differences in causal allele frequencies, effect sizes, and genetic architectures. Understanding the root causes of phenotypic differences worldwide has profound implications for biomedical and clinical practice in diverse populations, the transferability of epidemiological results, aiding multi- ethnic disease mapping 3,4 , assessing the contribution of non-additive and rare variant effects, and modeling the genetic architecture of complex traits. In this work we consider a central question in the global study of phenotype: do genetic variants have the same phenotypic effects in different populations? . CC-BY-NC-ND 4.0 International license It is made available under a (which was not peer-reviewed) is the author/funder, who has granted bioRxiv a license to display the preprint in perpetuity. The copyright holder for this preprint . http://dx.doi.org/10.1101/036657 doi: bioRxiv preprint first posted online Jan. 14, 2016;
Transcript of It is made available under a CC-BY-NC-ND 4.0 International ... · Consortium, Chun Jimmie Ye, Alkes...
1
Transethnicgeneticcorrelationestimatesfromsummarystatisticssupportwidespread
non-additiveeffects
BrielinC.Brown,AsianGeneticEpidemiologyNetwork-Type2Diabetes(AGEN-T2D)Consortium,ChunJimmieYe,AlkesL.Price,NoahZaitlen
Abstract
Theincreasingnumberofgeneticassociationstudiesconductedinmultiple
populationsprovidesunprecedentedopportunitytostudyhowthegeneticarchitectureof
complexphenotypesvariesbetweenpopulations,aproblemimportantforbothmedicaland
populationgenetics.Herewedevelopamethodforestimatingthetransethnicgenetic
correlation;thecorrelationofcausalvarianteffectsizesatSNPscommoninpopulations.
Unlikesomepriorapproaches,wetakeadvantageoftheentirespectrumofSNP
associationsandutilizeonlysummary-levelGWASdata,therebyavoidingthe
computationalcostsandprivacyconcernsassociatedwithgenotype-levelinformationwhile
remainingscalabletohundredsofthousandsofindividualsandmillionsofSNPs.Weapply
ourmethodtogeneexpression,rheumatoidarthritis,andtype-twodiabetesdataand
overwhelminglyfindthatthegeneticcorrelationissignificantlylessthan1.Wearguethat
thisisevidenceforthepresenceofnon-additiveordifferentialtaggingeffectsthatmodify
themarginaleffectsizesatSNPscommoninbothpopulations.Ourmethodisimplemented
inapythonpackagecalledpopcorn.
Introduction
Manycomplexhumanphenotypesvarydramaticallyintheirdistributionsbetween
populationsduetoacombinationofgeneticandenvironmentaldifferences.Forexample,
northernEuropeansareonaveragetallerthansouthernEuropeans1andAfricanAmericans
haveanincreasedrateofhypertensionrelativetoEuropeanAmericans2.Thegenetic
contributiontopopulationphenotypicdifferentiationisdrivenbydifferencesincausal
allelefrequencies,effectsizes,andgeneticarchitectures.Understandingtherootcausesof
phenotypicdifferencesworldwidehasprofoundimplicationsforbiomedicalandclinical
practiceindiversepopulations,thetransferabilityofepidemiologicalresults,aidingmulti-
ethnicdiseasemapping3,4,assessingthecontributionofnon-additiveandrarevariant
effects,andmodelingthegeneticarchitectureofcomplextraits.Inthisworkweconsidera
centralquestionintheglobalstudyofphenotype:dogeneticvariantshavethesame
phenotypiceffectsindifferentpopulations?
.CC-BY-NC-ND 4.0 International licenseIt is made available under a (which was not peer-reviewed) is the author/funder, who has granted bioRxiv a license to display the preprint in perpetuity.
The copyright holder for this preprint. http://dx.doi.org/10.1101/036657doi: bioRxiv preprint first posted online Jan. 14, 2016;
2
WhilethevastmajorityofGWAShavebeenconductedinEuropeanpopulations5,
thegrowingnumberofnon-Europeanandmulti-ethnicstudies4,6,7provideanopportunity
tostudygeneticeffectdistributionsacrosspopulations.Forexample,onerecentstudyused
mixed-modelbasedmethodstoshowthatthegenome-widegeneticcorrelationof
schizophreniabetweenEuropeanandAfricanAmericansisnonzero8.Whilepowerful,
computationalcostsandprivacyconcernslimittheutilityofgenotype-basedmethods.In
thiswork,wemaketwosignificantcontributionstostudiesoftransethnicgenetic
correlation.First,weexpandthedefinitionofgeneticcorrelationtobetteraccountfora
transethniccontext.Second,wedevelopanapproachtoestimatinggeneticcorrelation
acrosspopulationsthatusesonlysummarylevelGWASdata.Similartootherrecent
summarystatisticsbasedheritabilitymethods9–11,ourapproachavoidsprivacyconcerns
andisscalabletohundredsofthousandsofindividualsandmillionsofmarkers.Unlike
traditionalapproachesthatfocusonthesimilarityofGWASresults12–16weutilizetheentire
spectrumofGWASassociationswhileaccountingforLDinordertoavoidfiltering
correlatedSNPs.
Inasinglepopulation,thegeneticcorrelationoftwophenotypesisdefinedasthe
correlationcoefficientofSNPeffectsizes17,18.Inmultiplepopulations,differencesinallele
frequencymotivatemultiplepossibledefinitionsofgeneticcorrelation.Hereweconsider
boththecorrelationofalleleeffectsizesaswellasthecorrelationofallelicimpact,which
takesintoaccountthefrequencyofthevariantinthepopulation.Forexample,avariant
mayhaveamuchhighereffectsizebutmuchlowerfrequencyinonepopulation.Therefore,
wedefinethetransethnicgeneticeffectcorrelation(ρge)asthecorrelationcoefficientofthe
per-alleleSNPeffectsizes,andthetransethnicgeneticimpactcorrelation(ρgi)asthe
correlationcoefficientofthepopulation-specificallelevariancenormalizedSNPeffectsizes.
Whileotherdefinitionsofthegeneticcorrelationarepossible(seediscussion),these
quantitiescapturetwoimportantquestionsaboutthestudyofdiseaseinmultiple
populations:towhatextentdothesamemutationsinmultiplepopulationsdifferintheir
phenotypiceffectsandtowhatextentarethesedifferencesmitigatedorexacerbatedby
differencesinallelefrequency?
Toestimategeneticcorrelation,wetakeaBayesianapproachwhereinweassume
genotypesaredrawnrandomlyfromtheirpopulationandeffectssizeshaveanormalprior
(theinfinitesimalmodel19).Whileunlikelytorepresentreality,thismodelhasbeenused
successfullyinpractice8,20–23.Theinfinitesimalassumptionyieldsamultivariatenormal
.CC-BY-NC-ND 4.0 International licenseIt is made available under a (which was not peer-reviewed) is the author/funder, who has granted bioRxiv a license to display the preprint in perpetuity.
The copyright holder for this preprint. http://dx.doi.org/10.1101/036657doi: bioRxiv preprint first posted online Jan. 14, 2016;
3
distributionontheobservedteststatistics(Z-scores),whichisafunctionoftheheritability
andgeneticcorrelation.RatherthanpruningSNPsinLD10,24,25,thisallowsustoexplicitly
modeltheresultinginflationofZ-scores.Wethenmaximizeanapproximateweighted
likelihoodfunctiontofindtheheritabilityandgeneticcorrelation.Thismethodis
implementedinapythonpackagecalledpopcorn.Thoughderivedforquantitative
phenotypes,popcornextendseasilytobinaryphenotypesundertheliabilitythreshold
model.Weshowviaextensivesimulationthatpopcornproducesunbiasedestimatesofthe
geneticcorrelationandthepopulationspecificheritabilities,withastandarderrorthat
decreasesasthenumberofSNPsandindividualsinthestudiesincreases.Furthermore,we
showthatourapproachisrobusttoviolationsoftheinfinitesimalassumption.
WeapplypopcorntoEuropeanandYorubangeneexpressiondata26aswellasGWAS
summarystatisticsfromEuropeanandEastAsianrheumatoidarthritisandtype-two
diabetescohorts,27,28.OuranalysisofgEUVADISshowsthatoursummarystatisticbased
estimatorisconcordantwiththemixedmodelbasedestimator.Wefindthatthemean
transethnicgeneticcorrelationacrossallgenesislow(ρge=0.320(0.009)),butincreases
substantiallywhenthegeneishighlyheritableinbothpopulations(ρge=0.772(0.017)).We
findthegeneticeffectcorrelationinRAandT2Dtobe0.463(0.058)and0.621(0.088),
respectively.
Acrossallphenotypesconsidered,weoverwhelminglyfindthatthetransethnic
geneticcorrelationissignificantlylessthanone.Therearemanyphenomenathat
contributetothis,including:untypedandunimputedrarevariantscorrelatedwith
observedSNPs;gene-geneinteractionsordominanceeffects,gene-environment
interactions,includingepigeneticeffects,thataredifferentialbetweenpopulations;and
differencesinsub-phenotypecomposition.Ourresultsthereforeshowthatthese
phenomenasignificantlyaltertheeffectsizesofSNPscommontobothpopulations.
Methods
ConsiderGWASofaphenotypeconductedintwodifferentpopulations.Assumewe
haveN1individualsgenotypedonMSNPsinstudyoneandN2individualsgenotypedonthe
sameSNPsstudytwo.LetX1,X2bethematricesofmean-centeredgenotypesinstudyone
andstudytwo,respectively,andletY1,Y2benormalizedphenotypesoftheindividualsin
studyoneandtwo,respectively.Letf1,f2bevectorsoftheallelefrequenciesoftheMSNPs
commontobothpopulations.AssumingHardy-Weinbergequilibrium,theallelevariances
.CC-BY-NC-ND 4.0 International licenseIt is made available under a (which was not peer-reviewed) is the author/funder, who has granted bioRxiv a license to display the preprint in perpetuity.
The copyright holder for this preprint. http://dx.doi.org/10.1101/036657doi: bioRxiv preprint first posted online Jan. 14, 2016;
4
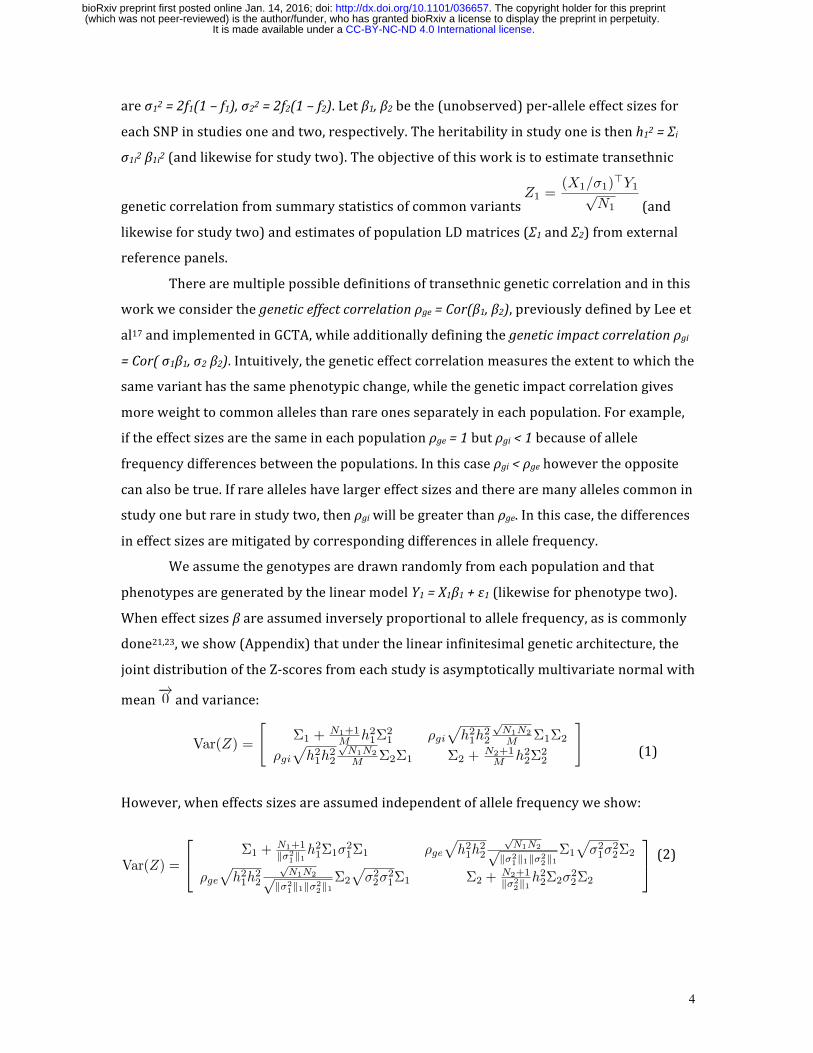
areσ12=2f1(1–f1),σ22=2f2(1–f2).Letβ1,β2bethe(unobserved)per-alleleeffectsizesfor
eachSNPinstudiesoneandtwo,respectively.Theheritabilityinstudyoneisthenh12=Σi
σ1i2β1i2(andlikewiseforstudytwo).Theobjectiveofthisworkistoestimatetransethnic
geneticcorrelationfromsummarystatisticsofcommonvariants (and
likewiseforstudytwo)andestimatesofpopulationLDmatrices(Σ1andΣ2)fromexternal
referencepanels.
Therearemultiplepossibledefinitionsoftransethnicgeneticcorrelationandinthis
workweconsiderthegeneticeffectcorrelationρge=Cor(β1,β2),previouslydefinedbyLeeet
al17andimplementedinGCTA,whileadditionallydefiningthegeneticimpactcorrelationρgi
=Cor(σ1β1,σ2β2).Intuitively,thegeneticeffectcorrelationmeasurestheextenttowhichthe
samevarianthasthesamephenotypicchange,whilethegeneticimpactcorrelationgives
moreweighttocommonallelesthanrareonesseparatelyineachpopulation.Forexample,
iftheeffectsizesarethesameineachpopulationρge=1butρgi<1becauseofallele
frequencydifferencesbetweenthepopulations.Inthiscaseρgi<ρgehowevertheopposite
canalsobetrue.Ifrarealleleshavelargereffectsizesandtherearemanyallelescommonin
studyonebutrareinstudytwo,thenρgiwillbegreaterthanρge.Inthiscase,thedifferences
ineffectsizesaremitigatedbycorrespondingdifferencesinallelefrequency.
Weassumethegenotypesaredrawnrandomlyfromeachpopulationandthat
phenotypesaregeneratedbythelinearmodelY1=X1β1+ε1(likewiseforphenotypetwo).
Wheneffectsizesβareassumedinverselyproportionaltoallelefrequency,asiscommonly
done21,23,weshow(Appendix)thatunderthelinearinfinitesimalgeneticarchitecture,the
jointdistributionoftheZ-scoresfromeachstudyisasymptoticallymultivariatenormalwith
mean andvariance:
(1)
However,wheneffectssizesareassumedindependentofallelefrequencyweshow:
(2)
Z1 =(X1/�1)>Y1p
N1
�!0
Var(Z) =
"⌃1 +
N1+1M h2
1⌃21 ⇢gi
ph21h
22
pN1N2
M ⌃1⌃2
⇢gip
h21h
22
pN1N2
M ⌃2⌃1 ⌃2 +N2+1M h2
2⌃22
#
Var(Z) =
2
4⌃1 +
N1+1k�2
1k1h21⌃1�2
1⌃1 ⇢geph21h
22
pN1N2p
k�21k1k�2
2k1
⌃1
p�21�
22⌃2
⇢gep
h21h
22
pN1N2p
k�21k1k�2
2k1
⌃2
p�22�
21⌃1 ⌃2 +
N2+1k�2
2k1h22⌃2�2
2⌃2
3
5
.CC-BY-NC-ND 4.0 International licenseIt is made available under a (which was not peer-reviewed) is the author/funder, who has granted bioRxiv a license to display the preprint in perpetuity.
The copyright holder for this preprint. http://dx.doi.org/10.1101/036657doi: bioRxiv preprint first posted online Jan. 14, 2016;
5
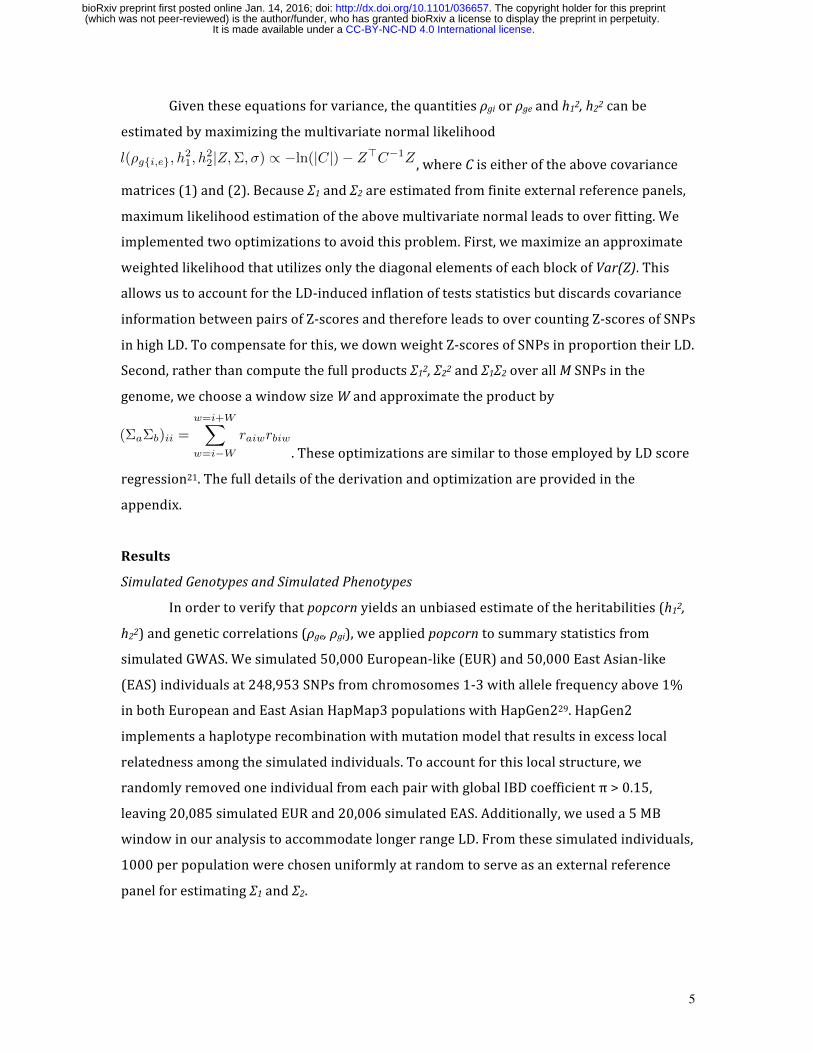
Giventheseequationsforvariance,thequantitiesρgiorρgeandh12,h22canbe
estimatedbymaximizingthemultivariatenormallikelihood
,whereCiseitheroftheabovecovariance
matrices(1)and(2).BecauseΣ1andΣ2areestimatedfromfiniteexternalreferencepanels,
maximumlikelihoodestimationoftheabovemultivariatenormalleadstooverfitting.We
implementedtwooptimizationstoavoidthisproblem.First,wemaximizeanapproximate
weightedlikelihoodthatutilizesonlythediagonalelementsofeachblockofVar(Z).This
allowsustoaccountfortheLD-inducedinflationoftestsstatisticsbutdiscardscovariance
informationbetweenpairsofZ-scoresandthereforeleadstoovercountingZ-scoresofSNPs
inhighLD.Tocompensateforthis,wedownweightZ-scoresofSNPsinproportiontheirLD.
Second,ratherthancomputethefullproductsΣ12,Σ22andΣ1Σ2overallMSNPsinthe
genome,wechooseawindowsizeWandapproximatetheproductby
.TheseoptimizationsaresimilartothoseemployedbyLDscore
regression21.Thefulldetailsofthederivationandoptimizationareprovidedinthe
appendix.
Results
SimulatedGenotypesandSimulatedPhenotypes
Inordertoverifythatpopcornyieldsanunbiasedestimateoftheheritabilities(h12,
h22)andgeneticcorrelations(ρge,ρgi),weappliedpopcorntosummarystatisticsfrom
simulatedGWAS.Wesimulated50,000European-like(EUR)and50,000EastAsian-like
(EAS)individualsat248,953SNPsfromchromosomes1-3withallelefrequencyabove1%
inbothEuropeanandEastAsianHapMap3populationswithHapGen229.HapGen2
implementsahaplotyperecombinationwithmutationmodelthatresultsinexcesslocal
relatednessamongthesimulatedindividuals.Toaccountforthislocalstructure,we
randomlyremovedoneindividualfromeachpairwithglobalIBDcoefficientπ>0.15,
leaving20,085simulatedEURand20,006simulatedEAS.Additionally,weuseda5MB
windowinouranalysistoaccommodatelongerrangeLD.Fromthesesimulatedindividuals,
1000perpopulationwerechosenuniformlyatrandomtoserveasanexternalreference
panelforestimatingΣ1andΣ2.
l(⇢g{i,e}, h21, h
22|Z,⌃,�) / �ln(|C|)� Z>C�1Z
(⌃a⌃b)ii =w=i+WX
w=i�W
raiwrbiw
.CC-BY-NC-ND 4.0 International licenseIt is made available under a (which was not peer-reviewed) is the author/funder, who has granted bioRxiv a license to display the preprint in perpetuity.
The copyright holder for this preprint. http://dx.doi.org/10.1101/036657doi: bioRxiv preprint first posted online Jan. 14, 2016;
6
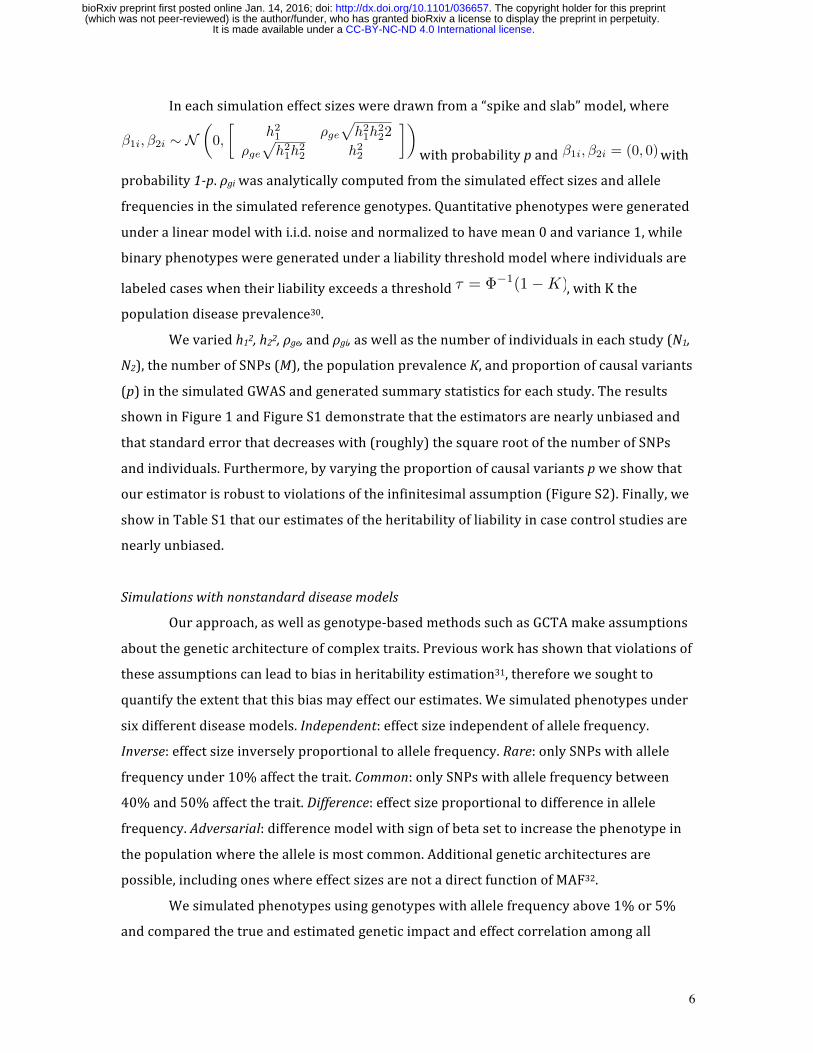
Ineachsimulationeffectsizesweredrawnfroma“spikeandslab”model,where
withprobabilitypand with
probability1-p.ρgiwasanalyticallycomputedfromthesimulatedeffectsizesandallele
frequenciesinthesimulatedreferencegenotypes.Quantitativephenotypesweregenerated
underalinearmodelwithi.i.d.noiseandnormalizedtohavemean0andvariance1,while
binaryphenotypesweregeneratedunderaliabilitythresholdmodelwhereindividualsare
labeledcaseswhentheirliabilityexceedsathreshold ,withKthe
populationdiseaseprevalence30.
Wevariedh12,h22,ρge,andρgi,aswellasthenumberofindividualsineachstudy(N1,
N2),thenumberofSNPs(M),thepopulationprevalenceK,andproportionofcausalvariants
(p)inthesimulatedGWASandgeneratedsummarystatisticsforeachstudy.Theresults
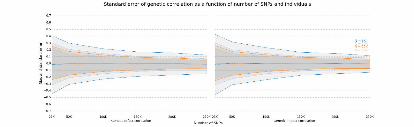
showninFigure1andFigureS1demonstratethattheestimatorsarenearlyunbiasedand
thatstandarderrorthatdecreaseswith(roughly)thesquarerootofthenumberofSNPs
andindividuals.Furthermore,byvaryingtheproportionofcausalvariantspweshowthat
ourestimatorisrobusttoviolationsoftheinfinitesimalassumption(FigureS2).Finally,we
showinTableS1thatourestimatesoftheheritabilityofliabilityincasecontrolstudiesare
nearlyunbiased.
Simulationswithnonstandarddiseasemodels
Ourapproach,aswellasgenotype-basedmethodssuchasGCTAmakeassumptions
aboutthegeneticarchitectureofcomplextraits.Previousworkhasshownthatviolationsof
theseassumptionscanleadtobiasinheritabilityestimation31,thereforewesoughtto
quantifytheextentthatthisbiasmayeffectourestimates.Wesimulatedphenotypesunder
sixdifferentdiseasemodels.Independent:effectsizeindependentofallelefrequency.
Inverse:effectsizeinverselyproportionaltoallelefrequency.Rare:onlySNPswithallele
frequencyunder10%affectthetrait.Common:onlySNPswithallelefrequencybetween
40%and50%affectthetrait.Difference:effectsizeproportionaltodifferenceinallele
frequency.Adversarial:differencemodelwithsignofbetasettoincreasethephenotypein
thepopulationwherethealleleismostcommon.Additionalgeneticarchitecturesare
possible,includingoneswhereeffectsizesarenotadirectfunctionofMAF32.
Wesimulatedphenotypesusinggenotypeswithallelefrequencyabove1%or5%
andcomparedthetrueandestimatedgeneticimpactandeffectcorrelationamongall
�1i,�2i ⇠ N✓0,
h21 ⇢ge
ph21h
222
⇢gep
h21h
22 h2
2
�◆
�1i,�2i = (0, 0)
⌧ = ��1(1�K)
.CC-BY-NC-ND 4.0 International licenseIt is made available under a (which was not peer-reviewed) is the author/funder, who has granted bioRxiv a license to display the preprint in perpetuity.
The copyright holder for this preprint. http://dx.doi.org/10.1101/036657doi: bioRxiv preprint first posted online Jan. 14, 2016;

7
models(Table1).WefindthatwhenonlySNPswithfrequencyabove5%inboth
populationsareused,thedifferenceinρgeandρgiisminimalexceptinthemostadversarial
cases.Evenintheadversarialmodel,thetruedifferenceisonly7%.Thoughunlikelyto
representreality,thefournonstandarddiseasemodelsresultinsubstantialbiasinour
estimators.WhenSNPswithallelefrequencyabove1%inbothpopulationsareincluded,
thedifferencesaremorepronounced.Thisisbecausethenormalizingconstant1/σrapidly
increasesastheSNPbecomesmorerare.Indeed,asSNPsbecomemorerarehavingan
accuratediseasemodelbecomesincreasinglyimportantandthereforeweproceedwitha
5%MAFcutoffinouranalysisofrealdataandusethenotationhc2torefertotheheritability
ofSNPswithallelefrequencyabove5%inbothpopulations(thecommon-SNPheritability).
Note,however,thatoneoftheadvantagesofmaximumlikelihoodestimationingeneralis
thatthelikelihoodcanbereformulatedtomimicthediseasemodelofinterest.
ValidationofPopcornusinggeneexpressioninGEUVADIS
Tofurthervalidateourapproach,wecomparedthecommon-SNPheritability(hc2)
andgeneticcorrelationestimatesofpopcorntoGCTAinthegEUVADISdatasetforwhich
rawgenotypesarepubliclyavailable.gEUVADISconsistsofRNA-seqdatafor464
lymphoblastoidcellline(LCL)samplesfromfivepopulationsinthe1000genomesproject.
Ofthese,375areofEuropeanancestry(CEU,FIN,GBR,TSI)and89areofAfricanancestry
(YRI).RawRNA-sequencingreadsobtainedfromtheEuropeanNucleotideArchivewere
alignedtothetranscriptomeusingUCSCannotationsmatchinghg19coordinates.RSEMwas
usedtoestimatetheabundancesofeachannotatedisoformandtotalgeneabundanceis
calculatedasthesumofallisoformabundancesnormalizedtoonemilliontotalcountsor
transcriptspermillion(TPM).ForeQTLmapping,CaucasianandYorubansampleswere
analyzedseparately.Foreachpopulation,TPMsweremediannormalizedtoaccountfor
differencesinsequencingdepthineachsampleandstandardizedtomean0andvariance1.
Ofthe29763totalgenes,9350withTPM>2inbothpopulationswerechosenforthis
analysis.
Foreachgeneweconductedacis-eQTLassociationstudyatallSNPswithin1
megabaseofthegenebodywithallelefrequencyabove5%inbothpopulationsusing30
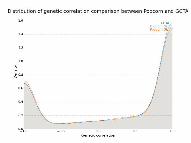
principalcomponentsascovariates.WefoundthatGCTAandpopcornagreeontheglobal
distributionofheritability(FigureS3)andthatGCTA’sestimatesofgeneticcorrelationhave
asimilardistributiontopopcorn’sgeneticeffect(GE)andgeneticimpact(GI)correlation
.CC-BY-NC-ND 4.0 International licenseIt is made available under a (which was not peer-reviewed) is the author/funder, who has granted bioRxiv a license to display the preprint in perpetuity.
The copyright holder for this preprint. http://dx.doi.org/10.1101/036657doi: bioRxiv preprint first posted online Jan. 14, 2016;
8
estimates(Figure2).WhilethenumberofSNPsandindividualsincludedineachgene
analysisaretoosmalltoobtainaccuratepointestimatesofthegeneticcorrelationonaper-
genebasis(N=464,M=4279.5),thelargenumberofgenesenablesaccurateestimationof
theglobalmeanheritabilityandgeneticcorrelation.
Common-SNPheritabilityandgeneticcorrelationofgeneexpressioningEUVADIS
Wefindthattheaveragecis-hc2oftheexpressionofthegenesweanalyzedwas
0.093(0.002)inEURand0.088(0.002)inYRI.Ourestimatesarehigherthanpreviously
reportedaveragecis-heritabilityestimatesof0.055inwholebloodand0.057inadipose33,
whichcouldariseforseveralreasons.First,weremove68%ofthetranscriptsthatare
lowlyexpressedineithertheYRIorEURdata.Second,estimatesfromRNA-seqanalysisof
celllinesmightnotbedirectlycomparabletomicroarraydatafromtissue.
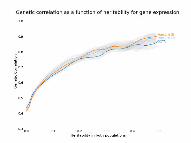
Theaveragegeneticeffectcorrelationwas0.320(0.010)whiletheaveragegenetic
impactcorrelationwas0.313(0.010).Notably,thegeneticcorrelationincreasesasthecis-
hc2ofexpressioninbothpopulationsincreases(Figure3).Inparticular,whenthecis-hc2of
thegeneisatleast0.2inbothpopulationsthegeneticeffectcorrelationwas0.772(0.017)
whilethegeneticimpactcorrelationwas0.753(0.018).
Inordertoverifythattherewerenosmall-samplesizeorconditioningbiasesinour
analysis,weanalyzedthegeneticcorrelationofsimulatedphenotypesoverthegEUVADIS
genotypes.Wesampledpairsofheritabilitiesfromtheestimatedexpressionheritability
distributionandsimulatedpairsofphenotypestohavethegivenheritabilityandagenetic
effectcorrelationof0.0overrandomlychosen4000baseregionsfromchromosome1ofthe
gEUVADISgenotypes.Withoutconditioning,theaverageestimatedgeneticeffect
correlationwas-0.002(0.003),indicatingthattheestimatorremainedunbiased.
Furthermore,theaverageestimatedgeneticeffectcorrelationwasnotsignificantlydifferent
from0.0conditionalontheestimatesofheritabilitybeingaboveacertainthreshold(Figure
S4).Notehoweverthatthesmallsamplesizeincreasesthevarianceoftheestimator
substantially.Becausethegeneticcorrelationisboundedbetween-1and1,thismayinduce
biaswhenthetruevalueisclosetotheboundaryandthesamplesizeissmall.
Wefindthatwhiletheaveragegeneticcorrelationislow,thegeneticcorrelation
increaseswiththecis-hc2ofthegene,indicatingthatascis-geneticregulationofgene
expressionincreasesitdoessosimilarlyinbothYRIandEURpopulations.Thismayhelp
interprettherecentobservationthatwhiletheglobalgeneticcorrelationofgeneexpression
.CC-BY-NC-ND 4.0 International licenseIt is made available under a (which was not peer-reviewed) is the author/funder, who has granted bioRxiv a license to display the preprint in perpetuity.
The copyright holder for this preprint. http://dx.doi.org/10.1101/036657doi: bioRxiv preprint first posted online Jan. 14, 2016;
9
acrosstissuesislow33,cis-eQTL’stendtoreplicateacrosstissues34.Asthepresenceofacis-
eQTLindicatessubstantialcis-geneticregulation,ananalysisofeQTLreplicationacross
tissuesisimplicitlyconditioningontheheritabilityofgeneexpressionbeinghighand
thereforemayindicatemuchhighergeneticcorrelationthanaverage.
SummarystatisticsofRAandT2D
Finally,wesoughttoexaminethetransethnicρgiandρgeinRAandT2Dcohortsfor
whichrawgenotypesarenotavailable.WeobtainedsummarystatisticsofGWASfor
rheumatoidarthritisandtype-2diabetesconductedinEuropeanandEastAsian
populations.WeremovedtheMHCregion(chromosome6,25–35Mb)fromtheRA
summarystatistics.Weestimatedthecommon-SNPheritabilityandgeneticcorrelation
using2539629SNPsgenotypedorimputedinbothRAstudiesand1054079SNPs
genotypedorimputedinbothT2Dstudieswithallelefrequencyabove5%in1000genomes
EURandEASpopulations.Thehc2andgeneticcorrelationestimatesarepresentedinTable
2.OurRAhc2estimatesof0.177(0.015)and0.221(0.026)forEURandEAS,respectively,
arelowerthanapreviouslyreportedmixed-modelbasedheritabilityestimatesof0.32
(0.037)inEuropeans35.Similarly,ourT2Dhc2estimatesof0.242(0.013)and0.105(0.021)
forEURandEAS,respectively,arelowerthanapreviouslyreportedmixed-modelbased
estimateof0.51(0.065)inEuropeans35.Westressthatthisdiscrepancyislikelyduetothe
differencebetweencommon-SNPheritabilityhc2andtotalnarrow-senseheritabilityhg2.
Furthermore,estimatesoftheheritabilityofT2Dfromfamilystudiescanvary
significantly36,37.
WefindthegeneticeffectcorrelationinRAandT2Dtobe0.463(0.058)and0.621
(0.088),respectively,whilethegeneticimpactcorrelationisnotsignificantlydifferentat
0.455(0.056)and0.606(0.083).Thetransethnicgeneticimpactandeffectcorrelationfor
bothphenotypesaresignificantlydifferentfromboth1and0(Table2),showingthatwhile
thereiscleargeneticoverlapbetweenthephenotypes,theperalleleeffectssizesdiffer
significantlybetweenthetwopopulations.Thisisevidenceforthepresenceofdifferential
taggingofuntypedandunimputed,possiblyrarevariantsaswellasgene-gene,gene-
environmentorothernon-additiveinteractions,themarginaleffectssizesofwhichare
modifiedbychangesinallelefrequencybetweenthetwopopulations.Whilewithin-locus
(dominance)interactionsmayalsoplayarole38,themagnitudeofthiseffecthasbeen
debated39.
.CC-BY-NC-ND 4.0 International licenseIt is made available under a (which was not peer-reviewed) is the author/funder, who has granted bioRxiv a license to display the preprint in perpetuity.
The copyright holder for this preprint. http://dx.doi.org/10.1101/036657doi: bioRxiv preprint first posted online Jan. 14, 2016;
10
Discussion
Wehavedevelopedthetransethnicgeneticeffectandgeneticimpactcorrelationand
providedanestimatorforthesequantitiesbasedonlyonsummary-levelGWASinformation
andsuitablereferencepanels.Wehaveappliedourestimatortoseveralphenotypes:
rheumatoidarthritis,type-2diabetesandgeneexpression.WhilethegEUVADISdataset
lacksthepowerrequiredtomakeinferencesaboutthegeneticcorrelationofsingleorsmall
subsetsofgenes,wecanmakeinferencesabouttheglobalstructureofgeneticcorrelationof
geneexpression.Wefindthattheglobalmeangeneticcorrelationislow,butthatit
increasessubstantiallywhentheheritabilityishighinbothpopulations.Inallphenotypes
analyzed,thegeneticcorrelationissignificantlydifferentfromboth0and1.Ourresults
showthatglobaldifferencesinSNPeffectsizeofcomplextraitscanbelarge.Incontrast,
effectssizesofgeneexpressionappeartobemoreconservedwherethereisstronggenetic
regulation.
Itisnotpossibletodrawconclusionsaboutpolygenicselectionfromestimatesof
transethnicgeneticcorrelation.Theeffectssizesmaybeidentical(!!" = 1)whilepolygenicselectionactstochangeonlytheallelefrequencies.Similarly,theeffectssizesmaybe
different(!!" < 1)withoutselection.DifferencesineffectssizesatcommonSNPscanresultfrommanyphenomena.Themarginaleffectsofageneinteractioncanbealtered
substantiallyviadifferencesinallelefrequency,whichmayariseduetodrift.Variantsthat
arerareinbothpopulationsbutdifferentiallytaggedmayalsocontribute,thoughweexpect
thiseffecttobesmall.Anothercontributionlikelycomesfromvariantsthatarerarein
populationonebutcommoninpopulationtwo(andviceversa),whichwillbefilteredinour
analysisbutmaybedifferentiallytagged.
Whilethegeneticcorrelationofmultiplephenotypesinonepopulationhasa
relativelystraightforwarddefinition,extendingthistomultiplepopulationsmotivates
multiplepossibleextensions.Inthisworkwehaveprovidedestimatorsforthecorrelation
ofgeneticeffectandgeneticimpactbutotherquantitiesrelatedtothesharedgeneticsof
complextraitsbetweenpopulationsincludethecorrelationofvarianceexplained
andproportionofsharedcausalvariantsbetweenthetwo
populations.Interestingly,whileourgoalwastoconstructanestimatorthatdeterminedthe
extentofgeneticsharingindependentofallelefrequency,weobservethatthecorrelationof
geneticeffectandgeneticimpactaresimilar.Furthermore,oursimulationsshowthatunder
⇢ge = Cor(�21�
21 ,�
22�
22)
.CC-BY-NC-ND 4.0 International licenseIt is made available under a (which was not peer-reviewed) is the author/funder, who has granted bioRxiv a license to display the preprint in perpetuity.
The copyright holder for this preprint. http://dx.doi.org/10.1101/036657doi: bioRxiv preprint first posted online Jan. 14, 2016;
11
arandomeffectsmodelutilizingonlySNPswithallelefrequencyabove5%inboth
populationsthetruegeneticeffectandgeneticimpactcorrelationaresimilar.Weconclude
thatatvariantscommoninbothpopulations,differencesineffectsizeandnotallele
frequencyaredrivingthetransethnicphenotypicdifferencesinthesetraits.
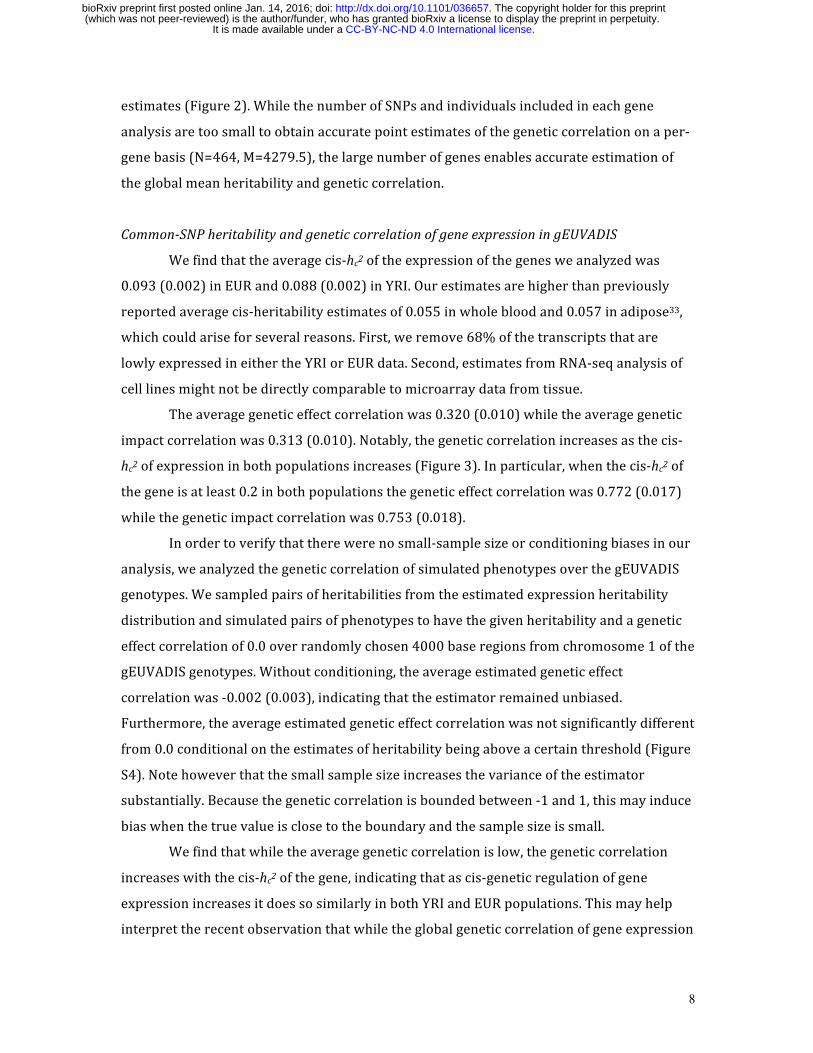
Estimatesofthetransethnicgeneticcorrelationareimportantforseveralreasons.
Asdetailedinthiswork,theyprovideinsightintotheextentthatnon-additivegenetic
variationaffectsaphenotype,furtheringourunderstandingofthegeneticarchitectureof
complextraits.Furthermore,theymayhelpinformbestpracticesfortransethnicmeta-
analysis,potentiallyofferingimprovementsovercurrentmethodsthatutilizefsttocluster
populationsforanalysis4.Finally,thetransethnicgeneticcorrelationconstrainsthelimitof
outofsamplephenotypepredictivepower.Ifthemaximumwithinpopulationcorrelationof
predictedphenotypePtotruephenotypeYis ,thenthemaximumoutof
populationcorrelationis (Appendix).
Ourapproachtoestimatinggeneticcorrelationhastwomajoradvantagesover
mixed-modelbasedapproaches.First,utilizingsummarystatisticsallowsapplicationofthe
methodwithoutdata-sharingandprivacyconcernsthatcomewithrawgenotypes.Second,
ourapproachislinearinthenumberofSNPsavoidingthecomputationalbottleneck
requiredtoestimatethegeneticrelationshipmatrix.Conceptually,ourapproachisvery
similartothattakenbyLDscoreregression.Indeed,thediagonaloftheLDmatrixproduct
inonepopulationareexactlytheLD-scores( ).Onecouldignoreourlikelihood-
basedapproachanddefinecross-populationscores inordertoexploitthe
linearrelationship (asimilarapproachcanbetakenfor
thegeneticeffectcorrelation).SinceLD-scoreregressionhasbeensuccessfullyusedto
computethegeneticcorrelationoftwophenotypesinasinglepopulation,thisderivation
canbeviewedasanextensionofLD-scoreregressiontoonephenotypeintwodifferent
populations.Themaindifferenceinourapproachischoosingmaximumlikelihoodrather
thanregressioninordertofitthemodel.Acomparisonofourmethodtotheldscsoftware
showstheyperformsimilarlyasheritabilityestimators(FigureS5).
Ofcourse,ourmethodisnotwithoutdrawbacks.First,itrequiresalargesample
sizeandlargenumberofSNPstoachievestandarderrorslowenoughtogenerateaccurate
estimates.UntilrecentlylargesampleGWAShavebeenrareinnon-Europeanpopulations,
⇢max
Y P
=q
h21
⇢max
Y P
= ⇢ge
qh21
⌃21ii = li
ci =X
m
r1imr2im
E[Z1iZ2i] =
pN1N2
M⇢gi
qh21h
22ci
.CC-BY-NC-ND 4.0 International licenseIt is made available under a (which was not peer-reviewed) is the author/funder, who has granted bioRxiv a license to display the preprint in perpetuity.
The copyright holder for this preprint. http://dx.doi.org/10.1101/036657doi: bioRxiv preprint first posted online Jan. 14, 2016;
12
thoughtheyarebecomingmorecommon.Similarly,referencepanelqualitymaysufferin
non-Europeanpopulationsandthismayimpactdownstreamanalysis40.Second,itislimited
toanalyzingrelativelycommonSNPs,bothbecausehavinganaccuratediseasemodelis
importantfortheanalysisofrarevariantsandbecauseeffectsizeandcorrelationcoefficient
estimateshaveahighstandarderroratrareSNPs21.Third,ouranalysisiscurrentlylimited
toSNPsthatarepresentinbothpopulations.Indeeditiscurrentlyunclearhowbestto
handlepopulation-specificvariantsinthisframework.Finally,admixedpopulationsinduce
verylong-rangeLDthatisnotaccountedforinourapproachandwearethereforelimited
toun-admixedpopulations21.
Ouranalysisleavesopenseveralavenuesforfuturework.Weapproximately
maximizethelikelihoodofan!×!multivariatenormaldistributionviaamethodthatutilizesonlythediagonalelementsofeachblock,discardingcovarianceinformation
betweenZ-scores.Abetterapproximationmaylowerthestandarderroroftheestimator,
facilitatingananalysisofthegeneticcorrelationoffunctionalcategories,pathwaysand
geneticregions.Wewouldalsoliketoextendouranalysistoincludepopulationspecific
variantsaswellasvariantsatfrequenciesbetween1-5%orlowerthan1%.Oursimulations
indicatethathavinganaccuratediseasemodelisimportantfordeterminingthedifference
betweenthegeneticeffectandgeneticimpactcorrelationwhenrarevariantsareincluded.
Maximumlikelihoodapproachesarewellsuitedtodifferentgeneticarchitectures,for
exampleonecouldexplicitlymodeltherelationshipbetweenallelefrequencyandeffectsize
,whereα=-1correspondstotheinverseassumptionandα=0corresponds
totheindependenceassumption.However,amorethoroughapproachwouldincorporate
additionalsourcesofinformationsuchastheeffectofselection.
2f(1� f) / �↵
.CC-BY-NC-ND 4.0 International licenseIt is made available under a (which was not peer-reviewed) is the author/funder, who has granted bioRxiv a license to display the preprint in perpetuity.
The copyright holder for this preprint. http://dx.doi.org/10.1101/036657doi: bioRxiv preprint first posted online Jan. 14, 2016;
Appendix
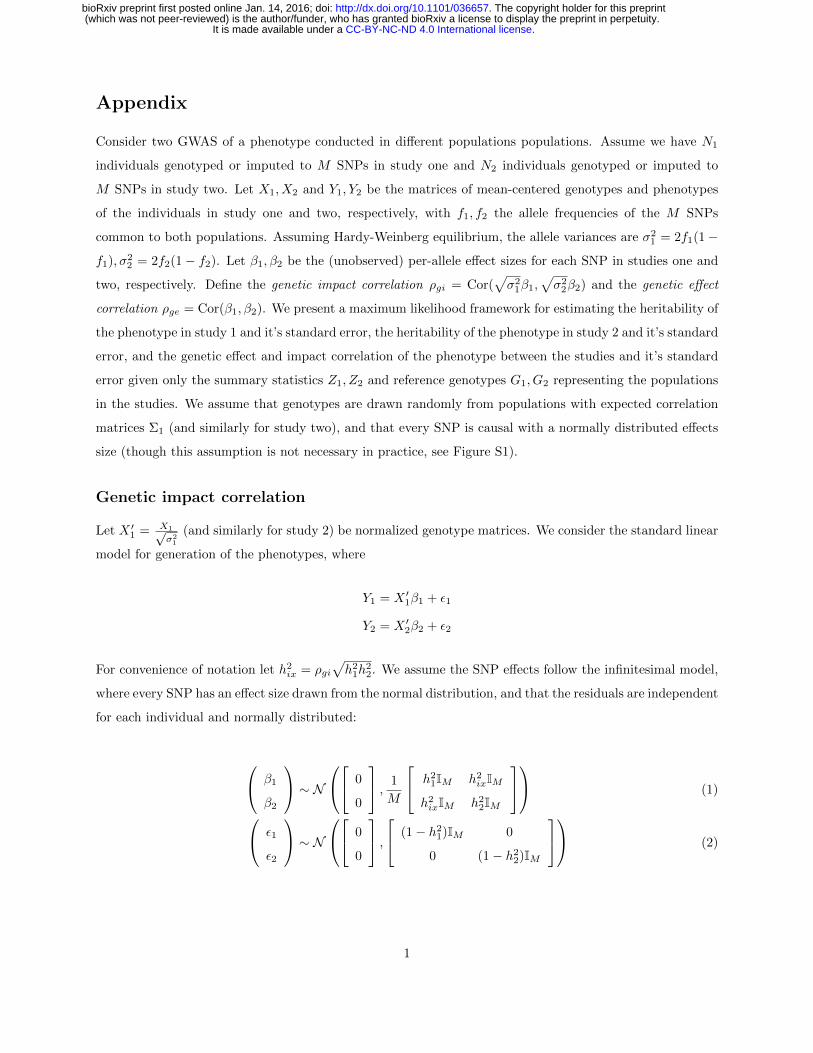
Consider two GWAS of a phenotype conducted in di↵erent populations populations. Assume we have N1
individuals genotyped or imputed to M SNPs in study one and N2 individuals genotyped or imputed to
M SNPs in study two. Let X1, X2 and Y1, Y2 be the matrices of mean-centered genotypes and phenotypes
of the individuals in study one and two, respectively, with f1, f2 the allele frequencies of the M SNPs
common to both populations. Assuming Hardy-Weinberg equilibrium, the allele variances are �21 = 2f1(1�
f1),�22 = 2f2(1� f2). Let �1,�2 be the (unobserved) per-allele e↵ect sizes for each SNP in studies one and
two, respectively. Define the genetic impact correlation ⇢gi
= Cor(p�21�1,
p�22�2) and the genetic e↵ect
correlation ⇢ge
= Cor(�1,�2). We present a maximum likelihood framework for estimating the heritability of
the phenotype in study 1 and it’s standard error, the heritability of the phenotype in study 2 and it’s standard
error, and the genetic e↵ect and impact correlation of the phenotype between the studies and it’s standard
error given only the summary statistics Z1, Z2 and reference genotypes G1, G2 representing the populations
in the studies. We assume that genotypes are drawn randomly from populations with expected correlation
matrices ⌃1 (and similarly for study two), and that every SNP is causal with a normally distributed e↵ects
size (though this assumption is not necessary in practice, see Figure S1).
Genetic impact correlation
Let X 01 = X1p
�
21
(and similarly for study 2) be normalized genotype matrices. We consider the standard linear
model for generation of the phenotypes, where
Y1 = X 01�1 + ✏1
Y2 = X 02�2 + ✏2
For convenience of notation let h2ix
= ⇢gi
ph21h
22. We assume the SNP e↵ects follow the infinitesimal model,
where every SNP has an e↵ect size drawn from the normal distribution, and that the residuals are independent
for each individual and normally distributed:
0
@ �1
�2
1
A ⇠ N
0
@
2
4 0
0
3
5 ,1
M
2
4 h21IM h2
ix
IM
h2ix
IM
h22IM
3
5
1
A (1)
0
@ ✏1
✏2
1
A ⇠ N
0
@
2
4 0
0
3
5 ,
2
4 (1� h21)IM 0
0 (1� h22)IM
3
5
1
A (2)
1
.CC-BY-NC-ND 4.0 International licenseIt is made available under a (which was not peer-reviewed) is the author/funder, who has granted bioRxiv a license to display the preprint in perpetuity.
The copyright holder for this preprint. http://dx.doi.org/10.1101/036657doi: bioRxiv preprint first posted online Jan. 14, 2016;
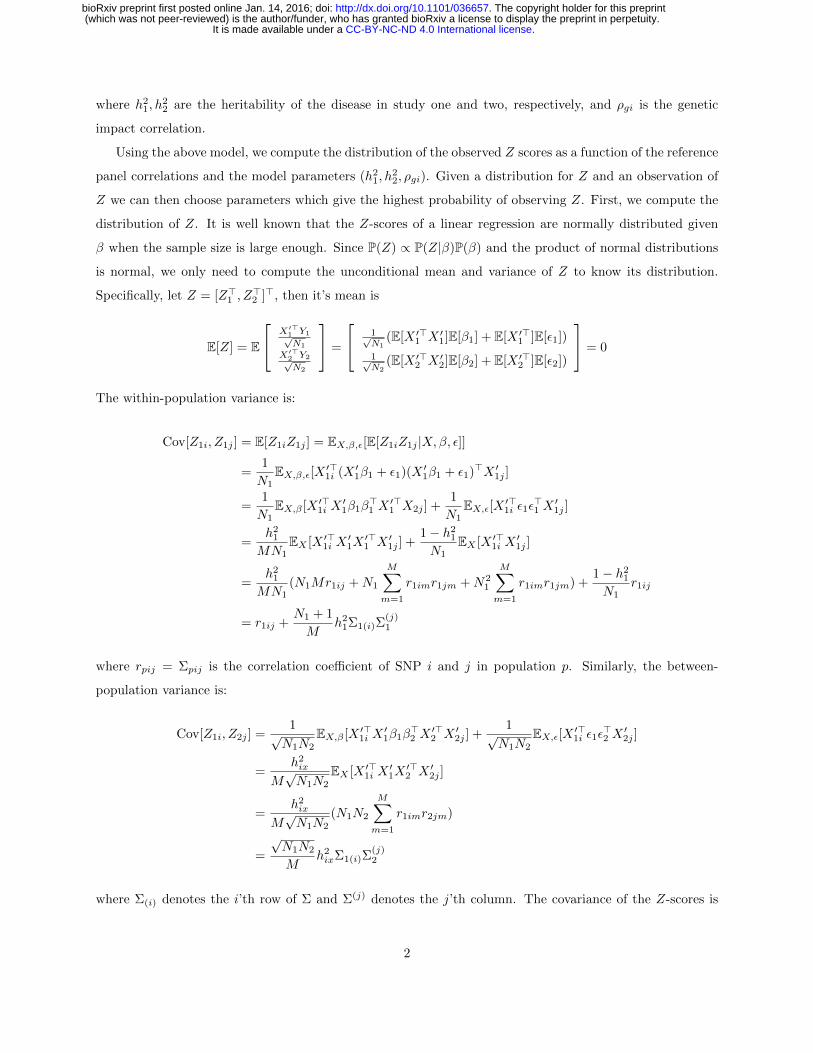
where h21, h
22 are the heritability of the disease in study one and two, respectively, and ⇢
gi
is the genetic
impact correlation.
Using the above model, we compute the distribution of the observed Z scores as a function of the reference
panel correlations and the model parameters (h21, h
22, ⇢gi). Given a distribution for Z and an observation of
Z we can then choose parameters which give the highest probability of observing Z. First, we compute the
distribution of Z. It is well known that the Z-scores of a linear regression are normally distributed given
� when the sample size is large enough. Since P(Z) / P(Z|�)P(�) and the product of normal distributions
is normal, we only need to compute the unconditional mean and variance of Z to know its distribution.
Specifically, let Z = [Z>1 , Z>
2 ]>, then it’s mean is
E[Z] = E
2
4X
0>1 Y1pN1
X
0>2 Y2pN2
3
5 =
2
41pN1
(E[X 0>1 X 0
1]E[�1] + E[X 0>1 ]E[✏1])
1pN2
(E[X 0>2 X 0
2]E[�2] + E[X 0>2 ]E[✏2])
3
5 = 0
The within-population variance is:
Cov[Z1i, Z1j ] = E[Z1iZ1j ] = EX,�,✏
[E[Z1iZ1j |X,�, ✏]]
=1
N1EX,�,✏
[X 0>1i (X
01�1 + ✏1)(X
01�1 + ✏1)
>X 01j ]
=1
N1EX,�
[X 0>1i X
01�1�
>1 X 0>
1 X2j ] +1
N1EX,✏
[X 0>1i ✏1✏
>1 X
01j ]
=h21
MN1EX
[X 0>1i X
01X
0>1 X 0
1j ] +1� h2
1
N1EX
[X 0>1i X
01j ]
=h21
MN1(N1Mr1ij +N1
MX
m=1
r1imr1jm +N21
MX
m=1
r1imr1jm) +1� h2
1
N1r1ij
= r1ij +N1 + 1
Mh21⌃1(i)⌃
(j)1
where rpij
= ⌃pij
is the correlation coe�cient of SNP i and j in population p. Similarly, the between-
population variance is:
Cov[Z1i, Z2j ] =1p
N1N2EX,�
[X 0>1i X
01�1�
>2 X 0>
2 X 02j ] +
1pN1N2
EX,✏
[X 0>1i ✏1✏
>2 X
02j ]
=h2ix
MpN1N2
EX
[X 0>1i X
01X
0>2 X 0
2j ]
=h2ix
MpN1N2
(N1N2
MX
m=1
r1imr2jm)
=
pN1N2
Mh2ix
⌃1(i)⌃(j)2
where ⌃(i) denotes the i’th row of ⌃ and ⌃(j) denotes the j’th column. The covariance of the Z-scores is
2
.CC-BY-NC-ND 4.0 International licenseIt is made available under a (which was not peer-reviewed) is the author/funder, who has granted bioRxiv a license to display the preprint in perpetuity.
The copyright holder for this preprint. http://dx.doi.org/10.1101/036657doi: bioRxiv preprint first posted online Jan. 14, 2016;
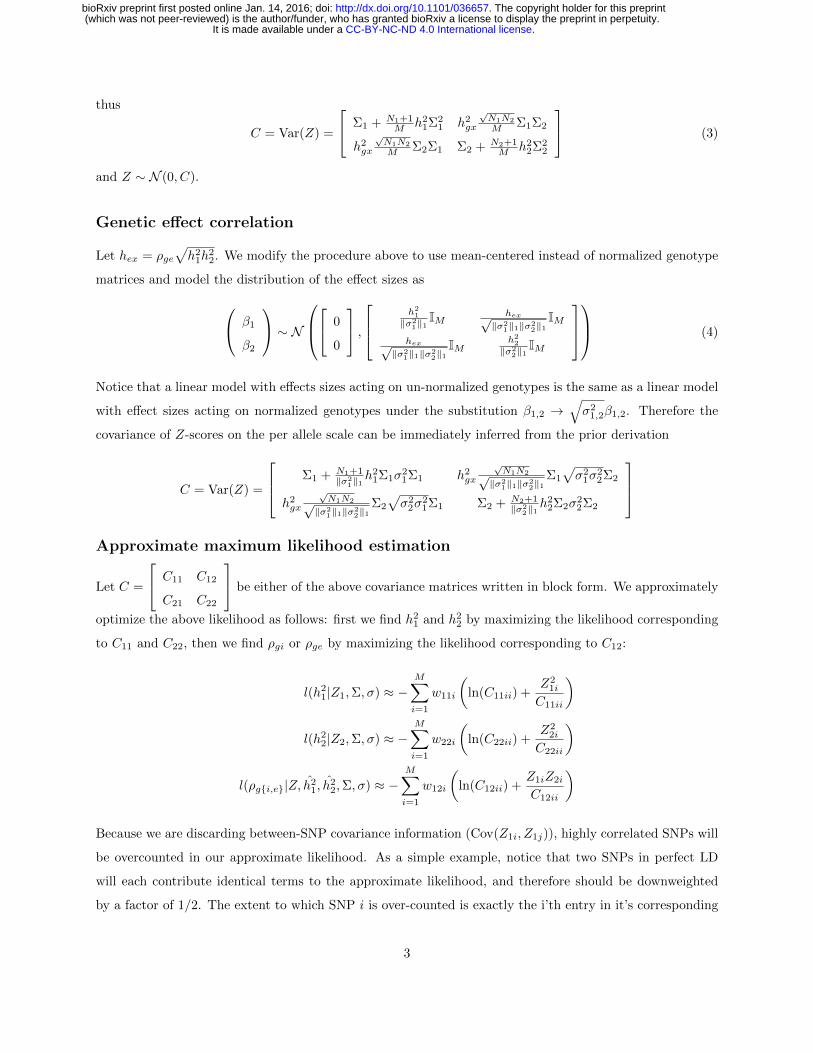
thus
C = Var(Z) =
2
4 ⌃1 +N1+1M
h21⌃
21 h2
gx
pN1N2
M
⌃1⌃2
h2gx
pN1N2
M
⌃2⌃1 ⌃2 +N2+1M
h22⌃
22
3
5 (3)
and Z ⇠ N (0, C).
Genetic e↵ect correlation
Let hex
= ⇢ge
ph21h
22. We modify the procedure above to use mean-centered instead of normalized genotype
matrices and model the distribution of the e↵ect sizes as
0
@ �1
�2
1
A ⇠ N
0
B@
2
4 0
0
3
5 ,
2
64h
21
k�21k1
IM
h
expk�2
1k1k�22k1
IM
h
expk�2
1k1k�22k1
IM
h
22
k�22k1
IM
3
75
1
CA (4)
Notice that a linear model with e↵ects sizes acting on un-normalized genotypes is the same as a linear model
with e↵ect sizes acting on normalized genotypes under the substitution �1,2 !q
�21,2�1,2. Therefore the
covariance of Z-scores on the per allele scale can be immediately inferred from the prior derivation
C = Var(Z) =
2
64⌃1 +
N1+1k�2
1k1h21⌃1�2
1⌃1 h2gx
pN1N2p
k�21k1k�2
2k1
⌃1
p�21�
22⌃2
h2gx
pN1N2p
k�21k1k�2
2k1
⌃2
p�22�
21⌃1 ⌃2 +
N2+1k�2
2k1h22⌃2�2
2⌃2
3
75
Approximate maximum likelihood estimation
Let C =
2
4 C11 C12
C21 C22
3
5 be either of the above covariance matrices written in block form. We approximately
optimize the above likelihood as follows: first we find h21 and h2
2 by maximizing the likelihood corresponding
to C11 and C22, then we find ⇢gi
or ⇢ge
by maximizing the likelihood corresponding to C12:
l(h21|Z1,⌃,�) ⇡ �
MX
i=1
w11i
✓ln(C11ii) +
Z21i
C11ii
◆
l(h22|Z2,⌃,�) ⇡ �
MX
i=1
w22i
✓ln(C22ii) +
Z22i
C22ii
◆
l(⇢g{i,e}|Z, h2
1, h22,⌃,�) ⇡ �
MX
i=1
w12i
✓ln(C12ii) +
Z1iZ2i
C12ii
◆
Because we are discarding between-SNP covariance information (Cov(Z1i, Z1j)), highly correlated SNPs will
be overcounted in our approximate likelihood. As a simple example, notice that two SNPs in perfect LD
will each contribute identical terms to the approximate likelihood, and therefore should be downweighted
by a factor of 1/2. The extent to which SNP i is over-counted is exactly the i’th entry in it’s corresponding
3
.CC-BY-NC-ND 4.0 International licenseIt is made available under a (which was not peer-reviewed) is the author/funder, who has granted bioRxiv a license to display the preprint in perpetuity.
The copyright holder for this preprint. http://dx.doi.org/10.1101/036657doi: bioRxiv preprint first posted online Jan. 14, 2016;
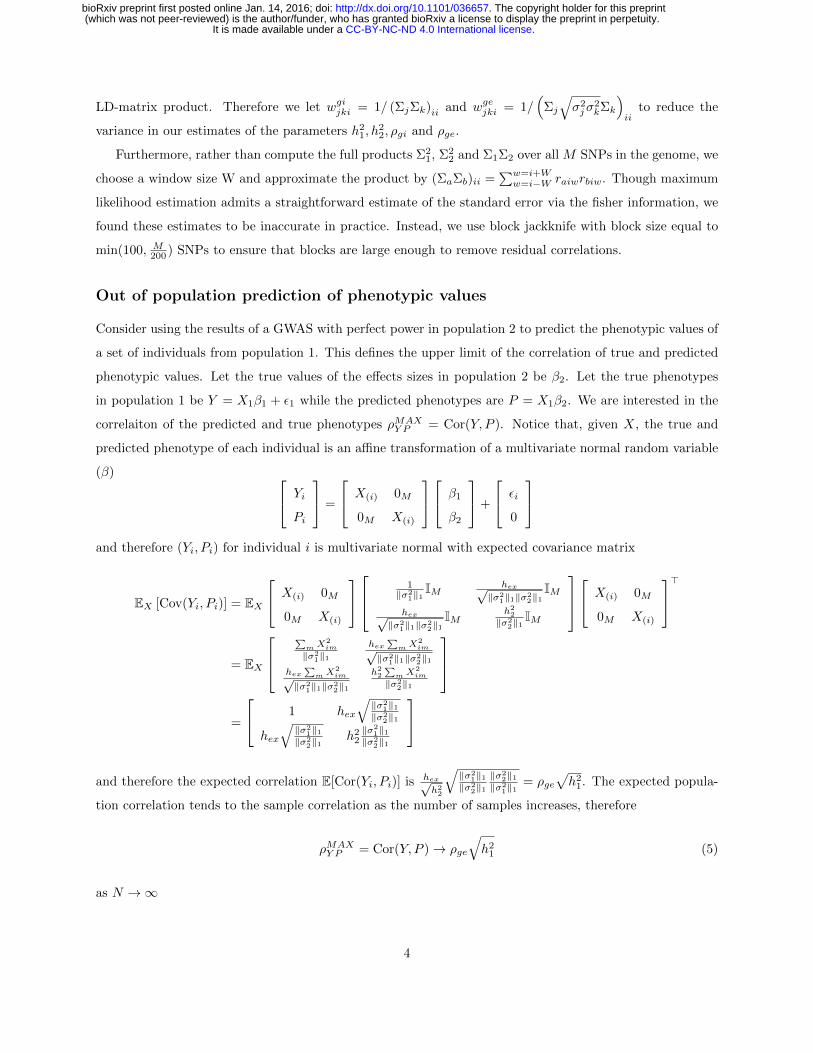
LD-matrix product. Therefore we let wgi
jki
= 1/ (⌃j
⌃k
)ii
and wge
jki
= 1/⇣⌃
j
q�2j
�2k
⌃k
⌘
ii
to reduce the
variance in our estimates of the parameters h21, h
22, ⇢gi and ⇢
ge
.
Furthermore, rather than compute the full products ⌃21, ⌃
22 and ⌃1⌃2 over all M SNPs in the genome, we
choose a window size W and approximate the product by (⌃a
⌃b
)ii
=P
w=i+W
w=i�W
raiw
rbiw
. Though maximum
likelihood estimation admits a straightforward estimate of the standard error via the fisher information, we
found these estimates to be inaccurate in practice. Instead, we use block jackknife with block size equal to
min(100, M
200 ) SNPs to ensure that blocks are large enough to remove residual correlations.
Out of population prediction of phenotypic values
Consider using the results of a GWAS with perfect power in population 2 to predict the phenotypic values of
a set of individuals from population 1. This defines the upper limit of the correlation of true and predicted
phenotypic values. Let the true values of the e↵ects sizes in population 2 be �2. Let the true phenotypes
in population 1 be Y = X1�1 + ✏1 while the predicted phenotypes are P = X1�2. We are interested in the
correlaiton of the predicted and true phenotypes ⇢MAX
Y P
= Cor(Y, P ). Notice that, given X, the true and
predicted phenotype of each individual is an a�ne transformation of a multivariate normal random variable
(�) 2
4 Yi
Pi
3
5 =
2
4 X(i) 0M
0M
X(i)
3
5
2
4 �1
�2
3
5+
2
4 ✏i
0
3
5
and therefore (Yi
, Pi
) for individual i is multivariate normal with expected covariance matrix
EX
[Cov(Yi
, Pi
)] = EX
2
4 X(i) 0M
0M
X(i)
3
5
2
641
k�21k1
IM
h
expk�2
1k1k�22k1
IM
h
expk�2
1k1k�22k1
IM
h
22
k�22k1
IM
3
75
2
4 X(i) 0M
0M
X(i)
3
5>
= EX
2
64
Pm
X
2im
k�21k1
h
ex
Pm
X
2imp
k�21k1k�2
2k1
h
ex
Pm
X
2imp
k�21k1k�2
2k1
h
22
Pm
X
2im
k�22k1
3
75
=
2
4 1 hex
qk�2
1k1
k�22k1
hex
qk�2
1k1
k�22k1
h22k�2
1k1
k�22k1
3
5
and therefore the expected correlation E[Cor(Yi
, Pi
)] is h
exph
22
qk�2
1k1
k�22k1
k�22k1
k�21k1
= ⇢ge
ph21. The expected popula-
tion correlation tends to the sample correlation as the number of samples increases, therefore
⇢MAX
Y P
= Cor(Y, P ) ! ⇢ge
qh21 (5)
as N ! 1
4
.CC-BY-NC-ND 4.0 International licenseIt is made available under a (which was not peer-reviewed) is the author/funder, who has granted bioRxiv a license to display the preprint in perpetuity.
The copyright holder for this preprint. http://dx.doi.org/10.1101/036657doi: bioRxiv preprint first posted online Jan. 14, 2016;
13
DescriptionofSupplementaldata
Supplementaldataincludefivefiguresandonetable.
Acknowledgements
TheauthorswouldliketoacknowledgeLiorPachterandHilaryFinucaneforinsightful
discussionabouttheproblem.BCBissupportedbytheNSFGRFP.ALPissupportedbyNIH
grantR01HG006399.NZissupportedbyNIHgrantK25HL121295.
WebResources
Popcornisavailableathttps://github.com/brielin/popcorn
References
1.Robinson,M.R.,Hemani,G.,Medina-Gomez,C.,Mezzavilla,M.,Esko,T.,Shakhbazov,K.,Powell,J.E.,Vinkhuyzen,A.,Berndt,S.I.,Gustafsson,S.,etal.(2015).PopulationgeneticdifferentiationofheightandbodymassindexacrossEurope.Nat.Genet.47,1357–1362.2.Burt,V.L.,Whelton,P.,Roccella,E.J.,Brown,C.,Cutler,J.A.,Higgins,M.,Horan,M.J.,andLabarthe,D.(1995).PrevalenceofhypertensionintheUSadultpopulation.ResultsfromtheThirdNationalHealthandNutritionExaminationSurvey,1988-1991.Hypertension25,305–313.3.Coram,M.A.,Candille,S.I.,Duan,Q.,Chan,K.H.K.,Li,Y.,Kooperberg,C.,Reiner,A.P.,andTang,H.(2015).LeveragingMulti-ethnicEvidenceforMappingComplexTraitsinMinorityPopulations:AnEmpiricalBayesApproach.Am.J.Hum.Genet.96,740–752.4.Morris,A.P.(2011).TransethnicMeta-AnalysisofGenomewideAssociationStudies.Genet.Epidemiol.35,809–822.5.Bustamante,C.D.,DeLaVega,F.M.,andBurchard,E.G.(2011).Genomicsfortheworld.Nature475,163–165.6.(2011).Agenome-wideassociationstudyinEuropeansandSouthAsiansidentifiesfivenewlociforcoronaryarterydisease.NatGenet43,339–344.7.Okada,Y.,Wu,D.,Trynka,G.,Raj,T.,Terao,C.,Ikari,K.,Kochi,Y.,Ohmura,K.,Suzuki,A.,Yoshida,S.,etal.(2014).Geneticsofrheumatoidarthritiscontributestobiologyanddrugdiscovery.Nature506,376–381.8.deCandia,T.R.,Lee,S.H.,Yang,J.,Browning,B.L.,Gejman,P.V.,Levinson,D.F.,Mowry,B.J.,Hewitt,J.K.,Goddard,M.E.,O’Donovan,M.C.,etal.(2013).AdditiveGeneticVariationinSchizophreniaRiskIsSharedbyPopulationsofAfricanandEuropeanDescent.Am.J.Hum.Genet.93,463–470.9.Lee,S.,Teslovich,T.M.,Boehnke,M.,andLin,X.(2013).GeneralFrameworkforMeta-analysisofRareVariantsinSequencingAssociationStudies.Am.J.Hum.Genet.93,42–53.10.Palla,L.,andDudbridge,F.(2015).AFastMethodthatUsesPolygenicScorestoEstimatetheVarianceExplainedbyGenome-wideMarkerPanelsandtheProportionofVariantsAffectingaTrait.Am.J.Hum.Genet.97,250–259.
.CC-BY-NC-ND 4.0 International licenseIt is made available under a (which was not peer-reviewed) is the author/funder, who has granted bioRxiv a license to display the preprint in perpetuity.
The copyright holder for this preprint. http://dx.doi.org/10.1101/036657doi: bioRxiv preprint first posted online Jan. 14, 2016;
14
11.Yang,J.,Ferreira,T.,Morris,A.P.,Medland,S.E.,Madden,P.A.F.,Heath,A.C.,Martin,N.G.,Montgomery,G.W.,Weedon,M.N.,Loos,R.J.,etal.(2012).Conditionalandjointmultiple-SNPanalysisofGWASsummarystatisticsidentifiesadditionalvariantsinfluencingcomplextraits.Nat.Genet.44,369–375.12.InternationalSchizophreniaConsortium(2009).Commonpolygenicvariationcontributestoriskofschizophreniathatoverlapswithbipolardisorder.Nature460,748–752.13.Zuo,L.,Zhang,C.K.,Wang,F.,Li,C.-S.R.,Zhao,H.,Lu,L.,Zhang,X.-Y.,Lu,L.,Zhang,H.,Zhang,F.,etal.(2011).ANovel,FunctionalandReplicableRiskGeneRegionforAlcoholDependenceIdentifiedbyGenome-WideAssociationStudy.PLoSONE6,e26726.14.Fesinmeyer,M.,North,K.,Ritchie,M.,Lim,U.,Franceschini,N.,Wilkens,L.,Gross,M.,Bůžková,P.,Glenn,K.,Quibrera,P.,etal.(2013).Geneticriskfactorsforbodymassindexandobesityinanethnicallydiversepopulation:resultsfromthePopulationArchitectureusingGenomicsandEpidemiology(PAGE)Study.Obes.SilverSpringMd21,10.1002/oby.20268.15.Chang,M.,Ned,R.M.,Hong,Y.,Yesupriya,A.,Yang,Q.,Liu,T.,Janssens,A.C.J.W.,andDowling,N.F.(2011).Racial/EthnicVariationintheAssociationofLipid-RelatedGeneticVariantsWithBloodLipidsintheUSAdultPopulation.Circ.Cardiovasc.Genet.4,523–533.16.Waters,K.M.,Stram,D.O.,Hassanein,M.T.,LeMarchand,L.,Wilkens,L.R.,Maskarinec,G.,Monroe,K.R.,Kolonel,L.N.,Altshuler,D.,Henderson,B.E.,etal.(2010).ConsistentAssociationofType2DiabetesRiskVariantsFoundinEuropeansinDiverseRacialandEthnicGroups.PLoSGenet.6,e1001078.17.Lee,S.H.,Yang,J.,Goddard,M.E.,Visscher,P.M.,andWray,N.R.(2012).Estimationofpleiotropybetweencomplexdiseasesusingsingle-nucleotidepolymorphism-derivedgenomicrelationshipsandrestrictedmaximumlikelihood.Bioinformatics28,2540–2542.18.Bulik-Sullivan,B.,Finucane,H.K.,Anttila,V.,Gusev,A.,Day,F.R.,Loh,P.-R.,ReproGenConsortium,PsychiatricGenomicsConsortium,GeneticConsortiumforAnorexiaNervosaoftheWellcomeTrustCaseControlConsortium3,Duncan,L.,etal.(2015).Anatlasofgeneticcorrelationsacrosshumandiseasesandtraits.NatGenet47,1236–1241.19.Falconer,D.S.,andMackay,T.F.C.(1996).Introductiontoquantitativegenetics(Essex,England:Longman).20.Loh,P.-R.,Tucker,G.,Bulik-Sullivan,B.K.,Vilhjálmsson,B.J.,Finucane,H.K.,Salem,R.M.,Chasman,D.I.,Ridker,P.M.,Neale,B.M.,Berger,B.,etal.(2015).EfficientBayesianmixed-modelanalysisincreasesassociationpowerinlargecohorts.Nat.Genet.47,284–290.21.Bulik-Sullivan,B.K.,Loh,P.-R.,Finucane,H.K.,Ripke,S.,Yang,J.,SchizophreniaWorkingGroupofthePsychiatricGenomicsConsortium,Patterson,N.,Daly,M.J.,Price,A.L.,andNeale,B.M.(2015).LDScoreregressiondistinguishesconfoundingfrompolygenicityingenome-wideassociationstudies.NatGenet47,291–295.22.Finucane,H.K.,Bulik-Sullivan,B.,Gusev,A.,Trynka,G.,Reshef,Y.,Loh,P.-R.,Anttila,V.,Xu,H.,Zang,C.,Farh,K.,etal.(2015).Partitioningheritabilitybyfunctionalannotationusinggenome-wideassociationsummarystatistics.NatGenet47,1228–1235.23.Yang,J.,Benyamin,B.,McEvoy,B.P.,Gordon,S.,Henders,A.K.,Nyholt,D.R.,Madden,P.A.,Heath,A.C.,Martin,N.G.,Montgomery,G.W.,etal.(2010).CommonSNPsexplainalargeproportionoftheheritabilityforhumanheight.Nat.Genet.42,565–569.24.So,H.-C.,Li,M.,andSham,P.C.(2011).Uncoveringthetotalheritabilityexplainedbyalltruesusceptibilityvariantsinagenome-wideassociationstudy.Genet.Epidemiol.n/a–n/a.25.Vattikuti,S.,Guo,J.,andChow,C.C.(2012).HeritabilityandGeneticCorrelationsExplainedbyCommonSNPsforMetabolicSyndromeTraits.PLoSGenet.8,e1002637.26.’tHoen,P.A.C.,Friedländer,M.R.,Almlöf,J.,Sammeth,M.,Pulyakhina,I.,Anvar,S.Y.,Laros,J.F.J.,Buermans,H.P.J.,Karlberg,O.,Brännvall,M.,etal.(2013).Reproducibilityof
.CC-BY-NC-ND 4.0 International licenseIt is made available under a (which was not peer-reviewed) is the author/funder, who has granted bioRxiv a license to display the preprint in perpetuity.
The copyright holder for this preprint. http://dx.doi.org/10.1101/036657doi: bioRxiv preprint first posted online Jan. 14, 2016;
15
high-throughputmRNAandsmallRNAsequencingacrosslaboratories.Nat.Biotechnol.31,1015–1022.27.Morris,A.P.,Voight,B.F.,Teslovich,T.M.,Ferreira,T.,Segrè,A.V.,Steinthorsdottir,V.,Strawbridge,R.J.,Khan,H.,Grallert,H.,Mahajan,A.,etal.(2012).Large-scaleassociationanalysisprovidesinsightsintothegeneticarchitectureandpathophysiologyoftype2diabetes.Nat.Genet.44,981–990.28.Cho,Y.S.,Chen,C.-H.,Hu,C.,Long,J.,HeeOng,R.T.,Sim,X.,Takeuchi,F.,Wu,Y.,Go,M.J.,Yamauchi,T.,etal.(2012).Meta-analysisofgenome-wideassociationstudiesidentifieseightnewlocifortype2diabetesineastAsians.NatGenet44,67–72.29.Su,Z.,Marchini,J.,andDonnelly,P.(2011).HAPGEN2:simulationofmultiplediseaseSNPs.Bioinformatics27,2304–2305.30.Lee,S.H.,Wray,N.R.,Goddard,M.E.,andVisscher,P.M.(2011).EstimatingMissingHeritabilityforDiseasefromGenome-wideAssociationStudies.Am.J.Hum.Genet.88,294–305.31.Speed,D.,Hemani,G.,Johnson,M.R.,andBalding,D.J.(2012).ImprovedHeritabilityEstimationfromGenome-wideSNPs.Am.J.Hum.Genet.91,1011–1021.32.Yang,J.,Bakshi,A.,Zhu,Z.,Hemani,G.,Vinkhuyzen,A.A.E.,Lee,S.H.,Robinson,M.R.,Perry,J.R.B.,Nolte,I.M.,vanVliet-Ostaptchouk,J.V.,etal.(2015).Geneticvarianceestimationwithimputedvariantsfindsnegligiblemissingheritabilityforhumanheightandbodymassindex.Nat.Genet.47,1114–1120.33.Price,A.L.,Helgason,A.,Thorleifsson,G.,McCarroll,S.A.,Kong,A.,andStefansson,K.(2011).Single-TissueandCross-TissueHeritabilityofGeneExpressionViaIdentity-by-DescentinRelatedorUnrelatedIndividuals.PLoSGenet.7,e1001317.34.Gaffney,D.J.(2013).GlobalPropertiesandFunctionalComplexityofHumanGeneRegulatoryVariation.PLoSGenet.9,e1003501.35.Stahl,E.A.,Wegmann,D.,Trynka,G.,Gutierrez-Achury,J.,Do,R.,Voight,B.F.,Kraft,P.,Chen,R.,Kallberg,H.J.,Kurreeman,F.A.S.,etal.(2012).Bayesianinferenceanalysesofthepolygenicarchitectureofrheumatoidarthritis.Nat.Genet.44,483–489.36.Marenberg,M.E.,Risch,N.,Berkman,L.F.,Floderus,B.,anddeFaire,U.(1994).Geneticsusceptibilitytodeathfromcoronaryheartdiseaseinastudyoftwins.N.Engl.J.Med.330,1041–1046.37.Nora,J.J.,Lortscher,R.H.,Spangler,R.D.,Nora,A.H.,andKimberling,W.J.(1980).Genetic--epidemiologicstudyofearly-onsetischemicheartdisease.Circulation61,503–508.38.Chen,X.,Kuja-Halkola,R.,Rahman,I.,Arpegård,J.,Viktorin,A.,Karlsson,R.,Hägg,S.,Svensson,P.,Pedersen,N.L.,andMagnusson,P.K.E.(2015).DominantGeneticVariationandMissingHeritabilityforHumanComplexTraits:InsightsfromTwinversusGenome-wideCommonSNPModels.Am.J.Hum.Genet.97,708–714.39.Zhu,Z.,Bakshi,A.,Vinkhuyzen,A.A.E.,Hemani,G.,Lee,S.H.,Nolte,I.M.,vanVliet-Ostaptchouk,J.V.,Snieder,H.,Esko,T.,Milani,L.,etal.(2015).DominanceGeneticVariationContributesLittletotheMissingHeritabilityforHumanComplexTraits.Am.J.Hum.Genet.96,377–385.40.Marchini,J.,andHowie,B.(2010).Genotypeimputationforgenome-wideassociationstudies.NatRevGenet11,499–511.41.Ma,R.C.W.,andChan,J.C.N.(2013).Type2diabetesinEastAsians:similaritiesanddifferenceswithpopulationsinEuropeandtheUnitedStates:DiabetesinEastAsians.Ann.N.Y.Acad.Sci.1281,64–91.
FigureTitlesandLegends
.CC-BY-NC-ND 4.0 International licenseIt is made available under a (which was not peer-reviewed) is the author/funder, who has granted bioRxiv a license to display the preprint in perpetuity.
The copyright holder for this preprint. http://dx.doi.org/10.1101/036657doi: bioRxiv preprint first posted online Jan. 14, 2016;
16
Figure1:Standarderrorofourestimateofgeneticeffectandimpactcorrelationasa
functionofthenumberofSNPsandindividuals.Phenotypesweresimulatedwithh12=0.5,
h22=0.5andρgi,e=0.5andgenotypesweresimulatedwithHapGen2tomatchEuropean(EUR)
andEastAsian(EAS)populations.
Figure2:DistributionofgeneticcorrelationcomparisonbetweenpopcornandGCTA.
Distributionwascomputedusingagaussiankdeonthesetofgeneticcorrelationestimates.
Figure3:Geneticcorrelationasafunctionofheritabilityforgeneexpression.Themeanand
standarderrorofthegeneticcorrelationofthesetofgeneswithh12andh22exceeding
thresholdhineachanalysis(y-axis)isplottedagainsth(x-axis).
Tables
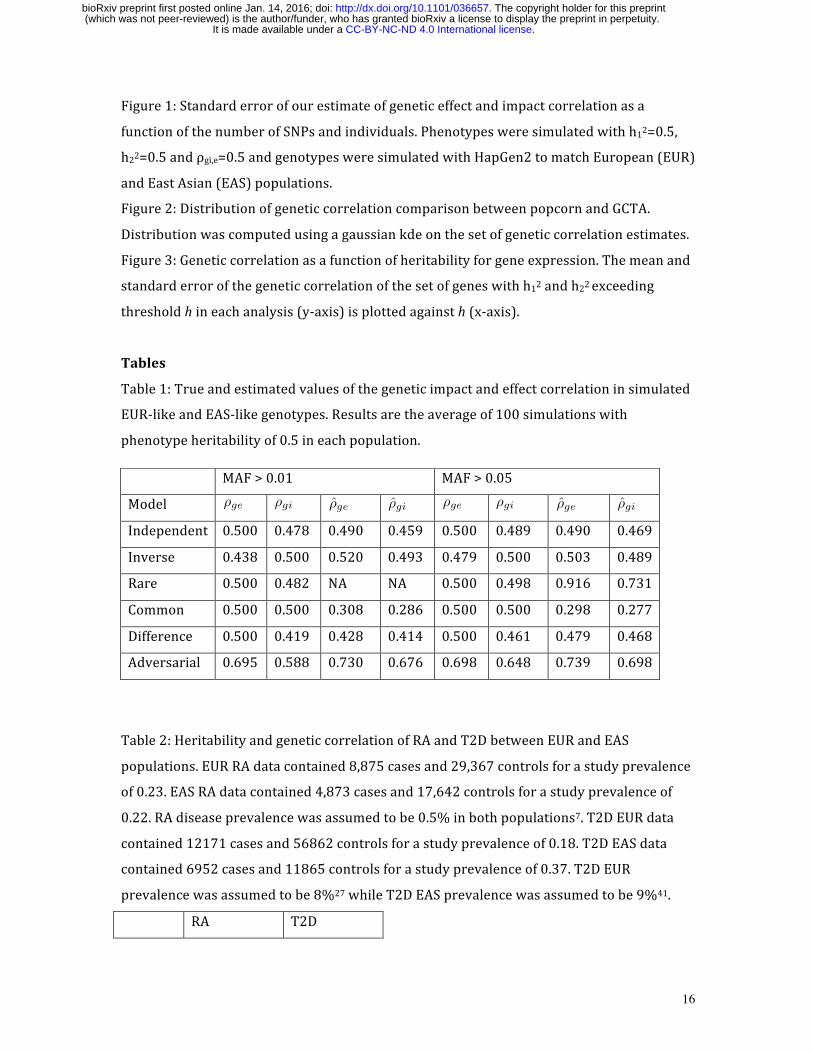
Table1:Trueandestimatedvaluesofthegeneticimpactandeffectcorrelationinsimulated
EUR-likeandEAS-likegenotypes.Resultsaretheaverageof100simulationswith
phenotypeheritabilityof0.5ineachpopulation.
Table2:HeritabilityandgeneticcorrelationofRAandT2DbetweenEURandEAS
populations.EURRAdatacontained8,875casesand29,367controlsforastudyprevalence
of0.23.EASRAdatacontained4,873casesand17,642controlsforastudyprevalenceof
0.22.RAdiseaseprevalencewasassumedtobe0.5%inbothpopulations7.T2DEURdata
contained12171casesand56862controlsforastudyprevalenceof0.18.T2DEASdata
contained6952casesand11865controlsforastudyprevalenceof0.37.T2DEUR
prevalencewasassumedtobe8%27whileT2DEASprevalencewasassumedtobe9%41.
RA T2D
MAF>0.01 MAF>0.05
Model Independent 0.500 0.478 0.490 0.459 0.500 0.489 0.490 0.469
Inverse 0.438 0.500 0.520 0.493 0.479 0.500 0.503 0.489
Rare 0.500 0.482 NA NA 0.500 0.498 0.916 0.731
Common 0.500 0.500 0.308 0.286 0.500 0.500 0.298 0.277
Difference 0.500 0.419 0.428 0.414 0.500 0.461 0.479 0.468
Adversarial 0.695 0.588 0.730 0.676 0.698 0.648 0.739 0.698
⇢ge ⇢gi ⇢ge ⇢gi ⇢ge ⇢gi ⇢ge ⇢gi
.CC-BY-NC-ND 4.0 International licenseIt is made available under a (which was not peer-reviewed) is the author/funder, who has granted bioRxiv a license to display the preprint in perpetuity.
The copyright holder for this preprint. http://dx.doi.org/10.1101/036657doi: bioRxiv preprint first posted online Jan. 14, 2016;

17
hEUR2obs 0.265(0.022) 0.146(0.008)
hEAS2obs 0.320(0.038) 0.093(0.020)
hEUR2lia 0.177(0.015) 0.242(0.013)
hEAS2lia 0.221(0.026) 0.105(0.021)
ρge 0.463(0.058) 0.621(0.088)
pρge>0 1.37e-15 1.70e-12
pρge<1 2.53e-20 1.66e-05
ρgi 0.455(0.056) 0.606(0.083)
pρgi>0 8.16e-16 2.85e-13
pρgi<1 4.87e-22 2.06e-06
.CC-BY-NC-ND 4.0 International licenseIt is made available under a (which was not peer-reviewed) is the author/funder, who has granted bioRxiv a license to display the preprint in perpetuity.
The copyright holder for this preprint. http://dx.doi.org/10.1101/036657doi: bioRxiv preprint first posted online Jan. 14, 2016;