Issues in the Analysis and Testing of Textile Composites ...
25
Issues in the Analysis and Testing of Textile Composites with Large Representative Volume Elements by Gerd Weissenbach ISBN: 1-58112-245-4 DISSERTATION.COM Boca Raton, Florida USA • 2004
Transcript of Issues in the Analysis and Testing of Textile Composites ...

Issues in the Analysis and Testing of Textile Composites
with Large Representative Volume Elements
by
Gerd Weissenbach
ISBN: 1-58112-245-4
DISSERTATION.COM
Boca Raton, Florida USA • 2004

Issues in the Analysis and Testing of Textile Composites with Large Representative Volume Elements
Copyright © 2003 Gerd Weissenbach All rights reserved.
Dissertation.com
Boca Raton, Florida USA • 2004
ISBN: 1-58112-245-4

Issues in the analysis and testing of textile composites with
large representative volume elements
Gerd Weissenbach Diplom-Ingenieur (FH)
Faculty of Engineering and Built Environment of the University of Ulster
Thesis submitted for the degree of Doctor of Philosophy
March 2003

2
Contents
Acknowledgements .......................................................................................... 5
Summary .......................................................................................................... 6
Abbreviations................................................................................................... 7
Note on access to contents ............................................................................... 9
List of figures ................................................................................................... 10
List of tables ..................................................................................................... 12
1 Introduction ................................................................................................. 13
1.1 Textile composite materials ..................................................................... 13
1.2 Application of textile composite materials ............................................... 16
1.2.1 Composite component of a lower leg prosthesis ............................ 16
1.2.2 T-sections...................................................................................... 21
1.2.3 Implications .................................................................................. 27
2 Aims and objectives ..................................................................................... 29
3 Literature review ......................................................................................... 31
3.1 Analysis................................................................................................... 31
3.1.1 Global/local analysis ..................................................................... 32
3.1.2 Macro elements............................................................................. 33
3.1.3 Mesovolumes ................................................................................ 34
3.1.4 Conclusion .................................................................................... 36
3.2 Shear testing ............................................................................................ 37
4 Rationale....................................................................................................... 44
4.1 Structural analysis of textile composites .................................................. 44
4.2 Functional description of the material stiffness ........................................ 47
4.3 Stiffness function..................................................................................... 53
4.3.1 Akima sub-spline interpolation...................................................... 53
4.3.2 Examples of stiffness functions ..................................................... 59
4.4 Finite element approach........................................................................... 61
4.4.1 Average material stiffness ............................................................. 62
4.4.2 Stiffness at integration points ........................................................ 66

3
5 Results and discussion.................................................................................. 67
5.1 Application to material tests..................................................................... 67
5.1.1 Plate twist test ............................................................................... 68
5.1.2 V-notched beam shear test............................................................. 74
5.1.3 Conclusions for general cases........................................................ 86
5.2 Comparison of the different finite element approaches............................. 91
5.3 Electronic speckle pattern interferometry................................................. 94
6 Conclusions................................................................................................... 101
7 Further work ................................................................................................ 104
7.1 Three-dimensional problems.................................................................... 104
7.2 Plate bending ........................................................................................... 105
7.3 Failure criteria ......................................................................................... 108
8 References .................................................................................................... 110
Appendices ....................................................................................................... A1
A1 Publications ............................................................................................. A2
A2 Finite element analysis............................................................................. A4
A2.1 Principles ...................................................................................... A4
A2.2 Isoparametric quadrilateral finite elements .................................... A9
A2.3 Material laws................................................................................. A13
A2.4 Gauss integration........................................................................... A18
A3 Program description................................................................................. A23
A3.1 General ......................................................................................... A23
A3.2 Structure of input file .................................................................... A27
A4 Software tests .......................................................................................... A31
A4.1 Tensile test .................................................................................... A31
A4.2 Biaxial test .................................................................................... A35
A4.3 Beam bending ............................................................................... A37
A4.4 Bimetallic beam ............................................................................ A42
A5 Program listings....................................................................................... A47
A5.1 STATEC (main program).............................................................. A49

4
A5.2 READDAT ................................................................................... A56
A5.3 ASSEMK...................................................................................... A64
A5.4 QUAD .......................................................................................... A69
A5.5 CHOM .......................................................................................... A77
A5.6 CAVRG ........................................................................................ A80
A5.7 CHET ........................................................................................... A88
A5.8 STFFNK2D................................................................................... A92
A5.9 MAPP2D ...................................................................................... A96
A5.10 SPL2D .......................................................................................... A99
A5.11 SPL1D .......................................................................................... A102
A5.12 DMACH ....................................................................................... A108
A5.13 BMATR........................................................................................ A109
A5.14 ASSEMF....................................................................................... A113
A5.15 REDUC......................................................................................... A116
A5.16 SOLVE ......................................................................................... A119
A5.17 GAUSS......................................................................................... A122
A5.18 GAUSSP....................................................................................... A124
A5.19 GAUSSS....................................................................................... A127
A5.20 MACHPD ..................................................................................... A129
A5.21 STRAIN........................................................................................ A130
A5.22 STRESS........................................................................................ A136
A5.23 WRITEGID................................................................................... A142
A6 Software tools.......................................................................................... A148
A6.1 RVESCALE.................................................................................. A149
A6.2 RANDOMISE............................................................................... A155
A6.3 SHEAR......................................................................................... A160

5
Acknowledgements
This work could not have been written without the help and support of the following
people.
First and foremost I would like to thank my supervisors Dr. Desmond Brown and
Prof. Robert McIlhagger for their unceasing support and encouragement.
I am very grateful to my wife Chao-Ling for her strong support and encouragement.
Without her help this thesis would not have been possible. I also would like to thank
my parents Karlheinz and Josefine Weißenbach for their help in getting me started.
I also would like to thank the following people who made a direct or indirect
contribution to the completion of this work (in alphabetic order): Roy Brelsford, Roy
Carton, Jim Curran, Dr. Michael Harris, Prof. Dr.-Ing. Franz Josef Lange, Ludwig
Limmer, Stewart Matthews, Konrad and Irene Mayr, Dr. Julie Soden and the other
people at the Engineering Composites Research Centre.
Finally, I would like to thank all my friends who helped to enjoy life after work.

6
Summary
The high degree of heterogeneity of textile composites was found to be the primary
problem in analysis and testing. A concept was developed based on a description of
the local variation of the material stiffness matrix using a spline interpolation. The
role of this stiffness function is to facilitate the calculation of the material stiffness
matrix at any given position or for arbitrary domains in the form of finite elements.
Based on this approach, two different methods were developed. In the first method
the average material stiffness matrix is calculated for a finite element and
subsequently the elemental stiffness matrix of this element is assembled. In the
second approach the elemental stiffness matrix is calculated directly using the local
material stiffness at the integration points of the finite element.
This concept was then applied to the plate twist test. The numerical analysis of this
test was done in order to determine the influence of heterogeneity on the test results.
It was shown that this test measures the in-plane shear modulus largely independent
of the representative volume element (RVE) size.
Both finite element approaches were then applied to the V-notched beam shear test,
to investigate the applicability of this test to the measurement of the shear properties.
The test set-up as well as numerical parameters of the finite element analysis of the
test were studied. It was possible to derive limits for the applicability of the V-
notched beam shear test in terms of RVE size, as well as set up guidelines for the
finite element analysis of textile composites.
With electronic speckle pattern interferometry, which enables full-field displacement
and strain measurements, tensile tests were carried out on 3D-woven textile
composite specimens. With the agreement of the experimental results and the
theoretical predictions the validity of the developed approach was again shown.

7
Abbreviations
isotropic material properties independent of orientation
orthotropic material properties as a function of orientation with three
mutually perpendicular planes of symmetry
anisotropic material properties in the general case; no planes of
symmetry
homogeneous constant material properties
heterogeneous material properties as a function of position
micro-mechanics area in mechanics about calculating the effective material
properties from the properties of the constituent materials
macro-mechanics mechanics of homogeneous materials
meso-mechanics area in mechanics between micro-mechanics and macro-
mechanics
homogenisation process of determining the effective material properties of a
heterogeneous material
RVE Representative Volume Element
sub-volume subdivision of a RVE (also often called sub-cell)
stiffness function material stiffness matrix as a function of the spatial
co-ordinates
ESPI Electronic Speckle Pattern Interferometry (full field strain
measurement method)
I-DEAS design and analysis software from SDRC
XS Cross-Sectional-Program (software developed at the
Engineering Composites Research Centre for weave structure
design)

8
ELCOTEC Elastic Constants of Textile Composites (software developed
at the Engineering Composites Research Centre for the
prediction of elastic constants)
STATEC Structural Analysis of Textile Composites (software
developed at the Engineering Composites Research Centre
for structural analysis)
GiD finite element pre- and postprocessor (software developed at
the International Center for Numerical Methods in
Engineering in Barcelona)
Symbols:
(Matrices and vectors are printed in bold letters; scalars in italic letters)
C material stiffness matrix
D differential operator
N shape function
B strain shape function
k elemental stiffness matrix
K global stiffness matrix of the finite element model
f local nodal forces
F global external nodal forces
u displacements
ε strain vector
σ stress vector
E Elastic modulus
G shear modulus
ν Poisson’s ratio
ξ, η local co-ordinates (“ksi” and “eta” respectively)

9
Note on access to contents
“I hereby declare that for one year following the date on which the thesis is deposited
in the Library of the University of Ulster, the thesis shall remain confidential with
access or copying prohibited. Following expiry of this period I permit the Librarian
of the University to allow the thesis to be copied in whole or in part without
reference to me on the understanding that such authority applies to the provision of
single copies made for study purposes or for inclusion within the stock of another
library. This restriction does not apply to the British Library Thesis Service (which,
subject to expiry of the period of confidentiality, is permitted to copy the thesis on
demand for loan or sale under the terms of a separate agreement) nor to the copying
or publication of the title and abstract of the thesis. IT IS A CONDITION OF USE
OF THIS THESIS THAT ANYONE WHO CONSULTS IT MUST RECOGNISE
THAT THE COPYRIGHT RESTS WITH THE AUTHOR AND THAT NO
QUOTATION FROM THE THESIS AND NO INFORMATION DERIVED FROM
IT MAY BE PUBLISHED UNLESS THE SOURCE IS PROPERLY
ACKNOWLEDGED.”

10
List of figures
Figure 1: Integrally woven double-bladed T-skin and I-beam............................. 14
Figure 2: Examples of complex 3D-weave structures (cross-sections)................ 15
Figure 3: An athlete with similar lower leg prostheses ....................................... 18
Figure 4: Lower leg prosthesis developed at the University of Ulster ................. 19
Figure 5: Forces during stance phase.................................................................. 20
Figure 6: Test set-up for interplane testing ......................................................... 23
Figure 7: Schematic force-deflection curve ........................................................ 24
Figure 8: Microsections of cleavage area ........................................................... 24
Figure 9: Force/deflection curves with increasing interlinking ........................... 26
Figure 10: Test set-up for the short beam shear test............................................ 38
Figure 11: Test set-up for the three-rail shear test............................................... 39
Figure 12: Test set-up for the V-notched beam shear test ................................... 41
Figure 13: Test set-up for the plate twist test...................................................... 42
Figure 14: Displacement fields of shear specimen using Moiré interferometry... 45
Figure 15: Finite element mesh superimposed on 8 harness satin weave ............ 46
Figure 16: RVE and geometric features ............................................................. 46
Figure 17: Microsection of a typical 3D-woven textile composite ...................... 48
Figure 18: Solid model of RVE.......................................................................... 48
Figure 19: Procedure to incorporate stiffness variation within RVE ................... 52
Figure 20: Comparison of two interpolation methods......................................... 54
Figure 21: Continuity and periodicity between adjacent RVEs........................... 55
Figure 22: Interpolation in two dimensions ........................................................ 59
Figure 23: Stiffness variations of a plain weave composite................................. 60
Figure 24: Stiffness variations of a 3D-woven composite................................... 61
Figure 25: Gauss grid with 10 × 10 sampling points........................................... 64
Figure 26: Reduction of discontinuities using mesh refinement.......................... 65
Figure 27: Error dependent on material orientation and orthotropy ratio............. 70
Figure 28: Correction factor CF for R/L = 0.95 .................................................. 71
Figure 29: Stiffness variation within composite material of chessboard pattern .. 72
Figure 30: Displacement and strain fields .......................................................... 73

11
Figure 31: Plate deflection with varying number of RVEs.................................. 73
Figure 32: Mesh and boundary conditions of the V-notched beam shear test...... 75
Figure 33: Shear gauge measurement area ......................................................... 76
Figure 34: Detailed mesh view of measurement area.......................................... 76
Figure 35: Correction factor for the V-notched beam shear test.......................... 78
Figure 36: RVE with circular inclusion.............................................................. 79
Figure 37: Sub-volume stiffness......................................................................... 80
Figure 38: RVE positions relative to measurement area ..................................... 82
Figure 39: Shear strain of specimen with different RVE-sizes............................ 84
Figure 40: Result of shear measurements with different RVE sizes .................... 85
Figure 41: Envelope for the shear measurement variations................................. 86
Figure 42: Finite element ratio for averaged material properties......................... 89
Figure 43: Finite element ratio for heterogeneous material properties................. 90
Figure 44: Number of required integration points for different finite element ratios 90
Figure 45: Comparison of shear modulus for different approaches ..................... 92
Figure 46: Comparison of shear strain variations for different approaches.......... 93
Figure 47: Mini-3D-ESPI-System for full-field strain measurements ................. 94
Figure 48: Optical configuration of the ESPI system.......................................... 95
Figure 49: Flowchart for solving 3D problems................................................... 97
Figure 50: Normal strain in loading direction..................................................... 98
Figure 51: Experimental results and theoretical predictions................................ 99
Figure 52: Effects of weave structure irregularity............................................... 100

12
List of tables
Table 1: Comparison of weights of parts with equal stiffness ............................. 22
Table 2: Predicted and experimental elastic stiffness data .................................. 51
13
1 Introduction
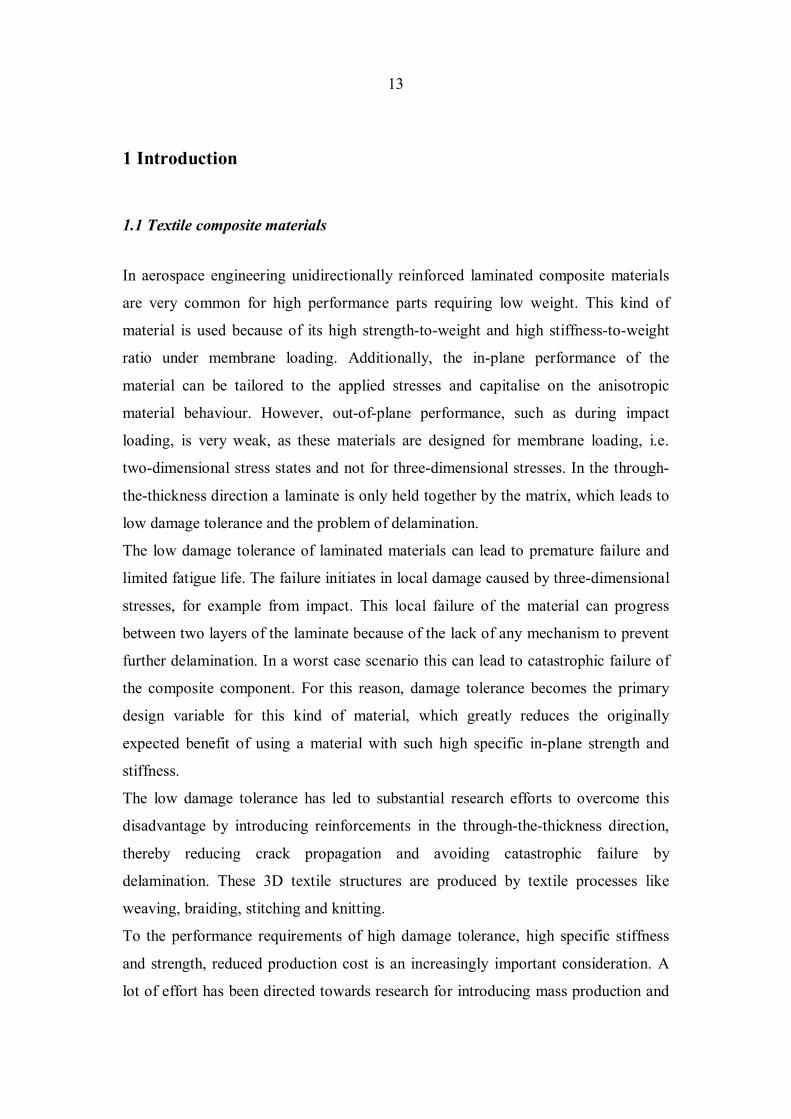
1.1 Textile composite materials
In aerospace engineering unidirectionally reinforced laminated composite materials
are very common for high performance parts requiring low weight. This kind of
material is used because of its high strength-to-weight and high stiffness-to-weight
ratio under membrane loading. Additionally, the in-plane performance of the
material can be tailored to the applied stresses and capitalise on the anisotropic
material behaviour. However, out-of-plane performance, such as during impact
loading, is very weak, as these materials are designed for membrane loading, i.e.
two-dimensional stress states and not for three-dimensional stresses. In the through-
the-thickness direction a laminate is only held together by the matrix, which leads to
low damage tolerance and the problem of delamination.
The low damage tolerance of laminated materials can lead to premature failure and
limited fatigue life. The failure initiates in local damage caused by three-dimensional
stresses, for example from impact. This local failure of the material can progress
between two layers of the laminate because of the lack of any mechanism to prevent
further delamination. In a worst case scenario this can lead to catastrophic failure of
the composite component. For this reason, damage tolerance becomes the primary
design variable for this kind of material, which greatly reduces the originally
expected benefit of using a material with such high specific in-plane strength and
stiffness.
The low damage tolerance has led to substantial research efforts to overcome this
disadvantage by introducing reinforcements in the through-the-thickness direction,
thereby reducing crack propagation and avoiding catastrophic failure by
delamination. These 3D textile structures are produced by textile processes like
weaving, braiding, stitching and knitting.
To the performance requirements of high damage tolerance, high specific stiffness
and strength, reduced production cost is an increasingly important consideration. A
lot of effort has been directed towards research for introducing mass production and

14
its associated reduced manufacturing cost. This is of great importance, if these
materials are to be adopted by the automotive industry with their requirements of
high volume production.
With these two objectives of mechanical performance (particularly through-the-
thickness) and low cost production, 3D-woven textile composites have been shown
to be promising candidates. 3D-weaving allows the production of near net shape
structures as integral units directly from the loom (examples see Figure 1), thus
avoiding the use of joints or fasteners.
Figure 1: Integrally woven double-bladed T-skin and I-beam1
The benefits of 3D-weaving are twofold; firstly the improvement in damage
tolerance by introducing through-the-thickness reinforcements and secondly by
enabling the production of integrated near net shape structures, thus reducing the
labour costs associated with the lay-up of laminates.
However, additional to the selection of the matrix material and the fibre type, a set of
new design variables appeared in relation to the definition of the weave structure
itself. Figure 2 shows some examples of complex 3D-weave structures developed by
Soden at the Engineering Composites Research Centre. The through-the-thickness
yarns can be clearly seen linking several layers together.

15
increasing through-the-thickness proportion
Figure 2: Examples of complex 3D-weave structures (cross-sections)2
The weaving process is described by Soden et al3 as follows:
“The weaving of multilayer reinforcements has developed into a
complete process, utilising modified weave structures and lift plans with
through-the-thickness yarns incorporated as part of the weave design4.
Multilayer woven reinforcements can be manufactured on conventional
textile machinery with few mechanical modifications to produce
reinforcements with fibres orientated in the warp (X), weft (Y), and
through-the-thickness (Z) directions. Specific proportions of yarns can be
arranged into each of three mutually perpendicular directions. For many
fabrics produced on conventional looms, the warp yarns undertake a dual
role. Firstly they create the (X) axis proportion, which is usually in the
principal stress direction, and secondly they form the through-the-
thickness or (Z) element. Thus for a given percentage of yarn in the (Y)
direction, increasing the (Z) proportion results in an equivalent reduction
in the (X) proportion, resulting in a loss of engineering properties in that
direction. Such reinforcements demonstrate good delamination resistance
when compared with laminated composites fabricated by the plied lay-up
method13, in addition reproducibility of preforms is more readily
achieved because the manual lay-up element is greatly reduced. […]

16
The difficulty associated with weaving multilayer fabrics on
conventional looms can increase if a multilayer shaped reinforcement is
required. An approach is therefore taken where shaped reinforcements
are produced on conventional looms by utilising the concept of initially
weaving the shaped reinforcement in a flat multilayer form, and folding
or opening to the desired shape after removal from the loom.”
1.2 Application of textile composite materials
Two examples of the application of 3D-woven carbon fibre textile composite
materials investigated at the Engineering Composites Research Centre are a
composite component of a lower leg prosthesis and a beam with T-shaped cross
section. These are presented from the perspective of illustrating the need for
structural analysis of such composite components. Due to the lack of a technique for
structural analysis of components made of these advanced materials, the design
methodology was very much based on an empirical approach. In the following
sections the design methodology is described and areas for the possible application
of structural analysis are highlighted. From these identified aspects of structural
analysis, the requirements for an analysis system can be derived.
1.2.1 Composite component of a lower leg prosthesis
Within the Northern Ireland Bioengineering Centre (NIBEC) a prosthesis for a below
knee amputee was developed. Lower-limb prostheses easily provide static structural
supports, but not dynamic functions that correspond to muscle activities that have
been lost. Therefore, good locomotion by the amputee requires a prosthesis, which
shows the same dynamic behaviour as the lost limb.
The new approach in the design is to utilise a composite material instead of
conventional engineering materials, such as steel, aluminium or titanium. The
purpose of this new design approach is to achieve improvements in terms of

17
increased convenience for the patient. Therefore, the inherent advantages of fibre
reinforced plastics were used, which are described briefly in the following
paragraphs. The use of a composite material has two main advantages5:
• Lightweight
The total weight of the prosthesis is the most important consideration from
the amputee’s perspective. The remaining muscle mass in the residual limb
defines an upper limit for the total weight of the prosthesis. Reduced weight
leads to greater mobility and less fatigue for the amputee.
• Multifunctionality
A main advantage of fibre reinforced plastics is the capacity for part
integration leading to a reduction in parts count. The same product
configuration constructed in aluminium and titanium has, in the case of lower
limb prosthesis, sometimes twice as many component parts.
The disadvantage of laminated composites is the low damage tolerance as described
in section 1.1, which can be significantly reduced by using 3D-woven textile
composites. The increase in impact strength is a very important consideration,
because people using prostheses often lead an active lifestyle (see Figure 3), which
involves activities like running, jumping or kicking. The impact load on a lower limb
prosthesis can be significant.

18
Figure 3: An athlete with similar lower leg prostheses6,*
The prosthesis consists of the following elements (see Figure 4):
• an adapter to fasten the prosthesis to the remaining part of the leg
• a connection between the fastening and the composite component
• the composite component
• the sole, also a composite
• a wedge shaped support between sole and composite component
The theme of the project with NIBEC was the analysis of the composite component.
Its behaviour is essential for the quality of the complete prosthesis.
* Aimee Mullins (USA), 200 m, Paralympics, Atlanta (USA), August 1996

19
Figure 4: Lower leg prosthesis developed at the University of Ulster
The below-knee amputee has lost part of their locomotive system not only in terms
of the static supporting structure, but also in the dynamic function of the foot-ankle
complex. The repeating element in the locomotion is the gait cycle. A complete gait
cycle is defined as the time from which the heel of one foot contacts the ground to
the next heel-contact of the same foot7. During the stance phase three characteristic
moments occur (see Figure 5), which were chosen for the calculation. These are as
follows:
• after heel-contact, when the maximum reaction force acts (1)
• at mid-stance, when the whole body weight takes place (2)
• before toe-off, at maximum push-off (3)

20
GroundReaction Force
max. push-off
body weight
Normal gaitWith stiff prosthesisWith elastic prosthesis
timeheel-contact toe-off
(1)
(2)
(3)
Figure 5: Forces during stance phase
In order to achieve a gait as close as possible to natural for the amputee, it is essential
that a sufficient amount of deformational energy is stored in the prosthesis and
released as kinetic energy during late-stance phase.
Furthermore the deflections of the prosthesis have to be within a certain range. If the
subject using the prosthesis does not show the above described behaviour, the
consequences would be that running, jumping and even walking are performed only
with difficulty and at a high energy cost to the user8.
The above-described aspects impose the following design requirements:
• The proceedings during the swing-phase determine the amount of elastic energy
to be stored in the composite component of the lower-leg prosthesis.

21
• Different forces act on the limb component during the stance phase. These forces
are responsible for the deflections, which have to be within a certain range.
Two different designs were analysed. They were made of the same lay-up to provide
the possibility to investigate the exclusive influence of the geometry of the composite
component. The first, a J-shaped design, has been already tested in practical
operation. Limitations, such as an insufficient amount of elastic energy storage,
became evident. In the case of the improved second design, an attempt was made to
overcome these problems. Firstly, by altering only the geometry of the component. A
subsequent follow-up was then to involve local stiffness tailoring to achieve an even
greater storage of elastic energy in the composite component.
The stiffness tailoring of the material was done by using I-DEAS to analyse the
effects of changes of the lay-up of the laminate and subsequently using the optimised
lay-up to translate this stiffness to a 3D-woven textile material. This approach was
necessary, as there was no design tool available to cater for this new type of material.
Additionally, it was not possible to predict any stress concentrations around holes
used to connect the different parts of the prosthesis when using 3D-woven textile
composites. This had to be done experimentally, or by observing the behaviour of the
prosthesis while in use.
1.2.2 T-sections
One of the main advantages of 3D-woven textile composites is the production of near
net shape structures as integral units directly from the loom. This advantage of 3D-
woven composites over laminated composites leads to substantially reduced labour
content and the ease of handling compared to the manually intensive lay-up process
for laminates. With the through-the-thickness reinforcement another disadvantage of
laminates is minimised if not eliminated - the typical failure mode of delamination.
Table 1 shows a comparison for a T-shaped stiffener manufactured of steel and 3D-
woven composites with respect to the weight of the parts with equal bending
stiffness.

22
steel Composite (6 layer twill based 3D-woven fabric,
carbon/epoxy) bending stiffness EI
[Nm2] 2400 2400
weight per unit length [ ]kg
m 0.50 0.32
relative weight [%]
100 64
Table 1: Comparison of weights of parts with equal stiffness
A series of 6 layer 3D-woven T-sections and a laminated control sample were
impregnated with an epoxy resin and cured at 150 °C in an autoclave at 12 bar
pressure to form a range of shaped reinforced composites. The reinforcements for
this application were designed specifically to overcome the problems of resin-rich
areas found at the web/flange interface in 6-layer structures. Interplane strength tests,
devised for this particular component type, were carried out in order to assess the
reinforcement quality. The results indicate that the type and amount of interlinking
influence the mode of failure but their relationship with interplane strength is
complex.
This interplane strength test is, in principle, a tension test where a force is applied at
both ends of the flange. The aim of this test is to determine the reinforcement (i.e. the
weave structure) quality in the cleavage area (see Figure 6) at the web/flange
interface, by measuring the initial failure load, the peak load and by recording the
force/deflection curve. Test results are therefore only valid if failure occurs along the
mid-plane of the reinforcement in the web.
This test was devised in order to assess the quality of a particular feature of the part,
which is associated with the manufacturing technique. However there is also the need
for other tests (e.g. bending or shear) approximating more closely to the in-service
loading.

23
F
F
cleavage area
clamps
10 mm
Figure 6: Test set-up for interplane testing
Test specimens with dimensions of (50 mm length) × (50 mm width) × (50 mm
height) were prepared for interplane strength testing. The specimens were clamped
over the entire width and were aligned carefully so that the web was horizontal, as
illustrated in Figure 6. The loading speed was set relatively small to 1 mm/min, as
this is a quasi-static test9. Research on the tensile testing of 3D textile composites has
been undertaken by NASA10,11,12. Although this work was concerned with plaque
type specimen, it gave a general indication of the levels of loading speed and
specimen dimensions. Tensile testing of composite T-pieces manufactured with 3D-
woven glass fibres was also conducted in the Engineering Composites Research
Centre at the University of Ulster13,14.
Figure 7 illustrates a typical force/deflection curve for an interplane test. In this
figure the initial failure load is the force when the first crack occurs and the peak
load is the highest force reached after the first crack has been initiated.