Volume V: Textile Composites and Characterisation (23.4 MB) - ICCM
956
ELEVENTH INTERNATIONAL CONFERENCE ON COMPOSITE MATERIALS Gold Coast, Queensland, Australia 14th - 18th July 1997 PROCEEDINGS VOLUME V TEXTILE COMPOSITES AND CHARACTERISATION Editor Murray L. Scott AUSTRALIAN COMPOSITE STRUCTURES SOCIETY WOODHEAD PUBLISHING LIMITED
Transcript of Volume V: Textile Composites and Characterisation (23.4 MB) - ICCM

ELEVENTH INTERNATIONAL CONFERENCEON COMPOSITE MATERIALS
Gold Coast, Queensland, Australia14th - 18th July 1997
PROCEEDINGS
VOLUME V
TEXTILE COMPOSITES ANDCHARACTERISATION
EditorMurray L. Scott
AUSTRALIAN COMPOSITE STRUCTURES SOCIETYWOODHEAD PUBLISHING LIMITED
xiii
TABLE OF CONTENTS
Textile CompositesThe Effect of Strain Gage Size on Measurement Errors in Textile CompositeMaterialsEric J. Lang, Tsu-Wei Chou
1
Compression Strength of Textile CompositesKunigal N. Shivakumar
9
Preforms for Composite Parts Made by Tailored Fibre PlacementD. Feltin, K. Gliesche
17
Effect of Weave Structure on Mode I Interlaminar Fracture Behavior of PlainGlass Woven Fabric Composites: Report of a Round Robin Test IIH. Saidpour, M. Sezen, Y.J. Dong, H.S. Yang, Y.L. Bai, T.X. Mao, C. Bathias, P.Krawczak, R. Bequignat, J. Pabiot, S. Pinter, G. Banhegyl, J.K. Kim, M.L. Sham, I.Verpoest, H. Hamada, Y. Hirai, K. Fujihara, C.Y. Yue, K. Padmanabhan, Y. Suzuki,T. Tanimoto, K. Schulte, J.K. Karger-Kocsis, W.J. Cantwell, R. Zulkifli, L. Ye, A.Lowe, S.V. Hoa, V.V. Smirnov, L.T. Drzal, W.R. Broughton, J.J. Lesko
27
Tensile Behaviour and Damage Progression in Multilayer Woven Glass/VinylEster CompositesP. Callus, F. Coman, K.H. Leong, I. Herszberg, M. Bannister
36
Interlaminar Delamination Toughness and Strength of 3-D OrthogonalInterlocked Fabric CompositeYasuyo Tanzawa, Naoyuki Watanabe, Takashi Ishikawa
47
Damage Development in Plain Weave GFRPC.I.C. Manger, S.L. Ogin, P.A. Smith, R.P. Greaves
58
A Flexible 3D FEA Modelling Approach for Predicting the MechanicalProperties of Plain Weave Unit CellP. Tan, L. Tong, G.P. Steven
67
Optimisation of In-Plane and Bending Properties of Woven Fabric LaminateConfigurationsR.W. Stewart, V.E. Verijenko, S. Adali
77
Developments in Multi-Axial Weaving for Advanced Composite MaterialsJ.I. Curiskis, A. Durie, A. Nicolaidis, I. Herszberg
86
Creep and Creep Rupture of Stitched CompositesFeiyi Pang, C.H. Wang, R.G. Bathgate
97
Modeling of Discrete Radial Reinforcement in Curved Polymer MatrixComposite LaminatesMing Y. He, Brian N. Cox, Keith T. Kedward
107
Interlaminar Fracture Properties of Stitched Fibreglass CompositesA.P. Mouritz, L.K. Jain
116
Quality Assessment During Stitching of Reinforcing Textiles for CompositesK-U. Moll, B. Wulfhorst
128
Open Hole Fatigue of Stitched and Unstitched Carbon/Epoxy LaminatesI. Herszberg, A. Loh, M.K. Bannister, H.G.S.J. Thuis
138
xiv
The Residual Compression Strength of Stitched and Unstitched Plain-WeaveCarbon/Epoxy Laminates After Impact and Hygrothermal CyclingB. Qi, I. Herszberg, A.A. Baker, M.K. Bannister
149
Simulation of the Shaping of Woven FabricsRoger Blanlot
160
Numerical Modelling of Energy Absorption in Woven CompositesLouis Dagba, Christian Wielgosz
171
Analysis of Shear Deformation and Strength at Fiber Crossing Part inTextile CompositesAsami Nakai, Hiroyuki Hamada, Nobuo Takeda
179
Closed Form Predictions of Macroscopic Thermomechanical Properties ofOrthogonal 3-D Woven Fabric CompositesTakashi Ishikawa, Naoyuki Watanabe, Kazuhiro Bansaku, Yoshinobu Ono
189
The Effects of Deforming Knitted Glass Preforms on the Tensile Properties ofResultant Composite LaminatesK.H. Leong, M. Nyugen, I. Herszberg
201
Optimising the Mechanical Properties of 3D-Knitted Sandwich StructuresDirk Philips, Ignaas Verpoest, Joris Van Raemdonck
211
Notched Strength of Knitted Fabric CompositesJ. de Haan, K. Kameo, A. Nakai, A. Fujita, J. Mayer, E. Wintermantel, H. Hamada
219
New Low Cost Textile Preforms and Short Cycle Processing Techniques forThermoplastic CompositesSofie Baeten, Ignaas Verpoest, Hauke Stumpf, Karl Schulte, Walter Zäh,Edith Mäder, Toni Pisanikovski, Carl-Håkan Andersson, Kjell Eng
227
Experimental Analysis of Fabric Deformation Mechanisms During PreformManufactureA.C. Long, C.D. Rudd, M. Blagdon, M.S. Johnson
238
New Textile Preforms and Processing Concepts for the Manufacture ofLow-Cost Thermoplastic Composite ComponentsH. Stumpf, T. Otto, K. Schulte
249
The Effect of Weft Binder Path Length on the Architecture of Multi-LayerWoven Carbon PreformsB. Lee, I. Herszberg, M.K. Bannister, J.I. Curiskis
260
The Design Principle and Weaving Technology of Thread-Linked Box-BeamPreformYang Caiyun, Li Wenzhang, Guo Wenping
270
Performance Characterization of Polymeric Composite Implant Rod Subjectedto TorsionKh. G. Schmitt-Thomas, Zhen-Guo Yang, T. Hiermer
277
The Manufacture and Testing of 3D Multilayer Woven I-BeamsG.P. Kamp, M.K. Bannister, I. Herszberg, A. Nicolaidis
287
Stiffness and Strength Properties in 3-D Braided Structural CompositesA.S.D. Wang, Amrita Kumar
297
Prediction of the Compression-After-Impact Strength of 2-D BraidedCompositesPaul J. Falzon, Israel Herszberg
307
A Study on the Microstructure of Three-Dimensional BraidsL. Chen, X. M. Tao, C.L. Choy
317
xv
The Effect of Architecture on the Mechanical Properties of Knitted CompositesK.O. Anwar, P.J. Callus, K.H. Leong, J.I. Curiskis, I. Herszberg
328
Weft-Knitted Glass-Fibre Preforms for Composite MaterialsS. Savci, J. Curiskis
338
Fabrication of Large Scale Braided Composite with I-Shaped StructureAsami Nakai, Mikio Masui, Hiroyuki Hamada
348
Mechanical Model of 3-Dimensional Multi-Step Braided CompositesJoon-Hyung Byun
356
Towards an Integrated Processing Model for a Co-mingled ThermoplasticCompositeT. A. Cain, M. D. Wakeman, R. Brooks, A.C. Long, C.D. Rudd
366
A Theoretical Framework for the Consideration of Damage Entities in 3DWoven Composite StructuresS. John, F. Coman, I. Herszberg, M. Bannister
377
Effect of Matrix Rivetting in Woven Fabric Holes to Interlaminar FractureToughness of Composite LaminatesF. Gao, M. Yao
384
Structural Integrity of Discontinuous Blade Stiffened Braided and WovenComposite PanelsKunigal Shivakumar, Mannur Sundaresan, Peter Shyprykevich,Vishnu S. Avva, Vivek Ramanujapuram
391
Environmental EffectsInfluence of Moisture Absorption on Hot/Wet Compressive Strength ofT800H/PMR-15 Carbon/Polyimide CompositeYasumasa Hamaguchi, Toshiyuki Shimokawa, Hisaya Katoh
402
Strength Reduction of GRP Composites Exposed to High Temperature MarineEnvironmentsJ.M. Hale, A.G. Gibson
411
The Effect of Thermoplastic Additives and Carbon Fibres on the ThermallyEnhanced Moisture Absorption by Epoxy ResinsJames A. Hough, Frank R. Jones
421
Modelling of Environmentally Induced Damage in Polymer Matrix CompositesBethany J. Foch, Hugh L. McManus
432
Experimental Studies on Composite Bonded JointsSteven L. Donaldson, Ajit K. Roy
444
The Effect of Environment on the Damage Tolerance of Glass and Carbon FibreReinforced Epoxy LaminatesG.A. Bibo, P.J. Hogg, M.L. Kay
456
Mechanical Behaviour of Carbon/Modified Bismaleimide Composites atElevated TemperaturesX.J. Xian, F.G. Shin, C.L. Choy
466
Evaluation of Ultimate Strength of High Temperature Composite Materials forSST Structures at Elevated Temperatures and After Thermal AgingToshiyuki Shimokawa, Yasumasa Hamaguchi, Yoshiaki Kakuta, Hisaya Katoh,Tomio Sanda, Hiroshi Mizuno, Yasuhiro Toi
474

xvi
The Effect of Moisture on the Interfacial Strength of Graphite-Epoxy andE-Glass-Epoxy CompositesW.L. Bradley, C.A. Wood, B.A. Pratt, C.S. Chatawanich
483
Durability of Fibre Reinforced Composite Materials After Twenty Years ofExposure to WeatheringA. Yoosefinejad, P.J. Hogg
493
Statistical Analysis of Water Absorption in Composite MaterialsB. Hu, X.J. Gong, J.C. Kneip, G. Verchery
499
Durability of Isothermally Aged Polymer Matrix CompositesDavid Harmon
507
Mechanical PropertiesThe Mechanical Testing of Continuous Fibre Reinforced Thermoplastic PipesB.J. Chapman, J.T. Evans, S.R. Frost, A.G. Gibson
517
Quality Control of Glass-fibre Reinforced Plastic Long Tubular MembersCarlo A. Castiglioni, Andrea Spessa
527
Micromechanical Modelling of the Damage Initiation and the CompetitionBetween Different Mechanisms of ±55° Filament-Wound Glass-Fiber/Epoxy-Resin TubesJinbo Bai, Gengkai Hu, Philippe Bompard
540
Effect of Stacking Sequence on Strength and Failure Process in Quasi-IsotropicCFRP Laminates with Toughened Interlaminar LayersShinji Ogihara, Nobuo Takeda, Satoshi Kobayashi, Akira Kobayashi
552
Experimental Micro-Mechanical Characterization of Interlaminar ShearDeformation in Interlaminar-Toughened CFRP LaminatesNobuo Takeda, Shinji Ogihara
562
Accurate Estimation of the Elastic Properties of Porous FibersW. Richards Thissell, Anna K. Zurek, Frank Addessio
571
Prediction of the Large Strain Mechanical Behaviour of Heterogeneous PolymerSystems by a Multi-Level ApproachR.J.M. Smit, W.A.M. Brekelmans, H.E.H. Meijer
585
Calculation of Effective Moduli of Viscoelastic Composites with PeriodicMicrostructures Using a Homogenization MethodYeong-Moo Yi, Sang-Hoon Park, Sung-Kie Youn
595
Behaviour of Delaminated Beam-Plates Under Combined Thermal andMechanical LoadsKosuke Hayakawa, Takahira Aoki
604
Mechanical Properties of 3-D Carbon/Bismaleimide Heat Resistant CompositesIppei Susuki, Masahiro Shinya, Yosiharu Yasui
614
Evaluation of the Elastic Properties of Fiber Reinforced Composites by theVarying-Span MethodS. Javad Jalali, Farid Taheri
625
Experimental Behavior of Graphite-Epoxy Panels with Holes Under BiaxialCompression and Shear LoadsGiulio Romeo, Giacomo Frulla
635

xvii
Influence of Cooling Rate on Morphological and Mechanical Properties ofThermoplastic CompositesHelen C.Y. Cartledge, Caroline A. Baillie, Yiu Wing Mai
645
Analysis of Interlaminar Stresses in an Internally-Dropped Ply RegionJaewook Rhim, Anthony J. Vizzini
652
Stress Transfer Mechanics for Multiple Ply Laminates for Axial Loading andBendingL.N. McCartney, C. Pierse
662
Comparison of Failure Prediction Methods for Glass/Epoxy and Carbon/EpoxyLaminates Under Biaxial StressM.J. Hinton, P.D. Soden, A.S. Kaddour
672
Compressive Failure Under Flexural Loading: Effects of Specimen Size, StrainGradient and Fibre WavinessMichael R. Wisnom
683
High Strain Rate Mechanical Properties of a Torospherical Shell Composed ofIM7/E7T1-2 Graphite Epoxy CompositeAlexander T. Dee, Jack R. Vinson, George Leon
693
Micromechanical Approach to the Strength of Unidirectional CompositesAtsushi Wada, Hiroshi Fukuda
704
A Phenomenological-Mechanistic Model for Random Fiber Composite,Stiffness and Strength PredictionYi Zhang, D.L. Sikarskie
711
Determining the Inter-Ply and Intra-Ply Viscosities of Uni-axial ThermoplasticComposites by the Roller Bend MethodT.A. Martin, I.F. Collins
721
Thermal Shock Resistance of Hybrid Particulate-Filled Epoxy CompositesMasatoshi Kubouchi, Tetsuya Handa, Ken Tsuda, Toshio Shimizu,Mitsuhiko Koyama
734
Stiffness Properties of Three Dimensionally (3-D) Reinforced Glass FabricsProduced by Needle-FeltingM. Veidt
742
Mechanical Response of Particle-Filled Polyethylene on Electrically GeneratedThermal Shock PulseJoachim Glatz-Reichenbach, Jørgen Skindhøj, Ralf Strümpler
749
Micromechanics for Continuous Fiber Reinforced Composites via Fiber Sub-StructuringSubodh K. Mital, Theo G. Keith Jr., Pappu L.N. Murthy
759
The Effect of Fibre-Bundling on the Mechanical Properties of a Short-FibreCompositeDavid R. Mulligan, Stephen L. Ogin, Paul A. Smith, Gary M. Wells,Christopher M. Worrall
768
Compressive Behaviors of Multiply Delaminated Rectangular Composite PlatesHiroshi Suemasu, Tatsuya Kumagai
776
Behaviour of +55/-55 Angle Ply Laminates Under External Pressure andAxial CompressionA.S. Kaddour, P.D. Soden, M.J. Hinton
786
Off-Axis Fiber Orientation High Strain Rate Compression Testing ofK-49/3501-6 Kevlar/Epoxy CompositesEric Preissner, Eyassu Woldesenbet, Jack R. Vinson
797
xviii
Analytical Model for Prediction of Microbuckling Initiation in CompositeLaminatesPierre J. Berbinau, Ernest G. Wolff
807
Finite Element Modeling of the High Strain Rate Behavior of S-2 Glass/VinylEster Composites Under Compressive LoadingHassan Mahfuz, Bazle A. Gama, Roshan P. Raines, Shaik Jeelani
818
Damage Development in Filled Viscoelastic Matrix CompositesA. Meddad, B. Fisa
830
Modelling of the Pushing Installation of Optical Fiber Cable in Urban AreaHabiba Boulharts, Jean-Louis Billoet, Jean Le Rouzic, Olivier Polit, Alain Pecot,Jean-Luc Campion
841
Simulation of Flexure in Off-Axis Three-Point Bending Test by a Finite-ElementCodeA.D. Resnyansky
852
Test MethodsFracture Mechanical Analysis of Pull-Out and Fragmentation TestsChristian Marotzke, Andreas Hampe
863
Finite Element Analysis of Test Methods for the Determination of Through-Thickness Properties in Tension, Compression and Shear of Long FibreReinforced CompositesS. Mespoulet, J.M. Hodgkinson, F.L. Matthews, D. Hitchings, P. Robinson
873
Loop Test for the Strength of MonofilamentsHiroshi Fukuda, Masayuki Yakushiji, Atsushi Wada
886
A Critical Evaluation of Through-Thickness Test MethodsWilliam R. Broughton
894
New Test Methods for Characterising Skin-Core Debonding in CompositeSandwich StructuresW.J. Cantwell, R. Scudamore, P. Davies, J.-B. Ferrer
905
The Measurement of Mode III Fracture Toughness in Thick CompositeLaminates Using Strain GagesW.C. Liao, R.L. Tu
914
Comparison of Tensile Properties Between Split Disk Test and TensileCoupon TestSung-Ho Yoon, Chun-Gon Kim
924
Approximate Stress Analysis of the Iosipescu Shear SpecimenJames M. Whitney
932
Proceedings of ICCM–11, Gold Coast, Australia, 14th-18th July 1997
V - 1
THE EFFECT OF STRAIN GAGE SIZE ONMEASUREMENT ERRORS IN TEXTILE COMPOSITE
MATERIALS
Eric J. Lang1 and Tsu-Wei Chou2
1 The Why Not Corp., 743 W. Sparrow Rd., Springfield, OH 45502, USA2 Center for Composite Materials, and Department of Mechanical Engineering, University of
Delaware, Newark, DE 19716 USA
SUMMARY: The heterogeneous nature of textile composites on the microstructural scaleleads to variation in the local strain field within the unit cell. This variation can result ininaccurate measurement of the average global strain when using strain gages of insufficientsize. A statistical model for sensor error is presented which leads to expressions for sensorvariance. The model includes the effects of unit cell size, gage length, gage width,microstructural defects and irregularities, and instrument error. The proposed model isverified experimentally using a plain woven graphite-epoxy composite material and straingages of various lengths. The experimental results are compared with analytical predictions.A set of guidelines for the use of strain gages on textile composites has been developed.
KEYWORDS: textile composites, statistics, microstructure mechanical properties, straingage
INTRODUCTION
Consider the problem of determining the average macroscopic strains on the surface of aheterogeneous material using a relatively compact strain gage. This problem arises, forinstance, when determining the bulk material properties of a textile composite material bymechanical testing.
The area of the strain gage is smaller than the macroscopic area and therefore, if the straindistribution is not constant, the sensor output and the macroscopic strain may not be inagreement. The gage averages the strain over the gage section. If the gage is located in aregion of below average strain, the sensor output will be lower than the average macroscopicstrain. Conversely, if the gage is located in a region of above average strain, the sensor outputwill be higher than the average macroscopic strain. In general, it is not known whether astrain gage is in a region of above average strain, average strain, or below average strain.Thus, the sensor output tends to be a random variable with some probability distributionaround the true macroscopic strain. Ideally, this probability distribution is closely centeredaround the actual macroscopic strain value. In practice, the distribution depends on factorssuch as gage size and unit cell size.
A non-uniform strain distribution may be caused by random defects or material irregularitiesintroduced during manufacturing. Alternatively, the heterogeneous microstructure of the

Volume V: Textile Composites and Characterisation
V - 2
material can cause variation in the local strain field. This microstructurally induced strainvariation has been predicted analytically and measured experimentally using MoiréInterferometry methods[1]. The magnitude of the strain variation is predicted to be a functionof the relative stiffnesses of the fiber and matrix material as well as the fiber architecture. Thegreater the difference in stiffness, the larger the strain variation.
Moiré interferometry also shows distinct variation in the strain field due to the microstructurein various textile composite materials. While these variations may not be significant if thetows are relatively small in comparison to the gage size, when the tows are large, the variationis likely to lead to measurement errors. Some textile composite materials such as through-the-thickness, multi-layer weaves and 3-dimensional braids [2-4] have quite large unit cells -- insome cases exceeding one or more inches.
The purpose of this paper is to investigate the effect strain gage size has on the accuracy ofstrain measurements made on periodically heterogeneous materials. A statistical model forsensor output including the effects of unit cell size, strain variation within the unit cell, gagelength, gage width, material defects and irregularities, and instrument error is proposed. Themodel is verified experimentally using a plain weave graphite-polyester composite. Thedetails of the theoretical analysis and experimental verification can be found in Refs. [5, 6].
DEFINITIONS AND PROBLEM FORMULATION
Let us decompose the strain ε ij (x,y) at a point on the surface of a heterogeneous material
with a periodically repeated microstructure or unit cell into a constant component ε ij which
represents the macroscopic average strain, a random component ε ijd (x,y) which represents the
effects of material defects and irregularities, and a periodic component ε iju(x,y) which
represents the local strain variation within the unit cell caused by the textile microstructure.The actual strain at a point is the sum of these three components, or
ε ij (x, y) = ε ij + ε ijd (x, y) + ε ij
u ( x, y)(1)
with
ε ij ≡ 1A
εij (x, y)dAA∫∫ E ε ijd (x, y)[ ]≡ 0 εu(x,y)dA
Au
∫∫ ≡ 0 (2)
where A is some macroscopic area, E[ ] denotes the statistical expectation[7], and Au is thearea of a unit cell.
Each component of the unit cell strain is, in general, a function of all the components ofglobal average strain as well as position within the unit cell. Assuming linear elasticity, theeffects on the unit cell strain of each component of macroscopic strain can be superposed.The unit cell strains are related to the global average strains by an equation of the form
ε iju(x,y) = Fijkl (x,y)ε kl (3)
Symmetry of the strain tensor requires,Fijkl = Fjikl = Fijlk (4)
Proceedings of ICCM–11, Gold Coast, Australia, 14th-18th July 1997
V - 3
which reduces the maximum number of independent constants in Fijkl to thirty-six. It should
be remembered that the components of Fijkl are functions of position in the unit cell and have
periodicity conditions. For simplicity, we will consider the case of rectangular unit cells in
which Fijkl and ε iju(x,y) must satisfy the following periodicity conditions
Fijkl (x* +mλx , y* +nλ y) = Fijkl (x*, y*) m= 1,2,....
n =1, 2,.. ..
(5)
ε iju(x * +mλ x ,y * +nλy) = ε ij
u(x*, y*) m = 1,2,....
n =1,2,.. ..
(6)
where λ x and λy are the lengths of the unit cell in the x and y directions and (x*, y*) is any
point in the unit cell. Similar periodicity conditions can be derived for unit cells of differentshapes.
Strain gages are usually placed on the surface of a material where there are only three non-zero strains. Thus, in practical situations, the nontrivial components of Eqn 3 can berepresented by
ε xxu
εyyu
εxyu
=
f11 f12 f13
f 21 f 22 f 23
f 31 f 32 f33
ε xx
ε yy
ε xy
or ε u = F[ ] ε (7)
Similarly, the strain at a point due to material defects is given by
ε xxd
εyyd
εxyd
=
g11 g12 g13
g21 g22 g23
g31 g32 g33
ε xx
ε yy
ε xy
or ε d = G[ ] ε (8)
In the previous equations, we use an upper case letter to denote a matrix and a lower caseletter to denote the elements of the matrix. The tensor Fijkl should not be confused with the
matrix F .
The components of G are assumed to be random variables, independent of each other andindependent from one point to the next in space. The expected value for each component iszero, and, for the purposes of this analysis, the variance is assumed to be the same for all
components and all positions in the unit cell. We will denote this variance by σδ2 and it is
defined by,
σδ2 ≡ E
1
Agij
2(x,y)dAA∫∫
(9)
SENSOR OUTPUT EQUATIONS
On the surface of a material, there is the possibility of three independent strain components.However, a strain gage gives only one measurement output. Most gages are designed to havevery low sensitivities to transverse and shearing strains and the contribution of these strains tothe gage output is neglected in the following analysis. The output of the sensor depends on
Volume V: Textile Composites and Characterisation
V - 4
the orientation of the sensor relative to the global coordinates, and the strain in the globalcoordinates.
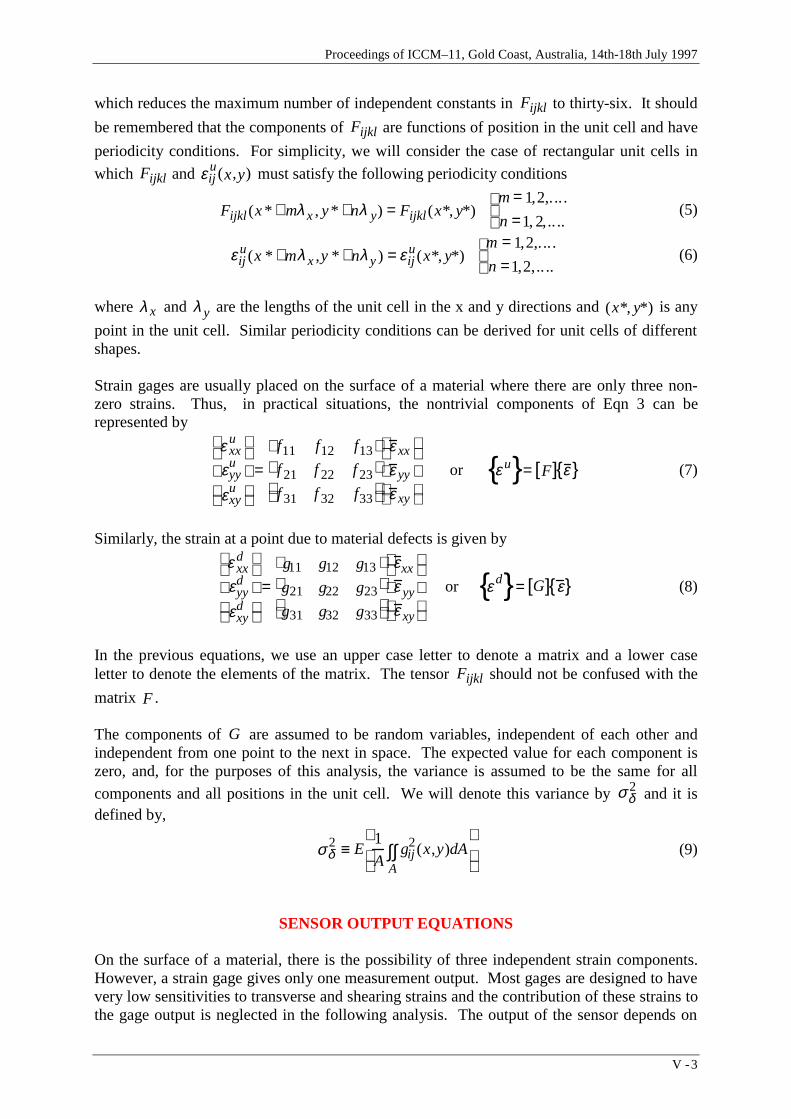
Figure 1 shows the coordinate system used to describe the position and orientation of thestrain gage. Primes are used to denote the gage coordinates. The lower left-hand corner ofthe gage is located at a position (X,Y) and the sensing direction of the gage is rotated in thecounter-clockwise direction to an angle φ relative to the global coordinate system x-y.
Following Eqn 1, the strain in the direction of the strain gage is
Foil strain gages currently in common usage consist of a single thin strip of metal whichtraverses back and forth across the gage area. In this analysis, we will treat the strain gages asareal sensors. Areal sensor measure the average strain over an area. With this assumption,the results of the present analysis can also apply to strain gages made from piezoelectricmaterials.[8]
In most cases a strain gage is positioned without any knowledge of its location relative to theunderlying unit cell. Therefore, the variables X and Y shown in Fig. 1 are assumed to beuniformly distributed random variables with the following probability density functions:
X
Y
x
y
φ
L x L yx'
y'
Fig. 1: Coordinate system detailing the position of the strain gage

Proceedings of ICCM–11, Gold Coast, Australia, 14th-18th July 1997
V - 5
The strain at a point (x,y) can be written as a function of (x', y', X, Y) by making thesubstitution
where Ag is the area of the gage.
Let us define the apparent strain, which is the strain actually recorded by the data acquisitionsystem, as
where m is the actual average strain on the gage section, and I is the random errorintroduced by all other sources such as gage defects, instrument errors (calibration, gain, gagefactor, etc.), and interference. To detect the error components we must analyze the variationin gage output. Since the errors are statistically independent, the variance in the apparentstrain is the sum of three variances :
σa2 = σu
2 + σd2 + ε g
2σI2 (17)
where σa2 is the apparent or measured sensor output variance, σu
2 is the variance due to the
microstructure, σd2 is the variance due to the material defects, and ε g
2σI2 is the variance due
to instrument error.
A SPECIFIC EXAMPLE
In this section some assumptions are made about the relationship between unit cell strain and
macroscopic strain which allow us to find closed form expressions for σu2. We will consider
a balanced plain weave material. The width, spacing, and density of the yarns are the same inboth the warp and weft directions. The only geometric parameter important in this study isthe microstructure wave length λ , which is the distance it takes for the microstructure torepeat itself in either the warp or weft direction.

Volume V: Textile Composites and Characterisation
V - 6
EXPERIMENTAL METHODS
In order to validate the theory developed in the previous sections, a series of experiments wasperformed. Coupons with multiple strain gages were tested in uniaxial tension. The variancein gage output was calculated for each coupon. These observed variances are used todetermine which components of the sensor error model are significant.
A graphite-polyester composite material was chosen for the test material in order to maximizethe ratio of the stiffness of the reinforcement to the stiffness of the matrix, therebymaximizing the magnitude of the microstructurally induced strain perturbations. A plain
01
23 3
21
0
α β
σu
ε g
Fig. 2 σu/εg vs function of gage dimensions α and β

Proceedings of ICCM–11, Gold Coast, Australia, 14th-18th July 1997
V - 7
weave was the textile form chosen since it has the smallest unit cell size for a given yarn sizeand thereby minimizes the maximum required gage size. The chosen preform material had 8warp yarns per 25.4 mm (1") and 8 weft yarns per 25.4 mm (1") giving it microstructurerepeat period, λ, of 6.35 mm (0.25"). A four layer laminate was made.
After cure, the material was end-tabbed and cut into 25.4 mm (1") wide and 508 mm (20")long coupons using a diamond tipped blade on a polishing table. This technique allowedaccurate parallel cuts to be made. The multiple strain gages were mounted on both sides ofeight coupons. The largest gage had a gage length of 12.7 mm (0.5") and an overall length of20.3 mm (0.8"). Therefore, the gages were placed 25.4 mm (1") apart nominally. The set ofgages was centered in the gage section of the coupon. However, in order to properlyrandomize the test, a random offset in the range of 0.00-6.35 mm (0.00-0.25") was added tothe 25.4 mm (1") nominal starting position of the gages. After the random off-sets weregenerated, the clearance gap between adjacent gages was checked to make sure that twoadjacent gages would not overlap. Chance would have it that none of the gages overlapped.Thus, the starting position of each gage was at a randomly assigned position along the tow.
All coupons except Coupon 6 had 7 gages on each side. On one side (6A) of Coupon 6, tengap-centered gages were mounted while on the other side (6B), ten tow-centered gages weremounted. The nominal length and width of gages for Coupon 6B are 1.575 mm (0.062") and3.048 mm (0.120"), respectively.
The coupons were loaded to a nominal 0.15 percent strain and the output of each gage wasrecorded. A plot of gage reading versus average gage reading for Coupon 6B are shown inFig. 3. Notice how widely dispersed the readings are for Coupon 6B, which has small tow-centered gages, and thus microstructurally induced variation. The results dramaticallydemonstrate the importance of considering gage size relative to unit cell size.
0
500
1000
1500
2000
0 500 1000 1500Average Strain (µε)
Str
ain
Gag
e O
uput
(µ
ε) gage length = 0.062"Tow centered gages
Fig. 3: Gage output vs average - Coupon 6B

Volume V: Textile Composites and Characterisation
V - 8
CONCLUSIONS
The variation in strain caused by the microstructure of a textile composite can have asignificant effect on the output of strain gages. If gages of the proper size are used, the effectof microstructurally induced variation is essentially eliminated. However, if the gages are toosmall the measurements can be inaccurate. In fact, with very small gages and compositesmade of a polymer matrix and a textile preform consisting of a high modulus fiber such asgraphite, the magnitude of the error is so large that the measurements are almost worthless.Thus, even though strain gages are usually idealized as "point sensors", their distributednature can play an important role with regard to their accuracy. A set of guidelines for the useof strain gages on textile materials has been presented in Refs. [5, 6].
REFERENCES
1. Post, D., Han, B. and Ifju, P., "Textile Composites," in High Sensitivity Moire -Experimental Analysis for Mechanics and Materials, Springer-Verlag, New York,1994, pp. 313-328.
2. Byun, J. H. and Chou, T. W., "Modelling and Characterization of Textile StructuralComposites: A Review," J. Strain Analysis, Vol. 24, No. 4, 1989, pp. 253-262.
3. Byun, J. H. and Chou, T. W., "Processing-Microstructural Relationships of 2-Step ands4-Step Braided Composites," Comp. Sci. Tech., Vol. 56, No. 3, 1996, pp. 235-251.
4. Chou, T. W., Microstructure Design of Fiber Composites, Cambridge University Press,Cambridge, UK, 1992.
5. Lang, E. J., Intelligent Textile Composite Materials Containing Lineal Strain Sensors,Ph.D. dissertation, University of Delaware, Newark, Delaware, 1996.
6. Lang, E. J. and Chou, T. W., "The Effect of Strain Gage Size on Measurement Errors inTextile Composite Materials," Comp. Sci. Tech., submitted for publication.
7. Montgomery, D. C., Design and Analysis of Experiments, Third ed., John Wiley &Sons, New York, 1991.
8. Tsou, H. S. and Hollkamp, J. J., "Collocated Independent Modal Control with Self-Sensing Orthogonal Piezoelectric Actuators" - Paper AIAA-94-1737-CP, AIAA/ASMEAdaptive Structures Forum, Hilton Head, SC, AIAA, 1994.
ACKNOWLEDGMENTS
This work was supported by the U. S. Army Research Office under the University ResearchInitiative program at the University of Delaware. We also thank Teddy Yong of the ImperialCollege, UK for his assistance with the experimental work.

Proceedings of ICCM–11, Gold Coast, Australia, 14th-18th July 1997
V - 9
COMPRESSION STRENGTH OF TEXTILECOMPOSITES
Kunigal N. Shivakumar
Center for Composite Materials Research, Department of Mechanical EngineeringNorth Carolina A&T State University, Greensboro, NC 27411, USA
SUMMARY: Compression strengths of 3-D braided, 3-D orthogonal woven, and 3-D braidedwith pultruded rods composites were measured. The average strength of braided, woven, andbraided with pultruded rod composites was 262.7, 373.6, and 268.3 MPa, respectively. Thedata scatter was reasonable for woven and braided with pultruded rod composites but it waslarge (about ±17%) for 3-D braided composites. Micrographic studies concluded that thenatural waviness of fiber tows in textile composites lead to buckling and shear kinkingfracture of fibers. The tow collapse model, which incorporates this phenomenon, accuratelypredicted the compression strength of all three textile preform composites. The compressionstrength was found to be strongly dependent on the axial tow misalignment angle. The use ofpultruded rods in place of axial braider tows reduced the manufacture process induced towmisalignment and hence increased the compression strength of braided composites.
KEYWORDS: textile preform composites, compression strength, microbuckling, towcollapse model, braided composite, woven composite, pultruded rod
INTRODUCTION
Advances have been made in laminated composite materials to build structures that arelighter, stiffer, and stronger than their metallic counterparts. Further developments are beingin reducing the manufacturing cost, sometimes at the expense of performance. Textilepreform composites are one such development. The interlocked fiber architecture increasesthe delamination resistance of the composites, but the natural waviness of fibers cansignificantly reduce its compression strength. Some innovative ways of selectivelyreinforcing composite structural components have been experimented in helicopter industries.However more studies are needed to improve the compression properties of textile preformcomposites. In addition, analytical compression strength models would help in understandingthe influence of various parameters that contribute to the strength and developing innovativeprocessing and fabrication techniques to improve the strength. In this direction, Shivakumarand Emehal[1,2] developed a simple compression strength model, referred to as the “towcollapse model” for multiaxial laminates and textile preform composites. This model is anextension of unidirectional fiber microbuckling (or kinking) models of Argon’s[3],Budiansky[4], and Fleck and Budiansky[5]. The objective of this paper is to verify the towcollapse model through experimentation on 3-D triaxial braided and woven composites.Then, evaluate the use of pultruded axial rods to enhance the compression strength of textilepreform composites.

Volume V: Textile Composites and Characterisation
V - 10
MATERIAL SYSTEM
The textile preform composite panels were made of BASF G30-500, 6k graphite fibers andDow Chemicals’ Tactix 123 resin. Three types of textile architecture were used, namely, 3-Dbraid, 3-D orthogonal weave, and 3-D braid with pultruded rods (referred to as braid withpultruded rods). In the third case, the axial tows were replaced by pultruded rods, which arestraight like an arrow. Fabric architecture is designated by the orientation of the fiber towsabout the load axis. Braids are represented by 0/±β, where β is the braid angle and the weaveis represented by 0/90/90. The 0 deg represent the axial direction and the two 90 degrepresents the two orthogonal axis on the plane normal to the weaving direction. Flat panelsof 300x300 mm were fabricated using the resin transfer molding process. Specimens of125x19 mm and 5.5 mm thickness with 25 mm gage length were extracted for compressiontests. Table 1 lists preform architecture and the fiber volume fraction (Vf) of the specimens.
Table1 1: Measured and calculated compression strength of textile preform composites.
Compression strength, MPaFiber Test data Tow collapse model
volume fraction
UncorrectedCorrected for SCF
Braids 6o/±17o 7o/±17o 8o/±17o
B1 0.45 218.6 242.6 311.9 282.5 260.8B2 0.33 235.1 261.0 232.8 211.0 194.6B3 0.35 277.2 307.7 245.4 222.4 205.2B4 0.41 215.8 239.5 283.2 256.6 236.8
Average 0.38 236.7 262.7 268.3 243.1 224.3
Weaves 3o/±90o 4o/±90o 5o/±90o
W1 0.43 367.1 414.9 482.2 374.2 309.6W2 0.46 396.7 448.2 521.9 405.0 335.1W3 0.42 408.3 461.4 473.2 367.2 303.9W4 0.44 322.2 364.1 500.4 388.2 321.3
Average 0.44 373.6 422.1 494.4 383.7 317.5
Braids with pultruded rods 2o/±37o 3o/±37o 4o/±37o
PR2 0.25 242.4 269.1 381.2 266.1 208.7PR3 0.35 249.5 276.9 548.6 382.9 300.3PR4 0.25 244.2 271.1 389.0 271.5 212.9PR5 0.26 230.7 256.1 409.1 285.6 223.9
Average 0.28 241.7 268.3 432.0 301.5 236.5
Note that the axial fiber orientation of composites was different for different types of textilearchitectures. Axial fiber tow orientations ranged from 6-8 deg for 3-D braids, 3-5 deg forweaves, and 2-4 for braid with pultruded rods. Note that the pultruded rod's panel wasfabricated with low lateral pressure so that the rods are not broken during the fabrication.This resulted in a low fiber volume fraction (average Vf =0.28).

Proceedings of ICCM–11, Gold Coast, Australia, 14th-18th July 1997
V - 11
TOW COLLAPSE MODEL
The tow collapse analysis[1,2 is an extension of microbuckling analysis of Argon[3],Budiansky[4], and Fleck and Budiansky[5] for unidirectional composites. Because of naturalwaviness of fiber tows in textile preform composites (see Fig. 1) and the wave angle isreasonably large no distinction is made between the misalignment and kink angles. Thenatural
waviness is introduced during the fabric manufacturing and consolidation process. In the towcollapse model the textile composite is assumed to be an assemblage of N set of inclined fibertows. The compression strength of the composite is the weighted sum of strengths of the Nsets of fiber tows. The load carried by each set of tows is a function of tow inclination (φi) tothe load, tow cross-sectional area fraction (Ai), total fiber volume fraction (Vf), transverseyield strength of the composite (σtys), and the shear yield strength (τysm) of the matrix in the
presence of fiber constraint. The expression for the compression strength (σc) is given by:

Volume V: Textile Composites and Characterisation
V - 12
σ c =Vf
VfRef
τysm A i
i =1
N∑
1
tan2φ i+
σ tys
τysm
2
The reference fiber volume fraction VfRef is assumed to be 0.6 based on the linear relationshipderived from Greszczuk[8] experimental data for unidirectional composites. Values of σtys
and τysm used in the present analysis were 127.6 and 63.8 MPa, respectively. The areafractions of 3-D braids were A1=0.46, A2=A3=0.27, for the weaves were A1=0.5, A2=A3=0.25,and for braids with pultruded rods were A1=0.46, A2=A3=0.27.
COMPRESSION TEST
Test Specimen
Modified IITRI test specimen[6,7] with and without tapered cross-ply glass/epoxy tabs wasused in the present study. Figure 2 shows the details of the specimen configuration with twotypes of tabs. The specimen width was 19 mm, thickness was 5.5 mm, and the unsupportedlength was 25 mm. The global buckling stress for simply-supported end conditions was about101 MPa for textile composites for G=2.8 GPa and E=55.2 GPa. This buckling stress is aboutthree times the expected compression strength of the textile composites. All specimens werestrain gaged in both the axial and transverse directions on top and bottom faces of thespecimen to measure both bending and membrane strains.
Test Procedure
The specimens were tested in compression using the IITRI test fixture in a universal testingmachine. A displacement controlled load was applied at a constant rate of 0.5 mm/minute.Stroke displacement, load, and strains were recorded at every two second interval in anautomatic data acquisition system. The test was stopped immediately after the ultimate load.The ultimate load was used for calculating the compression strength of the material. Duringthe test, the specimens were visually monitored and failure processes were monitored. After

Proceedings of ICCM–11, Gold Coast, Australia, 14th-18th July 1997
V - 13
the test, the failed regions of the specimens were inspected through a microscope and therelevant areas were photographed.
RESULTS AND DISCUSSIONS
Test Results
Figures 3 and 4 show stress-displacement response of 3-D braided and braided with pultrudedrods specimens, respectively. Results of woven specimens were similar to that of braidedcomposites, hence it is not shown. Almost all specimens failed by sudden fracture with littledamage progression. An evaluation of back and front strain gages showed that the specimenbending was small and the bending strain was less than 10% of membrane strainsimmediately before the fracture. Visual monitoring of specimens during the test showed thatthe failure in braided specimens initiated as a surface tow buckling (out-of-plane buckling oftows) followed transverse shear fracture (see Fig. 5(a)). The buckled surface tows spannedbetween the two consecutive tows interlocks. The transverse shear failure can becharacterized as the shear kinking of fibers or tow collapse. Unlike in braided specimens,woven and braided with pultruded rod specimens exhibited no out-of-plane buckling ofsurface tows. Tow kinking in woven composites is very clearly seen in Fig 5(b).
The ultimate load was used to calculate the compression strength. Table 1 lists thecompression strengths of all the specimens. Examination of fractured specimens revealed thatstress concentration due to tabs caused the specimens to fail near the tabs. A separate 3-Dfinite-element analysis of test specimens was conducted and found that the stressconcentration factor (SCF) to be 1.11 for braided specimens (tapered tabs) and 1.13 for wovenspecimens (no taper tabs). Compression strength after applying this correction (refer to dataafter applying SCF) is also given in the Table 1. The average strength, after applying the SCFcorrection, is 262.7, 373.6, and 268.3 MPa for braided, woven, and braided with pultruded rodcomposites, respectively. The data scatter was ±17% in braided, (-14%/9.3%) in woven, and(-4.3%/3.2%) in braided with pultruded rod composites. The average Vf of braided, woven,and braided with pultruded rod composites were 0.38, 0.44, and 0.28, respectively. Contraryto one’s expectation the strength of braided with pultruded rod composites has not improvedfrom that of the braided composites because of its low Vf (0.28).

Volume V: Textile Composites and Characterisation
V - 14
Comparison of Analysis with Test
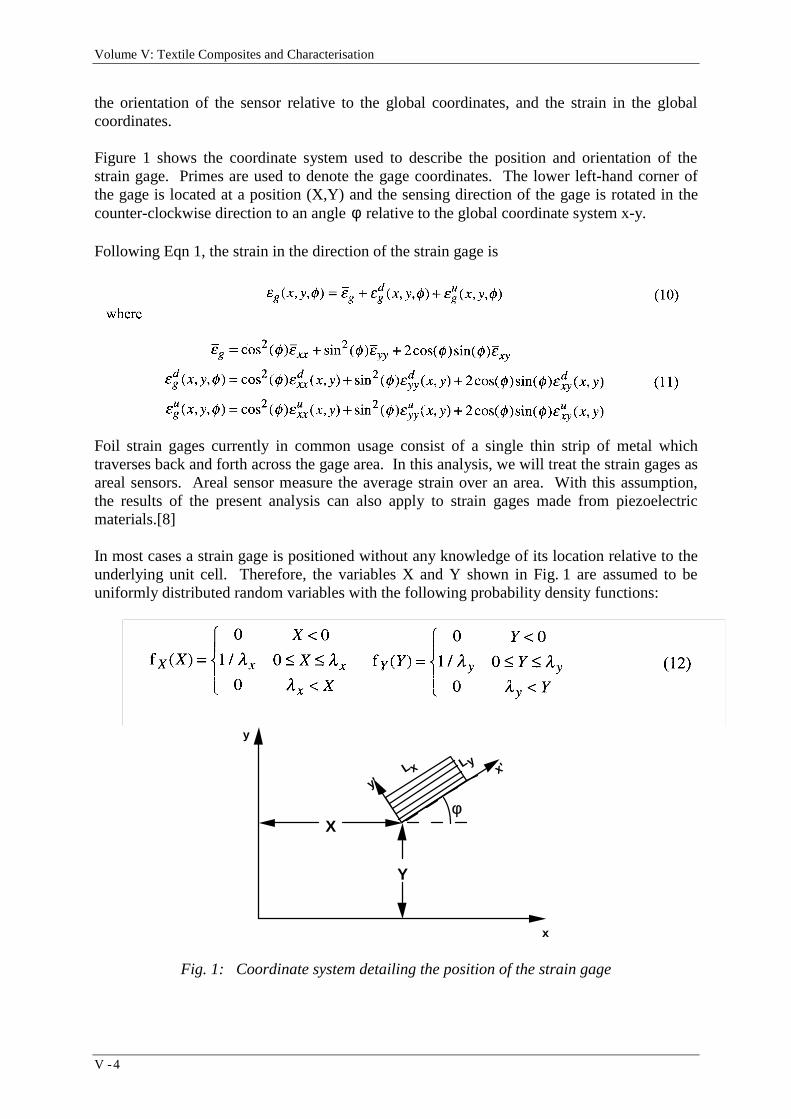
Calculated compression strength from the tow collapse model for all three composites isgiven in Table 1. Because the axial tow orientation was different from specimen to specimenand location to location, calculations are made for a range of angles: 6-8 deg for braids, 3-5deg for weaves, and 2-4 deg for braids with pultruded rods. Fiber volume fractions ofrespective specimens were used in the calculation. Calculated strengths for 7o/±17o braided,3.5o/90o/90o woven, and 3.5o/±37o braided with pultruded rod specimens agree with therespective test data. Figure 6 shows the comparison of analysis with test data for variousangle of axial tow orientations. For all three composites the analytical results agree well withthe test data. Because the values of Vf were different for different composites, the advantage
Proceedings of ICCM–11, Gold Coast, Australia, 14th-18th July 1997
V - 15
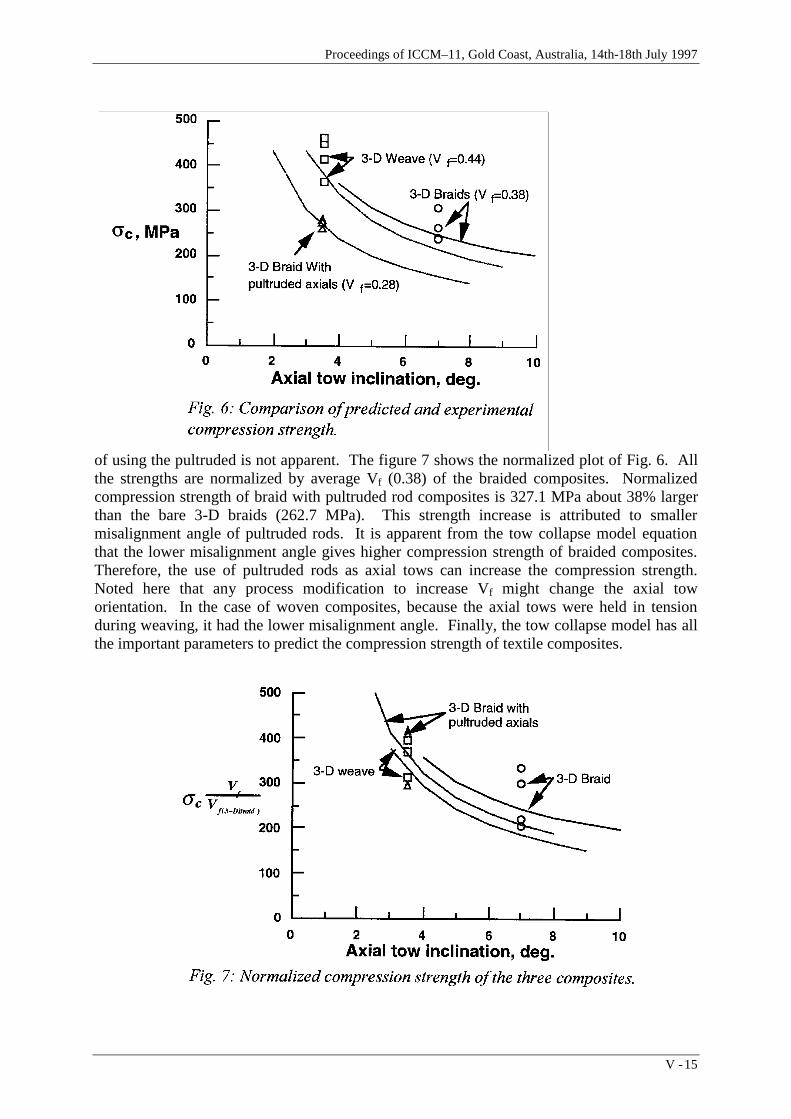
of using the pultruded is not apparent. The figure 7 shows the normalized plot of Fig. 6. Allthe strengths are normalized by average Vf (0.38) of the braided composites. Normalizedcompression strength of braid with pultruded rod composites is 327.1 MPa about 38% largerthan the bare 3-D braids (262.7 MPa). This strength increase is attributed to smallermisalignment angle of pultruded rods. It is apparent from the tow collapse model equationthat the lower misalignment angle gives higher compression strength of braided composites.Therefore, the use of pultruded rods as axial tows can increase the compression strength.Noted here that any process modification to increase Vf might change the axial toworientation. In the case of woven composites, because the axial tows were held in tensionduring weaving, it had the lower misalignment angle. Finally, the tow collapse model has allthe important parameters to predict the compression strength of textile composites.

Volume V: Textile Composites and Characterisation
V - 16
CONCLUDING REMARKS
Three types of textile preform composites were made from BASF G30-500 6k graphite yarnsand Dow Chemicals Tactix 123 matrix, using a resin transfer molding technique. Thepreform architectures were 3-D braid (7o/±17o), 3-D orthogonal weave (3.5o/90 o/90 o), and 3-D braid with pultruded rods (3.5o/±17o). In the last preform the axial tows were replaced bypultruded rods. Compression tests were conducted using the IITRI test fixture. The averagecompression strength of braided, woven, and braided with pultruded rod composites was262.7, 373.6, and 268.3 MPa, respectively. The data scatter was reasonable for woven andbraided with pultruded rod composites but it was large (about ±17%) for 3-D braidedcomposites. Micrographic studies concluded that the natural waviness of fiber tows in textilecomposites lead to buckling and shear kinking fracture of fiber tows. The tow collapsemodel, which incorporates this phenomenon, accurately predicted the compression failure ofall three textile preform composites. The compression strength was found to be stronglydependent on the axial tow misalignment angle. A small variation in the axial tow orientationcan have a significant change in the compression strength. Braid with pultruded rods hadsmall misalignment angle, consequently it had high compression strength. Similar trend wasnoticed also in woven composites, wherein the axial tows were held in tension during theweaving. Therefore the use of pultruded rods in place of axial tows can improve thecompression strength of braided composites.
REFERENCES
1. Shivakumar, K. N., Emehel, T. C., Avva, V. S., and Sadler, R. L., "CompressionStrength and Failure Mechanisms of 3-D Textile Composites," AIAA Paper 95-1159,1995.
2. Emehel, T. C. and Shivakumar, K. N., "Tow Collapse Model for Compression Strengthof Textile Composites," Proc. of ASC 10th Technical Conference, Santa Monica, Ca.October 18-20, 1995.
3. Argon, A. S., “Fracture of Composites,” Treatise of Materials Science and Technology,Vol. 1, Academic Press, New York, 1972.
4. Budiansky, B., "Micromechanics,” Computers and Structures, Vol. 16, No.1, 1983.
5. Fleck, N. A. and Budiansky, B., “Compressive Failure of Fibre Composites due toMicrobuckling.” Proc. IUTAM Symp. on Inelastic Deformation of Composite Materials,Troy, New York, May 29-June 1, 1990, ed. J. Dvorak, pp. 235-273.
6. ASTM Standards 1993 Annual Book, Section 15, Vol. 15.03, American Society forTesting and Materials, Philadelphia, Pa.
7. Minguet, P. J., Fedro, M. J., and Gunther, C. K., “Test Methods for TextileComposites,” NASA CR-4609, July 1994.
8. Greszczuk, L. B., “Microbuckling Failure of Circular Fiber-Reinforced Composites,”AIAA Journal, Vol. 13, No. 10, 1975, pp. 1311-1318.

Proceedings of ICCM–11, Gold Coast, Australia, 14th-18th July 1997
V - 17
PREFORMS FOR COMPOSITE PARTS MADE BYTAILORED FIBRE PLACEMENT
D. Feltin, K. Gliesche
Institute for Polymer Research Dresden, Hohe Str. 6, D-01069 Dresden, GERMANY
SUMMARY: A special characteristic of fibre reinforced composites is their anisotropicproperties. The maximum of the mechanical properties exist only along the fibre direction.The Institute of Polymer Research developed a new textile process for the production ofreinforcing structures. This process allows the consequent transfer of calculated results intotextile reinforcements, so that the reinforcement has locally varying fibre orientations andquantities. This paper reports on the technology of tailored fibre placement, the advantegesand the possibilities of this technology by means of demonstrator parts.
KEYWORDS: composite material, fibre preforming, tailored fibre placement, application
INTRODUCTION
Different structures for reinforced composite parts today are well known. These are producedfor instance by weaving, knitting or braiding [1-4]. For the reinforcement of highly loadedcomposite components the fibres should be arranged in the following way:
- stretched (without waves and twists)- aligned to the stress field- constant stress (the cross-section of the component corresponding to the local load)
Common textile structures can sometimes attend this requests in an economical way.
That is why in the Institute of Polymer Research developed a new textile process for theproduction of reinforcing structures [5,6]. This process allows the consequent transfer ofcalculated results into textile reinforcements, so that the reinforcement has locally varyingfibre orientations and quantities.
ANISOTROPIC MATERIAL BEHAVIOUR
A special characteristic of fibre reinforced composites is their anisotropic properties. Thismeans the properties, especially the mechanical properties like strength or stiffness aredependent on direction. The maximum of these properties exist only along the fibre direction.If the fibre direction differs from that of the applied stress the mechanical properties arereduced. If the angle between the fibre and the load direction differs only 10 degrees then thestrength is reduced to 20% of the maximum (see Fig.1) [7].

Volume V: Textile Composites and Characterisation
V - 18
0
0,1
0,2
0,3
0,4
0,5
0,6
0,7
0,8
0,9
1
0 15 30 45 60 75 90
in °
rel. strength
Tension
Compression
Fig.1: Relative strength of carbon fibre UD reinforced composite with epoxy resindependence on the angle between the load and the fibre direction
That is why is the agreement of fibre and the load direction is very important for theproperties of a component. Through the maximum exploitation of the fibres very light weightstructures are possible. Requirements for this are:
- exact knowledge of the load cases- small number of load cases- is it possible to produce textile structures with the necessary fibre orientations?- can the textile structures be processed to composite components?
TAILORED FIBRE PLACEMENT (TFP)
With tailored fibre placement it is possible to produce reinforcing structures with stress fieldaligned fibre orientations. This process is based on the well known embroidery technology,which is currently used for decorating fabrics. The principle of the production process isshown in Fig. 2.
3
1
24
5
X
Y
1 - Needle2 - Needle thread3 - Carbon roving4 - Hold down device5 - Base materialX,Y - possible move directions
Fig. 2: Principle of tailored fibre placement

Proceedings of ICCM–11, Gold Coast, Australia, 14th-18th July 1997
V - 19
A roving is fixed through stitches on a base material. Between the stitches the base materialcan be moved by numeric control in the X,Y direction. The roving is placed on the basematerial by zig-zag stitches either side of the roving. The roving can be made of carbon, glassfibres or other types of fibres. The base material can be a fabric or a nonwoven. Suitable is athin glass fibre fabric. In most cases the needle yarn is made of polyester.
Fig. 3 shows the working unit of the fibre placement machine.
Fig.3: Tailored fibre placement machine
The main advantage, compared to the common textile technologies, is the ability to arrangereinforcing fibres in every direction of the reinforcing area from an angle of 0° to 360°.Accumulation of fibres can be achieved by stitching several times across the same area.
MECHANICAL PROPERTIES
Table 1 shows mechanical properties of UD and 0°/90° reinforced composites made by TFP.It can be seen that this composite reaches the usual values.
APPLICATIONS
Brake Booster
The brake booster is a component that is used to support the bicycle brake. This component isfixed in front of the brake and prevents deformations of the brake shoe holder devices. Theprinciple function is shown in Fig. 4.

Volume V: Textile Composites and Characterisation
V - 20
Table 1: Mechanical properties of UD and 0°/90° reinforced composites made by TFP
Bending Test
fibre matrix structure fibre volumefraction ( %)
σmax (MPa)(coefficiet of variation)
E (GPa)(coefficiet ofvariation)
carbon fibre(Tenax HTA)
epoxy UD 531440
(2,2 %)103,2(5,9 %)
carbon fibre(Tenax HMS 40)
epoxy UD 531059
(5,0 %)154,1(3,3 %)
carbon fibre(Tenax HTA)
epoxy 0°/90° 52912
(3,2 %)71,8(0,7 %)
glass fibre PA6(commingling yarn)
UD 50781
(3,6 %)28,4(2,0 %)
Tension Test
carbon fibre(Tenax HTA)
epoxy UD 481438
(3,0 %)115,0
(1,9 %)
glass fibre(EC 17-1200-G52)
epoxy UD 53904
(3,8 %)42,0
(0,5 %)
F F
Fig. 4: Principle function and load case of the brake booster

Proceedings of ICCM–11, Gold Coast, Australia, 14th-18th July 1997
V - 21
Because the brake booster is used as a curved cantilever beam the stress field of thiscomponent for the represented load case is easy to determine. The outer areas will be loadedin compression, the inner areas in tension and the middle in shear stress. Therefore the fibresin the outer and in the inner areas should be a in 0° direction and the middle in an angle of+45°/-45°. Fig. 5 shows 3 different types of brake boosters.
A brake booster, made of aluminium, is tested as reference for the composite components.The first component type is produced through the use of a special fibre bundle. This fibrebundle, existed of 4 carbon rovings (4 x 12K), held together by axial threads around it. Thecross section of this fibre bundle is circular and is fixed on the base material by stitchesthrough the reinforcing fibres.
The second brake booster type is produced though the fixing of a carbon roving (12K) directlyon the base material by zig-zag stitches either side of the reinforcing fibres. The used quantityof carbon fibres is the same as for the component type II.
Aluminium Type I Type II
Stiffness in[(N/mm)/g]
1,77 4,06 6,49
Fig. 5. Brake boosters (real size 130 mm x 135 mm) and their properties
RESULTS
Fig. 5 shows furthermore the stiffness depending on the component weight of the brakeboosters at the beginning of the loading. The second brake booster shows the best results. The

Volume V: Textile Composites and Characterisation
V - 22
values for the first component are not so very good, due to follow causing. On the cross pointsin the middle area (loaded in shear stress) this bundle creating a deviation of the fibre-axis inthe third dimension.
The advantage of using a fibre bundle is a higher production rate compared to the secondbrake booster.But both the first and the second component shows better properties than thealuminium brake booster and it can be seen that the tailored fibre placement gives thepossibility of very light weight constructions.
Link Plate
This component is used for full suspension bikes and transmits impulses from the back wheelover struts to the spring unit. The principle function and the load case are shown on Fig. 6
1
2
34
5
1 - Spring unit2 - Link plate3 - Strut to the back wheel4 - main compression load5 - impulses from the back wheel
Fig. 6 Principle function and load case of the link plate
The main load is the compression load in the represented area but the requirement is acompression and a tension part from hole to hole. Fig. 7 shows the optimized preform and thecomponent.

Proceedings of ICCM–11, Gold Coast, Australia, 14th-18th July 1997
V - 23
Fig.7: Preform and component (real size 115 mm x 60 mm)
The necessary fibres for the compression and tension load are in the outer area and in themiddle in UD structure. This UD-structure move to a direction of 30° to the main loadedcompression part and prevent the bend of this part. The weight of this link plate is only 27gand the maximum transmitted force is higher than 10 kN (determined in an experiment). Theresult of this force is a compression stress over 1000 MPa in the main loaded area. In thetesting phase it was not possible to introduce higher loads, because the load was introducedthrough a bolt with a diameter of only 6 mm and this bolt failed at higher loads.
Bicycle Frame
One of the most interesting components for bicycles is the frame. The requirements, such asmaximum loads, drive comfort and minimum production costs on a carbon frame are veryhigh. The frame of a bicycle will be mainly loaded in torsion in one direction and in bendingin two directions.
F
F
M
Fig. 8: Main load directions in a bicycle frame

Volume V: Textile Composites and Characterisation
V - 24
The next figure shows the developed frame.
Fig. 9: Carbon bicycle frame
One of the main problems of this frame is the ordered design of this frame. In the area fromthe seat to the pedal crankcase, this frame has a very complex shape, so that it is not possibleto place the reinforing fibres optimal on this contour. That is why we developed a reinforcingstructure with 4 walls in this area (see Fig 10).
+45°/-45°0°/90°
+30°/-30°
+30°/-30°/0°
+45°/-45°
+30°/-30°/120°
z z
z
(Continuous from theseat to the pedalcrankcase)
Fig. 10: Reinforcing structure of the frame
In this way it is possible to place the carbon fibres in this area in a straight line. Most fibres inthis area are placed in 0° direction (direction from seat to pedal crankcase). Fig. 10 shows thedirections of the fibres in the other areas. In the part from the steering unit to the pedalcrankcase the fibres are placed in an angle of +/- 30°. This fibre orientation is a good
Proceedings of ICCM–11, Gold Coast, Australia, 14th-18th July 1997
V - 25
compromise compared with the optimal orientations for the torsion load and both bendingloads. The fiber orientation in the rear end is +/- 45°. This is the best fibre oriention fortorsion load but not the best for bending forces. This reinforcement improves the drivecomfort due to reduced the bending stiffness. That is why this part can partly absorb highimpulses from the back wheel.
Properties of the Frame
The weight of the carbon part of the developed bicycle frame is about 1600 g and for thenecessary inserts 500 g. The inserts are made of steel and not optimized for minimum weight.One importent criterion for the quality of a frame is the torque stiffness. For the determinationof this value the frame is fixed at the back wheel axis and the steering unit is loaded intorsion. The force per degree of deformation is the value for the torque stiffness of the frame.This carbon frame reaches a torque stiffness of 55 N per degree. So, despite the difficultdesign this frame shows good mechanical properties.
ADVANTAGES OF TAILORED FIBRE PLACEMENT
In combination with innovative design and production techniques, TFP show excellentpotential for a great variety of textile preforms with stress field aligned fibre placement andreinforcment in the third dimension. Its base on well established automated design andproduction technologies ensures the short time from design initiation to preform productionand makes the TFP an exceptionally fast prototyping technique. Reproducebility is excellent.
FINAL REMARK
This paper reports on the technology of tailored fibre placement. By means of demonstratorparts the advanteges and the possibilities of this technology are shown.
A seperate paper reports on the design methodologies which promise the best exploitations ofthe TFP technology. Several of these methodologies were tested in their abilities to relieve astess concentration in a notched composite. The manufacturing of these components, thetesting setups used and results are presented in the seperate paper.
REFERENCES
1. G. Niederstadt; “Leichtbau mit kohlenstoffaserverstärkten Kunststoffen”; Kontakt &Studium Band 167
2. W. Michaeli, M. Goedel; “Stationen der Herstellung von FVK-Bauteilen am Beispieldes FVK-Rades”; Fachtagung “Industrielle Anwendung der Faserverbundtechnik” ander RWTH Aachen, 1992
3. P. Offermann, G. Franske; “Beanspruchungs- und konfektionsgerechteTextilkonstruktionen für Hochleistungsverbunde”; Meliand Textilberichte, Mai 1991

Volume V: Textile Composites and Characterisation
V - 26
4. K. Drechsler; “Beitrag zur Gestaltung und Berechnung von Faserverbundwerkstoffenmit dreidimensionaler Textilverstärkung”; Dissertation an der Universität Stuttgard;1992
5. K. Gliesche, D. Feltin; “Automatisierte Herstellung von Langfaser (Endlosfaser) -Preforms für Faserverbund-Bauteile”; Vortrag zur 35. InternationalenChemiefasertagung, Dornbirn 1996
6. K. Gliesche; “Sticken und Nähen verstärkender Fasern”; Spectrum der Wissenschaften,Februar 1996
7. A.H.J. Nijhof; “Ontwerpen in verzelversterkte Kunststoffen”; TH Delft, 1983

Proceedings of ICCM–11, Gold Coast, Australia, 14th-18th July 1997
V - 27
EFFECT OF WEAVE STRUCTURE ON MODE IINTERLAMINAR FRACTURE BEHAVIOUR OFPLAIN GLASS WOVEN FABRIC COMPOSITES
AS A FUNCTION OF THE INTERFACE:REPORT OF A ROUND ROBIN TEST II
H.Saidpour & M.Sezen, Bournemouth University, UKY.J.Dong, H.S.Yang, Y.L.Bai & T.X.Mao, Chinese Academy of Science, China
C.Bathias, CNAM/ITMA, FranceP.Krawczak, R.Bequignat & J.Pabiot, Ecole des mines de Douai, France
S.Pinter & G.Banhegyl, Furukawa Electric Institute of Technology, HungaryJ.K.Kim & M.L.Sham, Hong Kong University of Science & Technology, Hong Kong
I.Verpoest, Katholike University of Leuven, BelgiumH.Hamada, Y.Hirai & K.Fujihara, Kyoto Institute of Technology, Japan
C.Y.Yue & K.Padmanabhan, Nanyang Technological University, SingaporeY.Suzuki, Nitto Boseki Co.Ltd, Japan
T.Tanimoto, Shonan Institute of Technology, JapanK.Schlute, Technical University Hamburg - Harburg, Germany
J.K.Karger-Kocsis, University of Kaiserslautern, GermanyW.J.Cantwell & R.Zulkifli, University of Liverpool, UK
L.Ye, University of Sydney, AustraliaA.Lowe, Australia National University, Australia
S.V.Hoa, Concordia University, CanadaV.V. Smirnov, Metal - Polymer Resarch Institute BAS, Belarus
L.T.Drzal, Michigan State University, USAW.R Brougntor, National Physical Laboratory, UK
J.J.Lesko, Virginia Polytechnic Institute and State University, USA
SUMMARY: Short beam shear tests and mode I interlaminar fracture toughness tests areperformed in a Round Robin Test (RRT) programme proposed by the Society of InterfacialMaterials Science (SIMS) to characterize the interlaminar fracture behavior of E-glass wovenfabric reinforced vinylester composites. Twenty institutions worldwide have participated inthis programme. No specific guidelines are given for the details of the test and the datareduction schemes, so that the participating laboratories perform the tests in their own ways.Only the fiber orientations relative to the specimen length are specified i.e. warp and weftfiber specimens. The first report of this programme to be presented at the 11th InternationalConference on Composite Materials (ICCM-11) focuses mainly on the effect of silanecoupling agent on mode I interlaminar fracture toughness tests and the stability of crackpropagation. In this report, the focus is placed on the influence of weave structure ofreinforcement on interlaminar fracture behavior.

Volume V: Textile Composites and Characterisation
V - 28
KEYWORDS: e-glass woven fabric reinforced vinylester composites; silane couplingagents; interface; interlaminar shear strength; mode I interlaminar fracture toughness; weavestructure.
INTRODUCTION
The interphase of composite materials is a key part which plays an important role indetermining the mechanical, chemical and degradation properties in composite materials.Hence, evaluations of the interphase properties in composite materials have been performedactively [1~4]. For instance, several testing methods (e.g. fiber fragmentation tests [3],embedded single fiber tests [4] etc.) have been developed to measure the bond quality at theinterphase between the fiber and matrix resin. There are also other testing methods toevaluate the interphase using the bulk composite laminates based on short beam shear tests[5,6] and interlaminar fracture toughness tests [7,8].
E-glass woven fabric reinforced composites have been widely used in commercialapplication, such as printed circuit boards, water tanks and fishing boats. It is well knownthat surface treatment is generally performed on the glass surface with silane coupling agentsto improve the bonding with the matrix resin. The structure of interphase in glass fiberreinforced composites is very complex chemically and physically, and there are many factorswhich affect the mechanical properties of the composites made therefrom. On performingsurface treatment of glass fibers, optimum conditions in order to get good adhesion betweenthe fiber and matrix resin were reported [9].
The Society of Interfacial Materials Science (SIMS) was established in 1993 to promote theunderstanding of composite interphases of various kinds as an interdisciplinary problem fromthe perspectives of chemistry, physics, material science and engineering mechanics. As partof its activities, the SIMS has organized the RRT programme to study the mechanicalproperties of E-glass woven fabric reinforced composites. The aim of the programme is toexchange the experiences between the participants and enhance the fundamentalunderstanding of the composite interphase. In the first RRT (RRT-I) programme, the tensileand bending tests were performed by ten institutions. It was found that both tensile andbending strengths increased with increasing the concentration of methacryl silane. In thepresent second RRT (RRT-II) programme short beam shear tests and mode I interlaminarfracture toughness tests have been performed by twenty institutions. The first part of thereport presents the results on the effect of surface treatment on mode I interlaminar fracturetoughness. In this paper which is the second part of the report on the present RRTprogramme, a focus is placed on the effect of weave structure on interlaminar shear strength(ILSS) and mode I interlaminar fracture toughness. It is aimed to contribute to furtherunderstanding of interphase properties which are vital to mechanical properties of compositematerials.
EXPERIMENTAL PROCEDURE
Material
Glass woven fabrics of 44 (warp) [ 34 (weft) strands count per 2.5 cm [ 2.5 cm were used asreinforcement (Nitto Boseki Co. Ltd., Japan). Fig.1 schematically illustrates the elements of

Proceedings of ICCM–11, Gold Coast, Australia, 14th-18th July 1997
V - 29
weave structure in glass woven fabric which are used in this study. The distance between thecenter of fiber strands was longer in the warp direction than in the weft direction, due to thedifference in density of fiber strands. Surface treatment was performed on the glass fiberfabric by using γ - methacryloxypropyltrimethoxysilane (A-174, Nippon Unicar, Co., Japan)and γ-glysidoxypropyltrimethoxysilane (A-187, Nippon Unicar, Co., Japan), which are calledmethacryl silane and epoxy silane, respectively. The concentrations of silane agents were0.01, 0.4, 1.0 wt% methacryl silane, 0.4 wt% methacryl silane washed with methanol solventand 0.4 wt% epoxy silane. The aqueous solution of silane coupling agent was acidified withacetic acid at ph = 4.0. The glass fiber fabrics were dipped into the silane aqueous solutions.They were squeezed by rollers and dried at 110 degree C for 10 min. Vinylester resin (R-806,Syowa High Polymer, Japan) was polymerized with 0.7 phr methyl-ethyl-ketone-peroxide.Composite laminates were fabricated by hand lay-up technique. A 40 µm thickpolytetrafluoroethylene (PTFE) was inserted as an initial crack during the lay-up at the mid-plane of the laminates for mode I interlaminar fracture toughness tests.
Specimen Geometry and Test Condition
The SIMS fabricated and supplied the composite laminates whose thicknesses were specifiedby the individual participating laboratories. The participating laboratories decided the testspeed, specimen geometry and so on. Typical specimen geometry for measuring interlaminarshear strength by short beam shear test was given in Fig.2 (a). The specimen was cut paralleland perpendicular to the warp strand direction, designating warp and weft specimens,respectively. Table 1 gives the details of the specimen dimensions and test conditions used byeach laboratory. Short beam shear tests were performed on the specimens with all fivesurface treatments. The interlaminar shear strength (ILSS) was calculated according tospecification BS2782 and ASTM D 2344:
τ = 3Pmax / 4wh (1)
where Pmax is the applied maximum load, w and h are the specimen width and thickness,respectively.
Mode I interlaminar fracture toughness tests were performed using double cantilever beam(DCB) specimens. Specimens finished 0.01 and 0.4 wt% methacryl silane were used.Typical geometry and details dimension of DCB specimen are shown in Fig.2 (b) and Table2. Either aluminium blocks or piano hinges were bonded to the specimen edges to allowloading in tension. Mode I interlaminar fracture toughness, GIC and GIR, were calculated

Volume V: Textile Composites and Characterisation
V - 30
according to data reduction scheme chosen by the individual laboratories. The details arereported in the first part of this report [10].

Proceedings of ICCM–11, Gold Coast, Australia, 14th-18th July 1997
V - 31
RESULTS AND DISCUSSION
Short Beam Shear Test
Fig. 3 shows the ILSS values for composites with five different surface treatments. It can benoted here that the ILSS increased 10%~30% with increasing concentration of methacrylsilane, regardless of the fiber orientation (warp or weft directions). This appears clearly onFig.4. It is also noted that the ratio of increasing ILSS is slightly 20% higher in the weftdirection than in the warp direction. This is probably related to the weave structure of thewoven fabric used in this study. But in general the amplitude of the variations observedremain very low and lower than those observed between materials with different interfacequalities. This suggests that the contribution of the fiber orientation is very small and couldbe perhaps neglected in regard to the contribution of the interface quality.
For a majority of laboratories, methanol washed specimen showed an increase in ILSS by5%~20% in comparison with unwashed specimen. For 0.4 wt% epoxy silane finishedspecimens the lowest ILSS values were obtained among the composites with different surfacetreatments from all the participating laboratories. Regarding the effects of surface treatmenton ILSS (nature of silane, methanol washing and amount of silane), it is finally interesting tonote that the same general trends have been found previously on the basis of tensile andbending tests (strength values) [10].

Volume V: Textile Composites and Characterisation
V - 32
Mode I Interlaminar Fracture Toughness Test
Fig.5 shows typical load - displacement curves for warp and weft specimens with finished by0.01 and 0.4 wt% methacryl silane. In the case of 0.01 wt% specimens, the load increased tothe maximum load linearly, and decreased gradually after the maximum, with stable crackpropagation. The maximum loads obtained from the weft specimen was higher than the warpspecimen. On the other hand, the load-displacement curve displayed saw teeth like behaviorfor 0.4 wt% specimens. The load dropped suddenly after reaching the maximum load, andcrack propagated unstably at fast speed for both the warp and weft specimens.
Initiation values of mode I interlaminar fracture toughness GIC, are shown in Fig.6. It isgenerally found that the weft specimens showed slightly higher GIC, than the warp specimens,

Proceedings of ICCM–11, Gold Coast, Australia, 14th-18th July 1997
V - 33
for both silane concentrations, 0.01 and 0.4 wt%, except those reported from two laboratories.Especially, there was more difference between the weft and warp specimens in the 0.01 wt%specimen relative to the 0.4 wt% specimen. Unstable fracture occurred in the 0.4 wt%specimens so that the propagation value GIR, could not be obtained. Fig.7 gives a comparisonof the propagation values, GIR calculated for 0.01 wt% specimens. Most laboratories reportedthat the propagation values, GIR, were higher for the weft specimens than the warp specimens.It was also noted that the propagation values, GIR, were higher than the initiation values, GIC.
Fig. 6: Initiation values of mode I interlaminar fracture toughness of warp and weftspecimens: (a) 0.01 wt% methacryl silane, (b) 0.4 wt% methacryl silane
The weft specimens had higher strands density in the longitudinal direction than the warpspecimens as noted from Fig.1. As such, it is thought that crack propagation along the lengthof weft specimens may need more energy than along the warp direction. Accordingly, both

Volume V: Textile Composites and Characterisation
V - 34
the initiation values GIC, and propagation values GIR, for the weft specimens were higher thanthe warp specimens. Concerning the increase of fracture toughness with crack propagationi.e., GIR > GIC, which is considered due to fiber bridging. Many researchers reported thatfiber bridging gives rise to higher mode I interlaminar fracture toughness [11,12]. Accordingto our observation, the fiber bridging builds up gradually with crack propagation.
Just as for ILSS results, the results obtained on the basis of mode I tests show that theinfluence of fiber orientation is far less than the influence of interface quality[10]. As over100% variation was observed on GIC initiation values with different surface treatments, only10~20 % variation is noted when changing the fiber orientation. This confirms the fact thatthe interface quality plays here a role of prime importance on the damage mechanisms of suchcomposites. The role of fiber orientation is less important.
CONCLUSIONS
The second Round Robin Test was carried out with twenty laboratories having participatedglobally to study the interlaminar fracture behavior of glass woven fabric vinylestercomposites with five different silane coupling agents. Short beam shear tests and mode Iinterlaminar fracture toughness tests were performed with the specimens whose directionswere both weft and warp fiber orientations. Regarding the influence of the surface treatment,it could also be noted that in general the same trends previously observed for tensile andbending strengths are obtained for ILSS. A slight increase in both the initiation andpropagation GIC values was generally noted when changing the fiber orientation from warp toweft direction. Finally it is interesting to note that the amplitude of the variation of theproperties (ILSS or mode I) is higher when modifying the surface treatment than whenmodifying the orientation of the fibers. This means that the purely interfacial effects areinfluencing more the damage mechanisms than the weave structure effects (at least for theglass / vinylester composite materials studied here).

Proceedings of ICCM–11, Gold Coast, Australia, 14th-18th July 1997
V - 35
ACKNOWLEDGMENTS
The organizers of the 2nd round robin test programme wish to thank all the participants whocompleted the test as instructed and submitted the results in time. A special gratitude is due toDr. Y.Suzuki of Nitto Boseki Co. Ltd, Japan for supplying the glass woven fabrics used inthis study.
REFERENCES
1. H.Hamada, N.Nishida, Z.Maekawa & N.Ikuta, Journal of Material Science, 29, 352(1994).
2. P.S.Chua & M.R.Piggot, Composite Science and Technology, 22 pp.33-42 (1987).
3. G.Dorey & J.Harvey, Interfaces in Polymer Ceramic and Metal Matrix Composites,pp.694 (1988).
4. L.T.Drzal, 28th National SAMPE Symposium, pp.1051 (1983).
5. E.Fitzer, K.H.Geigl, W.Huttner & W.Weiss, Carbon, 18 pp.389-393 (1980).
6. T.Norita, J.Matsui & H.S.Matsui, Composite Interfaces, pp.213-232 (1980).
7. Y.Suzuki, Z.Maekawa, H.Hamada, M.Kibune, M.Hojo & N.Ikuta, Journal of MaterialScience, 27 pp.6782-6790 (1992).
8. P.Krawczak & J.Pabiot, Jornal of composite materials, 29 pp.2230-2253 (1995).
9. Y.Nakanishi & N.Ikuta, Journal of Society Material Science, 45 pp.1307-1315 (1996).
10. H.Saidpour, M.Sezen, Y.J.Dong, H.S.Yang, Y.L.Bai, T.X.Mao, C.Bathias, P.Krawczak,R.Bequignat, J.Pabiot, S.Pinter, G.Banhegyl, J.K.Kim, M.L.Sham, I.Verpoest,H.Hamada, Y.Hirai, K.Fujihara, C.Y.Yue, K.Padmanabhan, Y.Suzuki, T.Tanimoto,K.Schlute, J.K.Karger-Kocsis, W.J.Cantwell, R.Zulkifli, L.Ye, A.Lowe, S.V.Hoa, V.VSmirnov, L.T.Drzal, W.R Brougntor & J.J.Lesko, to appear in Proc.ICCM-11.
11. M.Hojo & T.Aoki, ASTM STP 1156 pp.281-298 (1993).
12. X.Z.Hu & Y.W.Mai, Composites Science and Technology, 46 pp.147-156 (1993).

Volume V: Textile Composites and Characterisation
V - 36
TENSILE BEHAVIOUR AND DAMAGEPROGRESSION IN MULTILAYER WOVEN
GLASS/VINYL ESTER COMPOSITES
P. Callus 1, F. Coman 2, K. H. Leong 3, I. Herszberg 1, M. Bannister 3
1 Sir Lawrence Wackett Centre for Aerospace Design, Royal Melbourne Institute ofTechnology, GPO Box 2476V, Melbourne, Victoria, 3001, Australia.
2 Department of Manufacturing Systems and Engineering, Royal Melbourne Institute ofTechnology, GPO Box 2476V, Melbourne, Victoria, 3001, Australia.
3 Cooperative Research Centre for Advanced Composite Structures Limited, 506 LorimerStreet, Fishermens Bend, Victoria, 3207, Australia.
SUMMARY: Preforms containing orthogonal, normal layered interlock and offset layeredinterlock architectures were woven in E-glass and consolidated with vinyl ester resin. Tensilespecimens were prepared, in the warp and weft directions, then tested to failure. The stress-strain response of most specimens were trilinear, with a primary softening of 20-30 % at2500-3500 µε and a secondary softening of 0-15 % at 10000-17000 µε. The difference in theelastic modulus and strength of all structures was within experimental scatter, provided thefibre content in the testing direction was accounted for. The strain to failure was similar forall specimens. Selected specimens were illuminated with transmitted light and photographedduring testing. Cracks occurred within the tows oriented both perpendicular and parallel tothe testing direction. Structures containing more heavily crimped warp tows also exhibiteddisbonding local to the warp tow/binder crossover point. The softening events were attributedto these cracks.
KEYWORDS: multilayer weave, modulus, tensile strength, strain to failure, softening,transmitted light photography, damage progression, crack distribution
INTRODUCTION
The mechanical behaviour of textile composites can be predicted with reasonable reliabilityusing a number of models [1-3]. The most critical variable in prediction is the orientation oftows relative to the loading axis. In all but the simplest approximations [3], these modelsmust be experimentally calibrated with “real” structures, either by measuring the distributionof tow orientations in consolidated [1], or dry [4], preforms, or by calibrating models withexperimental results from composites containing known fibre orientations [1].
Extensive pre-test and post-failure examinations have been used to develop these predictionmodels [1]. The mechanisms for load transfer and damage progression have had to satisfyboth the stress-strain behaviour and the observed damage. While such work has provedextremely useful it does not precisely establish the progression of damage during loading.Interrupted testing, where specimens were unloaded prior to failure and then examined,provides definitive evidence of the progression of damage and has been used in the
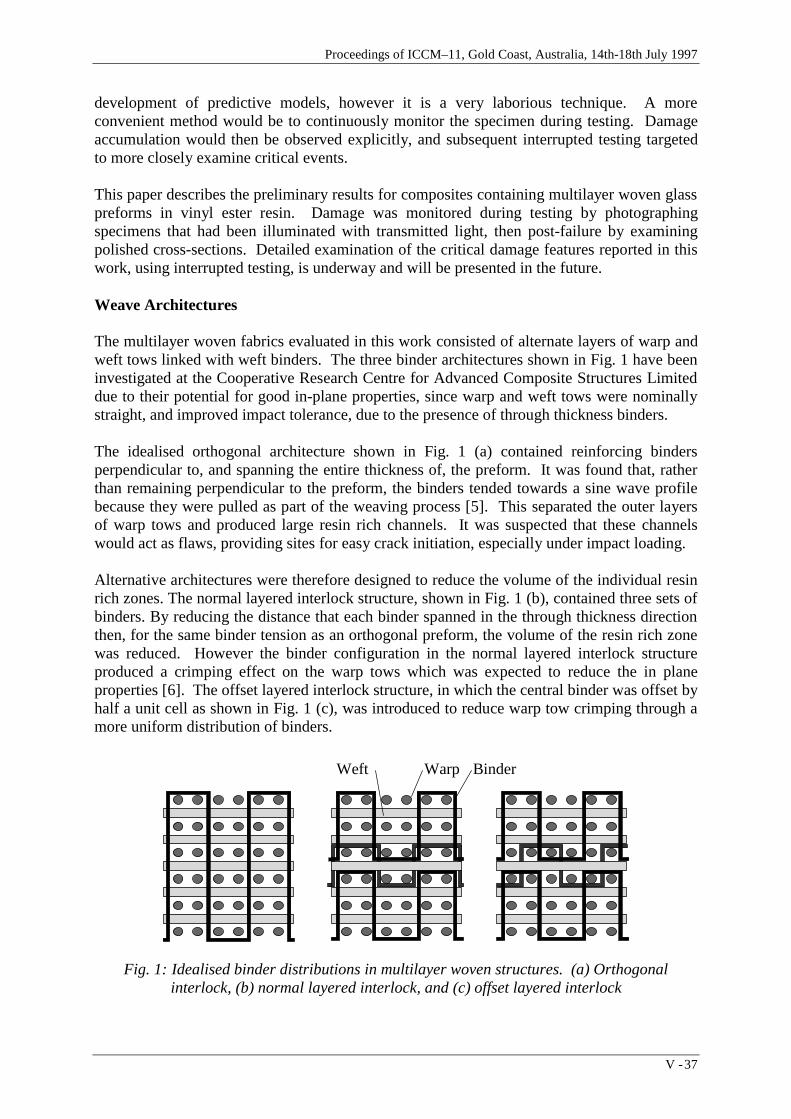
Proceedings of ICCM–11, Gold Coast, Australia, 14th-18th July 1997
V - 37
development of predictive models, however it is a very laborious technique. A moreconvenient method would be to continuously monitor the specimen during testing. Damageaccumulation would then be observed explicitly, and subsequent interrupted testing targetedto more closely examine critical events.
This paper describes the preliminary results for composites containing multilayer woven glasspreforms in vinyl ester resin. Damage was monitored during testing by photographingspecimens that had been illuminated with transmitted light, then post-failure by examiningpolished cross-sections. Detailed examination of the critical damage features reported in thiswork, using interrupted testing, is underway and will be presented in the future.
Weave Architectures
The multilayer woven fabrics evaluated in this work consisted of alternate layers of warp andweft tows linked with weft binders. The three binder architectures shown in Fig. 1 have beeninvestigated at the Cooperative Research Centre for Advanced Composite Structures Limiteddue to their potential for good in-plane properties, since warp and weft tows were nominallystraight, and improved impact tolerance, due to the presence of through thickness binders.
The idealised orthogonal architecture shown in Fig. 1 (a) contained reinforcing bindersperpendicular to, and spanning the entire thickness of, the preform. It was found that, ratherthan remaining perpendicular to the preform, the binders tended towards a sine wave profilebecause they were pulled as part of the weaving process [5]. This separated the outer layersof warp tows and produced large resin rich channels. It was suspected that these channelswould act as flaws, providing sites for easy crack initiation, especially under impact loading.
Alternative architectures were therefore designed to reduce the volume of the individual resinrich zones. The normal layered interlock structure, shown in Fig. 1 (b), contained three sets ofbinders. By reducing the distance that each binder spanned in the through thickness directionthen, for the same binder tension as an orthogonal preform, the volume of the resin rich zonewas reduced. However the binder configuration in the normal layered interlock structureproduced a crimping effect on the warp tows which was expected to reduce the in planeproperties [6]. The offset layered interlock structure, in which the central binder was offset byhalf a unit cell as shown in Fig. 1 (c), was introduced to reduce warp tow crimping through amore uniform distribution of binders.
Fig. 1: Idealised binder distributions in multilayer woven structures. (a) Orthogonalinterlock, (b) normal layered interlock, and (c) offset layered interlock
WarpWeft Binder

Volume V: Textile Composites and Characterisation
V - 38
EXPERIMENTAL TECHNIQUES
Preform and Specimen Production
The processing and postcure conditions for these panels have been described elsewhere [7]and are summarised in Table 1. One orthogonal preform and two preforms containing bothnormal layered interlock and offset layered interlock architectures were woven from E-glasswith a mechanical hand loom. Each preform contained six layers of 1440 tex warp tows, fivelayers of 1200 tex weft tows, and 68 tex weft binders. The preforms were consolidated withDerakane vinyl ester resin using resin transfer moulding. Straight sided, 200 mm x 40 mmwith 120 mm gauge length, specimens were cut from the panels in the warp and weftdirections. Specimen lengths were limited by material availability, and width was thatrecommended in ref. [8] to ensure that an adequate number of complete unit cells would betested and the results representative of the composite.
Table 1: Specimen manufacture details
Panel Architecture Resin Postcure No. of specimens
number Warp Weft
1 Orthogonal 411-C-50 100 °C/3 h 5 5
2 Normal layeredOffset layered
411-45 Roomtemperature
10
6
2
2
3 Normal layeredOffset layered
411-C-50 100 °C/3 h 2
2
5
5
Tensile Testing
Tests were conducted in a 100 kN MTS servo hydraulic testing machine using theconfiguration shown in Fig. 2. A light source was positioned to the rear of the specimen and a35 mm camera mounted in front. Photographs were taken, with the specimen illuminated bytransmitted light, at load increments of approximately 2 kN.
An open weave abrasive cloth (Screenbak) was placed between the specimens and serratedgrip faces to soften the gripping interface. This permitted specimens to be tested without tabsbut with failure still occurring inside the gauge length.
Specimens were loaded at 0.5 mm min-1 until failure while strain was measured using an MTS632-12C extensometer modified to a 100 mm gauge length. The increased extensometergauge length ensured that the effects of damage, which occurred uniformly over the entirespecimen gauge length, were measured up to specimen failure. After testing the failedspecimens were sectioned, polished and a microstructural examination performed.

Proceedings of ICCM–11, Gold Coast, Australia, 14th-18th July 1997
V - 39
Fig. 2: Test configuration showing the specimen, light source, camera, and extended gaugelength extensometer
RESULTS AND DISCUSSION
Mechanical Properties
The elastic moduli, evaluated between 1000 and 3000 µε, tensile strength and strain to failureare plotted in Fig. 3. The most important parameter controlling mechanical properties wasfound to be the volume fraction of fibres in the test direction. This was different for each ofthe specimens due to local variations in architecture, panel thickness and size of the unit cellsin the woven preform. Data was therefore normalised to the nominal fibre content for eachpanel/architecture combination and is shown as the light columns in Fig. 3. The averagenominal fibre contents for all architectures was calculated to be 33.3 vol. % in the warpdirection and 30.4 vol. % in the weft direction. The contribution of binders to the weft fibrecontent was ignored. Strength and modulus data were further normalised to these fibrecontents and are shown as the dark columns in Fig. 3.
The properties of all architectures in the warp direction and the strain to failure in the weftdirection was within the experimental scatter. It was considered valid to compare tests in thewarp direction, from Panels 2 and 3, with those in the weft direction, Panel 3 only, since thedifferences in warp direction modulus and strength between Panels 2 and 3 were typically lessthan 10 %. The strain to failure of the offset layered interlock, in the warp direction, was 20% lower in Panel 2, however this was not considered sufficient to invalidate comparisonssince this data was still within the overall scatter for all tests.
In the weft direction the data for each panel, light columns, suggested a reduction in modulusand strength as architecture changed from orthogonal to normal layered interlock to offsetlayered interlock. These differences were reduced to within experimental scatter once thedata had been normalised to the standard weft fibre contents, dark columns.
Damage Progression
The form of the stress-strain plot and the features observed in transmitted light photographswere similar for all architectures tested in both directions. These features and behaviours are
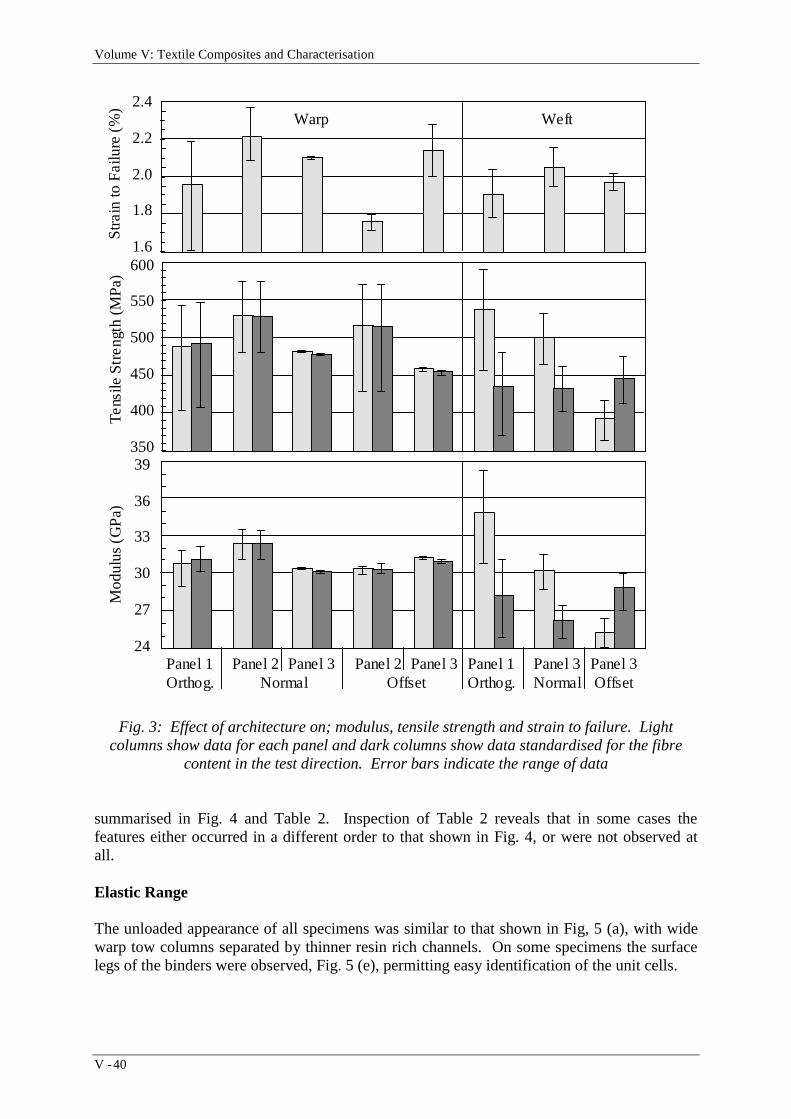
Volume V: Textile Composites and Characterisation
V - 40
Fig. 3: Effect of architecture on; modulus, tensile strength and strain to failure. Lightcolumns show data for each panel and dark columns show data standardised for the fibre
content in the test direction. Error bars indicate the range of data
summarised in Fig. 4 and Table 2. Inspection of Table 2 reveals that in some cases thefeatures either occurred in a different order to that shown in Fig. 4, or were not observed atall.
Elastic Range
The unloaded appearance of all specimens was similar to that shown in Fig, 5 (a), with widewarp tow columns separated by thinner resin rich channels. On some specimens the surfacelegs of the binders were observed, Fig. 5 (e), permitting easy identification of the unit cells.
2.4Warp Weft
2.2
2.0
1.8
1.6600
550
500
450
400
35039
36
33
30
27
24Panel 1 Panel 2 Panel 3 Panel 2 Panel 3 Panel 1 Panel 3 Panel 3Orthog. Normal Offset Orthog. Normal Offset
Str
ain
to
Fa
ilure
(%
)M
od
ulu
s (G
Pa)
Te
nsile
Str
en
gth
(MP
a)

Proceedings of ICCM–11, Gold Coast, Australia, 14th-18th July 1997
V - 41
Preliminary analysis indicates that, in agreement with ref. [1], the elastic modulus of thesemultilayer woven architectures can be predicted with reasonable accuracy using orthotropiclaminate theory. The results of this investigation will be reported during the conference.
0
100
200
300
400
500
0.0 0.5 1.0 1.5 2.0 2.5Strain (%)
Str
ess
(M
Pa)
Primary softeningTransverse cracks
Longitudinal cracks
Localdisbonding Secondary softening
Fig. 4: Generalised stress-strain response showing all mechanical behaviour and damagefeatures observed for these architectures and test directions
Table 2: Average strain at which stiffness changes and damage features were observed
Damage or property feature Orthogonal Normal layered Offset layered
Warp Weft Warp Weft Warp Weft
Primary softening (µε) 3340 3530 3090 2540 2990 3130
Modulus drop (%) 26 25 29 19 * 22
Appearance of transverse cracks (µε) 6810 5250 3800 5940 4870 4110
Appearance of longitudinal cracks (µε) None None 8220 14900 6860 15050
Appearance of local disbonding (µε) None None 13200 None 6850 None
Secondary softening (µε) 10610 12280 16730 10670 * 11080
Modulus drop (%) 8 5 13 5 * 14
* Data unavailable
Primary Softening
A 20 to 30 % reduction in stiffness was observed for all specimens at approximately 3000 µε.It is most likely that this drop was due to transverse cracking, ie. cracks within the towsoriented perpendicular to the test direction. These cracks were observed in transmitted lightphotographs and are discussed in the next section. Although the transverse cracks were

Volume V: Textile Composites and Characterisation
V - 42
observed well after softening had occurred it is probable that the cracks were present earlierbut not detected. Interrupted testing will be performed to confirm that this was the case.
Transverse Cracking
Transverse cracks, as shown in Fig. 5 (b), initiated between 3040 and 7160 µε and occurred inall specimens. Cross-sections, such as Fig. 5 (c), show that these cracks were confinedexclusively to the tows transverse to the testing direction and did not extend into thesurrounding resin rich zones. The number and length of individual cracks increased with loaduntil, at approximately 50 % of failure load, saturation occurred. At this stage cracks spannedmost of the specimen width and were uniformly spaced along the full gauge length, similar tothe transverse cracks that appear in cross ply laminates.
Load was transferred from tows parallel to the test direction to tows perpendicular to the testdirection by shearing of the matrix at the interface between parallel/perpendicular tows. Theefficiency of this transfer was probably enhanced by the presence of through thicknessbinders. Cracking occurred when stress in the perpendicular tows exceeded the matrix tensilestrength. It is proposed that this cracking reduced the contribution of perpendicular tows tothe load bearing capacity of the composite and so caused the primary softening. Modelsrelating the spacing of transverse cracks and the degree of softening in cross-ply laminates [9]probably apply to the multilayer woven composites used in this work.
When testing in the warp direction the cracks in the weft tows were very clear, appearingstraight in orthogonal and normal layered interlock specimens but wavy in offset layeredinterlock specimens. Most property models account for out of plane tow deviations, howeverFig. 5 (e) shows that if the weaving or RTM processes have not been optimised, then in planedeviations, of similar magnitude to out of plane deviations could occur. Figure 3 shows thatthe effect of weft tow waviness on the specimens tested in this work was not significant.
Secondary Softening
In most specimens a second change in stiffness was observed at higher strains. The responseof the specimens that did not display this behaviour; two orthogonal warp, one orthogonalweft and two normal layered interlock warp, were either bilinear or continuously curved.
The resin for the secondary softening is unknown. It is possible that, in normal layeredinterlock specimens tested in the warp direction, this softening was caused by easierstraightening of load bearing tows afforded by the presence of longitudinal cracking and localdisbonding. In all other cases the transmitted light photographs either did not detect cracks,or cracks were observed after softening. Again interrupted testing will be performed todetermine the precise order of events.
Tow lock-up in the woven architecture has been proposed as a mechanism to explainsoftening at high loads and very large strain to failure for woven carbon/epoxy composites[1]. However in this work the secondary softening occurred as low as 9000 µε and 250 MPa.It is very unlikely that tow failure would commence at such low strains.

Proceedings of ICCM–11, Gold Coast, Australia, 14th-18th July 1997
V - 43
(a) (b)
(c) (d)
(e) (f)
Fig. 5: Transmitted light photographs and cross-sectional micrographs of various specimensindicating the progression of damage. (a) A specimen prior to testing. (b) Transverse cracks.
(c) Micrograph showing transverse cracks occurred wholly within perpendicular tows. (d)Longitudinal cracks. (e) Local disbonds. (f) Micrograph showing disbonds as
circumferential cracks around the outer tows

Volume V: Textile Composites and Characterisation
V - 44
Longitudinal Cracking
Longitudinal cracks, as shown in Fig. 5 (d), appeared at intermediate loads within towsparallel to the loading direction. Cracks appeared to initiate under the binder/warp towcrossover point then propagate within the tow to almost the full specimen gauge length.
The most likely cause of these cracks originated during weaving of the preform. Tension inthe binders crimped the warp tows at the warp tow/binder crossover point. In theconsolidated composite under load, these crimped warp tows tended to straighten and returnto their original cross-sectional shape. This produced a tensile stress perpendicular to the towand cracking if the resin strength was exceeded. This mechanism assumes that, althoughbinders exert considerable restraint on warp tows, they cannot completely prevent all lateralmovement.
Local Disbonding
Local disbonding was observed when testing the offset layered interlock specimens, and to alesser extent the normal layered interlock specimens, in the warp direction. As shown inFig. 5 (e) disbonding occurred in the region immediately surrounding the warp tow/bindercrossover point and was initiated where a short longitudinal crack had reached the surface of awarp tow. Figure 5 (f) showed that these disbonds were restricted to the surface tows, wherecrimping in the warp tow by the weft binder was most severe.
Disbonding occurred in the most severely crimped regions of tows when the stress at the warptow/matrix interface, generated by tow straightening, exceeded the tow/matrix interfacialshear strength. Disbonding was confined to the crimped region and crack size depended onthe severity of the crimp. Disbonds were much larger in the offset layered interlockspecimens, supporting the observations that the tows in this structure were more wavy thanthose in the other architectures. This increased tow waviness was caused by high bindertension during weaving and is discussed below.
Additional Comments
The extent of crimping in tows parallel to the loading direction controlled the appearance oflongitudinal cracks and local disbonds. This crimp was generated not only by the weavearchitecture, but also by the weaving process, in particular the binder tension. The preformsin this work were woven on a manual loom, with control over binder tension provided by theoperator. Due to the difficulties in exerting close control over binder tension it is likely thatthe degree of crimp in any one preform, let alone between preforms, was variable. In fact theideal architectures were probably never achieved, however test results indicate that providedthis variation was less than 5 to 10° the effect on tensile properties was minimal.
The resin rich channels did not appear to contribute to crack formation. Strains within thesechannels were very close to the overall specimen strain, and specimen failure strains of 1.6 to2.4 % were well within the resin capacity of 5 to 6 % [10]. The strain within tows, magnifieddue to the close packing of glass fibres, was sufficient to cause extensive local cracking [11].
Architectural differences are expected to play a much more significant role when thecomposites are subjected to compression and impact loading. In these situations two

Proceedings of ICCM–11, Gold Coast, Australia, 14th-18th July 1997
V - 45
competing factors will influence performance. The first is the volume of the resin rich zones,increasing of which will reduce performance, and the straightness of tows, where morecrimped tows will decrease performance. The volume of resin rich zones decreased fromorthogonal to normal layered interlock to offset layered interlock, while tow straightness wascontrolled by architecture and weaving technique. The effect of each factor must bedetermined experimentally.
CONCLUSIONS
There was no significant difference in the elastic modulus, strength and strain to failure ofglass/vinyl ester orthogonal, normal layered interlock and offset layered interlockarchitectures when tested in the warp and weft directions, provided the effect of fibre contentin the testing direction was accounted for.
Five features were identified during the tensile loading of these materials; (i) primarysoftening, (ii) cracks within tows transverse to the testing direction, (iii) secondary softening,(iv) cracks within tows parallel to the testing direction, (v) local disbonding at the warptow/binder crossover. The softening events were probably caused by cracking anddisbonding.
Transmitted light photography is a useful technique for characterising damage accumulationin translucent composite specimens during testing. It has contributed to an understanding offailure mechanisms and assisted in more detailed examination of these materials.
ACKNOWLEDGMENTS
The authors acknowledge the contribution of the following colleagues to this work;A. Nicolaidis - preparation of woven preforms, K. Houghton - resin transfer moulding,M. Finch and M. Wilson - testing, R. Chuah - data analysis, and K. Dixon - assistancethroughout.
REFERENCES
1. Cox, B., “Failure Models for Textile Composites”, NASA CR-4686, Langley ResearchCenter, August 1995.
2. Vandeurzen, P., Ivens, J. and Verpoest, I., “ A Critical Comparison of Analytical andNumerical (FEM) Models for the Prediction of the Mechanical Properties of WovenFabric Composites”, TEXComp 3, Aachen, December 9-11, 1996, pp 12/1-12/11.
3. Falzon, P.J., PhD Thesis, Royal Melbourne Institute of Technology, Department ofAerospace Engineering, To be submitted.
4. Gommers, B, Verpoest, I., and Van Houtte, P., “On the use of Orientation Tensors inthe Analysis of Knitted Fabric Reinforced Composites”, TEXComp 3, Aachen,December 9-11, 1996, pp 8/1-8/18.

Volume V: Textile Composites and Characterisation
V - 46
5. Bannister, M. K., Herszberg, I., Coman, F., Raper, H., Curiskis, J., “Manufacture andAnalysis of Multilayer Woven Preforms”, Ninth Technical Conference of the AmericanSociety for Composites, Newark, Delaware, U. S. A., September 20-22, 1994.
6. Coman, F., Herszberg, I., Bannister, M., John, S., “A Realistic Computer Simulation ofMultilayer Woven Preforms for the Analysis of Composite Structures”, CADCOMP 96,Udine, Italy, July 1-3, 1996.
7. Callus, P., Dixon, K., Leong, K.H., Herszberg, I. and Bannister, M., “DamageVisualisation During the Tensile Testing of Multilayer Woven Glass/Vinyl EsterComposites”, To be presented at the International Aerospace Congress IAC97, Sydney,Australia, February 25-27, 1997.
8. Minguet, P. J., Fedro, M. J., Gunther, C. K., “Test Methods for Textile Composites”,NASA CR-4609, Langley Research Center, July, 1994.
9. Highsmith, A.L. and Reifsnider, K. L., “Stiffness-Reduction Mechanisms in CompositeLaminates”, Damage in Composite Materials, ASTM STP 775, K. L. Reifsnider, Ed.,American Society for Testing and Materials, 1982, pp. 103-117.
10. “Derakane Epoxy Vinyl Ester Resins, Product and Usage Guide”, Dow Plastics,September, 1994, 20 pp.
11. Kies, J.A., “Maximum Strains in the Resin of Fibreglass Composites”, U.S. NavalResearch Laboratory, Ballistics Branch, Mech. Div., NRL Report 5752, March 26,1962.

Proceedings of ICCM–11, Gold Coast, Australia, 14th-18th July 1997
V - 47
INTERLAMINAR DELAMINATION TOUGHNESSAND STRENGTH OF 3-D ORTHOGONAL
INTERLOCKED FABRIC COMPOSITE
Yasuyo Tanzawa1 , Naoyuki Watanabe2 and Takashi Ishikawa3
1 Graduate Student, Department of Aerospace EngineeringTokyo Metropolitan Institute of Technology, 6-6, Asahigaoka, Hino, Tokyo 191, JAPAN
2 Associate Professor, Department of Aerospace EngineeringTokyo Metropolitan Institute of Technology
3 Section Head, Airframe Division, National Aerospace Laboratory6-13-1 Ohsawa, Mitaka, Tokyo 181, JAPAN
SUMMARY: The double cantilever beam (DCB) tests were executed for interlaminarfracture toughness of 3-D orthogonal interlocked fabric composite. The jagged load-deflection curves caused by unstable crack propagation were obtained. The strain energyrelease rate for 3-D composite becomes far higher even if the volume fraction of z-directionfiber is small, and becomes higher as the volume fraction becomes high. The observation ofthe specimens revealed that z-direction fibers made the fracture more complex and causedmany characteristic phenomena: debondings of the z-direction fiber from in-plane layer; itsfailure or pull-out and bridging of z-direction fiber; crack branching, deviation and secondarycrack almost in front of the crack tip. They may increase the absorbed fracture energy. Thedouble-notched shear (DNS) tests were carried out to estimate the interlaminar shear strengthof the present composite. The shear strength were nearly equal for different distance betweenthe notches at least for tested cases.
KEYWORDS: 3-D orthogonal interlocked fabric composite, tabbed DCB test, DNS test,mode I strain energy release rate, fiber bridging
INTRODUCTION
Fiber reinforced composite materials have many advantages and are frequently used in manykinds of fields [1], but most of them are two-dimensional (2-D) laminated composites, sointerlaminar delamination is the weakest failure mode in these materials. In fact, thedelamination is considered to be the most prevent life-limiting growth mode in compositestructures [2]. Various techniques have been introduced to enhance the interlaminar strength.One way is a usage of thermoplastic or toughened thermoset matrices. One of the mosteffective way is three-dimensional (3-D) fabric construction technique [3], [4] such asbraiding, weaving, knitting or stitching process. Among them, the orthogonal interlockedfabric composite provides fiber architecture aimed at retaining in-plane performance whileenhancing out-of-plane properties, by including a small amount of through-the-thicknessreinforcement [5]. It is important to investigate quantitatively the influence of the z-directionreinforcement on the material performances to assess fully the trade-off study between in-

Volume V: Textile Composites and Characterisation
V - 48
plane and interlaminar properties in the design of fabric composite structures. Until now,several experimental studies about interlaminar toughness have been done for 3-D fabriccomposites [6] - [8]. On the other hand, to the authors' knowledge, few analyses have beencarried out about the material [9]. The authors modified the model used in Ref. 9 and carriedout the analyses [10].
In this paper, two kinds of the experiments related to the interlaminar properties of 3-Dorthogonal interlocked fabric composite are performed. The DCB tests were executed forMode I interlaminar fracture toughness and the results were compared with those ofunidirectional composite. The effect of z-direction fiber bundle on the interlaminar fracturebehavior of the material is discussed. From the observation of the specimen after the test, thefracture mechanism of the material is discussed. To estimate the interlaminar shear strengthof the 3-D composite, the double-notched shear (DNS) tests were carried out in compression.
EXPERIMENTS
Material Systems and Properties
in-plane fiber
z-fiber
Fig. 1: Fiber structure of five-axes 3-D orthogonal interlocked fabric composite
The orthogonal interlocked fabric composites used in our experiments were made ofCF/Epoxy, which were manufactured in Nagoya Aerospace Systems Division, MitsubishiHeavy Industries, Co. Ltd. (MHI). The fiber architecture of 3-D composite used here is givenin Figure 1. It was composed of five axes fiber yarns: four of them were in-plane and the otherwas z-direction. To fabricate the composites, resin transfer molding (RTM) process wasadopted. The stacking sequence was [±45/0/90]3S thus the total number of plies is 24.Detailed data of the properties of 3-D composite used here is given in Table 1. Carbon fiberTR40 was used for in-plane fiber in all the specimens. There were three types of thespecimens: C1 and C2 were reinforced in z-direction by carbon fiber TR40 and K isreinforced in z-direction by aramid fiber K49. The z-direction fiber tows were 1K or 3K,respectively in C1 and C2, thus volume fraction of fibers running in the z-direction wssdifferent. The unidirectional composite with heat resistant thermoplastic resin, CF/PI-SP, wasalso tested as a reference. The properties of PI-SP are as follows: Tg = 254 [°C], the tensilestrength = 91.2 [MPa] and the tensile modulus = 2.65 [GPa].

Proceedings of ICCM–11, Gold Coast, Australia, 14th-18th July 1997
V - 49
Table 1: Properties of 3-D orthogonal interlocked fabric composite
Type C1 C2 Kfibers in-plane TR40 - 12K (carbon fiber)
z-direction TR40 - 1K TR40 - 3K K49 - 768distance between z-fibers [mm] 3.9 Å~ 3.9
total 54.2 54.7 54.50° 20.6 20.4 20.5
fiber volume fraction [%] - 45° 29.2 28.9 29.0+45° 29.2 28.9 29.090° 20.6 20.4 20.5
z-direction 0.5 1.4 1.1
Testing Procedure for DCB Test
25mm
2mm
3mm
12.8mm
0.4mm6.4mm 2.5mm11.4mm
Unidirectional CFRP Tab 3-D Composite
Fig. 2: Geometry of tabbed DCB specimen
The DCB test is a common method for Mode I interlaminar fracture toughness. This methodhas been applied to 2-D composite laminate successfully. However classical DCB specimencannot be used in the test for 3-D composites. Because this material has high interlaminarstrength, usually it fails first at the root of the DCB beam by a bending moment with nointerlaminar fracture toughness data. To avoid this difficulty, several methods have beencontrived recently. For example, Guenon et al. developed one method by using the tabbedDCB specimen [5]. Another test method developed in National Aerospace Laboratory byIshikawa et al. [7].
Fig. 3: Test configuration of tabbed DCB specimen

Volume V: Textile Composites and Characterisation
V - 50
Figure 2 shows the specimen design and dimensions used in this study, which have beendeveloped by Ishikawa et al. This specimen is cut out to insert the jig useful when the load toextend the delamination is high. Figure 3 shows the feature of the specimen usingunidirectional CFRP tab. Initial crack was given in this specimen artificially by machining.The width of the specimen was measured at three points and initial artificial crack length wasmeasured on both sides. The DCB specimen was loaded in tension by the INSTRON 4502screw-driven testing machine in a displacement-controlled mode with 0.25 [mm/min] cross-head speed.
Figure 4 illustrates the schematic load-deflection curve for the present 3-D composite. Thespecimen was loaded till the load decreased suddenly at the point A, then the machine wasstopped to measure the crack length. For the current 3-D composites, it is uncertain whether
ĢA
P 1
2P
δ 1 δ 2
A
B
C
O
Lo
ad
Opening Displacement
Fig. 4: Schematic load-deflection curve of 3-D composite
the geometry of crack is similar to that of initial states or not. Therefore, the crack length wasmeasured on both sides and the averaged value was employed. This average was used incalculation of the strain energy release rate, GI, under the assumption of a straight tip line.The curve of load versus crack opening displacement, which is assumed to be identical withcross head displacement, had been plotted during the experiment. After the experiment,loads and opening displacements at the instances when the load suddenly dropped werepicked up. With these data, GI was calculated by the area method, which is based on energyconsideration and suitable to estimate it for the 3-D composites. The first load drop point wasneglected and other data after the second drop were utilized to calculate GI because the firstdrop is affected by a dull artificial crack tip.
Testing Procedure for Shear Tests
The interlaminar shear strength was evaluated with the DNS tests. The geometry of thespecimen is shown in Figure 5. The specimen has two alternate notches with interval of Lwhose depths are half of the thickness of the specimen. Restricting the thickness-wisedeformation, the specimen was compressed up to failure between the notches by theINSTRON 4505 screw-driven testing machine in a displacement-controlled mode with 1.0[mm/min] cross-head speed. The tests were conducted for two types of the specimen ofdifferent distances between the notches 6.4 [mm] and 12.7 [mm].
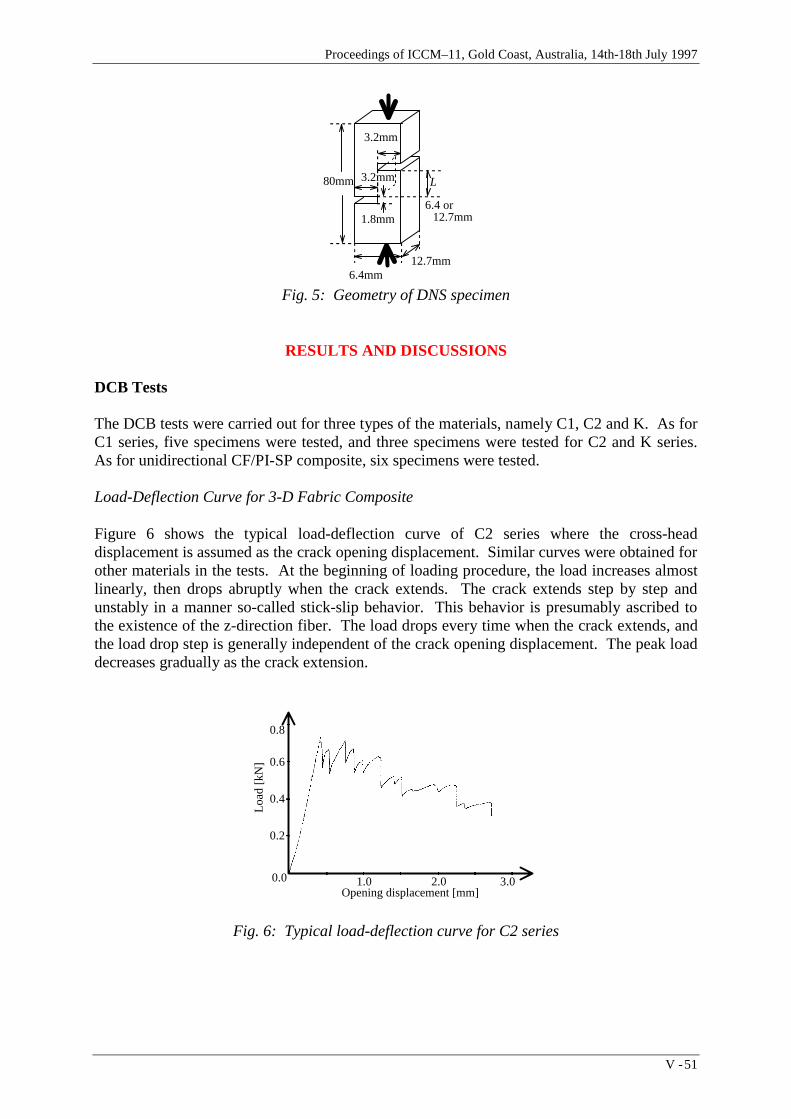
Proceedings of ICCM–11, Gold Coast, Australia, 14th-18th July 1997
V - 51
80mm
6.4mm12.7mm
6.4 or 12.7mm
3.2mm
3.2mm
1.8mm
L
Fig. 5: Geometry of DNS specimen
RESULTS AND DISCUSSIONS
DCB Tests
The DCB tests were carried out for three types of the materials, namely C1, C2 and K. As forC1 series, five specimens were tested, and three specimens were tested for C2 and K series.As for unidirectional CF/PI-SP composite, six specimens were tested.
Load-Deflection Curve for 3-D Fabric Composite
Figure 6 shows the typical load-deflection curve of C2 series where the cross-headdisplacement is assumed as the crack opening displacement. Similar curves were obtained forother materials in the tests. At the beginning of loading procedure, the load increases almostlinearly, then drops abruptly when the crack extends. The crack extends step by step andunstably in a manner so-called stick-slip behavior. This behavior is presumably ascribed tothe existence of the z-direction fiber. The load drops every time when the crack extends, andthe load drop step is generally independent of the crack opening displacement. The peak loaddecreases gradually as the crack extension.
0.2
0.4
0.6
0.8
Lo
ad
[kN
]
0.0 1.0 2.0 3.0Opening displacement [mm]
Fig. 6: Typical load-deflection curve for C2 series

Volume V: Textile Composites and Characterisation
V - 52
Effect of z-direction Fibers
Figure 7 shows the Mode I strain energy release rate GI, for C1 series as a function ofnormalized crack growth length. The normalized crack growth length is defined as ( a - a0 ) /a0, where a is an instant crack length and a0 is an initial crack length. The averaged values ofGI for all the specimens are listed in Table 2. The values for #1 and #2 are distributed in anarrow region, from 0.69 [kN/m] to 1.54 [kN/m] for #1 and from 0.75 [kN/m] to 1.54 [kN/m]for #2. The averaged values for #1 and #2 are 0.99 [kN/m] and 1.33 [kN/m], respectively, aslisted in Table 2. On the other hand, the values of GI for #3, #4 and #5 are distributed widely,for example, from 0.45 [kN/m] to 4.73 [kN/m] for #5. Most values for these three specimensare higher than those for #1 and #2, with the higher average of 1.42 [kN/m] for #3, 1.86[kN/m] for #4 and 1.55 [kN/m] for #5. On the whole, the GI values remain in particularregion from 0.8 [kN/m] to 2.0 [kN/m] with a few exception, exhibiting the average for C1series of 1.43 [kN/m].
0.00
1.00
2.00
3.00
4.00
5.00
0.00 0.400 0.800 1.20 1.60
#1#2#3#4#5
Normalized crack growth
ease rate [kN/m]
Fig. 7: Strain energy release rate for C1 series as a function of normalizedcrack growth length
Table 2: Strain energy release rate of 3-D orthogonal interlocked fabric composite
Strain energy release rate [kN/m]Type Specimen average
#1 #2 #3 #4 #5C1 0.99 1.33 1.42 1.86 1.55 1.43C2 6.18 4.95 3.79 4.98K 3.43 2.75 3.25 3.14
The averaged strain energy release rates of unidirectional CF/PI-SP for all the specimens arelisted in Table 3. The values are nearly constant with the average of the whole values of 0.64[kN/m], which is considerably lower than that of C1 series. In Ref. 11, it was reported that GIfor conventional unidirectional CF/Epoxy composite was 0.094 [kN/m] and that forunidirectional CF/PEEK composite was 1.82 [kN/m]. Comparing with these results, the valueof GI for C1 series is high enough, although this composite system with normal epoxy resincontains only 0.5% of z-direction fibers.

Proceedings of ICCM–11, Gold Coast, Australia, 14th-18th July 1997
V - 53
Table 3: Strain energy release rate of unidirectional CF/PI-SP composite
Strain energy release rate [kN/m]Specimen average
#1 #2 #3 #4 #5 #60.53 0.62 0.68 0.63 0.70 0.66 0.64
Effect of the Volume Fraction of z-direction Fibers
0.00
5.00
10.0
15.0
20.0
0.00 0.400 0.800 1.20 1.60
#2#1
#3
Normalized crack growth
ease rate [kN/m]
Fig. 8: Strain energy release rate for C2 series as a function ofnormalized crack growth length
Figure 8 shows the GI for C2 series as a function of normalized crack growth length and theiraverage are also listed in Table 2. The values of GI for #1 and #2 are distributed widely, from1.23 [kN/m] to 16.36 [kN/m] for #1 and from 0.99 [kN/m] to 10.22 [kN/m] for #2 with theaverage for #1 and #2 being 6.18 [kN/m] and 4.95 [kN/m], respectively. In the case of #3, GIare distributed in a narrow region, from 3.23 [kN/m] to 5.14 [kN/m] with 3.79 [kN/m] inaverage. The averaged value for whole C2 series is obtained as 4.98 [kN/m]. Figure 9 showsthe results for K series as a function of normalized crack growth length. The averaged valuesfor each specimen are 3.43 [kN/m] for #1, 2.75 [kN/m] for #2 and 3.25 [kN/m] for #3 with thewhole average of 3.14 [kN/m], as listed in Table 2. Note that the values of GI for eachspecimen disperse widely again, for example, from 0.33 [kN/m] to 7.83 [kN/m] for #3. Atendency that GI becomes high with crack growth is observed.
0.00
2.00
4.00
6.00
8.00
10.0
0.00 0.400 0.800 1.20 1.60
#1#2#3
Normalized crack growth
ease rate [kN/m]
Fig. 9: Strain energy release rate for K series as a function ofnormalized crack growth length
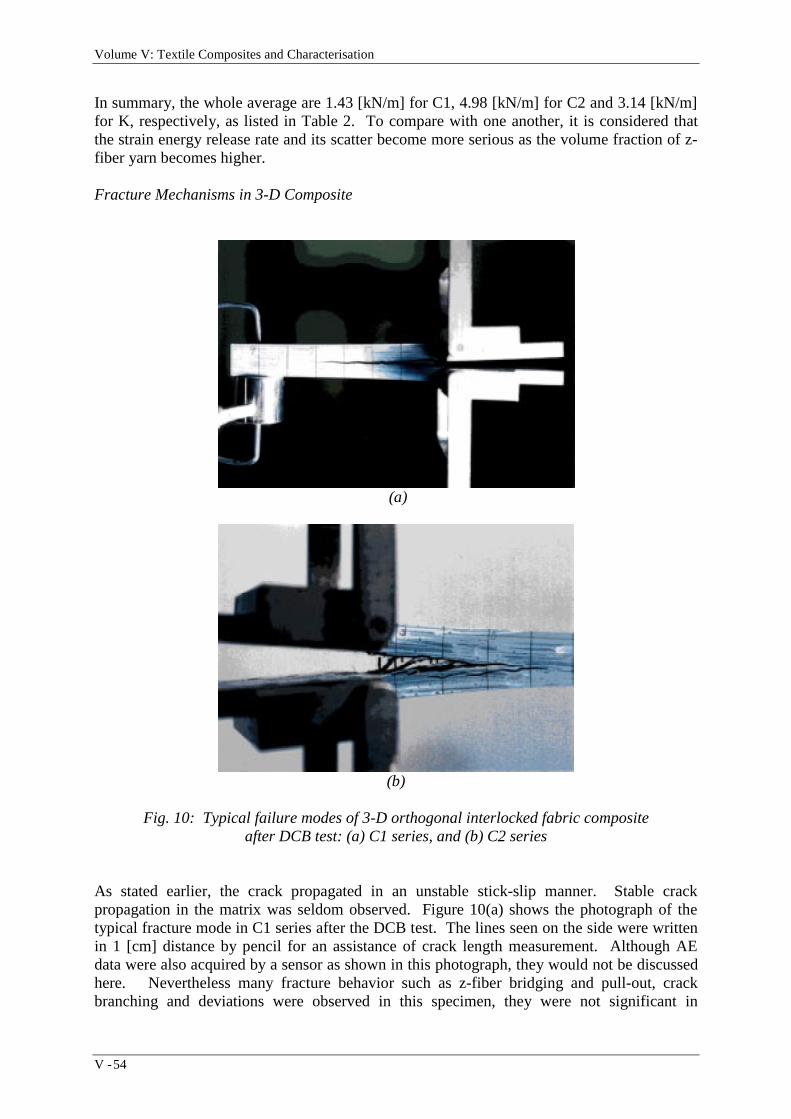
Volume V: Textile Composites and Characterisation
V - 54
In summary, the whole average are 1.43 [kN/m] for C1, 4.98 [kN/m] for C2 and 3.14 [kN/m]for K, respectively, as listed in Table 2. To compare with one another, it is considered thatthe strain energy release rate and its scatter become more serious as the volume fraction of z-fiber yarn becomes higher.
Fracture Mechanisms in 3-D Composite
(a)
(b)
Fig. 10: Typical failure modes of 3-D orthogonal interlocked fabric compositeafter DCB test: (a) C1 series, and (b) C2 series
As stated earlier, the crack propagated in an unstable stick-slip manner. Stable crackpropagation in the matrix was seldom observed. Figure 10(a) shows the photograph of thetypical fracture mode in C1 series after the DCB test. The lines seen on the side were writtenin 1 [cm] distance by pencil for an assistance of crack length measurement. Although AEdata were also acquired by a sensor as shown in this photograph, they would not be discussedhere. Nevertheless many fracture behavior such as z-fiber bridging and pull-out, crackbranching and deviations were observed in this specimen, they were not significant in

Proceedings of ICCM–11, Gold Coast, Australia, 14th-18th July 1997
V - 55
comparison with C2. The in-plane fiber bridging and pull-out were also observed. Figure10(b) shows the photograph of the typical fracture mode in C2 series where it is indicated thatthe secondary cracks were created and they generally ran parallel to the main crack. The z-fiber bridging and pull-out were prominently observed in this specimen. In addition, failurein most z-direction fibers did not occur in the plane of crack propagation but occurred in theregion near the surface where a stress concentration could be expected in the manufacturingprocess. Based on comparison of the fracture mode between C1 and C2, it is dearlyunderstood that the mechanisms of fracture becomes more complex as z-fiber volume fractionincreases. While the load supported by the z-direction fiber increases as z-fiber volumefraction increases, the crack deviation or branching become serious because of the existenceof z-fiber.
From these observations, various kinds of fracture phenomena could be found in 3-Dcomposite toughness tests: debondings of z-direction fiber from in plane layers; its failure orpull-out, and bridging by z-direction fiber; crack branching, deviation and secondary crackalmost everywhere in front of the crack tip. In addition, the crack branching and deviationmay lead to bridging by in-plane fibers. Because these phenomena can be considered toincrease the absorbed fracture energy, the crack propagation is apt to be arrested.
Interlaminar Shear Tests
Fig. 11: Typical fracture modes of 3-D orthogonal interlockedfabric composite after the DNS tests
The short beam shear (SBS) test in three-point bending is often used as a simple andconvenient method. Although these tests were carried out, the results exhibited seriousdependency on the distance between the supporting points. Therefore, the interlaminar shearstrength was evaluated with the DNS tests in compression. These tests were carried out onlyfor C2 series specimens by two types of the distances between the notches, 6.4 [mm]: A and12.7 [mm]: B. The number of specimens was five for each type. The interlaminar shearstrength for Type A and Type B were distributed from 86.85 [MPa] to 114.22 [MPa] for TypeA and from 92.34 [MPa] to 102.21 [MPa] for Type B. The pitch of z-direction fibers is 3.9[mm] in the present composite, thus only one or two z-fiber exist between the notches forType A, while there are three or four z-fibers between the notches for Type B. Therefore, theinterlaminar shear strength obtained with Type A depends on the state of the specimen and itsscatter becomes serious. On the other hand, the results of Type B exhibit lower scatter thanthose of Type A. The interlaminar shear strength average were 99.80 [MPa] for Type A and

Volume V: Textile Composites and Characterisation
V - 56
97.13 [MPa] for Type B with only 2.7% difference between them, although their scatter levelwere different each other. Therefore, no dependency of the interlaminar shear strength on thedistance between the notches was found so far as tested. Figure 11 shows the failure mode oftype B after the tests. Only single delaminaton was observed between the notches along 0°axis fiber yarn, which could be regarded as the result of almost pure-shear fracture.
CONCLUSIONS
The interlaminar fracture toughness and strength of the 3-D orthogonal interlocked fabricCF/Epoxy were evaluated by using the tabbed DCB specimen and the interlaminar shear tests.The area method was used in calculation of the strain energy release rate. The interlaminarshear tests were carried out with the DNS test in compression. The conclusions are given asfollows:
1) The DCB tests were carried out for C1, C2 and K series with the volume fractions of z-direction fiber being 0.5% for C1, 1.4% for C2 and 1.1% for K. The obtained strainenergy release rate averages were 1.43 [kN/m] for C1, 4.98 [kN/m] for C2 and 3.14[kN/m] for K, respectively.
2) The value of the strain energy release rate for 3-D orthogonal interlocked fabriccomposites was compared with those for tougher unidirectional composites. Althoughthe volume fraction of z-direction fiber is only 0.5%, the strain energy release rate of 3-D CF/Epoxy is fifteen-fold greater than that of the UD composite of similar resinwithout z-direction reinforcements.
3) The difference of the strain energy release rate due to the difference of z-fiber volumefraction was also discussed. The strain energy release rate comes to higher as the z-fiber increases. Moreover, serious scatter was found in the results of the strain energyrelease rate, and the scatter became more serious with increasing the volume fraction ofz-direction fiber.
4) The load-deflection curves of 3-D composite were much different from those ofunidirectional composites. The jagged curve was obtained for 3-D due to unstablestick-slip crack propagation.
5) During and after the DCB tests, the interlaminar crack propagation processes wereobserved and fracture mechanisms were contemplated. They are far more complicatedthan those in unidirectional composites. The presence of z-direction fibers causes manycharacteristic phenomena: debondings of z-direction fiber from in-plane layers; itsfailure or pull-out, and bridging by z-direction fiber; crack branching, deviation andsecondary crack almost everywhere in front of the crack tip. The bridging by in-planefibers may occur because of the crack branching and deviation. These phenomenaincreases the absorbed fracture energy and the crack propagation tends to be arrested.
6) The interlaminar shear strengths obtained by the SBS test exhibited strong dependencyon the distance between the supporting points. On the contrary, those by the DNS testsexhibited almost no dependency on distance between the notches at least for testedcases. It is concluded at present that the DNS test is suitable to evaluate theinterlaminar shear strength of the 3-D orthogonal interlocked fabric composite.
Proceedings of ICCM–11, Gold Coast, Australia, 14th-18th July 1997
V - 57
ACKNOWLEDGMENTS
The authors thank Mr. Y. Hayashi and Mr. M. Matsushima, Composite Structure Section,Airframe Division, National Aerospace Laboratory, for their help in the experiments. Theauthors also thank Mr. Y. Shinya, Nagoya Aerospace Systems Division, Mitsubishi HeavyIndustries, Co. Ltd., for fabrication of the materials used in the experiment.
REFERENCES
1. Mallic, P. K., Fiber-Reinforced Composite; materials, manufacturing, and design, 2nded., Marcel Dekker Inc., 1993.
2. Whitney, J. M., “Experimental Characterization of Delamination Fracture,”Interlaminar Response of Composite Materials, Composite Material Series 5, Pagano,N. J. Ed., Elsever Science Publishers B.V., 1989.
3. Ko, F. K., “Three-Dimensional Fabric For Composite,” Textile Structural Composite,Chou, T. W. and Ko, F. K. Ed., Elsivier Publisher, New York, 1989.
4. Chou, T. W., Microstructural Design of Fiber Composites, Cambridge University Press,New York, 1992.
5. Guenon, V. A. F., Chou, T. W and Gillespie, J. W., “Toughness Properties of a Three-Dimensional Carbon-Epoxy Composite,” Journal of Material Science, Vol.24, 1989,pp.4168 - 4175.
6. Guenon, V. A. F., “Interlaminar Fracture Toughness of a Three-DimensionalComposite,” Master Thesis of Applied Science in Mechanical Engineering, Universityof Delaware, 1987.
7. Ishikawa, H., Ji, M., Anahara, M. and Yasui, Y., “The Estimation of Fracture ofOrthogonal Three-Dimensional Fiber-Reinforced Composite By DCB Testing,”Proceedings of 71th Ordinary General Meeting of the Japan Society of MechanicalEngineers, 1994, pp.455-457. (in Japanese).
8. Ishikawa, T., Matsushima, M., Bansaku, K., Watanabe, N. and Sunakawa, M.,“Experimental Results of Interlaminar Fracture Toughness and In-Plane Strength of 3-DWoven CF/Epoxy Plates,” Proceedings of Seminar of the Japan Society for CompositeMaterials, 1996, pp.51-52. (in Japanese).
9. Byun, J. H., Gillespie, J. W. and Chou, T. W., “Mode I Delamination of a Three-Dimensional Fabric Composite,” Journal of Composite Materials, Vol.24, 1990,pp.497-518.
10. Watanabe, N. and Tanzawa, Y., “Delamination Analysis of 3-D Orthogonal InterlockedFabric Composite,” Proceedings of 37th AIAA SDM Conference, April 1996, AIAA-96-1418.
11. Matsushima, M., Ishikawa, T., Hayashi, Y. and Kobayashi, S., “ExperimentalInvestigation of Interlaminar Fracture Toughness of Carbon Fiber/Thermoplastic andCarbon Fiber/Thermosetting Composite by DCB Specimens,” Report of NationalAerospace Laboratory, TR-1096, 1991, pp.3-16. (in Japanese).

Volume V: Textile Composites and Characterisation
V - 58
DAMAGE DEVELOPMENT IN PLAIN WEAVE GFRP
C.I.C. Manger1, S.L. Ogin1, P.A. Smith1 and R.P. Greaves2
1 Department of Materials Science and Engineering, University of Surrey, Guildford,GU2 5XH, UK
2 Rolls-Royce Plc., PO Box 31, Derby, DE24 8BJ, UK
SUMMARY: Damage development in a two layer plain weave glass/epoxy system underquasi-static loading has been investigated. The damage comprised matrix cracking anddelamination. Three distinct types of damage morphology were found and were related to therelative shift of the fabric laminae with respect to each other. The tortuous path of the transversecracking and repeat of damage patterns were found to depend upon tow and weavecharacteristics, respectively.
KEYWORDS: plain weave, GFRP, damage development, lamina shift.
INTRODUCTION
Over recent years there has been a renewed interest in woven composite materials. Althoughwoven composites exhibit slightly (approximately 5-10 %) lower moduli and strength thanequivalent cross-ply laminates they offer some specific advantages. They have very gooddrapability, especially the common eight harness satin weave. Manufacturing costs can bereduced as one layer of cloth replaces two unidirectional plies, resulting in easier handling andshorter lay-up times. They also have better impact resistance as the nature of the weave localisesthe damage.
The theoretical modelling of the elastic behaviour of woven fabric composite materials is nowwell developed. This includes both closed form analytical models building on the early researchof Chou and co-workers, e.g. [1], and finite element methods such as those of Whitcomb [2].However, due to the nature of the fibre architecture and the associated complex damagemorphology, work concerned with characterising and predicting damage onset and growth,together with the effect of damage on residual properties, is more limited. Present modelsrequire extensive computational effort and involve many simplifications, e.g. [3]. The aim of thepresent work is to address these issues making use of a model (transparent) GFRP system inorder to facilitate damage observation.
Marsden et al. [4-6] characterised the damage in an eight harness satin weave glass/epoxycomposite under both quasi-static and fatigue loading. Damage development was found to be afunction of tow and weave architecture. It is clear from the work of Marsden et al. [4-6] andBoniface et al. [7] that cracking damage in woven GFRP and CFRP has a complex morphologyand that this morphology needs to be understood before the effect of damage can be modelled.The present paper studies the damage initiation and development in a plain weave glass/epoxycomposite.
In the present work a laminate assembled from two layers of plain weave fabric was used. Aparticular feature of interest has been the effect of the shift of the fabric layers relative to oneanother on the damage pattern which develops. The effect of this shift on material properties hasbeen considered analytically by other workers. The models of Naik and Shembekar [8] report

Proceedings of ICCM–11, Gold Coast, Australia, 14th-18th July 1997
V - 59
optimum elastic properties for configurations out of phase with one another, i.e. fabric layersshifted relative to each other. Yurgartis and Maurer [9] suggest that relative lamina shift, alongwith weave configuration and stacking sequence, influence interlaminar shear strength.
MATERIALS AND EXPERIMENTAL METHODS
The reinforcement used was an E-glass plain weave fabric with similar warp and weft towsconsisting of three finer bundles twisted together (Fig. 1). The cloth has a weight of 182 g/m2
and thickness of 0.15 mm. It was marginally unbalanced with 142 and 126 tow ends in the warpand weft directions, respectively. The matrix used was an Epikote 828 epoxy resin with anNMA curing agent and Ancamine K61B accelerator. Laminates were fabricated using a twolayer wet lay up process, in which resin was introduced into cloths which had been carefullymarked out to ensure alignment and stacked so as to maintain overall maintain symmetry aboutthe mid-plane. The laminates were cured at 100oC for 3 hours and post-cured at 150oC for afurther 3 hours.
Figure 1. SEM photomicrograph of plain weave cloth
Test coupons (20 mm x 200 mm) were cut using a water cooled diamond saw. Aluminium endtags of dimensions 20 mm x 50 mm were bonded to the coupons leaving a 100 mm gauge lengthat the centre of which were bonded strain gauges. Quasi-static mechanical testing wasperformed using an Instron 1175 machine at a crosshead speed of 0.5 mm/min. Data wasrecorded using a PC-based data-logger package. A linear regression analysis of the stress-straincurve between 1000 and 4000 microstrain was carried out to obtain moduli data.
Observations of damage accumulation were facilitated by the transparent nature of the GFRP,which allowed the plan view damage development to be observed by in situ photography.Samples were unclamped from the grips of the testing machine prior to being photographed.Polishing longitudinal edge sections allows the through thickness profile of the damage to bestudied, following the method of Marsden et al. [6]. With accurate measurements during samplepreparation, a plan view array of cracks may be located and viewed in cross section.

Volume V: Textile Composites and Characterisation
V - 60
RESULTS
Laminate Properties
Laminate properties are given in Table 1. The number in brackets denotes the number ofsamples tested. Crack initiation and failure strains are comparable to those found by Marsden etal. [6] on a similar eight harness satin material. The relatively low volume fraction of 36 % isattributed to the open nature of the weave and low pressure used in fabrication. The variation inmodulus is largely attributable to local variations in laminate thickness due to nesting and thethin nature of the cloth.
Table 1: Laminate properties
E0 (GPa) 18.7 ± 1.4 (12)
σTS (MPa) 260
εi (%) 0.6
εf (%) 2.1
Vf (%) 36
Thickness (mm) ~0.4
Damage Development
Under quasi-static loading short transverse cracks of approximately 1 mm in length initiate in theweft tows at an initiation strain, εi, of approximately 0.6 %. Photographs of edge sections showthe initial damage occurs near the tow centre (Fig.2a). The crack path is often complicated and isdiverted at the interfaces of the three twisted bundles within each tow. At higher levels of strainfurther cracking initiates towards the tow ends (Fig 2b). The damage tends to saturate, resultingin a reasonably regular spacing within the tows of approximately twice the tow thickness(Fig.2c). The damage is confined to the tows and does not extend into the matrix.
Plan view photomicrographs show that the transverse cracking is aligned at approximately 5 -10o to the horizontal weft tows which is a result of the cracks following the line of the twistwithin the tows. The average crack length at saturation is roughly equivalent to the inter-crimpdistance which is much less than the laminate width.

Proceedings of ICCM–11, Gold Coast, Australia, 14th-18th July 1997
V - 61
(a)
(b)
(c)
Figure 2: Polished edge section photomicrographs of damage at(a) 1.0 % strain, (b) 1.2 % strain and (c) 1.6 % strain.
Interestingly, there are three types of damage morphology that may be found in any onelaminate. The use of edge sections to study the local relative position of the cloths has shown themorphologies to be as follows.

Volume V: Textile Composites and Characterisation
V - 62
Banded transverse cracking in weft tows.
The plan view here shows damage to be contained in horizontal bands, perpendicular to theloading direction, P, which are composed of transverse cracks in the weft tows (Fig 3a). Theloading direction indicated applies to parts (a), (b) and (c) of the figure. This damagemorphology occurs when the two cloths lie in phase with one another as shown in Fig. 3b andindicated schematically in Fig. 3c. The two weft tows are superimposed resulting in damage freeresin rich bands.
(a) Í P Î
delamination(b)
(c)
Figure 3: Damage morphology of case A, (a) plan view photomicrograph, (b) polished edge section photomicrograph and
(c) schematic representation of edge section

Proceedings of ICCM–11, Gold Coast, Australia, 14th-18th July 1997
V - 63
Banded transverse cracking in weft tows with a regular array of delaminations.
In this damage morphology the plan view damage is similar to case A but with additionaldelaminations orientated in the loading direction (Fig. 4a). These delaminations initiate atapproximately 1.5 % strain. In this case the two cloths are symmetrical about the mid-plane, i.e.180o out of phase (Fig. 4b and Fig. 4c) and the transverse cracking is arranged in bands as in caseA. The delaminations occur at sites where two warp tows touch, i.e. every 180o. This leads to adelamination at every other warp / weft cross over point. The delaminations are dependent onlaminate consolidation and are found only if the warp tows are touching.
(a) Í P Î
(b)
delamination
transverse crack
(c)
Figure 4: Damage morphology of case B, (a) plan view photomicrograph, (b) polished edge section photomicrograph and
(c) schematic representation of edge section

Volume V: Textile Composites and Characterisation
V - 64
Regularly distributed plan view transverse cracking in weft tows.
This is shown in plan view in Figure 5a and results when the cloths are at some intermediatephase between the above two cases (Fig. 5b and Fig.5c). The adjacent weft tows are no longersuperimposed and overlap when viewed in plan view, resulting in no through-thickness resin richregions.
(a) Í P Î
(b)
(c)
Figure 5: Damage morphology of case C, (a) plan view photomicrograph,(b) polished edge section photomicrograph and
(c) schematic representation of edge section

Proceedings of ICCM–11, Gold Coast, Australia, 14th-18th July 1997
V - 65
Similarities in cracking morphology can be found for all three cases. Transverse crackingappears to be more pronounced at cross over points between the warp and weft tows. This canclearly be seen in both cases A and B. Delaminations may be found in cases A and C at highdamage densities, although the delaminations do not appear with the regularity seen in case B.Such a delamination is shown in Figure 3b, located at the interface of a warp and weft tow. Ofthe three crack morphologies the banded plan view damage morphology (case A) was found tobe dominant, suggesting that the open nature of the plain weave cloth encourages nesting of thecloths on one another during consolidation.
In this study it has been shown that the relative shift of adjacent cloths influences damagemorphology, in addition to the previously reported influence on mechanical properties [4-5].These findings should be considered in any subsequent detailed modelling of the effect ofdamage development on mechanical properties of woven composite materials.
CONCLUSIONS
The damage morphology seen in a plain weave GFRP laminate under quasi-static loading wasfound to be dependent on tow characteristics, weave geometry and relative cloth shift. Thetransverse cracking morphology, both plan view and through thickness, was strongly influencedby the twist of individual tows, whilst the macroscopic cracking patterns were determined by theweave geometry and relative cloth shift. A regular array of delaminations between fabric layerswas found to result for relative cloth shifts of 180o, when the laminate was symmetrical about itsmid-plane. Transverse cracking initiated near the tow centre and, at saturation, developed areasonably regular saturation spacing within the tows of approximately twice the tow thickness.
ACKNOWLEDGEMENTS
The authors would like to thank Reg Whattingham for his technical assistance and also Rolls-Royce plc and the EPSRC for funding a CASE studentship for C. Manger.
REFERENCES
1. Ishikawa, T., Chou, T.-W., "Stiffness and Strength Behaviour of Woven FabricComposites", J. Mat. Sci., Vol. 17 (1982) pp.3211-3220.
2. Whitcomb, J.D., “Three-Dimensional Stress Analysis of Plain Weave Composites”,Composite Materials Fatigue and Fracture, Volume 3, T. K. O’Brien, ed., ASTM.STP1110, Philadelphia: American Society for Testing and Materials, pp. 417-438.
3. Whitcomb, J., Srirengan, K., "Effect of Various Approximations on PredictedProgressive Failure in Plain Weave Composites", NASA Conference Publication 3311Part 2, Mechanics of Textile Composites Conference, (1995) pp. 665-681.
4. Marsden, W. M., Boniface, L., Ogin, S. L., Smith, P. A., "Quantifying Damage inWoven Glass/Epoxy Laminates", Proc. FRC 94, Newcastle (1994) 32/ pp.1-9.

Volume V: Textile Composites and Characterisation
V - 66
5. Marsden, W. M., Boniface, L., Ogin, S. L., Smith, P. A., Greaves, R. P., "MatrixCracking and Stiffness Reduction in Woven Fabric Composites", Proc. ICCM 10, Eds.A. Poursartip and K. Street, published by The Tenth Int. Conf. On Comp. MaterialsSociety, Woodhead Publishing Ltd., Vancouver (1995) Vol. 1, pp. 431-438.
6. Marsden, W.M. "Damage Accumulation in a Woven Fabric Composite", Phd. Thesis.Department of Materials Science and Engineering, University of Surrey, Guildford, UK(1996).
7. Boniface, L., Gao, F., Marsden, W. M., Ogin, S. L., Smith, P. A., "Matrix CrackingPhenomena in Glass and Carbon Woven Fabric Composites", Proceedings of 3rdInternational Conference on Deformation and Fracture of Composites (1995) pp.317-325.
8. Naik, N. K., Shembekar, P. S., "Elastic Behaviour of Woven Fabric Composites: II -Laminate Analysis", J. Composite Mat., Vol. 26 (1992) pp.2226-2246.
9. Yurgartis, S. W., Maurer, J. P., "Modelling Weave and Stacking Configuration Effects
on Interlaminar Shear Stresses in Fabric Laminates", Composites, Vol. 24 (1993)pp.651-658.

Proceedings of ICCM–11, Gold Coast, Australia, 14th-18th July 1997
V - 67
A FLEXIBLE 3D FEA MODELLING APPROACH FORPREDICTING THE MECHANICAL PROPERTIES OF
PLAIN WEAVE UNIT CELL
P. Tan, L. Tong and G. P. Steven
Department of Aeronautical Engineering, University of Sydney, NSW 2006 AustraliaCooperative Research Center for Aerospace Structures, P.O.Box 30, 351 Milperra Road,
Bankstown, NSW 2200, Australia.
SUMMARY : A finite element analysis (FEA) modelling approach was developed forpredicting the mechanical properties of plain weave graphite/epoxy fabric-reinforcedcomposites. 3D FEA models for a single layer plain weave fabric were generated byinterfacing an in-house computer code with the FEA software Strand6 using 8-node brick and6-node wedge elements. The paths of the impregnated tow (or yarn) within the compositematerials were chosen to be sinusoidal, and a lenticular cross-section formed by twosinusoidal curves was utilised in the models. Pure tension and shear loading were applied.Results from FEA models were in good agreement with the present test results and thosereported in the literature. In addition, a parametric study illustrated the effects of thegeometrical dimensions of a unit cell on its mechanical properties.
KEYWORDS: woven fabric-reinforced composite, mechanical properties, finite elementanalysis (FEA) model
INTRODUCTION
Fibre reinforced woven fabric has been widely adopted in aerospace structures. To effectivelyutilise this material, it is necessary to evaluate its mechanical properties for a wide range ofweave architecture parameters and to tailor the composite to the specified requirements of itsrole in practical structures [2]. Measurements of these properties are difficult and can be veryexpensive when investigating the effects of some manufacturing and geometrical parameters.Fortunately, theoretical and FEA modelling provide a cost-effective alternative fordetermining these properties. However, modelling the architecture of woven fabric-reinforcedcomposite material in detail is difficult. Part of this difficult is due to the complicatedarchitecture of the woven fabric composite materials when viewed at the same scale as theweave geometry [3]. Hence, most of research workers developed the models based on thesimplified geometry of woven fabric composites. Earlier work was carried out by Ishakawaand Chou [4-7] who developed one-dimensional models for woven fabric-reinforcedcomposites. Later, various analytical and FEA models for predicting the mechanicalproperties of woven fabrics were proposed and developed, including the one-dimensionalmodels [8]; two-dimensional models [9-11] and three-dimensional models [12-15].
In this study a flexible 3D FEA modelling approach is proposed for determining themechanical properties of plain weave fabric-reinforced composite materials. The modelscreated are capable of producing a 3D representation and visualisation of any plain weave unit

Volume V: Textile Composites and Characterisation
V - 68
cell. The approach was validated by comparing with the test results. In addition, a parametricstudy was conducted to investigate the effects of geometric dimensions of a unit cell on itsmechanical properties.
DEVELOPMENT OF FEA MODEL FOR A PLAIN WEAVE UNIT CELL
When developing the computer model of a plain weave unit cell, it is predefined that themodel should be general and capable of further development and refinements. Thus, a generalmodel, capable of producing any required weave geometry, and not restricted to any particulargeometry or to a particular textile description, is required. For easy construction of any plainweave unit cell model, a flexible modelling approach is necessary. In addition, in order toevaluate the mechanical behaviour, a representation of a plain weave which is suitable forfinite element meshing and analysis is required [2]. In this section, the details of the geometryfor a woven fabric unit cell, the boundary conditions and loadings chosen will be discussed.The procedure for developing the 3D FEA models and the relevant assumptions will bedescribed.
lx
lylz
x
yz
x
yz
(a) with resin (b) without resin
Fig. 1: 3D FEA model for plain weave unit cell
Fig. 2: Photomicrograph of a section of T300/934 plane weave laminate
Geometry and Assumptions for Plain Weave Unit Cell
Due to the complicated architecture of woven fabrics, it is difficult to describe the 3D unit cellgeometry at the same scale as the woven fabric micro geometry. Hence, the geometricalmodel for a plain weave unit cell was established at the yarn level. Each yarn contains a fewthousand fibres, and all fibres in each yarn are assumed to follow the same path which is

Proceedings of ICCM–11, Gold Coast, Australia, 14th-18th July 1997
V - 69
chosen to be sinusoidal. Also, a strictly lenticular cross-section formed by two sinusoidalcurves is utilised in the model (see Fig. 1(a) with resin and (b) removing the resin from themodel). The 3D FEA models are easy to be created by interfacing an in-house computer codewith the FEA software Strand6 [1]. These models include some of the major parametersaffecting the mechanical properties of composite, ie. impregnated yarn orientation, fibrevolume fraction, mechanical properties of composite constituents. They can be evaluated fromthe scan of real weave fabric geometry (see Fig. 2), which was obtained by using an imageanalysis system together with the Iphoto Plus software. The mechanical properties for thecomposite constituents in a plain weave unit cell are considered to be homogeneous andisotropic for the resin but orthotropic for the impregnated fibre yarns with the respect to theprinciple material axis (or local coordinate system).
Boundary Conditions and Loadings
To evaluate the stiffness constants for a plain weave unit cell, six separate strain vectors arerespectively applied to the relevant unit cell model using the Lagrange Multipliers Method.Six separate FEA cases need to be run respectively on the same FEA model for thecorresponding six separate strain vectors (εx=0.001, εy=0.001, εz=0.001, γxy=0.001, γyz=0.001,γzx=0.001), and the relevant boundary conditions for each case are listed in Table 1.
Table 1: Boundary conditions for cases (a)-(f)
Case Boundary conditionsa DX|x=lx=0.001lx, DX|x=0=0, DY|y=0=DY|y=ly=0, DZ|z=0=DZ|z=lz=0b DY|y=ly=0.001ly, DY|y=0=0, DX|x=0=DX|x=lx =0, DZ|z=0=DZ|z=lz=0c DZ|z=lz=0.001lz, DZ|z=0=0, DX|x=0=DX|x=lx=0, DY|y=0=DY|y=ly=0d DX|y=ly=0.0005ly, DX|y=0=0, DY|x=lx=0.0005lx, DY|x=0=0, DZ|z=0=DZ|z=lz=0e DY|z=lz=0.0005lz, DY|z=0=0, DZ|y=ly=0.0005ly, DZ|y=0=0, DX|x=0=DX|x=lx=0,f DX|z=lz=0.0005lz, DX|z=0=0, DY|y=0=DY|y=ly=0, DZ|x=lx=0.0005lx, DZ|x=0=0
Considering the boundary conditions and strain vectors selected above, the requiredmechanical properties can be evaluated from the relevant equations [16].
EXPERIMENTAL VERIFICATION
In order to investigate the validity of the developed FEA models, 18 tests were carried out.The specimen preparation, testing procedure, experimental results and comparisons betweenthe predicted and testing results are discussed in this section.
Specimen Preparation and Testing Procedure
In this experimental investigation, plain weave graphic/epoxy fabric reinforced compositematerials T300/934 (3K-70-PW) were used.
Eight layers (or plies) of prepreg woven fabrics were laminated. The stacking sequence oflaminate specimens is balanced and symmetric so that the bending coupling stiffness andshear coupling stiffness terms are zero, and the torsion coupling stiffness is relatively low;
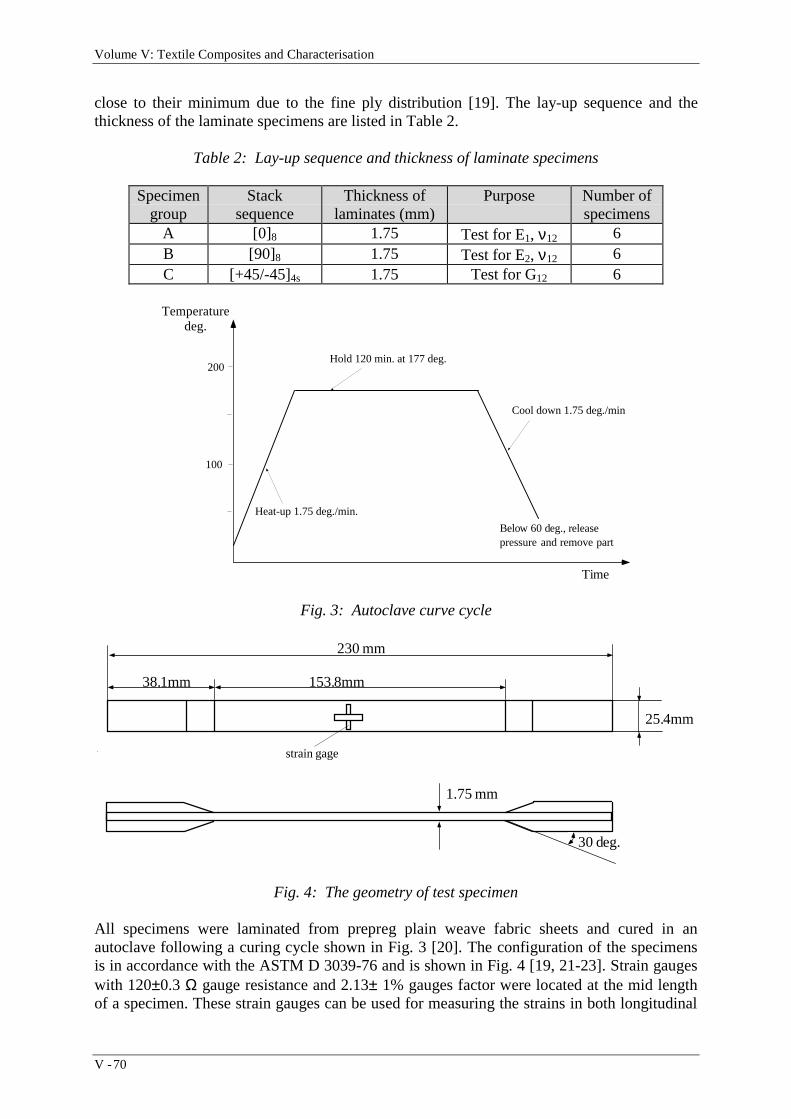
Volume V: Textile Composites and Characterisation
V - 70
close to their minimum due to the fine ply distribution [19]. The lay-up sequence and thethickness of the laminate specimens are listed in Table 2.
Table 2: Lay-up sequence and thickness of laminate specimens
Specimengroup
Stacksequence
Thickness oflaminates (mm)
Purpose Number ofspecimens
A [0]8 1.75 Test for E1, ν12 6B [90]8 1.75 Test for E2, ν12 6C [+45/-45]4s 1.75 Test for G12 6
Time
Temperature deg.
100
200Hold 120 min. at 177 deg.
Heat-up 1.75 deg./min.
Cool down 1.75 deg./min
Below 60 deg., releasepressure and remove part
Fig. 3: Autoclave curve cycle
38.1mm 153.8mm
230 mm
25.4mm
1.75 mm
30 deg.
strain gage
Fig. 4: The geometry of test specimen
All specimens were laminated from prepreg plain weave fabric sheets and cured in anautoclave following a curing cycle shown in Fig. 3 [20]. The configuration of the specimensis in accordance with the ASTM D 3039-76 and is shown in Fig. 4 [19, 21-23]. Strain gaugeswith 120±0.3 Ω gauge resistance and 2.13± 1% gauges factor were located at the mid lengthof a specimen. These strain gauges can be used for measuring the strains in both longitudinal

Proceedings of ICCM–11, Gold Coast, Australia, 14th-18th July 1997
V - 71
and transverse directions. Static tension tests were performed by Instron machine. Thespecimens were tested at a room temperature (26°C) and at a cross-head speed of 1mm/min.Two computer data acquisition systems were used in the test for collecting the relevant data,eg., the loading, displacement and the strains. These two systems were driven by the softwarepackages Instron Merlin and Labview respectively, which were operated via an user interfacemenu.
The geometrical parameters for a plain weave unit cell interested were obtained from thephotomicrograph of a specimen section and listed in Table 3.
Table 3: Geometrical dimensions and fibre volume fraction
models lx (mm) ly (mm) lz (mm) Vfo (%)
ModEXP 2.1 2.1 0.22 50.1
The overall fibre volume fraction Vfo was evaluated using the following equation
V =N
T Dfo A×
×ρ
(1)
where N is the number of ply for the laminate specimen, ρA is fibre areal weight (g/m2), D isfibre density (g/cc) and T is the thickness of laminate specimen [24].
Table 4 lists the mechanical properties for the T300 carbon fibre and the 934 resin epoxy aswell as the mechanical properties for the impregnated tow (T300/934) that were calculatedusing the following micromechanics equations proposed by Chamis [18]
E11 = Vf E1f + Vm Em' '× × (2)
E = E =E
V (1 E / E )22 33
m
f m 2f1− × −'(3)
G = G =G
V (1 G / G )12 31
m
f m 12f1− × −'(4)
G =G
V (1 G / G )23
m
f m 23f1− × −'(5)
ν ν ν ν12 = 13 = Vf 12f + Vm m' '× × (6)
ν 23232
=E22
× G(7)
Using the data given in Table 4, the mechanical properties for a T300/934 plain weave unitcell were predicted with the aid of the relevant 3D FEA models and are tabulated in Table 5.The predicted values are compared with those reported by the Boeing company [25], and thepresent experimental results which were obtained following the ASTM test standards ASTMD 3096-76 and ASTM D3518-76.
In Table 5, the differences between the predicted and experimental results are 4.9% for the in-plane Young’s moduli E1 and E2, 12.2% for the in-plane Poisson’s ratio ν12 and 1.7% for thein-plane shear modulus G12, while the differences between predicted results and the averagevalues reported by the Boeing company are 0.7% for the in-plane Young’s moduli E1 and E2,

Volume V: Textile Composites and Characterisation
V - 72
14% for the in-plane Poisson’s ratio ν12 and 8% for the in-plane shear modulus G12. Thus it isnoted that the predicted mechanical properties for a T300/934 plain weave unit cell aregenerally in good agreement with the present experimental results and those obtained by theBoeing company. However, the FEA results tend to be lower than the measured mechanicalproperties. One reason for this could be that equation (1) may underestimate the overall fibrevolume fraction.
Table 4: Mechanical properties of constituents and impregnated tow for T300/934 compositematerials
Item Material E1*
(GPa)E2*
(=E3*)
(GPa)
G12*
(=G13*)(GPa)
G23*
(GPa)ν12*
(=ν13*)ν23*
Fibre (T300) 220 13.8 11.35 5.5 0.2 0.25Matrix Epoxy resin
(934)4.1 4.1 1.454 1.454 0.41 0.41
Impregnatedtow
(T300/934) 173.11 10.84 6.361 4.165 0.2456 0.3019
* Subscripts 1, 2 and 3 indicate the quantities in longitudinal, transverse and through-the-thickness directions respectively.
Table 5: The comparisons of the mechanical properties for T300/943 plain weave composites
Item E1
(GPa)E2
(GPa)E3
(GPa)ν12 ν13 ν23 G12
(GPa)G13
(GPa)G23
(GPa)FEA modelVf
o=50.1%56.5 56.5 10.18 0.043 0.45 0.45 4.28 2.86 2.86
Test 59.4 59.4 N/A 0.049 N/A N/A 4.353 N/A N/ANASA [25] 53.09-
60.6753.09-60.67
0.05 3.1-6.205
PARAMETRIC STUDY
Four unit cell models with different geometrical dimensions were developed for the plainweave composite, and they are referred as ModA, ModB, ModC and ModD. Based on theresults of these models, the effects of some geometrical parameters on the mechanicalproperties were discussed. The mechanical properties predicted from model ModA will becompared with those available in the literature.
In all calculations in this section, the overall fibre volume fractions for all four models werechosen to be the same and equal to 58.46%. The relevant geometrical dimensions of unit cellsare given in Table 6, in which lx, ly and lz are the length, width and thickness of a unit cell (seeFig. 1).

Proceedings of ICCM–11, Gold Coast, Australia, 14th-18th July 1997
V - 73
Table 6: Geometrical parameters for all four models
models lx (mm) ly (mm) lz (mm)ModA 2.1 2.1 0.19ModB 2.8 2.8 0.19ModC 2.1 2.1 0.25ModC 3 1.5 0.19
Table 7: Mechanical properties of constituents for T300/GY260 composite materials
Material(GPa)
E1 E2
(=E3)ν12
(=ν13)ν23 G12
(=G13)G23 Vf (%)
Fibre (T300) [17] 220 13.8 0.2 0.25 11.35. 5.5 58.46Resin (GY260) [17] 3.252 3.252 0.355 0.355 1.2 1.2 41.54
Impregnatedtow (T300/GY260) 202.038 12.134 0.2128 0.2704 8.358 4.776
Table 7 gives the mechanical properties for the T300 carbon fibre, the GY260 epoxy and theimpregnated yarn (T300/GY260). It should be mentioned that each impregnated tow (oryarn) in the plain weave composite material was modelled as a unidirectional prepreg. Themechanical properties of the unidirectional fibre yarn were calculated using equations (2) to(7).
Same strain vectors and boundary conditions were applied for the four unit cell models, andthe mechanical properties were then obtained following the same procedure as described inthe previous sections. Table 8 presents the mechanical properties for all four plain weave unitcell models.
Table 8: Mechanical properties for all four plain weave models
Model E1
(GPa)E2
(GPa)E3
(GPa)ν12 ν13 ν23 G12
(GPa)G13
(GPa)G23
(GPa)ModA 65.68 65.68 8.60 0.032 0.364 0.364 5.23 2.71 2.71ModB 67.10 67.10 8.60 0.032 0.358 0.358 5.26 2.67 2.67ModC 63.77 63.77 8.60 0.032 0.371 0.371 5.25 2.76 2.76ModD 67.32 63.23 8.60 0.032 0.356 0.372 5.25 2.67 2.77
By studying the data listed in the first three rows in Table 8, it is noted that when the unit celldimensions increase in both the warp (x) and the weft (y) directions or decreases in the zdirection, the in-plane Young’s moduli E1, E2 increase, while the out-of-plain Poisson’s ratiosν13, ν23 and the shear moduli G13, G23 decrease. The variations of dimensions in all threedirections almost do not affect the out-of-plane Young’s modulus E3, the in-plane Poisson’sratio ν12, and the shear modulus G12. For model ModD, the in-plane Young’s modulus in thewarp direction (ie. with longer unit cell dimension) E1 is greater than that in the weft direction(ie. with shorter unit cell dimension) E2, the out-of-plane Poisson’s ratio ν23 and shearmodulus G23 are larger than ν13 and G13 respectively. It is believed that variations of fibre

Volume V: Textile Composites and Characterisation
V - 74
orientation could be an important contributing factor to these changes in mechanicalproperties.
The mechanical properties for model ModA can be compared with those given in Ref. [17], asmodel ModA was established based on the same geometry reported in Ref. [17]. Table 9 liststhe mechanical properties predicted by the present model, and those predicted and measuredin Ref. [17]. It is noted that the in-plane Young’s modulus E1 and E2 obtained from ModA areclose to the experimental results and those evaluated from UB’s models. The differencesbetween the results of model ModA and the experimental ones are less than 2% for the in-plane Young’s modulus E1 (or E2). However, the differences for the in-plane Poisson’s ratioand the shear modulus are 34% and 20% respectively.
Table 9: Comparison of Mechanical properties between presented and those in Ref [17]
Item ModA LB-1 [17] LB-2 [17] UB-1 [17] UB-2 [17] Test [17]E1 (GPa) 65.68 42.97 55.71 67.35 66.44 66.12E2 (GPa) 65.68 42.97 55.71 67.35 66.44 66.84E3 (GPa) 8.58 8.41 8.44 8.44 8.50 N/AG12 (GPa) 5.23 3.996 N/C 3.98 N/C 4.357G13 (GPa) 2.71 N/C N/C N/C N/C N/AG23 (GPa) 2.71 N/C N/C N/C N/C N/Aν12 0.032 0.323 0.150 0.027 0.0299 0.0476ν13 0.364 0.257 0.323 0.38 0.4101 N/Aν23 0.364 0.257 0.323 0.38 0.4101 N/A
CONCLUSIONS
This paper presented a 3D FEA modelling approach for predicting the mechanical propertiesof plain weave fabric composites. The present modelling approach was validated bycomparing the predicted results with the experimental ones. This modelling approach can beused to model various plain weave composite materials with different geometrical parametersand mechanical properties of composite constituents. The parametric study demonstrated thatsome mechanical properties, eg, E1 and E2, ν13 and ν23, G13 and G23 are sensitive to thechanges in dimensions of a unit cell while others, eg, G12, ν12, and E3, are less sensitive or notsensitive.
ACKNOWLEDGMENTS
P.Tan is supported by an Australian Postgraduate Award (APA) and a SupplementaryScholarship in the Aeronautical Engineering Department of the University of Sydney. Shewould like to thank Mr Radu Turcanu for the assistance provided in the test.

Proceedings of ICCM–11, Gold Coast, Australia, 14th-18th July 1997
V - 75
REFERENCES
1. “STRAND6 Reference Manual and User Guide,” G+D Computing Pty Ltd, Sydney,Australia, September, 1993.
2. Hewitt, J.A., Brown, D. and Clarke, R.B., “Computer Modelling of Woven Composite
Materials,” Composites, Vol. 26, 1995, pp.134-140. 3. Blackketter, D.M., Walrath, D.E. and Hansen, A.C., “Modeling Damage in a Plain
Weave Fabric-Reinforced Composite Material,” Journal of Composites Technology &Research, 1993, pp.136-142.
4. Ishikawa, T. and Chou, T.W., “Elastic Behaviour of Woven Hybrid Composites”,
Journal of Composite Material, Vol. 16, No. 1, 1982, pp. 2-19. 5. Ishikawa, T. and Chou, T.W., “In-Plane Thermal Expansion and Thermal Bending
Coefficients of Fabric Composites”, Journal of Composite Material, Vol. 17, No. 2,1983, pp. 92-104.
6. Ishikawa, T and Chou, T.W. “One-dimensional Micromechanical analysis of Woven
Fabric Composites,” AIAA Journal, Vol. 21, No.12, 1983, pp. 1714-1721. 7. Ishikawa, T. and Chou, T.W., “Nonlinear Behaviour of Woven Fabric Composites”,
Journal of Composite Material, Vol.17, No. 5, 1983, pp 399-413 8. Zhang, Y.C. and Harding, J. “A Numerical Micromechanics Analysis of the Mechanical
Properties of a Plain Weave Composite,” Computer and Structures, vol. 36, No. 5,1990, pp.839-844.
9. Naik, N. K. and Shembekar, P. S. "Elastic Behaviour of Woven Fabric Composites: I-
Lamina Analysis," Journal of Composite Material, Vol. 26, No. 15, 1992, pp. 2197-2225.
10. Shembekar, P. S. and Naik, N. K., "Elastic Behaviour of Woven Fabric Composites: II-
Laminate Analysis," Journal of Composite Material, Vol. 26, No. 15, 1992, pp. 2226-2246.
11. Naik, N. K. and Shembekar, P. S. "Elastic Behaviour of Woven Fabric Composites: III-
Laminate Design," Journal of Composite Material, Vol. 26, No. 17, 1992, pp. 2523-2541.
12. Woo, K and Whitcomb, J.D., “Three-Dimensional Failure Analysis of Plain Weave
Textile Composites Using a Global/Local Finite Element Method,” Journal ofComposite Materials, Vol. 30, No.9, 1996, pp. 984-1003.
13. Whitcomb, J.D., “Three-Dimensional Stress Analysis of Plain Weave Composites,”
NASA report, NASA TM-101672, 1989.

Volume V: Textile Composites and Characterisation
V - 76
14. Hewitt, J.A., Brown, D. and Clarke, R.B., “Computer Modelling of Woven CompositeMaterials,” Composites, Part A Vol. 26, No. 2, 1995, pp. 134-140.
15. Cox, B.N., Carter, W.C. and Fleck, N.A. “A Binary Model of Textile Composites-I.
Formulation”, Acta Metall. Mater., Vol.42, No.10, 1994, pp. 3463-3479. 16. P.Tan, L.Tong and G.P.Steven, “A 3D Modelling Technique for Predicting the Linear
Elastic Properties of Opened-Packing Woven Fabric Unit Cell,” to be presented at the9th International Conference on Composite Structure, Paisley, Scotland, 8th-10th, Sep.1997.
17. Falzon, P.J. and Herszberg, I., “Three-Dimensional Finite Element Analysis of a Plain
Woven Composite,” CRC-AS report, CRC-AS TM 95001, December,1994. 18. Chamis,C.C., “Simplified Composite Micromechanics Equations for Hygral, Thermal,
and Mechanical properties,’ SAMPE Quarterly, pp.14-23, April 1984. 19. Isaac, M. Daniel and Ori Ishai “Engineering Mechanics of Composite Materials,”
Oxford University Press, 1994. 20. Anonymous, “ICI Fiberite Material Handbook” Tempe, Arizona, USA, March, 1989. 21. Anonymous, "Annual book of ASTM Standards. Section 15, General Products,
Chemical Specialties and End Use Products,” Vol.15.03, Philadelphia, DA: ASTM,1985.
22. Whitney, J.M., Daniel, I.M. and Pipes, R.B., “Experimental Mechanics of Fibre
Reinforced Composite Materials,” The Society for Experimental Stress Analysis,U.S.A., 1982.
23. Carlsson, L.A. and Gillespie, J.W., “Dalaware Composites Design Encyclopedia”,
Technomic Pub. Co., 1992. 24. “Composite Manufacturing of Tooling,” CRC-AS Short Course note, 1994 25. BOEING Advanced Composites Handbook, 1986.

Proceedings of ICCM–11, Gold Coast, Australia, 14th-18th July 1997
V - 77
OPTIMISATION OF IN-PLANE AND BENDINGPROPERTIES OF WOVEN FABRIC LAMINATE
CONFIGURATIONS
R. W. Stewart, V. E. Verijenko, S. Adali
University of Natal, Durban, South Africa
SUMMARY: The properties of a satin weave glass/carbon hybrid composite lamina areestablished according to the theory in [1-3]. This is extended to a multi-layered solution wherethe main focus is on the behaviour of 3-layered symmetric laminates. Various angularorientations are imparted to each layer according to the standard transformation equations [4].Vertical shifts are allocated to each layer to fix its position in the lay-up. Once the describingmatrices have been determined, the deflection characteristics of a simply supportedrectangular plate can be found according to [5,6]. Through changing the thickness andgeometry of the various layers, changes to the angle of the various laminae and of the wholeplate to the simple supports, the influence of each of the parameters on the plate deflectioncan be determined. It is also possible to show an optimal solution for minimum deflection ofthe plate.
KEYWORDS: woven fabric, deflection, in-plane, satin weave
INTRODUCTION
The properties of a satin weave glass/carbon hybrid composite lamina are establishedaccording to the theory in [1-3]. The in-plane properties predicted by the parallel-seriesscheme in [1] have been shown to agree well with experimental data. The investigation isextended here to include bending properties. It has been found, although not presented here,that there is a significant difference between the results obtained ignoring weave structuresand those obtained considering them. The focus of this study is therefore to investigate theinfluence of weave structure on the deflection of a plate.
In order to extend the theory to a laminated plate, the summation of the various matrices thatdescribe each lamina is done at the end of the unit cells. It is therefore possible to change theangular orientation of each layer, which could not be achieved previously. The in-planeproperties of each constituent layer are determined to show the influence of this on thebehaviour of the laminate. It will be shown that although the in-plane properties are not useddirectly for the determination of deflection characteristics, these properties are closely related.
THEORY
Material Properties
The material properties of each woven fabric lamina were first established. This involveddefining shape functions for the weave structure. These shape functions can be found in [1-3].

Volume V: Textile Composites and Characterisation
V - 78
The relevant stiffness parameters could be found as presented in [1], [3]. Relevant dimensionsand terms can be seen in Fig. 1.
The satin weave under consideration consists of carbon fibre reinforcement in the Warpdirection and glass fibre reinforcement in the Fill direction. The assumed properties of thecarbon, glass and resin are presented in Table 1.
Fig. 1: Unit cell of weave structure and relevant dimensions
Model Details
The weave under consideration was a satin weave where the thickness h akw
k( ) ( )/ could bevaried. It was assumed that the gap between adjacent yarns is so small that it is insignificant.A three-layer laminate configuration (Fig. 2) was assumed and the overall thickness of thislaminate was kept constant. The proportionate thickness of each of the component layers was,however, varied. It was assumed that the two outer laminae were identical in terms ofthickness and orientation. For the middle layer (here termed layer 1), h( )1 was varied while
aw( )1 was kept constant. This changed the ratio h aw
( ) ( )/1 1 , which changed the shape of theweave and hence affected the properties. For the outer layers (each termed layer 2),
h aw( ) ( )/2 2 was kept constant as the value of h( )2 was varied. The properties of the outer layers
thus remained constant and were subject only to variation under off-axis loading.
The properties of the outer layers were kept constant throughout the investigation in order toestablish how the weave structure of the middle layer would affect the behaviour of thelaminated plate, particularly under bending loads.

Proceedings of ICCM–11, Gold Coast, Australia, 14th-18th July 1997
V - 79
Table 1: Constituent material propertiesEL ET GLT GTT ν LT
Glass 71.5 71.5 27.5 27.5 0.29
Carbon 210.0 39.6 24.0 14.3 0.26
Resin 3.5 3.5 1.3 1.3 0.35
Fig. 2: Stacking of unit cells for determination of stiffness parameters
Stiffness Parameters
Finding the bending resistance of each layer involves finding the elements of the D-matrix.The following relationship from [7] is commonly used to describe the behaviour of a platewhere material and geometric nonlinearities are small:
(1)
where [A] gives the in-plane stiffness, [D] the coupling stiffness and [B] gives the couplingterms of the stiffness matrix. , N ε 0 are in-plane forces and mid-surface strainsrespectively and , M κ are bending moments and curvatures respectively. It shall beshown later that we do not need to find the elements of the [B] matrix. The in-plane stiffnessmatrix [A] can be found from:
A x y Q hx x y h h hx x y
Q x y hx x y hx x y
Q x y hx x y hx x y
k M ku
kl
k k
W k k
F k k
( ) ( ) ( ) ( ) ( )
( ) ( )
( ) ( )
( , ) [ ( , ) ( , )]
( , )[ ( , ) ( , )]
( , )[ ( , ) ( , )]
= + − −
+ −
+ −
3 2
2 1
1 3
(2)
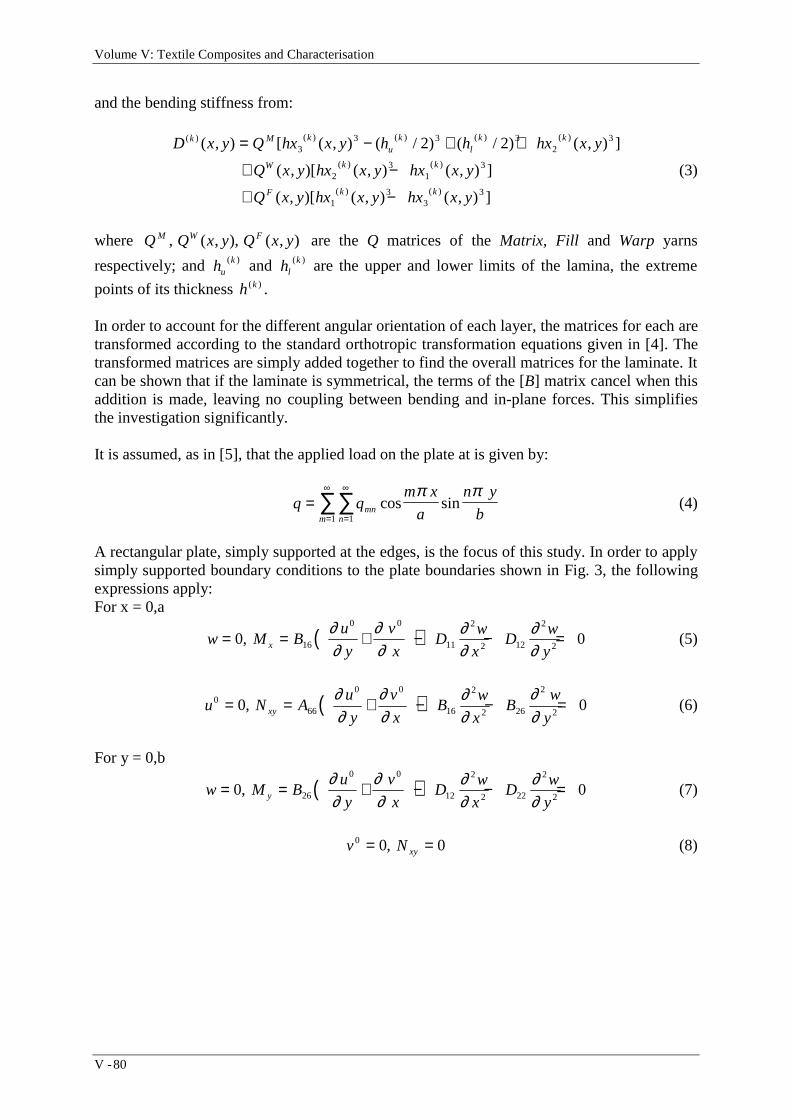
Volume V: Textile Composites and Characterisation
V - 80
and the bending stiffness from:
D x y Q hx x y h h hx x y
Q x y hx x y hx x y
Q x y hx x y hx x y
k M ku
kl
k k
W k k
F k k
( ) ( ) ( ) ( ) ( )
( ) ( )
( ) ( )
( , ) [ ( , ) ( / ) ( / ) ( , ) ]
( , )[ ( , ) ( , ) ]
( , )[ ( , ) ( , ) ]
= − + +
+ −
+ −
33 3 3
23
23
13
13
33
2 2
(3)
where Q Q x y Q x yM W F, ( , ), ( , ) are the Q matrices of the Matrix, Fill and Warp yarns
respectively; and huk( ) and hl
k( ) are the upper and lower limits of the lamina, the extreme
points of its thickness h k( ) .
In order to account for the different angular orientation of each layer, the matrices for each aretransformed according to the standard orthotropic transformation equations given in [4]. Thetransformed matrices are simply added together to find the overall matrices for the laminate. Itcan be shown that if the laminate is symmetrical, the terms of the [B] matrix cancel when thisaddition is made, leaving no coupling between bending and in-plane forces. This simplifiesthe investigation significantly.
It is assumed, as in [5], that the applied load on the plate at is given by:
q qm x
a
n y
bmnnm
==
∞
=
∞
∑∑ cos sinπ π
11
(4)
A rectangular plate, simply supported at the edges, is the focus of this study. In order to applysimply supported boundary conditions to the plate boundaries shown in Fig. 3, the followingexpressions apply:For x = 0,a
( )w M Bu
y
v
xD
w
xD
w
yx= = + − − =0 016
0 0
11
2
2 12
2
2,
∂∂
∂∂
∂∂
∂∂
(5)
( )u N Au
y
v
xB
w
xB
w
yxy0
66
0 0
16
2
2 26
2
20 0= = + − − =,
∂∂
∂∂
∂∂
∂∂
(6)
For y = 0,b
( )w M Bu
y
v
xD
w
xD
w
yy= = + − − =0 026
0 0
12
2
2 22
2
2,
∂∂
∂∂
∂∂
∂∂
(7)
v Nxy0 0 0= =, (8)

Proceedings of ICCM–11, Gold Coast, Australia, 14th-18th July 1997
V - 81
Fig. 3. Laminated plate dimensions
The deflection at each point on the plate is then given by the expression:
[ ]w x yR b
q
m x
a
n y
bD m D D m n R D n R
mnnm
( , )sin sin
( )=
+ + +=
∞
=
∞
∑∑4 4
4
114
12 662 2 2
224 4
11 2 2π
π π
(9)
where the maximum deflection will occur in the centre of the plate for a uniformly distributedload. From [6], it can be seen that m = 1,3,5,..... and n = 1,3,5,...... The series achieves rapidconvergence and it in practice m and n were summed to 99, which yields a very small error inthe results. The plate is assumed to be square for the purposes of the investigation. This meansthat the value of the aspect ratio R in equation (8) is 1.
The properties of the each of the layers and the overall plate model as entered for computationby the model are as follows:
- Plain satin weave, a awk
fk( ) ( )=
- Undulation, u akw
k( ) ( )/ .= 0 6- Fibre volume content = 0.6
- Size of plate a aw/ .( )1 100 0= and b bw/ .( )1 100 0= .
RESULTS
The maximum deflection for a layer of core material with h aw( ) ( )/ .1 1 1 0= and with
infinitely thin outer layers is given in Fig. 4a. It can be seen that there is considerablevariation in the maximum deflection as the orientation of the plate is altered. The maximumdeflection is w h/ .= × −0 26 103 and occurs when the 0/45/0 laminate is orientated at 90o to thesimple supported boundary of the plate. Note that h h h= +( ) ( )1 22 . The configuration with thelowest variation is the 0/0/0 laminate. The maximum deflection occurs at a load angle of 60o,which is a feature repeated in later results.

Volume V: Textile Composites and Characterisation
V - 82
The maximum deflection of a plate with h aw( ) ( )/ .1 1 0 9= can be seen to be
w a/ .= × −017 103 from Fig. 2b. This occurs in the 0/60/0 laminate for an orientation angle of750. The variation in the behaviour of the different configurations is substantially reduced.
Fig. 2c displays an interesting occurrence. All the laminate configurations begin to display a
similar pattern for maximum deflection when h aw( ) ( )/ .1 1 0 7= . In almost all cases max.
w a/ .= × −014 103 at on orientation angle of 60o. It is clear from this point on that the middlelayer (layer 1) does not influence the behaviour of the laminate significantly when
h aw( ) ( )/ .1 1 0 7≤ . Only the magnitude of deflection is affected by the ratio of middle layer
thickness to overall thickness.
It is found that under the conditions chosen here, the minimum deflection is achieved whenh aw
( ) ( )/ .1 1 0 5= . For this case, maximum w a/ .= × −0125 103 at an orientation anglebetween 45o and 60o for almost any laminate configuration.
Fig. 4a: Max. w h/ ×103 for plate with h aw( ) ( )/ .1 1 1 0=
Fig. 4b: Max. w h/ ×103 for plate with h aw( ) ( )/ .1 1 0 9=

Proceedings of ICCM–11, Gold Coast, Australia, 14th-18th July 1997
V - 83
0
0.05
0.1
0.15
0.2
0.25
0.3
0 15 30 45 60 75 90
Orientation
Max
w/h
x 1
000
0/0/0
0/30/0
0/45/0
0/60/0
0/90/0
Fig. 4c: Max. w h/ ×103 for plate with h aw( ) ( )/ .1 1 0 7=
0.05
0.06
0.07
0.08
0.09
0.1
0.11
0.12
0.13
0.14
0.15
0 15 30 45 60 75 90
Angle of Loading
Max
w/h
x 1
000
0/0/0
0/30/0
0/45/0
0/60/0
0/90/0
Fig. 4d: Max. w h/ ×103 for plate with h aw( ) ( )/ .1 1 0 5=
Although it can be seen from equation (9) that only elements of the D-matrix influence thecalculated deflection under the current method, it is still possible to explain deflections interms of in-plane stiffness’ (which are properties of the A-matrix). This is because it can beseen from equations (2) and (3) that the A and D matrices are very closely related. A highvalue in the A-matrix will usually mean a high value in the corresponding D-matrix.
There is also a dependency of the terms of the D-matrix on the value of the h-parameters.These effectively position the laminate. It is therefore possible to see how in-plane stiffnessterms can indirectly affect the deflection of the lamina.
Fig. 5a shows the effect of orientation on the in-plane properties of the middle lamina, layer 1.It can be seen that there is clear orthotropic behaviour, with the lowest stiffness achieved at an
orientation angle of 450. As the ratio h aw1 1/ is increased, the change in shape of the weave
structure causes the in-plane stiffness to drop.
Fig. 5b also shows clear orthotropic behaviour with the Bulk modulus having its highest value
at an orientation of 450. It can be seen that the value drops as the ratio h aw1 1/ is increased in
the same way as Fig. 5a.
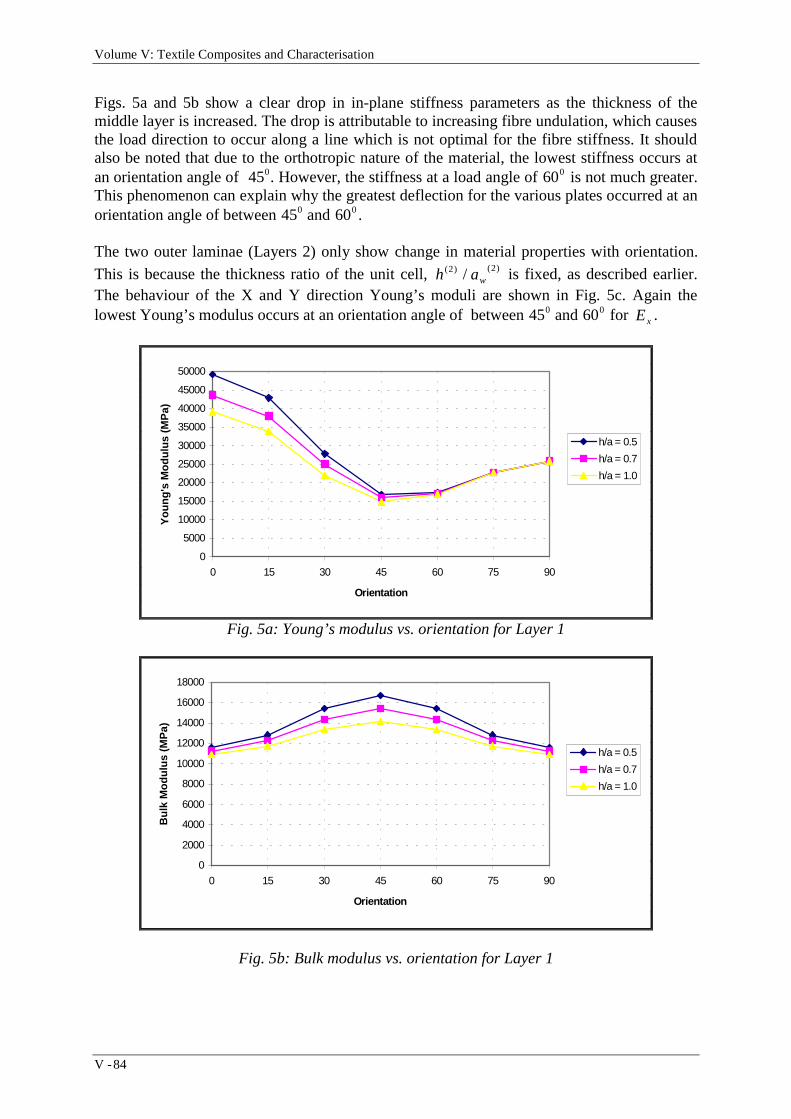
Volume V: Textile Composites and Characterisation
V - 84
Figs. 5a and 5b show a clear drop in in-plane stiffness parameters as the thickness of themiddle layer is increased. The drop is attributable to increasing fibre undulation, which causesthe load direction to occur along a line which is not optimal for the fibre stiffness. It shouldalso be noted that due to the orthotropic nature of the material, the lowest stiffness occurs atan orientation angle of 450. However, the stiffness at a load angle of 600 is not much greater.This phenomenon can explain why the greatest deflection for the various plates occurred at anorientation angle of between 450 and 600.
The two outer laminae (Layers 2) only show change in material properties with orientation.
This is because the thickness ratio of the unit cell, h aw( ) ( )/2 2 is fixed, as described earlier.
The behaviour of the X and Y direction Young’s moduli are shown in Fig. 5c. Again thelowest Young’s modulus occurs at an orientation angle of between 450 and 600 for Ex .
0
5000
10000
15000
20000
25000
30000
35000
40000
45000
50000
0 15 30 45 60 75 90
Orientation
You
ng's
Mod
ulus
(M
Pa)
h/a = 0.5
h/a = 0.7
h/a = 1.0
Fig. 5a: Young’s modulus vs. orientation for Layer 1
0
2000
4000
6000
8000
10000
12000
14000
16000
18000
0 15 30 45 60 75 90
Orientation
Bul
k M
odul
us (
MP
a)
h/a = 0.5
h/a = 0.7
h/a = 1.0
Fig. 5b: Bulk modulus vs. orientation for Layer 1

Proceedings of ICCM–11, Gold Coast, Australia, 14th-18th July 1997
V - 85
0
5000
10000
15000
20000
25000
30000
35000
40000
45000
50000
0 15 30 45 60 75 90
Ex
Ey
Gxy
Fig. 5c: In-plane properties for Layer 2
CONCLUSIONS
The best resistance to bending is achieved when the thickness of the middle layer,h aw
( ) ( )/ .1 1 0 5= . The orientation of the middle layer did not have much influence at thisthickness ratio. In-plane stiffness of the laminae has a large influence on the bending stiffnessof the laminate. Maximum deflection typically occurs for the laminates considered at anorientation angle of between 450 and 600, depending on the lay-up sequence and thickness.
REFERENCES
1. Naik K, “Woven Fabric Composites”, Technomic Publishing, 1994.
2. Shembekar P.S., Naik K., “Elastic Analysis of Woven Fabric Laminates: Part 1. Off-axis Loading”, Journal of Composites Technology and Research, Vol. 15, No. 1, 1993.
3. Stewart R.W., Verijenko V.E., Adali S, “Analysis of In-Plane Properties of HybridGlass-Carbon Woven Fabric Composites”, Proceedings of 1st International Conferenceon Composite Science and Technology, pp509-514, 1996.
4. Jones R.M., “Mechanics of Composite Materials”, McGraw-Hill, 1975.
5. Whitney J.M., “Structural Analysis of Laminated Anisotropic Plates”, Technomic,pp177-185, 1987.
6. Vasiliev V.V., Jones R.M., “Mechanics of Composite Structures”, Taylor and Francis,pp 281-284, 1993.
7. Pedersen, Pauli, “Mechanical Behaviour of Composites and Laminates”, ElsevierApplied Science, 1987.

Volume V: Textile Composites and Characterisation
V - 86
DEVELOPMENTS IN MULTIAXIAL WEAVING FORADVANCED COMPOSITE MATERIALS
J.I. Curiskis1, A. Durie2, A Nicolaidis3 and I. Herszberg4
1 Department of Textile Technology, University of New South Wales, Sydney 2052, New SouthWales, Australia.
2 Department of Aviation and Technology, University of Newcastle, University Drive,Callaghan 2308, New South Wales, Australia
3 Department of Fashion and Textile Design, Royal Melbourne Institute of Technology, CityCampus, GPO Box 2476V, Melbourne 3001, Victoria, Australia.
4 Sir Lawrence Wackett Centre for Aerospace Design Technology, Royal Melbourne Instituteof Technology, GPO Box 2476V, Melbourne 3001, Victoria, Australia.
This work has been carried out as part of a CRC-ACS research program.
SUMMARY: There is an increasing demand within the composites industry for integrally-manufactured three-dimensional preform structures. Using and extending the basic principlesof conventional weaving processes has allowed a wide range of such structures to bedeveloped, as briefly summarised in this paper. Such integrally-woven preforms, however,lack reinforcing fibre in the bias directions (eg. +45°) intermediate between the warp andweft. A detailed review of recent developments to overcome this limitation is presented inthis paper, together with the type of integrally-woven multiaxial structure (eg. 5-axis)achievable. Although the details of implementation differ, these multiaxial weavingdevelopments utilise the principles of lappet weaving, triaxial weaving, and cross-laying.
KEYWORDS: multiaxial, weaving, lappet, triaxial, cross-laying, bias, three-dimensional.
INTRODUCTION
The use of textile technology in the manufacture of preforms for advanced compositematerials has and continues to be under intense investigation due to the potential of theseprocesses, together with resin infusion techniques such as resin transfer moulding (RTM), toproduce low-cost high-quality structures with improved mechanical performance. Perhapsforemost among these textile processes is weaving technology.
Using the basic principles of conventional weaving processes, as discussed below, a widerange of integrally-woven preform structures have been developed for the compositesindustry. Such structures, however, are generally limited to at most three directions of fibrereinforcement, viz. the orthogonal directions of warp, weft and through-thickness (binder)yarns. Inclusion of fibre reinforcement in the in-plane “bias” direction (eg. +45°) stillrequires formation of a laminate structure. This restriction has led to interest in the use ofmultiaxial weft-inserted warp-knitted/stitch-bonded structures which can be manufactured onappropriate commercially available machinery. Such structures, however, suffer fromlimitations as regards potential channelling in the fibre architecture and the use ofthermoplastic knitting threads to provide through-thickness reinforcement, as well as limitedversatility for three-dimensional shaping during preform manufacture.

Proceedings of ICCM–11, Gold Coast, Australia, 14th-18th July 1997
V - 87
Recent years, however, have witnessed new developments in multiaxial weaving to overcomethe above limitations. These developments are reviewed in this paper. Included in this is abrief outline of two special weaving techniques in which bias yarns can be introducedintermediate between the warp and weft directions in a woven fabric.
CONVENTIONAL WEAVING PROCESSES
Weaving is perhaps the oldest fabric-forming technology, with a rich history of technologicaldevelopment both in terms of machinery and fabric structures. It is essentially the action ofproducing a fabric by the interlacing of two sets of yarns (warp and weft) as schematicallyillustrated in Figure 1. The warp yarns run in the machine direction and are provided in aparallel sheet array, either from one or more warp beams or from individual warp yarnpackages located in a frame known as a creel. The weft yarns run in the cross-machinedirection and are typically introduced singly or in looped double-pick form. Weaving ischaracterised by three primary motions:
1. shedding - the separation of thewarp sheet into an upper andlower layer, thereby creating atunnel known as the shed;
2. picking - the insertion of theweft yarn (pick) into the shed;
3. beating-up - the consolidationof the inserted weft yarn intothe edge of the fabric (knownas the cloth fell).
Fig. 1: Principles of conventional weaving
Secondary motions required for power weaving are warp let-off and cloth take-up. Theformer is the release of the warp yarn from its supply as weaving progresses, and the latter isthe withdrawal of the fabric from the weaving zone as it is produced and its subsequentstorage (eg. on a cloth roll). Additional auxiliary motions are associated with the continuity(and selection) of the weft yarn supply and the provision of various stop motions in the eventof yarn breakage or other malfunctions; in the case of shuttleless weaving, selvedge formingdevices are also required. Ideally, both yarn sets are under controlled tension regimes duringthe weaving cycle. Fundamental to the conventional weaving process is the use of heddles toeffect shedding for individual warp yarns and of the reed to achieve beating-up; heddles areessentially (vertical) wires with an eye in the centre through which a warp yarn is threaded,while the reed is a comb-type device across the width of the machine - further, both devicesmaintain the lateral position of the warp yarns in the sheet array. Various mechanisms havebeen developed to implement and extend these motions and texts are available for theinterested reader [eg. 1]. From these basic principles, an amazing array of woven fabricstructures have been developed to satisfy various aesthetic and functional requirements forapparel, furnishing, and technical/industrial end-uses [eg. 2].
Extension to Textile Composite Preforms
Simple woven structures (eg. satin weaves) found early application as preforms in laminatestructures. The poor impact performance and delamination resistance of such structures has

Volume V: Textile Composites and Characterisation
V - 88
led to the use of stitching techniques borrowed from clothing technology; in addition, theweave crimp is often considered to reduce the mechanical efficiency of the reinforcing fibres.The development of multilayer plate structures is a natural progression well within the scopeof conventional weaving - indeed, they form the compound weave category of wovenstructures. Typical examples of such 3D woven fabrics are the simple angle interlock, warpinterlock and orthogonal structures, which utilise binder warp and/or weft to provide through-thickness reinforcement and structural integrity to (ideally) straight warp and/or weft primaryload-bearing yarns. In the patent literature there are various other plate-type structuresdeveloped for moulding into curved 3D surfaces [eg. 3] and for stiffened panels, includingbeams with various cross-sections [eg. 4]. In addition, the technique of face-to-face weaving,traditionally employed in the manufacture of cut-pile woven carpets, can be used tomanufacture sandwich structures in which the “pile” yarn traverses between the two“backing” fabrics [eg. 5]. Further, this basic technique has been extended to manufacturecore-type structures in which fabric “ribs” join the two surface layers [eg. 6]. Finally, thetechnique of contour or shape weaving has been utilised to weave 3D shell-type structures[eg. 7].
While recognisable weaving developments such as the above have been reported, otherdevelopments yielding structures sometimes referred to as 3D nonwoven orthogonal fabricshave also been undertaken [eg. 8]. Where the three primary motions of weaving arerecognisable, such processes are in fact weaving developments. A typical example is the useof binder warp to provide structural integrity in an otherwise non-interlaced orthogonal arrayforming composite beams of various cross-sectional shapes [eg. 9].
MULTIAXIAL WEAVING PROCESSES
The inclusion of bias yarns at an angle (eg. +45°) intermediate between the warp and weftdirections for the development of multiaxial multilayer integrally woven preforms (eg. 5-axis3D structures) requires that the constraints imposed by the heddles and reeds in conventionalweaving be overcome. Before proceeding to such preform developments, it is instructive tofirst consider two special weaving techniques in which the same problems were encountered.
Lappet Weaving
Lappet weaving is a special technique in which extra warp threads are introduced traditionallyto develop isolated design motifs on an open weave background [2]. Figure 2 illustrates theprinciples of the technique, which requires the use of a lappet (or needle) bar (D) positionedbetween the reed (V) and the cloth fell (A). The extra warp yarns (W) are threaded throughthe eyes of the needles of the lappet bar and do not pass through the reed; the extra warp isusually supplied from a separate warp beam to the normal warp (X), which is controlled byheddles (Y) in the usual way. The lappet bar has two directions of movement: a lateral(shogging) movement in the weft direction, thereby controlling the angular position of theextra warp yarns with respect to the principal directions of the fabric; and a verticalmovement which allows the lappet bars to form a shed for weft insertion and to be clear of thereed during beat-up - the lappet bar can be considered similar to a guide bar in warp knitting.In principle, a standard weaving loom can be modified to incorporate the lappet system.

Proceedings of ICCM–11, Gold Coast, Australia, 14th-18th July 1997
V - 89
Fig. 2: Principles of lappet weaving
Clearly, lappet weaving has potential to manufacture integrally-woven multiaxial multilayerpreform structures for composite materials. The extra warp yarns can be made to run atvirtually any angle between (and including) the warp and weft directions, and can therefore beconsidered as bias yarns. These bias yarns are interlaced with the weft but held in position bythe adjacent pair of normal warp yarns, and float on one surface of the fabric betweensuccessive weft interlacing points. Further, the bias yarns can be interlaced with weft yarns atany position within a multilayer structure, with the two extremes corresponding to the weftyarns at the same or opposite fabric surface; the latter would provide through-thicknessreinforcement using bias yarns. However, such structures would have two main limitations:the location of the bias yarns would be limited to the outer surfaces of the preform structure;at some stage the lappet bars must reverse the direction of their shogging movement, thuslimiting the extent to which an individual bias yarn can traverse the fabric width. The latterlimitation, however, can be overcome with modification of the lappet system.
Triaxial Weaving
Triaxial weaving is another special weaving technique in which two sets of warp yarns andone set of weft yarns are interlaced in such a way that the three sets of threads form amultitude of triangles. Figure 3(a) illustrates a simple triaxial weave in which equilateraltriangles can be seen as well as reversal of the (bias) warp yarns at the fabric selvedges. Thelatter ensures the continuity of an individual warp yarn across the full width of the fabric.Further, it clearly indicates that an individual warp yarn during one traverse (left-to-right, say)will be a member of one set of warp yarns but on the return traverse (right-to-left) will be amember of the opposite set of warp yarns.
The first specific patent of which the authors areaware was published in 1921 [10]. However,Mooney [11], in an excellent review of triaxialstructures and manufacturing techniques, traces thehistory to the early 19th century. Interest in triaxialweaving was renewed in the 1960s due to itspotential to manufacture stable fabric structureswith excellent burst and tear resistance and withnear-isotropic in-plane mechanical performance.Indeed, the 1960s and 1970s was a period of intenseactivity in which many patents describing structuresand manufacturing techniques appeared [eg.
(a) Weave (b) Primary motionsFig. 3: Principles of triaxial weaving

Volume V: Textile Composites and Characterisation
V - 90
12,13] as well as various research papers describing mechanical properties [eg. 14]. Thefollowing summarises the basic features required in the triaxial weaving process, and asexemplified in the Barber-Colman TW-2000 triaxial loom [15].
In order to achieve transverse positioning of the two opposing sets of warp yarns (1,2 inFigure 3(b)), including yarn transfer at the fabric selvedges, special heddles (3,4) circulatingaround a racetrack-type circuit [10,12] are used. These heddles are also used to form a shedfor weft (5) insertion via a rigid rapier. The warp yarns are supplied on beams or individualyarn packages mounted on a rotating carousel [16]; alternate approaches are to use a warpbeam in which the yarns form a flattened spirally wrapped sleeve [17] or to maintain the warpsupply stationary and to rotate the machine. Beat-up is usually achieved through the use oftwo open reeds (6,7) working sequentially, with the fabric (8) formed in the same plane as thewarp sheet. One reed maintains the position at the cloth fell of the traversing warp sets for theprevious pick, while the second reed beats-up the newly inserted pick; the first reed iswithdrawn immediately before the second reed reaches the cloth fell. On the next pick, thetwo open reeds reverse roles.
The potential of triaxial fabric structures for composite materials has been recognised withrespect to their in-plane mechanical performance [18], conformability to curved surfaces [19],and a recent machine development for composite applications in shell-type structures [20]. Itis clear from Figure 3 that inclusion of axial warp yarns as a third warp set in the basic triaxialprocess has some potential for the development of multilayer triaxial fabrics. However,modifying the conventional triaxial weaving process to incorporate such yarns would be amajor engineering task. Rather, modifying the yarn guides to operate in a lappet weavingmode would be a simpler task - one which would overcome the second limitation of atraditional lappet weaving system as described in the previous section.
Multiaxial Developments for Textile Composite Preforms
The patent by Ruzand and Guenot [21] is the first patent to indicate how a standard loom canbe modified for multiaxial weaving. Figure 4(a) illustrates the type of structure that can beobtained. The bias yarns (3a,3b) run across the full width of the fabric in two opposing layerson the top and back surfaces of the fabric, although they can be inserted on one surface only ifdesired. The bias yarns are held in position by selected weft yarns (2) interlaced with warpbinding yarns (1) on the two surfaces of the structure. The intermediate layers between thetwo surfaces are composed of other warp (1) and weft (2) yarns which may be interlaced (asillustrated) or not.
The basis of the technique is an extension of lappet weaving in which pairs of lappet bars (6aand 6b, 6c and 6d) are utilised on one or both sides of the fabric, as schematically illustratedin Figure 4(b). The lappet bars are segmented and of a length greater than the fabric width byone segment length. Each pair of lappet bars move in opposite directions, with no reversal inthe motion of a segment until it fully extends past the opposite fabric selvedge. When thelatter situation is reached, the segment is detached from the lappet bar, its yarns grippedbetween the selvedge and the guides and cut near the selvedge. The detached segment is thentransferred to the opposite side of the fabric where it is reattached to the lappet bar and itsyarns subsequently connected to that fabric selvedge. Since a rapier is used for weft insertion,the bias yarns can be consolidated into the selvedge by an appropriate selvedge-formingdevice employed for shuttleless weaving. The bias warp supply for each lappet bar segment

Proceedings of ICCM–11, Gold Coast, Australia, 14th-18th July 1997
V - 91
must be independent of all other segments and not interfere with the yarns from othersegments.
(a) Example weave (b) Schematic illustration of loom cross-section
Fig. 4: Multiaxial weaving development by Ruzand and Guenot [21]
Another approach utilising lappet weaving principles has been described by Farley [22];Figure 5 shows relevant aspects of his invention. In this case the lappet bars comprise slottedneedles (34) positioned in transversely moveable needle holders (20) mounted on racks (22)placed in an assembly (18) which is positioned in front of a shedding mechanism (16); thelatter controls the normal warp (14) which is drawn from warp beams or a creel supply (12).The bias yarns (24) are positioned in the slotted eyes (36) of the needles, with the yarn supply(eg. individual spools) attached to the needle holders; there is a plurality of such needleholders on any rack. The needle holders, and thus bias yarns, are moved transversely (F1)across the fabric width. At desired transverse positions, the needles are moved vertically toform a shed into which the weft yarn (38) is inserted by a special rapier (26) which alsoachieves beat-up through an attached inflatable membrane, thus negating the need for a reed.At the end of the traverse, a needle holder assembly is removed from its rack and repositionedat the opposite side (start) of the rack. The protruding ends of the bias yarns can be woveninto the fabric selvedge or attached to a suitable clamping system moving parallel to theselvedge. According to the patent, a rack can be split into two halves so that each half can beseparately withdrawn to opposite sides of the fabric to facilitate the weaving of complexpreform structures, such as stiffened panels, without disrupting the continuity of the biasyarns. Examples of such preform structures, however, are not given, although it should benoted that the positioning of the lappet system together with bias yarn supply on racks permitsthe inclusion of bias yarn layers at any vertical position in the through-thickness direction.

Volume V: Textile Composites and Characterisation
V - 92
(a) Lappet weaving principles. (b) Schematic illustration of loom cross-sectionFig. 5: Multiaxial weaving development by Farley [22].
(a) Example weave (b) Schematic illustration of loom cross-section.Indexing screw-shaft system
Fig. 6: Multiaxial weaving develop-ment by Anahara et al [23]
A multiaxial multilayer structuretogether with the manufacturingprinciples described by Anahara et al[23] is illustrated in Figure 6. Thenormal warp (z), bias (B) and weft(x) yarns are held in place by verticalbinder yarns (y). The weft yarns areinserted as double picks using arapier needle (not shown) which also performs beat-up. Weft insertion requires the normalwarp and bias yarn layers to form a shed via shafts (5,6) which do not use heddles but ratherhave horizontal guide rods to maintain the vertical separation of these yarn layers. The binderyarns are introduced simultaneously across the fabric width by a vertical guide bar assembly(10) comprising a number of pipes with each pipe controlling one binder yarn. The bias yarnsare continuous throughout the fabric length and traverse the fabric width from one selvedge tothe other in a cross-laid/folded structure, as shown in Figure 6(a). Lateral positioning andcross-laying of the bias yarns is achieved through use of an indexing screw-shaft system(15,16), shown in Figure 6(c). As the bias yarns are folded downwards at the end of theirtraverse, there is no need to rotate the bias yarn supply as in triaxial weaving. Consequently,the bias yarns can be supplied on conventional warp beams (2a) or from a warp creel, but they

Proceedings of ICCM–11, Gold Coast, Australia, 14th-18th July 1997
V - 93
must be appropriately tensioned (12) due to path length differences at any instant of weaving,although total yarn consumption will be equal for all bias yarns within a folded structure. Itshould be noted, however, that the folded structure of the bias yarns results in each layerhaving triangular sections which alternate in the direction of the bias angle about the normalwarp direction due to bias yarn interchange between adjacent layers.
In total, Anahara’s patent describes eight variations, in which the fabric structure achieved isthe main emphasis. However, two of these variations also describe an alternate approachbased on triaxial weaving principles. The bias yarns are threaded through individual guideblocks which are controlled by a special shaft to circulate in one direction around arectangular path. Clearly, this also requires rotation of the bias yarn supply.
(a) Example weave(b) Schematic illustration of loom cross-section
(c) Split-reed system
Fig. 7: Multiaxial weaving developmentby Addis [25]
Another approach is presented by Mood and Mahboubian-Jones [24] and extended by Addis[25]. While there are differences in detail, the prime features in these patents for control ofthe bias yarns are the use of special split-reeds together and a jacquard shedding mechanismwith special heddles. Figure 7 illustrates the system developed by Addis together with anexample of the type of structure that can be produced; the latter comprises bias yarns (11,12)sandwiched between weft yarns (14,15) with structural integrity provided by warp binding(13). A creel (16) supplies bias warp yarns in a sheet (17) to the special heddles (19)connected to the jacquard head (20). The bias yarns then pass through the split-reed system(18) which includes an open upper reed (22) and an open lower reed (21) together with guides(32) positioned in the reed dents. The lower reed is fixed while the upper reed can be movedin the weft direction. The jacquard head is used to position selected bias yarns in the dents ofthe upper reed so that they can be shifted transverse to the normal warp direction; it should benoted that correct positioning of the bias yarns requires a series of such lifts and transversedisplacements and must ensure that there is no entanglement of the warp. A shed is formed

Volume V: Textile Composites and Characterisation
V - 94
by the warp binding yarn (13) via a needle bar system (25) and the weft is inserted at the weftinsertion station (23), with beat-up performed by another open reed (30).
The earlier patent [24] utilised two split-reed systems, positioned on either side of thejacquard head, and required the bias yarns to be detachably engaged by the special heddles(eg. latch needles) for selective raising and lowering of yarn. Normal warp yarns were alsocontrolled by the jacquard head and beat-up could be performed by the open lower reed of thesplit-reed system. It would appear that the yarn guides (32) in the later system wereintroduced to overcome problems of yarn abrasion and other failures. Nevertheless, the basicapproach described in these two patents appears to have potential for the manufacture ofunique structures, due to the use of the jacquard head, but clearly requires further exploration.However, as the warp supply is not rotated, reversal in the direction of the bias yarns must begoverned by “cross-laying/folding” considerations which are not discussed in the patents.
A multiaxial multilayer nonwoven (non-interlacing) development has also been described in asecond patent by Anahara et al [26]. The aim is to ensure that such structures are symmetricalabout an imaginary central plane. The various layers are assembled from individual yarns laidaround perpendicular pins in a frame. The pins are subsequently replaced by vertical bindingyarn in a stitching action.
CONCLUDING REMARKS
The textile industry has a rich history of innovation and invention to meet consumer demandsand increase productivity through automation of fibre/yarn manipulation processes - indeed,the development of a Dutch 12-piece ribbon loom in 1604 was, according to Karl Marx, theharbinger of the Industrial Revolution. The composites industry is one consumer of growingimportance to the textile industry. The need for integrally-woven three-dimensional preformstructures for advanced composites has seen many developments in recent years extendingconventional weaving processes, as briefly summarised in the early part of this paper. Theincreasing demand for integrally-woven multiaxial structures (eg. 5-axis reinforcement), inwhich bias yarns complement the orthogonal directions of warp, weft and through-thicknessbinder reinforcement, has been the main focus of this paper. Developments in this area werereviewed in detail, together with the special techniques of lappet weaving and triaxialweaving. It is clear that lappet weaving principles have been incorporated in two of thesedevelopments [21,22] while a third patent [23] has offered a number of variations based ontriaxial weaving principles and cross-laying principles. The fourth development [24,25]would appear to have potential for the manufacture of unique structures through the use of ajacquard shedding mechanism but this requires further exploration as cross-laying is implicitfor bias yarn traverse across the full width of the fabric. The fifth development [26] is not aweaving technique but combines the assembly of non-interlaced yarn layers with subsequentbinding via stitching. The authors are currently considering the feasibility of alternateweaving developments to the above and will report the principles of these in the near future.

Proceedings of ICCM–11, Gold Coast, Australia, 14th-18th July 1997
V - 95
REFERENCES
1. Marks R. and Robinson A.T.C., “Principles of Weaving”, Textile Institute, Manchester,1976.
2. Grosicki Z.J., “Watson’s Textile Design and Colour”, Newnes-Butterworth, London,1975.
3. Rouhling J.A., “Deformable Fabric for composite materials”, European Patent 0-439-274-A1, 31 July 1991, Scapa Group PLC.
4. Muller J., Zulliger A. and Dorn M., “Economic production of composite beams with 3Dfabric tapes”, Textile Month, Sept 1994, 9-13.
5. Bompard B. and Lamarie J-P., “Laminated material reinforced by a multi-dimensionaltextile structure and method for producing the same”, US Patent 5,021,281, 4 June1991, Brochier S.A.
6. Sawko P.M., Calimito D.P. and Jong A., “Flexible ceramic thermal protection systemresistant to high aeroacoustic noise comprising a three-dimensional woven-fiberstructure having a multilayer top fabric layer and an intermediate rib fabric layer”, USPatent 5,451,448, 19 Sept 1995, NASA.
7. Busgen A., “Shape weaving - new invention for producing 3D-shaped woven shells”,Technische Textilien/Technical Textiles, vol.38, Sept 1995, 129-132 (E28-E29).
8. Khokar N., “An experimental uniaxial noobing device: working principle and importantfeatures”, Proc 77th Annual World Conference of the Textile Institute, Niches in theWorld of Textiles, Tampere, Finland, 21-24 May 1996, vol.2, 303-304.
9. Mohamed M.H. and Zhang Z-H., “Method for forming variable cross-sectional shapedthree dimensional fabric”, US Patent 5,085,252, 4 Feb 1992, NCSU.
10. Stewart F.H., “Woven fabric”, US Patent 1,368,215, 8 Feb 1921.
11. Mooney D.R., “Triaxial weaves and weaving: an exploration for hand weavers”, ArsTextrina, vol.2, 1984, 9-68.
12. Kulczycki K. and Burns D., “Triaxial weaving machine with heddle transfer andmethod”, US Patent 4,013,103, 22 March 1977, Barber-Colman Co.
13. Dow N.F., “Triaxially woven fabrics of uniform compliancy and porosity”, US Patent3,874,422, 1 April 1975, N.F. Doweave Inc.
14. Schwartz P., “Complex triaxial fabrics - cover, flexural rigidity, and tear strength”,Textile Res. J., vol.54, 1984, 581-584.

Volume V: Textile Composites and Characterisation
V - 96
15. Trost W.C., “The triaxial weaving machine”, Canadian Textile Journal, July 1977, 55-59.
16. Helton M., Dow F., Dow R.M. and Hillebrand M.J., “Triaxial fabric forming machineand components therefor”, US Patent 4,015,637, 5 April 1977, N.F. Doweave Inc.
17. Dow N.F., “Warp beam for triaxial weaving”, US Patent 3,884,429, 20 May 1975, N.F.Doweave Inc.
18. Fujita A., Hamada H. and Maekawa Z., “Tensile properties of carbon fiber triaxialwoven fabric composites”, J. Comp. Mat., vol.27, no.15, 1993, 1428-1442.
19. Trost W.C., “Triaxial fabric”, US Patent 4,438,173, 20 March 1984, Barber-Colman Co.
20. Fukuta K., Hatta H., Hiroshima N., Murayama K. and Sugano T., “Triaxial fabric ofinterlaced oblique yarns”, US Patent 5,070,914, 10 Dec 1991, Mitsubishi DenkiKabushiki Kaisha, and Agency of Industrial Science and Technology.
21. Ruzand J-M. and Guenot G., “Multiaxial three-dimensional fabric and process for itsmanufacture”, International Patent WO 94/20658, 15 Sept 1994, Etablissements CottonFreres et Cie.
22. Farley G.L., “Method and apparatus for weaving a woven angle ply fabric”, US Patent5,224,519, 6 July 1993, NASA.
23. Anahara M., Yasui Y. and Omori H., “Three-dimensional textile and method ofproducing the same”, European Patent 0-426-878-A1, 15 May 1991, Kabushiki KaishaToyoda Jidoshokki Seisakusho.
24. Mood G.I. and Mahboubian-Jones M.G.B., “Multi-axial weaving”, International PatentWO 92/14876, 3 Sept 1992, Bonas Machine Co. Ltd.
25. Addis S.R., “A bias yarn assembly forming device”, International Patent WO 96/06213,29 Feb 1996, Short Brothers PLC.
26. Anahara M., Yasui Y., Sudoh M. and Nishitani M., “Three-dimensional fabric withsymmetrically arranged warp and bias yarn layers”, US Patent 5,270,094, 14 Dec 1993,Kabushiki Kaisha Toyoda Jidoshokki Seisakusho, and Kawasaki Jukogyo KabushikiKaisha.
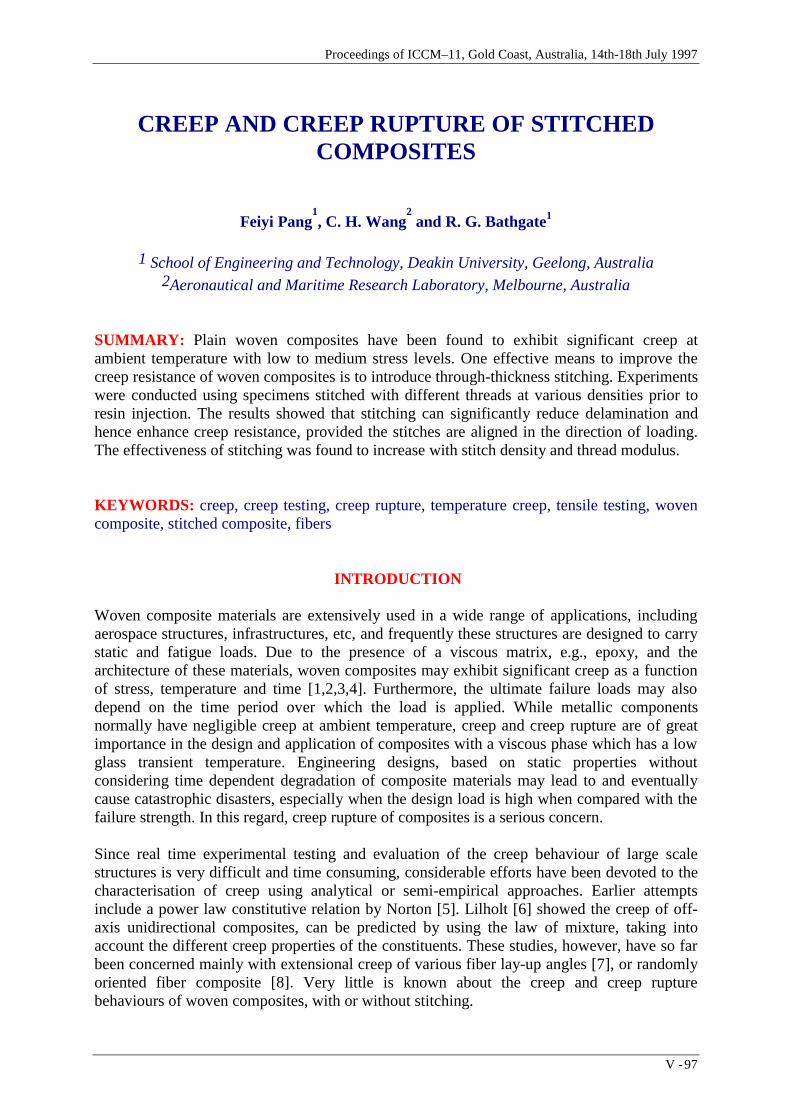
Proceedings of ICCM–11, Gold Coast, Australia, 14th-18th July 1997
V - 97
CREEP AND CREEP RUPTURE OF STITCHEDCOMPOSITES
Feiyi Pang1, C. H. Wang
2 and R. G. Bathgate1
1 School of Engineering and Technology, Deakin University, Geelong, Australia2Aeronautical and Maritime Research Laboratory, Melbourne, Australia
SUMMARY: Plain woven composites have been found to exhibit significant creep atambient temperature with low to medium stress levels. One effective means to improve thecreep resistance of woven composites is to introduce through-thickness stitching. Experimentswere conducted using specimens stitched with different threads at various densities prior toresin injection. The results showed that stitching can significantly reduce delamination andhence enhance creep resistance, provided the stitches are aligned in the direction of loading.The effectiveness of stitching was found to increase with stitch density and thread modulus.
KEYWORDS: creep, creep testing, creep rupture, temperature creep, tensile testing, wovencomposite, stitched composite, fibers
INTRODUCTION
Woven composite materials are extensively used in a wide range of applications, includingaerospace structures, infrastructures, etc, and frequently these structures are designed to carrystatic and fatigue loads. Due to the presence of a viscous matrix, e.g., epoxy, and thearchitecture of these materials, woven composites may exhibit significant creep as a functionof stress, temperature and time [1,2,3,4]. Furthermore, the ultimate failure loads may alsodepend on the time period over which the load is applied. While metallic componentsnormally have negligible creep at ambient temperature, creep and creep rupture are of greatimportance in the design and application of composites with a viscous phase which has a lowglass transient temperature. Engineering designs, based on static properties withoutconsidering time dependent degradation of composite materials may lead to and eventuallycause catastrophic disasters, especially when the design load is high when compared with thefailure strength. In this regard, creep rupture of composites is a serious concern.
Since real time experimental testing and evaluation of the creep behaviour of large scalestructures is very difficult and time consuming, considerable efforts have been devoted to thecharacterisation of creep using analytical or semi-empirical approaches. Earlier attemptsinclude a power law constitutive relation by Norton [5]. Lilholt [6] showed the creep of off-axis unidirectional composites, can be predicted by using the law of mixture, taking intoaccount the different creep properties of the constituents. These studies, however, have so farbeen concerned mainly with extensional creep of various fiber lay-up angles [7], or randomlyoriented fiber composite [8]. Very little is known about the creep and creep rupturebehaviours of woven composites, with or without stitching.

Volume V: Textile Composites and Characterisation
V - 98
The objective of this paper is to present an experimental study of the creep rupture behaviourof woven composites at ambient temperatures. Through-thickness stitching was investigatedas a promising means of improving the creep resistance of composites.
MATERIALS AND EXPERIMENTS
A two-dimensional woven fiber composite was manufactured using a standard resin injectiontechnique. Five layers of bi-directional carbon fibre cloth were placed in between two layersof glass fibre fabric which was bi-directional E-glass cloth (top and bottom). The fabric wasstitched through the thickness to obtain the preform, using a modified lock stitching method[2,3,4]. When the stitching process was completed, a standard resin injection procedure wasapplied to obtain the stitched composite. The resin used was Epocast 50-A, mixed withhardener 946 at a ratio of 100:15 by weight. Finally the composite was cured three days atroom temperature followed by a post curing process of 2 hours at 80°C. The resultingcomposites had a volume fraction of approximately 0.5, half of which was aligned parallel tothe axis of the specimens and the rest aligned perpendicular to the specimen axis. Table 1shows the specifications of cotton and carbon threads used in the present work.
Table 1: Characterisation of stitch yarn
cotton yarn(Tex=300)
carbon yarn(Tex=200)
thick carbon(Tex=800 )
Tensile strength (MPa) 350 3400 3400Modulus(GPa) 2.857 238 238
The stitching process was repeated along the loading direction as shown in Fig.1. The manualstitching process was achieved with a high level of control and repeatability to provide evenlydistributed stitch points throughout the hybrid fabric preform.
Tensile Static and Creep Testing
The size of the specimen was 200mm long, 15 mm wide and 1.5 mm thick. The two stitchinglines were symmetry to the centre. At each end, 50mm of the specimen was held in the grips,leaving a test area of 100mm long and 15mm wide.
10 mm
00 stitch
Load
ing
dire
ctio
n
10 mm
(a) (b)
Fig.1 (a) Lock stitching pattern and (b) loading direction.

Proceedings of ICCM–11, Gold Coast, Australia, 14th-18th July 1997
V - 99
Static tensile tests were conducted to quantify the mechanical properties of the unstitched andstitched woven composites, with particular attention to the effect of stitching on the in-planetensile strength and elastic modulus. As shown in Table 2, both the Young's Modulus and thetensile strength increased as a result of stitching, suggesting that stitching of the preforms didnot result in any loss of in-plane stiffness and strength. Tensile creep tests were conductedusing a workshop constructed lever arm system. Constant load was applied to each specimen,corresponding stress levels ranging from 10% to 90% of the respective tensile strength. Atleast two specimens were tested at each condition to assess the variations between specimens.
Table 2: Mechanical properties of non-stitch and stitched. Stitch threads and density
Stitched
Static Properties non-stitch
composite
cotton
pitch=5mm
cotton
pitch=10mm
carbon
pitch=5mm
carbon
pitch=10mm
Tensile strength (MPa) 279 309 297.5 340 333
Elastic Modulus (GPa) 53.5 59.1 51.6 78.1 73.2
RESULTS AND ANALYSIS
Stitch Threads and Density
The experimental creep curves for specimens without stitch are shown in Figure 2(a), wherethe creep strains measured at various constant applied stress are plotted against time. Here thestrains are the total longitudinal strain, ε, recorded using an extensometer. It is clear that verylittle creep occurred at stress level equal to or below 50 MPa, roughly one fifth of the ultimatetensile strength of the unstitched specimens.
Fig.2(b) shows the creep behaviour of specimens stitched with cotton threads at a pitch=5mmalong the loading direction. Comparison with the unstitched specimens reveals that higherstress was required to induce the same amount of creep at a given time. The creep response ofhigh density (pitch=5mm) carbon thread stitched composites are shown in Fig.2(c). Ascomparing with the cotton thread stitched composites (same pitch) even more reduction in thecreep strain at a given stress level was observed. To further examine the influence of threadstiffness on creep, experiments have also been carried out for specimens stitched with athicker carbon thread. The results are shown in Fig.2(d).
For a given stitching thread, the density of stitching was also important, as evidenced inFig.3(a) and (b). The experimental results showed that the smaller the stitch pitch, the moreeffective was the stitching. The different creep behaviours of unstitched and stitchedcomposites can be better seen in Fig.4, where the specimens were tested at an identical stresslevel. It is evident that for the same pitch, thick carbon thread was clearly the most effective interms of reducing creep.

Volume V: Textile Composites and Characterisation
V - 100
0
0.1
0.2
0.3
0.4
0.5
0 2000 4000 6000
ExperimentFour element model
70MPa
50MPa
30MPa
205MPa
108MPa
88MPa
Time (min.)
Str
ain
(%)
0
0.1
0.2
0.3
0.4
0.5
0 2000 4000 6000
Four element modelExperiment
105MPa88MPa
70MPa
250MPa
205MPa
150MPa
Time ( min. )
Str
ain
( %
)Fig.2: Creep responses of (a) unstitched composite (b) cotton
0
0.1
0.2
0.3
0.4
0.5
0 2000 4000 6000
ExperimentFour element model
150MPa
88MPa70MPa
105MPa
260MPa
250MPa
205MPa
Time ( min. )
Str
ain
( %
)
0
0.1
0.2
0.3
0.4
0.5
0 2000 4000 6000
Four element modelExperiment
260MPa
250MPa
205MPa
152MPa
105MPa88MPa
70MPa
Time (min.)
Str
ain
(%
)
(c) carbon (d) thick carbon composite
0.2
0.3
0.4
0.5
0 2000 4000 6000
non-stitchpitch=5pitch=10pitch=20
Time(min.)
Str
ain
(%)
0.2
0.3
0.4
0.5
0 2000 4000 6000
non-stitchthick carbon thread,pitch=10pitch=5pitch=20pitch=10
Time (min.)
Str
ain
(%)
Fig.3: Effects of stitching density on creep behaviour (b) carbon thread (MPa).(a) cotton thread (205MPa)

Proceedings of ICCM–11, Gold Coast, Australia, 14th-18th July 1997
V - 101
0.25
0.35
0.45
0 2000 4000 6000 8000
thick carbon(pitch=10mm)
cotton (pitch=5mm)
cotton (pitch=10mm)
carbon (pitch=5mm) carbon (pitch=10mm)
non-stitch
Time (min.)
Str
ain
(%)
0
0.0005
0.0010
0.0015
0.0020
100 200 300 400
thick carbon(pitch=10mm) carbon(pitch=5mm)cotton(pitch=5mm)unstitch
Stress(MPa)C
reep
ra
te
Fig.4: Effects of stitching and type of stitch Fig.5: Variation of the creep rate for fiber on creep behaviour (205MPa) different stress levels
The relationships between the creep rate and the stress are shown in Fig.5. It was found thatthe creep rate increased nearly linearly with increase of stress at low and medium stresslevels. This suggested that the unstitched and stitched woven composites could be consideredas linear viscoelastic materials. An accurate description for stitched and unstitched compositescan be obtained by using linear viscoelastic theory. In the present the four-element, Burger'smodel was adopted to characterise the creep behaviour. The total strain at time t is equal tothe sum of the following strains:
ε ε ε ε= + +1 2 3 (1)
The relationship between σ and ε for Burger's model were considered as[9]:
(2)

Volume V: Textile Composites and Characterisation
V - 102
ε3
ε2
ε1
ε
η2
η1
σ
R
R
1
2
Fig.6: Burgers Model
The predictions of Burger's model are compared with the experimental results obtained atambient temperatures, and, as shown in Fig.2, the correlation was very good. It was found thatgood agreement between theory and experiment was illustrated for the linear viscoelasticresponse characterised. The error in both estimates was approximately 4%. The accuracy ofBurger's model has been illustrated for such materials [9]. The results of the presentinvestigation indicate that Burger's model has the potential to accurately predict the linearviscoelastic response of stitched and unstitched woven composites.
Creep Rupture
The experimental results obtained for stage I and II regions represent the behaviour thatwould occur under service conditions with low to medium applied stresses. As the appliedstress increases, failure in the form of creep rupture may result, even at ambient temperature.If composite materials are to be used reliably for extended periods of time, it is important toknow not only how much the material deforms but if and when the material will fail. To thisend, experiments were carried out by increasing the applied stress level to between 85% and95% of the tensile strength. The results for unstitched, cotton stitched, carbon stitched andthick carbon stitched are shown in Fig.7(a)-(d). Compared with un-stitched composite underthe same stress level, stitched specimens generally took longer to fail. The creep curves for allspecimens appeared to be rather similar, exhibiting some stage III creep prior to rupture. Acomparison of specimens stitched with different threads is shown in Fig.8, clearlydemonstrating the effectiveness of stitching to increase creep rupture stress level for a giventime or increasing creep rupture life for a given stress level.

Proceedings of ICCM–11, Gold Coast, Australia, 14th-18th July 1997
V - 103
0
0.1
0.2
0.3
0 100 200 300 400
268MPa
255MPa
238MPa
Time (min.)
Str
ain
( %
)
0
0.1
0.2
0.3
0 100 200 300 400 500
270MPa
282MPa
296MPa
Time ( min. )
Str
ain
( %
) Fig.7: Rupture behaviour of (b) cotton stitched composite (a) unstitched composite
It can also be observed that the creep strain at failure, as shown in Figs.7(a)-(d), decreases asthe applied stress increases, indicating a gradual transition towards a more brittle behaviour. Ithas been suggested that the creep lifetime of many materials can be correlated using aMonkman-Grant (see e.g., Service [10]) type of relationship which relates the failure time t f
to the creep rate ε⋅
(3)
Where C and m are material and environmental constants. An exponent of m=1 implies aconstant strain at failure and assumes that creep in the primary and tertiary stages isnegligible, whereas an exponent greater than unity means that the failure strain shouldincrease as the strain rate decreases. The failure creep strain for unstitched and stitchedspecimens are plotted versus the failure time in Fig.9. The creep rates for the unstitched andstitched composites are shown in Fig.10 against the time to failure, at two differenttemperatures. It can be seen that there exists a universal relationship between the creep strainrate and the time to failure, thus providing a creep rupture criterion that can be identifiedrelatively easily, as C, m are independent of temperature, stitching method and stitchingdensity.
For practical application purpose, a relationship that gives the time to failure for any givenapplied stress and temperature would be more useful. Since the results of this study haveshown that for a given creep strain rate the time to failure is independent of the temperatureand stitching, Norton law and (3) can be combined to provide an expression that gives thetime to failure as a function of the applied stress:
t CAfm
amn= − −σ (4)

Volume V: Textile Composites and Characterisation
V - 104
0
0.1
0.2
0.3
0 200 400 600
290MPa
310MPa326MPa
Time ( min. )
Str
ain
( %
)
0
0.1
0.2
0.3
0 200 400 600
296MPa317MPa333MPa
Time ( min. )
Str
ain
( %
)Fig. 7(c) carbon stitched composite Fig. 7(d) thick carbon stitched composite.
Where C and m are constants, independent of geometry and temperature, A and n aredependent on temperature and stitching threads and pitch.
0
0.1
0.2
0.3
0.4
0 200 400 600
carbon(pitch=5mm)thick carbon(pitch=10mm)cotton(pitch=5mm)un-stitch
Time ( min. )
Str
ain
( %
)
0.05
0.15
0.25
0.35
0 200 400 600
thick carbon stitch(pitch=10mm)
carbon stitch(pitch=5mm)
cotton stitch(pitch=5mm)
unstitch
Failure time (min.)
Cre
ep s
tra
in (
%)
Fig.8: Effects of stitching and type of stitch Fig.9: Creep failure strain as a functionstitched composite. of failure time.
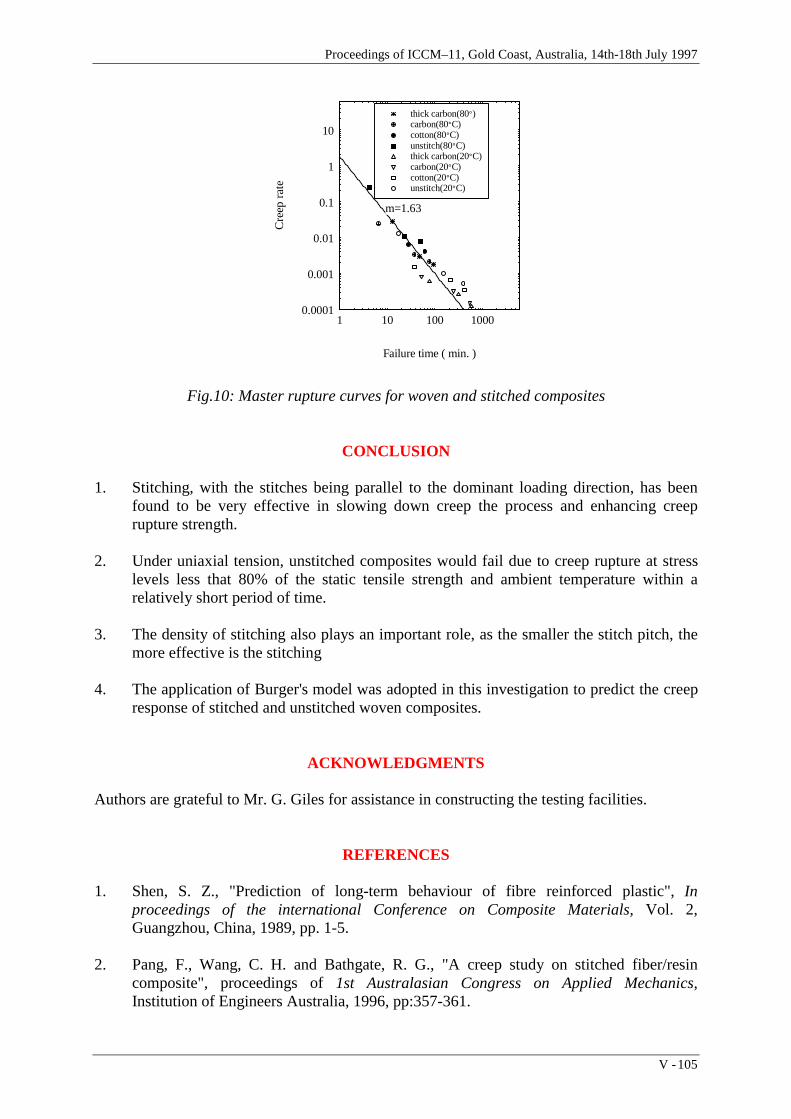
Proceedings of ICCM–11, Gold Coast, Australia, 14th-18th July 1997
V - 105
0.0001
0.001
0.01
0.1
1
10
1 10 100 1000
thick carbon(80°)carbon(80°C)cotton(80°C)unstitch(80°C)thick carbon(20°C) carbon(20°C)cotton(20°C)unstitch(20°C)
m=1.63
Failure time ( min. )
Cre
ep r
ate
Fig.10: Master rupture curves for woven and stitched composites
CONCLUSION
1. Stitching, with the stitches being parallel to the dominant loading direction, has beenfound to be very effective in slowing down creep the process and enhancing creeprupture strength.
2. Under uniaxial tension, unstitched composites would fail due to creep rupture at stresslevels less that 80% of the static tensile strength and ambient temperature within arelatively short period of time.
3. The density of stitching also plays an important role, as the smaller the stitch pitch, themore effective is the stitching
4. The application of Burger's model was adopted in this investigation to predict the creepresponse of stitched and unstitched woven composites.
ACKNOWLEDGMENTS
Authors are grateful to Mr. G. Giles for assistance in constructing the testing facilities.
REFERENCES
1. Shen, S. Z., "Prediction of long-term behaviour of fibre reinforced plastic", Inproceedings of the international Conference on Composite Materials, Vol. 2,Guangzhou, China, 1989, pp. 1-5.
2. Pang, F., Wang, C. H. and Bathgate, R. G., "A creep study on stitched fiber/resincomposite", proceedings of 1st Australasian Congress on Applied Mechanics,Institution of Engineers Australia, 1996, pp:357-361.

Volume V: Textile Composites and Characterisation
V - 106
3. Pang, F., Wang, C. H. and Bathgate, R. G., "Creep response of woven fiber composites:effect of stitching", accepted by Composite Science and Technology.
4. Pang, F., Wang, C. H. and Bathgate, R. G., "Effects of stitch thread and density on thecreep behaviour of woven composites", submitted to Journal of Composite Materials.
5. Norton, F. H., "The creep of steel at high temperature", New york : McGrawHill. 1929.
6. Lilholt, H., "Models for creep of fibrous composite materials", Materials Forum.Vol.11, 1988, pp. 133-139.
7. Chung I., Sun C. T. & Chang I. Y., "Modelling creep in thermoplastic Composites",Journal of Composite Materials, Vol. 27, No. 10, 1993, pp. 1009-1029.
8. Wang Y. R. & Chou T. W., "Analytical modelling of creep behaviour of short fibrereinforced ceramic matrix composites", Journal of Composite Materials, Vol. 26, No. 9,1992, pp.1269-1287.
9. Findley W. N., Lai J. S. & Onaran K., "Creep and relaxation of nonlinear viscoelasticmaterials", North-Holland Publishing Company.
10. Service T. H., "Creep rupture of a phenolic-alumina particulate composite", Journal ofMaterials Science 28, 1993, pp : 6087-6090.

Proceedings of ICCM–11, Gold Coast, Australia, 14th-18th July 1997
V - 107
MODELING OF DISCRETE RADIALREINFORCEMENT IN CURVED POLYMER MATRIX
COMPOSITE LAMINATES
Ming Y. He1, Brian N. Cox2 and Keith T. Kedward1
1 Materials Department and Department of Mechanical & Environmental Engineering,University of California, Santa Barbara CA 93106
2 Rockwell Science Center, 1049 Camino Dos Rios, Thousand Oaks CA 91360
SUMMARY : The problem of how through-thickness reinforcement opposes the opening ofdelamination cracks in curved laminar structures is examined theoretically. Finite elementcalculations have been performed to show how the through-thickness reinforcement modifiesthe energy release rate of a delamination crack. Solutions are found for perfectly bonded anddebonded cases. Energy conservation arguments are then used to define constitutive laws forequivalent continuous bridging springs acting on the delamination fracture surfaces. This stepallows the immediate application of useful concepts from the literature on bridged cracks.Results are summarized for convenient use and trends are highlighted by relating the exactnumerical results to analytical approximations for the perfectly bonded and debonded cases.
KEYWORDS : polymer matrix composite, stitch, laminate, delamination, finite element,bridging traction, bridged crack.
INTRODUCTION
In previous publications [1,2] simple approaches for predicting the amount of throughthickness reinforcement required to suppress delamination in polymer matrix composites havebeen presented. A curved configuration originally defined by Kedward et al [3] and used forconventional curved composite laminates was adopted for the theoretical development ofthese prediction methods. Further evaluation of the adequacy of these simple methods is nowaccomplished through finite element analyses.
From a practical viewpoint a relatively small percentage of through thickness reinforcementhas been proven to be effective in suppressing the propagation of delamination in impactdamaged panels and at stepped transitions associated with local changes in laminatethicknesses. Similarly, it is anticipated, but as yet unproved experimentally, that delaminationtendencies in curved structures subjected to bending loads, that tend to increase with theradius of curvature, can be suppressed by stitching.
One major incentive for the present work is the substantiation of the simple methodsadvanced by Cox et. al [1] enabling estimation of the minimum percentage of stitchreinforcement in the radial direction of curved laminates, necessary to suppress delaminationin curved laminates subjected to static or fatigue loading. These simple methods can then beadopted by structural designers in their efforts to select prudent stitch densities and evaluate

Volume V: Textile Composites and Characterisation
V - 108
the relative merits of a range of stitch formulations, i.e. fiber type and number of filaments pertow. The designer can then avoid the penalty of in-plane property degradation that can becreated by fiber damage and distortion with excessive percentage of through thickness (stitch)reinforcement. In addition the closed form relationship developed can facilitate estimation ofthe type, area fraction and distribution of stitches that would represent effective percentagesfor various skin thickness and/or curvatures.
Other constraints are imposed by the textile machinery available and used by the fabricatorsof fiber preforms and the subsequent polymer matrix composites. Hence the contribution ofthe analysis tools developed and validated herein, which serve the designers in the vitalinteractions with the manufacturing activities. Typically the processes involved in thefabrication of stitched composites consist of some form of resin infiltration technique such asResin Film Infusion (RFI) or Resin Transfer Molding (RTM).
The following development addresses the categories of well bonded and debonded interfacesbetween the stitch tow and surrounding matrix. This is shown to represent strong differencesin performance and effectiveness of the through thickness reinforcement and therefore theselection can be influenced by both the reinforcing fiber and its surface characteristics.
THE DELAMINATION AS A BRIDGED CRACK
Consider the uniformly curved laminate depicted in Fig. 1, subject to opening bendingmoments, i.e. moments of such a sense that the through-thickness stresses developed, σr aretensile. The laminate has total thickness 2h and the radius of curvature of its mid-plane isdenoted rm. When the curvature is modest (h/rm< 0.2), σr takes its maximum value in theuncracked laminate near the mid-plane. It will be assumed in the following that alldelaminations occur exactly on the mid-plane. This will be reasonable for studyingdelaminations caused solely by the through-thickness stress acting on naturally occurringflaws.
Fig. 1: A delamination crack in a curved structure under opening bending moments, withbridging stitches indicated schematically

Proceedings of ICCM–11, Gold Coast, Australia, 14th-18th July 1997
V - 109
Attention is also restricted here to delamination cracks that initiate and propagate far from theends of the curved structure or any holes. With this condition, Mode II sliding displacementsare expected to be negligible. The problem can therefore be treated by examining purelyMode I opening.
When a delamination crack begins to propagate, it will be bridged by the stitches, as depictedin Fig. 1. The axial stresses in the stitches will be transferred to the laminate, tending to closedown the delamination crack and reducing the crack tip stress intensity factor, Ktip. Thisclosure effect can be represented by a system of bridging tractions acting on the fracturesurfaces. The bridging traction will usually increase as the delamination crack openingincreases, at least until the stitches fail. This enables the possible existence of a steady statemode of delamination crack propagation, in which the critical value, σc, of σr required tocause propagation of the delamination crack reaches a constant value, σ1, independent of thedelamination crack length.
To enable concepts from the literature on bridged cracks to be invoked, an analogue withcontinuous bridging traction is now sought to the discrete unit cell model shown in Fig. 2a.The continuous model will be formulated to be energetically equivalent to the discrete model.
The unit cell with continuous bridging traction, p, acting on the delamination fracture surfacesis sketched in Fig. 2b. The laminate and stitch have been replaced by a homogenousorthotropic medium. The models of Figs. 2a and 2b will be called the “discrete” and“continuous” models, respectively.
For the continuous model, the linear bridging traction law is given by
p=βu (1)
where 2u is the total crack opening, β the bridging stiffness parameter.
Fig. 2: (a) Detail of the geometry assumed for modeling a stitched laminate.(b) Analogue of continuous bridging tractions acting on an homogenized laminate

Volume V: Textile Composites and Characterisation
V - 110
The fracture properties of the continuous model have already been analyzed in Refs. 1,4 and5. From these prior works, the steady-state cracking stress, σ1 is given by
σ1 = βΓc (2)
where Γc is the intrinsic Mode I fracture energy of the stitched laminate. A fair estimate of Γc
is
Γc = (1-cs) Γm (3)
where cs is the area fraction of stitches, Γm is the fracture toughness of the unstitchedlaminate. More generally, Γc refers to the delamination resistance arising from crack tipprocesses. Given Eq. (3) or some other estimate or measurement of Γc, σ1 is fully determinedby the bridging stiffness parameter, β.
ESTIMATION OF THE BRIDGING STIFFNESS PARAMETER β
Shear Lag Approximation
The problem of a cylindrical inclusion (here the through-thickness segment of the stitch)being pulled out of a semi-infinite half space (here one half of the laminate with the boundarybeing the crack plane) to which it is well bonded was analyzed by Budiansky, Hutchinson,and Evans (BHE) using shear lag methods [6]. While BHE assumed isotropy in the cylinderand the half-space, it will serve to equate Young’s modulus for their inclusion to the axialmodulus of the stitch, Es, here; and the through-thickness and shear moduli of their half-spaceto the through-thickness and shear moduli of the laminate, Ez and Gzx here. Integrating thestress fields of BHE’s Eq. (25) yields displacements at the fracture surface and thence anestimate, βBHE, for β:
βBHE =ρcsEs
rs(4a)
where ρ =2Gzx
Ez
cs
1− cs
+Ez
Es
−4(1− cs)
2
2 logcs + (1− cs)(3− cs)
1 / 2
≈ ηcs1/ 2 (4b)
and rs is the radius of the stitch, η is a dimensionless factor of order unity. The shear laganalysis of BHE yields axial stresses in the stitch which fall exponentially with distance fromthe fracture plane with a characteristic length rs/ρ. Thus if

Proceedings of ICCM–11, Gold Coast, Australia, 14th-18th July 1997
V - 111
Results from Finite Element Model
Numerous calculations were performed by finite element methods in reference [2] for thediscrete cell model (Figure 2a) for two material systems:
System 1: a quasi-isotropic carbon/epoxy laminate stitched with carbon fibers;System 2: the same laminate stitched by glass fibers;
Values of β deduced from the FEM results for well bonded stitches are presented in Fig. 3.The FEM results have been normalized by the estimate βBHE derived from the BHE model.The abscissa shows the ratio h/rs.
Figure 3a shows calculations for material system 1 for cs = 0.008 (a relatively low volumefraction of stitches); and three values of the curvature measure rm/h. Results for rm/h= 200will be very close to the limit obtained for vanishing curvature. The case rm/h= 5.7 representsthe maximum degree of curvature that this work will recommend in designing stitchedlaminates. For large h/rs solutions for all rm/h approach a constant value, not far from unity.For small h/rs, β falls well below βBHE. The cut-off occurs near the expected condition, Eq.(5), i.e., near h/rs = 11 for material system 1. For h/rs> cs
½ (the regime where BHE isappropriate), there is some separation of curves for different rm/h, but the dispersion ismoderate for curvatures in typical structures (5 < rm/h < 10).
For h/rs < 5, the BHE derived approximation seriously overestimates β, which would lead tononconservative designs. This is the regime of thin laminates, which can deform very easilyby buckling without significant axial displacement of the stitches. The regime h/rs < 5 mustbe avoided by designers.
Figure 3b shows results of the same form for fixed curvature, rm/h = 9; up to threerepresentative stitching area fractions, cs = 0.008 (low), 0.02 (moderate), and 0.06 (relativelyhigh); and for the same two material systems. All curves show similar trends, being almostconstant for h/rs > 10 and low for h/rs < 5. For these material systems, β/βBHE is not far from

Volume V: Textile Composites and Characterisation
V - 112
unity for h/rs > 10. As Fig. 3 summarizes, the estimate βBHE is fairly accurate for highlyanisotropic materials (polymer composites).
Figure 4 shows FEM results for the case of debonded stitches for the two material systemswith cs= 0.008 and rm/h = 5.7. The bridging stiffness parameter, β, is now normalized againstthe estimate, β(1)
unif, derived by assuming uniform axial strain in the stitch (Eq. (15)). All thecurves lie significantly below the ordinate unity, indicating that β(1)
unif is a nonconservativeestimate. The discrepancy is associated with the contribution of laminate deformation and itseffect on stitch compliance which was ignored in the formulation for β(1)
unif. The dashedcurve shows β(2)
unif/β(1)unif where β(2)
unif is the estimate of Eq. (8), which includes anapproximate estimate of laminate deformation. This curve reproduces the magnitudes andtrends with h/rs quite well. Just as for well bonded stitches, designing structures with h/rs< 5is not recommended, because β becomes very small (ineffective stitching).
0
0.25
0.5
0.75
1
0 5 10 15 20 25
β/β B
HE
h/rs
rm/h=200
Well bonded interfacesMaterial system 1c
s=0.8%
5.7
9
Boundary of validity of BHE
(a)
0
0.5
1
1.5
2
2.5
0 5 10 15 20 25
β/β B
HE
0.06 0.02
h/rs
Well Bonded Interfacesr
m/h=9
Material system12
0.02
0.008
0.008
cs=0.06
(b)
Fig. 3: Numerical results for the bridging stiffness parameter, β normalized against theestimate derived from the BHE model vs. the ratio of the laminate half-thickness to the
stitch radius. Well bonded stitches. (a) Three different curvatures; materialsystem 1. (b) Different stitch area fractions for two material systems.

Proceedings of ICCM–11, Gold Coast, Australia, 14th-18th July 1997
V - 113
0
0.2
0.4
0.6
0.8
1
0 5 10 15 20 25
β/β(1
)
unif
h/rs
Material system 1
Frictionless Sliding Interfacesr
m/h=9, c
s=0.008
FE Results
Analytical
Results, β(2)unif
Material system 2
Fig. 4: Numerical results for the bridging stiffness parameter, β, for the continuous model normalized against the estimate derived by assuming uniform axial strain
in the stitch vs. the ratio of the laminate half-thickness to the stitch radius.Debonded, frictionless stitches.
Bounds for β
The bonded and debonded, frictionless cases for which solutions have been computed byfinite element methods provide upper and lower bounds for β. Let β(max) denote the upperbound and β(min) denote the lower bound. Any case of intermediate debonding or nonzerofriction must lie between these bounds.
For the well bonded case,
The upper and lower bounds for the steady-state cracking stress, σ1(max), and σ1
(min), can bedetermined from the bounds for β and Γc by Eq. 2. Figure 5 shows representative values forthe carbon-epoxy system as functions of the area fraction of stitches, cs. The intrinsic fractureenergy was assigned the value 1 kJm-2.

Volume V: Textile Composites and Characterisation
V - 114
MINIMUM AREA FRACTION OF STITCHES REQUIRED TO SUPPRESSDELAMINATION
In Ref. 1 it was proposed that a practical criterion for an adequate density of stitching was therequirement that delamination occur at a higher external load than that required for failure bysome other mechanism. In most cases, the other mechanism will be failure on thecompressive (outer) surface of the laminate, usually by kink band formation [1,7]. Let thecritical in-plane compressive stress for kinking failure be denoted σc. The compressive stresson the outer surface, σ(o), is related to the maximum radial stress, σr
(a) which arises near themid-plane, by [1,4]
where Ex is the in-plane Young's modulus of the laminate; and ξ is close to unity. A fittedapproximation to ξ can be found in [1]. In the following, it will be assumed that 5 < rm/h <10,so that σr
(a)/σr(o) For typical carbon-epoxy laminates, in-plane failure occurs by kinking on
the compressive side when σ(o) = σc 500MPa. Thus for the assumed curvature range, one
requires σ1 in the range 25 < σ1 < 50 MPa. This range is marked in Figure 5. If the stitchesremain well bonded, the area fraction of stitching cs for stitches of common denier (rs 0.5mm) required to achieve high enough σ1 to suppress delamination never exceeds 4%. If thestitches are assumed to debond, the required area fractions are much higher and care wouldhave to be taken to select a suitably fine stitch denier. A stitch of radius 0.125 mm wouldsupport the top of the range for σ1 when cs= 0.06. Nevertheless, this is the most conservativeoutlook for what is probably an extreme case. Stitching densities of a few percent with astitch spacing of at least several mm are likely to represent common and practicableconditions.
CONCLUSIONS
The problem of a delamination crack bridged by discrete stitches in a curved structure hasbeen mapped onto an analogue in which the crack is bridged by continuous crack facetractions. Solutions for well bonded and debonded, frictionless stitches form bounds to thegeneral case. The bounds can be expressed as estimates of the critical stress for delamination,from which bounds for the volume fraction of the stitching required to suppress delaminationcan be deduced. For polymer composites, stitch area fractions below 5% will be enough tosuppress delamination. Another important conclusion of this study is that the ratio of thelaminate half-thickness to the stitch radius should not be allowed to fall below 5. Stitching isineffective in suppressing crack opening and therefore in raising the delamination fractureenergy for laminates that are thinner than this.

Proceedings of ICCM–11, Gold Coast, Australia, 14th-18th July 1997
V - 115
Fig. 5: Bounds for the design stress σ1. The shaded bands indicate values required forrepresentative values of the relative curvature and the critical stress for failure
REFERENCES
1. Cox, B. N., Massabò, R., and Kedward, K. T., “The Suppression of Delaminations inCurved Structures by Stitching,” Composites, part A 1996, 27A, 1133-8.
2. He, M. Y., and Cox, B. N., " Crack Bridging by Through-Thickness Reinforcement indelaminating Curved Structures", submitted to Composites,. part A, 1996.
3. Kedward, K. T., Wilson, R. S., and McLean, S. K., "Flexure of Simply CurvedComposite Shapes," Composites J. 20, 1989, 527-536.
4. Lu, T. J., Xia, Z. C., and Hutchinson, J. W., “Delamination of Beams under TransverseShear and Bending,” Mater. Sci. Engng 1994, A188, 103-112.
5. Lu, T. J., and Hutchinson, J. W., “The Role of Fiber Stitching in Eliminating TransverseFracture in Cross-Ply Ceramic Composites,” J. Amer. Ceram. Soc., 1995, 78, 251-3.
6. Budiansky, B., Hutchinson, J.W., and Evans, A.G., “Matrix Fracture in Fiber-Reinforced Ceramics,” J. Mech. Phys. Solids, 1986, 34, 167-189.
7. Cox, B. N., Dadkhah, M. S., Morris, W. L., and Flintoff, J. G., “Failure Mechanisms of3D Woven Composites in Tension Compression and Bending,” Acta Metall. Mater.,1994, 42, 3967-84.
Volume V: Textile Composites and Characterisation
V - 116
INTERLAMINAR FRACTURE PROPERTIES OFSTITCHED FIBREGLASS COMPOSITES
A.P. Mouritz 1 and L.K. Jain2
1 Department of Defence, DSTO, Aeronautical and Maritime Research Laboratory,P O Box 4331, Melbourne, Victoria, AUSTRALIA 3001
2 Cooperative Research Centre for Advanced Composite Structures Ltd. (CRC-ACS),361 Milperra Road, Bankstown, New South Wales, AUSTRALIA 2200
SUMMARY: This paper assesses the ability of two theoretical models to predict the Mode Iand Mode II interlaminar fracture toughness properties of fibre reinforced polymercomposites reinforced by through-the-thickness stitching. The models were used to calculateR-curves and steady state energy release rates for stitched glass fibre reinforced polymer(GFRP) composites. The GFRP was stitched in two orientations with Kevlar® thread to twodensities. The Mode I model predicted a significant increase in the delamination resistance ofthe stitched composites, and the magnitude of this improvement was confirmedexperimentally using the double cantilever beam (DCB) test. Scanning electron microscopy(SEM) showed that this toughening was caused by stitches bridging the delamination and, to alesser extent, by crack tip deflection and by stitch pull-out processes. The Mode II modelpredicted that stitching would only provide a small improvement in delamination toughness,and this was in reasonable agreement with experimental results determined with the end notchcantilever (ENC) test which showed no appreciable change in toughness as a result ofstitching. SEM was used to observe the failure mechanisms of the stitches under Mode IIloading, and it appears that the ability of stitching to improve the delamination resistance wasmasked by the unusually high toughness of the unstitched GFRP laminate. This study showsthat the theoretical models can predict with reasonable accuracy the delamination resistanceof stitched GFRP loaded in translaminar tension or shear.
KEYWORDS: glass fibre reinforced polymer (GFRP) composite, stitching, mode I andmode II interlaminar fracture toughness, modelling
INTRODUCTION
Fibreglass composites are used in a wide variety of sporting goods, civil structures,automotive and aerospace components, and marine vessels. For example, these compositesare used in sporting equipment such as fishing rods, javelins, pole vault poles and tennisrackets while in automobiles they have been used in structural chassis components such asdrive shafts, springs and road wheels. Fibreglass is used in marine structures ranging in sizefrom masts and radomes to racing yachts, fishing trawlers and minehunting ships. Despite thewidespread use of glass fibre reinforced polymer (GFRP) composites, their use in otherapplications has been restricted by low mechanical, fracture toughness and impact resistantproperties in the through-thickness direction. This is a result of the two-dimensional (2-D)laminate structure, in which glass fibres do not extend in the through-thickness direction.

Proceedings of ICCM–11, Gold Coast, Australia, 14th-18th July 1997
V - 117
Since the mid-1980s there has been great interest in reinforcing composites by through-the-thickness stitching. Interlaminar fracture toughness studies reviewed by Dransfield et al. [1]show that stitched composites possess higher delamination resistance under Mode I and ModeII loading than traditional 2D laminates. For example, Jain [2] reports that the Mode I steadystate energy release rate (GIRs) required for crack propagation for a stitched carbon fibrereinforced polymer (CFRP) composite was 16 times higher than the unstitched CFRPlaminate, while under Mode II loading the steady state values (GIIRs) for CFRP compositeswas increased up to fourfold by stitching.
As a result of these improvements in interlaminar fracture toughness, stitched composites arebeing used in new structural applications such as the wings and fuselage of some aircraft [3].An important requirement for assessing potential applications for stitched composites is acapability to accurately predict the improvement in delamination resistance resulting fromstitching without the need for costly and time-consuming fracture toughness testing. Jain andMai [4,5] have recently developed theoretical models for predicting the delamination crackgrowth resistance (R) curves of stitched composites under Mode I and Mode II loading. Jain[2] found that these models predicted the R-curves for a stitched CFRP composite withreasonably good accuracy when compared with experimentally measured R-curves. Despitethis agreement, the models have not been rigorously tested for other types of stitchedcomposite, and therefore the aim of this paper is to assess their accuracy againstexperimentally measured Mode I and Mode II R-curves for a GFRP composite stitched withKevlar thread.
INTERLAMINAR FRACTURE TOUGHNESSMODELLING OF STITCHED COMPOSITES
Mode I Interlaminar Fracture Model
The model developed by Jain and Mai [4] for calculating the Mode I interlaminar toughness isbased on Euler-Bernoulli linear elastic beam theory applied to a stitched composite with adouble cantilever beam (DCB) geometry, as shown in Fig 1a. The model can be used todetermine the effect of various stitching parameters (eg. stitch density, stitch modulus, threaddiameter) on the R-curve behaviour of composites. However, the influence of stitchingorientation cannot be determined. Jain and Mai [4] show that the Mode I delaminationresistance in terms of stress intensity factor, KIR(∆a), of a composite with continuous through-the-thickness stitching can be calculated from the expression:
( )K a YP
Hf
a a
HIRo∆
∆=
+
(1)
where: ao is the initial crack length∆a is crack growth characterised by the stitch bridging zone lengthf(.) is a geometric factorH is the half-thickness of the DCB specimenP is the crack propagation load at a known length ao + ∆a, andY is an orthotropic correction factor.

Volume V: Textile Composites and Characterisation
V - 118
These and the following parameters are defined in detail in Ref. [4]. The crack propagationload, P, is obtained from the following crack propagation condition:
( )K a YP
Hf
a a
HK Y p t
Hf
t
HdtIR
oIC
t
a
∆∆
∆
=+
= +
=∫ ( )
1
0
(2)
where: KIc is the critical stress intensity factor of the (unstitched) compositep(t) is the closure traction due to bridging stitches, andt is the distance from the crack tip to the specimen end.
Once the crack propagation load is known, the fracture toughness, KIR(∆a), can be calculatedusing equation 1, and the fracture toughness in terms of energy release rate, GIR(∆a), may beobtaining using:
( ) ( )G a
K a
EIRIR
o
∆∆
=2
(3)
where Eo is the orthotropic elastic modulus of the composite [4].
Mode II Interlaminar Fracture Model
The Mode II interlaminar fracture toughness model by Jain and Mai [5] was derived usingfirst order shear deformation laminated plate theory and Griffith’s energy release rateapproach. Models have been developed for stitched composites subjected to shear loadingusing the end notched flexure (ENF) or end notched cantilever (ENC) test methods. Fig 1bshows a diagram for the ENC specimen geometry, and the energy release rate available forcrack propagation for this specimen is given by the following expression [5]:
( )( ) ( )G
A
a
aa H
AaII o= + +
−
*
*cosh
sinhsinh
21
2
2
λ∆τ
λ∆λ
α λ αα
λ∆ (4)
where: τ is the shear stress and is related to the applied load Pis the correction factor to include shear deformationα1 & α2 are stitching parameters andis related to material properties through A* and α1.
The expressions for τ, A*, α, α1, α2, and λ may be found in Ref. [5]. Using the crackpropagation condition, GII = GIIc, where GIIc is the critical energy release rate for theunstitched composite, the shear stress τ required for crack propagation can be determined. Theenergy release rate can then be calculated from:
( )G A a HIIR = +* τ α2 2 (5)
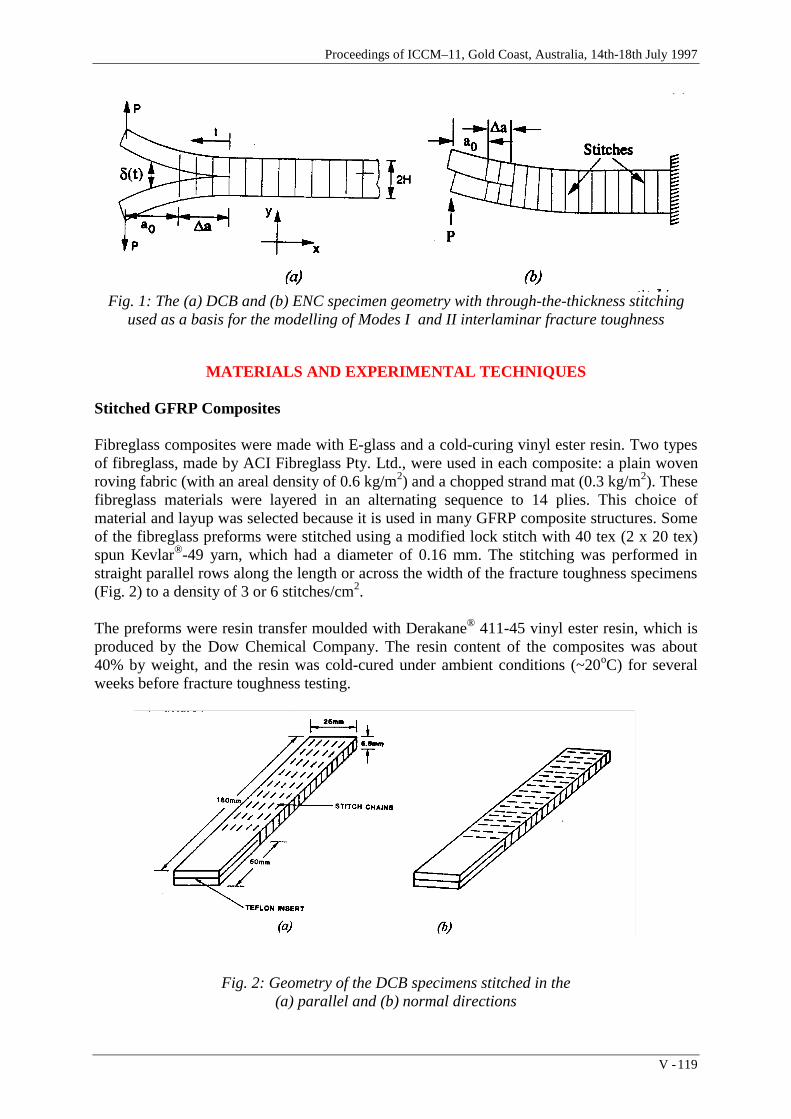
Proceedings of ICCM–11, Gold Coast, Australia, 14th-18th July 1997
V - 119
Fig. 1: The (a) DCB and (b) ENC specimen geometry with through-the-thickness stitchingused as a basis for the modelling of Modes I and II interlaminar fracture toughness
MATERIALS AND EXPERIMENTAL TECHNIQUES
Stitched GFRP Composites
Fibreglass composites were made with E-glass and a cold-curing vinyl ester resin. Two typesof fibreglass, made by ACI Fibreglass Pty. Ltd., were used in each composite: a plain wovenroving fabric (with an areal density of 0.6 kg/m2) and a chopped strand mat (0.3 kg/m2). Thesefibreglass materials were layered in an alternating sequence to 14 plies. This choice ofmaterial and layup was selected because it is used in many GFRP composite structures. Someof the fibreglass preforms were stitched using a modified lock stitch with 40 tex (2 x 20 tex)spun Kevlar®-49 yarn, which had a diameter of 0.16 mm. The stitching was performed instraight parallel rows along the length or across the width of the fracture toughness specimens(Fig. 2) to a density of 3 or 6 stitches/cm2.
The preforms were resin transfer moulded with Derakane® 411-45 vinyl ester resin, which isproduced by the Dow Chemical Company. The resin content of the composites was about40% by weight, and the resin was cold-cured under ambient conditions (~20oC) for severalweeks before fracture toughness testing.
Fig. 2: Geometry of the DCB specimens stitched in the(a) parallel and (b) normal directions

Volume V: Textile Composites and Characterisation
V - 120
Interlaminar Fracture Toughness Testing
The Mode I interlaminar fracture toughness was measured using the DCB method inaccordance with ASTM D5528-94a. The specimen geometry is shown in Fig 2. A 50 mmlong Teflon film was located between the mid-thickness plies at one end of the specimen toinitiate the delamination. End blocks were attached to this end of the specimen. Load wasapplied at a cross-head speed of 2 mm/min until the crack grew by 4-6 mm, and at this pointthe load (P) and cross-head displacement (δ) were recorded and the crack length (a) wasmeasured using a travelling optical microscope before the specimen was unloaded and thenreloaded until the crack grew by a further 4-6 mm. This process was repeated 12 times in aDCB test, which caused the delamination to grow by an average of 80 mm. Five DCB testswere performed on each composite. The Mode I energy release rate required for crackpropagation was calculated using the elastic beam equation derived by Hashemi, Kinloch andWilliams [6]:
GP
b a HIR =+
3
2
δχ( )
(6)
where b is the specimen width and χ is a constant to correct for deflection and rotation effectsat the crack tip, and is calculated using equations in Ref [6].
The Mode II fracture toughness was measured using the ENC method. The ENC specimengeometry was similar to the DCB specimens (Fig 2) except the pre-crack and specimenlengths were about 70 and 135 mm, respectively. The ENC specimens were loaded at a cross-head speed of 2 mm/min until the delamination grew a short distance (usually within 10 mmof the pre-crack). The load, cross-head displacement and crack length were then measuredbefore the specimen was unloaded and reloaded. This process was repeated 8 times during aENC test, which caused the delamination to grow by an average of 60 mm. Each compositewas tested 5 times, and the Mode II energy release rate causing crack propagation wascalculated from the expression [6]:
GP a
b H EIIR =9
4
2 2
2 311
(7)
where E11 is the Young’s modulus of the composite.
RESULTS AND DISCUSSION
Mode I Interlaminar Fracture Properties
Fig. 3 compares R-curves measured for the stitched composites under Mode I loading againsttheoretical R-curves calculated using equation 3. Also shown is a typical R-curve measuredfor the unstitched GFRP. The theoretical model is seen to calculate the Mode I interlaminarfracture toughness of the stitched composites with reasonably good accuracy. The theoreticalR-curves predict a rapid increase in fracture toughness within the first 8 mm of crack growth.This is due to the formation of a stitch bridging zone behind the delamination crack front (as

Proceedings of ICCM–11, Gold Coast, Australia, 14th-18th July 1997
V - 121
represented in Fig. 1 as the region ∆a). Once this zone has fully developed, the model predictssteady-state delamination growth where the GIR value remains constant with further crackgrowth. The measured R-curves show however that the GIR value does not remainconstant,
Fig. 3: Theoretical and measured Mode I R-curves for the GFRP composites stitched to a (a) low and (b) high stitch density. The theoretical R-curves are shown by the solid line
and this is because the delamination grew in a slip/stick process. In the DCB tests it wasobserved that when the delamination approached a row of stitches the crack growth speed wasslowed until some of the stitches bridging the delamination failed under a higher load. Thisthen allowed the delamination to propagate rapidly to the next row of stitches where theprocess repeated itself. This slip/stick fracture process contributed to the scatter in the GIR
values of the stitched composites, which is represented by the error bars in Fig. 3.

Volume V: Textile Composites and Characterisation
V - 122
A comparison of the measured and calculated GIRs values is presented in Table 1. Thecalculated toughness values are the same for stitching in the parallel and normal directionsbecause the model does not account for stitch orientation. The measured values, however,show that stitch direction has a negligible influence on toughness. Good agreement is seenbetween the measured and predicted GIRs values, although the model predicts a slightly highervalue for the high stitch density composites.
Table 1: Comparison of theoretical and experimental GIRs values
COMPOSITE THEORETICAL MEASURED
Unstitched GFRPGFRP stitched to low density in parallel directionGFRP stitched to low density in normal directionGFRP stitched to high density in parallel directionGFRP stitched to high density in normal direction
-1.55 kJ/m2
1.55 kJ/m2
2.45 kJ/m2
2.45 kJ/m2
0.67 ± 0.11 kJ/m2
1.73 ± 0.20 kJ/m2
1.63 ± 0.12 kJ/m2
2.27 ± 0.21 kJ/m2
1.90 ± 0.13 kJ/m2
(a) (b)
(c) (d)
Fig. 4: SEM micrographs of stitches located (a) 2.5 mm, (b) 10 mm and (c) 25 mm behindthe crack front as well as (d) a broken stitch on the fracture surface of a DCB specimen.
The direction of crack growth is to the left
The fractured DCB specimens were examined in cross-section using scanning electronmicroscopy (SEM) to observe the delamination crack growth process and the failuremechanisms of the stitches. The delamination grew along the chopped glass mat layer at themid-plane of the DCB specimen, and this promoted pull-out and bridging of these fibres

Proceedings of ICCM–11, Gold Coast, Australia, 14th-18th July 1997
V - 123
behind the crack front. This toughening process is responsible for the relatively highinterlaminar fracture toughness of the unstitched GFRP. When the delamination reached astitch it was deflected along the stitch/GFRP interface for 1-2 mm (Fig. 4a). This appeared toarrest the crack until a higher load caused the delamination to grow around the stitch withoutcausing any damage to the Kevlar®. From this observation it appears that the crack tipdeflection process contributes to the toughening of the GFRP by stitching. The undamagedstitches formed a crack bridging zone which extended for ~6 mm and 10-15 mm in thecomposites stitched to the low and high densities, respectively. The length of the bridgingzone is the same or slightly longer than that predicted by the model (∆a = 8 mm). Towards theend of the bridging zone the Kevlar® filaments began to fail (Fig. 4b) shortly before completetensile fracture of the stitch (Fig. 4c). Examination of the fracture surfaces revealed thatfilaments from the broken threads were pulled-out (Fig. 4d), and this is expected to contributea small amount to the toughening of the stitched composites.
Mode II Interlaminar Fracture Properties
Fig. 5 compares R-curves for the stitched composites experimentally measured under Mode IIloading against the theoretical R-curves calculated using equation 5. It is important to notethat R-curves measured for the same composite showed considerable scatter, and this isrepresented in the figure by error bars. The theoretical R-curves are characterised by a smallincrease in GIIR within the first 8 mm of crack growth, and then a steady-state crack growthcondition exists for longer crack lengths. The measured R-curves also show an initial rise inGIIR, which occurs over the first 15-20 mm. This is mainly from the bridging effect caused bythe in-plane glass fibres of the chopped glass mat layer. The experimental curves then show aregion where GIIR remains constant or declines gradually with increasing crack length. Thisregion is due to near steady-state crack growth, and the GIIRs values measured from this regionare compared with theoretical values in Table 2. This Table and Fig. 5 show that neither thestitch density nor stitch direction influenced the measured Mode II delamination toughness ofthe GFRP. The model, on the other hand, predicted a small improvement in toughness withincreasing stitch density. However, considering the large amount of scatter with the measuredGIIR values, the model predicted the Mode II delamination toughness with reasonably goodaccuracy.
Table 2: Comparison of theoretical and experimental GIIRs values
COMPOSITE THEORETICAL MEASUREDUnstitched GFRPGFRP stitched to low density in parallel directionGFRP stitched to low density in normal directionGFRP stitched to high density in parallel directionGFRP stitched to high density in normal direction
-6.9 kJ/m2
6.9 kJ/m2
7.6 kJ/m2
7.6 kJ/m2
6.2 ± 0.4 kJ/m2
5.9 ± 0.4 kJ/m2
6.0 ± 0.9 kJ/m2
6.6 ± 0.6 kJ/m2
5.9 ± 0.4 kJ/m2

Volume V: Textile Composites and Characterisation
V - 124
Fig. 5: Theoretical and measured Mode II R-curves for the GFRP composites stitched to a (a) low and (b) high stitch density. The theoretical R-curves are shown by the solid line
The inability of stitching to improve the Mode II fracture toughness was probably due to theintrinsically high toughness of the unstitched GFRP laminate. SEM examination of thiscomposite after ENC testing showed that delamination crack growth occurred along thechopped glass mat layer located at the mid-plane of the specimen. This promoted extensivebridging of the chopped glass fibres across the opposing fracture surfaces behind the crackfront. High shear forces would be needed to pull-out and break these fibres, causing a

Proceedings of ICCM–11, Gold Coast, Australia, 14th-18th July 1997
V - 125
substantial improvement in interlaminar toughness. Another feature of the fracture surfaceswas their reasonably high roughness caused by the delamination weaving through thechopped glass mat layer. In the ENC tests it was observed that this roughness often caused theopposing fracture surfaces to interlock at high asperities, and increased loading was needed toshear these asperities before crack growth could continue. This toughening caused bysurface traction combined with fibre bridging appear to be responsible for the highdelamination resistance of the unstitched GFRP. The modelling reveals that the contributionto toughening from stitching was much less, and as a result the delamination resistance of thestitched composites were similar to the unstitched laminate.
Interlaminar fracture studies using the end notched flexure (ENF) test report that the Mode IIdelamination resistance of unidirectional CFRP composites is improved by stitching [2,7,8].The GIIc values of unstitched CFRP composites (~1.5 kJ/m2) are much lower than theunstitched GFRP (6.2 kJ/m2). This is because unidirectional laminates do not experience largeamounts of fibre bridging and surface traction under shear loading. Stitching is then able toimprove the fracture toughness by forming a bridging zone behind the crack front. Forexample, Jain [2] found that the GIIc value for an unstitched CFRP laminate was 1.3 kJ/m2,and this increased to 5.2 kJ/m2 after stitching with Kevlar® yarn to a density of 12stitches/cm2. While this improvement in delamination resistance is considerable, thetoughness of the stitched CFRP composite is still lower than the unstitched GFRP. As a result,the ability of stitching to improve the already tough GFRP laminate is lower than for aunidirectional CFRP composite.
After the ENC tests the stitched specimens were examined by SEM to identify the failuremechanism of the Kevlar® stitches under shear loading. Fig. 6 shows the stitches at variousdistances behind the crack front. When the delamination reached a stitch it was deflectedalong the interface between the thread and surrounding GFRP, and this fracture process wassimilar in appearance to that observed under Mode I loading (Fig. 4a). The crack then spreadaround the stitch without causing any damage. At a short distance (∆a = 6 mm) behind thecrack front the stitches began to split along their length (Fig. 6b). This splitting spread acrossthe stitch (Fig. 6c) leading to complete failure (Fig. 6d). The length over which the stitchesbridged the delamination was observed to be ~20-25 mm for the two stitch directions andstitch densities. This stitch bridging zone was longer than that predicted by the model (~8mm), but it corresponds to the region on the measured R-curves where the GIIR increased withcrack length for the first ~25 mm. It appears, therefore, that the initial increase in the R-curvesis due to the formation of the stitch bridging zone as well as the chopped glass fibre bridgingzone. It is worth noting that other Mode II delamination toughness studies [2,7,8] on stitchedcomposites have used the ENF test method rather than the ENC technique. A limitation of theENF method is that the crack can only be grown for ~25-30 mm, which is slightly longer thanthe length of the stitch bridging zone. In comparison, the maximum crack length with theENC test is about 70-90 mm, and for this reason the ENC method is a better technique formeasuring the steady state fracture toughness of stitched composites.
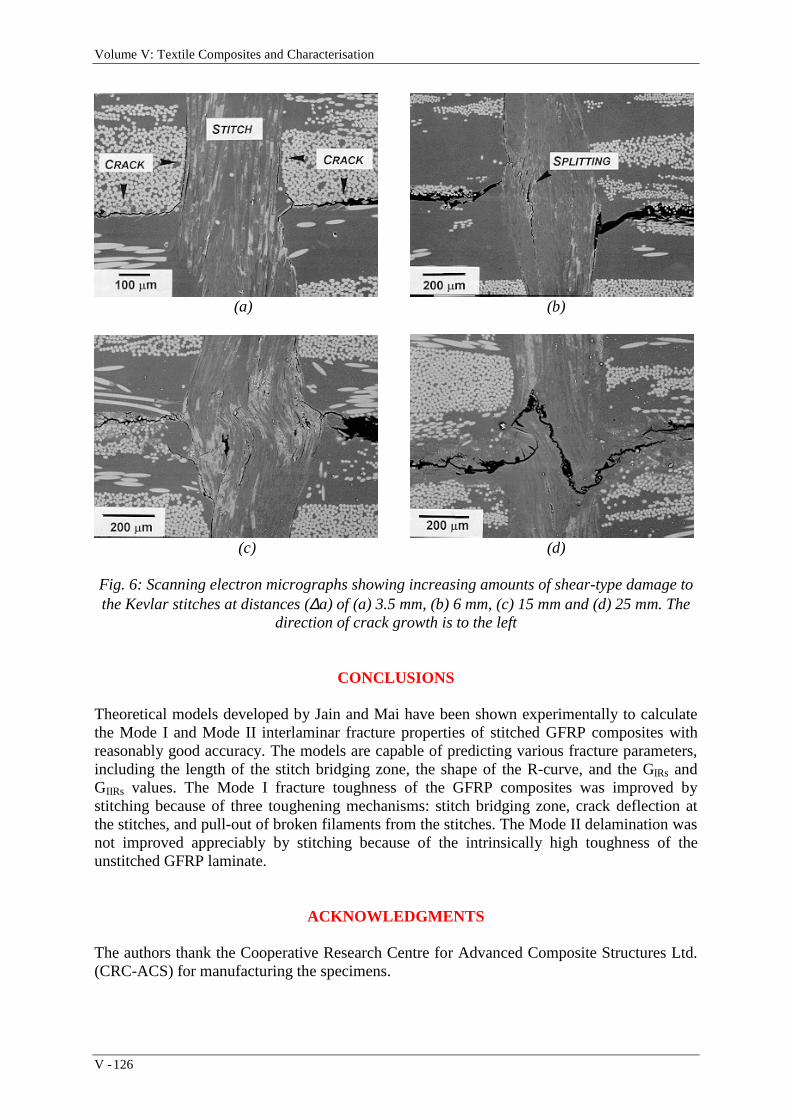
Volume V: Textile Composites and Characterisation
V - 126
(a) (b)
(c) (d)
Fig. 6: Scanning electron micrographs showing increasing amounts of shear-type damage tothe Kevlar stitches at distances (∆a) of (a) 3.5 mm, (b) 6 mm, (c) 15 mm and (d) 25 mm. The
direction of crack growth is to the left
CONCLUSIONS
Theoretical models developed by Jain and Mai have been shown experimentally to calculatethe Mode I and Mode II interlaminar fracture properties of stitched GFRP composites withreasonably good accuracy. The models are capable of predicting various fracture parameters,including the length of the stitch bridging zone, the shape of the R-curve, and the GIRs andGIIRs values. The Mode I fracture toughness of the GFRP composites was improved bystitching because of three toughening mechanisms: stitch bridging zone, crack deflection atthe stitches, and pull-out of broken filaments from the stitches. The Mode II delamination wasnot improved appreciably by stitching because of the intrinsically high toughness of theunstitched GFRP laminate.
ACKNOWLEDGMENTS
The authors thank the Cooperative Research Centre for Advanced Composite Structures Ltd.(CRC-ACS) for manufacturing the specimens.

Proceedings of ICCM–11, Gold Coast, Australia, 14th-18th July 1997
V - 127
REFERENCES
1. Dransfield, K., Baillie, C. and Mai, Y.-W., “Improving the Delamination Resistance ofCFRP by Stitching - A Review”, Composite Science and Technology, Vol. 50, 1994, pp.305-317.
2. Jain, L.K., “Improvement of Interlaminar Properties in Advanced Fibre Compositeswith Through-Thickness Reinforcement”, Cooperative Research Centre for AerospaceStructures Ltd., Report CRC-AS TM 94012, 1994.
3. Jackson, A.C., Barrie, R.E., Shah, B.M. and Shulka, J.G., “Advanced TextileApplications for Primary Aircraft Structures”, Proceedings of Fiber-Tex 1992, October27-29, 1994, NASA Conference Publication 3211, pp. 325-352.
4. Jain, L.K. and Mai, Y.-W., “On the Effect of Stitching on Mode I DelaminationToughness of Laminated Composites”, Composite Science and Technology, Vol. 51,1994, pp. 331-345.
5. Jain, L.K. and Mai, Y.-W., “Determination of Mode II Delamination Toughness ofStitched Laminated Composites”, Composite Science and Technology, Vol. 55, 1995,pp. 241-253.
6. Hashemi, S., Kinloch, A.J. and Williams, J.G., “The Analysis of Interlaminar Fracturein Uniaxial Fibre-Polymer Composites”, Proceedings of the Royal Society of London,Vol. A427, 1990, pp. 173-199.
7. Ogo, Y., “The Effect of Stitching on In-Plane and Interlaminar Properties of CarbonEpoxy Fabric Laminates”, University of Delaware, CCM-87,17, 1987.
8. Sharma, S.K. and Sankar, B.V., “Effect of Stitching on Impact and InterlaminarProperties of Graphite/Epoxy Laminate”, Proceedings of the Ninth American Society forComposites Annual Technical Conference, September 20-22, 1994, pp. 700-708.

Volume V: Textile Composites and Characterisation
V - 128
QUALITY ASSESSMENT DURING STITCHING OFREINFORCING TEXTILES FOR COMPOSITES
K-U. Moll, B.Wulfhorst
Institut für Textiltechnik der RWTH Aachen, University of Technology, Aachen (ITA),Eilfschornsteinstraße 18, D-52062 Aachen, Germany
SUMMARY: During stitching of reinforcing textiles the stitching parameters should be setfor optimal reinforcing results in the manufactured composite. The damages of the sewingthread and the reinforcing textile should be minimized. The architecture of the sewing threadshould be load bearing. For optimal results measurement devices were developed which aresuitable to watch the relevant parameters (presser foot distance, needle thread tension) duringthe stitching process. This measurement devices allow a reproducable setting of the sewingmachine. A test stand for the simulation of the loads of a sewing thread is also presentedwhich is necessary to determine the damages of the sewing thread during the stitchingprocess.
KEYWORDS: stitching of reinforcing textiles, composites, stitching parameters,measurement, machine settings, thread damages
INTRODUCTION
Since a very long time stitching is used for joining textile parts. It is the traditional way tomanufacture clothes from woven or knitted textiles. There are a lot of requirements on thestitching process during the manufacturing of clothes. But the main aim is to manufacturestitching rows which cause no buckling of the textile and possess a high elasticity. Thematerials and the requirements differ completely from the demands which are relevant in thearea of composites. Even at non-reinforcing technical textiles, like airbags, belts and others,the requirements are not to be compared with those in the area of composites.
Stitching reinforcing textiles for composites means that a reinforcing material should beintroduced in the third dimension of the textile structure. For this the sewing thread should beplaced in a load bearing geometry and its damages during the stitching process should be aslow as possible. The reinforcing textile should also not be damaged by the stitching process.No additional crimp should be introduced by the sewing thread.
In the past investigations of stitching reinforcing textiles have been done in America [1, 2, 3],Asia [4, 5, 6], Australia [7, 8] and Europe [9]. Nearly always stitching has been performed byusing conventional sewing machines. The machine settings were fixed in a way like theywould have been fixed for stitching clothes, too. Improvements of the delamination resistance,the peeling resistance and the interlaminar shear strength of the manufactured compositeshave been measured. In this presentation new methods for exactly reproducable settings of thesewing machines and for an instant control of the stitching process are shown.

Proceedings of ICCM–11, Gold Coast, Australia, 14th-18th July 1997
V - 129
AIMS OF STITCHING REINFORCING TEXTILES FOR COMPOSITES
A lot of methods exist for the manufacturing of composites. These methods are mainlydistinguishable by the way of wetting the reinforcing textiles with the matrix material. Nearlyall these methods start with the placing of layers of reinforcing textiles in a mould. In mostcases woven textiles are used. These layers are bonded together by the matrix material. Mostmatrix materials, especially the thermoset matrix materials, are very brittle. Their mechanicalproperties are worse in comparison with the reinforcing materials. Therefore thereinforcement of composite materials in z-direction is poor. As a result the mechanicalproperties in z-direction are not as high as in-plane. In z-direction the matrix material ismainly loaded and therefore the delamination resistance, the interlaminar shear strength andthe peeling resistance are low.
In the past a lot of investigations have been made to manufacture three-dimensionalreinforcing textiles. Examples for this textiles are multi-layered fabrics, knitted structures forthe production of sandwich panels and three-dimensional braids. They all have a three-dimensional geometry and a three-dimensional fibre architecture. Using these textiles for theproduction of single parts or structures leads to high mechanical properties in z-directionwhich are caused by three-dimensional fibre orientation. The in-plane properties are reducedby some fibres of the x-y-plane guided into z-direction. Additionally this textiles must oftenbe joined to flat structures. One prominent example for this are stringer stiffened panels. Thejoining of two different composites structures is often done by adhesives. Therefore thejoining zone is non-reinforced again and its properties in z-direction are low. For the optimaltransmission of loads from one structure to the other the joining zone should contentreinforcements which might be loaded by shear and peeling loads. For manufacturing suchreinforcements, stitching is a suitable process. The reinforcing textiles should be stitchedtogether before the wetting process.
Manufacturing complex shapes from conventional (2-D) reinforcing textiles means that everysingle one has to be draped and deformed. The preforming of several layers in advance isdifficult because the single layers are slipping. Stitching is a good alternative for a fixation ofsingle layers. Additionally by a combination of stitching and folding processes new 3-Dpreforms might be manufactured which are reinforced in discrete regions by the reinforcingsewing thread and the handling properties of the preform are improved by this fixation.
Therefore several investigations are described in literature for an improvement of thesemechanical properties by stitching reinforcing textiles. Some other advantages of stitchedjoining zones might be mentioned. Bonded joining zones which are manufactured by anadhesive are influenced by temperature. Most adhesives are getting soft by increasingtemperature and their brittleness increases rapidly with decreasing temperature. They mayshow their best mechanical properties only in a very narrow range of temperature. Usingstitching as a joining method the properties in the joining zone are changed by the temperaturein the same way as in-plane.
The use of adhesives to join two composite parts means that the separate parts have to beprepared for the bonding process. The quality of a bonded joining area depends on thethickness of the bonding zone. Bonding together two plain parts will not cause any problems,but if the separate parts are curved it is necessary to manufacture these two parts with exactly

Volume V: Textile Composites and Characterisation
V - 130
the same curvature. This is not always possible. During stitching the textiles are fixed togetherbefore the wetting process. They might be bended after the stitching process.
But also the stitching process must be controlled for getting highest performing joining zones.Possible control mechanisms are shown in this presentation.
PARAMETERS TO BE CONTROLLED DURING STITCHINGREINFORCING TEXTILES
Some parameters might be set for the stitching process at the sewing machine. One veryimportant parameter is the geometry of the needle, but the selection of an useful needle forstitching reinforcing textiles can be done in pre-tests. If we are investigating the parameters ofa lock-stitch sewing machine further parameters are the turning speed of the main shaft, thepressure of the presser foot and the tensions of the needle thread and the lower thread.
The range of tensions of the lower thread is very narrow for a non-critical stitching process.The tension of the needle thread influences the position of the knot in z-direction because aequilibrium of forces between both the two thread tensions and the friction with the stitchedtextile is working. As a result of a very low tension of the needle thread the knot will bepositioned at the bottom of the stitched textile. At a very high tension of the needle thread theknot will lay on top of the stitched textile. Despite the fact that the position of the knots forclothing textiles is only an asthetical aspect, it is very important for technical textiles,especially reinforcing textiles. The position of the thread will influence the mechanicalproperties of the whole composite part.
A suitable pressure of the presser foot influences the trouble-free tightening of the knot. Asthe knot is tightened during the upward movement of the needle, it is important to prevent anupward displacement of the top layers. That is done by the presser foot, too. At lock-stitchsewing machines the pressure is also necessary for a reliable transport of the stitched textileswhich is responsible for regular stitch-lengths. Therefore the pressure is also in general animportant parameter for stitching. This pressure is suitable for a compression of thereinforcing textiles during the stitching process.
During the consolidation process additionally a compression of the reinforcing textileshappens. It is possible to calculate the thickness t [mm] of the composite by knowledge of theareal weight of a reinforcing textile ma [g/m²], the aimed fibre volume fraction of thecomposite to be manufactured ϕF, the density of the fibre material ρF [g/cm³] and the numberof layers of the reinforcing textile with help of equation 1.
t = n * ma
ρF * ϕF * 1000 .
(1)
If the reinforcing textiles are compressed during stitching to a thickness which is bigger than tthe reinforcing sewing thread might be crimped during the consolidation process. Thereby itlooses its load bearing architecture (see figure 1). If the pressure is too high the structure ofthe composite will be deeply disturbed in the area of the stitching row (see also figure 1).From this point of view it is not important to control the pressure itself but its effectconcerning the thickness of the stitched textile.

Proceedings of ICCM–11, Gold Coast, Australia, 14th-18th July 1997
V - 131
Fig. 1: Effects of different pressures on composite structures
MEASUREMENT OF THE PARAMETERS DURING THE STITCHING PROCESS
For the measurement of the above described parameters a measurement device has beenadapted at a lock-stitch sewing machine. An incremental optical encoder has been mounted onthe main shaft. Its output signal is a rectangular voltage between 0 and 5 V. It has a resolutionof 480 partitions. That means that at every turning angle of 0.75° of the main shaft ameasurement of the parameters is triggered.
The lock-stitch sewing machine possesses a triple feed system (unison feed). Besides the dropfeed the needle movement describes an elliptical curve. That means that the needle supportsthe feeding action by the feed-synchronized needle motion. Additionally a top feed isinstalled, which consists of two presser feet. One of these feet moves only upwards anddownwards, the other one moves up and down and additionally in the horizontal direction.Therefore this is the third transport mechanism of the stitching machine. The movement of thepresser feet happens in a alternating way. Therefore the textile is always in contact with atleast one presser foot, and is always compressed. One of the presser feet rests on the needleplate, the other one on the drop feed if no textile is stitched. During stitching a textile thedistance between the presser feet and the needle plate respectively the drop feed is thethickness of this textile loaded by the presser feet. The unison transport is shown in figure 2.
Figure 2: Unison feed of the used lock-stitch sewing machine

Volume V: Textile Composites and Characterisation
V - 132
At each presser foot a distance encoder has been fixed. Their signal is set to zero if the presserfeet are resting on the needle plate or the drop feed. With the textile between the presser feetand the drop feed respectively the needle plate the thickness of the compressed textile ismeasured. The measurement of the thickness is triggered by the signals of the incrementaloptical encoder. That means that 480 signals are derived from each presser foot per turn of themain shaft of the sewing machine respectively per stitch cycle. They are on-line stored andanalysed by a computer. They are also set in relation to the turning angle of the main shaft.The sensors possess also a very high resolution. It is possible to measure differences smallerthan one micron.
A RES measurement device is integrated in the run of the needle thread. It is responsible forthe measurement of the needle thread tension. The measurement of the needle thread tensionis also triggered by the incremental optical encoder and the signals are set in relation to theturning angle of the main shaft of the machine.
A schematic view of the measurement systems is shown in figure 3. The systems allow thecontrol of the parameters as well as the reproduction of settings of the machine. Both aspectsallow the assessment of the quality during stitching reinforcing textiles for composites. This isshown in an example in the following paragraph.
Figure 3: Schematic view of the measurement system
If 18 layers of a woven glass fabric with an areal weight of
ma = 163 g/m² (2)
should be used for the production of a composite the fibre volume fraction might be assumedas
ϕF = 50 %. (3)
With this the thickness of the resulting composite can be calculated as
t = 2.3 mm. (4)

Proceedings of ICCM–11, Gold Coast, Australia, 14th-18th July 1997
V - 133
Therefore the pressure of the presser feet should be fixed in a way that the textile layers arecompressed to a thickness of 2.3 mm during the stitching process. The measurement of thethickness during the stitching process has never been done before, but it is a convenientmethod to measure a very important parameter during the process.
The measurement of the tension of the needle thread is also important for the qualityassessment during stitching reinforcing textiles. It might be a parameter which is importantfor later calculations of the mechanical properties of the composites. Both measurements areshown in figure 4.
0
1
2
3
4
5
6
7
8
0 100 200 300 400 500 600 700
main shaft angle [°]
pres
ser
feet
dis
tanc
es fr
om n
eedl
e pl
ate
[mm
]
-20
0
20
40
60
80
100
120
140
160
180
need
le th
read
tens
ion
[cN
]
presser foot 1
presser foot 2
needle thread tension
Fig. 4: Measurement of presser feet distances from the needle plateand needle thread tensions
The needle thread tension is also responsible for thread damages. For this reason themeasurement of the tension is important.
MEASUREMENT OF THREAD DAMAGES
Up to now it was not possible to evaluate exactly the thread damages occuring during thestitching process. As in stitching clothing textiles typically polyester threads are used whichare not very brittle this topic is not as relevant there as in stitching reinforcing textiles. Usinga carbon or glass thread during stitching reinforcing textiles can cause thread damagesbecause of their high brittleness and the small bending curvatures combined with the abrasive-loads which are working on the threads during the stitching process.
It is not possible to dissect the thread out of the stitched textile and do some tensile tests withit. During the preparation of this tests additional damages are caused. It is not possible todetermine the amount of this damages.

Volume V: Textile Composites and Characterisation
V - 134
The needle thread carries the highest loads at a lock-stitch sewing machine. The thread passesthe needle hole many times before it is brought into the seam. The aim was to design a teststand at which the loads are simulated.
At a sewing machine with a drop feed the needle thread is teared off the bobbin during thefeeding movement. The drawing off is induced by the movement of the stitched textile. Thishappens when the needle is above the needle plate. At a sewing machine with an unison feedthe drawing off also happens during the feeding of the textile, but then the needle actuallypenetrates the textile. No relative movements between the textile and the thread occur,because the needle and the thread are moving in the same direction with the same velocity.The feeding happens during a defined turning angle of the sewing machine. First it isimportant to know this angle during which the feeding happens.
To copy all the brakes and all the machine parts which are in friction with the thread andbending it would be very complex. Therefore a drawing off system was adapted to the lock-stitch sewing machine.
The thread passes all machine parts like in the usual stitching process. The process is donewithout a lower thread. That means that the small friction between the needle thread and thelower thread is not considered. The needle and the needle thread are not passing a textilewhich is fed by the machine but the needle thread is guided to a bobbin. The bobbin turnswith the same velocity and about the same length like the textile would be fed by the unisonfeed. That means that the drawing off of the bobbin and relative movements between theneedle thread and the machine parts are completely the same like during stitching a textile.That moment at which the drawing off starts is given by a signal of the incremental opticalencoder. A computer takes this signal as a triggering and outputs a signal to a stepping motor.This stepping motor is connected with a bobbin which takes the thread on. The system isshown schematic in figure 5.
Figure 5: Take up mechanism for the sewing threads loaded during the sewing process

Proceedings of ICCM–11, Gold Coast, Australia, 14th-18th July 1997
V - 135
With the thread which is wound on the bobbin tensional tests can be performed. Themeasured tensile strength is a sign for the filament damages of the sewing thread. With thisresults the stitching parameters and especially the needle thread tension might be optimized toperform a stitching process with as low as possible filament damages of the sewing thread.This investigations are necessary to make use of the full performance of the threads.
The investigations have been done with a glass filament thread with a total fineness of138 tex. In these tests the sewing machine ran with a speed of 180 tpm. Higher speeds arepossible. The measurement of the needle thread tension is similar to that shown in figure 4.The statistical results of the tensile tests are given in table 1.
Table 1: Tensile strengths of loaded and non-loaded glass filament sewing thread, sewingmachine speed for loading the thread: 180 tpm
thread non-loaded thread loaded duringstitching process
tensile strength [N] 60,72 47,21
standard deviation [N] 4,75 5,06
The results documented in table 1 show that a damage of the glass filament sewing threadoccurs. Even with the very low turning speed of 180 tpm the damage occurs. With higherturning speeds and other stitch lengths more damages will occur.
POSITIVE NEEDLE THREAD FEED
The used sewing threads are typically manufactured from reinforcing filaments. They arewound on bigger bobbins than typical sewing threads, e.g. polyester sewing threads. Theyarns are very slippery. Therefore their single windings are falling down if the bobbin isplaced vertically for the sewing process. Filament damages and a wide range of needle threadtensions are the results. Covering the bobbin with a cloth prevents the falling down of thesingle windings, but the neddle thread tension changes thereby in a very wide rangedepending on the actual position of the thread. Therefore a mechanism was developed inwhich the bobbin is placed horizontally on the shaft of a stepping motor. During eachstitching cycle the stepping motor turns as far as needle thread is necessary for a perfectperformance of the stitch. Thereby the tension of the needle thread is always the same duringall stitching cycles.
The positive needle thread feed is a similar system to the mechanism which draws on theneedle thread as described before. Its development is a result of the investigations which aredone with the measurement systems and reduces thread damages. Therefore it belongs to thearea of quality assessment methods during stitching.
CONCLUSIONS
The presented measurement systems are a new and necessary way to improve the quality ofcomposites manufactured from stitched reinforcing textiles. They allow to set the sewing

Volume V: Textile Composites and Characterisation
V - 136
machine in an optimal way to produce composites with load bearing structures of the sewingthreads. They also allow to reproduce the settings of a machine and to show correlationsbetween the stitching parameters and the mechanical properties of the composites.
With the measurement of thread damages a new method has been developed which gives thepossibility to examine the properties of sewing threads after the stitching process. This has notbeen necessary in the area of clothing textiles because of the low brittleness of the sewingthreads. Using now glass and carbon threads for the stitching process makes the newinformation useful. Especially for the calculations or simulations of the mechanical propertiesof stitched joining zones in a composite it is necessary to assume the mechanical properties ofthe sewing thread.
This shows that the typical measurement systems of textile technology might be useful fornew results in stitching reinforcing textiles for composites.
The paper gives an overview over the methods used for the improvement of the properties ofcomposites manufactured of stitched reinforcing textiles. First tests with the systems havebeen done. The complete results will be shown during the oral presentation of the paper.
REFERENCES
1. Mignery, L.A., Tan, L.M., Sun, C.T.: The use of stitching to suppress delamination inlaminated composites. Johnson, W.S. (ed.): Delamonation and Debonding of Materials,ASTM STP 876, Philadelphia/USA: ASTM, 1985, 371-385.
2. Sawyer, J.W.: Effects of stitching on the strength of bonded composite single lap joints.AIAA Journal 23 (1985), 1744-1748.
3. Portanova, M.A., Poe, C.C., Whitcomb, J.D.: Open hole and post-impact compressionfatigue of stitched and unstitched carbon/epoxy composites. NASA TM 102676, 1990
4. Du, X., Xue, F., Gu, Z.: Experimental study of the effect of stitching on strength of acomposite laminate. International Symposium on Composite Materials and Structures(Beijing 10-13/06/1986). Proc., Lancaster/PA/USA: Technomic, 1986, 912-918
5. Liu, D., Kim, Y.G., Hong, S.: Stitching as joint in woven composite plate. ASM/ED:3rd Annual ASM/ESD Adv. Comp. Conf. (Detroit/MI/USA 15-17/09/1987), 343-347
6. Matsuhisha, Y, Hiramatsu, T., Nishimara, A: Z-directional laminate reinforcingmaterial. High performance Torayca carbon stitching thread. SAMPE: 33rd Int. SAMPESymposium and Exhibition (Anaheim 07-10/03/1988)
7. Herszberg, I., Bannister, M.K.: Tensile properties of thin stitched carbon/epoxycomposites. Cooperative Research Centre for Aerospace Structures: 5th AustralianAerospace Conference (09/1989), Proc. ACN 059048770, Victoria: CRC-AS Ltd., 1993

Proceedings of ICCM–11, Gold Coast, Australia, 14th-18th July 1997
V - 137
8. Herszberg, I., Bannister, M.K.: Compression and compression-after-impact propertiesof thin stitched carbon/epoxy composites. Cooperative Research Centre for AerospaceStructures: 5th Australian Aerospace Conference (09/1989), Proc. ACN 059048770,Victoria: CRC-AS Ltd., 1993
9. Mc Illhagger, R., Hill, B.J., McLaughlin, P.: Flexural properties of sewn carbon-fibrecomposites. Journal of the Textile Institute 83 (1992), 614-620

Volume V: Textile Composites and Characterisation
V - 138
OPEN HOLE FATIGUE OF STITCHED ANDUNSTITCHED CARBON/EPOXY LAMINATES
I. Herszberg1, A. Loh1, M.K. Bannister2, H.G.S.J.Thuis3
1 The Sir Lawrence Wackett Centre for Aerospace Design Technology, Department ofAerospace Engineering, Royal Melbourne Institute of Technology, P.O. Box 2476V,
Melbourne, VIC, 3001, Australia.2 Cooperative Research Centre for Advanced Composite Structures (CRC-ACS), 506 Lorimer
Street, Fishermens Bend, VIC 3207, Australia3 Advanced Composites Structures Department, National Aerospace Laboratory, P.O.Box
153, 8300 AD Emmeloord, The Netherlands.
SUMMARY: Tension-compression open hole fatigue tests were conducted to determine theeffect of stitching on the delamination damage progression and fatigue life of notched carbon/epoxy laminates. The specimens were made from uniweave fabric stitched with Kevlar orDyneema thread at various stitch densities and subsequently impregnated by resintransfermoulding. The specimens had a 6 mm hole drilled at their centre and were supported byanti-buckling plates with a 25 x 62 mm window surrounding the hole. They were cycled, up to amaximum of 100,000 cycles, between the tension and compression loads required to achieve,far-field strains of ± 0.35%. It was concluded that the low density Kevlar stitched specimenshad better fatigue resistance than the unstitched specimens and the low density stitchedDyneema specimens had even better fatigue resistance. On the other hand, the fatigue resistanceof the high density stitched Kevlar specimens was inferior to that of the unstitched specimens.
KEYWORDS: open hole fatigue, stitched composites, carbon/epoxy composites,delamination progression
INTRODUCTION
The manufacture of composites from stitched woven carbon cloth and impregnated by a liquidmoulding techniques, such as Resin Transfer Moulding (RTM), has the potential to producelow cost high quality components with improved resistance to delamination. The increase indamage tolerance and resistance of such stitched composite depends on many parameters suchas laminate thickness and stitching yarn properties and density. A major motivation forstitching preforms is the potential to greatly reduce the cost of component manufacture byreducing RTM tooling costs and to reduce the number of components in the structure, hencereducing the assembly costs. Consequently, stitched preforms may be used solely formanufacturing considerations, even for configurations which do not benefit from increaseddamage tolerance. To facilitate the use of such materials in aircraft production, it is essentialthat their mechanical properties are characterised.
To this end, a collaborative program between The Cooperative Research Centre for Advancedcomposite Structures (CRC-ACS), and National Aerospace Laboratory, The Netherlands(NLR) was undertaken to explore the mechanical properties of carbon/epoxy laminatesstitched with Kevlar or Dyneema. Preliminary results of the static properties have been

Proceedings of ICCM–11, Gold Coast, Australia, 14th-18th July 1997
V - 139
reported by Thuis and Bron [1]. This follows previous studies at the CRC-ACS on the tension[2], compression [3] and compression-after-impact [3-5] of Kevlar stitched carbon/epoxylaminates. An extensive review of the effect of stitching on the in-plane mechanical propertiesof fibre reinforced plastics has been conducted by Mouritz et. al. [6] where they summarisethe limited amount of work which has been reported to date on the fatigue properties ofstitched composites.
Most reported fatigue studies of stitched composites involved compression-compressionloading. Lubowinsky and Poe [7] found that stitching improved fatigue life, despite the localdamage and fibre distortion caused by stitching. On the other hand, others (eg Furrow et al.[8]) found that stitching did not effect the fatigue performance. In particular Portanova andPoe [9] found open hole fatigue performance was unaffected by stitching. Shah Khan andMouritz [10] have studied the fatigue performance of stitched and unstitched GFRP underzero-to-tension cycling and they report a substantial reduction in fatigue life due to stitching.This was attributed, in part to damage caused by stitching. Xiao and Bathias [11] haveconducted tension fatigue tests on unstitched notched (open hole) and unnotched wovenglass/epoxy laminates and they have reported that the notched and un-notched laminates hadthe same ratios of fatigue strength to ultimate tensile strength.
An investigation has been undertaken to determine the effect of stitching on the open-holefatigue performance of carbon/epoxy laminates subject to tension-compression cyclic loading.In particular the effect of stitching on the progression of delamination has been studied. Thispaper presents preliminary results of this investigation.
SPECIMENS MANUFACTURE AND DEFINITION
The test specimens used for the present study were machined from panels produced byimpregnating stitched and unstitched woven carbon preforms with epoxy resin, using theResin Transfer Moulding (RTM) process.
The preforms were manufactured from 17 layers of Ciba Composites GU-230-E01 uniweavefabric with a lay-up of [45, -45 ,45 , 0, -45, 90, 45, -45, 0, -45, 45, 90, -45, 0 , 45, -45, 45].The warp tows were 3K T300 (or equivalent) and they formed 90% of the fibres. The weftincluded special yarns to facilitate resin infusion by RTM. The fabric had a fine surface sprayof partially cured epoxy which facilitated preforming.
Some of the preforms were stitched, respectively, with a twisted 40 tex (2×20) Kevlar threador a twisted 16.5 tex (3 x 5.5) Dyneema thread. A modified lock-stitch was used, where theknot was adjusted to lie within the top fabric layer. The stitch rows were oriented at 0°, with astitch pitch of 3.6 mm and spacing of 7.0 mm to produce a stitch density of four stitches percm2. A high density stitching of ten stitches per cm2 was achieved by spacing the stitch rowsat 3.5 mm and reducing the stitch pitch to 2.9 mm. Further details of the stitch geometry arepresented by Leong et al. [5]
The preforms were impregnated, using the closed mould RTM process, with Ciba CompositesLY 5052 epoxy resin, in conjunction with HY 5052. They were cured for four hours at 55°C.The nominal panel thickness was 3.5 mm, giving a fibre volume fraction (carbon only) of60%. In fact, the specimens had an average thickness of 3.66 mm (standard deviation 1.6%)with a corresponding fibre volume fraction of 57%.

Volume V: Textile Composites and Characterisation
V - 140
The specimens, of dimension 50 x 250 mm and described in Fig. 2, were cut from the panelsso that the stitch rows were parallel to their loading direction. A 6.0 mm hole was drilled intheir centre and left in the as-drilled condition. Steel end tabs and aluminium clip-gauge tabs,as shown in Figs. 1 and 2, were bonded to the specimens using Redux 420A/B adhesive andcured for 4 hours at 50°C. The aluminium clip-gauge tabs, of dimension 5 x 10 mm werelocated so that their centreline was 10 mm to one side of the centre of the hole and the gapbetween them was 14 mm to accommodate the clip-gauge extensometer (MTS model632.03C-02).
Clip gauge
Anti-bucklingguides
End tabs
Specimen
Bolts
Hole
Specimen
Grips
Clip gauge tabs
Fig. 1: Schematic of fatigue test showing anti-buckling guides, clip gauge and clip gauge tabs
Diam. 6 mm
50 mm
250 mm
60 mm
Nominalthick. 3.5 mm
Fig. 2: Fatigue specimens and steel tab lay-out
TEST PROCEDURE
Four specimens were tested, of each of the four stitch configurations, which were: unstitched,low density Kevlar stitching, high density Kevlar stitching and low density Dyneemastitching. Specimen details and their uncycled static ultimate tensile (UTS) and compressive(UCS) are summarised in Table 1. Each of the specimen was allocated a four digitidentification number. The first two digits define the specimen type and the following twodigits allowed discrimination among individual specimens. For example, specimens 1217 and1220 are two of the Kevlar low density stitched specimens.

Proceedings of ICCM–11, Gold Coast, Australia, 14th-18th July 1997
V - 141
Table 1: Specimen details and static strengthsSpecimen Stitching No. Cycled Ultimate Strength (MPa)
Type Type Density /cm2 Tension Compression11 unstitched 4 335 22312 Kevlar 40 tex 4 4 323 22613 Kevlar 40 tex 10 4 321 n/a15 Dyneema 16.5 tex 4 4 326 243
Each specimen was loaded, at room temperature, in tension/compression fatigue at afrequency of 5 Hz under load control, between the tension and compression loads required toachieve, respectively, far-field strains of +/- 0.35% in the uncycled specimen. During the testthese strains increased considerably. Those specimens which did not fail sooner, weresubjected to 100,000 cycles, after which their residual compressive strength was measured. Atthe beginning of the test and at 10,000 cycle intervals the specimens were subject to visualinspection, an ultrasonic inspection and a strain survey. During cycling the specimen wasconstrained from buckling by antibuckling guides. Details of the test procedure andequipment are presented below.
Fatigue Cycling
The tests were conducted at room temperature (18°C to 24°C) using a 100 kN MTS servo-hydraulic test machine fitted with hydraulic grips and controlled by a MTS Teststar controland data acquisition system, which was also used for data acquisition.
The specimens were cycled, under load control, with constant amplitude at a frequency of5Hz to a maximum of 100,000 cycles. The maximum and minimum loads were chosen tocorrespond, respectively to a far-field strain of +/- 0.35% in the uncycled specimen. Theywere typically 20 kN and 19 kN respectively. Such high strain levels were chosen so thatsignificant fatigue damage would occur, in order to assess the effects of stitching. This levelwas in fact appropriate as evidenced by the fact that five of the sixteen specimens tested failedat fewer than 100,000 cycles. The tests were interrupted at 10,000 cycle intervals in order toconduct strain surveys and allow inspection of the specimen.
In order to determine the load limits, one specimen for each type had a strain gauge located 25mm above the centre of the hole which measured the far-field strain. This specimen wasloaded in tension, under load control, at a rate of 125 N/sec until a strain of 0.35% wasreached, at which time the test was terminated. The corresponding load was used as themaximum load for subsequent cycling. The test was repeated in compression in order todetermine the minimum load. The same fatigue profile was used for all specimens of onetype.
Anti-Buckling Guides
The specimens, prior to testing, were fitted with an anti-buckling guide so as to leave anunsupported region of 60 mm x 25 mm around the hole. The configuration of these guides isshown in Fig. 1. To accommodate the compressive strain, there was a 1 mm gap between thetop and bottom of the guides and the respective end-tabs. The specimen was clamped betweenthe specimen with the aid of bolts which were adjusted until finger-tight. At each 1,000 cycleinspection interval the guides were removed and refitted before subsequent testing.
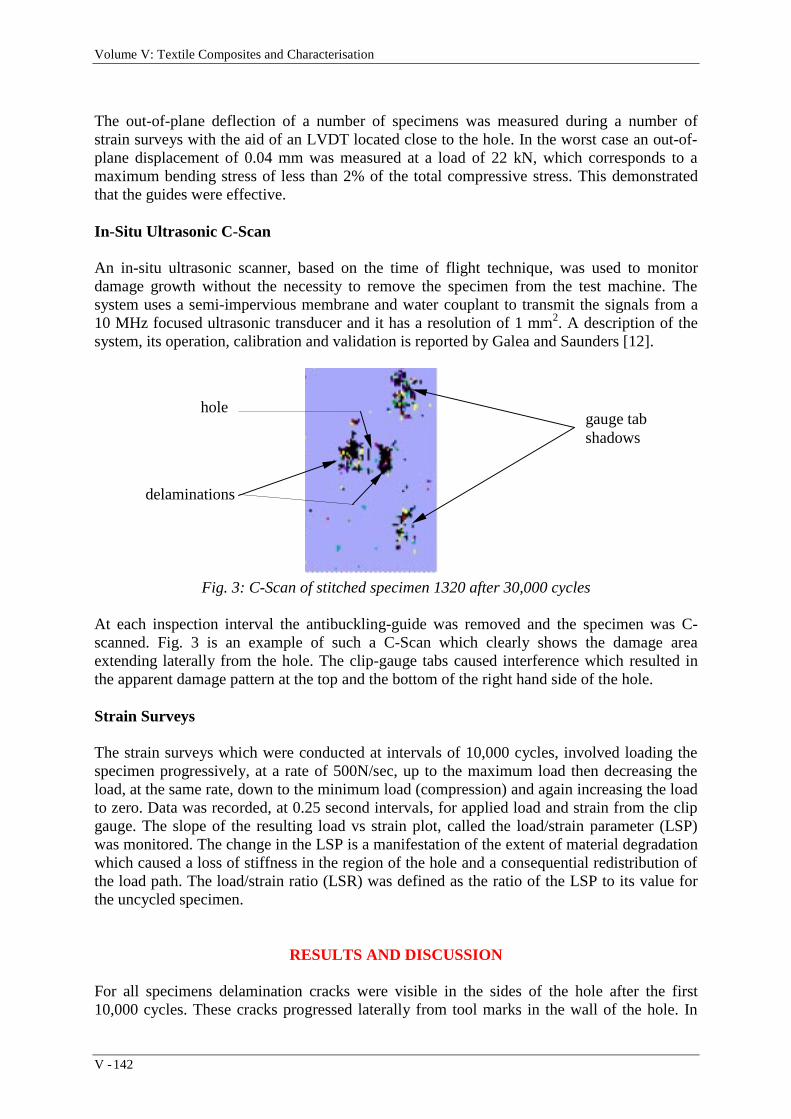
Volume V: Textile Composites and Characterisation
V - 142
The out-of-plane deflection of a number of specimens was measured during a number ofstrain surveys with the aid of an LVDT located close to the hole. In the worst case an out-of-plane displacement of 0.04 mm was measured at a load of 22 kN, which corresponds to amaximum bending stress of less than 2% of the total compressive stress. This demonstratedthat the guides were effective.
In-Situ Ultrasonic C-Scan
An in-situ ultrasonic scanner, based on the time of flight technique, was used to monitordamage growth without the necessity to remove the specimen from the test machine. Thesystem uses a semi-impervious membrane and water couplant to transmit the signals from a10 MHz focused ultrasonic transducer and it has a resolution of 1 mm2. A description of thesystem, its operation, calibration and validation is reported by Galea and Saunders [12].
Fig. 3: C-Scan of stitched specimen 1320 after 30,000 cycles
At each inspection interval the antibuckling-guide was removed and the specimen was C-scanned. Fig. 3 is an example of such a C-Scan which clearly shows the damage areaextending laterally from the hole. The clip-gauge tabs caused interference which resulted inthe apparent damage pattern at the top and the bottom of the right hand side of the hole.
Strain Surveys
The strain surveys which were conducted at intervals of 10,000 cycles, involved loading thespecimen progressively, at a rate of 500N/sec, up to the maximum load then decreasing theload, at the same rate, down to the minimum load (compression) and again increasing the loadto zero. Data was recorded, at 0.25 second intervals, for applied load and strain from the clipgauge. The slope of the resulting load vs strain plot, called the load/strain parameter (LSP)was monitored. The change in the LSP is a manifestation of the extent of material degradationwhich caused a loss of stiffness in the region of the hole and a consequential redistribution ofthe load path. The load/strain ratio (LSR) was defined as the ratio of the LSP to its value forthe uncycled specimen.
RESULTS AND DISCUSSION
For all specimens delamination cracks were visible in the sides of the hole after the first10,000 cycles. These cracks progressed laterally from tool marks in the wall of the hole. In
gauge tabshadows
delaminations
hole

Proceedings of ICCM–11, Gold Coast, Australia, 14th-18th July 1997
V - 143
most cases the initial rapid growth of the delamination reached a plateau and subsequentlyresumed its growth (eg Fig.4a). The load/strain ratio followed a similar, but inverse,progression (eg Fig.4b). A total of five of the 16 specimens tested failed at fewer than 100,000cycles. As is to be expected from fatigue test there was considerable scatter in the data.However, there are indications that the low density Kevlar stitched specimens had betterfatigue resistance than the unstitched specimens and the low density stitched Dyneemaspecimens had even better fatigue resistance. On the other hand, the fatigue resistance of thehigh density stitched Kevlar specimens was inferior to that of the unstitched specimens.
0
5
10
15
20
25
0 25 50 75 100
Cycles (x10³)
Tot
al D
elam
inat
ion
Siz
e (m
m)
1117 1120
1121 1122
Fig. 4a: Delamination progression unstitched specimens
0.5
0.6
0.7
0.8
0.9
1.0
1.1
0 25 50 75 100
Cycles (x10³)
Load
/Str
ain
Rat
io
1117 1120
1121 1122
Fig. 4b: Progression of load/strain ratio unstitched specimens
Damage Progression
Various forms of damage were manifest as the cycling progressed these included:delamination, transverse cracks, matrix and fibre pulverisation and stitch debonding. Therewere indications that delamination and transverse crack growth were arrested for a while atthe stitch rows, however, they were not conclusive.
Delamination damage growth was monitored via C-Scan and the progression of changes inthe load strain ratio gave an indication of general damage accumulation and growth. Figs. 4a
to 7a describe the behaviour of the delamination growth where, typically, the initial rapidgrowth reached a plateau and subsequently resumed its growth. Figs. 4b to 7b describe theprogression of the LSR, which is a manifestation of the extent of material degradation. It,typically, followed a similar, but inverse, progression to the delamination growth.

Volume V: Textile Composites and Characterisation
V - 144
0
5
10
15
20
25
0 25 50 75 100
Cycles (x10³)
Tot
al D
elam
inat
ion
Siz
e (m
m)
1217 1220
1221 1222
0.5
0.6
0.7
0.8
0.9
1.0
1.1
0 25 50 75 100
Cycles (x10³)
Load
/Str
ain
Rat
io
1217 1220
1221 1222
Fig. 5a: Delamination progression Fig. 5b: Progression of load/strain ratioKevlar low density stitched specimens Kevlar low density stitched specimens
0
5
10
15
20
25
0 25 50 75 100Cycles (x10³)
Tot
al D
elam
inat
ion
Siz
e (m
m)
1317 1320
1321 1322
0.5
0.6
0.7
0.8
0.9
1.0
1.1
0 25 50 75 100Cycles (x10³)
Load
/Str
ain
Rat
io1317 1320
1321 1322
Fig. 6a: Delamination progression Fig. 6b: Progression of load/strain ratioKevlar high density stitched specimens Kevlar low high density stitched specimens
0
5
10
15
20
25
0 25 50 75 100
Cycles (x10³)
Tot
al D
elam
inat
ion
Siz
e (m
m)
1517 1521
1522 1520
0.5
0.6
0.7
0.8
0.9
1.0
1.1
0 25 50 75 100
Cycles (x10³)
Load
/Str
ain
Rat
io
1517 1520
1521 1522
Fig. 7a: Delamination progression Fig. 7b: Progression of load/strain ratioDyneema low density stitched specimens Dyneema low density stitched specimens
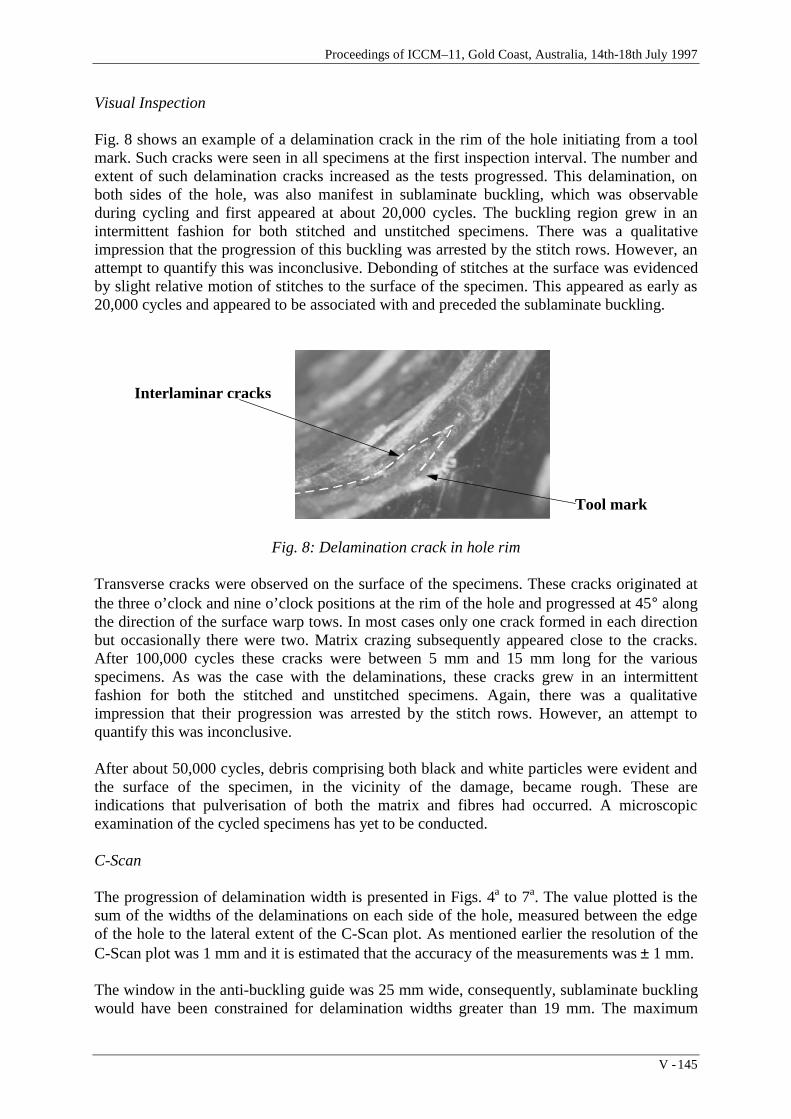
Proceedings of ICCM–11, Gold Coast, Australia, 14th-18th July 1997
V - 145
Visual Inspection
Fig. 8 shows an example of a delamination crack in the rim of the hole initiating from a toolmark. Such cracks were seen in all specimens at the first inspection interval. The number andextent of such delamination cracks increased as the tests progressed. This delamination, onboth sides of the hole, was also manifest in sublaminate buckling, which was observableduring cycling and first appeared at about 20,000 cycles. The buckling region grew in anintermittent fashion for both stitched and unstitched specimens. There was a qualitativeimpression that the progression of this buckling was arrested by the stitch rows. However, anattempt to quantify this was inconclusive. Debonding of stitches at the surface was evidencedby slight relative motion of stitches to the surface of the specimen. This appeared as early as20,000 cycles and appeared to be associated with and preceded the sublaminate buckling.
In terl aminar cracks
Tool mark
Fig. 8: Delamination crack in hole rim
Transverse cracks were observed on the surface of the specimens. These cracks originated atthe three o’clock and nine o’clock positions at the rim of the hole and progressed at 45° alongthe direction of the surface warp tows. In most cases only one crack formed in each directionbut occasionally there were two. Matrix crazing subsequently appeared close to the cracks.After 100,000 cycles these cracks were between 5 mm and 15 mm long for the variousspecimens. As was the case with the delaminations, these cracks grew in an intermittentfashion for both the stitched and unstitched specimens. Again, there was a qualitativeimpression that their progression was arrested by the stitch rows. However, an attempt toquantify this was inconclusive.
After about 50,000 cycles, debris comprising both black and white particles were evident andthe surface of the specimen, in the vicinity of the damage, became rough. These areindications that pulverisation of both the matrix and fibres had occurred. A microscopicexamination of the cycled specimens has yet to be conducted.
C-Scan
The progression of delamination width is presented in Figs. 4a to 7a. The value plotted is thesum of the widths of the delaminations on each side of the hole, measured between the edgeof the hole to the lateral extent of the C-Scan plot. As mentioned earlier the resolution of theC-Scan plot was 1 mm and it is estimated that the accuracy of the measurements was ± 1 mm.
The window in the anti-buckling guide was 25 mm wide, consequently, sublaminate bucklingwould have been constrained for delamination widths greater than 19 mm. The maximum

Volume V: Textile Composites and Characterisation
V - 146
width for specimens which survived 100,000 cycles was 17 mm for specimens 1217 and1221. The specimens that failed did so within 10,000 cycles after the delamination widthreached the window. This indicates that sublaminate buckling was not the sole failuremechanism.
The delamination width grew in an intermittent fashion for both the stitched and unstitchedspecimens. An attempt to correlate the position of the plateaux with the stitch line positionswas inconclusive.
Load/Strain Ratio
The progression of the load/strain ratio (LSR) for each of the specimens is presented in Figs.4b to 7b. The LSP is not only a measure of the stiffness of the material in the region of the clipgauge, but it also a measure of load redistribution due to damage and consequent changes inlocal stiffness in other regions of the material. In particular a local reduction in stiffness in theregion of the hole which does not extend to the location of the clip gauge will neverthelesscause a reduction in the LSP and consequently the LSR. Delamination damage, particularlywhen sublaminate buckling occurs, will cause such a reduction in stiffness. However, otherforms of damage, such as microcracking, will also cause a stiffness reduction. The fact thatthe LSR follows the same (inverse) progression as that of the delamination damage does notnecessarily mean that delamination was the dominant damage mode, since the other forms ofdamage may have progressed at a similar rate. The second change in slope of the LSR curvemay be due to the delamination, on the clip-gauge side, passing the clip-gauge position. Acomparison of the number of cycles at which these two events occurred showed goodcorrelation. This is not always evident from Figs. 4a to 7a, because they record the total of thedelamination widths on each side, which were not always equal. A more extensive discussionof these issues will be presented elsewhere.
Table 2: Fatigue life or damage at 100,000 cyclesSpecimen Stitching Load Range (kN) Fatigue Life At 100,000 cycles
Type Density Tens. Comp. (cycles) Delaminationwidth (mm)
Load/StrainRatio
1117 unstitched 21.8 20.3 100,000+* 14 0.741120 100,000+ 8 0.801121 96,260 - -1122 74,354 - -1217 Kevlar Low 20.8 19.7 100,000+* 17 0.651220 100,000+* 9 0.721221 100,000+ 17 0.781222 100,000+ 9 0.781317 Kevlar High 21.8 20.2 53,236 - -1320 92,500 - -1321 74,404 - -1322 100,000+ 10 0.721517 Dyneema Low 20.2 18.9 100,000+ 9 0.921520 100,000+ 16 0.731521 100,000+ 13 0.811522 100,000+ 6 0.88
*fatigue life < 110,000 cycles estimated on the basis of damage progression

Proceedings of ICCM–11, Gold Coast, Australia, 14th-18th July 1997
V - 147
Effects of Stitching
As may be seen from the data presented in Table 2, the fatigue performance of the highdensity Kevlar stitched specimens was inferior to that of the unstitched specimens. None ofthe low density Kevlar and Dyneema stitched specimens failed below 100,000 cyclesindicating a superior fatigue performance to that of unstitched specimens. However, this mayhave been influenced by the slightly lower (about 5%, see Table 2) cycling load range. Asdescribed earlier, the load range was chosen, for each specimen type, to give a strain range of± 0.35% for the uncycled specimens. In order to facilitate the comparison of fatigueperformance, it would perhaps have been preferable to use the same load range for allspecimen types.
A comparison of the damage progression for the low density Kevlar and Dyneema stitchedspecimens (Figs. 5 and 7) shows that the Dyneema stitched specimens have superior fatigueperformance. This is particularly evident from a comparison of the progression of their LSRs(Figs. 5b and 7b). This may be related to the higher compressive strength measured for theDyneema stitched specimens compared to the unstitched and low density Kevlar stitchedspecimens (Table 1). Unfortunately the compressive test results for the high density stitchedspecimens is unavailable for comparison. The improved compressive and fatigue performancemay be due to the smaller diameter (~20%) of the Dyneema thread which would lead to lessfibre distortion due to stitching.
From visual observations there were indications that the stitch rows provided some resistanceto the growth of transverse cracks and sublaminate buckling, however an attempt to quantifythis effect was inconclusive. No correlation was found between the positions of stitches andthe plateaux in the progression of delamination damage. This may be because the length scaleof the damage is such as to preclude steady-state crack bridging.
From the above results, the indications are, that the through-thickness reinforcement effect ofstitching does enhance fatigue performance to some extent. On the other hand, the fibremisalignment caused by stitching degrades compression and compressive fatigueperformance. It would appear that there is an optimum combination of stitch density and fibrediameter which will maximise the fatigue performance.
CONCLUSIONS
Tension-compression open hole fatigue tests were conducted on carbon/ epoxy laminatesmade from uniweave fabric stitched with Kevlar or Dyneema thread at various stitchdensities. Four specimens from each type were cycled up to a maximum of 100,000 cycles.Based on the limited number of specimens tested, the following conclusions may be made onthe effect of stitching on their open hole fatigue performance.
• The fatigue performance of the high density Kevlar stitched specimens was inferior tothat of the unstitched specimens.
• The fatigue performance of the low density Kevlar stitched specimens was inferior to thatof the low density Dyneema stitched specimens. This is possibly because of the smallerdiameter of the Dyneema thread.

Volume V: Textile Composites and Characterisation
V - 148
• There are strong indications that the fatigue performance of both, the low density Kevlarand Dyneema stitched specimens, was superior to that of the unstitched specimens.
• For all specimens there was evidence of delamination after the first 10,000 cycles.
• There was no evidence that stitching arrested the progression of delamination damage.
• There were indications, based on visual examination, that the stitch rows temporarilyarrested the propagation of transverse cracks and sublaminate buckling. However,attempts to quantify this were inconclusive.
ACKNOWLEDGMENTS
The authors gratefully acknowledge the assistance of Mr Paul Falzon of the CRC-ACS and DrPaul Callus of RMIT, who contributed to the testing and the analysis of the results.
REFERENCES
1. Thuis, H.G.S.J. and Bron, E. “The Effects of Stitching Density and Laminate Lay-up on theMechanical Properties of Stitched Carbon Fabrics”, National Luct-en Ruimtevaart-laboratorium, Report NLR CR 96126L, 1996
2. Herszberg, I. and Bannister. M. K. “Compression and Compression-after-Impact Properties ofStitched Carbon/Epoxy Composites”, Cooperative Research Centre for Aerospace StructuresCP-93001, 1993.
3. Herszberg, I., and Bannister M.K., “Tensile Properties of Thin Stitched Carbon/EpoxyComposites”, Proceedings, 5th Aeronautical Conference, Melbourne. September 1993.
4. Leong, K.H., Herszberg, I., and Bannister, M.K., “Impact Damage Resistance and Toleranceof Stitched Carbon Epoxy Laminates”, Proceedings, 2nd Pacific International Conference onAerospace Science & Technology, Melbourne, March 1995.
5. Leong, K.H., Herszberg, I., and Bannister, M.K., “An Investigation of Fracture Mechanismsof Carbon Epoxy Laminates Subjected to Impact and Compression-After-Impact Loading”, IJ Crash, Vol 1 No 3, 1996, pp 285-293.
6. Mouritz, A.P, Leong, K.H, Herszberg, I. “A Review of The Effects of Stitching on The In-Plane Mechanical Properties Of Fibre-Reinforced Polymer Composites”, in-press Composites.
7. Lubeowinski, S.J. and Poe, C.C. “Fatigue Characterization of Stitched Graphite/EpoxyComposites”, Proceedings. Fibre-Tex 1987, NASA Conf. Pub. 3001, 1987, pp 253-271.
8. Furrows, K.W., Loos, A.C. and Can, R.J. “Environmental Effects on Stitched RTM textileComposites” J Rein Plast Comp, Vol 15, 1996, pp 378-419.
9. Portanova, M.A. Poe, C.C. and Whitcomb, J.D. “Open hole and Post-Impact CompressiveFatigue of Stitched and Unstitched Carbon-Epoxy Composites” Composite Materials: Testingand Design (Tenth Volume), ASTM STP 1120, Glenn, G.C. ed, American Society for Testingand Materials, Philadelphia, 1992 pp 37-53.
10. Shah Khan, M.Z. and Mouritz, A.P. “Fatigue Behaviour of Stitched GRP Laminates” CompSci & Tech, Vol 56, 1996, pp 695-701.
11. Xiao, J. and Bathias, C. “Fatigue Behaviour of Unnotched and Notched Woven Glass/EpoxyLaminates”, Comp Sci & Tech Vol 50, 1994, pp 141-148.
12. Galea, S.C. and Saunders, D.S. “In-Situ Ultrasonic C-Scanner”, Australian Department ofDefence, DSTO, ARL-TR-4, 1992

Proceedings of ICCM–11, Gold Coast, Australia, 14th-18th July 1997
V - 149
THE RESIDUAL COMPRESSION STRENGTH OFSTITCHED AND UNSTITCHED PLAIN-WEAVE
CARBON/EPOXY LAMINATES AFTER IMPACT ANDHYGROTHERMAL CYCLING
B. Qi1, I. Herszberg2, A.A. Baker3 and M.K. Bannister4
1The Sir Lawrence Wackett Centre for Aerospace Design Technology, RMIT.Now with CRC-ACS
2The Sir Lawrence Wackett Centre for Aerospace Design Technology, Dept of AerospaceEngineering, Royal Melbourne Institute of Technology, P.O. Box 2476V, Melbourne, Vic.
3001, Australia3Airframes and Engines Division, Aeronautical and Materials Research Laboratory,
506 Lorimer Street, Fishermens Bend, Vic, 3207, Australia4Cooperative Research Centre for Advanced Composite Structures (CRC-ACS), 506 Lorimer
Street, Fishermens Bend, Vic. 3207, Australia
SUMMARY: Damage effects due to hygrothermal cycling were experimentally studied forthin (~1mm) Carbon /Epoxy laminates containing various levels of impact damage.T300/GY260 laminates were made by Resin Transfer Moulding from plain woven fabric withvarious densities of through-the-thickness stitching using Kevlar threads. The cycling wasconducted, on impacted and non-impacted wet specimens, over a temperature range from -30oCto +100oC with ambient humidity ranging from low to 99%. Stitching did not significantlyaffect the damage resistance of the laminates, nor their residual compressive strength afterimpact (CAI strength). The cycled specimens were only slightly more resistant to damage thanthe dry specimens and the saturated specimens showed further slight improvement.Hygrothermal cycling slightly decreased the CAI strength and decreased the undamagedstrength.
INTRODUCTION
The use of post-buckling design in composites has raised interest in the performance ofstitched thin-skinned composites. Through-the-thickness stitching is a simple technique andcan be combined with liquid moulding techniques such as Resin Transfer Moulding (RTM) topotentially produce low cost and high quality components with improved resistance todelamination [1, 2].
Tada and Ishikawa [3] evaluated the effects of stitching on compression strength of holedcarbon fibre laminates in which Kevlar 49 threads were stitched around the hole. They foundthat stitching could prevent crack initiation and/or propagation at initial failure stage but hadlittle effect on compression strength. Herszberg et. al [4] showed that Kevlar transversestitching did not affect the residual compression strength of thin woven fabric laminates.While stitching was generally reported to improve Mode I fracture toughness [5, 6], Ogo [5]found that stitching had negligible effect on Mode II delamination toughness, while Jain andMai [7] reported a significant increase due to stitching.
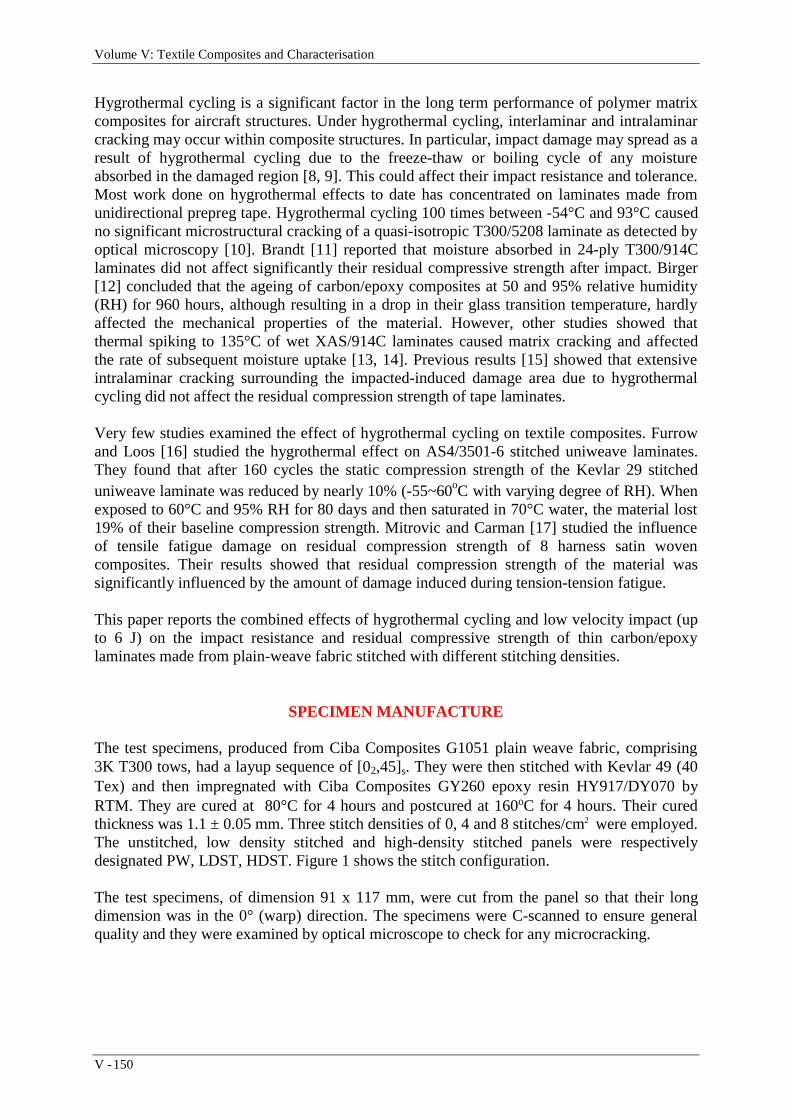
Volume V: Textile Composites and Characterisation
V - 150
Hygrothermal cycling is a significant factor in the long term performance of polymer matrixcomposites for aircraft structures. Under hygrothermal cycling, interlaminar and intralaminarcracking may occur within composite structures. In particular, impact damage may spread as aresult of hygrothermal cycling due to the freeze-thaw or boiling cycle of any moistureabsorbed in the damaged region [8, 9]. This could affect their impact resistance and tolerance.Most work done on hygrothermal effects to date has concentrated on laminates made fromunidirectional prepreg tape. Hygrothermal cycling 100 times between -54°C and 93°C causedno significant microstructural cracking of a quasi-isotropic T300/5208 laminate as detected byoptical microscopy [10]. Brandt [11] reported that moisture absorbed in 24-ply T300/914Claminates did not affect significantly their residual compressive strength after impact. Birger[12] concluded that the ageing of carbon/epoxy composites at 50 and 95% relative humidity(RH) for 960 hours, although resulting in a drop in their glass transition temperature, hardlyaffected the mechanical properties of the material. However, other studies showed thatthermal spiking to 135°C of wet XAS/914C laminates caused matrix cracking and affectedthe rate of subsequent moisture uptake [13, 14]. Previous results [15] showed that extensiveintralaminar cracking surrounding the impacted-induced damage area due to hygrothermalcycling did not affect the residual compression strength of tape laminates.
Very few studies examined the effect of hygrothermal cycling on textile composites. Furrowand Loos [16] studied the hygrothermal effect on AS4/3501-6 stitched uniweave laminates.They found that after 160 cycles the static compression strength of the Kevlar 29 stitcheduniweave laminate was reduced by nearly 10% (-55~60oC with varying degree of RH). Whenexposed to 60°C and 95% RH for 80 days and then saturated in 70°C water, the material lost19% of their baseline compression strength. Mitrovic and Carman [17] studied the influenceof tensile fatigue damage on residual compression strength of 8 harness satin wovencomposites. Their results showed that residual compression strength of the material wassignificantly influenced by the amount of damage induced during tension-tension fatigue.
This paper reports the combined effects of hygrothermal cycling and low velocity impact (upto 6 J) on the impact resistance and residual compressive strength of thin carbon/epoxylaminates made from plain-weave fabric stitched with different stitching densities.
SPECIMEN MANUFACTURE
The test specimens, produced from Ciba Composites G1051 plain weave fabric, comprising3K T300 tows, had a layup sequence of [02,45]s. They were then stitched with Kevlar 49 (40Tex) and then impregnated with Ciba Composites GY260 epoxy resin HY917/DY070 byRTM. They are cured at 80°C for 4 hours and postcured at 160oC for 4 hours. Their curedthickness was 1.1 ± 0.05 mm. Three stitch densities of 0, 4 and 8 stitches/cm2 were employed.The unstitched, low density stitched and high-density stitched panels were respectivelydesignated PW, LDST, HDST. Figure 1 shows the stitch configuration.
The test specimens, of dimension 91 x 117 mm, were cut from the panel so that their longdimension was in the 0° (warp) direction. The specimens were C-scanned to ensure generalquality and they were examined by optical microscope to check for any microcracking.

Proceedings of ICCM–11, Gold Coast, Australia, 14th-18th July 1997
V - 151
stitch pitch
stitch spacing
0 directiono
Fig. 1: Configuration of stitched woven fabric laminate
EXPERIMENTAL TECHNIQUES
Four groups of specimens were tested, each with a different sequence of impact andhygrothermal cycling. Each group comprised a number of specimens from each stitchconfiguration, ie., PW, LDST and HDST. The specimens from the various designations weredamaged by impacting at energy levels ranging from 0 to 6 J. Before testing all specimenswere dried in an oven at 70°C until constant weight was reached. The edges of the testspecimens were not sealed during conditioning since minor local edge effects would not affectthe impact performance. The testing sequence for each group is outlined below andsummarised in Table 1 which also includes moisture content in the non-impacted specimensand their measured glass transition temperature (Tg).
• Group A specimens were impacted at different energy levels, then compression tested.• Group B specimens were immersed in water at 70°C until their weight reached an
equilibrium (constant conditioning), then impacted at different energy levels andsubsequently compression tested.
• Group C specimens were immersed in water for constant conditioning. Impact test werethen performed before 810 standard hygrothermal cycles (SHC). After that some of themwere subjected to constant conditioning for moisture reabsorption. The others weresubsequently compression tested.
• Group D specimens were subjected to 810 standard hygrothermal cycles after constantconditioning, then impact and subsequently compression tested.
Table 1: Test matrix
Group Test sequence Number of specimens Moisture content*(%) Tg (oC)
at Impact at CAI At Impact at CAIA Dry→Imp→CAI PW: 13 LDST: 33 HDST: 17 <0.2 <0.2 146 146
B Wet→Imp→CAI PW: 4 LDST: 4 HDST: 0.62 0.62 125 125
C Wet→Imp→SHC→CAI PW: 6 LDST: 9 HDST: 7 0.62 0.52 125 114
D Wet→SHC→Imp→CAI PW: 4 LDST: 4 HDST: 5 0.52 0.52 114 114
*for non-impacted specimens
Standard Hygrothermal Cycle – SHC
The temperature ranges was -30°C to +100°C (measured at the specimen surface) withrelative humidity ranging from low to 99% RH. The average heating rate was 1.1°C/min. Thetemperature range chosen is based on the general temperature profile for a commercial aircraft(see Ref. [18] for more detail).

Volume V: Textile Composites and Characterisation
V - 152
Moisture Absorption and Glass Transition Temperature
Moisture absorption behaviour before and after cycling was determined by using waterimmersion at 70°C. Selected specimens were redried and their moisture reabsorptioncharacteristics determined. Details on measuring weight, and determination of the effect ofabsorbed moisture on Tg of composite materials using dynamic mechanical thermal analysis(DMTA) have been reported previously by Qi et al. [18].
Impact and CAI tests
Impact test were conducted at six different incident impact energy levels from 0 to 6 J.Compression after impact tests were conducted at room temperature using the CRC-ACS testrig. The specimen was constrained by anti-buckling plates which contained a circular cut-outof diameter 40 mm to allow any damage growth and local buckling within this window.Details of those testing and test procedures have been reported by Qi et al. [19].
Damage Characterisation
Tetrabromoethene enhanced X-ray radiography was employed to characterise the initiationand growth of microcracking (after SHC) and damage (after impact and CAI). Throughtransmition C-Scan was also used to determine the projected impact damage area. Opticalmicroscopy was employed to study surface damage and failure mode and SEM was also usedto investigate the fracture morphology.
RESULTS AND DISCUSSION
Plain Woven Fabric Structures
Cross-sections of a plain-weave specimen revealed tow waviness, due to the weave structure,such that fibre tows were at out-of-plane angles of up to 8.2°. Stitching cause further out ofplane crimping of the tows and also local in-plane distortion of the yarns such that diamondshaped resin-rich areas were formed in the vicinity of each stitch. No distortion of the stitchloops was found due to RTM consolidation process. This fibre/tow waviness is a major factoraffecting in-plane mechanical properties of this type of laminate, especially for theirundamaged compression strength [1, 4]. Dow [1] has shown that stitched flat laminates havecompression strength about 20% lower than the strength of comparable unstitched laminateswhich may be attributed to crimping and fibre displacement and damage due to stitching.
Hygrothermal Effect
A variety of damage modes were manifest for the various specimens subsequent to cycling.These have been previously reported by Qi et al [18]. Short transverse matrix cracks andsurface debonding between resin and tow fibres were observed. These microcracks grewalong fibres in the tows and they were arrested in the interlacing zone of warp and weft tows.Some delamination was found in the interlacing tows of the surface plies. Figure 2 is an X-rayradiograph and shows some small dark zones at the interlace points on the surface ply. Cross-sectional microscopic inspection revealed that these were delamination cracks occurringbetween surface warp tows and weft tows. Stitched specimens developed cracks in the resinrich areas associated with the stitching and there was evidence of debonding at the stitch

Proceedings of ICCM–11, Gold Coast, Australia, 14th-18th July 1997
V - 153
interface. However, they were far less susceptible to the surface ply delamination cracks, asmay be seen from Figure 3. This may be because the hygrothermal stresses had been relievedby the cracking in the stitch region.
15 mm
15 mm
Fig. 2: Matrix cracking of PW specimen, Fig. 3: Matrix cracking and stitchshown by short dark lines and delamination thread debonding of a HDST specimen
in the interlacing area (SHC; X-ray) (SHC; X-ray)
Impact Resistance
The impact damage resistance, as measured by the decrease in damage area due to impact, isshown in Fig. 4 for dry, cycled and wet PW specimens. Those data points are best fitted tolinear lines. The damage resistance of the cycled specimens (Group D) was found to be higherthan for the dry specimens (Group A) and the wet specimen (Groups B & C) even greater. Itappears that constant water exposure enhanced matrix toughness, probably due toplasticisation of the matrix with moisture absorption. These results are consistent with thedegree of moisture absorbed by the various specimens (Table 1). Similar results were foundfor the various stitched configurations and tape laminates [19].
Stitching did not significantly change the impact resistance, in terms of impact damage area,of dry, cycled or wet specimens. As an example, Fig. 5 presents the results for dry PW, LDSTand HDST specimens.
0
50
100
150
200
250
300
350
0 2 4 6 8Impact Energy (J)
Dam
age
Are
a (m
m^2
)
Group AGroups B+CGroup D
Group D
Group B+C
Group A
0
50
100
150
200
250
300
350
0 2 4 6
Impact energy (J)
Dam
age
Are
a (m
m^2
)
PW
LDST
HDST
Fig. 4: Impact performance of PW under Fig. 5: Comparison of impact resistancedifferent conditions between dry PW, LDST & HDST specimens

Volume V: Textile Composites and Characterisation
V - 154
Impact Damage Mode
The projected impact damage area was circular for both non-stitched and stitched specimens.Fig. 6 shows a cross-section of dry PW specimen impacted at 4.5 J. It is interesting to notethat at the maximum impact energy, the area ratio of the damage zones, measured on the backand impacted surfaces respectively, was less than 3, whereas for tape specimens this ratio istypically greater than 10. The impact damage comprised: fibre breakage, transverse matrixcracking, and tow separation. This contrasts with the large rear ply delamination areas formedin impacted tape laminates. This more localised damage and high impact resistance for thewoven composite compared to conventional tape laminates, is attributed to the wavy towstructure providing greater resistance for crack propagation.
By counting the number of stitches in the impact damage area, it was found that the effectivestitch density was less than the nominal stitching density. This is obviously dependent onstitching pattern. For example, for a HDST specimen, with a nominal stitch density of 8stitches per cm2, at an impact energy level of 5J, there were only nine stitches in the failurearea giving an effective stitch density of only 4 stitches per cm2.
Fig. 6: Cross-section view of impacted PW specimen (Group A, impacted at 4.5J)
Damage Tolerance
Failure mode
Inspection of edges and surfaces of failed specimens after CAI revealed that significant warptow barrelling occurred and failure mode was transverse shear cracking. Further cross-sectional inspection, see Fig. 7, showed that kinking of warp tows occurred on the crack path.Since fibre kinking is a type of fibre microbuckling, it was assessed that this preceeded thefinal shear failure. The failure mode was similar for both stitched and unstitched specimens.
In progressive loading tests the impact induced damage area was not observed to spread (Fig.8). This contrasts with tape laminates where the impact damage region spreads undercompessive loading as a result of sublaminate buckling.

Proceedings of ICCM–11, Gold Coast, Australia, 14th-18th July 1997
V - 155
Stitches
Transverse shear crack
Multi-kinking
1 mm
19.1 kN 21.1 kN
40 mm
Fig. 7 Kinking bands in warp tows of a Fig.8 Compression failure of an impacted HDSTHDST specimen after CAI specimen during stepped loading (Group A,
(Group D, impacted at 3.84 J) X-ray , impacted at 4.5 J)
Residual Compression Strength
As may be seen from Figs. 9-12, which show the influence of damage width on residualcompression strength of the various laminates, stitching did not significantly affect residualcompression strength of the woven fabric laminates. This is despite the fact that stitchingreduced the undamaged compressive strength [4].
No significant difference was found in the residual compressive strength, between theuncycled Group A (dry) and Group B (wet) specimens (see eg Fig. 10), indicating thatplasticisation of the matrix due to moisture absorption did not affect residual compressionstrength. This confirms the findings of other researchers (Guild et al. [20] and Dost et al. [21])that resin toughness has little effect on the relationship between CAI and damage diameter.
As may be seen from Figs. 10-12, Group D (cycled then impacted) specimens had a lowerresidual compressive strength than that of uncycled (A and B) specimens. The CAI strengthfor group C (impacted then cycled) specimens was intermediate. The compressive strength forundamaged cycled specimens was also lower than for the uncycled specimens. This may bebecause of the placement of load-bearing (0°) plies on the surface. The degradation of thematrix at the surface due to hygrothermal cycling would reduce the support to the warp towsresulting in a lower compression strength.
It was expected that the impact damage area in the Group C (impacted then cycled) specimenswould grow due to cycling as a result of the freeze-thaw effect of moisture trapped in thedamage area. No such damage growth was observed and the CAI strength of the Group Cspecimens was in fact higher than that of the Group D (cycled then impacted) specimens. Thismay be because for group C specimens, the impact-induced crack tips were blunted by thehygrothermal cycling.
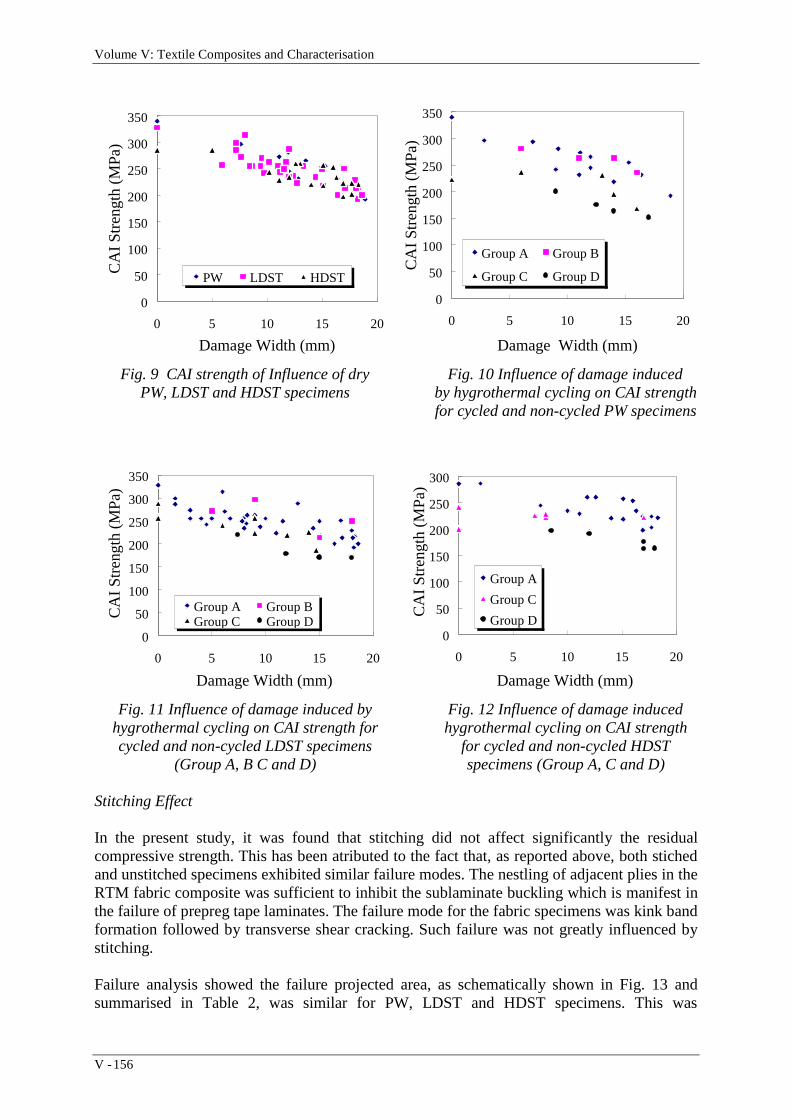
Volume V: Textile Composites and Characterisation
V - 156
0
50
100
150
200
250
300
350
0 5 10 15 20
Damage Width (mm)
CA
I Str
engt
h (M
Pa)
PW LDST HDST
0
50
100
150
200
250
300
350
0 5 10 15 20
Damage Width (mm)
CA
I Str
engt
h (M
Pa)
Group A Group B
Group C Group D
Fig. 9 CAI strength of Influence of dry Fig. 10 Influence of damage inducedPW, LDST and HDST specimens by hygrothermal cycling on CAI strength
for cycled and non-cycled PW specimens
0
50
100
150
200
250
300
350
0 5 10 15 20
Damage Width (mm)
CA
I Str
engt
h (M
Pa)
Group A Group BGroup C Group D
0
50
100
150
200
250
300
0 5 10 15 20
Damage Width (mm)
CA
I Str
engt
h (M
Pa)
Group A
Group C
Group D
Fig. 11 Influence of damage induced by Fig. 12 Influence of damage inducedhygrothermal cycling on CAI strength for hygrothermal cycling on CAI strengthcycled and non-cycled LDST specimens for cycled and non-cycled HDST
(Group A, B C and D) specimens (Group A, C and D)
Stitching Effect
In the present study, it was found that stitching did not affect significantly the residualcompressive strength. This has been atributed to the fact that, as reported above, both stichedand unstitched specimens exhibited similar failure modes. The nestling of adjacent plies in theRTM fabric composite was sufficient to inhibit the sublaminate buckling which is manifest inthe failure of prepreg tape laminates. The failure mode for the fabric specimens was kink bandformation followed by transverse shear cracking. Such failure was not greatly influenced bystitching.
Failure analysis showed the failure projected area, as schematically shown in Fig. 13 andsummarised in Table 2, was similar for PW, LDST and HDST specimens. This was

Proceedings of ICCM–11, Gold Coast, Australia, 14th-18th July 1997
V - 157
confirmed by X-ray radiography and visual inspection on the failed specimens. Table 2showed that for LDST specimens almost no stitches were involved in the failure process,since cracks propagated between two stitching rows, while only 4 stitches per cm2 wereinvolved in the failure region for HDST specimens.
HDST/LDST
PW
Stitching rows
Crack projected zone
Impact damage area
2dW’
α
Fig. 13: A sketch showing damage propagation, the projected failure area and transverseshear crack on the edge for PW, LDST and HDST specimens
Table 2: Estimated failed stitch density during CAI
Nominalstitchingdensity(st/cm2)
Estimatedprojected
failure area(cm2)
Estimatednumber of
stitchesfailed
Estimatedeffective
stitchdensity(st/c m2)
0 2 x(2d x W’)
0 0
4 2 x(2d x W’)
0 0
8 2 x(2d x W’)
2 x(1 + W’/d)
4.1
Components of shear force would be expected to act on the through-the-thickness stitchesbecause of the shear type failure mode. The shear properties of Kevlar/epoxy is poorcompared to that of carbon/epoxy [22]. SEM photographs of a broken stitch thread, showingevidence of shear and pull-out failure, are presented in Figs. 14 and 15.
An important factor in the failure mechanism was the friction caused by the relativemovement between two fractured surfaces during the transverse shear cracking. Friction maybe a potential energy dissipation mechanism during mode II fracture [7]. The contribution ofthe stitches to resist such crack propagation was much lower than the neighbouring carbonfibres because of their small volume fraction and lower shear properties.

Volume V: Textile Composites and Characterisation
V - 158
Transverse shearcrack plane
Failed stitch thread
Loading direction
Fig. 14 Breakage of a stitch thread in a Fig. 15 Breakage of a stitch thread inHDST specimen after CAI (Group D, SEM) a failed HDST specimen after CAI (SEM)
CONCLUSIONS
For the thin carbon/epoxy specimens studied, which were stitched with kevlar thread andsubject to the combined effect of hygrothermal cycling and impact damage, the followingconclusions were reached:
• Stitching did not increase their damage resistance or improve the residual compressivestrength.
• Hygrothermal cycling caused a reduction in undamaged compressive strength and the CAIstrength of both stitched and unstitched specimens. The reduction manifest in cycled thenimpacted specimen was greater than for impacted and cycled specimens.
ACKNOWLEDGMENT
The assistance of Mr K Houghton in the manufacture of the specimens, and Mr H. Morton inthe use of X-ray radiography are gratefully acknowledged.
REFERENCE
1. Dow, M. B., Smith, D. L. “Damage-Tolerant Composite Materials Produced by Stitching CarbonFabrics", 21st International SAMPE Technical Conference, Sept. 25-28, 1989
2. Farley, G. L. and Dickinson, L. C. "Mechanical response of Composite materials withthrough-the-thickness Reinforcement", NASA CR- ? 1991
3. Tada, Y. and Ishikawa, T. “Experimental evaluation of the effects of stitching on CFRPlaminate specimens with various shapes and loading”, Key Engineering Materials Transtech Publications, Switzerland, Vol.37, 1989, pp.305-316
4. Herszberg, I. and Bannister. M. K. “Compression and Compression-after-ImpactProperties of Stitched Carbon/Epoxy Composites”, 5th Australian Aerospace Conference,Melbourne, Sept., 1993, also published in Cooperative Research Centre for AerospaceStructures CP-93001, 1993.
5. Ogo, Y. “The effect of stitching on in-plane and interlaminar properties of carbon /epoxyfabric laminates”, MSc. Thesis, Uni. Of Delaware, Newark, Delware, May, 1987

Proceedings of ICCM–11, Gold Coast, Australia, 14th-18th July 1997
V - 159
6. Morales, A. “Structural stitching of textile preforms”, Proc. 22nd SAMPE Tech. Conf., 6-8 Nov. 1990, pp.1217-1230
7. Jain, L. K. and Mai, Y. W. “Analysis of stitched laminated ENF specimens for interlaminarMode II fracture toughness”, International J. of Fracture, Vol. 68, 1994, pp.219-244
8. Ashford, L.W. "Analysis and Test of Carbon/Bismaleimide Laminates Subjected toInternal Pressures Resulting from Trapped Moisture", 18th International SAMPEtechnical Conference, Oct. 7-9, 1986
9. Stansfield, K.E. and Pritchard, G. "Damage generation and healing during compositethermal spikes", 21st International SAMPE Conference, pp.120-129, Sept. 1989.
10. Crossman, F.W., Mauri, R.E. and Warren, W.J., "Hygrothermal Damage Mechanisms inGraphite-Epoxy Composites", NASA Contractor Report 3189, 1979
11. Brandt, J. and Warnecke, J. "Influence of material parameters on the impact performanceof carbon-fibre-reinforced polymers", High Tech - The Way Into The Nineties, Ed.Brunsch, K., et al. Elsevier, Amsterdam, 1986, pp. 251-260
12. Birger, B. Moshonov, A. and Kenig, S. "The effects of thermal and hygrothermal ageingon the failure mechanisms of graphite-fibre epoxy composites subjected to flexuralloading," Composites., Vol. 20, No. 4, 1989 p.341.
13. Bohlman, R.E. and Derby, E.A., "Moisture Diffusion in G/E Laminates-Experimental andPredicted", Proc. of Structures, Structural Dynamics and materials Conference, March1997, pp.219-226.
14. Clark, G., Saunders, D.S., van Blaricum, T.J. and Richmond, M. "Moisture Absorption inGraphite/Epoxy Laminates", Composites Science and Technology, 1990 pp. 355-375
15. Qi, B., Herszberg, I., Baker, A. A. and Bannister, M., "The Effects of HygrothermalCycling on the Impact Resistance and Tolerance of Quasi-Isotropic T300/914CLaminates”, 1st Australasian Congress on Applied Mechanics, Melbourne, 21-23 Feb.,1996, pp. 371-376
16. Furrow, K. W., Loos, A. and Cano, R. J. “Environmental effects on stitched RTM textilecomposites”, J. of Reinforced Plastics and Composites, Vol. 15, 1996, pp.378-419.
17. Mitrovic, M. and Carman, G. P. “The influence of tensile fatigue damage on residualcompression strength of woven composites”, Proc. of the American Society forComposites, Tenth Technical Conference, Oct. 18-20, 1995, pp. 633-643.
18. Qi, B., Herszberg, I., Baker, A. A. and Bannister, M., "Damage Effect of HygrothermalCycling on Carbon/Epoxy Laminates”, PICAST2-AAC6, Melbourne 20-23 March, 1995,pp. 585-592
19. Qi, B., Herszberg, I., Baker, A. A. and Bannister, M., "The Effects of Moisture andImpact on Ultimate Compressive Strength of G/E Composites", in Proc. 5th AustralianAeronautical Conference, Melbourne, 14 Sept, 1993.
20. Guild, F.J., Hogg, P.J. and Prichard, J.C. "A model for the reduction in compressionstrength of continuous fibre composites after impact damage", Comp, 24 (4), 1993 p. 333.
21. Dost, E. F. Ilcewicz, L. B. and Gosse, J. H. “Sublaminate stability based modeling ofimpact damage composite laminates”, Proc. Of the American Society for Composites -Third Technical Conference, ASC, 1988
22. Clements, L. L. and Moore, R. L. SAMPE Quart, Vol.9, No.1. 1977, p.623. Morgan, R. J. and Allred, R. E. “Aramid Fibre Reinforcements”, in Reference Book for
Composites Technology Vol. 1, edited by S. M. Lee, 1987 pp.143-166

Volume V: Textile Composites and Characterisation
V - 160
SIMULATION OF THE SHAPING OF WOVENFABRICS
Roger Blanlot
Aerospatiale, Common Research Center Louis BlériotDépartement Ingénierie et Procédés Composites,12, Rue Pasteur BP.76
92152 Suresnes Cedex, France
SUMMARY: This paper is a second part of a general reflection aiming to the definition ofthe mechanical behaviour of prepreg woven fabrics used for the manufacture ofundevelopable composite parts by lay-up as well as by extension by any shaping processes.We present a finite element formulation based on anisotropic hypoelastic constitutiveequations. This formulation has been achieved by considering the need for obtaining anindustrial design tool. The present formulation corresponds to the objective rigid-bodyrotation frame with an up-dating of the warp and weft yarn directions of the fabric. Thehypothesis is assumed that the evolution of these directions is quasi-identical to the evolutionof the principal directions of strain. The constitutive equations of the fabric behaviour areidentified at each increment. The numerical model is integrated in the ABAQUS finiteelement software. Firstly we have studied the simple shear test with different orientations ofthe fabric. In a second part we have simulated an example of forming.
KEYWORDS: woven fabrics, prepreg, simulation, constitutive equations, finite strains, finiteelement method, laying-up
INTRODUCTION
The increasing use of composite materials over the last few decades, more particularly in thefield of aerospace, has implied the improvement of design rules and consequently, has leadthe industries to look into the automation of the different manufacturing processes. In the caseof automation of the classical laying up forming process, specific automated machines havebeen now in use for several years in different countries such as U.S.A., or France. But theywere originally designed for developable or slightly undevelopable composite parts. In thecase of undevelopable parts, automation was generally not considered. Several kinds ofdifferent systems in processing aids were achieved without taking various mechanical aspectsof the fabric into account.
The present study is concerned with a general research pattern pertaining to the definition ofthe mechanical behaviour of prepreg fabrics used for the manufacture of undevelopablecomposite parts by laying-up as well as its extension for stamping process.
Generally, two different approaches can be used for this type of problems: one way favoursthe geometrical aspect of the warping, the other one its mechanical aspect. Our research isbased on the mechanical approach.

Proceedings of ICCM–11, Gold Coast, Australia, 14th-18th July 1997
V - 161
The behaviour of prepreg fabrics with resin in the non-polymerized phase during themanufacture of undevelopable composite parts by lay-up, depends on various parameterswhich can be grouped into two sets as:
the parameters associated to the dry fabric- materials constituting warp and weft yarns (type and mechanical characteristics)- the method of preparation of the yarn (size, thickness, section shape, etc...)
the weaving technique (fabric weave, fabric structure)
the parameters associated to the resin- the average resin content- the mechanical characteristics
the fabric impregnation method.
These parameters were identified experimentally after carrying out a whole range ofmechanical tests, on the prepreg fabric, and the resin, separately and respectively.
A micro-structural finite element model developed earlier [1] was validated by comparing itto the results obtained from tests. This study has brought out that the most important factor forthe shaping process is the fabric ability to allow for a relative rotation of the yarns associatedwith the plane shear of the resin [2].
In this paper, we present a finite element formulation based on anisotropic hypoelasticconstitutive equations. This formulation has been achieved by considering the need to obtainan industrial design tool. We have also developed a macro-mechanical model, whichsubstitutes an homogeneous continuous material to the discrete nature of fabric. Thehomogenisation has been obtained through an iteration in the computation procedure.
The continuous variation of the geometric positions of fabric yarns is taken into account byincorporating the velocity of particles in the formulation, thus allowing the evolution ofanisotropy during the transformation. We have used Green-Nadghi's formulation associatedwith rigid body rotation derived from polar decomposition. The evolution of the orthotropichypoelastic law is there determined by the location of the bisectors of the warp and weftdirections identified at each instant of the transformation.
PRELIMINARIES
Kinematic of the Transformation
Let us consider the motion of the different material points, called particles, of a deformablebody. The motion of a particle P relative to a reference frame R, associated to a orthonormalbasis in a Euclidean space of three dimensions, is described by the time locus of its positionvector x (P, t). This locus is the path trajectory of P in R. This particle can be identified by itsposition vector X(P) in R at a reference time (t0). At this time the different particles occupythe reference configuration C(t0) or C0. The motion of this particle P is described by thevector function :
x = f(X, t)

Volume V: Textile Composites and Characterisation
V - 162
The position of different particles at a given time (t) corresponds to the current configurationC(t) or C.
The transformation of an infinitesimal element dX in C0 into an infinitesimal element dx in C,is defined by the deformation gradient tensor F.
dx = F.dX
This tensor which is continuously differentiable has a strictly-positive determinant, and henceadmits the polar decomposition
F = R.U = V.R
U(t) and V(t) describe the local deformation of the element and are referred to as the right andleft stretch tensor respectively. These tensors are symmetric and positive-definite. R(t) is theproper orthogonal tensor and characterises the rigid body rotation with RT = R-1.
The material time rate of change of the body deformation is described by the velocity gradienttensor L .
The symmetric part D is called the stretching tensor,
D = sym L = 1
2L + LT( )
and the anti symmetric part W the spin tensor,
W = skw L = 1
2L - LT( )
This completes the sketch of basic kinematics essential for this presentation.
Change of Frame and Objectivity
For pure homogeneous deformations, an orthogonal triad, composed of the principal axeswhich remain orthogonal throughout the deformation, can be identified. Furthermore, itsmaterial derivative equals the deformation rate tensor. Only for homogeneous (not pure)deformations is the deformation gradient tensor unsymmetric, and there is no triad whichremains orthogonal throughout. For this reason, finite strain formulations which involve stressrate must compensate for the material rotation by using objective derivatives [5], [6]. Theseobjective derivatives are divided into two types : the convective derivatives and those whicheliminate the parasitic rotations by changing frame. For the latter, a lot of objective tensorrates are proposed in literature.
Let ei(t) be a smooth, time-dependent orthonormal basis. The corresponding twirl tensor Ωis the skew tensor function defined by
Given a smooth tensor function B, the time derivative of B measured by an observer rotatingwith ei(t) can be written as

Proceedings of ICCM–11, Gold Coast, Australia, 14th-18th July 1997
V - 163
Green-Nagdhi's (Mc Innis or Dienes) derivative corresponds to the case of ei(t) associatedwith the rotation experienced by the material yarns and coinciding with the principaldirections of strain since the initial time.
Sowerby-Chou's (Hill) derivatives corresponding to the case of ei(t) are the rotations of theprincipal directions of U and V tensors.
Another important notion is Jaumann's derivative BJ
given by
in which W is the spin. This derivative corresponds [4] to the corotationnal frame where, foreach time, the materials yarns that coincide with the principal axes of deformation have noangular velocity.
Application to a Non-Up-Dated Behaviour Law for Simple Shear
The simple shear test can be described by the figure below :
Fig. 1. Simple shear test
A Green-Nagdhi's formulation is used with an orthotropic hypoelastic behaviour law. Theorthotropic axes are assumed to rotate with the rigid body frame. The overbars and greeksubscripts denote the writing of equations in the rotating frame.
and θ = arctan-a
2
+ θ0 , θ0 represents the initial angle (e1, eα) between the shearing
direction and one of the orthotropic directions. The integration of these equations in therotating local basis gives

Volume V: Textile Composites and Characterisation
V - 164
σ ααR = −σ ββ
R = (Cαααα − Cααββ ). 2arctana2
−
a2
.sin(2θ0) − ln 1+ a2
4
.cos(2θ0)
σ ββR = (Cααββ − Cββββ ). 2arctan
a
2
−
a
2
.sin(2θ0) − ln 1+
a2
4
.cos(2θ0 )
σ αβR = 2Cαβαβ . 2arctan
a
2
−
a
2
.cos(2θ0 ) + ln 1+
a2
4
.sin(2θ0)
The next figures indicate the evolution of the Cauchy's stress components in the rigid bodyframe.
Cαααα = Cββββ = 100010 MPa ; Cααββ = 6.8 MPa ; Cαβαβ =4.4 MPa, θ0= 0°
OUR STUDY
Basic Assumptions
The basic assumptions of our model are given as follows:
1. on the macroscopic scale, the fabric has a plane of symmetry coinciding with the medianplane of the fabric, and the material considered is a perfectly balanced fabric,
2. the thickness of the fabric is small so that the stress vector components orthogonal to themedian plane of the fabric are zero,
3. deformations due to warping shrinkage are neglected. An average modulus is assigned toeach of the warp and weft directions.
4. the behaviour of the fabric is assumed to be orthotropic along the directions of thebisectors of the warp and weft roving. The components of the behaviour law then vary asfunctions of the relative rotation of these directions.
The latter assumption results from the kinematics study of two material segments, e.g. as infig. 4, which are initially perpendicular to an arbitrary initial position. This study comparesthe bisector rotation of the dihedron formed by these segments to the rotation of the rigidbody derived from the polar decomposition. This assumption is permissible within thetransformation range applicable for the studied process as it can be seen at the fig. 5.

Proceedings of ICCM–11, Gold Coast, Australia, 14th-18th July 1997
V - 165
Fig. 4. Rotation of the warp and weft yarns
-35
-30
-25
-20
-15
-10
-5
0
0 0,2 0,4 0,6 0,8 1
0°-90°30°-120°45°-135°60°-150°rigid body rotation
shear displacement (a)
Bis
ect
or
rota
tion
s fo
r d
iffe
ren
t in
itia
l o
rie
nta
tion
s o
f th
e w
arp
an
d w
eft
ya
rn f
ab
ric
(de
gre
es)
Fig. 5. Comparison between rotation of bisectors obtained from real rotations of warp andweft yarns and the rigid body rotation
The variation of the behaviour law in the mobile coordinate system (eα,eβ) corresponding tothe rigid body rotation can then be monitored in order to ensure that the formulation isobjective. Actually, one way to obtain an objective behaviour law for our material withmaterial symmetry is to express it in a frame which rotates with the material. An orthotropicbehaviour law will thus stay within it. Among those frames and according to our hypothesis,the rigid body frame, initially coinciding with the directions of the warp and weft yarns anglebisectors remains in coincidence throughout the transformation. Furthermore, as thedeformations in the yarn directions are infinitesimal compared to the finite shear deformationsin the fabric plane, the behaviour law remains orthotropic in this frame but evolves with thevariation of the angle between warp and weft yarns. Only the variation of this orthotropyneeds to be considered.

Volume V: Textile Composites and Characterisation
V - 166
Constitutive Equations
We have chosen to work with a hypoelastic law, representative of the constitutive law ofcarbon yarns. The viscoelasticity of the resin is thus neglected and it is given an elasticmodulus. We can write the law in the rotating frame as follow :
We will then use this frame together with the rigid body rotation to formulate strains andstresses at velocity to benefit from the objectivity of magnitudes manipulated in it, and we canwrite :
in this rotating frame.
In our incremental numeric formulation, taking the behaviour law variation into account, weassume that the rotation of the main elongation directions is zero on an increment.Furthermore, we assume that the behaviour law is constant for this increment. Note that thisassumption is particularly justified for very small increments.Therefore, we obtain:
σ (t + ∆t) = σ W C αβW ∆ε R
The C αβ tensor of the behaviour law is calculated from the geometric positions of the two
yarn directions which are up-dated at the end of the increment. Let Nwarp and Nweft be therespective direction vectors of a warp or weft yarn at the beginning of an increment. Duringthis increment, those directions are transformed into nwarp and nweft by :
nwarp =1
∆F.Nwarp
.∆F.Nwarp and nweft =1
∆F.Nweft
.∆F.Nweft .
So we can express the angle between those two vectors and so recalculate the angle
θ(t + ∆t) =1
2nwarp, nweft
∧
between them and the bisector.
The behaviour law is obtained for the next increment by integrating the local behaviour of thewarp and weft networks (assumed to be independent) associated with the pre impregnation
resin, across the thickness of the fabric, using the law C αβ = 1h (Cαβ
warp −θ( )h∫ + Cαβ
weft +θ( ))dz
where Cαβwarp −θ( ) and Cαβ
weft +θ( ) are the initial orthotropic homogenised behaviour laws for the
warp or weft networks, expressed in a basis rotated from respectively −θ and +θ . Therotation of the bisector being comparable to the rigid body rotation, the orthotropic behaviourlaw is objective.
BASIC TESTS
In order to validate our algorithm, we have implemented it in the ABAQUS industrialsoftware by writing a "VUMAT" map, a subroutine used to define a specific behaviour law.Here below we present some results in comparison with a non up-dated material.

Proceedings of ICCM–11, Gold Coast, Australia, 14th-18th July 1997
V - 167
Simple Shear Test
This test has been described previously. The results obtained with a material which is acarbon satin are presented in Fig. 6 and 9.
Behaviour law of one network of yarns:
C1111 = 100003 MPa ; C2222= 7.62 MPa ; C1122 = 3.4 MPa ; C1212 =2.2 MPa, θ0= 0°
The non up-dated normal stresses being insignificant compared to the up-dated stresses, theyare not indicated in Fig. 6.
Simple Tensile Test
This test has been performed in order to test the kinematic of deformation obtained with thisalgorithm. We have imposed a displacement on a sample with a 45° initial angle of the warpyarns, as the width of a real sample of fabric becomes 1/2 of the initial width. For this test theangle between yarns that we have to obtain is 41.4 degrees. We have found 42.2 degrees withour model and a width of 0.507, whereas the sample with non up-dated behaviour law is near62 degrees with a width of 0.756 .

Volume V: Textile Composites and Characterisation
V - 168
EXAMPLE
The example of shaping process which is presented in this paper corresponds to a automatedlaying-up of a hemispherical part with a woven fabrics with yarns oriented at +-45°(directions of fibers along the diagonals of the fabric pattern ).
Fig. 12 Laying up on a hemisphereFabrics at +-45°
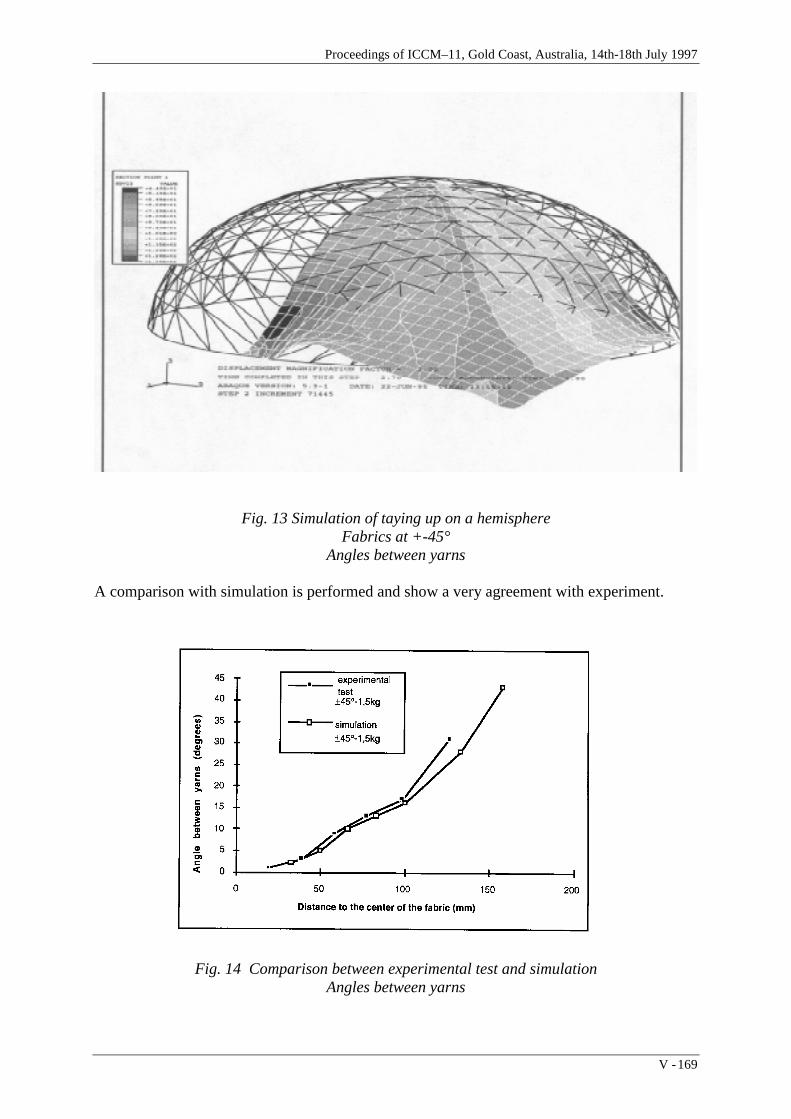
Proceedings of ICCM–11, Gold Coast, Australia, 14th-18th July 1997
V - 169
Fig. 13 Simulation of taying up on a hemisphereFabrics at +-45°
Angles between yarns
A comparison with simulation is performed and show a very agreement with experiment.
Fig. 14 Comparison between experimental test and simulationAngles between yarns

Volume V: Textile Composites and Characterisation
V - 170
CONCLUSIONS
This study is the first part of a numerical model of the laying-up for non-developablecomposite parts. We must now introduce the viscoelastic behaviour in the constitutiveequations to obtain an industrial aided design tool.
ACKNOWLEDGMENTS
This study was performed in collaboration with M. Billoët from ENSAM PARIS.
REFERENCES
1. BLANLOT R. BILLOET J.L. "Modélisation en grandes transformations de milieux àanisotropie évolutive - Modeling of large transformations in bodies with variableanisotropy)." Internal Report", ENSAM PARIS 1995 .
2. BLANLOT R. BILLOET J.L. GACHON H. "Study of the non-polymerized prepregfabrics in off-axes tests", ICCM9 - Volume 4, Madrid 1993.
3. GELIN "Modélisation en grandes transformations de milieux à anisotropie évolutive -Modeling of large transformations in media with variable anisotropy)." Internal Report",.
4 GILORMINI P. "Sur les référentiels locaux objectifs en mécanique des milieux continus- (About objective local frames in mechanics of continuous media)" - Acad. Sci. Parisreport T. 318, Series II, pp 1153-1159, 1994.
5. SOWERBY R., CHOU E. "Rotations, stress rates and strain measures in homogeneousdeformation processes" - Int. J. Solids Stuctures, Vol. 20, No. 11/12, pp. 1037-1048,1984
6 SZABO L. - BALLA M. "Comparison of some stress rates " - Int. J. Solids Stuctures,Vol. 25, No. 3, pp. 279-297, 1989

Proceedings of ICCM–11, Gold Coast, Australia, 14th-18th July 1997
V - 171
NUMERICAL MODELLING OF ENERGYABSORPTION IN WOVEN COMPOSITES
Louis Dagba1, Christian Wielgosz2
1Laboratoire de Mécanique et Matériaux, Ecole Centrale de Nantes1 Rue de la Noë, 44072 Nantes Cedex 03, France
2 Laboratoire de Génie Civil de Nantes St - Nazaire, Ecole Centrale de Nantes -Université de Nantes, 2 Rue de la Houssinière, 44322 Nantes Cedex 03, France
SUMMARY: The aim of the paper is to submit experimental and numerical results on energyabsorption behaviour of woven composite plates submitted to high dynamic tensile. Thehybrid woven plate (glass - kevlar - epoxy ) is clamped at one end and impacted at the otherend in order to obtain damage and failure of the sample. Usual finite element methodprograms with damage theories are unable to give a correct numerical answer to this problem.We show that a modified Chang's ([1], [2], [3]) progressive damage theory including new postfailure rules can be used to compute the response of the sample and to obtain good numericalresults on the energy absorbed by the sample.
KEYWORDS: hybrid woven composite, dynamic, failure, energy absorption
INTRODUCTION
The use of composite materials in crashworthy structures offers significant weight and costreduction relative to metal structures. In the last decade, several authors ([4], [5], [6]) haveshown by crushing tests on composite tubes the ability of composite materials to absorbenergy. In spite of the considerable work done in experimental studies, reliable numericalmodels are not yet available to predict the energy absorption behaviour of compositestructures. The aim of this study is to simulate this phenomenon in the case of compositeplates by using a dynamic finite element software [7]. The woven composite constitutive lawis obtained from an experimental study. Dynamic behaviour is described and the typical loaddisplacement curve shows the ability of the woven to absorb energy. A first finite elementmodel based on Chang's theory shows that the failure rules are inadequate to describe energyabsorption. New damage rules are introduced to solve failure progression in the plate. It isshown that load carried capacity of the plate is in good agreement with experimental results.

Volume V: Textile Composites and Characterisation
V - 172
EXPERIMENTAL PROCEDURE
Material data
The material used in this investigation is a glass - kevlar- epoxy woven composite. The testedstructure is made of height ply of twill weave as shown on Fig 1.
The samples (Fig.2) are cut from twill panels and submitted to quasi-static tensile load inorder to derive in-plane elastic constitutive law [8]. Table 1 sumarizes fiber volume fractionand elastic properties of the studied structure.

Proceedings of ICCM–11, Gold Coast, Australia, 14th-18th July 1997
V - 173
Dynamic Tensile Test.
The dynamic test on the sample was carried on the cutted sample [8]. One end is clamped andthe other end is impacted by a rigid body with velocity V (Fig 3).
Velocity is choosen to obtain damage and the final breaking of the structure. Different valuesof the velocity (10.5, 15, 20.5, 25 m/s) were applied to the rigid body. We have only deal withthe third case of velocity.
Experimental Results.
Displacement is recorded at one end of the sample whereas load carried by structure is at theother end. The pattern of failed sample and the load displacement curve are shown in Fig 4and Fig 5. The scheme of Fig 4 shows that damage occurs only in a localised zone behindinitial cutting.
Fig. 4: Failed sample with localised damage zone
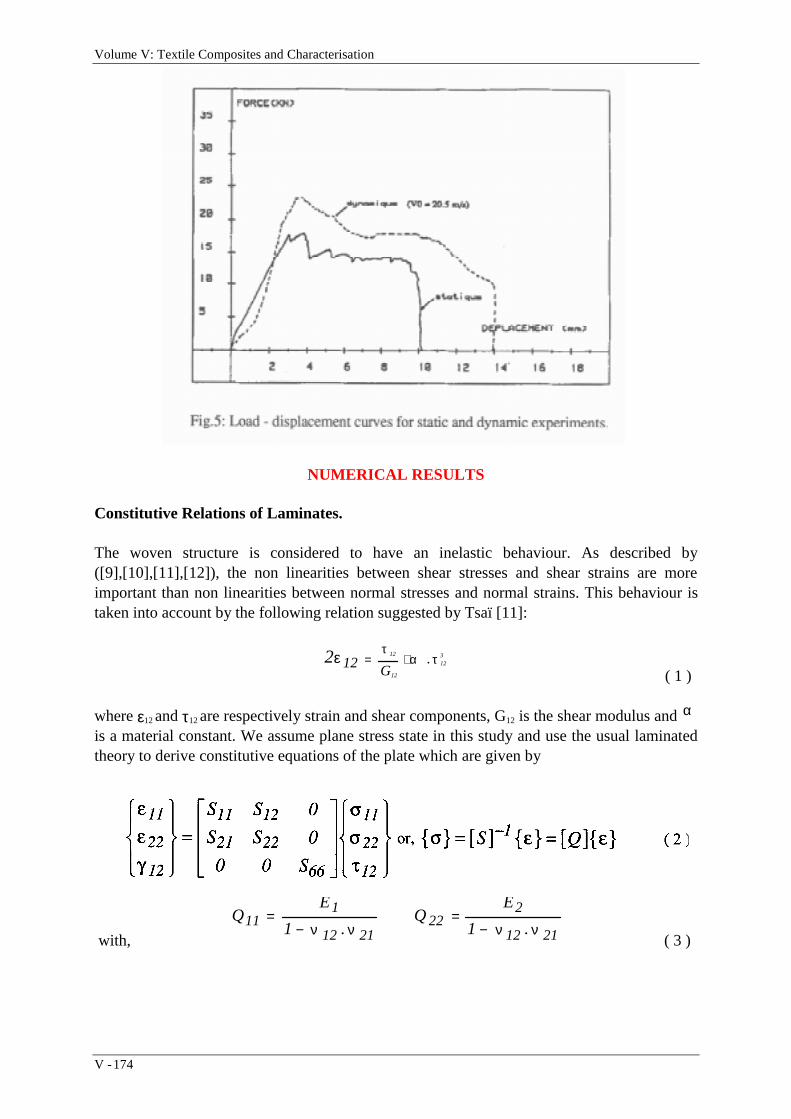
Volume V: Textile Composites and Characterisation
V - 174
NUMERICAL RESULTS
Constitutive Relations of Laminates.
The woven structure is considered to have an inelastic behaviour. As described by([9],[10],[11],[12]), the non linearities between shear stresses and shear strains are moreimportant than non linearities between normal stresses and normal strains. This behaviour istaken into account by the following relation suggested by Tsaï [11]:
2 ε 12 = 12τ
12G + α . 12
3 τ ( 1 )
where ε12 and τ12 are respectively strain and shear components, G12 is the shear modulus and α
is a material constant. We assume plane stress state in this study and use the usual laminatedtheory to derive constitutive equations of the plate which are given by
with,
Q 11 = E 1
1 − ν 12 . ν 21Q 22 =
E 2
1 − ν 12 . ν 21 ( 3 )

Proceedings of ICCM–11, Gold Coast, Australia, 14th-18th July 1997
V - 175
Q 12 = E 1 . ν 21
1 − ν 12 . ν 21
= E 2 . ν 12
1 − ν 12 . ν 21
= Q 21, Q 66 = G 6
( 4 )thus:
Chang's degradation rules are used to take into account progressive failure in composites.
Finite element model and numerical results with Chang's model.
The finite element discretization uses Belytschho [13] shell elements. Several computationswere done and the results on the mesh size have shown that the optimum number of shellswas about 480. Numerical results with Chang's damage rules are given on Fig 6:

Volume V: Textile Composites and Characterisation
V - 176
The load curve versus displacement shows pic values which are similar to experimental
results, but maxima values of stresses are too high and energy absorbeb is not completely
described.
A new theory of damage and post failure in woven composites.
Since Chang criterion tends to overload the strength of the woven composite in the case ofdynamic loading and to undervalue energy absorption, we have implemented in LS-DYNA3Dsoftware [7], a maximum stress limit and new post degradation rules which are based on thehypothesis that the failure of fibers in tensile is the predominant mode of failure. The loss ofwoven stiffness in filler and stuffer weavers is governed by two different parameters ac and at.The usual constitutive relations
are replaced by the new law:
Numerical results are now closely connected with experimental data (Fig.8). Let us tell thatour results are here given without any filter. We can therefore state that post failure behaviourof woven composite structures can be numerically taken into account in the treatment of crashresponse of energy absorption components.

Proceedings of ICCM–11, Gold Coast, Australia, 14th-18th July 1997
V - 177
CONCLUSION
Behaviour up to failure in woven composites subjected to high dynamic tensile can be wellmodelled by a modified Chang's progressive damage theory. Numerical results concerning anhybrid woven composites (glass - kevlar - epoxy) are in good agreement with experimentaldata. The post-failure behaviour of composite structures can be numerically obtained by usingfinite element method. Numerical solutions can be taken into account in the treatment of crashresponse of energy absorption components.
REFERENCES
1. Chang, F. K., K.Y.Chang, A Progressive Damage Model for Laminated compositesContaining Stress Concentrations,Journal of Composite.Materials., Vol 21, 1987, pp. 834-855.
2. Chang, F. K., R. A. Scott, G. S. Springer, Failure Strength of Nonlinearly ElasticComposite Containing a Pin Loaded Hole,Journal of Composite.Materials., Vol 18, 1984,pp. 464-477.

Volume V: Textile Composites and Characterisation
V - 178
3. Chang, F. K., Post-Failure Analysis of Bolted Composite Joints in Tension or Shear-outMode Failure, Journal of Composite.Materials., Vol 21, 1987, pp. 809-833.
4. Farley, G. L., The effects of Crushing Speed on the Energy-Absorption capability ofComposite Tubes, Journal of Composite.Materials., Vol 26, 1992, pp. 1314-1329.
5. Farley, G. L., Relationship between Mehanical - Property and Energy Absorption Trendsfor Composite Tubes, NASA Report, L- 17087, 1992.
6. Kindervater, G. L., Composite Strength and Energy Absorption as an Aspect of StructuralCrash Resistance, In Structural Crashworthiness and Failure, ed. N. Jones, T.Wierzbicki, Elsevier, 1993, pp. 189-235.
7. Hallquist, J. O., DYNA3D User's Manual ( Non Linear Dynamic Analysis of Structures inthree Dimensions ), Lawrence National Laboratory, 1992.
8. Zeitouni, R., Contribution à l'étude de l'Absorption d'énergie par Mécanisme de Déchiruredes Matériaux Composites, E.C.N., Ph D Thesis, 1992.
9. Hahn, H. T., Nonlinear Behavior of Laminated Composites, Journal of CompositeMaterials., Vol 7, 1973, pp. 257-271.
10. Sims, F. D., Nonlinear Elastic Behavior of Unidirectional Composite Laminae, Journal ofComposite Materials., Vol 7, 1973, pp. 103-108.
11. Tsai, S. W., Hahn, T. H., Nonlinear Elastic Behavior of Unidirectional CompositesLaminated, Journal of Composite.Materials., Vol 7, 1973, pp. 102-118.
12. Yamada, S. E., Analysis of Laminate Strength and its Distribution, Journal ofComposite.Materials., Vol 12, 1978, pp. 275-284.
13. Belytschko, T. W., Chiang, H. Y., Improvements in Low-order Shell Elements forExplicit Transient Analysis, Analytical and Computational Models of Shells, A. K. Noorand Belytschko, T. W., ASME - CED, 3 , pp. 383-398 ( 1989 ).
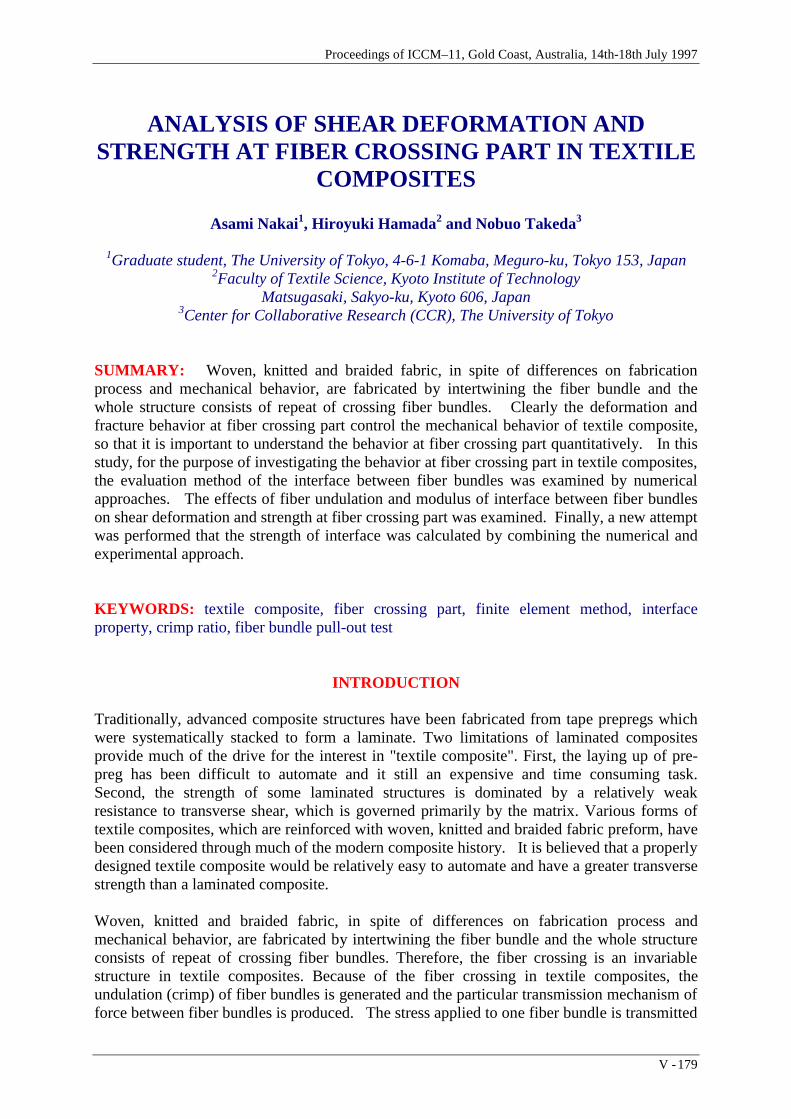
Proceedings of ICCM–11, Gold Coast, Australia, 14th-18th July 1997
V - 179
ANALYSIS OF SHEAR DEFORMATION ANDSTRENGTH AT FIBER CROSSING PART IN TEXTILE
COMPOSITES
Asami Nakai1, Hiroyuki Hamada2 and Nobuo Takeda3
1Graduate student, The University of Tokyo, 4-6-1 Komaba, Meguro-ku, Tokyo 153, Japan2Faculty of Textile Science, Kyoto Institute of Technology
Matsugasaki, Sakyo-ku, Kyoto 606, Japan3Center for Collaborative Research (CCR), The University of Tokyo
SUMMARY: Woven, knitted and braided fabric, in spite of differences on fabricationprocess and mechanical behavior, are fabricated by intertwining the fiber bundle and thewhole structure consists of repeat of crossing fiber bundles. Clearly the deformation andfracture behavior at fiber crossing part control the mechanical behavior of textile composite,so that it is important to understand the behavior at fiber crossing part quantitatively. In thisstudy, for the purpose of investigating the behavior at fiber crossing part in textile composites,the evaluation method of the interface between fiber bundles was examined by numericalapproaches. The effects of fiber undulation and modulus of interface between fiber bundleson shear deformation and strength at fiber crossing part was examined. Finally, a new attemptwas performed that the strength of interface was calculated by combining the numerical andexperimental approach.
KEYWORDS: textile composite, fiber crossing part, finite element method, interfaceproperty, crimp ratio, fiber bundle pull-out test
INTRODUCTION
Traditionally, advanced composite structures have been fabricated from tape prepregs whichwere systematically stacked to form a laminate. Two limitations of laminated compositesprovide much of the drive for the interest in "textile composite". First, the laying up of pre-preg has been difficult to automate and it still an expensive and time consuming task.Second, the strength of some laminated structures is dominated by a relatively weakresistance to transverse shear, which is governed primarily by the matrix. Various forms oftextile composites, which are reinforced with woven, knitted and braided fabric preform, havebeen considered through much of the modern composite history. It is believed that a properlydesigned textile composite would be relatively easy to automate and have a greater transversestrength than a laminated composite.
Woven, knitted and braided fabric, in spite of differences on fabrication process andmechanical behavior, are fabricated by intertwining the fiber bundle and the whole structureconsists of repeat of crossing fiber bundles. Therefore, the fiber crossing is an invariablestructure in textile composites. Because of the fiber crossing in textile composites, theundulation (crimp) of fiber bundles is generated and the particular transmission mechanism offorce between fiber bundles is produced. The stress applied to one fiber bundle is transmitted

Volume V: Textile Composites and Characterisation
V - 180
to another fiber bundle at the fiber crossing part. The deformation and fracture behavior atfiber crossing part control the mechanical behavior of textile composites, so that it isimportant to understand the behavior at fiber crossing part quantitatively. However, thearchitecture of a textile fabric in textile composite is complex and, therefore, the parameterscontrolling the behavior at fiber crossing part become numerous. Moreover, the behavior atfiber crossing part is dependent on the properties of interface between fiber and matrix.
Hamada et al have proposed a evaluation method of the interface between fiber bundles inwoven fabric composite experimentally [1]. In the special experimental method, the shearstrength of interface between warp fiber strand and weft fiber strand in a plain woven fabricwith different concentration of silane coupling agents was obtained.
In this study, for the purpose of investigating the deformation and fracture behavior at fibercrossing part in textile composites, the evaluation method of the interface between fiberbundles was examined by numerical approaches. Firstly, the concept of modeling andnumerical analysis model for textile composite is proposed. Second, the evaluation methodproposed by Hamada et al. [1] was introduced as a background. The numerical analysismodel was applied to the evaluation method. In this paper, the effects of fiber undulation andmodulus of interface between fiber bundles on shear deformation and strength at fibercrossing part was examined. Finally, a new attempt was performed that the strength ofinterface was calculated by combining the numerical and experimental approach.
MODELING FOR TEXTILE COMPOSITES
In the case of textile composites, fiber orientation angle, crimp, continuity of fiber and stresstransmission system between fibers greatly affect the mechanical behavior. So, the analyticalmodel has to represent the weaving structure faithfully. Moreover, various range of fracturesfrom microscopic fracture to macroscopic fracture in the composite have to be considered. Itmight be difficult to represent all ranges of fracture in a single model. In conformity with theconcept, we have established an unified method from micro model to macro model [2-4].Figure 1 shows the five modeling steps for simulating the mechanical behaviors of the braidedcomposite precisely. Basically, results obtained from micro models are used in the analysesof macro models. According to this system, macroscopic analysis can be performedconsidering microscopic phenomena. Hereafter, specific characteristics of each model aredescribed.
"Fiber bundle model" represents the fiber bundle impregnated with resin. This model doesnot consider the undulation of fiber bundle, although micro fracture in the fiber bundle can beconsidered by using the model. This model might consider micro phenomena such as theeffects of surface treatment, filament diameter and number of filaments.

Proceedings of ICCM–11, Gold Coast, Australia, 14th-18th July 1997
V - 181
"Cross part model" represents the cross part between fiber bundles to consider the effects ofthe contact between undulated fiber bundles and interface between fiber and matrix. Thismodel might consider the cross sectional shape of fiber bundle, weaving structure andinterfacial properties at the cross part between fiber bundles.
"Weaving structural model" represents the weaving structure to consider its effect on themechanical behavior of braided composites. The braided composites are recognized as anaggregation of the resin impregnated fiber bundle and resin region. The weaving structure ofthe braided composites is expressed as connections to beam elements. Resin existingbetween crossing fiber bundles is set by using beam element because of consideringtransmission of force at crossing point between the fiber bundles and the material constants of

Volume V: Textile Composites and Characterisation
V - 182
the resin element will be obtained by analysis of "Cross part model". The resin elements arealso set up in both surfaces of textile composite since the resin exists at surface of the textilecomposite except for between crossing fiber bundles.
"Basic structural model" represents the basic braided composite such as flat or tubular braidedcomposite. The mechanical behavior of the basic braided composites can be predicted byusing the numerical results of the weaving structural models as material constants and failurecriteria. Finally "Structural model" represents the whole structure of braided composite.Numerical results of the weaving structural models or basic structural model, can be used asmaterial constants of each element in the structural model. This analytical method can beapplied to predict the various mechanical properties of braided composite, by selecting andcombining these models according to the analytical objects.
BACKGROUND - FIBER BUNDLE PULL-OUT TEST -
Hamada et al have proposed a new evaluation method of the interface between fiber bundlesin textile composites, called “Fiber bundle pull-out test” [1]. Through the fiber bundle pull-out test, the shear strength at fiber crossing part in textile composites should be obtained.
The schematic diagram of the specimen for fiber bundle pull-out test is shown in Fig.2(a).Figure 2(b) shows the magnification of warp/weft fiber crossing part. In order to cause thepull-out of warp fiber strand at the fiber crossing part, notches are introduced as shown inFig.2. Moreover, to apply the shear force only to the fiber crossing part, a plate made byepoxy resin is placed on the both sides of fiber crossing part as shown in Fig.2(a). Thegeometry of the specimen was decided by finite element analysis in consideration of the stresscomponents at fiber crossing part.

Proceedings of ICCM–11, Gold Coast, Australia, 14th-18th July 1997
V - 183
Figure 3 shows the fracture process of fiber crossing part in fiber bundle pull-out test.Applying a load to the specimen, initial crack was occurred in the vertical direction to the loadas shown in Fig.3. As the displacement increased, the delamination of fiber bundleprogressed from the initial crack, and then the pull-out of warp fiber strand was observed.The fracture progress was independent of the concentration of silane coupling agents on aplain woven fabric. The strength of fiber crossing part was obtained by dividing the load atwhich initial crack occurred by the area of fiber crossing part.
ANALYTICAL MODEL AND METHOD
In order to clarify the effects of fiber undulation and modulus of interface between fiberbundles on the shear deformation and strength at fiber crossing part, numerical analysis wasperformed by finite element method. Cross part model which represent the fiber crossingpart was employed to consider the contact between undulated fiber bundles and the interfaceproperties.
Figure 4 shows the finite element division for a fiber bundle pull-out test specimen and theboundary condition. The load was applied to one side of warp fiber strand as shown in Fig.4.In this study, three types of FE model with different crimp ratio were chosen. Crimp ratio isa unique characteristic in textile fabric which represent the degree of the fiber undulation andclearly the crimp ratio affects the mechanical behavior of textile composites. The FE modelwas composed of warp fiber strand, weft fiber strand, resin and interface elements. Twodimensional plain strain element was used in all elements. The material constants used in themodel are shown in Table 1. The material constants of the fiber elements were calculated byRule of Mixture since the fiber bundle was impregnated with the resin. The resin elementspossess the properties of an epoxy resin. However, the material constants of the interfaceelements are unknown, because this relates to the interfacial properties between the fiber andmatrix. Therefore, the elastic modulus of interface were changed on the basis of resinproperty, 1/10, 1 and 5 times as shown in Table 1. After all, nine kinds of analytical modelwith different crimp ratios and moduli of interface were examined as shown in Table 2.Hereinafter, abbreviated names in Table 2 is employed to express each model.

Volume V: Textile Composites and Characterisation
V - 184

Proceedings of ICCM–11, Gold Coast, Australia, 14th-18th July 1997
V - 185
RESULTS AND DISCUSSIONS
Figure 5 shows the deformation states of the MM model and ML model. In the case of themodel with lower elastic modulus of interface than resin, the transmission of the strain ofwarp fiber strand through interface was smaller and the deformation of resin became smallerthan that in the case of the model with higher elastic modulus of interface. The tendency wasindependent of the crimp ratio of the model.
Second, initial fracture stress of the each model was investigated. Upon investigation ofstress distribution on each element, clearly the initial fracture occurred at interface element.Figure 6 shows the initial fracture position at interface elements. The initial fracture positionwas changed with the crimp ratio and the modulus of interface elements. Figure 7 shows therelation between the normalized maximum stress at the interface and modulus of interface oneach model with different crimp ratios. In this figure, the calculated maximum (von Misses)stress at the interface was normalized by dividing the applied stress to the warp fiber strand ateach model. The normalized stress was also changed with the crimp ratio and the modulus of

Volume V: Textile Composites and Characterisation
V - 186
interface elements. The maximum stress at the interface increased with increase either crimpratio or modulus of interface.

Proceedings of ICCM–11, Gold Coast, Australia, 14th-18th July 1997
V - 187
Finally, a new attempt was performed that the strength of interface was calculated bycombining the numerical and experimental approaches. From the above numerical approach,the relation between the applied stress to the warp fiber strand and the calculated stress at theinterface could be clarified. On the one hand, the shear strength of fiber crossing part couldbe obtained by experimental approach. In conjunction with the shear stress at which initialfracture occurred in experiments and the applied stress to the warp fiber strand in analysis, thestress calculated at the interface when the initial fracture occurred was obtained. This stress,indeed, is the strength of the interface.
The shear strength of fiber crossing part obtained by experiments with different concentrationof silane coupling agents was ranging from 11.5 to 21.1 MPa. By using the strength, thestrength of the interface was calculated with each model. Figure 8 shows the relationbetween modulus of interface and calculated strength of interface. In this case, since thecrimp ratio and modulus of interface were unknown quantities, the strength could not bespecified but the range of reasonable modulus and strength of interface could be clarified.Within the range, a proper combination of the modulus and strength should be fixed accordingto each interfacial treatment on fiber strand.
CONCLUSIONS
In this study, in order to study the deformation and fracture behavior at fiber crossing part intextile composites, an evaluation method of the interface between fiber bundles was examinedby numerical approaches. The concept of modeling and numerical analysis model for textilecomposite was proposed and applied to fiber bundle pull-out test. The effects of crimp ratioand modulus of interface between fiber bundles on shear deformation and the stress at fibercrossing part was clarified. Finally, the strength of interface was calculated in conjunctionwith the shear stress at which initial fracture occurred in experiments and the applied stress tothe warp finer strand in analysis. The introduced analytical model should be useful forinvestigation of the behavior at fiber crossing part in textile composites and further thedetermination the material constants of interface.

Volume V: Textile Composites and Characterisation
V - 188
REFERENCES
1. Hamada, H., Kotaki, M., Kadomoto, S., Harada, T., “Evaluation of interfacial propertiesof intersection part between warp and weft fibers in glass woven fabric composites”,Proc. of Annual meeting in Kansai section of JSME (Japan Society of MechanicalEngineers), 1996.21-22 March, pp.348-349 (in Japanese).
2. Hamada, H., Nakai, A., Fujita, A., Maekawa, Z., Yokoyama, A. and Uozumi, T., “CAEin Integrated Braided Composite”, Journal of Science and Engineering of CompositeMaterials, Vol.4, No.2, 1995, pp.109-120.
3. Nakai, A., Fujita, A., Yokoyama, A. and Hamada, H., “Design Methodology for aBraided Cylinder”, Composite Structures, Vol.32, 1995, pp.501-509.
4. Nakai, A. and Hamada, H., “Bending Properties of Multi-layered Braided CompositeTube”, Journal of Science and Engineering of Composite Materials, (in submitting).

Proceedings of ICCM–11, Gold Coast, Australia, 14th-18th July 1997
V - 189
CLOSED FORM PREDICTIONS OF MACROSCOPICTHERMOMECHANICAL PROPERTIES OF
ORTHOGONAL 3-D WOVEN FABRIC COMPOSITES
Takashi Ishikawa 1, Naoyuki Watanabe2, Kazuhiro Bansaku3 and Yoshinobu Ono2
1 Section Head, Airframe Division, National Aerospace Laboratory6-13-1 Ohsawa, Mitaka, Tokyo 181,JAPAN
2 Aerospace and Systems Dept., Tokyo Metropolitan Institute of Technology6-6 Asahigaoka, Hino-shi, Tokyo 191, JAPAN
3 Research Center for Advanced Science and Technology, Tokyo University4-6-1 Komaba, Meguro-Ku, Tokyo 153, JAPAN
SUMMARY: A simple mechanical model for describing elastic moduli and coefficients ofthermal expansion of composites using orthogonal 3-D woven fabric reinforcement isproposed in the present work based on the constituent material properties. The theoreticalprocedure consists of two phases: the first phase is a property description of unidirectionalcomposites as the element of 3-D fabric composites and the second is a description of thewhole. Although the emphasis is placed on the second phase, simple but expedient closedform formulae are also developed for predicting ET and GLT. The second phase is constructedby combination of parallel and serial linkage of the UD composite blocks. The predictedelastic modulus, in-plane shear modulus and coefficient of thermal expansion of Tyranno
/epoxy 3-D composite system were compared with experimental results and numerical resultsobtained from homogenization finite element analysis. An agreement between them arebasically excellent. A simple method to predict elastic and thermal expansion behavior of 3-D composites is established.
KEYWORDS: mechanical modeling, serial and parallel linkage, elastic modulus, coefficientof thermal expansion, experiments, homogenization finite element
INTRODUCTION
Three dimensional woven fabric composites have attracted an engineering interest ofcomposite community in recent years. They can provide higher translaminar properties, andimply a potential of low-cost processing of polymer composite structures. Another role of 3-D fabric composites is a reinforcement of ceramic matrix composites (CMC) includingcarbon/carbon materials. In these composites, because matrices are brittle, functions oftranslaminar (z) yarns are enhanced. However, such z yarns make gaps between load carryingin-plane (x and y) yarns and deteriorates in-plane mechanical properties. According to thisbackground, simple prediction formulae of mechanical properties of 3-D woven compositesare needed more strongly than before in order to establish a quick loop of optimization inmaterial design. Literature survey revealed that no simple closed form formulae had not beenproposed yet for description of elastic moduli and coefficients of thermal expansion (CTE) of

Volume V: Textile Composites and Characterisation
V - 190
3-D woven composites although some pioneering research work (e.g.: Ref.. 1, 2, 3 and 4) hadbeen conducted.
The purpose of the present paper is first to establish a simple mechanical modeling fordescription of thermomechanical behavior of orthogonal 3-D fabric composites, and secondlyto provide simple full closed form equations for predicting the above-mentioned constantsbased on the established model. In order to comprehend the structure of the problem at aglance, Table 1 is provided here. Required baseline inputs are constituent material propertiesof 3-D composites, i. e., Young’s moduli, Poisson’s ratios, coefficients of thermal expansion(CTE) of fiber and matrix, fiber volume fraction, and geometrical parameters of 3-D fabrics.Theoretical procedures are divided into two phases; the first phase consists of a prediction ofproperties of unidirectional (UD) composites as a component of a unit cell of 3-D fabric, andthe second phase consists of a prediction of 3-D fabric composite properties based on theestablished model. For the first phase, a simple and useful closed formula based on a similarmechanical concept to the second phase isproposed, which is another focal point ofthe present paper. A reliability of thisformula was checked by using previoussemi-numerical method5) developed by oneof the author (TI). The second phaseprocedures are constructed bycombinations of parallel and serial linkageof the constituent blocks.
The calculated results through closed formpaths were compared with numericalresults by homogenization finite elementanalysis (HFEA). They were alsocompared with the correspondingexperimental results for Tyranno/Epoxy3-D fabric composites. Agreements of theclosed form results with HFEA results andexperimental values will be shown to bevery good in general.
PREDICTION OF MECHANICAL PROPERTIES FOR UD COMPOSITES
This sort of problems were concern of the early time composite mechanics research andhundreds of papers were published, which were reviewed in, e.g., Ref.6. Of course, there isno problem to predict longitudinal modulus and CTE, EL and αL , and major Poisson’s ratio,
νL. Transverse properties like modulus and CTE, ET , νTT and αT , and longitudinal shearmodulus GLT were considered to be difficult at first. After cumulative research work,composite community regards these problems as almost solved until some time in 1970’sexcept for the corresponding part to random fiber packing. Some famous formulae likeHalpin & Tsai7) are quoted in student textbooks. However, it should still be noted that manyof those formulae require some semi-empirical factors like contiguity, C. This sort of factorsalways cause an ambiguity at application. One of the authors (TI) also proposed a semi-numerical method5) based on a combination of Fourier expansion of stress functions and pointcollocation. Its results could be regarded as very close to the exact solution because of an
Table 1 Explanation for Construction ofthe Theoretical Procedure
3KDVHIRU3UHGLFWLRQRI8'&RPSRVLWHV5HTXLUHG 'DWD (I νI *I αI (P νP *P αP
)LEHU 9ROXPH )UDFWLRQ LQ 8' 9)X0HWKRGV &ORVHG )RUP )RUPXOD LQ 6HF RU 5HI
2XWSXWV (/ (7 ν/ */7 *77 ν77 α/ α7
3KDVHIRU3UHGLFWLRQRI')DEULF&RPSRVLWHV0RGHO &RQFHSW DQG *HRPHWU\ RI ' )DEULF &RPSRVLWHV5HTXLUHG 'DWD DERYH RXWSXWV DQG :LGWK RI <DUQ E7
E)0HWKRGV 7ZR $SSUR[ )RUPXODH 36$ 63$ LQ 6HF
2XWSXWV (; *;< α; IRU 36$ VROXWLRQ HWF

Proceedings of ICCM–11, Gold Coast, Australia, 14th-18th July 1997
V - 191
excellent agreement with preceding numerical analysis and because some mathematicalconditions about symmetry were satisfied. One disadvantage of this method was that noclosed form expression was obtained. Thus, there remain a necessity for the simplest closed-form formula for predicting particularly ET and GLT. However, an expediency will beimposed as a penalty of the simplicity.
A sectional geometry of the conceived model at this phase is shown in Fig. 2. According toRef.5, the hexagonal fiber packing is selected here. One bold simplification introduced hereis to employ the hexagonal fiber section. This assumption makes the solution very simple.Note that fiber volume fraction in UD(Vfu) is given by (a/b)2. Let us consider the case where1/2< b/a<1 corresponding to Vfu over 25% and where 0<T1 /b<1-a/b, in the left region. It isassumed that the model is subjected to the tensile force in the T2 direction and that so-calledmechanics of materials approach is adopted after early References of 8 and 9. If the model iscut along the force direction with a width of dT1 and the force uniformity is assumed, then themodulus in the T2 direction is obtained as follows using the position of fiber edge F(T1) :
ET2 = Ef Em / Em F(T1)/√ 3 b + Ef (1 - F(T1) /√ 3 b) (1)
Because the fiber edge is a slant straight line, Equation 1 can be modified into the followingform:
ET2 = Ef Em / Em (2a/3b - T1/3b) + Ef ( 1 - 2a/3b + T1/3b) (2)
In the region where 1-a/b<T1 /b<1/2, one expedient assumption is introduced. Although the
true distance of two fibers is 4(a-b)/ √ 3 , it is assumed to be half in order to account stressconcentration. If we admit this assumption, ET2 becomes constants in this region as follows:
ET2 = Ef Em /Em (1/3 + 2a/3b) + Ef ( 2/3 - 2a/3b) (3)
If we do not introduce such an expediency, the results are always smaller than the calculatedresults by the method of Ref.5. In other words, the above distance reduction is considered tobe one empirical parameter by which the results can be adjusted to fit the exact solutions. Theaveraged ET2 , namely aimed value of ET, can be obtained by integrating these equations inthe T1 direction and divided by b/2, leading to the following natural logarithmic function :
ET = 6 Ef Em /(Ef - Em ) ∝ n [(Ef - Em)(1 - a/b) /3Ef - 2a/b(Ef - Em) + 1 ] +3 Ef Em (2a/b - 1) / Em (1 + 2a/b) + 2Ef ( 1 - a/b) (4)
The second expedient compromise have to be introduced next: The distance reduction trulymeans an increase of fiber area, which is written in the following form of Vfu change:
dVfu = 4/3 (1- a/b)(1-1/2/(a/b)) (5)

Volume V: Textile Composites and Characterisation
V - 192
Fig. 1: Model for UD Prediction Phase
0
5
10
15
20
25
30
35
30 40 50 60 70 80
Exact for T/EpClosed Form for T/EpExact for Gl/EpClosed Form for Gl/EpExact for C/EpClosed Form for C/Ep
Fiber Volume Fraction (Vfu %)
T/Ep
Gl/Ep
C/Ep
Fig. 2: Comparison in predictions of ET in unidirectional composite phase

Proceedings of ICCM–11, Gold Coast, Australia, 14th-18th July 1997
V - 193
However, this Vfu change should be neglected, in other words, the initial Vfu = (a/b)2 isassumed to be maintained. Otherwise, the results do not coincide with the exact solutioncurves. According to these strong assumptions, the present solution is regarded as expedient.
The calculated curves based on Eq. 4 are shown in Fig.2 for three cases of composite,Tyranno/Epoxy, glass/epoxy and carbon/epoxy. As it is well known, former two fibers areisotropic and the last is anisotropic. For carbon/epoxy case, Ef is assumed as EfT = κ EfL
where κ is an anisotropic factor of carbon fiber and where EfL is a longitudinal modulus ofcarbon fiber.
The used material values are : Ef = 185GPa for Tyranno, Ef = 68.6GPa for glass and EfL =
187GPa and κ = 0.084 for carbon fibers. For isotropic fibers, agreements of the presentresults with exact solutions are fairly good particularly in practical Vfu regions. Forcarbon/epoxy, an agreement becomes slightly worse. Although a description is omitted here,similar equations for GLT and calculated results were obtained. Comparison indicates that theprediction by the closed formula is getting worse than ET. However, it could be still used ifwe consider the fact that the hexagonal array provides slightly lower prediction than realityfor UD composites due to random fiber packing. Thus, the present formulae are correlatedwith exact solutions with confidence. We can use them in 45 to 65% Vfu if we admit a few
percent errors. To meet a need in the next section, ET of Tyranno/ Epoxy with Vfu = 59.7%,and above material values was determined as 14.1GPa, where exact solution provides13.9GPa. EL and νL were obtained as 112 GPa and 0.26 upon νm=0.38 and νf = 0.2.
PREDICTION OF MECHANICAL PROPERTIES FOR 3-D FABRIC COMPOSITES
Let us proceed into the aimed phase, prediction of mechanical properties of orthogonal 3-Dfabric composites. The first step is to establish a mechanical model. Figure 1 depicts thegeometry of the model constructed upon micro-observation of an actual composite piece.The model is based on a possible repeating unit cell. Transparent volume denotes regionsfilled with pure matrix materials. Other regions consist of unidirectional (UD) compositebricks, namely 12 elements in total. Thickness, ht, and width of yarns, bF , of fill and warpare assumed to be identical in this model. Width of translaminar (z) yarns is denoted by bT.Thus, a relationship between local volume fraction in UDC, Vfu, and total volume fraction of3-D composites, VfT, can be written as follows considering pure matrix regions:
VfT = Vfu (bF + bT) bF + bT2 /2 / (bF + bT )2 (6)
Actual values of bF and bT for the present SCL type orthogonal Tyranno/Epoxy weremeasured to be 1.043 and 0.5153 mm respectively. Then, the factor for Vfuwould be 0.724.
The same epoxy resin with Em = 3.43GPa and νm=0.38 as UDC, Epicote 828, is used. Asstated in the previous section, baseline UDC material properties were already obtained.

Volume V: Textile Composites and Characterisation
V - 194
Fig.3: Schematic of the mechanical modeling
It is assumed that voids which are inevitable factor in ceramic matrix composites exist onlyin pure matrix regions. However, since this paper treats only polymer matrix composites, aneffect of voids is neglected according to a sectional observation as void free.
Hereafter, we go into the core of the present procedure, development of closed-form formulaefor 3-D composite phase. The first one is referred to as the Parallel-Serial approach (PSA)where the parallel volume average of rule of mixture (ROM) type is conducted first and thenserial average of Reuss type is conducted. The first ROM style average in regions with labelE gives:
Ex(E) = bT ET + (EL + Em ) bF /2 / (bF + bT ) where suffix x denotes the x direction. (7)
In the regions AF, BF, CF, and DF, and also AG, BG, CG, and DG, the same procedure gives:
Ex(F) = (bF + bT )ET + bFEL + bT Em /2(bF + bT ) (8)
Ex(G) = bFEL + (bF + 2bT ) Em / 2(bF + bT ) (9)
By connecting these three moduli in Reuss estimate style, we have an approximate modulus:
Ex1 = 2(bF + bT )/( bT /Ex(E)+2bF /Ex(F)+bT /Ex(G) ) where suffix 1 denotes PSA solution. (10)
The second procedure is referred to as the Serial-Parallel approach (SPA) where the order ofaverage is reversed. For example, serial linkage is counted first in regions with labels A to Das:
Ex(A) = 2(bF + bT ) / bT /ET + (2bF + bT.) / Em , Ex(B) = EL (11)Ex(C) = 2(bF + bT ) /(2bF + bT )/ET + bT /Em , Ex(D) = (bF + bT ) /(bF /ET + bT /Em ) (12)

Proceedings of ICCM–11, Gold Coast, Australia, 14th-18th July 1997
V - 195
Finally, the total average of the modulus in the x-direction, denoted by Ex2, is obtained by
ROM:
Ex2 = ( bT Ex(A) + bF Ex(B) + bT Ex(C) + bF Ex(D) ) / 2(bF + bT ) (13)
Thus, two approximating closed-form formulae are obtained.
In the previous section, only a little discussion about in-plane shear modulus, GLT, was givenand discussion about coefficients of thermal expansion (CTE) was skipped. Becausesolutions for these properties are also key purpose of the present paper, they will be givenbelow only for the PSA case. Equations for in plane shear modulus can be written as followsfor the ROM part:
Gxy(E) = bT GTT + (GLT + Gm ) bF /2 / (bF + bT ) (14)Gxy(F) = (2bF + bT )GLT + bT Gm / 2(bF + bT ) (15)Gxy(G) = bFGLT + (bF + 2bT ) Gm / 2(bF + bT ) (16)
where GTT denotes transverse shear modulus of the constituent UD composite bricks.
Overall averaged in-plane shear modulus by the PSA procedure, Gxy1 , is obtained as:
Gxy1 = 2(bF + bT ) / ( bT /Gxy(E) + 2bF /Gxy(F)+ bT /Gxy(G) ) (17)
For calculating CTE, a concept of a modulus modified ROM average should be introducedinstead of common ROM average in a parallel linkage. The harmonic mean, Reuss estimate,should be substituted by a simple summation of thermal deformation. If we understand thesemodifications, CTE in the x direction can be obtained as follows, for the first parallel linkage:
αx(E) = bT ETαT + (ELαL + Emαm ) bF /2 / bT ET + (EL + Em) bF /2 (18)
αx(F) = (bF + bT ) ETαT + bF ELαL + bT Emαm / (bF + bT) ET + bFEL + bTEm (19)
αx(G) = bFELαL + (bF + 2bT )Emαm / bF EL + (bF + 2bT )Em (20)
Overall averaged CTE in the x direction by PSA procedure, αx1, is obtained as:
αx1 = ( αx(E) bT /2 + αx(F) bF + αx(G) bT /2 ) / (bF + bT ) (21)
Thus, the aimed closed form solutions of Ex, Gxy, and αx are all determined.
Some comments about αT predictions for UD phase should be stated here. Although It is well
known to us that αT is affected by matrix Poisson’s ratio(10,5), equations in the previoussection can not handle such behavior. Thus, one possible and again expedient way is toincorporate a law given in Ref.10 and a similar formula to Eq. 4) in a manner of the averagewhere the true distance between fibers is adopted here. Although a presentation of equationsand results is omitted, such formula provides reasonable αT within a few percent error fromthe solution of Ref.5. So far as checked by a reliable result, such crude formulae could bepractically applied.

Volume V: Textile Composites and Characterisation
V - 196
PREDICTED RESULTS FOR 3-D FABRIC COMPOSITES AND DISCUSSIONS
Figure 4 indicates a comparison between calculated and experimental elastic moduli in the x-direction for Tyranno/Epoxy 3-D fabric composites. The objective solution here is the PSA
20
25
30
35
40
45
50
55
60
25 30 35 40 45 50 55 60
PSA Approx.
HFEA
SPA Approx.
Experiment
Fiber Volume Fraction (Vf: %)
Fig. 4: Relationships between elastic moduli and fiber volume fraction (VfT)
0
1
2
3
4
5
6
7
25 30 35 40 45 50 55 60
PSA Approx.
SPA Approx.
Closed Form
HFEA
Experiment
Fiber Volume Fraction (Vf%)
Fig.5: Relationships between in-plane shear moduli and fiber volume fraction (VfT)

Proceedings of ICCM–11, Gold Coast, Australia, 14th-18th July 1997
V - 197
approximation indicated by a solid curve. Because the baseline UD moduli obtained throughEq.4) and the method of Ref.5 are very close to each other, the current plot is based on theexact solution and an indication of PSA based on Eq.4) is omitted. It can be observed that anagreement between the present PSA solution and the results of homogenization finite elementanalysis is very favorable. They also coincide with the experimental elastic modulus. Notethat a brief description about experimental procedure will be given in the next section. TheSPA approximate solution provides slightly lower values than those from PSA. If weconsider the simplicity of the analysis and predictability, it can be concluded that the presentclosed form solution for prediction of 3-D fabric composites is applicable so long as Ex
concerned.
The results concerning another aimed modulus, Gxy, are shown in Fig.5. A solid lineindicates PSA solution based on the exact UD composite input. A discrepancy from theHFEA solution tends to be greater than the previous Young’s modulus case. In the case of theclosed form formula, one difficulty arises to predict transverse shear modulus, GTT. Forsolving this point, a transverse Poisson’s ratio is assumed to 0.5 and transverse isotropyrelation is utilized. Full closed form solution based on this simplification is indicated by achain curve, where a discrepancy from HFEA becomes much larger than exact-UD/PSAsolution. However, if we consider a simplicity and easy handling, this sort of solution couldbe used for some purpose. It should be noted that the experimental result fall between exact-UD/PSA and HFEA curves, being closer to the latter. Exact-UD/SPA solution provides thelowest prediction among all. So, if we pursue expediency, a combination of closed form UDand SPA might be the best.
Predicted results for coefficient of thermal expansion (CTE) and the experimental value areshown in Fig.6 where HFEA solution has not been obtained yet. As stated earlier, the closedform solution for UDC was the poorest in CTE case, the indicated results are forcombinations of exact-UD and PSA/SPA formulae. Mutual relations between twoapproximations are similar to the previous modulus cases, whereas an agreement betweenPSA and the experimental value is again excellent.
0 100
2 10-6
4 10-6
6 10-6
8 10-6
10 10-6
12 10-6
25 30 35 40 45 50 55 60
PSA Approx.
SPA Approx.
Experiment
Fiber Volume Fraction (Vf : %)
Fig. 6: Relationships between in-plane CTE and fiber volume fraction (VfT)
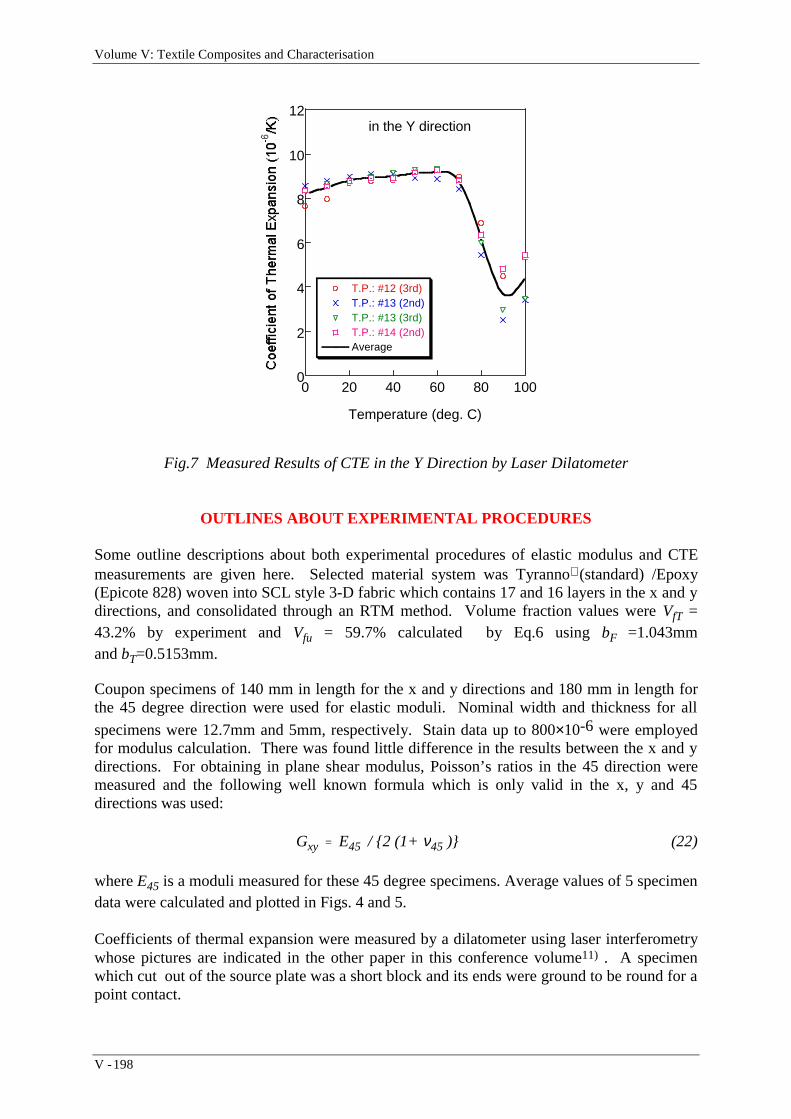
Volume V: Textile Composites and Characterisation
V - 198
0
2
4
6
8
10
12
0 20 40 60 80 100
T.P.: #12 (3rd)T.P.: #13 (2nd)T.P.: #13 (3rd)T.P.: #14 (2nd)Average
Temperature (deg. C)
in the Y direction
Fig.7 Measured Results of CTE in the Y Direction by Laser Dilatometer
OUTLINES ABOUT EXPERIMENTAL PROCEDURES
Some outline descriptions about both experimental procedures of elastic modulus and CTEmeasurements are given here. Selected material system was Tyranno(standard) /Epoxy(Epicote 828) woven into SCL style 3-D fabric which contains 17 and 16 layers in the x and ydirections, and consolidated through an RTM method. Volume fraction values were VfT =43.2% by experiment and Vfu = 59.7% calculated by Eq.6 using bF =1.043mm and bT=0.5153mm.
Coupon specimens of 140 mm in length for the x and y directions and 180 mm in length forthe 45 degree direction were used for elastic moduli. Nominal width and thickness for all
specimens were 12.7mm and 5mm, respectively. Stain data up to 800×10-6 were employedfor modulus calculation. There was found little difference in the results between the x and ydirections. For obtaining in plane shear modulus, Poisson’s ratios in the 45 direction weremeasured and the following well known formula which is only valid in the x, y and 45directions was used:
Gxy = E45 / 2 (1+ ν45 ) (22)
where E45 is a moduli measured for these 45 degree specimens. Average values of 5 specimendata were calculated and plotted in Figs. 4 and 5.
Coefficients of thermal expansion were measured by a dilatometer using laser interferometrywhose pictures are indicated in the other paper in this conference volume11) . A specimenwhich cut out of the source plate was a short block and its ends were ground to be round for apoint contact.

Proceedings of ICCM–11, Gold Coast, Australia, 14th-18th July 1997
V - 199
A typical example of the measured data in the y-direction is shown in Fig.7 where the data forthe second and third measurements are chosen for avoiding hygroscopic effect. An average at25°C was adopted for an indication in Fig.6.
CONCLUSIONS
It can be mentioned that the present closed form solution in the second estimation phase of 3-D fabric composite properties, particularly PSA approach, provides excellent predictions ofin-plane Young’s modulus in spite of its simplicity if the elastic moduli of the constituent UDcomposite are properly estimated. Its reliability is confirmed by agreements withhomogenization finite element predictions and experimentally obtained modulus. In-planeshear modulus by the PSA equation also shows a good agreement with HFEA andexperimental results if the exact UD moduli are available. In the case of coefficient ofthermal expansion, again the PSA solution provides good predictions only if the result of UDprediction phase is reliable. Thus, the main aim of the present paper to develop closed formformulae for predicting 3-D composite thermo-mechanical properties is almost fulfilled withthe PSA solution.
Some imperfection in the first phase, a long-lasting classic problem of UD composite propertyprediction by simple closed formulae, still remains unsolved within this paper. If someexpedient assumptions are allowed, a candidate equation using a logarithmic form of a/b( =Vfu
1/2) is proposed here for a prediction of ET , which gives favorite curves for isotropic fiberPMCs. However, because of its expediency, the same form for GLT leads to higher
estimations and the equation for αT derived based on the same idea provides much smallervalues than exact calculations. Although another compromising formulae are possiblydescribed for these two properties, persuasiveness of the concept will be degraded seriously.Thus, a conclusion about this phase is summarized as follows: A closed form solution for ET
with expedient handling of fiber distance can be formulated and it can predict a favorablevalue under a recognition of its limitation.
A practical goal of this research program is an application of the simple solutions toestimation of the matrix elastic modulus of CMC, which is very hard to measure. Because ofthe length and consistency in the discussion, description of this part is omitted in the presentpaper and Reference 12 should be referred for that purpose.
ACKNOWLEDGEMENT
This work is supported by funding of STA of Japanese Government for establishingtechnologies of Japanese Space Transportation System, HOPE. The authors also wish tothank Mr. Sunao Sugimoto for his assistance in preparation of graphical work.
REFERENCES
1. Yang, J.M., Ma, C.L. and Chou, T.W., “Fiber Inclination Model of Three-DimensionalTextile Structural Composites”, Journal of Composite Materials, Vol.20, No.9, 1986,pp.472-484.

Volume V: Textile Composites and Characterisation
V - 200
2. Whitney, T.J. and Chou, T.W., “Modeling of 3-D Angle Interlock Textile StructuralComposites”, Journal of Composite Materials, Vol.23, No.9, 1989, pp.890-911.
3. Nagai, K., Yokoyama, A., Hamada, A., Maekawa, Z., and Noguchi, Y., “The Study ofAnalytical Method for Three-Dimensional Composite Materials (1st Report: Evaluationof Tensile Elastic Modulus) (in Japanese)”, Journal of Japan Society of MechanicalEngineers, Part A, Vol.58, No.555, 1992, pp.2099-2103.
4. Gu, P. and Mohamad, M., “Structure and Properties of 3-D Woven Carbon/EpoxyComposites”, Proceedings of 9th International Conference on Composite Materials,Madrid, Spain, July 12-16, 1993, Vol. IV.: Composites Design, Miravete, A., Eds.,pp.568-575.
5. Ishikawa, T., Koyama, K., and Kobayashi., S., “Thermal expansion Coefficients ofUnidirectional Composites”, Journal of Composite Materials, Vol.12,No.2, 1978, pp.153-168.
6. Chamis, C.C., and Sendeckyj, G.P., “Critique on Theories Predicting Thermo-ElasticProperties of Fibrous Composites”, Journal of Composite Materials, Vol.2, 1968,pp.332.
7. Halpin, J.C. and Tsai, S.W., “Environmental Factors in Composite Materials Design”,AFML-TR-66-190, Air Force Materials Laboratory, 1966.
8. Greszczuk, L.B., “Theoretical and Experimental Studies on Properties and Behavior ofFilamentary Composites”, Proceedings of 21st SPI Conference, Chicago, Illinois, 1966,Sect.8-A.
9. Uemura, M., and Yamada, N., “Elastic Constants of Carbon Fiber Reinforced PlasticComposites (in Japanese)”, Zairyo (Materials), Journal of Japan Society of Materials,Vol.24, No.257, 1975, pp.156-163.
10. Shapery, R.A., “Thermal Expansion Coefficients of Composite Materials Based onEnergy Principles”, Journal of Composite Materials, Vol.2, 1968, pp.380.
11. Sugimoto, S, and Ishikawa, T., “Calibration of Infrared Stress Measurement Techniquefor CFRP Composites and Its Application”, Proceedings of 11th InternationalConference on Composite Materials, Gold Coast, Australia, July 14-18, 1997, Scott, M.L.,Eds.
12. Ishikawa, T. Bansaku, K., Watanabe, N., Nomura, Y., Shibuya., M., and Hirokawa, T.,“Experimental Stress-Strain Behavior of Si-Ti-C-O Fiber/SiC Matrix Composites andEstimation of Matrix Elastic Modulus”, Composite Science and Technology, in printing.

Proceedings of ICCM–11, Gold Coast, Australia, 14th-18th July 1997
V - 201
THE EFFECTS OF DEFORMING KNITTED GLASSPREFORMS ON THE TENSILE PROPERTIES OF
RESULTANT COMPOSITE LAMINATES
K. H. Leong1, M. Nguyen2 & I. Herszberg2
1Cooperative Research Centre for Advanced Composite Structures Ltd. (CRC-ACS),506 Lorimer Street, Fishermens Bend, VIC 3207, AUSTRALIA.
2The Sir Lawrence Wackett Centre for Aerospace Design and Technology, RMIT,GPO Box 2476V, Melbourne, VIC 3001, AUSTRALIA.
SUMMARY: The effects of deforming knitted fabrics on the tensile properties of theirresultant composites have been evaluated. The properties were studied for both the courseand wale directions for composite laminates with fabrics that had been deformed in either ofthe two directions. It was found that as the amount of deformation in the fabrics wasincreased tensile stiffness and strength of the laminates improved markedly in the directionwhich the knitted fabrics had been deformed. When the laminates were loaded normal to thedirection in which the fabric had been deformed, it was found that deformation in the waleand course directions resulted in improvement and deterioration of tensile properties,respectively. The relative orientation of the fracture planes with respect to the loading axiswas also found to be dependent on the degree of deformation that had been induced in theknitted fabric.
KEYWORDS: knitted preforms, textile composites, tensile properties, deformation, fracturemechanisms
INTRODUCTION
The use of knitting technology with advanced fibres, such as glass, carbon and aramid, toproduce near-net-shape fabrics, or "socks", has in recent years received increasing interestfrom the composite materials community. In conjunction with a suitable liquid mouldingtechnique, such as Resin Transfer Moulding (RTM), the fabrics have the potential to be usedfor production of a wide variety of composite structures with complex shapes [1,2]. Whilstsuch fabrics are obviously advantageous in terms of reducing production cost as a result ofminimum material wastage and reduced labour time, the development of a suitable "sock" fora particular structure is often a time consuming, and hence an expensive task. Therefore,unless such costs are justified, an alternative cheaper method would be to impregnate flatknitted fabrics in a forming tool to obtain the required shape of the component [3].
During the process of forming a flat knitted fabric (e.g. during deep drawing), it is inevitablethat the fabric would be deformed due to stretching so that optimum conformibilty to theshape of the component is achieved. The highly looped fibre architecture of the knitted fabriceasily affords such deformation, and hence its excellent forming characteristics. However, theexercise results in distortion to the knit structure which could result in tearing and/or isolated

Volume V: Textile Composites and Characterisation
V - 202
bunching of the fabric [3]. The distortion would also cause a degree of fibre orientation in thedirection of stretching which, in turn, would affect the mechanical properties of the resultantcomposite [4,5]. In addition, previous investigations carried out on composite materialsmanufactured from knitted glass and carbon fabrics have revealed that the mechanicalproperties of knitted composites are anisotropic [4,6-9], and they are dependent on factorssuch as the number of layers of fabric [4,5,10], stitch density (which is a measure of thetightness of the knit) [7], knit architecture [8] and fibre volume fraction [9-11].
Whilst knitted composites generally have inferior in-plane strength and stiffness comparedwith materials such as woven composites, they are superior in terms of impact resistance andretention of post-impact properties [12], with comparable bearing capabilities [9,12].Consequently, these positive attributes partly account for the increasing effort to develop thistechnology for niche applications [13,14].
In the present study, the effects of deformation of knitted fabrics on the tensile properties ofresultant composites have been investigated for the weft knitted Milano rib fibre architecture.The properties were investigated for both the course and wale directions for composites withfabrics deformed in either of the two directions. This study was also supported byfractographic studies using stereooptical microscopy. It is noteworthy that the researchreported in this paper is an auxiliary part of a larger project that is currently undertaken at theCooperative Research Centre for Advanced Composite Structures Ltd. (CRC-ACS). Theproject involves the development of a more cost-effective technique for producing anon-structural helicopter component which is currently being manufactured using the tapelayup method [3].
EXPERIMENTAL
Materials and Manufacture
The test panels used in this experimental programme were manufactured via RTM and usingup to 7 layers of weft knitted Milano rib fabric (see Figure 1 for loop structure) and Derakane411-C50 vinyl ester resin/Triganox T-239 catalyst/CoNap promoter/2, 4-P inhibitor. A10-gauge, flat bed knitting machine was employed to produced a fabric of nominal arealweight of 730g m-1 (undeformed) using 2 × 68tex multi-filament glass fibre.
Wale
Course
Fig. 1: Schematic diagram of the Milano rib structure.

Proceedings of ICCM–11, Gold Coast, Australia, 14th-18th July 1997
V - 203
A rig, details of which are given elsewhere [15], was developed and built to afford systematicdeformation to the knitted fabrics. In the course direction, the fabrics were deformed to 20%,35% and 45% (maximum achievable) while in the wale direction to 20%, 30% and40% (maximum achievable). Undeformed (0%) fabrics were also considered.
The fibre volume fractions (Vf) of the laminates were maintained fairly constant atapproximately 55% by varying the number of knitted fabric layers to isolate the effect of Vf onstrength. Further, a reasonably uniform resin flow pattern and, hence, quality in terms ofporosity and wetting, between the different laminates could also be maintained. Hence,between 6 and 7 fabric layers were used to produce the laminates. It is noteworthy that earlierstudies [9,14] have established the relative insensitivity of tensile strength and stiffness of theMilano rib structure to the number of fabric layers used in a composite; what is in fact moreimportant is the fibre volume fraction.
Coupon Tests
Straight-sided tensile test specimens of 3mm × 25mm × 210mm nominal dimensions wereused throughout the programme. Tensile tests were conducted using an Instron 50kNscrew-driven mechanical testing machine under displacement control at a nominal rate of0.5mm min-1. A gauge length of 120mm was used leaving 45mm on each end of thespecimens which were gripped in the testing machine. An open weave emerycloth (Screenbak™) was used instead of tabs in the gripped areas of the specimens and thisappeared to be effective in promoting failure to occur within the gauge length of thespecimens. Specimens of both deformed and undeformed fabrics were tested in the wale andcourse directions. No less than 5 specimens were considered for each case.
RESULTS AND DISCUSSION
Introduction
To facilitate the presentation of the results, discussion and conclusions, the followingabbreviations are used in the rest of this paper.
δWW = deformed and tested in the wale direction;δCC = deformed and tested in the course direction;δWC = deformed in the wale direction and tested in the course direction; andδCW = deformed in the course direction and tested in the wale direction;
where δ represents the amount of deformation.
Stress-Strain Behaviour
Figure 2 shows a typical stress-strain curve for the 45CW laminate. It reveals that thelaminate initially exhibited linear behaviour but then transformed to pseudo-plastic in thelatter stages of loading before a maximum stress (defined as the tensile strength) was reached,after which a rather gradual reduction ensued. The transition in linear to non-linear behaviourgenerally corresponded to the onset of matrix cracking. The stress-strain behaviour describedabove was generally observed to be similar for all the specimens, irrespective of the directionand degree of fabric deformation or the relative loading axis of the laminates.

Volume V: Textile Composites and Characterisation
V - 204
0
20
40
60
80
0 0.2 0.4 0.6 0.8 1
Tensile strain (%)
Ten
sile
str
ess
(MP
a)
Fig. 2: Typical stress-strain curve of the knitted composite under study.
Tensile Strength and Stiffness
The fibre content of the different laminates varied between 52% and 57% and therefore, toafford comparison, the experimental results of each set of laminates have been normalised to aconstant Vf of 55% and presented in Figures 3 and 4 for strength and stiffness, respectively.
From Figures 3 and 4, it will be noted that when the fabrics had not been deformed, theresultant composite laminates displayed higher strength and stiffness in the wale than in thecourse direction. Although no systematic measurements have been carried out, it is clearfrom qualitative assessments that the content of fibres oriented in the wale direction is higher,which would account for the better tensile properties along that axis.
As the amount of deformation in the fabrics was increased, the tensile strength and stiffness ofthe laminates improved markedly in the direction which the fabrics had been deformed. It isinteresting to note that this behaviour is consistent with the results of Ha et al. [5] forcomposites derived from deformed and undefomed plain weft knitted carbon fabrics. Thisimprovement in strength and stiffness with the degree of deformation is attributed to anincrease in the content of fibres oriented along the loading axis as the knitted fibres wereincreasingly drawn and straightened in the direction of stretch. The present results also implythat the fibres were not significantly pre-stressed (i.e. the yarns were straightened along thestretch axis but not elongated), if at all, when the fabrics were deformed within the levelsconsidered in this study. If the fibres were significantly pre-stressed, then there would be adeterioration in tensile strength with increased fabric deformation which was not observed. Inaddition, the improvements in tensile properties with increased deformation were revealed tobe considerably more pronounced for strength (40WW = 72.4%; 45CC = 89.9%) than theyare for stiffness (40WW = 17.5%; 45CC = 38.5%). This is not unexpected since a slightmisalignment in fibre orientation from the loading axis (up to ~25°) is known to have a moresignificant influence on strength than on stiffness [16].
When loading normal to the direction of stretch, Ha et al. [5], on plain weft knitted carboncomposite laminates, have shown that tensile properties deteriorated with the degree of
Proceedings of ICCM–11, Gold Coast, Australia, 14th-18th July 1997
V - 205
deformation in the knitted fabric. This degradation in tensile properties is believed to beattributed to a reduction in content of fibres oriented in the course direction as the fabric wasdeformed along the wale, and vice versa. This is consistent with the simultaneous increase inthe content of fibres oriented in the direction of stretch which accounts for the improved WWand CC properties mentioned earlier.
For the laminates considered in the present work, however, loading normal to the direction offabric deformation resulted in an improvement and a deterioration in the WC and CW tensileproperties, respectively. Inspection of fabrics subjected to various amounts deformationsuggests that the opposing trends observed for the WC and CW laminates are due to themanner in which the Milano rib structure changes with deformation in the wale and coursedirections.
(a)
0
20
40
60
80
100
120
140
160
180
200
0 10 20 30 40 50
Degree of deformation (%)
Ten
sile
str
engt
h (M
Pa)
WW
WC
(b)
0
20
40
60
80
100
120
140
160
180
200
0 10 20 30 40 50
Degree of deformation (%)
Ten
sile
str
engt
h (M
Pa)
CW
CC
Fig. 3: The influence of deformation of the knitted fabric on composite strength.

Volume V: Textile Composites and Characterisation
V - 206
(a)
0
5
10
15
20
0 10 20 30 40 50
Degree of deformation (%)
Ten
sile
stif
fnes
s (G
Pa)
WW
WC
(b)
0
5
10
15
20
0 10 20 30 40 50
Degree of deformation (%)
Ten
sile
stif
fnes
s (G
Pa)
CC
CW
Fig. 4: The influence of deformation of the knitted fabric on composite stiffness.
It is clear from Figures 5d and 5e that when the fabric was deformed in the course direction,the individual courses were simply drawn closer together, as would be in a plain weft knitstructure, thus effectively reducing the amount of fibres that contribute to the wale-wiseproperties. Consequently, the tensile properties of the CW laminates deteriorated with theamount of fabric deformation. It is interesting to observe that the "loopy" nature of the knitstructure was increasingly diminished with deformation of the fabric in the course direction.
However, as illustrated in Fugures 5b and 5c, when the fabric was deformed in the waledirection, the "loopy" nature of the knit structure was retained. The legs of the loops (seeFigure 6) not only remained oriented at an angle to the two principal axes, i.e. wale andcourse, so that these fibre components contribute to the tensile properties in both thedirections. The enhancement of strength and stiffness of the WC laminates is in factattributed to the increasing straightening of these fibre components with deformation.

Proceedings of ICCM–11, Gold Coast, Australia, 14th-18th July 1997
V - 207
Close examination of Figure 5 further revealed that the fibres are much straighter in thecourse-deformed fabrics than in the wale-deformed ones, and this is probably the reason forthe steeper rate of increase both in strength (WW = 1.81% per unit stretch; CC = 2.00% perunit stretch) as well as in stiffness (WW = 0.43% per unit stretch; CC = 0.86% per unitstretch) for the former compared with the latter laminates.
(a) Undeformed, As-received (b) Wale-deformed, Light (c) Wale-deformed, Heavy
Wale
Course
(d) Course-deformed, Light (e) Course-deformed, Heavy
Fig. 5. The effects of deformation on the effective fibre architecture of the Milano rib fabric.
(a) (b) (c)
Fig. 6: Components of a weft knitted loop.
Fracture Mechanisms and Failure Modes
Irrespective of the amount of deformation in the fabric, and the relative loading direction, thefirst discernible damage in the specimens was observed to be matrix cracking (see Figure 7),which increased in intensity with loading until final failure of the specimen intercepted. Itwill be noted that this microcracking appeared macroscopically as whitened areas in thespecimens. The locations of the microcracks within the gauge section were initially relativelyrandom, but as loading progressed and more microcracks formed, they appeared to coalescetogether to form regular rows of matrix cracks that span the whole width of thespecimens (see Figure 7). Earlier work by Leong et al. [9] have revealed that the microcracksdo not actually span the whole thickness of the laminates but are arrested by the complexarray of fibres that came about through the intermeshing between the different fabric layers.

Volume V: Textile Composites and Characterisation
V - 208
They also pointed out that the matrix crack spacings were of the order of the distancesbetween the loop components in the fabric (see Figure 6), depending on the loading axis.
(a)
(b)
(c)
Fig. 7: Typical fractured specimens made from (a) undeformed, and(b & c) deformed, fabrics.
In the present work, ultimate failure is defined as the point at which there was an appreciabledrop in the load-carrying capacity of the specimen. In most cases, when this happened, thespecimens were not completely broken whereby the matching fracture surfaces was bridgedby a ligament of fabric material. It is noteworthy that the gradual drop in stress after reachinga maximum, as depicted by the stress-strain curve in Figure 2, suggests that groups of fibreswithin the fracture plane had failed sequentially so that if a test were terminated before all thefibres within the plane had failed a ligament of fabric material would remain. Consistent withthis fracture behaviour, ultimate failure for the knitted composites was not catastrophic. It isbelieved that the appreciable drop in the load-carrying capacity, and hence ultimate failure, ofthe laminates occurred with the onset of gross fibre fracture, i.e. breakage of the first fibrebundles.
The amount of deformation that the fabric had undergone was also observed to have aninfluence on the fracture mode of the resultant composite laminates. By referring to Figure 7,it can be seen that the laminates had failed in one of three modes with respect to the relativeorientation of the fracture plane to the loading axis. More precisely, the specimens ofundeformed (and lightly deformed) fabric failed in a plane normal to the loading axis (seeFigure 7a) whilst the specimens of more heavily deformed fabrics generally failed at anangled plane of approximately 20° to 30° (see Figure 7c). It has been noted that the angles ofthe fracture planes on the whole increased with the amount of deformation of the fabrics. Insome intermediate cases, the specimens failed in a combination of both modes, usuallybeginning at angle and finishing up normal, to the loading axis (see Figure 7b).
Post-failure examination of the fracture surfaces, using an Olympus ZHS stereoopticalmicroscope, confirmed that ultimate failure of the specimens was indeed dictated by thecapacity of the fibres to withstand loading after matrix cracking. As expected the fibre

Proceedings of ICCM–11, Gold Coast, Australia, 14th-18th July 1997
V - 209
breakages occurred in a fashion very similar to that observed by Ramakrishna and Hull [10]for their plain weft knitted carbon samples, whereby the fracture plane coincided with theplane of lowest local fibre content. In other words, wale-tested specimens tended to havefibres breaking at the legs of loops, and course-tested ones at the needle/sinker loops. It willbe noted that, as in the specimens that failed in a plane normal to the loading axis, fibrebreakages in the wale- and course-tested specimens that failed at an angled plane alsooccurred predominantly at legs of loops and needle/sinker loops, respectively. These latterfibre breakages were however not confined to a single row of wale of course but, instead, theyconsistently moved to adjacent rows causing large matrix cracks to form along the way.
CONCLUSIONS
In the present work, the effects of deforming knitted fabrics on the tensile properties of theirresultant composites have been evaluated. The properties were studied for both the courseand wale directions for composite laminates with fabrics that had been deformed in either ofthe two directions. It was revealed that as the amount of deformation in the fabrics wasincreased tensile stiffness and strength of the laminates improved markedly in the directionwhich the knitted fabrics had been deformed. This improvement in strength and stiffness withthe degree of deformation is attributed to an increase in the content of fibres oriented alongthe loading axis as the knitted fibres were increasingly drawn and straightened in the directionof stretch. When the laminates were loaded normal to the direction in which the fabric hadbeen deformed, it was revealed that deformation in the wale and course directions resulted inimprovement and deterioration of tensile properties, respectively. The opposing trendsobserved for the CW and WC laminates is accounted for by a difference in the nature ofdistortion to the Milano rib structure when it is deformed in the two principal directions.
The orientation of fracture planes with respect to the loading axis appeared to be alsodependent on the degree of deformation that had been induced in the knitted fabric.Specimens of undeformed (and lightly deformed) fabric failed in a plane normal to theloading axis whilst the specimens of more heavily deformed fabrics generally failed at anangled plane of approximately 20° to 30° depending on the amount of fabric deformation. Insome intermediate cases, the specimens failed in a combination of both modes, usuallybeginning at angle and finishing up normal, to the loading axis. Nevertheless, irrespective ofthe amount of deformation in the fabric, ultimate failure of the wale- and course-testedspecimens was attributed to fibre breakages occurring predominantly at the legs of loops andneedle/sinker loops, respectively.
ACKNOWLEDGEMENTS
The authors are grateful to P.J. Falzon for useful discussions, and K. Houghton for assistancein specimens preparation.
REFERENCES
1. Epstein M. and Nurmi S. (1991) "Near net shape knitting of fiber glass and carbon forcomposites", (Proc. Conf.) 36th Int. SAMPE Symposium., April 15-18, 1991,pp 102 - 113.
Volume V: Textile Composites and Characterisation
V - 210
2. Raz S. (1994) "Advanced knitted structures for composites : an outlook", (Proc. Conf.)TEXCOMP2 - New textiles for composites, May 17-19, 1994, Leuven, Belgium,Eds. I. Verpoest & F.K. Ko, 20pp.
3. Qi, B., Kruckenberg, T. and Raju, J. (1996) Resin transfer moulding of a non-structuralcomponent using a glass knitted fabric reinforcement, Submitted to Comp. Sci. Tech.
4. Verpoest I. & Dendauw J. (1992) "Mechanical properties of knitted glass fibre/epoxyresin laminates", (Proc. Conf.) 37th Int. SAMPE Symp., March 9-12, 1992, pp 369-377.
5. Ha S-W., Mayer J., De Haan J., Petitmermet M. & Wintermantel E. (1993) "Knittedcarbon fibers reinforced biocompatible thermoplastics, mechanical properties andstructure modelling", (Proc. Conf.) ECCM-6, September 20-24, 1993, Bordeaux, France,eds. A.R. Bunsell, A. Kelly, A. Massiah, pp 637-642.
6. Verpoest I. & Dendauw J. (1993) "Mechanical properties of knitted glass fibre/epoxyresin laminates", (Proc. Conf.) ECCM-6, September 20-24, 1993, Bordeaux, France,eds. A.R. Bunsell, A. Kelly, A. Massiah, pp 927-932.
7. Wu, W.L., Hamada, H., Kotaki, M. & Maekawa, Z. (1995) "Design of knitted fabricreinforced composites", J. Rein. Plast. Comp., 14, 1032.
8. Chou, S., Chen, H.-C. & Lai, C.-C. (1992) "The fatigue properties of weft knitted fabricreinforced epoxy resin composites", Comp. Sci. Tech., 45, 283.
9. Leong, K.H., Falzon, P.J., Bannister, M.K. and Herszberg, I. (1996) "An investigation ofthe mechanical performance of weft knitted Milano rib glass/epoxy composites,Submitted to Comp. Sci. Tech.
10. Ramakrishna, S. & Hull, D. (1994) "Tensile behaviour of knitted carbon-fibre-fabric/epoxy laminates - Part I : Experimental", Comp. Sci Tech., 50, 237.
11. Ramakrishna, S. & Hull, D. (1994) "Tensile behaviour of knitted carbon-fibre-fabric/epoxy laminates - Part II : Prediction of tensile properties", Comp. Sci Tech.,50, 249.
12. Herszberg, I., Falzon, P.J., Leong, K.H. & Bannister, M.K. (1996) "Bearing strength ofglass/epoxy composites manufactured from weft-knitted E-glass fabric",(Proc. Conf.) 1st Australasian Congress on Applied Mechanics, 21-23 February, 1996,Vol. 1, pp. 279-284.
13. Bannister, M.K. and Herszberg, I. (1995) "The manufacture and analysis of compositestructures from knitted preforms", (Proc. Conf.) 4th Int. Conference on AutomatedComposites, 6-7 September 1995, Nottingham, U.K., Vol. 2, pp. 397-404.
14. Herszberg, I., Bannister, M.K., Leong, K.H. & Falzon, P.J. (1996) "Textile compositesresearch at the Cooperative Research Centre for Aerospace Structures Ltd. (CRC-AS)"(Proc. Conf.) TEXCOMP3 - New textiles for composites, December 9-11, 1996, Aachen,Germany, ed. Wulfhorst, B., pp. 3/1-3/20.
15. Nguyen, M. (1996) "Investigation on the mechanical properties of stretched compositepanels", Final Year Project Dissertation, Royal Melbourne Institute of Technology.
16. Hull, D. (1981) "An introduction to composite materials", Cambridge University Press.

Proceedings of ICCM–11, Gold Coast, Australia, 14th-18th July 1997
V - 211
OPTIMISING THE MECHANICAL PROPERTIES OF3D-KNITTED SANDWICH STRUCTURES
Dirk Philips 1, Ignaas Verpoest 2 and Joris Van Raemdonck 3
1,2 Department of Metallurgy and Materials Engineering, KU Leuven,de Croylaan 2, B-3001 Leuven, Belgium
3 IPA, Waaslandlaan 38, B-9160 Lokeren, Belgium
SUMMARY: In this paper an overview is given of the newest developments on 3D-knittedcomposites. The main effort has been focussed on overcoming the problems of translating theknittings from a textile environment to the field of composites. The major developments aregoing on in the development and use of complex yarns. Also, the first results of bending testson different kinds of 3D-knitted composites are presented. The main parameters seem to bethe orientation of the beam elements and the areal density of the composite. However, it is noteasy to compare all results since a lot of parameters are involved. To overcome this, a newnormalisation method will be necessary and more tests results are required.
KEYWORDS: knittings, sandwich, preforms
INTRODUCTION
In the last few years the interest for composites based on knittings has increased significantlydue to the extremely good drapability of knitted prepregs and because complex parts can beshaped quite easily even with a reduced number of processing steps.
The new material described in this paper is based on two existing types of composite. Itcombines the advantages of the integrally 3D-woven sandwich structures[1] with thedeformability and handleability of knitted preforms[2]. It is thought that this approach canhave some advantages compared to the more traditional sandwich structures.
Currently, most sandwich structures are produced by bonding together two skins onto a corematerial. However, core materials with high specific properties such as honeycombs and somespecial types of foam are very expensive and hence, the complete sandwich becomes quiteexpensive as well. In the case of textile reinforcements such as the 3D-knitted and 3D-wovensandwich fabrics, the cost can be significantly lower because of the well-known textiletechnologies and the low cost mass production of these textiles[3].
Another typical problem which is difficult to solve with classical sandwich structures is thedelamination of the skins, especially when the sandwich has been damaged. By using integral3D-knitted and 3D-woven sandwich composites, this problem can be prevented.
One of the main advantages of these 3D-knitted structures is that double-curved sandwichpanels can be produced easily. This is not really possible with the current sandwich materialsand thus 3D-knitted sandwich composites bring a new feature to this class of materials.

Volume V: Textile Composites and Characterisation
V - 212
CONCEPT & PRODUCTION OF 3D-KNITTINGS
Concept
3D-knitted sandwich fabrics consist of two skins [4], which look like a grid of knitted beamelements in a hexagonal or a rhombic configuration. The top and bottom skin of the knit areattached to each other by pile fibers standing vertical to the fabric plane. These pile fibers actas a core for the sandwich structure. Their length can be adjusted to modify the fabricthickness and hence also the composite properties.
Fig. 1: Hexagonal grid structure of a 3D-knitting
Fig. 2: Close look at the pile fibers
Production
The production of 3D-knittings is very similar to that of flat knittings. Only here, in principle,two knitting machines are put back to back in order to produce the top and the bottom skins ofthe sandwich fabric simultaneously. In practice, a double-bed rashell knitting machine is usedfor this purpose. This machine has two needle beds that can be controlled independently.
Fig. 3: Schematic drawing of the knitting process
During the knitting process the skins are being connected with pile fibers. These fibers notonly constitute the core of the fabric but they are also part of the skins. This can be seen inFig. 3 where it is shown how the piles are knitted into the top skin of the fabric. In the next
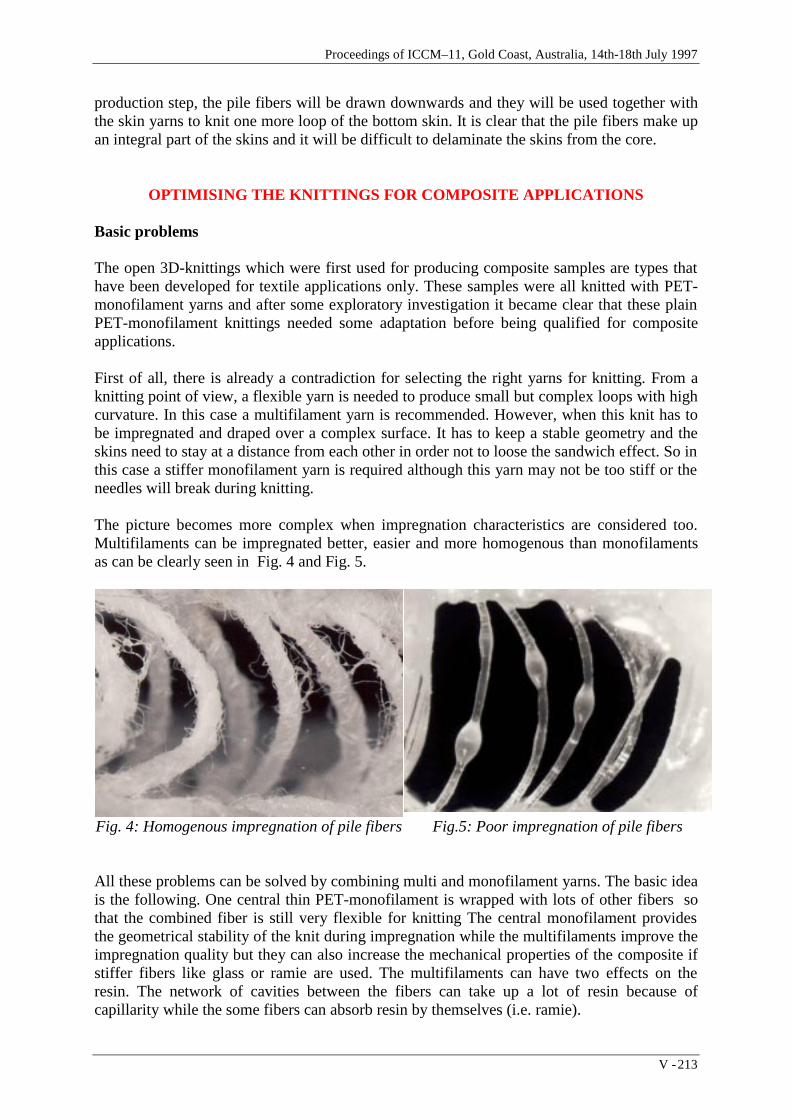
Proceedings of ICCM–11, Gold Coast, Australia, 14th-18th July 1997
V - 213
production step, the pile fibers will be drawn downwards and they will be used together withthe skin yarns to knit one more loop of the bottom skin. It is clear that the pile fibers make upan integral part of the skins and it will be difficult to delaminate the skins from the core.
OPTIMISING THE KNITTINGS FOR COMPOSITE APPLICATIONS
Basic problems
The open 3D-knittings which were first used for producing composite samples are types thathave been developed for textile applications only. These samples were all knitted with PET-monofilament yarns and after some exploratory investigation it became clear that these plainPET-monofilament knittings needed some adaptation before being qualified for compositeapplications.
First of all, there is already a contradiction for selecting the right yarns for knitting. From aknitting point of view, a flexible yarn is needed to produce small but complex loops with highcurvature. In this case a multifilament yarn is recommended. However, when this knit has tobe impregnated and draped over a complex surface. It has to keep a stable geometry and theskins need to stay at a distance from each other in order not to loose the sandwich effect. So inthis case a stiffer monofilament yarn is required although this yarn may not be too stiff or theneedles will break during knitting.
The picture becomes more complex when impregnation characteristics are considered too.Multifilaments can be impregnated better, easier and more homogenous than monofilamentsas can be clearly seen in Fig. 4 and Fig. 5.
Fig. 4: Homogenous impregnation of pile fibers Fig.5: Poor impregnation of pile fibers
All these problems can be solved by combining multi and monofilament yarns. The basic ideais the following. One central thin PET-monofilament is wrapped with lots of other fibers sothat the combined fiber is still very flexible for knitting The central monofilament providesthe geometrical stability of the knit during impregnation while the multifilaments improve theimpregnation quality but they can also increase the mechanical properties of the composite ifstiffer fibers like glass or ramie are used. The multifilaments can have two effects on theresin. The network of cavities between the fibers can take up a lot of resin because ofcapillarity while the some fibers can absorb resin by themselves (i.e. ramie).
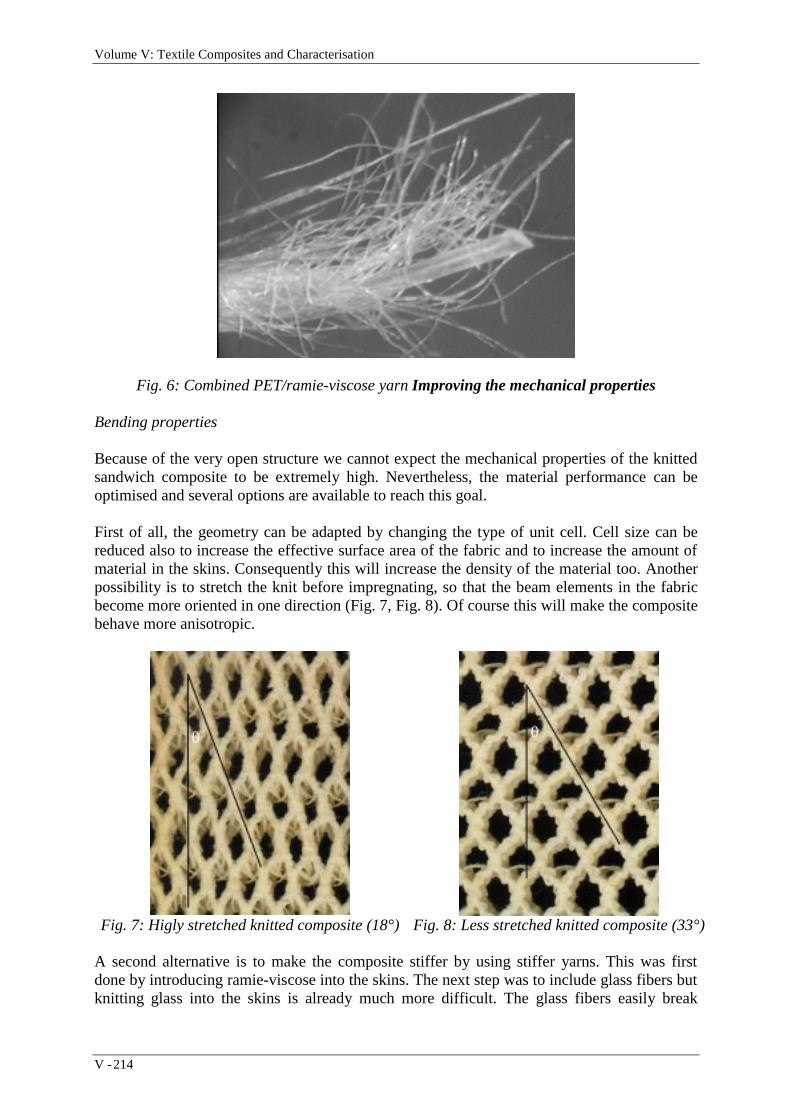
Volume V: Textile Composites and Characterisation
V - 214
Fig. 6: Combined PET/ramie-viscose yarn Improving the mechanical properties
Bending properties
Because of the very open structure we cannot expect the mechanical properties of the knittedsandwich composite to be extremely high. Nevertheless, the material performance can beoptimised and several options are available to reach this goal.
First of all, the geometry can be adapted by changing the type of unit cell. Cell size can bereduced also to increase the effective surface area of the fabric and to increase the amount ofmaterial in the skins. Consequently this will increase the density of the material too. Anotherpossibility is to stretch the knit before impregnating, so that the beam elements in the fabricbecome more oriented in one direction (Fig. 7, Fig. 8). Of course this will make the compositebehave more anisotropic.
Fig. 7: Higly stretched knitted composite (18°) Fig. 8: Less stretched knitted composite (33°)
A second alternative is to make the composite stiffer by using stiffer yarns. This was firstdone by introducing ramie-viscose into the skins. The next step was to include glass fibers butknitting glass into the skins is already much more difficult. The glass fibers easily break

Proceedings of ICCM–11, Gold Coast, Australia, 14th-18th July 1997
V - 215
because of the high tension on the knitting yarns and because of high curvatures inside theknitting loops. Another option is not to knit the glass but to insert the glass fibers as straightbundles in the skins.
Compression & impact
To increase the compression and impact resistance of the composite, the load bearing capacityof the pile fibers has to become higher. This means that the buckling resistance of each singlepile has to get better. With the introduction of combined yarns for pile fibers a majorimprovement has been realised.By increasing the density of pile fibbers the load experienced by a single pile can be reducedso that the overall compression and impact properties of the composite can improve.
BENDING PROPERTIES
Description of the fabrics used
Table1: Description of 3D-knittingsKnit Geometry Pile Fiber Skin Fiber Skin InsertsH10 Hexagonal PETmonofil PETmonofil -R7 Rhombic PETmonofil PETmonofil -Hr1 Hexagonal PET/ramie-viscose PETmonofil -Hr2 Hexagonal PET/ramie-viscose PETmonofil -Hr3 Hexagonal PET/ramie-viscose PETmultifil -Hpg1 Hexagonal PET/polyester PETmultifil 204 tex glass knittedHpg2 Hexagonal PET/polyester PETmultifil 68 tex glass inserted
In Table 1, three families of materials can be distinguished. The first two types of knits are theplain PET-monofilament knittings as produced for textile applications. The newly developedHr-types all have PET/ramie-viscose pile fibers, while the Hpg-types have PET/polyesterpiles and extra glass fibers in their skins. Two versions of Hpg-knits are available: one withthe glass knitted into the skins while the other version has the glass inserted as straightbundles.
It is clear that the knits with combined yarns will have higher mechanical properties becausethey can be impregnated better, especially the pile fibers.
Production of composite samples
Two types of resin systems have been used for the production of composite samples. Resin1is a sheet like resin that has to be cured in an oven for 60 minutes at 125°C. The other one,resin2 is a solvent based resin which cures at room temperature in open air after evaporationof the solvent. This second type gives better homogenisation of the resin.All composite samples have a thickness around 7mm. Only the samples Hpg2-a and Hpg2-bare thinner (5.5mm).

Volume V: Textile Composites and Characterisation
V - 216
Bending properties
In Fig. 9, the apparent bending modulus of 3D-knitted composites has been shown. The mainorientation angle of the beam elements (which is in fact the main fiber orientation) and theresin content are mentioned. In this figure, two groups of composites can be distinguished.The samples on the left hand side of the figure have been impregnated with resin1, the otherswith resin2.
Apparent Eb-Modulus
0
50
100
150
200
250
300
H10 R
7
Hr1
Hr2
Hr3
Hr2
Hr3
Hpg
1-a
Hpg
1-b
Hpg
2-a
Hpg
2-b
Material
Eb
(N/m
m²)
Warp
Weft
AngleResin w%
32°70%
35°78%
34°74%
33°67%
31°78%
19°71%
21°69%
34°58%
24°59%
32°65%
24°65%
Resin1 Resin2
Fig. 9: Bending modulus of 3D-knitted composites
In the left group all samples have about the same degree of stretching so that they arecomparable in this respect. Samples H10 and R7 are the first generation of 3D-knittedcomposites: they are knitted from plain PET-monofilaments which are difficult to impregnateproperly. This is also the reason why the modulus of H10 is low: the pile fibers are barelyimpregnated.
The value for R7 is already much higher because the sample has a high resin content. In thiscase the skins are well impregnated and on some spots even over-impregnated, while the pilefibers of R7 are getting impregnated as well due to the abundance of resin. As a consequenceof this, resin walls between the piles are being formed. This drastically increases the stiffnessof the composite. Resin lumps in the corners between the piles and the skins have the sameeffect.
Samples Hr1, Hr2, Hr3 are all based on PET/ramie-viscose pile fibers which means that thecore is much better impregnated and the properties are higher. However, these three types ofsamples, especially Hr1 and Hr3 have been over-impregnated. The corners between beamelements and the corners between piles and skin have been filled with resin, which drasticallyincreases the stiffness.
Comparing these three samples with Hr2 and Hr3 impregnated with resin2 shows that thelatter are somewhat stiffer despite the lower resin content. The reason for this is that they havebeen stretched more. However, one would expect the difference to be bigger, but this is not so

Proceedings of ICCM–11, Gold Coast, Australia, 14th-18th July 1997
V - 217
because of over-impregnation of the samples with resin1 and because resin1 is stiffer thanresin2.
The effect of stretching the knittings becomes more clear in the Hpg-samples. They are allimpregnated with the same resin2 but also, the resin content for samples made from one typeof knit is constant (58 or 65w%) for both the stretched and the unstretched versions. Thestretched samples (~21°) clearly are stiffer, they have a stiffness of about double that of theless stretched ones (~33°).
In Fig. 10 the apparent bending modulus versus the density of the composite is visualised. Allavailable samples have been put into two categories, although there is some variation in themeasured angle. There is a group of samples which are highly stretched (~21°) and sampleswhich are less stretched (~33°). Both the warp and weft direction are presented.
Apparent Eb-modulus vs Areal density
0
50
100
150
200
250
300
0 500 1000 1500 2000 2500
Density (g/m²)
Eb
(N/m
m²) 33° warp
33° weft
21° warp
21° weft
Hr2
Hpg1-b
Hr3
Hpg2-b
Hr3
Hr2
Hr1
Hpg1-aHpg2-a
R7
H10
Fig.10: Apparent bending modulus versus composite density
For each group of samples a linear relationship between modulus and density is observed.Modulus goes up with increasing density of the composite but also depends on the degree ofstretching. The type of knitting yarn does not seem to have a lot of influence nor does theresin. This would suggest that the stiffness is mainly dependent on the geometry of the unitcells and on the density, just like foam materials. Of course, all results presented here are thefirst findings based on just a small number of samples. It is still to early to draw generalconclusions.
However, one limitation of the current analysis is the artificial division of the compositesamples into two categories. A more correct way is to perform a normalisation for the degreeof stretching and to have a look at more samples that only differ in angle.
A variation of a few degrees was recorded when characterising the samples. This will nothave such a big influence on the samples that have their beam elements at an angle of 33°.However, it becomes much more critical for samples that are more stretched. This is probably
Volume V: Textile Composites and Characterisation
V - 218
the reason why the extra glass in the skins of Hpg-knits seems to be inefficient at first sight.Another reason is that part of the glass fibers are broken because of knitting and these brokenfibers could be seen on the sample. It is also obvious that if the Hpg-samples with 24° wouldhave been normalised to an angle of about 20°, the apparent Eb-modulus would be higher.
CONCLUSIONS
1. 3D-knitted fabrics are being adapted to satisfy specific needs of composites and newtypes of complex yarns are under investigation.
2. Stretching the fabric can be used to control the stiffness of the composite.
3. A reliable method for comparing test specimen with different degrees of stretching isnecessary.
REFERENCES
1. Van Vuure, A.W., Ivens, J., Verpoest, I., “Sandwich fabric panels”, Proceedings 40th Int.SAMPE Symposium, Anaheim, USA, May 8-11, 1995
2. Verpoest, I., Dendauw, J., “Mechanical properties of knitted glass fiber/epoxy resin
laminates”, 37th Int. SAMPE Symposium, March 9-12, 1992, pp. 369-377. 3. Verbrugge, K., Ivens J., Verpoest, I., Van Der Vleuten, P., “Foamed 3D-fabric sandwich
structures”, Proceedings of the 12th European SAMPE Conference, Maastricht (NL),1991, pp. 417-425
4. Philips, D., Verpoest, I., Van Raemdonck, J., “3D-knitted fabrics for composite
structures”, Proceedings TEXCOMP 3, Aachen, Germany, December 9-11, 1996
ACKNOWLEDGEMENTS
We would like to thank the following organisations and institutions:
Part of this research has been financed with a specialisation grant of the Flemish Institute forthe Promotion of Scientific and Technological Research in Industry (IWT).
This text presents research results of the Belgian programme on Interuniversity Poles ofattraction initiated by the Belgian State, Prime Minister’s Office, Science PolicyProgramming. The scientific responsibility is assumed by its authors.

Proceedings of ICCM–11, Gold Coast, Australia, 14th-18th July 1997
V - 219
NOTCHED STRENGTH OF KNITTED FABRICCOMPOSITES
J. de Haan1, K. Kameo2, A. Nakai2, A. Fujita2, J. Mayer1,E. Wintermantel1, H. Hamada2
1Chair of Biocompatible materials Science and Engineering, Swiss Federal Institue ofTechnology Zurich, Wagistrasse 23, 8952 Schlieren, Switzerland
2Kyoto Institute of Technology, Matsugasaki, Sakyo-ku, Kyoto606, Japan
KEYWORDS: knitted fabric composites, open hole tension, elastic properties, strengthproperties, monolayer model composites

Volume V: Textile Composites and Characterisation
V - 220

Proceedings of ICCM–11, Gold Coast, Australia, 14th-18th July 1997
V - 221
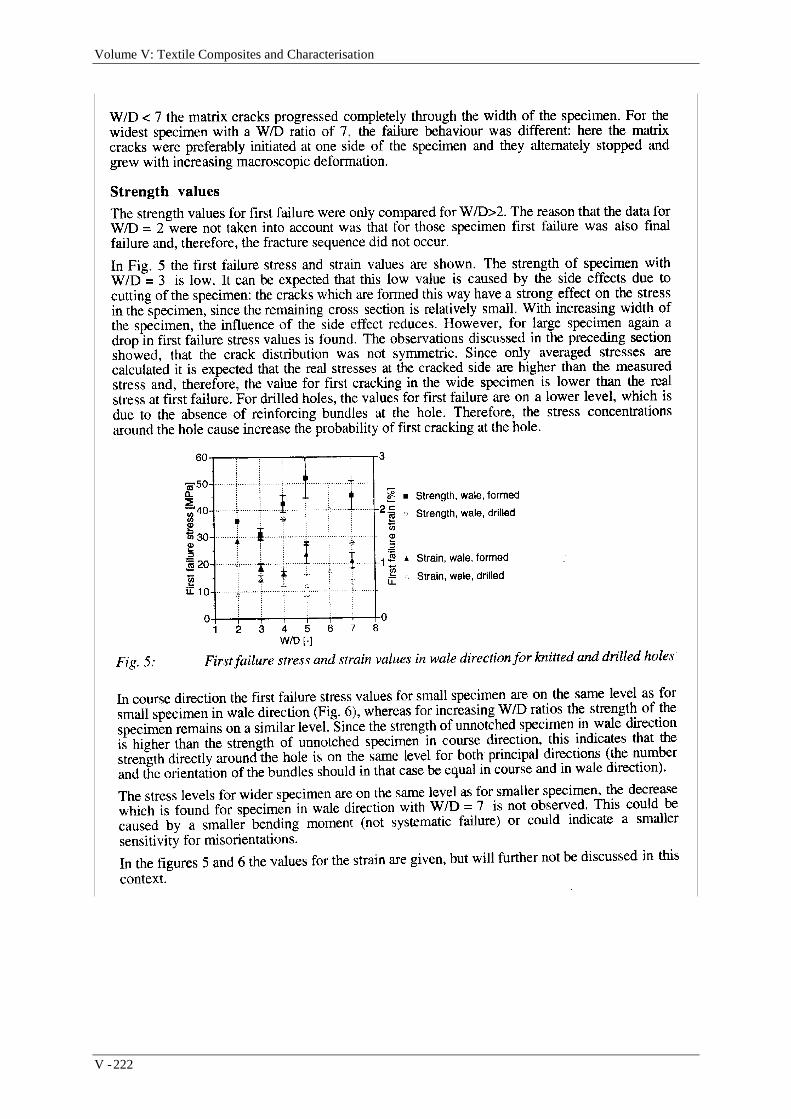
Volume V: Textile Composites and Characterisation
V - 222

Proceedings of ICCM–11, Gold Coast, Australia, 14th-18th July 1997
V - 223

Volume V: Textile Composites and Characterisation
V - 224

Proceedings of ICCM–11, Gold Coast, Australia, 14th-18th July 1997
V - 225

Volume V: Textile Composites and Characterisation
V - 226

Proceedings of ICCM–11, Gold Coast, Australia, 14th-18th July 1997
V - 227
NEW LOW COST TEXTILE PREFORMS AND SHORTCYCLE PROCESSING TECHNIQUES FOR
THERMOPLASTIC COMPOSITES
Sofie Baeten 1, Ignaas Verpoest 1, Hauke Stumpf 2, Karl Schulte 2, Walter Zäh 3,Edith Mäder 4, Toni Pisanikovski 5, Carl-Håkan Andersson 5, Kjell Eng 6
1 Department of Metallurgy and Materials Engineering, Katholieke Universiteit Leuven,de Croylaan 2, B-3001 Heverlee, Belgium
2 Technical University Hamburg-Harburg, Polymer and Composites section, Denickestrasse15, D-21071 Hamburg, Germany
3 Karl Mayer, PB 1120, 63166 Obertshausen, Germany4 Institut für Polymerforschung, PF 12.04.11, 01005 Dresden, Germany
5 Lund University, LTH-Mat.Eng-PB 118, 22100 Lund, Sweden6 Engtex, PB 83, 56522 Mullsjö, Sweden
SUMMARY: Weft-inserted warp knitting is chosen for its low production cost to produce anovel thermoplastic textile preform, containing both the non-crimp reinforcing fibres and thethermoplastic matrix ribbons. The composite structures are obtained by simple hot pressingthe textile preform without any further addition of the matrix. Special glass sizings and lowviscosity matrix materials are developed to ensure a good wetting out of the reinforcementand an easy, thus fast impregnation. This new SPLIT-WARPKNIT structure reveals a highpotential for a good mechanical performance while it remains cost-competitive with othercommercial materials, already available on the market. An extensive mechanical and physicalanalysis, of which the evaluation of the impregnation quality and the global fibre distribution,is carried out to determine the optimal processing window for two different fast processingtechniques, while the flow of the highly viscous thermoplastic matrix through the fibrebundles is modelled.
KEYWORDS: textile preforms, thermoplastic, glass fibres, fast processing, impregnationquality, flow behaviour, automotive
INTRODUCTION
Improved safety standards and extended luxury demands have tremendously increased theweight of vehicles. With the urge of weight reduction in the automobile industry forminimising fuel consumption and exhaust emissions, fibre reinforced composite materialsoffer, besides Al and Mg, a significant light weight potential in structural body parts ofvehicles [1]. Due to some severe disadvantages of thermoset composites, like high productioncycle times, limited recyclability, constrained storage time as well as storage requirements,engineering composites based on thermoplastics have been investigated in recent years.Despite a promising cost decrease when using thermoplastic matrix composites, the pricelevel is far away from that of competing light weight materials, such as Al. A decrease in thefabrication cost of thermoplastic composite parts can be obtained if the separate impregnationstep can be eliminated, by means of a 'dry impregnation' [1]. It seems that textile preforms are

Volume V: Textile Composites and Characterisation
V - 228
particularly well suited due to the experience of the textile industry with low-cost productionand optimal textile processes.. Hence a considerable decrease of the part cost is only achievedby significantly lowering the cost of pre-impregnated thermoplastic textile preforms [5].
However, major difficulties are encountered during the processing of thermoplastic matrixcomposites and include the impregnation due to the high viscosities and low shear flow rates.To overcome these problems, several alternative methods of combining the fibres and thematrix have been developed to reduce the mass transfer distance of the matrix to the fibresduring processing , e.g. the use of several types of "combined yarns", where the reinforcingfibres are intensily mixed with the matrix fibres [2]. A new cost-effective thermoplastic textilepreform has been developed [3]. The advantages of this new class of thermoplastic split-warpknit textile preform are [4][5]:
- low production cost of the textile structure- preform shows a good drapability- increased mechanical properties due to the non-crimp textile structure- one textile structure is composed of different layers, with different orientations of the
reinforcing fibres- short cycle processing time is possible- as the hybrid yarn structure determines the homogeneity of the distribution of the
reinforcing fibres in the polymer matrix and thus the mechanical performance, a goodcomposite part can be made
SPLIT-WARPKNIT TEXTILE PREFORM
A new thermoplastic textile preform, both containing the reinforcing fibres and thethermoplastic matrix ribbons is developed. The thermoplastic ribbon, which will later formthe matrix, is either used as knitting yarn or laid down parallel to the glass fibres, forming ahybrid yarn.
Material Selection
The characteristics required for the novel pre-impregnated textile structure are versatile anddemand special research [4][5]. The main requirements are:
• Good compatibility between the reinforcing fibres and the thermoplastic matrix- good adhesion- good wetting behaviour, giving an overall good impregnation quality
• Low melt viscosity of the polymer matrix to achieve an easy flow during processing• Good processibility of the film, when using a thermoplastic grade with a high MFI• Adequate splitting behaviour of the film• Adequate knitting behaviour of fibres and matrix ribbons
A thorough market survey pointed out that the commercially available thermoplastic films arenot suited for composite applications. They do not contain the required antioxidants,stabilisers and coupling agents and are often coated. The glass fibres were also not availablewith the suited sizings for good adhesion and textile processing and of necessary fineness.

Proceedings of ICCM–11, Gold Coast, Australia, 14th-18th July 1997
V - 229
Therefore, special glass sizings and low viscosity PP matrix materials were selected andmodified in a laboratory scale aimed at a good wetting of the glass fibres and an easyimpregnation. After optimization, a commercially available PP grade (Shell XS 6500 S) hasbeen stabilized and modified with a maleic anhydride grafted PP during film extrusion.
The glass fibres with the optimized sizing have been produced by Glasseiden GmbH Oschatz,Germany as cost-effective direct roving of 300 tex fineness. The material selection anddevelopment of PET-matrices and corresponding sized glass fibres revealed continuousamorphous film of Hoechst AG best suited for the new processing technique. PET-compatibleglass fibres have been also produced by Glasseiden GmbH Oschatz, Germany.
Textile Preform
Weft-inserted warp knitting is selected to produce the split-warpknit textile preform [4][5](see fig 1 and 2).
Figure 1: Warp knitting with weft inserts Figure 2: Split-warpknit textile
During the first knitting trials of a co-knitted split-warpknit uni-axial structure, where thematrix ribbons are knitted around glass fibres (fig 3), several problems occurred:
- a polymer mixture with a high MFI (10 times more than commercially used) was taken to produce the film- the film was not oriented in the width direction- the film showed a high brittleness- the thermoplastic tape has a too low elongation- the low resistance of the ribbons lead to untwisting and tearing of the tapes- during rewinding of the bobbins the stretch ratio in the length direction increased- the glass rovings were too heavy and too open to use a E 18 gaugeknitting machine: a change to 12 needles per inch was necessary- tubular guides had to be used for the glass rovings- the production of the glass beams should be eliminated by using creels
After evaluation of the produced composite laminates, more questions arose that were linkedto further material optimisation. The insufficient composite properties could be due to badwetting of the fibres or due to the bad impregnation homogeneity caused by the textilestructure. However, the kinetics of wetting single fibres by thermoplastic melts showedimmediate wetting of the sized glass fibres, in contrary, the co-knitted textile structure, with

Volume V: Textile Composites and Characterisation
V - 230
the thermoplastic ribbons knitted around the glass fibres, resulted in a composite material witha highly non-uniform fibre distribution surrounded with unreinforced matrix rich zones.Hence lower mechanical properties were obtained. One possibility to improve theimpregnation homogeneity is to reduce the flow path by using of a new textile structure wherethe thermoplastic ribbons are inserted in the glass fibre bundles, forming a hybrid yarn, andsewed together with a non-meltable stitching yarn. This led to the hybrid split-warpknitmaterial where the thermoplastic ribbons are laid down parallel to the glass fibre bundles anda PET stitching yarn is used to form the textile preform (fig 4). Another preform is now beingdeveloped where a meltable, compatible stitching yarn is used.
Figure 3: Co-knitted split-warpknit Figure 4: Hybrid split-warpknit
Short Cycle Processes
Given the apparent potential for the application of thermoplastic fabric composites in highvolume manufacturing, the conflicting demands of process cycle time and laminate qualityrequire to be resolved.
In all material developments, focusing on mass applications, the processability underindustrial conditions, is an important issue. When considering thermoplastic composites, theminimum cycle time to consolidate the preform is of primary importance [4].
The process cycle involves preheating the matrix polymer above its melting point, followedby a compaction to wet out the reinforcement and cooling the laminate to below the polymercrystallisation temperature [2]. Before the matrix will flow it must be heated sufficientlyabove its melting point to reduce the viscosity for full fibre impregnation. While overheatingwill degrade the polymer, the preheating stage is critical and can be achieved in two ways.In the classical hot pressing in-mould heating and cooling method, a loose stack of textilelayers is placed in a cold mould, heated, pressed and cooled down in the mould to produce apre-compacted sheet. It involves high heating energy flow to and from the formingequipment, resulting in longer cycle times and higher operating costs. This classical process ishence far too expensive for industrial use. During an alternative production method, the fabricis preheated separately in an external oven prior transfer to the forming equipment, which is ata temperature below Tg. This technique is well established in the traditional GMT processingand eliminates the need to cycle the mould temperature, avoiding large cycle times. The majordifference between processing continuous reinforced materials and classical GMTs is thatgenerally no bulk or large scale flow is thought to occur [2].

Proceedings of ICCM–11, Gold Coast, Australia, 14th-18th July 1997
V - 231
Highly oriented thermoplastic split-film ribbons will, when heated up, shrink considerably.So, it is necessary to support the textile preform throughout the heating phase to prevent anuncontrolled shrinkage and curling of the fabric. Note that the classical GMT process does notfulfil this requirement. Hence, alternative processing techniques have to be developed for thefast and cost-effective composite production when using the new thermoplastic split-warpknittextile preform.
Quicktemp Concept
In the alternative method, the mould has to go through the same thermal history as the part,which immediately poses a heat transfer problem. Conventional moulds are usually made ofsteel and it is virtually impossible to cool them down in a sufficiently short time. Animprovement can be obtained using diaphragma forming, which is however expensive due tothe use of special film material.
A new concept for cycle time reduction has been conceived [4][5]:
1. The surface temperature of the mould on the cavity side is the quantity of primary interestto the part. Other domains of the mould can be kept at a different temperature.
2. A large temperature difference between two media (or two domains of one mould) can beused to enhance the heat transfer.
3. The duration of the heating phase is the bottleneck when optimising the cycle time. Watercooling of the composite is fast enough.
This concept has been incorporated in a new mould design. The mould is mainly made of amaterial with a low temperature conductivity (steel) while only the small part, close to themould surface, consists of a material with a high temperature conductivity. The first region isheld at a very high temperature and acts as a heat storage while the second region, equippedwith heating and cooling systems to adjust the temperature, is the forming region and is incontact with the part. During the heating phase, additional heat is flowing from the heatstorage into the forming region due to the large temperature gradient.
Adapted GMT Process
To reduce the cycle times, the idea rose to modify the GMT process (Glass mat reinforcedthermoplastics), where the pile of textile layers is externally heated and transferred to a mouldat constant temperature below the melting temperature of the thermoplastic matrix. If themould is kept at a low temperature, cycle time is reduced drastically because the heating andthe cooling of the massive equipment is no longer needed [4].
However, any alteration of the ideal, uneconomical hot pressing method has an influence onthe impregnation and distribution of the fibres throughout the composite. While in theclassical process the impregnation time is a programmable parameter, this is no longer thecase for the GMT based production process.
Problems also rise during the external heating and transfer of the pile of molten textile layersfrom the oven to the press. Because a loose stack of split-warpknit textile layers containsabout 80% of air, the stack of textiles should be precompacted to remove as much air aspossible in order to accelerate the heating. During convective heating trials it was observedthat the textile exhibited a high amount of shrinkage, preferentially in one direction, distorting

Volume V: Textile Composites and Characterisation
V - 232
the fibre architecture and resulting in an uncontrolled waviness of the fibres. To provide adegree of constraint, the loose pile of textiles was heated by conduction between two steelplatens of a hot press, where teflon sheets were used to prevent sticking of the molten layersto the platens. In industry however, it is possible to precompact the loose stack of textilelayers with a kind of calendering rolls in a continuous way. The actual preheating could becarried out by radiative heating in an inert atmosphere to prevent the oxidation anddegradation of the textiles. If radiative heating can be applied, the composite can be producedwithout the use of Teflon foils. It is also worth trying to use a mould with a lower thermalconductivity to slow down the cooling speed and further improve the impregnation.
MECHANICAL TEST DATA FOR DIFFERENT PROCESSING TECHNIQUES
Classical Hot Pressing
Before going into the different short cycle processes, laminates were manufactured usingvarious split-warpknit textile preforms with the classical hot pressing technique, resulting inoptimal mechanical properties.
Two different types of a glass fibre reinforced polypropylene split-warpknit textile preformwere examined:
1. co-knitted split-warpknit preform where the thermoplastic matrix ribbons are knittedaround the glass fibre bundles: mono-axial and bi-axial structure
2. hybrid split-warpknit preform where the thermoplastic matrix ribbons are laid downparallel to the glass fibres and sewed together with a PET yarn: mono-axial structure
The properties are also compared to "Twintex" based material.
The mono-axial hybrid split-warpknit preform has a higher fibre volume fraction than themono-axial co-knitted split-warpknit preform but analogous tensile properties (table 1).The bending properties of the hybrid split-warpknit laminates are significantly better thanthose of the co-knitted split-warpknit laminates, probably due to the more homogeneous fibredistribution. No matrix rich zones, which could cause interlaminar shear failure duringtransversal three point bending are present in the new hybrid split-warpknit preform structure.The properties of the new split-warpknits are well comparable to the ones of competitive co-mingled yarns, already commercially available (Twintex).
Adapted GMT Process
The main goal of this study was to investigate whether it is possible to use a GMT basedproduction process for the split film co-knitted composites. Furthermore, an optimisation ofthe production parameters was carried out. Considering the process of external heating underslight pressure, transferring the molten material to the cold mould and consolidating underpressure, several parameters are examined:
Preheating temperature and heating methodMould temperaturePressure of consolidationHolding time at pressure

Proceedings of ICCM–11, Gold Coast, Australia, 14th-18th July 1997
V - 233
Table 1: Tensile properties of the first and the second generation split-warpknit laminates,compared to Twintex co-mingled yarn (Vetrotex).
Processing parameters (optimal classical cycle): 25 bar, 220°C during 5 min
Mono-axialco-knitted
Mono-axialhybrid
Bi-axialco-knitted
Bi-axialhybrid
TwintexTPP 60650
Fibre volumefraction (%)
22 37 39 36 46
Tensile strength(MPa)
297* 289* 360** 320** 317*
Young’smodulus (GPa)
14.5* 16.5* 18** 17.5** 16.6*
*: related to a fibre volume fraction of 20%**: related to a fibre volume fraction of 40%
The experimental results showed that the only parameter of major importance for the tensilebehaviour of cross ply laminates of the bi-axial co-knitted split-warpknit textile, where thematrix ribbons are knitted around the glass fibres, oriented in the 0° and 90° direction, was thepreheating temperature, the temperature to which the material is externally heated in an ovenbefore it is transferred to the press to be formed in a cold mould. This temperature greatlyinfluences the viscosity of the thermoplastic matrix and hence the ease of wetting out andflow through the closely packed fibre bundles. This is even more pronounced when studyingthe shear modulus during ±45 tensile tests (fig 5). The pressure and the mould temperatureinfluence the shear modulus to a lower extent.
0
0.5
1
1.5
2
2.5
200 210 220 230 240 250 260 270 280
Preheating temperature (°C)
GP
a Youngs modulus
Shear modulus
Figure 5: The influence of the preheating temperature on the shear properties of cross plylaminates of the bi-axial co-knitted split-warpknit, tested at 45°. The shear modulus is given
by: GE
xyxy
=+
45
2 1( )ν

Volume V: Textile Composites and Characterisation
V - 234
The optimal process parameter set is:- Pre heating temperature = 280°C- Mould temperature = 125°C- Pressure = 48 bar- Holding time = 300 sec.resulting in optimal mechanical properties for GMT-produced bi-axial co-knitted split-warpknit aminates :- Tensile modulus: 15.92 GPa- Tensile strength: 305.4 MPa- Shear modulus: 0.69 GPa- ± 45° tensile modulus: 2.17 GPa- Poisson coefficient: 0.58
The optimal properties for the conventional hot pressing method and the adapted GMTprocessing technique are compared in table 2 for cross ply symmetric laminates of the biaxial co-knitted split-warpknit textile.
The lowest void fraction and the highest fibre volume fraction is found for the classicalproduction cycle, resulting in a better impregnation homogeneity and thus an overall bettermechanical performance of the composite. However, the classical production cycle is muchmore time consuming and economically non-competitive and further optimisation of theadapted GMT process is still possible.
Table 2: Comparison of the mechanical properties of the biaxial co-knitted split-warpknit
Hot pressing Adapted GMTFibre volume fraction (%) 48.0 46.6
Void fraction (%) 3.2 5.4Matrix volume fraction (%) 48.8 48
Tensile strength (correcred to 50%fibre volume fraction) (MPa)
361.5 327.3
Tensile modulus (corrected to 50%fibre volume fraction) (GPa)
21.25 17.06
Shear modulus: ±45° tensiletesting(GPa)
1.73 0.69
Prototype Development
A dome-type part has been manufactured with a lab-scale mould, using the "Quicktemp"principle. Figure 6 shows a shoesole, produced with an adapted GMT process, using existingindustrial equipment. These preliminary prototype trials could already show the industrialprocessability of the new thermoplastic split-warpknit preform.
An industrial tool for the production of an automotive upper washer spring seat has beenrecently manufactured incorporating the new "Quicktemp" fast heating concept (see fig 7).This tool will be operated in an industrial environment.

Proceedings of ICCM–11, Gold Coast, Australia, 14th-18th July 1997
V - 235
Figure 6: Shoesole, GMT, bi-axial co-knittedsplit-warpknit
Figure 7: "Quicktemp" mould for upperwasher spring seat
Modelling of the Impregnation
The main issue during the production of thermoplastic composites is the impregnation,controlled by the velocity and the ease of flow of the thermoplastic matrix through the closelypacked fibre bundles.
The flow of a polymer matrix through a regular array of reinforcing fibre bundles is oftendescribed by Darcy's law as a flow through a porous medium [8][9][12]:
qK p
xiij
j
=µ
∂∂
(1)
with Kij the permeability tensor and µ the viscosity.
While the permeability tensor is mostly experimentally determined, the capillary model is oneof the mostly used geometric approaches to calculate the permeability of a porous medium,given by the Carman-Kozeny equation [6][7][8][12]. However, because this equation isdeveloped for a packed bed of ellipsoids, the permeability is isotropic which can not be validfor a UD reinforcement where the transverse flow is much more difficult than the flow alongthe fibre bundles. Gutowski et al. did propose a modified equation which forces the transversepermeability (K becomes anisotropic) to approach zero as the fibre volume fraction reaches atheoretical maximum value, depending on the stacking pattern of the fibres [9][12][14].
While Darcy's law for the flow through a porous medium is a good model to describe therelative flow of a low viscous thermoset matrix through a regular array of fibre bundles, it cannot be valid for modelling the flow in thermoplastic matrix composites. The flow underpressure of the melted thermoplastic matrix through the reinforcing fibres, should be modelledas a squeeze flow of a viscous, compressible medium [10][11].

Volume V: Textile Composites and Characterisation
V - 236
Since in the conventional hot pressing, a sufficiently high pressure is already applied duringthe heating phase, the stacked textile layers are strongly compacted before the polymer meltsand the originally round fibre bundles become elliptical. When however, the material isexternally heated (GMT like process), the molten polymer will surround the fibre bundles andunder influence of the surface tension force them to take up a circular cross section..
The model, which is currently under development, predicts the impregnation quality as afunction of the production parameters and can be subdivided in three different levels [14]:
1. a micro scale model, where the fibre diameter is a typical length unit. The description ofthe flow on a micro scale, allows to trace the influence of deviations of the ideal stackingpattern of the fibres (missing of a fibre, displacement with regard to the ideal stacking,variation in fibre diameter...), on the permeability.
2. an intermediate scale model, where the fibre bundle diameter is chosen as a typical length.The radial flow in the fibre bundles is described by the equation of Brinkman and thepermeability is given by Gebart [13][14]. For the flow along the fibre bundles, theequations of Navier Stokes are used.
3. a macro scale model, where the length unit is much larger than the bundle diameter andwhere the reinforcement can be considered as a continuous porous medium.
However, the development will be focused on the micro and intermediate scale model.
ACKNOWLEDGEMENTS
This research is suppported by the European Community Research Programme Brite-Euram,Project no BE7256-93, Contract number BRE2-CT94-0552. The authors gratefullyacknowledge the financial contribution by the commission. Part of this research has beenfinanced with a specialisation grant of the Flemish Institute for the Promotion of Scientificand Technological Research in Industry (IWT). This text presents research results of theBelgian programme on Interuniversity Poles of attraction initiated by the Belgian State, PrimeMinister's Office, Science Policy Programming. The scientific responsibility is assumed by itsauthors.
REFERENCES
1. Singkofer R. Mehn R., "Advanced Thermoplastic Composites based on KnittedFabrices with Weft Insertion - Economical Application in Highlu Loaded VehicleComponents", Proc. 17th Intern Sampe Conference, Basel, Switzerland, May 28-301996.
2. Wakeman M.D., Cain T.A., Rudd C.M., "Optimisation of the Flexural Stiffness ofCompression Moulded Co-mingled Glass and Polypropylene Composites, Proc. ECCM7, London, May 14-16, 1996
3. Mäder E., "New Hybrid Yarns for Continuous Fibre-reinforced Thermoplastics", Proc35th Intern man-Made Fibres Congress, Dornbirn, Austria, September 25-27, 1996

Proceedings of ICCM–11, Gold Coast, Australia, 14th-18th July 1997
V - 237
4. Stumpf H., Mäder E., Baeten S., Pisanikovski T., Zäh W., Eng K., Andersson C.-H.,Verpoest I., Schulte K., "New Thermoplastic Composite Preforms based on Split-filmWarp Knitting", Proc. TexComp Conf, Aachen, Germany, December 9-11, 1996
5. Stumpf H., Mäder E., Schulte K., Zäh W., "New Thermoplastic Composites Made fromLow-cost Textile Preforms and Specialized Processing Techniques for Short CycleTimes", Proc. 17th Intern? Sampe Conference, Basel, Switserland, May 28-30, 1996
6. Ye L., Klinkmüller V., Friedrich K.: Impregnation and Consolidation in Compositesmade of GF/PP Powder Impregnated Bundles, Journal of Thermoplastic CompositeMaterials, vol 5, p 32-48, 1992
7. Seo J.W., Lee W.I.: A Model of the Resin Impregnation of Thermoplastic Composites,Journal of Composite Materials, vol 25, p 1127-1142, September 1991
8. PP, Structure, Blends and Composites, Vol 3, Composites, edited by J. Karger-Kocsis,Chapman and Hall, 1995
9. Klinkmüller V., Um M.K., Friedrich K., Kim B.S.: Impregnation and Consolidation ofdifferent GF/PP Commingled Yarns, Proc. of ICCM-10, Whistler B.C., Canada, August1995, vol III, p 397-404
10. Balasubramanyam R., Jones R.S, Wheeler A.B.: Modelling Transverse Flows ofReinforced Thermoplastic Materials, Composites vol 20, no 1, p 33-37, January 1989
11. Ranganathan S., Advani S.G., Lamontia M.A.: A Non-isothermal Process Model forConsolidation and Void Reduction during In-situ Tow Placement of ThermoplasticComposites, Journal of Composite Materials, vol 29 no 8, p 1040-1061, 1995
12. Vol 10, Composite Materials Series: Flow and Rheology in Polymer Matrix CompositesManufacturing, Editor Suresh G. Advani, Series Editor R.B. Pipes, Elsevier, 1995
13. Gebart B.R.: Permeability of Unidirectional Reinforcements for RTM, Journal ofComposite Materials, vol 26, no 8, p 110-1133, 1992
14. Lundström T.S., Gebart B.R.: Effect of Perturbation of Fibre Architecture onPermeability inside Fibre Tows, Journal of Composite Materials, vol 29, no 4, p 424-443, 1995
Volume V: Textile Composites and Characterisation
V - 238
EXPERIMENTAL ANALYSIS OF FABRICDEFORMATION MECHANISMS
DURING PREFORM MANUFACTURE
A. C. Long1, C. D. Rudd1, M. Blagdon1 and M. S. Johnson2
1 Department of Mechanical Engineering, University of Nottingham,University Park, Nottingham NG7 2RD, UK
2 Cooporative Research Centre for Advanced Composite Structures Ltd,506 Lorimer Street, Fishermens Bend, Victoria, 3207, Australia
SUMMARY: In recent years, a number of fabric drape models have been developed, whichare usually based on a kinematic algorithm in which deformation is restricted to inter-fibreshear. However relatively little experimental evidence has been reported to support thisapproach, and it is widely recognised that a number of other deformation mechanisms exist.The objective of this study was to investigate the formability of a range of non-crimp fabricreinforcements, both to validate the kinematic model and to quantify the effects of fabricconstruction on formability. The first stage involved analysing fabrics during pure shear,which showed that the fabric construction can greatly affect both the fabric shear stiffness andfibre locking angle. Fabric samples were then deformed using a hemispherical punch, with anautomated strain analysis system used to measure the resulting fibre distribution. Thepredicted and measured fibre patterns agreed well up to the fibre locking angle, with fabricshear stiffness apparently having a negligible effect.
KEYWORDS: preforms, drape modelling, fabric shear, non-crimp fabrics, RTM, SRIM
INTRODUCTION
Liquid composite moulding processes, including resin transfer moulding (RTM) andstructural reaction injection moulding (SRIM), are now finding widespread applications in theautomotive and aerospace industries. These processes involve the impregnation of a fibrepreform with a liquid thermosetting resin, which is then cured to produce a rigid component.Preforms are usually produced in a separate manufacturing process, with a wide range oftechniques available for their manufacture. Whilst a number of textile based techniques canbe used to produce preforms directly from yarns or rovings, these are usually limited tospecific component geometries such as regular or prismatic sections and it is often necessaryto produce preforms by forming or stamping of reinforcement mats or fabrics. However theformability of the reinforcements, which are often woven or stitch-bonded “non-crimp”fabrics, is limited by their construction. In particular fabric wrinkling can occur in areas withcomplex curvature, which would lead to rejection of the preform on grounds of quality.Another associated problem is that the resulting variations in fibre volume fractions andorientations can lead to a non-uniform distribution of both preform permeability andcomponent mechanical properties, thus making preform design strategies based on flowsimulation and structural analysis somewhat problematic.

Proceedings of ICCM–11, Gold Coast, Australia, 14th-18th July 1997
V - 239
To overcome some of the difficulties outlined above, in recent years a number of simulationshave been developed for fabric deformation during preform manufacture. These are usuallybased on a kinematic mapping of an idealised fabric to an arbitrary surface, assuming thereinforcement to be analogous to a pin-jointed net. However it is widely recognised that anumber of other deformation mechanisms exist, although relatively little experimental workhas been reported to quantify these. The objective of this study was to establish theformability of a range of reinforcement fabrics and to investigate the validity of the kinematicmodel. The first stage was to examine the behaviour of the fabrics during shearing toestablish both the shear stiffness and fabric locking angle. An automated strain analysissystem, originally developed to characterise sheet metal formability, was then used tomeasure the fibre distribution within three-dimensional preforms. This allowed the relativeimportance of fabric deformation mechanisms to be established, and highlighted thelimitations associated with the kinematic model.
Materials
A number of non-crimp (stitch-bonded) glass fabrics were used in this study. These aresummarised in Table 1, which includes tow linear density in Tex (g/km), tow pitch (distancebetween centre lines) and fabric superficial density for each material. Examples of fabricsfrom the two manufacturers are shown in Fig. 1. The TT material (Fig. 1(a)) is held togetherusing a tricot stitch, with the stitch oriented at 45o to the fibres. The BUC materials (Fig.1(b)) contain a similar tricot stitch, with an additional chain stitch used to maintain each layerof unidirectional fibres within the fabric. Although the BUC materials were intended to be45o, the samples actually had a ply angle of approximately 55o due to fabric relaxation.
Table 1: Material data for Tech Textiles (TT) and Flemmings (BUC) non-crimp fabrics
Code Tow lineardensity (Tex)
Tow pitch(mm)
Superficialdensity (g/m2)
TT/936 600 1.3 936
BUC/403 408 2.0 403
BUC/440 408 1.8 440
BUC/545 408 1.5 545
BUC/600 408 1.3 600
BUC/682 408 1.2 682
BUC/784 900 2.3 784
BUC/800 600 1.5 800
BUC/1200 900 1.5 1200
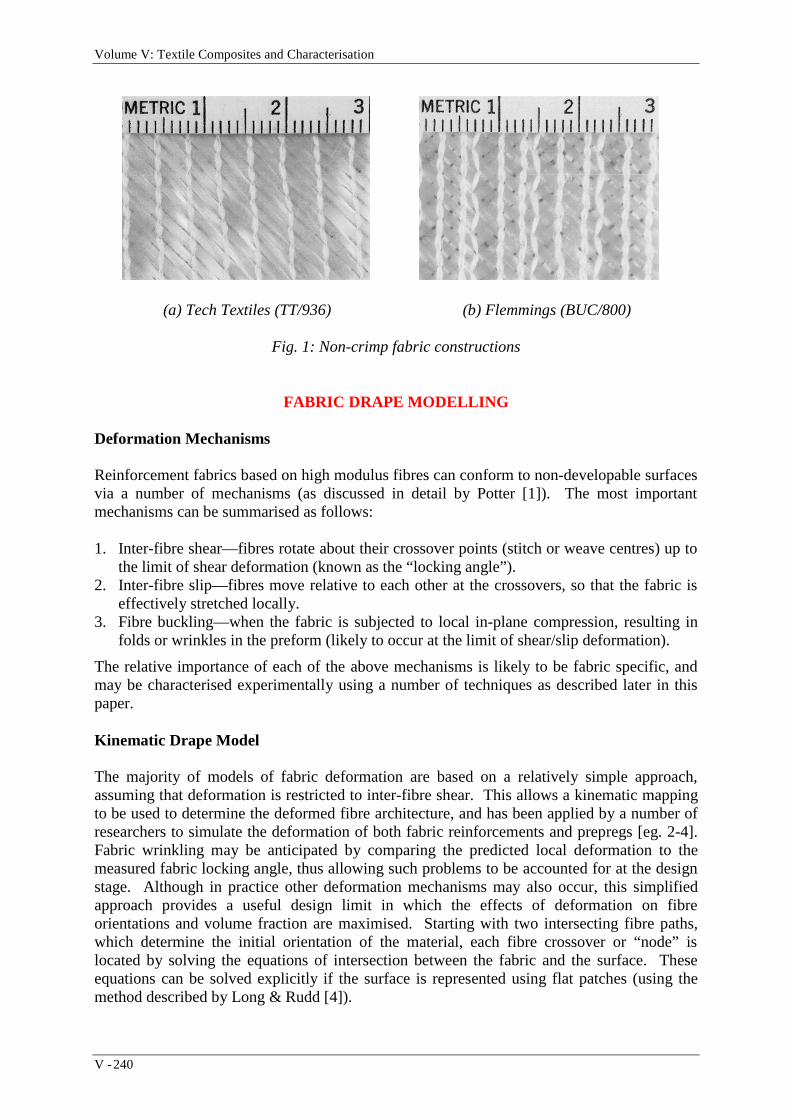
Volume V: Textile Composites and Characterisation
V - 240
(a) Tech Textiles (TT/936) (b) Flemmings (BUC/800)
Fig. 1: Non-crimp fabric constructions
FABRIC DRAPE MODELLING
Deformation Mechanisms
Reinforcement fabrics based on high modulus fibres can conform to non-developable surfacesvia a number of mechanisms (as discussed in detail by Potter [1]). The most importantmechanisms can be summarised as follows:
1. Inter-fibre shear—fibres rotate about their crossover points (stitch or weave centres) up tothe limit of shear deformation (known as the “locking angle”).
2. Inter-fibre slip—fibres move relative to each other at the crossovers, so that the fabric iseffectively stretched locally.
3. Fibre buckling—when the fabric is subjected to local in-plane compression, resulting infolds or wrinkles in the preform (likely to occur at the limit of shear/slip deformation).
The relative importance of each of the above mechanisms is likely to be fabric specific, andmay be characterised experimentally using a number of techniques as described later in thispaper.
Kinematic Drape Model
The majority of models of fabric deformation are based on a relatively simple approach,assuming that deformation is restricted to inter-fibre shear. This allows a kinematic mappingto be used to determine the deformed fibre architecture, and has been applied by a number ofresearchers to simulate the deformation of both fabric reinforcements and prepregs [eg. 2-4].Fabric wrinkling may be anticipated by comparing the predicted local deformation to themeasured fabric locking angle, thus allowing such problems to be accounted for at the designstage. Although in practice other deformation mechanisms may also occur, this simplifiedapproach provides a useful design limit in which the effects of deformation on fibreorientations and volume fraction are maximised. Starting with two intersecting fibre paths,which determine the initial orientation of the material, each fibre crossover or “node” islocated by solving the equations of intersection between the fabric and the surface. Theseequations can be solved explicitly if the surface is represented using flat patches (using themethod described by Long & Rudd [4]).

Proceedings of ICCM–11, Gold Coast, Australia, 14th-18th July 1997
V - 241
FABRIC SHEAR TESTING
Whilst the modelling approach described above can be used to provide a rapid indication ofthe fibre architecture within the preform, it has no way of distinguishing different fabricsother than in the specification of the deformation limit (locking angle). The behaviour offabrics subjected to shearing can be measured experimentally to determine the effective shearcompliance. As well as providing a measure of the fabric locking angle, such tests can also beused to provide data for a mechanistic deformation model (eg. [5]). Fabric shear testing canbe carried out in a parallelogram fixture (as shown in Fig. 2), in which the fabric sample isclamped on either two or four sides. The shearing force is applied in the bias direction whilemeasuring the axial displacement using an instrumented loading frame.
Fig. 2: Parallelogram fixture for fabric shear testing
Typical results for a stitch-bonded (non-crimp) fabric reinforcement are shown in Fig. 3.Results are presented for specimens loaded both parallel and perpendicular to the stitchingthread (as indicated in the inset figure). It is clear that this particular material exhibitssignificantly greater resistance to shear when loaded parallel to the stitch, which is underincreasing tension throughout the test. The rapid increase in shear force as the shear angleapproaches 60o is thought to indicate the onset of fibre locking, as wrinkles were clearlyvisible on fabric specimens towards the end of the tests. These results were produced at acrosshead speed of 100mm/min, although similar results were obtained at other rates in therange 68 to 1020 mm/min.
To establish the effect of fabric construction on shear properties, tests were carried out using anumber of non-crimp fabrics with a range of tow spacings and linear densities (the BUCmaterials listed in Table 1). As has already been mentioned, these materials were actually55o, so shear tests were carried out with samples clamped on two parallel sides with one setof fibres aligned in the direction of shear. For all materials, it was found that fibre lockingoccurred at a very low shear angle (approximately 15o) when loaded parallel to the tricotstitch, with shear forces typically double those measured with a perpendicular stitch. Fig. 4shows the relationship between shear force and shear angle for specimens loadedperpendicular to the stitch. It is clear that an increase in tow linear density with constant pitch
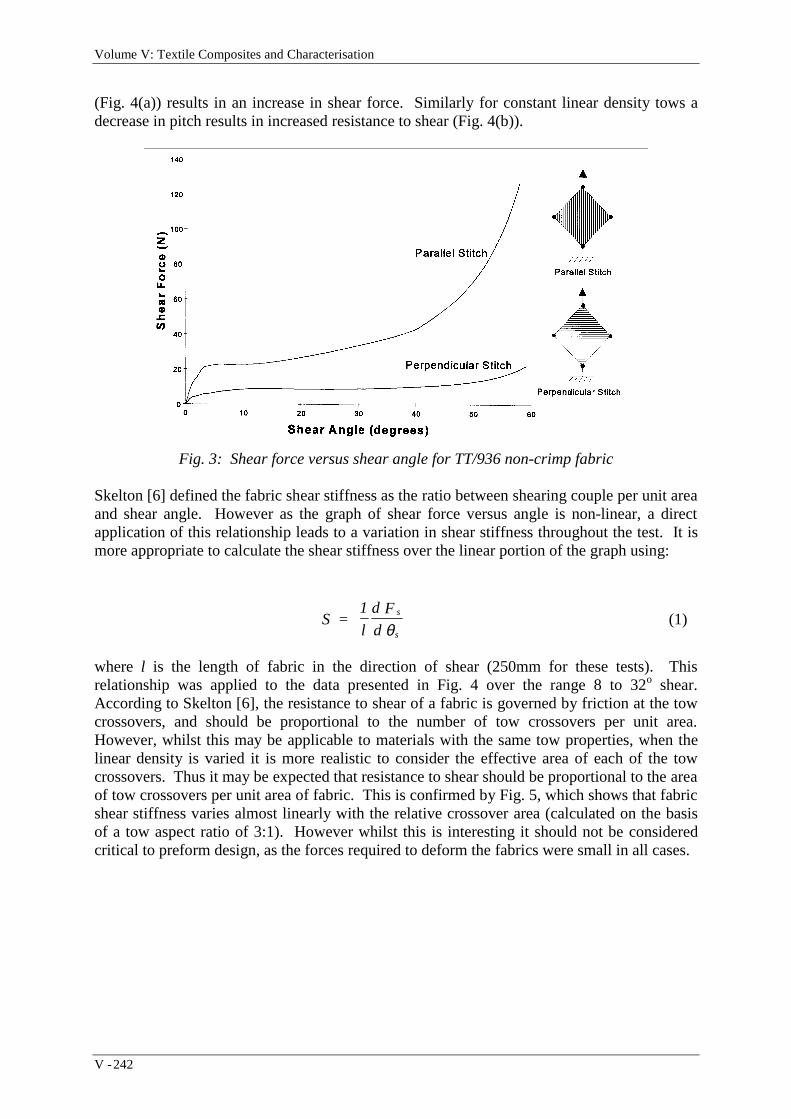
Volume V: Textile Composites and Characterisation
V - 242
(Fig. 4(a)) results in an increase in shear force. Similarly for constant linear density tows adecrease in pitch results in increased resistance to shear (Fig. 4(b)).
Fig. 3: Shear force versus shear angle for TT/936 non-crimp fabric
Skelton [6] defined the fabric shear stiffness as the ratio between shearing couple per unit areaand shear angle. However as the graph of shear force versus angle is non-linear, a directapplication of this relationship leads to a variation in shear stiffness throughout the test. It ismore appropriate to calculate the shear stiffness over the linear portion of the graph using:
where l is the length of fabric in the direction of shear (250mm for these tests). Thisrelationship was applied to the data presented in Fig. 4 over the range 8 to 32o shear.According to Skelton [6], the resistance to shear of a fabric is governed by friction at the towcrossovers, and should be proportional to the number of tow crossovers per unit area.However, whilst this may be applicable to materials with the same tow properties, when thelinear density is varied it is more realistic to consider the effective area of each of the towcrossovers. Thus it may be expected that resistance to shear should be proportional to the areaof tow crossovers per unit area of fabric. This is confirmed by Fig. 5, which shows that fabricshear stiffness varies almost linearly with the relative crossover area (calculated on the basisof a tow aspect ratio of 3:1). However whilst this is interesting it should not be consideredcritical to preform design, as the forces required to deform the fabrics were small in all cases.
S = 1
l
d F
ds
sθ (1)
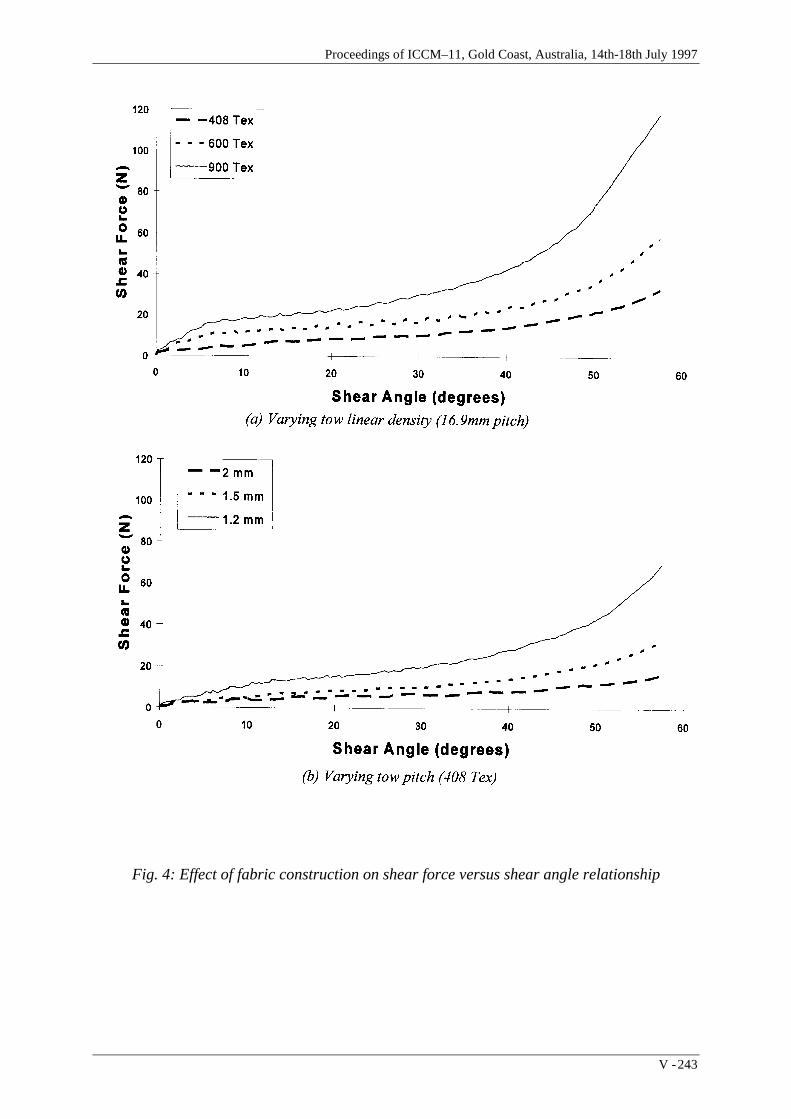
Proceedings of ICCM–11, Gold Coast, Australia, 14th-18th July 1997
V - 243
Fig. 4: Effect of fabric construction on shear force versus shear angle relationship

Volume V: Textile Composites and Characterisation
V - 244
Fig. 5: Variation in shear stiffness with proportion of fibre crossovers for Flemmings fabrics(loaded perpendicular to stitch).
AUTOMATED STRAIN ANALYSIS
Although the above method can be used to examine the formability of fabrics during shearing,other deformation mechanisms are excluded by the nature of the test. To study thedeformation of reinforcements during three-dimensional forming operations, a technique isrequired to measure the positions and orientations of fibres within a preform. Such atechnique can be used to assess the relative importance of the available deformationmechanisms, and also provides a method for validating the drape model described earlier. Tothis end a method developed by Ford Motor Company to characterise sheet metal formabilityhas been adapted to measure fabric deformation. This involves measuring the deformation ofa square grid on the material surface, and is known as the CAMSYS Automated StrainAnalysis and Measurement Environment (as shown schematically in Fig. 6). This can be usedto determine the position of each grid intersection, from which local shear and slip data can beobtained (as described in our earlier paper [7]).
Fig. 6: Automated strain analysis and measurement environment schematic

Proceedings of ICCM–11, Gold Coast, Australia, 14th-18th July 1997
V - 245
To apply this technique to reinforcements, fabric samples were formed using a 100mmdiameter punch mounted on a hydraulic press. Specimens were formed to a depth of 65mm ata punch velocity of 65mm/s, with constant clearance maintained at the clamped periphery toallow edge draw during forming. Deformed specimens were then rigidised using an aerosolvarnish prior to analysis using the CAMSYS system. In each case, specimens wereconsidered in four quadrants, two of which were effectively deformed parallel to the stitchingthread and two perpendicular. Typical results for a non-crimp fabric are shown in Fig. 7,which compares the measured fibre pattern with the distribution predicted using the kinematicdrape model. In both cases the surface is shaded to represent local shear, whilst for themeasured pattern fibre segments are also shaded to indicate inter-fibre slip (calculated aspercentage strain between intersections). On a qualitative level, it is clear that the predictedand measured fibre distributions agree reasonably well.
A quantitative comparison is made in Fig. 8, which shows the predicted and measured inter-fibre angles along the axis of maximum deformation (as indicated on the inset figure). Thereis generally a good agreement between the predicted and measured values, particularly forquadrants sheared parallel to the stitch. The predicted level of shear is slightly lower (ie.higher inter-fibre angle) for quadrants which were sheared parallel to the stitching thread,which may be due to the increased resistance to shear in this direction as demonstrated in Fig.3. Minimum inter-fibre angles of 41o and 51o were measured respectively for deformationparallel and perpendicular to the stitch. These may be considered to be the effective lockingangles for this material, as wrinkles were clearly visible around the base of the specimens.Inter-fibre slip of up to 10% was recorded in the same areas, suggesting that the pure shearassumption may be unsatisfactory in the most highly deformed regions.
The same technique was applied to the range of BUC fabrics (as described in Table 1).Typical inter-fibre angle data is compared with the kinematic model prediction in Fig.9. Asnoted in the previous section, these materials lock at a very low level of shear when deformedparallel to the stitching thread. In this case, the maximum shear angle measured in thisdirection was 12o. For the quadrants which were sheared perpendicular to the stitch, themeasured level of shear was slightly greater than predicted by the drape simulation. Thisdemonstrates that the significant deformation was restricted to 2 quadrants during the formingoperation. Similar measurements made with various fabric constructions showed little or noeffect on the deformed fibre distribution. This would suggest that the important parameter insimulating fabric drape is the fibre locking angle. Differences in fabric shear stiffness may beof relevance if forming loads are of concern, although in practice these are likely to besignificantly lower than the forces generated during reinforcement compaction.

Volume V: Textile Composites and Characterisation
V - 246
Fig. 7: Predicted (left) and measured (right) fibre patterns for hemisphere draped withTT/936
Fig. 8: Comparison of predicted and measured fibre angles for TT/936

Proceedings of ICCM–11, Gold Coast, Australia, 14th-18th July 1997
V - 247
Fig. 9: Comparison of predicted and measured fbre angles for BUC/800
CONCLUSIONS
This study has demonstrated two methods which can be used to characterise reinforcementformability. Fabric shear testing can be used to determine the effective shear stiffness, andmay also indicate the fabric locking angle. However the latter is very much subject tointerpretation, and in particular there is no obvious way to deduce the deformation limit fromthe shear force variation measured during the test. An automated strain analysis technique,adapted from sheet metal formability, can be used to measure the fibre distribution within athree-dimensional preform. This method allows a wider range of deformation mechanisms tobe characterised, and also provides a quantitative method for validating a fabric drapesimulation.
Each of these methods was applied to a range of non-crimp fabrics with various constructions.Stitch orientation, tow linear density and tow pitch were all found to have a significant affecton fabric shear stiffness, although only stitch orientation appeared to affect the fabric lockingangle. The stitching thread also had a significant affect on the fibre distribution during three-dimensional forming, whereas other factors which influence fabric shear stiffness were notfound to be significant. From these results it may be concluded that the most importantparameter in characterising fabric formability is the locking angle, although it should berecognised that this may depend on the direction of shear deformation.

Volume V: Textile Composites and Characterisation
V - 248
ACKNOWLEDGEMENTS
The work described in this paper continues to be funded by Ford Motor Company, and theauthors would particularly like to thank Ken Kendall and Carl Johnson for their support.Flemmings Industrial Fabrics are also thanked for supplies of raw materials and technicaladvice.
REFERENCES
1. Potter, K.D. “The influence of accurate stretch data for reinforcements on theproduction of complex structural mouldings”, Composites, Vol. 10, 1979, pp. 161-167.
2. Van West, B.P., Pipes, R.B., Keefe, M. and Advani, S.G. “The draping andconsolidation of commingled fabrics”, Composites Manufacturing, Vol. 2, 1991, pp.10-22.
3. Bergsma, O.K. “Computer simulation of 3D forming processes of fabric reinforcedplastics”, Proc. 9th Int. Conf. on Composite Materials, Madrid, Spain, July 1993, Vol.IV, pp. 560-567.
4. Long, A.C. and Rudd, C.D. “A simulation of reinforcement deformation during theproduction of preforms for liquid moulding processes”, Proc. I.Mech.E. Journal ofEngineering Manufacture, Vol. 208, 1994, pp. 269-278.
5. Boisse, P., Cherouat, A., Gelin, J.C. and Sabhi, H. “Experimental study and finiteelement simulation of a glass fibre fabric shaping process”, Polymer Composites, Vol.16, 1995, pp. 83-95.
6. Skelton, J. “Fundamentals of fabric shear”, Textile Research Journal, December1976, pp. 862-869.
7. Long, A.C., Rudd, C.D., Blagdon, M., Kendall, K.N. and Demeri, M. Proc.10th Int.Conf. on Composite Materials, Whistler, B.C., Canada, August 1995, Vol. III, pp.205-212.

Proceedings of ICCM–11, Gold Coast, Australia, 14th-18th July 1997
V - 249
NEW TEXTILE PREFORMS AND PROCESSINGCONCEPTS FOR THE MANUFACTURE OF LOW-
COST THERMOPLASTIC COMPOSITECOMPONENTS
H. Stumpf, T. Otto, K. Schulte
Technical University Hamburg-Harburg, Polymer & Composites SectionDenickestrasse 15, D-21071 Hamburg, Germany
SUMMARY: Newly developed thermoplastic textile preforms for composite production con-taining matrix material and reinforcement fibers in a non-impregnated form appear veryfavorable in view of the general urge for cost reduction. An attempt has been made to developtools for predicting the forming behavior of a weft-inserted warp knitted sample textile of thistype. Good agreement was found between experiment and simulation for in-planedeformation, where even the loading-unloading hysteresis could be modeled. Moreover, themolding concept QUIKTEMP is presented shortly. It allows for the conduction of the wholecomposite part production in one mold, while being economically reasonable.
KEYWORDS: textile preform, warp knitting, split-film, weft inserts, drapeability, shaping,shear deformation, modeling, QUIKTEMP mold, fast heating and cooling
INTRODUCTION
A strong urge to reduce the weight of transportation vehicles can currently be observed in theautomotive, aerospace and railway industry, respectively. At the same time the market condi-tions and the available budgets put tight limits on the acceptable cost. In particular, any designthat is more costly than the conventional ones is not likely to progress into large scale applica-tions.
Composites appear to belong to the materials of choice when replacers for the state-of-the-artsteel constructions are discussed. As far as the mass applications are concerned only thermo-plastic matrix composites will be able to compete. The requirements of the respective indus-tries in regard to the maximum cycle time in mass applications apparently cannot be met withthe currently available thermoset resins.
As pointed out above only composite material solutions with a considerably lowered costhave a chance in the tough competition. For this reason, several recent developments focusedon the reduction of the material cost, when compared to the composite materials that havebeen known mainly from aerospace applications in the past two decades. Two principalapproaches can be observed: On the one hand, work is directed towards the use of less costlyfibers and matrix materials, respectively, such as glass fibers and polypropylene matrices, forinstance. On the other hand efforts are undertaken to reduce the processing cost all along the

Volume V: Textile Composites and Characterisation
V - 250
way from the constituent production to the composite part. Particularly the development ofnew textile preforms has attracted much interest.
Since it is hardly economical to place single fibers in order to produce a composite part, it isevident that in most cases some kind of preform will be employed. When continuous fiberreinforced composites are considered textile preforms have been proven in the past to be veryfavorable. Textile manufacture and processing has been known for centuries and can beapplied in mass production at a very low cost and high productivity, respectively.
"DRY IMPREGNATED" TEXTILE PREFORMS - MATERIALS AND PROCESSING
In this paper we are concerned with textile preforms that contain both the reinforcement fibersand the matrix material of the composite to be made. However, unlike in many other preformssuch as pre-impregnated sheets, in the cases considered the material is unconsolidated and thematrix polymer is present merely in its original form, i.e. as textile yarn, as powder thatadheres to the textile or similar. It should be noted that the matrix yarns can have any crosssectional shape (that is, also split-films are covered by this term, which will be explainedlater) or length. The textile can thus be seen as a "dry mixture" of the reinforcement fibers andthe matrix.
According to the underlying philosophy, impregnation of these textile preforms would beachieved when the final composite part is produced. The processing of the material (after thetextile manufacture) would thus be reduced to one step to be conducted in a press. This bearsa considerable technical and economical potential:• reduced preform material cost, since no impregnation of the preform is needed• reduced production cost, due to the absence of pre-consolidation and other intermediate
steps• availability of the full drapability of the dry textile preform, which facilitates the produc-
tion of complex shapes
As far as the second point is concerned it should be noted that conventional thermoplasticprepregs are usually pre-compacted in a double-belt press in order to obtain organosheets andto complete the pre-impregnation. This machinery needs a very high invest, while the produc-tion rate is not of infinite magnitude. Efforts to significantly reduce the cost of the thermo-plastic prepreg-material thus suffer from inherent, tight constraints.Various techniques to combine matrix material and reinforcement fibers in a textile withoutpre-impregnation have been considered in the past:
1. Techniques that combine matrix and reinforcement fiber before the manufacture of atextile• commingled rovings incorporating thermoplastic staple yarns (air-textured, friction-
spun etc. [1]) processed with any textile technique• commingled rovings incorporating continuous thermoplastic yarns (on-line assembled)
processed with any textile technique• FIT ('fibres impregnées thermoplastiques': powder coated reinforcement yarns)• other
2. Techniques that combine matrix and reinforcement yarn by the textile processing• co-woven structures (conventional thermoplastic yarns or other)• co-knitted structures (conventional thermoplastic yarns, thermoplastic split-film etc.)• other (stitch-bonding of nonwovens etc.)

Proceedings of ICCM–11, Gold Coast, Australia, 14th-18th July 1997
V - 251
The first group cited usually gives a more homogenous distribution of matrix and reinforce-ment fibers, respectively, already in the textile preform. This most likely yields an even fiberdistribution in the eventual composite. It should be noted at this point that during mostprocesses (impregnation/consolidation) the fibers do not move over long distances, especiallywhen short cycle times are considered, due to the viscosity of the molten matrix and theabsence of a driving pressure gradient. Especially the now commercially availableTWINTEX-roving (by Vetrotex S.A.) has recently attracted interest. Textile structuresproduced with this roving were transformed to composite parts without substantial problemsin many applications. Minor potential problems arising from the shrinkage of thethermoplastic constituents of the roving are pointed out in [2].
The second group of techniques usually is favorable for the lower preform cost achievablewith it, since yet one processing step less is needed. However, care has to be taken in order toensure adequate impregnation when short cycle times are considered. The selection of fiber-matrix-systems with low melt viscosity and good wetting behavior is thus mandatory. It isalso necessary to optimize the textile architecture for an even fiber distribution i.e. withoutmatrix rich regions in the composite.
A development falling in the second group is currently carried out by the authors togetherwith multiple partners in the context of an international consortium. While the presentation ofthis project is not the aim of the current paper, a short introduction should be given, since thedeformation behavior of a type of material like developed there shall be considered. Acomprehensive report can be found elsewhere [2, 3].
The basic idea is to produce a preform that combines both the matrix material in the form ofsplit-film and the reinforcement rovings. Split-film is a special term for continuos thermo-plastic film that has been cut lengthwise into tapes of small cross section. The resultant yarn ismuch less expensive than conventional (i.e. spun) fibers, but nevertheless well-suited toclassical textile operations. Warp knitting of split-film only has been known for a long time asa favorable technique to produce low-cost net-type textile structures in large volumes. Warpknits also exhibit a great drapability. For this reason it was intended to combine warp knittingwith weft-inserted reinforcement fibers to obtain a structure like the one displayed in figure 5(see third section), hence a non-crimp fabric. In the (uniaxial) version shown the loops aremade from split-film and melt away during composite production. This textile comprised atricot loop-structure of polypropylene split-film and weft-inserted glass-rovings with acommercial composite sizing.
DEFORMATION BEHAVIOR OF THE TEXTILE PREFORM
As described above, one fundamental treat of the intended processing route is that the dry,non-molten fabric be inserted in the final compression step where the composite part isformed. Clearly, this gives a much larger formability of the fabric when being compared to apre-consolidated organosheet. This is especially true when the melting of the matrix thermo-plastic does not take place before the material is put in the mold in order to be formed to thefinal part shape. The latter is incorporated in a process according to the QUIKTEMP conceptas described below.

Volume V: Textile Composites and Characterisation
V - 252
Nevertheless, it is crucial that the textile is not susceptible to wrinkling in large deformationstates. The occurrence of folds and wrinkles constitutes a process limit, since this is notacceptable in terms of part quality. Hence, special attention has to be given to this subject.
At this point it should be noted that complex shaping operations nearly always involve largelocal shear deformations. This deformation mode is likely to yield wrinkling of the fabric [4]and, therefore, needs to be examined in depth. Figure 1 shows the classical deformation of arectangular piece of fabric by deep-drawing with a spherical punch. As indicated, extensiveshear deformation is encountered in the corners of the textile. This example is to show thatvirtually all deforming processes of initially flat materials into doubly curved surfaces yieldlarge-angle shearing.
2
1
Fig. 1: Shaping of a piece of fabric over a spherical surface; large local shear deformation isencountered
In-plane axial deformations, on the other hand, are often not so critical, since substantial pre-tensioning is usually applied by clamps at the fabric edges or other devices. The resultingbiaxial stress states then merely exhibit positive stress values (tension) in both directions andthus exclude wrinkling, which is mainly caused by the presence of zero or compressivestresses/strains in the respective directions.
It should also be mentioned that the reinforcement textiles in questions often exhibit a shearrigidity of some two or three orders of magnitude lower than the axial stiffnesses in the direc-tion of the reinforcement fibers, due to a large content of oriented yarn portions in the textile.Inevitably, in deformations without severe constraints that prescribe the local strains (i.e. faraway from the clamped edges) the shear mode is much easier activated than the axial defor-mation modes. This underlines the necessity to be especially concerned with the shearbehavior of these textiles. It should be defined more clearly that this reasoning addresses theshearing obtained by the relative rotation one or more initially inclined (to each other) fiberfamilies about the cross-over points. This mode is, for instance, encountered in a lattice-liketextile architecture in trellis shear or similar.

Proceedings of ICCM–11, Gold Coast, Australia, 14th-18th July 1997
V - 253
a) woven
b) warp
Fig. 2: Woven (a) vs. warpknitted fabric (b)
For completeness also the bending of the textile preform should be addressed. It is very diffi-cult to access the behavior of fabrics in this deformation mode. Moreover, the bending radii intechnical shaping operation are rarely so small that they fall into the range where buckling-outof the textile constituents (i.e. reinforcement rovings) is a problem. Since the biaxial curvatureloadcases to a large extent result in local shear as already pointed out, we choose to neglectthe bending rigidity and to assume a membrane-like behavior for the moment.
The deformation behavior of the preforms certainly is largely dependent on the specific textilearchitecture. Figure 2 shows a warp knitted structure in comparison to a woven. Generally itcan be said that knitted fabrics are less susceptible to wrinkling than wovens, since their loopstructure can accommodate large deformations much more easily [2, 4]. This seems to applyeven for uni- or multiaxial weft-inserted warp knits (as shown in figure 3), where the biaxialversions (not shown explicitly) resemble woven structures to a certain extent. Apparently theabsence of interlocking of the reinforcement rovings in these non-crimp fabrics is favorableespecially in regard to the shear behavior [4]. Ongoing work of the authors is directed to thisaspect.
As a consequence of the above we are mainly concernedwith the shear behavior of the textile preforms in question.For the simplicity of the experimental setup we choose todeal with the trellis shear mode (compare the schematicsketch of the device in figure 4). It should be stressed at thispoint that this mode has to be clearly distinguished fromboth pure shear and simple shear, as indicated e.g. by Hearleet al. [5]. Only for small deformations the respective shearresistances might be coincident. Our eventual objective is todevelop a model that can be employed to predict theforming behavior. However, for this purpose the trellis sheartest is just as good as another one, since the specific setupcan be incorporated in a finite element model and the textilemodel parameters then be adjusted to fit the experimentalcurve.
Nevertheless, in the case of a trellis shear test care has to betaken that the reinforcement fiber families in the textile areexclusively parallel to the ankles of the trellis, when theresistance to relative rotation of the fiber families is to bemeasured. Otherwise a considerable axial stretch of at leastone family of fibers would be the consequence (comparee.g. [6]), resulting in a greatly increased deformation forcethat is rarely encountered in practical three-dimensionalforming operations. This would prohibit the measurement ofthe shear resistance as intended. Hence, the trellis shear testwith the current objective is only applicable to uniaxiallyand biaxially reinforced textiles such as wovens or warpknits with uni- or biaxial weft-insertion. For multiaxiallyweft-inserted warp-knits a setup as proposed by Hörsting [4]is needed.
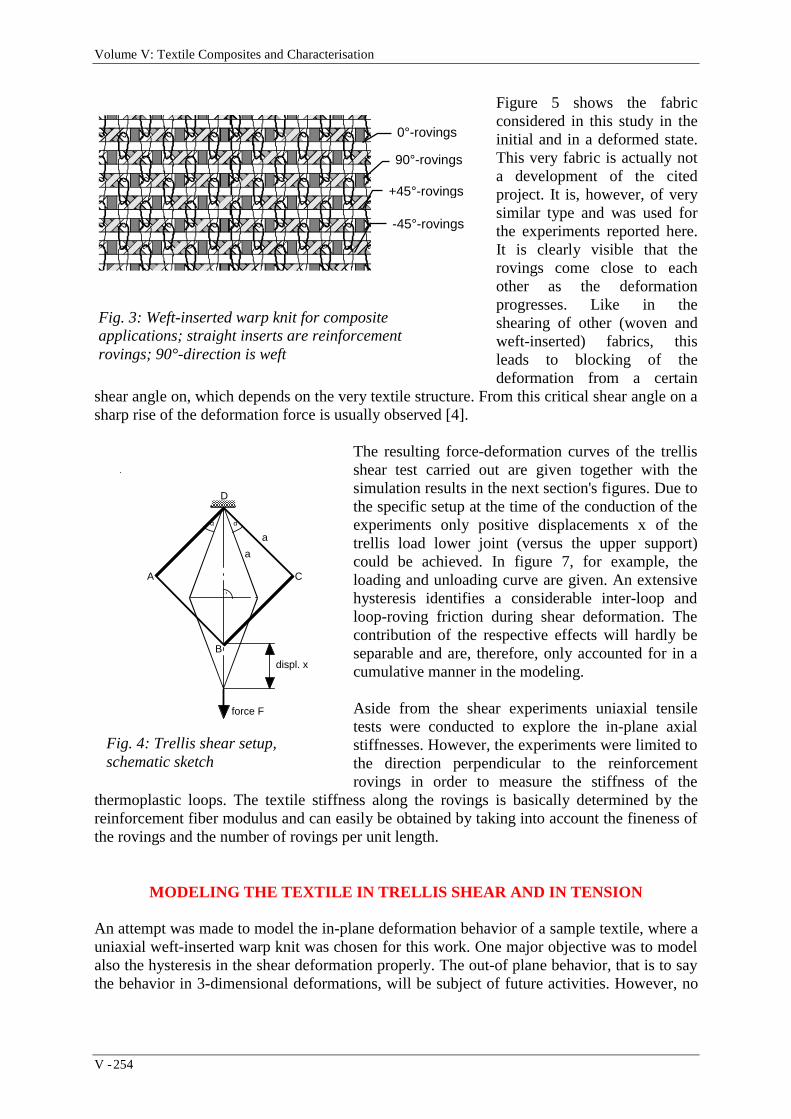
Volume V: Textile Composites and Characterisation
V - 254
Figure 5 shows the fabricconsidered in this study in theinitial and in a deformed state.This very fabric is actually nota development of the citedproject. It is, however, of verysimilar type and was used forthe experiments reported here.It is clearly visible that therovings come close to eachother as the deformationprogresses. Like in theshearing of other (woven andweft-inserted) fabrics, thisleads to blocking of thedeformation from a certain
shear angle on, which depends on the very textile structure. From this critical shear angle on asharp rise of the deformation force is usually observed [4].
The resulting force-deformation curves of the trellisshear test carried out are given together with thesimulation results in the next section's figures. Due tothe specific setup at the time of the conduction of theexperiments only positive displacements x of thetrellis load lower joint (versus the upper support)could be achieved. In figure 7, for example, theloading and unloading curve are given. An extensivehysteresis identifies a considerable inter-loop andloop-roving friction during shear deformation. Thecontribution of the respective effects will hardly beseparable and are, therefore, only accounted for in acumulative manner in the modeling.
Aside from the shear experiments uniaxial tensiletests were conducted to explore the in-plane axialstiffnesses. However, the experiments were limited tothe direction perpendicular to the reinforcementrovings in order to measure the stiffness of the
thermoplastic loops. The textile stiffness along the rovings is basically determined by thereinforcement fiber modulus and can easily be obtained by taking into account the fineness ofthe rovings and the number of rovings per unit length.
MODELING THE TEXTILE IN TRELLIS SHEAR AND IN TENSION
An attempt was made to model the in-plane deformation behavior of a sample textile, where auniaxial weft-inserted warp knit was chosen for this work. One major objective was to modelalso the hysteresis in the shear deformation properly. The out-of plane behavior, that is to saythe behavior in 3-dimensional deformations, will be subject of future activities. However, no
Fig. 3: Weft-inserted warp knit for compositeapplications; straight inserts are reinforcementrovings; 90°-direction is weft
a
a
A C
B
D
αα
.
displ. x
force F
Fig. 4: Trellis shear setup,schematic sketch
90°-rovings
+45°-rovings
-45°-rovings
0°-rovings

Proceedings of ICCM–11, Gold Coast, Australia, 14th-18th July 1997
V - 255
principal problems should arise in usingthe same model, since apart from the out-of-plane bending the fundamentaldeformation modes are equal.
We will at first be concerned with theadequate representation of the shearbehavior and then show that the modelwith the same set of parameters is alsovalid for the tensile test in the loopdirection (warp). Standard finite elementtechniques are applied in all cases. Forconvenience the ankles of the trellis sheartester were modeled by very stiff beamsin order to prescribe the trellis shearkinematics. Since a homogeneousdeformation field was found in theexperiments it was chosen for the sake ofa low numerical expense to model only asmaller portion of the textile (square ofsize 10x10 mm2 in, while the shear testerwas a square of ca. 170x170 mm2).
In the setup chosen the reinforcementrovings are represented by standardEuler-Bernoulli beam elements. Figure 6shows the model. Apparently substantialfriction is encountered in the loops andbetween loops and rovings as thedeformation progresses (compare theexperimentally observed hysteresis infigure 7). The thermoplastic loops werethus modeled by rods with non-linearforce-extension behavior. Since thenumerous friction effects occurring can hardly be separated it was decided to represent theloop volume between the reinforcement rovings by pairs of mutually orthogonal elastic-plastic rods with a certain work hardening rule, all inclined with respect to the rovingdirection (compare figure 6, where only half of the rods is actually elastic-plastic; the rest iselastic for the sake of computation time reduction).
In the case currently considered the location and orientation of the rods must not necessarilycoincide with the loop yarns. The elastic-plastic material parameters were adjusted so that themacroscopically observed non-linear force-displacement curve with hysteresis was met. How-ever, during this process it was found that the rather steep slope of the curve at large shearangles could never be modeled. Hence, when the small-angle shear part of the curve was fit,the rigidity given by the model was much to low for large shear angles, whereas a fitting ofthe large-angle shear resulted in considerably larger rigidity predictions in the low range thangiven by the experimental values.
x = 65 mm
Fig. 5: Undeformed (x=0 mm) and deformed(x=65 mm) fabric state; loops from polypro-pylene split-film, weft-inserted glass rovings
(inital spacing: 1.9 mm)
x = 0 mm
split-film(underlap)
roving

Volume V: Textile Composites and Characterisation
V - 256
xshear tester (elastic beam)
roving (elastic beam)
special element (’orthogonal stiffness‘)
elastic rod
elastic-plastic rod
Fig. 6: Finite element model assembled from linear elastic beams, elastic-plastic (and linearelastic) rods and an especially developed 'orthogonal stiffness' element
Physically this effect is related to the compression of the loop system (and to a certain extentto the compression of the rovings, dependent on the textile's parameters), that yields 'blocking'of the deformation when the rovings come very close to each other at large shear angles, aspointed out already above. However, any rod that is fixed to nodes on the beam elementsrepresenting the reinforcement rovings, regardless of the original orientation, cannot displaythis increase of stiffness orthogonal to the rovings. The projected stiffness of the rod in thisdirection will rather decrease, since a continuos inclination takes place as the shearprogresses. This is a fundamental conflict resulting from the formulation of a finite elementmodel with the available standard elements.
Therefore, a special finite element was developed, which, in a qualitative manner, preciselydisplays the compressional stiffness of the loop volume orthogonal to the rovings. Withproper parameters this element can also display the tension behavior of the loop system. Therepresentation of the axial stiffness orthogonal to the rovings is then exclusively taken over bythe 'orthogonal stiffness' element, whereas the elastic-plastic rods are adjusted so that themodel as a whole is in accordance with the textile's shear behavior. The tensile behavior ofthe textile in the roving direction is represented by the axial stiffness of the respective beamelements. Details on the 'orthogonal stiffness' element will be given in a detailed publicationwhich is currently being prepared [7].
Figure 7 shows the results of experiment and simulation in one diagram. Apparently theagreement is very good, even for the unloading curve, which is subject to extensive hysteresis.The model with identical parameters was also tested for its behavior in tension orthorgonal tothe roving direction. The predicted force-displacement curve is shown in figure 8 togetherwith the corresponding experimental curve. Again, experiment and simulation agree verywell. In this example, the stiffness value of the 'orthogonal stiffness' elements accumulatedover the specimen width was close to the rigidity of the real specimen in this direction, hencethese elements represented the major part of the model tensile stiffness orthogonally to therovings and at the same time modeled the loop compression in shearing properly.

Proceedings of ICCM–11, Gold Coast, Australia, 14th-18th July 1997
V - 257
-0.1
0
0.1
0.2
0.3
0.4
0.5
0.6
0.7
0.8
0.9
1
0 0.1 0.2 0.3 0.4 0.5 0.6 0.7 0.8 0.9 1
Normalized displacement x/x max
Nor
mal
ized
forc
e F
/Fm
ax
ExperimentSimulation
Maximum values (experiment): xMmax: 65 mm FMmax: 46 N Simulation results scaled to exp. specimen size
Fig. 7: Loading and unloading force-displacement curve in trellis shear; experiment andsimulation in comparison
0
50
100
150
200
250
300
350
400
0 0.5 1 1.5 2 2.5 3
Displacement x [mm]
For
ce F
[N]
Experiment
Simulation
Test direction: warp (orthogonal to rovings)
FFSpecimen
Clamps
5 mm
25 mm
Fig. 8: Fabric in uniaxial tension orthogonal to the rovings; load-displacement curve ofexperiment and simulation in comparison
For obvious reasons it would be favorable to have a continuous representation (i.e. shell ormembrane finite elements) of the fabrics considered. However, with the high degree ofanisotropy, in particular the extremely low shear rigidity and a poisson contraction behaviorthat is typically far from anything known from continuous solids, at this points it seemsquestionable to the authors whether this will be achievable in the near future, when not someof the accuracy requirements are dropped. The combined beam/truss representation on theother hand appears to be an interesting alternative. The incorporation into larger models andcomplex shaping simulations have to be investigated in the near future.
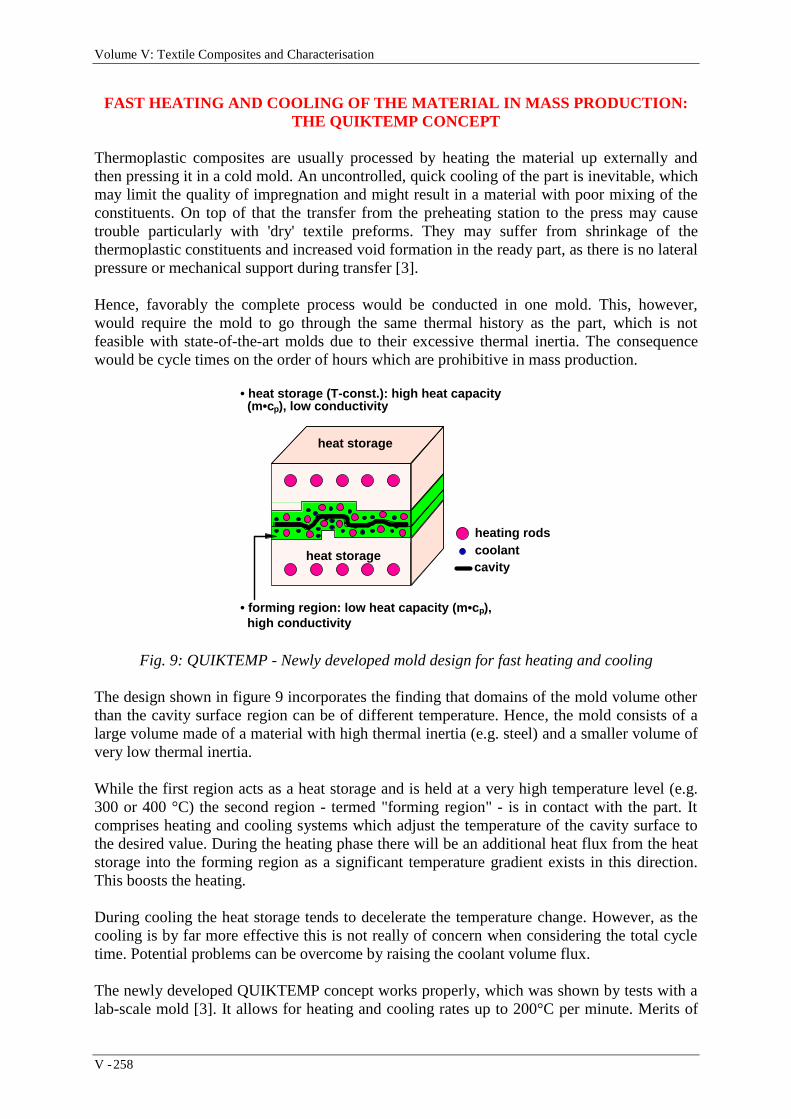
Volume V: Textile Composites and Characterisation
V - 258
FAST HEATING AND COOLING OF THE MATERIAL IN MASS PRODUCTION:THE QUIKTEMP CONCEPT
Thermoplastic composites are usually processed by heating the material up externally andthen pressing it in a cold mold. An uncontrolled, quick cooling of the part is inevitable, whichmay limit the quality of impregnation and might result in a material with poor mixing of theconstituents. On top of that the transfer from the preheating station to the press may causetrouble particularly with 'dry' textile preforms. They may suffer from shrinkage of thethermoplastic constituents and increased void formation in the ready part, as there is no lateralpressure or mechanical support during transfer [3].
Hence, favorably the complete process would be conducted in one mold. This, however,would require the mold to go through the same thermal history as the part, which is notfeasible with state-of-the-art molds due to their excessive thermal inertia. The consequencewould be cycle times on the order of hours which are prohibitive in mass production.
heating rodscoolantcavity
heat storage
• heat storage (T-const.): high heat capacity (m•cp), low conductivity
heat storage
• forming region: low heat capacity (m•c p), high conductivity
Fig. 9: QUIKTEMP - Newly developed mold design for fast heating and cooling
The design shown in figure 9 incorporates the finding that domains of the mold volume otherthan the cavity surface region can be of different temperature. Hence, the mold consists of alarge volume made of a material with high thermal inertia (e.g. steel) and a smaller volume ofvery low thermal inertia.
While the first region acts as a heat storage and is held at a very high temperature level (e.g.300 or 400 °C) the second region - termed "forming region" - is in contact with the part. Itcomprises heating and cooling systems which adjust the temperature of the cavity surface tothe desired value. During the heating phase there will be an additional heat flux from the heatstorage into the forming region as a significant temperature gradient exists in this direction.This boosts the heating.
During cooling the heat storage tends to decelerate the temperature change. However, as thecooling is by far more effective this is not really of concern when considering the total cycletime. Potential problems can be overcome by raising the coolant volume flux.
The newly developed QUIKTEMP concept works properly, which was shown by tests with alab-scale mold [3]. It allows for heating and cooling rates up to 200°C per minute. Merits of
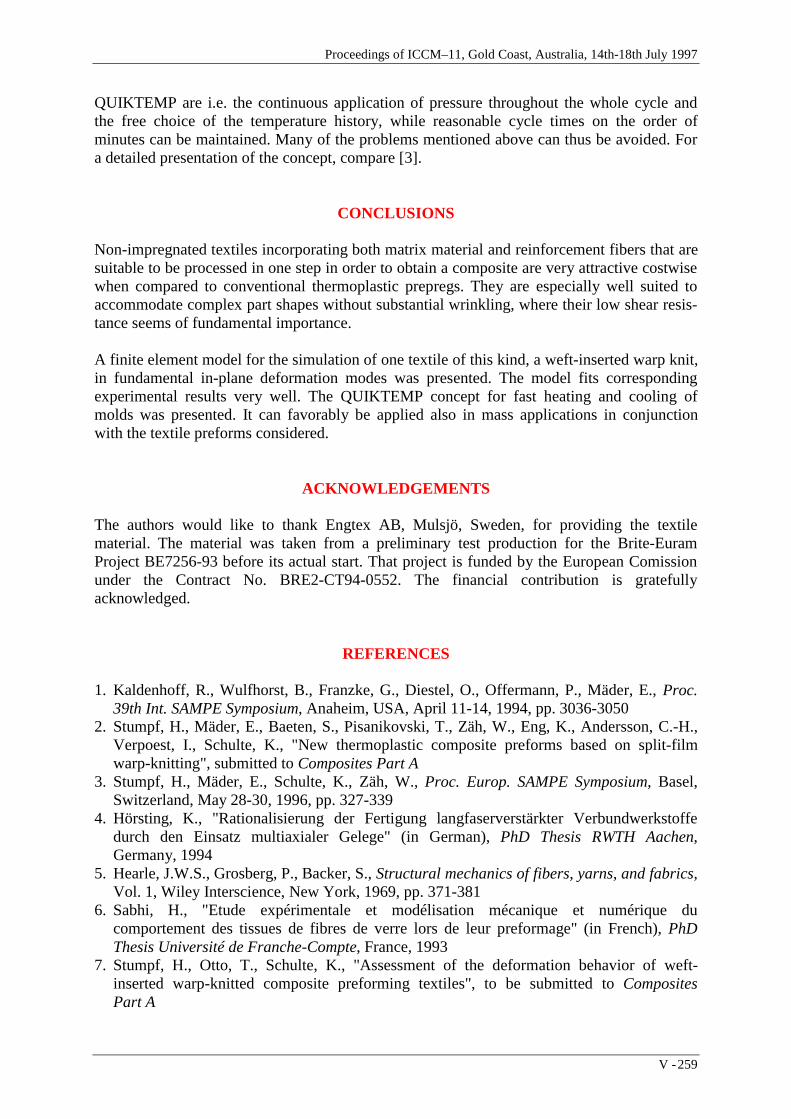
Proceedings of ICCM–11, Gold Coast, Australia, 14th-18th July 1997
V - 259
QUIKTEMP are i.e. the continuous application of pressure throughout the whole cycle andthe free choice of the temperature history, while reasonable cycle times on the order ofminutes can be maintained. Many of the problems mentioned above can thus be avoided. Fora detailed presentation of the concept, compare [3].
CONCLUSIONS
Non-impregnated textiles incorporating both matrix material and reinforcement fibers that aresuitable to be processed in one step in order to obtain a composite are very attractive costwisewhen compared to conventional thermoplastic prepregs. They are especially well suited toaccommodate complex part shapes without substantial wrinkling, where their low shear resis-tance seems of fundamental importance.
A finite element model for the simulation of one textile of this kind, a weft-inserted warp knit,in fundamental in-plane deformation modes was presented. The model fits correspondingexperimental results very well. The QUIKTEMP concept for fast heating and cooling ofmolds was presented. It can favorably be applied also in mass applications in conjunctionwith the textile preforms considered.
ACKNOWLEDGEMENTS
The authors would like to thank Engtex AB, Mulsjö, Sweden, for providing the textilematerial. The material was taken from a preliminary test production for the Brite-EuramProject BE7256-93 before its actual start. That project is funded by the European Comissionunder the Contract No. BRE2-CT94-0552. The financial contribution is gratefullyacknowledged.
REFERENCES
1. Kaldenhoff, R., Wulfhorst, B., Franzke, G., Diestel, O., Offermann, P., Mäder, E., Proc.39th Int. SAMPE Symposium, Anaheim, USA, April 11-14, 1994, pp. 3036-3050
2. Stumpf, H., Mäder, E., Baeten, S., Pisanikovski, T., Zäh, W., Eng, K., Andersson, C.-H.,Verpoest, I., Schulte, K., "New thermoplastic composite preforms based on split-filmwarp-knitting", submitted to Composites Part A
3. Stumpf, H., Mäder, E., Schulte, K., Zäh, W., Proc. Europ. SAMPE Symposium, Basel,Switzerland, May 28-30, 1996, pp. 327-339
4. Hörsting, K., "Rationalisierung der Fertigung langfaserverstärkter Verbundwerkstoffedurch den Einsatz multiaxialer Gelege" (in German), PhD Thesis RWTH Aachen,Germany, 1994
5. Hearle, J.W.S., Grosberg, P., Backer, S., Structural mechanics of fibers, yarns, and fabrics,Vol. 1, Wiley Interscience, New York, 1969, pp. 371-381
6. Sabhi, H., "Etude expérimentale et modélisation mécanique et numérique ducomportement des tissues de fibres de verre lors de leur preformage" (in French), PhDThesis Université de Franche-Compte, France, 1993
7. Stumpf, H., Otto, T., Schulte, K., "Assessment of the deformation behavior of weft-inserted warp-knitted composite preforming textiles", to be submitted to CompositesPart A

Volume V: Textile Composites and Characterisation
V - 260
THE EFFECT OF WEFT BINDER PATH LENGTH ONTHE ARCHITECTURE OF MULTI-LAYER WOVEN
CARBON PREFORMS
B. Lee1, I. Herszberg2, M. K. Bannister3, J. I. Curiskis4
1 Royal Melbourne Institute of Technology (RMIT), Department of Fashion and TextileDesign, City Campus, GPO Box 2476V, Melbourne, 3001, Australia.
2 Royal Melbourne Institute of Technology, Department of Aerospace Engineering, The SirLawrence Wackett Centre for Aerospace Design Technology, GPO Box 2476V, Melbourne,
3001, Australia.3 Cooperative Research Centre for Advanced Composite Structures, 506 Lorimer St.
Fishermens Bend, Vic. 3207, Australia.4 School of Fibre Science and Technology, The University of New South Wales, Sydney, 2052,
NSW Australia.
SUMMARY: Multilayer woven preforms were manufactured from 12K carbon tows and 1Kbinder yarns with orthogonal weft binder. The effects of weft binder path before and afterliquid moulding compaction were examined. A theoretical study analysed the effect of weftbinder path length on the geometry of multi-layer woven carbon preforms. A differentialwarp yarn tension model was established to indicate the required warp yarn tension duringweaving in order to produce a uniform weave architecture. It was found that the creation of adefined binder path length would ensure a uniform preform structure with minimum resin richareas, and weaving with the optimal binder path length would ensure the production of amultilayer preform of acceptable quality.
KEYWORDS: weft binder, nominal binder length, minimal binder length, binder lockinglength, differential warp tension
INTRODUCTION
The use of fibre reinforced composite structures has been limited by their high cost ofproduction and their poor resistance to damage. Using well developed textile technologies,such as multilayer weaving, structural preforms with three-dimensional fibre architecturesmay be produced [1,2]. Liquid moulding techniques may then be used to impregnate thepreform with resin. These highly automated processes have the potential to produce low-cost,reliable composite structural components of complex shapes [3]. Due to the three-dimensional nature of the fibre architecture such structures are less prone to delamination andtheir impact resistance is significantly increased [4].
Glass and carbon fibre yarns are highly rigid and inextensible. Unlike textile fibres, thesehigh-performance fibre yarns have to be controlled individually over their warp yarn tensionduring weaving. Due to the complex nature of warp and weft interaction over theirinterlacing points, it is difficult, but important to predict the fibre architecture in the preform

Proceedings of ICCM–11, Gold Coast, Australia, 14th-18th July 1997
V - 261
and the composite, which will determine the mechanical behaviours of the composite. Theinfluence of the weaving parameters upon the fibre orientation is significant, and must bequantified in order to design and manufacture successful composite structures [2].
The idealised fibre arrangements in a preform structure would provide full straightness oftows and therefore would enhance the in-plane mechanical properties of the composite. Oneof the commonly used three-dimensional woven architectures has a lattice of non-crimpedwarp and weft yarns held in place by a relatively thin binder yarn which provides through-thickness interlacing and which forms the basis of the through-thickness strength.Traditionally, these binder yarns have been warp binders. More versatility in the design of thearchitecture may be achieved by using weft binders. However, early preforms produced usingweft binders had non-uniform architectures and resin rich zones, and this was probably due tothe irregular binder path length placement across the width of the fabrics.[2]
This paper describes a preliminary study on the effect of weft binder path length on thepreform architecture for an 11 layer (6 warp, 5 weft) multilayer woven preform withorthogonal weft binders. The preforms were woven from 12K carbon tows and 1K binderyarns. A theoretical analysis is presented to study the relationship between binder path lengthand resin rich area. A differential warp yarn tension model is also presented.
SPECIMEN PRODUCTION
Multilayer preforms were produced with different binder path lengths on a 16 shafts tableloom. They were constructed from carbon yarn of 12k tows with six layers of warp and fivelayers of weft in an orthogonal woven structure. Weft binders (1k tows) were used tointerlace the lattice of warps and wefts in a through-thickness and alternatively offset fashion.A schematic diagram of the generic architecture is shown on Fig. 9.
After preform manufacture, samples of the fabric were cut out and moulded into compositepanels by using RTM process and RTM 6 resin. Composite thickness upon RTM was 3.2mmand Fibre Volume Fraction was 60%. Specimens were sectioned along both the binder andwarp directions, and the sections were examined through an optical microscope. To examinethe fibre architecture directly after weaving, the preform was wet out with epoxy resin byhand and then cured at room temperature for 24 hours without applying consolidationpressure.
RESULTS AND DISCUSSION
Figs. 1 and 2 are microphotographs of warp and weft sections respectively, of a compositeproduced with a short weft binder length.

Volume V: Textile Composites and Characterisation
V - 262
Fig. 1: Multilayer woven structure Fig. 2: Multilayer woven structure with a with a short binder length, consolidated without short binder path length, consolidatedpressure (sectioned along binder direction) without pressure (sectioned along warp
direction)
As shown on Fig. 1, the weft binder followed a wavy path and impeded warp yarns fromspreading evenly, causing resin rich zones outside the binder loop. The cross-sectional shapeof a warp column became elliptical. From Fig. 2, It may be observed that weft yarns werepushed away from the binder and warp yarns were forced to crimp. The resulting weft wasuneven and of low density allowing extensive resin rich regions.
Figs. 3, 4 and 5 are microphotographs of composites made from preforms with optimal weftbinder length. Figs. 3 and 4 depict warp and weft sections, respectively, of the compositeconsolidated without compaction pressure and hence gives an indication of the preformarchitecture. Fig. 5 depicts a warp section of the composite consolidated under a compactionpressure of 276 kPa. Fig. 3 shows that a near ‘square shape’ binder path may be achievedwhich allows a uniform distribution of warp yarns and minimises the extent of resin-richareas. As may be seen from Fig. 4 the wefts are uniform and tightly packed. Fig. 5 shows thatwhen consolidated under compaction pressure a uniform structure with straight wefts andvertical binder yarns may be achieved.
Fig. 3: Multilayer woven structure with a near ‘square shape’ binder path, consolidatedwithout pressure (sectioned along binder direction)

Proceedings of ICCM–11, Gold Coast, Australia, 14th-18th July 1997
V - 263
Fig. 4: Multilayer woven structure with a ‘near square shape’ binder path, consolidatedwithout pressure (sectioned along warp direction)
Fig. 5: Multilayer woven structure with a near ‘square shape’ binder, consolidated withpressure (sectioned along binder direction)
Compressed and consolidated composite structures were shown on Fig. 5 and Fig. 6. Thecomposite architecture in Fig. 5 was achieved with a near ‘square shape’ binder path. Itdemonstrated that the resin rich areas were kept to a minimum. The binder path length of thisstructure has an optimal length, leading to straight tows of a composite architecture withminimal resin rich areas.
Fig. 6 shows a composite structure with a slightly longer than the nominal binder path length.The sign of binder buckling occurred within the layers after consolidation, due to the extrabinder path length. Fig. 7 demonstrates the longer than the nominal binder path structurewithout applying consolidating pressure.
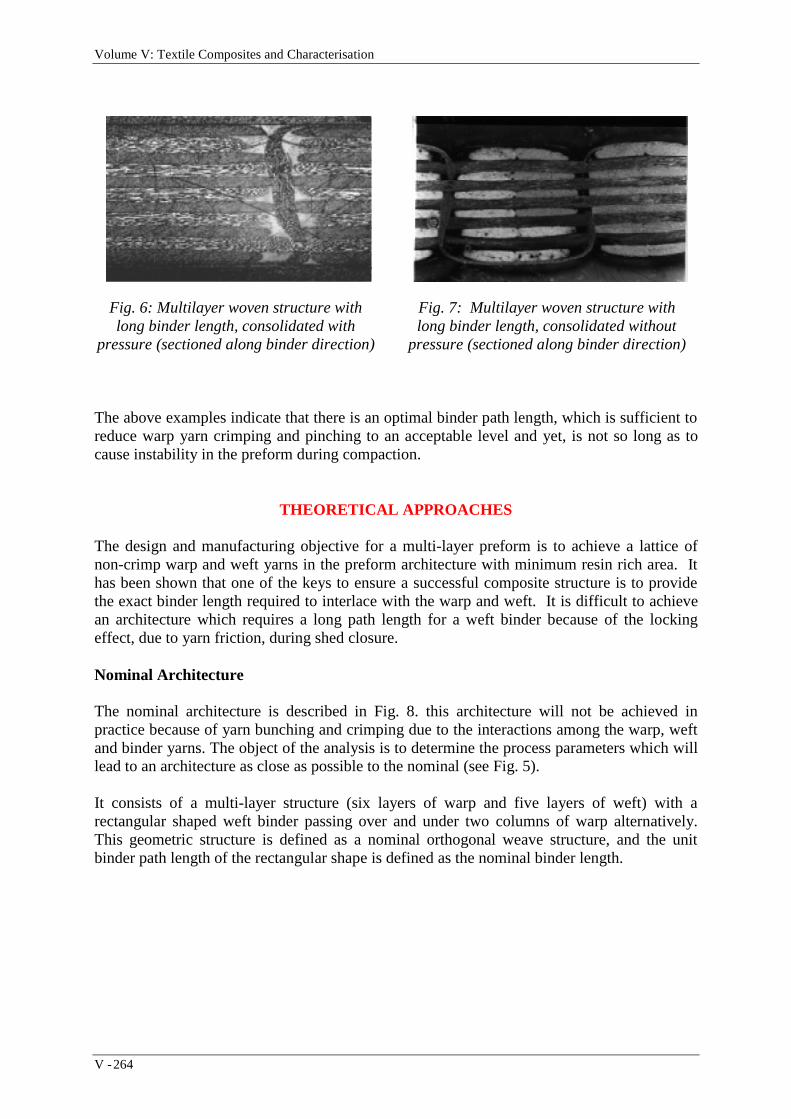
Volume V: Textile Composites and Characterisation
V - 264
Fig. 6: Multilayer woven structure with Fig. 7: Multilayer woven structure withlong binder length, consolidated with long binder length, consolidated without
pressure (sectioned along binder direction) pressure (sectioned along binder direction)
The above examples indicate that there is an optimal binder path length, which is sufficient toreduce warp yarn crimping and pinching to an acceptable level and yet, is not so long as tocause instability in the preform during compaction.
THEORETICAL APPROACHES
The design and manufacturing objective for a multi-layer preform is to achieve a lattice ofnon-crimp warp and weft yarns in the preform architecture with minimum resin rich area. Ithas been shown that one of the keys to ensure a successful composite structure is to providethe exact binder length required to interlace with the warp and weft. It is difficult to achievean architecture which requires a long path length for a weft binder because of the lockingeffect, due to yarn friction, during shed closure.
Nominal Architecture
The nominal architecture is described in Fig. 8. this architecture will not be achieved inpractice because of yarn bunching and crimping due to the interactions among the warp, weftand binder yarns. The object of the analysis is to determine the process parameters which willlead to an architecture as close as possible to the nominal (see Fig. 5).
It consists of a multi-layer structure (six layers of warp and five layers of weft) with arectangular shaped weft binder passing over and under two columns of warp alternatively.This geometric structure is defined as a nominal orthogonal weave structure, and the unitbinder path length of the rectangular shape is defined as the nominal binder length.

Proceedings of ICCM–11, Gold Coast, Australia, 14th-18th July 1997
V - 265
Fig. 8: A nominal orthogonal weave structure
As shown on Fig. 8, the nominal binder path length can be expressed as
Ln = 4*A + 2* T (1) B.C.R. = T/2A (%)
where A is the width of warp yarn; T is the preform thickness; B.C.R. is binder crimping rate.
The thickness of the preform is T = 6*B + 5*C (mm) (2)
A*B = Yarn linear density / fibre density (* 10-3 mm2)
where B is the thickness of warp yarn; C is the thickness of weft yarn.
The Fibre Volume Fraction is
F.V.F. = Vf / VT (3) Vf = Wf / ρ
where ρ is the fibre density; Wf is the unit weight of fibre yarn.
Warp Yarn Pinching and Minimal Binder Path Length
When a binder path length was shorter than the nominal binder length, the binder path couldno longer be kept rectangular. As shown on Fig. 1 and Fig. 9, the binder would force the warpyarn to change its cross-sectional shape. It was assumed that 1) the two neighbouringcolumns of warp yarns were on the same horizontal axis plane; 2) the warp ends were notcrimped under the tension of weft binders. With the cross-sectional area of warp and weftyarn being constant, the binder path would decrease to a minimal length in order to maintainits structural stability. A minimal binder path is defined as the binder path length which isshorter than the nominal length, but not short enough to cause warp yarn to crimp.
%&
7
$

Volume V: Textile Composites and Characterisation
V - 266
Resin rich area
Fig. 9: A schematic diagram of binder forced resin rich area
The wavy minimal binder path (see Fig. 1) may be modelled as a series of ellipses and thepath length may be expressed as:
LA T
min( ' /2)= +
22
2 2
π (4)
where T’ is the fabric thickness when the binder is in an elliptical path.
The cross sectional area of the confined warp column is constant:
Sa = 1/4 * π * Α * T’/2 = T/2 * A
This leads to an expression for the preform thickness:
T/T’ = π/4 (5)
If A = 2.5 mm, T = 3.2 mm;then, T’ = 4.1 mm; Ln = 16.4 mm and; Lmin = 14.3 mm.
This indicates that a shorter binder length will lead to a thicker fabrics.
As shown earlier, the warp tows would be forced to bunch-up when the binder path length isshorter than the nominal length. For a minimal length binder, the warp yarns would be forcedinto an elliptical shape. If the binder length is further reduced, crimping of the warp yarns willoccur and neighbouring warp columns may move vertically with respect to one-an-other.
Resin Rich Area
As shown on Fig. 9, the short binder path forced the warp tows to bunch-up and generated av-shaped gap between tow warp columns. After resin infusion, this area formed a resin richchannel, which may become a microcrack initiation site [2]. The cross-sectional area of thisresin rich channel is given by:
Resin rich area = A * T’ - 2Sa (6)
Using the data given by the above example, the resin rich area would be 2.2 mm2.

Proceedings of ICCM–11, Gold Coast, Australia, 14th-18th July 1997
V - 267
Warp Yarn Crimping
When the binder is further shortened beyond the minimal length, the top and bottom layers ofwarp would be forced to crimp in order to accommodate the reduced binder length. Theresulting decrease of the crimp rate of the binder would be at the expense of the crimpgenerated in the warps.
Following Lord 1980 [5]; assuming the warp yarn being forced into a sinusoidal path andignoring yarn stiffness and the frictional effect between the binder and the warps, therelationship between the tensions in the warps, binders and their crimp amplitude may bedescribed as
Ab/Aw ≈ (λb/λw) * (tw/tb) (7)
where Ab is the crimp amplitude of the binder; Aw is the crimp amplitude of the warps; λb isthe pitch of the binder; λw is the pitch of the warp yarns; tb is the tension in the binder and tw isthe tension in the warps.
From Eqn. (7) it may be seen that the crimp amplitude in the warp is dictated by the tensionand spacing of the yarns. If the binder is kept at low tension (i.e. longer path length) whilst thetension in the warp direction is high, then there will be very little crimp in the warp andconsiderable crimp in the binder. Although the warp has bending stiffness which is muchhigher than that of the binder, and will consequently resist crimping, this effect may beneglected because the friction between the binder and warp yarns induces high binder tensionduring shed closure.
Weft Density
Once warp crimping occurs there is a severe restriction on the extent to which the weft yarnsmay be beat into the fabric. The resulting weft density is consequently lower and thedistribution of warp tows is uneven leading to resin rich regions. An exreme example of thismay be seen in Fig. 2.
Fibre Volume Fraction
From Eqn (3), F.V.F can be further expressed as:
F.V.F. = Vf / VT = [(Dw*Nw + Df * Nf) * Yy / ρ + (Df / λb) * (Yb / ρ)] / T (8)
where Dw is warp density; Nw is the number of warp layers; Df is weft density; Nf is thenumber of weft layers; Yy is the warp/weft yarn linear density and Yb is the binder yarn lineardensity.
Binder Buckling
Longer binder path length would generate binder buckling during preform compaction as maybe seen in Fig. 6. This will reduce the effectiveness of the binders in providing delaminationresistance.

Volume V: Textile Composites and Characterisation
V - 268
DIFFERENTIAL WARP TENSION SET-UP APPROACH
In a weaving machine, a proper tension control over warp yarn may produce the requiredbinder path. As shown on Fig. 10, the shed closure of warp yarns forces the weft binder toincrease its path length (crimp). However, the friction between the binder and warp yarnswould impede such an increment. The frictional force on the weft binder is of the greatest inthe central region and gradually decreases toward the edges according to Amonton’s law offriction: T2 = T1 eµθ assuming the binder being perfectly flexible. This indicates that adifferential warp tension set-up on the loom is crucial to achieve an uniform architectureacross the width of the fabric. The higher the tension in the warps, the longer the binder pathlength may be achieved. However, due to the practical restriction of the shedding height, thewidth of the fabric and also the adverse effect of higher tension on the quality of warp yarns(i.e. fibre damage), there exist a maximum achievable unit binder length. This specific binderlength may be defined as a “locking length”. If the locking length is longer than the minimalbinder length, then warp yarn crimp may not occur, and vice versa.
Fig.10: A schematic diagram of binder/warp yarn interaction
CONCLUSION
Multilayer woven carbon preforms have been produced. The fibre architecture examinationand theoretical analysis indicated that the creation of a defined binder path length will ensurean uniform preform structure with minimum resin rich areas and full straightness of warpyarns. The high tension induced in the binder due to the shed closure and the friction betweenthe binder and warp yarns may cause bunching of the warp yarns within the binder loopswhich would lead to undesirable resin-rich channels in the resulting composite. The bindermight further cause the warp yarns to crimp and so reduce the mechanical properties in thecomposite.
An optimal binder path length can be used in the production of an acceptable quality ofmultilayer preforms. It was around the nominal binder path length, and not less than theminimal length, which was sufficiently long to reduce crimping and pinching to an acceptablelevel and yet, was not too long so as to cause instability in the preform during compaction.Differential warp yarn tension set-up across the width of the fabric would ensure therealisation of such an uniform path length. Due to the practical limitation on warp tension,there is a restriction on the control of binder path length, the binder “locking length” definesthe basic ability of a loom to produce a multilayer preform with acceptable quality.

Proceedings of ICCM–11, Gold Coast, Australia, 14th-18th July 1997
V - 269
ACKNOWLEDGMENTS
We would like to thank Ms F. Coman for the assistance of preparing the photographs, Mr K.Houghton for the technical support in the RTM process.
REFERENCES
1. Hill, B. J., McIllhager R. and McLaughlin P., “Weaving multilayer fabrics forreinforcement of engineering components”, Composites Manufacturing No 4 1993,pp227-232.
2. Bannister, M.K., Herszberg, I., Coman, F., Raper, H., and Curiskis, J.I., “Manufactureand Analysis of Multilayer woven Preforms”, American Society of Composites NinthTechnical Conference, Delaware 1994.
3. Farley, G.L., Smith, B.T., Maiden, J., “ Compressive Response of Thick LayerComposite Laminates with Through-The-Thickness Reinforcement”, Journal ofReinforced Plastics and composites, Vol 11 July 1992.
4. Broslus, D., Clarke, S., “ Textile preforming techniques for low-cost structuralcomposites”, Advanced Composite Materials: New Developments and ApplicationsConference Proceedings, Detroit, Sept. 30 - Oct. 3, 1991, pp 1 - 10. Lord, P.,Mohamed, M.H., “Weaving: Conversion of Yarn to Fabric”, 2nd edition, MerrowPublishing Co. Ltd 1982.

Volume V: Textile Composites and Characterisation
V - 270
THE DESIGN PRINCIPLE AND WEAVINGTECHNOLOGY OF THREAD-LINKED BOX-BEAM
PREFORM
Yang Caiyun, Li Wenzhang, Guo Wenping
Department of Textiles,Tianjin Institute of Textile Science and Techonlogy,Chenglinzhuang Road, Hedong Distric, Tianjin, 300160, P.R. China
SUMMARY: Thread-linked box-beam preform is a new structure textile. There are manythreads between one pair opposite walls and these threads are woven together with the wallsto form a three dimensional integrated structure. These threads not only link the two oppositewalls but also keep them apart from a certain distance. The paper explores the principle offabric forming and the weave structure developed by us, introduces the weaving process indetail and also discusses some problems which should be noticed in weaving with this newstructure textile. It will certainly have a great value in developing and producing a new type oftextile composites.
KEYWORDS: box-beam preform, thread-linked, design principle, weaving technique,woven, centre-weft-stitching, stitching place, fabric specifications
INTRODUCTION
Thread-linked box-beam preform is a new structure of textile preform. The tradional wovenhollow fabric only has four connected walls which form a rectangle cross section. In this newstructure, there are many threads between one pair opposite walls and these threads are woventogether with the walls to form a three dimentional integrated structure. These threads notonly link the two opposite walls but also keep them apart from a certain distance. The preformcan be designed for specific applications such as a passage, a filter of gases or liquids, and afilling with sand, foam and so on, and its properties are varied by means of the material, fabricstructure and thread arrangement.It can contain up to 160,000 thread stitching places per m2
and can be produced with the spacing up to 1000 mm.The fabrics can also be coated,rubberised and cured to form a composite product.
The paper explores the principle of the fabric forming and the weave structure developed byus in three topic, intruduces the weaving process in detail and also discusses some problemswhich should be noticed in weaving with this new structure.
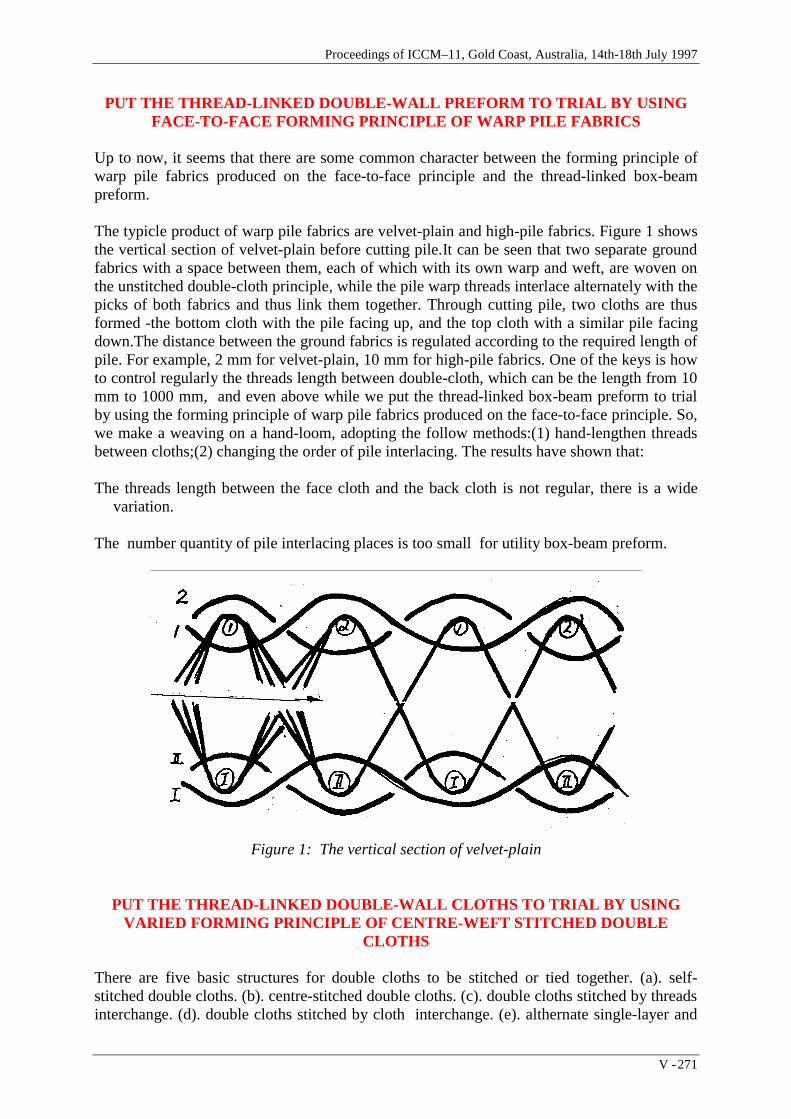
Proceedings of ICCM–11, Gold Coast, Australia, 14th-18th July 1997
V - 271
PUT THE THREAD-LINKED DOUBLE-WALL PREFORM TO TRIAL BY USINGFACE-TO-FACE FORMING PRINCIPLE OF WARP PILE FABRICS
Up to now, it seems that there are some common character between the forming principle ofwarp pile fabrics produced on the face-to-face principle and the thread-linked box-beampreform.
The typicle product of warp pile fabrics are velvet-plain and high-pile fabrics. Figure 1 showsthe vertical section of velvet-plain before cutting pile.It can be seen that two separate groundfabrics with a space between them, each of which with its own warp and weft, are woven onthe unstitched double-cloth principle, while the pile warp threads interlace alternately with thepicks of both fabrics and thus link them together. Through cutting pile, two cloths are thusformed -the bottom cloth with the pile facing up, and the top cloth with a similar pile facingdown.The distance between the ground fabrics is regulated according to the required length ofpile. For example, 2 mm for velvet-plain, 10 mm for high-pile fabrics. One of the keys is howto control regularly the threads length between double-cloth, which can be the length from 10mm to 1000 mm, and even above while we put the thread-linked box-beam preform to trialby using the forming principle of warp pile fabrics produced on the face-to-face principle. So,we make a weaving on a hand-loom, adopting the follow methods:(1) hand-lengthen threadsbetween cloths;(2) changing the order of pile interlacing. The results have shown that:
The threads length between the face cloth and the back cloth is not regular, there is a widevariation.
The number quantity of pile interlacing places is too small for utility box-beam preform.
Figure 1: The vertical section of velvet-plain
PUT THE THREAD-LINKED DOUBLE-WALL CLOTHS TO TRIAL BY USINGVARIED FORMING PRINCIPLE OF CENTRE-WEFT STITCHED DOUBLE
CLOTHS
There are five basic structures for double cloths to be stitched or tied together. (a). self-stitched double cloths. (b). centre-stitched double cloths. (c). double cloths stitched by threadsinterchange. (d). double cloths stitched by cloth interchange. (e). althernate single-layer and

Volume V: Textile Composites and Characterisation
V - 272
double-layer construction. Centre-stitching can be classified into two, centre-warp-stitchingand centre-weft-stitching. The basic principle of centre-wef- stitching is introducing the thirdsystem of weft whose whole function is to stitch the two otherwise separate layers of clothtogether.The centre-weft lie between the face and the back cloth which is for the purpose ofstitching occasionlly at a regular interval between the inter-layer cohesion.
The thread-linked double-wall cloths we want to weave is charactered not only integrated bystitching but seprated a distance from 10 mm to 1000 mm or even above. So, it is imposible touse the principle of centre-weft- stitching entirely. Thus we modify the principle of centre-weft-stitching. Firstly, the number of stitching places is designed only two for every onecentre-weft, one of two stitching the face cloth, the other stitching the back cloth. Secondly,the two stitching places are arranged lang distance apart. Figure 2 shows the cross section.After removing the fabric, levelly moving the face cloth layer toward left until the twostitching places near by, then toward up until the link threads vertical, a hollow thread-linkeddouble cloths appears. The height of the double-wall cloths is the distance between twostitching places, and the linked threads of between the two opposite walls are the centre-weft.It should be noticed that the stitching places of the every centre-weft should be differentunless finishing a repeat.
Figure 2 Cross section of double-wall cloths
PUT THE THREAD-LINKED BOX-BEAM PREFORM TO TRIAL BY COMBININGTHE FORMING PRINCIPLE OF THE TRADITIONAL WOVEN HOLLOW
FABRIC WITH THE FORMING PRINCIPLE MENTIONED ABOVE
As mentioned earlier, thread-linked double-wall cloths can be obtained by using above variedforming principle of the centre-weft stitched double cloths, but this is not our ultimatepurpose that is obtaining thread-linked box-beam or thread-linked four connected walls witha rectangle cross section.How to get both sides of the thread-linked double-wall cloths? Thereare two ways.The one is sewing a single-layer structure cloth on to thread-linked double-wallcloths to form thread-linked box-beam preform.The other is weaving both sides cloth withthread-linked double-wall cloths simultaneously to form a three dimensional integratedthread-linked box-beam preform. It is obviously that, the integrated property and outwareappearence quality of the later is better than former because of sewing. So, we try to developintegrated thread-linked box-beam preform by means of combining the forming principle ofthe traditional woven hollow fabric with the above forming principle of thread-linked double-wall cloths.

Proceedings of ICCM–11, Gold Coast, Australia, 14th-18th July 1997
V - 273
The basic forming principle of the hollow fabric is no stitching while double fabric forms andthe face weft and the back weft insert cloth fell in proportion of 1:1 strictly. We produce outthread-linked box-beam preform on power loom, as show in figure 3.
Figure 3: The photograph of thread-linked box-beam preform
THE WEAVING TECHNIQUES OF THREAD-LINKED BOX-BEAM PREFORM
The weaving technique of thread-linked box-beam preform are different between hand loomand power loom. We made a lot of experiments about affecting factor such as choosing ofyarns, designing of fabric specifications as well as winding, warping, warp sizing, drawing-inand weaving, and obtained reasonabler weaving techniques and technique parameters ofthread-linked box-beam preform on a power loom.
Choice of Yarns
What yarns are chosen is depended on the ultimate uses of the thread-linked box-beampreform. If it is used as a general filter fabric, then cotton yarn can be chosen. If it is used as ahigh temperature filter fabric, then polyester yarn or filament yarn even cavlar can be chosen.If it is used in building, municipal works and so on, then high tenacity polyester yarn orpolypropylene fibre yarn can be chosen. The purpose of this paper is to study the priciple andfind out the weaving technique of the thread-linked box-beam preform, so we choose 32s/2general mid-fiber-length yarn, the weaving properties of which are better,the preform can beused as a filter fabric.
Design of fabric specifications
Design of cover factor
The degree of cover factor must be appropriate; if too low, the fabric is loose, and link threadsare not firm, as a result, its using scope will be limited; if too high, ends breaking often takesplace, shed cling, as a result, the weaving is very difficult.According to the experiment, thesuitable scope of warp cover factor is 100%-120%, the ratio of wefe to warp is 0.80-0.95. Inthis way, the fabric is close and weaving is easy.The warp count and weft count of the thread-linked box-beam preform we weave on power loom are 45.8/cm and 37.0/cm respectively.

Volume V: Textile Composites and Characterisation
V - 274
Design of weaves
(1) The choosing of base veave. On principle, the base weaves may be plain weave, twillweave, satin weave and filling rib weave and so on, but plain weave is the best, since it hasthe highest number of interlacings compared to other weaves which cause it to be the firmestand the fastest when as the fix link threads. So we choose plain weave as base weave.
(2) The way and the pattern of centre-weft-stitching. The fabric is composed of two system ofwarp threads, the face warp threads and the back threads, and three series of weft threads, theface weft threads and back weft threads as well as centre-weft. The face warp with the faceweft interlace each other and the back warp with the back weft interlace each other to formfour walls of thread-linked box-beam preform. The centre-weft with the face warp and theback warp interlace respectively forming stitching threads to combine the centre-weft with thefour walls and make the centre-weft an long link threads of the threads-linked box-beampreform.The way of the stitching may be “V”style, in which centre-weft are bound in by oneend only at a place, or “W”style, in which centre-weft are bound in by three ends at a place.So, ”W” style stitching is termed a ‘fast’ stitching, ”V” as a ‘loose’ stitching. It is evident that‘W’style stitching is more suitable for thread-linked box-beam preform. In this way, moresteady link threads can be obtained.
In weaving, a stitching place is completed and a link thread of thread-linked box-beampreform is formed during inserting a pick. It is therefore necessary that the stitching placesdistribate in some patterns to make the link threads of thread-linked box-beam preform havethe same length and even density. In this paper, a restangle pattern of stitching places isdesigned. There are 17 face ends (or back ends) and 16 face picks (or back picks) betweennear stitching places. As a result, the density of up to 80,000 stitching places per m2 isobtained. Of couse, the density of stitching places can be changed by varying the number offace ends and face picks between near stitching places.
(3) The yarns ratio and the yarn number of complete weave repeat. The ratio is a veryimportant factor to secure quality of the perform. In this paper, both ratios of face to backends and face to back picks are 1:1, the ratio of base to centre-weft is 16:200.
For the warp number of complete weave repeat, concerning to warp set, loom width andweave continuative on selvedge of hollow fabric and so on, 4401 ends are in the final beam.This value is not only the yarn number of complete weave repeat but also the total number ofwarp ends. On the basis of the pattern of stitching places distribute, the weft number ofcomplete weave repeat is 432.
Table 1 gives the summary of fabric specifications of threads-linked box-beam preform.
Table 1: Fabric specifications
yarn base weave warp count weft count width total ends
32s/2 1/1 plain 45.8/cm 37.0/cm 96cm 4401

Proceedings of ICCM–11, Gold Coast, Australia, 14th-18th July 1997
V - 275
The techonological process and the choosing of production equipment
The techonological process of the thread-linked box-beam preform is given in Figure 4.
warp: winding---warping---drawing-in--| |--- weaving weft: quilling--------------------------------|
Figure 4: Techonological process
According to the design principle and specifications of the fabric, the production equipmentemployed are 1332M winding machine, G122 drum warping, G191 quilling machine, 1515Mpower loom (fitted with JK202 jacquard attachment ).
The main points of weaving process
1 In the weaving process, the warp yarns are subjected to rubbing seriously, which lead toends breakage and shedding indistinctly. To minimize this problem, slashing is chosen.It is the key of weaving fluently that the wearability of warp yarns is increased. Inaddition, a wax stick can be put at the back of loom to reduce friction, the warp sheet iskept close to its face moving forward, or talcum powder can be used to reduce friction.
2 According to the require of construction design, let-off stop motion and take-up stopmotion must be mounted. During inserting base picks, the let-off and the take-up areactivated on the basis of pick density. However, during inserting centre-weft, the let-offstop motion and the take-up stop motion work, the let-off and the take-up are notactivated, and weaving goes on only accompanyed with shedding, filling insertion, andbeat-up until 200 centre-weft are inserted, and loom motions become regular.
3 The weaving of the preform is similar to the weaving of the hollow fabric in some way.The weaving main points of the hollow fabric are very useful, Also it is very importantthat two shuttles must be used, one for base picks, the other for centre-weft.
4 In the weaving process, the fell of cloth floats up and down seriously. Consequently theshed is not clear. This appearance is more serious during inserting centre-weft. Thisproblem must be solved by improving weaving technique. Otherwise, interlacedisorders even flying shuttle occurs. The horizontal incresing pressure motion isequiped near shed, to minimize floating range.
5 Picking power and pick tension should be controled strictly. If they are higher, centre-weft drags the stitching ends aside,the appearance of fabrics emerges small holes. Ifpicking power is lower, the shuttle can’t arrive opposite box. If pick tension is lower,the centre-weft in cloth is looser and longer than other centre-weft.

Volume V: Textile Composites and Characterisation
V - 276
CONCLUDING REMARKS
Through exploring for the structure and technique of the thread-linked box-beam preform, weobtain the dedign principle and the keys of weaving technology of the fabric. The principle offabric forming and the weave structure developed by us is new. It will certainly have a greatvalue in developing and producing a new type of textile composites.
REFERENCES
1. Cai Bixia,”Weave Struture and Design”, Textile Industrial Publishing House.
2. Chen Yuanpu, “Weaving Technology and Equipment”, Textile Industrial PublishingHouse.

Proceedings of ICCM–11, Gold Coast, Australia, 14th-18th July 1997
V - 277
PERFORMANCE CHARACTERIZATION OFPOLYMERIC COMPOSITE IMPLANT ROD
SUBJECTED TO TORSION
Kh. G. Schmitt-Thomas, Zhen-Guo Yang and T. Hiermer
Institute of Applied Materials EngineeringTechnical University of Munich, Arcisstraße 21, 80333 Munich, Germany
SUMMARY: This study was aimed at characterizing the shear performance and failurebehavior of polymeric composite implant rod subjected to torsion load. Three kinds ofmolding processes for manufacturing the rod were investigated: hot-pressing process, windingprocess, and combination process of winding and braiding. The properties for two types ofrod configurations were carefully analyzed: one with a braided-fabric and other without abraided-fabric. Shearing fracture tests were conducted with a special loading facility whichintegrates newly-developed torsion tester with Instron universal testing machine. The effect ofloading rate on shear performance of the rod was taken into account when failure behaviorand morphology associated with torsion load were investigated. Experimental results showthat owing to three-dimensional reinforcing effect of the braided-fabric, the comprehensiveperformance for the rod with a braided-fabric could be better improved as compared to itscounterpart without a braided-fabric.
KEYWORDS: torsion test, implant rod, biomaterial, epoxy/carbon, molding process,braided-fabric, loading rate, failure analysis.
INTRODUCTION
Implants for load-bearing body prostheses usually consist of either metal materials, polymercomposites or materials with combination of metals and polymers. The use of metal islargely dependent on the need of sufficient strength. However, there exist a number ofdeficiencies in metal materials, although they possess excellent mechanical properties andfracture toughness. The mismatch between the elastic modules of their alloys and body boneis obvious [1]. It is the incompatibility of mechanical and physical properties between metalmaterial and human body that results in one of the main reasons of artificial implant failures.In addition, some interference diagnostic problems exist for the metal implants whiledetermining implant quality with non-destructive testing such as X-radiography, magneticresonance, and ultrasonic inspection [2]; another problem is the corrosion of the metalimplant. In view of these, development of advanced polymeric composite with both suitablemechanical properties and physical compatibility has been receiving great attention since thebeginning of the 1980's [3-6].
As laminated composites have been widely applied to aerospace and other industries, thereare some disadvantages relating to them; among those are lack of sufficient damage toleranceand low interlaminar shear strength. In comparison with the laminated composites, woven-

Volume V: Textile Composites and Characterisation
V - 278
fabric reinforced composites seem to display more advantages, such as improved damagetolerance, higher shear-resistance property, dimensional stability as well as balancedmechanical property [7]. For those reasons, polymeric composites reinforced with braided-fabric are increasingly attractive to researchers.
However, test and characterization for woven-fabric composites subjected to torsion loadhave not been identified well because of their inherent difficulty and anisotropy in property.Even with unidirectional-fiber reinforced composites applied by torque parallel to the fiber,different position results in each fiber to be deformed differently [8]. As a component to beused for fixing spine in human body, the implant rod is inevitably subjected to twist load,which might be one of the main forces for causing its failure. Therefore, how to effectivelyanticipate its shear performance and failure behavior under the condition of torque is currentlya new challenge. For this purpose, as a preliminary investigation, the present study willmainly focus on some experiment details relevant to torsion test of the implant rod andcorresponding property characterization. Full consideration of the experimental results willbe addressed in future publications.
EXPERIMENTAL PROCEDURE
Material
The matrix material studied was a biocompatible epoxy resin with the designationMEPOMAN, which was developed by MAN Ceramics Company, Germany. For thereinforcement, fiber with a diameter of 5.2 µm, called T800H, was supplied by TorayIndustries Inc., Japan. The fibers are processed into roving containing 12000 filaments. Allunidirectional carbon-fiber reinforced polymer (CFRP) rods investigated during testing arecomposed of a fiber content of 60 vol. % . The associated material properties are listed inTable 1.
Table 1: Fundamental properties of materials
Material specification Tensile Strength(MPa)
Tensile modulus(GPa)
Density(g/cm3)
Strain to failure(%)
Epoxy resin, MEPOMAN 100 3.1 1.30 4.50Carbon-fiber, T800H 5590 294 1.81 1.90
CFRP-Plate, UD 3000 170 1.60 1.55
Fabrication of the rod
The CFRP rods used for experiment were produced with three kinds of molding processes:the first was hot-pressing process, the second was winding process, and the last was acombination of winding and braiding. The related fabrication process are illustrated in Fig.1.
For the hot-pressing process several plies of unidirectional prepregs were stacked together andthen pressed into a CFRP-plate through pressure and heating in the mould (Fig. 1a). Thismaterial was simplified as UDpress plate. As to the winding process, fiber-rovingsimpregnated by resin were wound on a rotating, heated steel plate. After curing under acondition of temperature of about 160 °C, the material, which is simplified as UDwind

Proceedings of ICCM–11, Gold Coast, Australia, 14th-18th July 1997
V - 279
plate, was cut at the edge of the steel-pate and so two CFRP-plates were made (Fig. 1b).Next, both kinds of CFRP-plates are machined into several quadrangular bars, and then thosebars are ground with a conventional machining method into cylindrical rods (Fig. 1c).
Fig. 1: Schematic illustration for fabricating CFRP-Rod
Finally, the surface of the rod fabricated by the winding process was wound with a layer ofresin-impregnated roving through a rotary and braiding molding equipment which wasemployed for producing fabric with different braiding-angles (Fig. 1d) and so CFRP-rod witha braided-fabric, namely UDbraided-rod, was made. The angle and thickness of braided-fabric investigated are respectively 45° and 1 mm.
Preparation of the samples
For a preliminary study three kinds of rods were tested, that is, UDpress-rod and UDwind-rodwith a diameter of 4 mm, as well as UDbraided-rod with a diameter of 7.3 mm. The rodswere embedded in two steel cartridges with a mixture of epoxy resin and aluminum powder toget the samples for the experiment. During preparation the rods bonded by embedding-mixture were carefully fixed in a special equipment so they were aligned in the center of bothcartridges. The whole length of the sample was 110 mm, in which each cartridge has a lengthof 40 mm and the gauge length is 30 mm, as depicted in Fig. 2.
Fig. 2: Sketch of the UDbraided sample

Volume V: Textile Composites and Characterisation
V - 280
Test facility and procedure
A torsion loading facility shown in Fig. 3, which integrates torsion tester with an Instronuniversal testing machine, was specially developed, so that one can easily measure torque andangle of twist of the sample.
The fundamental principle is described as follows: first, two sensors for measuring torque andangle of twist were set to be zero before testing; a sample was then put in clamp holders; nexta nylon rope in the torsion tester moved up vertically through loading of Instron universaltesting machine. The rope caused a hoisting drum to rotate around the shaft and apply torqueto the sample; finally, analogous signals received by the sensors were transmitted to twoamplifiers which sent data to an analog/digital card installed in a computer. After acquisitionof the data, a personal computer automatically constructed a torque-angle-curve on its screenthrough special software.
Fig. 3: Torsion loading facility

Proceedings of ICCM–11, Gold Coast, Australia, 14th-18th July 1997
V - 281
RESULTS AND DISCUSSIONS
Microstructure details
Figure 4 shows optical micrographs about transverse and longitudinal cross-section profile ofthe rod braided with an angle of 450. It clearly displays some manufacture flaws such asvoids, macropores, and delaminations existing in the rod. These flaws have a certaindistribution law. Voids usually lie at the transverse cross-section of the rod (Fig. 4b) andrarely appear in the longitudinal direction; macropores, called resin starvation, exist within theareas of braid intersection and interface between braided-fabrics and unidirectional plies; anddelaminations appear between some plies (Fig. 4a). It is these existing flaws that affectstability of the material property of the rod. In general, these flaws are mainly resulted formeither raw material or molding process. Some flaws like voids and delaminations, which arecaused by residual moistures during curing, could be avoided or be diminished greatly byimproving quality of raw resin and fiber, for example, minimizing moisture in the resin byvacuum drying. However, for macropores, which have greater impact on shearing property ofthe rod, it is very difficult to reduce them because of limitation of the current manufacturetechnology of composite. Obviously, this issue is a challenge to modern manufacturetechnology.
a) Longitudinal section (20x) b) Transverse section (15x)
Fig. 4: Cross sections of the rod with a braided woven-fabric angle of 450
Characterization of shearing properties
Shear deformation behavior of the rod
In order to analyze experimental data, some fundamental relationships are necessary. Let usassume the rod has a geometrical size of length L, diameter D, polar inertia moment of thecircular cross-section area J, shear modulus G, and is subjected to torsion load T at its end,then maximum shear stress and corresponding angle of twist of the rod can be calculated asfollows:
τ γ τ γ θ= = =GTD
J
D , and ,
2 2 (1)

Volume V: Textile Composites and Characterisation
V - 282
θ π= TL
JG , and J =
D
32
4
(2)
where τ denotes shear stress, γ shear strain and θ angle of twist of the rod.
Based on Eqs. (1) and (2), the associated shear properties of the rods manufactured withdifferent molding processes were computed against a loading rate of 10 mm/min. and thecorresponding values are given in Table 2.
Table 2: Shear performance for three kinds of rods
Molding process UDpress UDwind UDbraidedShear modulus, MPa 4408 4902 5008
Failure shear stress, MPa 54.7 70 194Angle of twist at failure, ° 31.4 34.8 36.5Relative twist angle, °/mm 0.71 0.83 1.22
Note: the UDbraided-rod has a diameter of 7.3mm and both UDpress and UDwind rods havea diameter of 4 mm.
As predicted, the material properties for UDbraided rod were best among three of them,especially for largely increasing the relative twist angle and failure shear stress. Thoseindicate that due to braided a layer fabric, the global performance resistant to sheardeformation of the rod has been improved.
For the sake of comparison, Figs. 5 and 6 further illustrate torque-angle plot for UDbraided-rod with braided-fabric angle of 450 and UDwind-rod at the loading rate of 10 mm/min.
It can be seen from Figs. 5 and 6 that before approaching to maximum torque value, the angleof twist linearly increases with the applied torque for both kinds of rods without appreciablepop-up of curve slope. Obviously, in this case, the bonding between braided-fabric andunidirectional-fibers of UDbraided-rod is good although there are some macropores existingin their interfaces shown in Fig. 4. The applied torque continues to rise to the limit torque ofthe material, after which the load-bearing capability of the rod collapses immediately. Thetorque of UDbraided-rod drops significantly, which is much larger than its counterpartwithout a braided-fabric. The main reason for accounting for this is that the interfacialsituation between woven-fabric and the unidirectional plies occurs fully debonding, whichcauses shear stiffness of the rod along the transverse direction diminish dramatically.However, the reduction for load-bearing capability of the UDwind-rod is mainly resulted fromcracking of the matrix and delamination of the plies. Another distinctive feature betweenUDbraided-rod and UDwind-rod lies at the variation of the subsequent applied torque with theangle after initial breaking. For the UDbraided-rod, its applied torque displays tendency of alittle going up with the angle (Fig. 5), and the torque for the UDwind-rod always decreaseswith the angle( Fig. 6). This is because the former needs further cracking of the matrix anddelamination of the plies, just as the latter did previously. Consequently, the UDbraided-rod,in fact, undergoes more than two times the fracture processes.

Proceedings of ICCM–11, Gold Coast, Australia, 14th-18th July 1997
V - 283
Fig. 5: Torque-angle plot for UDbraided-rod with braid angle of 45°
Fig. 6: Torque-angle plot for UDwind-rod
Loading rate effect
The properties of composite materials are often influenced by some experimental parameterslike loading rate etc. It is therefore necessary to repeat standard tests over a range of suitable

Volume V: Textile Composites and Characterisation
V - 284
test condition. Table 3 shows some data related to shearing performance of the UDbraided-rod with loading rate ranging from 10 mm/min. to 1000 mm/min.
Table 3: The variation of shearing performance with loading rate
Loading rate, mm/min. 10 50 100 200 1000Twist rate, °/min 22.9 114.6 229.2 458.0 2292.0
Shear modulus, MPa 5008 5204 4621 4935 4938Failure shear stress, MPa 194 194 187 188 180Angle of twist at failure, ° 36.5 35.1 38.2 36.0 34.2Relative twist angle, °/mm 1.22 1.17 1.27 1.20 1.14
It is shown that all material properties such as shear modulus, failure shear stress, angle oftwist as well as relative twist angle were not influenced by the loading rate. The error amongdata was less than 5 %, which is allowable from the sense of engineering. As a result, theeffect of the loading rate on static material strength of the rod can be neglected. But it shouldbe worthwhile to note here that for other kinds of rods such as braided-fabric angles of 600
and 700, something was a little different due to the molding process, which will be discussedin an another paper.
Failure behavior
Figure 7 shows fractographs of UDbraided-rod and UDwind-rod after torsion test, in whichthe final fracture position of all rods were far away from the grip of the cartridge. Typicalfractographic morphologies are illustrated in Figs. 8-9. Several fracture characteristics can berecognized from these SEM photos.
a) UDbraided-rod b) UDwind-rod
Fig. 7: Fractographs of UDbraided-rod and UDwind-rod after torsion test
It is clearly shown in Fig. 8a and Fig. 9a that the number of delamination for UDbraided-rodis obviously smaller than that for UDwind-rod; many brittle cracking layers appear on theouter surface of the UDwind-rod. This indicates that apart from increasing shear properties ofthe rod, the reinforcement of braided-fabric was also able to repress the brittle fracture processto some extent. This may be very significant for both design of fracture-resistance forpolymer composite rod and enhancing residual service life of the rod containing some flaws.

Proceedings of ICCM–11, Gold Coast, Australia, 14th-18th July 1997
V - 285
8a) 9a)
8b) 9b)
8c) 9c)
Fig. 8: SEM photographs of UDbraided-rod Fig. 9: SEM photographs of UDwind-rod
Referring to Fig. 8b and Fig. 9b, it is easy to find that fractographs of both rods have a similarfeature: their morphologies have a terrace shape. This three-dimensional fracture behaviorhas a close relation with torsion load. The main reason for producing this special morphologywas that the rod experienced secondary and multi-fracture with further twisting, which isimplied from the curve of torque-angle illustrated in Fig. 5. However, carefully comparing

Volume V: Textile Composites and Characterisation
V - 286
Fig. 8c with Fig. 9c, one is able to be aware that the number of fiber pull-outs for UDbraided-rod was less than that for UDwind-rod; this meant that the braided-fabric can also improveaxial property of the rod besides shear stiffness of transverse direction and thus produce three-dimensional reinforcement effect. In addition, the fractured surface of the UDbraided-rodwas full of a lot of powders; by contrast, the fractured surface of UDwind-rod looks veryclean and corresponding matrix displays brittle cracking characteristics. This further exhibitsthat the braided-fabric reinforcement has a function of avoiding formation of brittle fracture.
CONCLUSIONS
1. The torsion loading facility, which integrates specially-designed torsion tester withInstron universal testing machine, was developed. The facility can be used not only forevaluating failure behavior of the implant rod subjected to torsion load, but alsoeffectively measuring shear performance of the material.
2. The reinforcement with a braided-fabric is beneficial for reducing brittle fracture in therod in addition to enhancing transverse shear property; moreover, the comprehensiveperformance of the rod with a braided-fabric, such as shear modulus, critical shear stress,angle of twist, and relative twist angle, are improved compared to its counterpart withouta braided-fabric.
3. A terrace-like morphology represents the most common failure characteristiccorresponding to torsion load, which is mainly caused by repeated twist fractures.
4. Under the certain range from 22.9 °/min. to 2292 °mm/min., the effect of loading rate onshear property of the rod can be ignored.
REFERENCES
1. Jamison, R.D., Biomechanics Symposium 1989, 3rd Joint ASCE/ASME MechanicsConference, AMD ( Symposium Series ), 98, 1989, pp. 195-199
2. Matthew, R.M. et al, J. of Biomedical Materials Research, 28, 1994, pp. 1221-1231
3. Akay, M. and Aslan, N., J. of Biomedical Materials Research, 31, 1996, pp. 167-182
4. Ruffieux, K. et al, Textiles and Composites’92, Finland, 1992, pp. 326-332
5. Deger, C., Jadhav, T. and Jadhav, B., Progress in Biomedical Polymers, Plenum Press,1990, pp.239-248
6. Williams, D.F., McNamara, A. and Turner, R.M., J. Mater. Sci. Letters, 6, 1987,pp. 188-190
7. Hoa, S.V., Comptuer-Aided Design of Polymer-Matrix Composite Structures, MarcelDekker, Inc., 1995, pp.137-138
8. Gong, X.L. et al, J. Reinforced Plastics and Composites, 14, 1995, pp. 29-44

Proceedings of ICCM–11, Gold Coast, Australia, 14th-18th July 1997
V - 287
THE MANUFACTURE AND TESTING OF 3DMULTILAYER WOVEN I-BEAMS
G. P. Kamp1, M. K. Bannister1, I. Herszberg2, A. Nicolaidis1
1Cooperative Research Centre for Advanced Composite Structures Limited506 Lorimer Street, Fishermens Bend, Victoria, 3207, Australia
2Sir Lawrence Wackett Centre for Aerospace Design Technology, Royal Melbourne Instituteof Technology, GPO Box 2476V, Melbourne, Victoria, 3001, Australia
SUMMARY: Composite I-beams were manufactured from E-glass and vinyl ester resin. Theglass preforms for the I-beams were produced using advanced multilayer weaving techniquesand consolidation of these preforms was carried out via Vacuum Assisted Resin Injection(VARI). The design requirements for the beams were based upon those for a cross-member ina typical footbridge. Three- and four-point tests demonstrated that the composite beamsachieved the required structural performance except for a 5% reduction in expected bendingstiffness. This was thought to be due to a reduction in the anticipated flange thickness. Theuse of multilayer woven preforms also demonstrated improved manufacturability of thebeams when compared to standard 2D glass fabric.
KEYWORDS: FRP I-beam, multilayer weaving, mechanical performance, vacuum assistedresin injection
INTRODUCTION
For most of their existence, modern-day composite materials have been intimately related tothe aerospace industry. Their high specific strength and stiffness have made them the materialof choice for an increasing number of aerospace components and it is only relatively recentlythat composite materials have begun to be used as major structural components in civilengineering projects. Although the mechanical performance and corrosion resistance ofcomposites have always been of interest to civil engineers, the high cost of raw materials andlabour intensive production methods have limited their use.
Increasingly, however, it is becoming apparent that as the cost of materials is reduced andimproved manufacturing processes are developed a potentially huge market for composites isforming in the construction industry. In the USA alone, the problems associated with ageinginfrastructure is costing the economy billions of dollars annually with recent estimates statingthat around 230,000 of the 575,000 bridges in the US are either structurally deficient orfunctionally obsolete [1].
Composites can be used in a number ways to overcome the infrastructure problems currentlyfacing the USA and many other countries. They have the potential to help repair existingproblems [2] through techniques such as wrapping of concrete support columns [3], which isparticularly relevant in earthquake-prone areas, and strengthening of concrete beams with

Volume V: Textile Composites and Characterisation
V - 288
bonded composite plates [4,5]. Composite materials have also been used in the manufactureof a number of pedestrian and road bridges, including those at Aberfeldy (Scotland) [6],Stroud, Gloucestershire (UK) [6] and Russell, Kansas (USA) [7]. To date, hundreds ofcomposite footbridges have been manufactured, with the choice of composite materials beingmade for reasons which include; ease of construction and maintenance, corrosion resistance,nearly inaccessible locations, environmental concerns and aesthetics. In particular, one majorfactor for the choice of composites in footbridges is the desire to reduce the overall weight ofthe bridge as this is a substantial proportion of the total load.
As mentioned earlier, the use of composites in large civil engineering projects has beenlimited by the high material costs and the labour-intensive methods required for compositecomponent production. With the advent of relatively low-cost, commercially available, largecarbon fibre tows the problem of high material cost is beginning to be addressed, however,forming these tows into the required shapes is still a matter of concern. Pultrusion [8] is amethod of producing composite structural components in the large volumes that are needed incivil engineering and has certainly been an important technique used in the production ofmost of the composite bridges currently standing. The supply of fibre in the pultrusionprocess is generally in the form of individual tows or two dimensional woven fabric. This canresult in a costly set-up stage for large components, due to the large number of fibre sourcesthat need to be fed into the equipment to build up the final component. Utilising advancedtextile manufacturing processes it is possible to produce a single fibre preform in the desiredstructural configuration. These techniques have been shown to produce components withimproved performance at a reduced cost [9].
This paper reports on initial work, conducted at the Cooperative Research Centre forAdvanced Composite Structures, which investigated the potential of using advanced weavingtechniques to produce three-dimensional fibre preforms for composite I-beams.
DESIGN OF I-BEAM
Performance Requirements
There are numerous applications for I-beams within the civil engineering field, each of whichwill dictate their own particular performance requirements upon the structural member. Forthe purpose of this investigation a specific use for the I-beam had to be determined in orderthat dimensions and mechanical properties could be calculated. Due to the increasing use ofcomposite materials in footbridges it was decided to design the beams as generic cross-members in such an application.
The generic footbridge structure consists of two longitudinal beams upon which the cross-members are placed with the bridge deck on top of these cross-members (Fig. 1). The load onthe bridge is the weight of the people times a safety factor plus the dead weight of the bridgestructure itself. For this investigation it was assumed that the width of the bridge was 2 metreswith the longitudinal supporting beams placed 1 metre apart. Standard design requirementsstipulate a maximum of 9 people, each weighing 100 kg will fit in a square metre. This gives
a uniformly distributed load on the bridge of 8.8 x 10⁻³
MPa. If a safety factor of three is
applied this becomes 30 x 10-3
MPa, which also allows for approximately 120 kg/m2 of
structural weight. It was assumed that the deck will distribute the load evenly to the cross-members, therefore reducing the bridge design to a two-dimensional problem of a simply

Proceedings of ICCM–11, Gold Coast, Australia, 14th-18th July 1997
V - 289
supported beam with a distributed load. If the distance between the cross-members is taken tobe 1 metre a distributed load on each cross-member of 30 N/mm is obtained.
500 mm
2000 mm
Fig. 1: Illustration of generic footbridge used for design of I-beams
With these dimensions and calculated loads, simple beam theory gives the maximum bendingmoment and shear load in the cross-members as 3.75 kNm and 18.75 kN respectively. Thebending stiffness of the beam is determined by the maximum allowable deflection of the
bridge deck, which is limited to 1/80th
of the deck width. This restriction yields a required
minimal bending stiffness of EI = 4.69 x 10¹⁰
Nmm2 for the beam. With these performance
parameters in mind a multilayer woven preform was then designed for use as the I-beam.
Weave Architecture
For this investigation the materials for the I-beam were chosen on the basis of their cost andease of use. The cost of E-glass is substantially lower than the higher performance carbonfibres and is less susceptible to damage during the weaving process than carbon. Vinyl esterwas chosen as the resin material as it is relatively cheap and cures at room temperature thusremoving the need for expensive curing cycles and high temperature tool materials.
The preforms were woven at the CRC-ACS on a dobby hand loom (for initial trials) and anadvanced electronic jacquard loom (for the production of full size preforms). The use of theselooms restricted the manufacture and style of the preform in a number of ways. Firstly, themajority of weaving looms are incapable of producing material with fibres in the ±45°direction as well as the normal 0° and 90° directions. It is possible to manufacture materialwith fibres in all 4 directions on special looms but this material is not widely available. Thisrestriction of only 0° and 90° fibres in the web and flanges will result in having to increase thethickness of the web in order to obtain the required shear strength. It would be possible to addadditional material to the web at ±45° but for the purpose of this investigation the design wasrestricted to only multilayer 0/90 fabric.
Due to the set-up of the looms, which were also being used for the manufacture of preformsfor other investigations, there were restrictions placed upon the types of preforms that couldbe produced. This meant that the weave architecture had to be, essentially, identical in theweb and the flange even though the performance requirements for both areas are verydifferent. Thus, for the purpose of this initial work, the selection of weave architecture wasbased upon previous work performed at the CRC-ACS which examined critical factors in themanufacturability and weave architecture of multilayer woven preforms [10]. This selectedweave architecture contained fibre distributions of 54% and 46% for the longitudinal (alongthe length of the beam) and transverse direction respectively with the total fibre volume

Volume V: Textile Composites and Characterisation
V - 290
fraction of the beam predicted to be 50%. It should be noted that in commercial production ofpreforms for composite I-beams, a loom would be initially set-up to produce the requiredmaterial as a single preform with optimised weave architectures for both the flange and web.
Dimensions of I-beam
The I-beam contains four independent dimensional variables, namely; the web height (H), the
flange width (W), the web thickness (tw) and the flange thickness (tf). These dimensions willbe determined by the performance requirements of the beam and the mechanical properties ofthe materials used.
The Young’s moduli of E-glass fibres and vinyl ester are 72 GPa and 3.4 GPa respectively.For a composite containing a 54% - 46% distribution of fibres in the longitudinal - transversedirections and a 50% final fibre volume fraction the estimated Young’s moduli [11] in thelongitudinal and transverse direction are;
E1 = 25.6 GPaE2 = 23.4 GPa
In order to adequately determine the beam dimensions shear tests were performed upon themultilayer woven composite. These tests produced the following mechanical properties;
Maximum Shear Stress τmax = 40 MPa
Shear modulus, G12 = 4.5 GPa
The web area of the beam was calculated from the maximum shear load capacity required bythe beam (18.75 kN) and the maximum shear stress that the multilayer woven compositematerial will be allowed to carry. This allowable shear stress was set to be 30 MPa, giving asafety factor of 1.3. Using this data, the web area was given by the relation;
AreaShearLoad
webaverage
=τ
(1)
which yielded a required web area of 625 mm2.
For the bending properties of the I-beam it is desirable to place the flanges as far apart aspossible, but increasing this distance decreases the web thickness and increases the chance ofthe web becoming unstable in lateral/torsional buckling. With this in mind and also takinginto account the range of preform dimensions that could be produced on the loom, the webheight and thickness were chosen to be 102 mm and 6.1 mm respectively.
The minimum moment of inertia of the beam is dictated by the required bending properties.The required bending stiffness depends directly on the moment of inertia. With a predictedYoung’s modulus of 25.6 GPa in the longitudinal direction of the multilayer wovencomposite, the stiffness requirements demand a minimum moment of inertia of;
IEI
Emmyy = = ×
1
6 418 10. (2)

Proceedings of ICCM–11, Gold Coast, Australia, 14th-18th July 1997
V - 291
The required bending moment capacity is linked to the moment of inertia via the followingrelation;:
σ xyy
M z
I= ⋅
(3)
where σx is the maximum allowable stress in the longitudinal direction and z is the levelwhere this stress acts (this stress will occur at the outer flange surfaces). Previous tests uponthe multilayer woven composite had measured the minimum strength of the material to be 320MPa in tension. Applying a safety factor of 1.3 the maximum allowable stress in the flangeswas assumed to be 250 MPa. From Eqn. 3 this results in a minimum moment of inertia of
approximately 7.7 x 105 mm4. Comparing the two values obtained for the moment of inertia
shows that the bending stiffness requirement is the major factor in dictating the minimummoment of inertia and thus the flange area as well. The moment of inertia can be expressed interms of beam dimensions,
( ) ( )[ ]I W H W t H tyy w f = ⋅ ⋅ − − ⋅ − ⋅112
3 32 (4)
Substitution of the known parameters leads to the following relation between the flangethickness and width.
tW
Wf = − ⋅⋅ − ⋅ ×
−51
102 12 18 10
6112
3 613
.
.(5)
The flange width and thickness were chosen to prevent flange buckling at the design loadsand to conform with the range of preforms that could be produced by the loom. A bucklinganalysis of the flange lead to the selection of a flange width of 62 mm and a flange thicknessof 4.8 mm. The required dimensions of the I-beam were therefore;
Web height (H) = 102 mm Flange width (W) = 62 mm
Web thickness (tw) = 6.1 mm Flange thickness (tf) = 4.8 mm
MANUFACTURE OF I-BEAM
Weaving of preforms
Initial weaving trials were conducted upon a 24 shaft dobby hand loom and the resultantpreforms produced were used to manufacture specimens for three-point bend tests. These testswere conducted to determine whether the weave architecture and dimensions of the web, thatwas based upon earlier rail-shear tests, would in fact provide adequate shear strength.
Full scale specimens for 4-point bend tests were manufactured upon an automated,electronically controlled, jacquard loom. This loom was used not only because it couldproduce samples of the required size but also to demonstrate the manufacture of advancedtextile preforms, that are suitable for composite structures, on an industry standard productionloom.
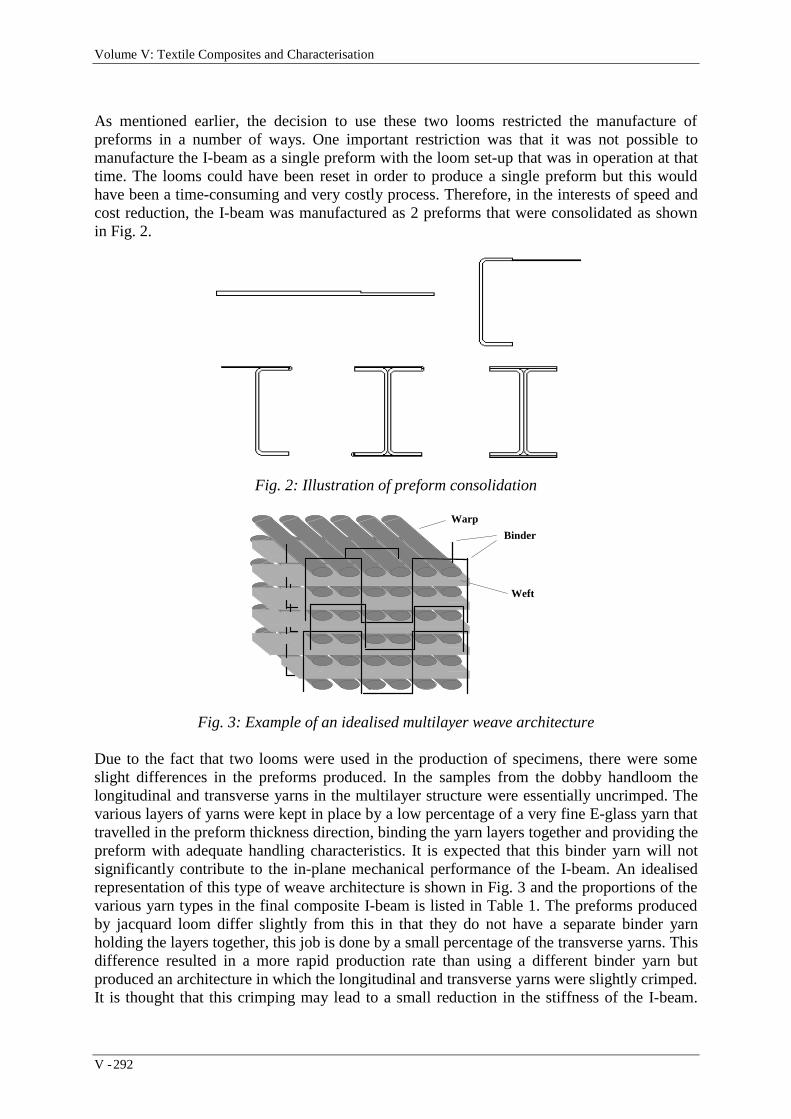
Volume V: Textile Composites and Characterisation
V - 292
As mentioned earlier, the decision to use these two looms restricted the manufacture ofpreforms in a number of ways. One important restriction was that it was not possible tomanufacture the I-beam as a single preform with the loom set-up that was in operation at thattime. The looms could have been reset in order to produce a single preform but this wouldhave been a time-consuming and very costly process. Therefore, in the interests of speed andcost reduction, the I-beam was manufactured as 2 preforms that were consolidated as shownin Fig. 2.
Fig. 2: Illustration of preform consolidation
Warp
Binder
Weft
Fig. 3: Example of an idealised multilayer weave architecture
Due to the fact that two looms were used in the production of specimens, there were someslight differences in the preforms produced. In the samples from the dobby handloom thelongitudinal and transverse yarns in the multilayer structure were essentially uncrimped. Thevarious layers of yarns were kept in place by a low percentage of a very fine E-glass yarn thattravelled in the preform thickness direction, binding the yarn layers together and providing thepreform with adequate handling characteristics. It is expected that this binder yarn will notsignificantly contribute to the in-plane mechanical performance of the I-beam. An idealisedrepresentation of this type of weave architecture is shown in Fig. 3 and the proportions of thevarious yarn types in the final composite I-beam is listed in Table 1. The preforms producedby jacquard loom differ slightly from this in that they do not have a separate binder yarnholding the layers together, this job is done by a small percentage of the transverse yarns. Thisdifference resulted in a more rapid production rate than using a different binder yarn butproduced an architecture in which the longitudinal and transverse yarns were slightly crimped.It is thought that this crimping may lead to a small reduction in the stiffness of the I-beam.

Proceedings of ICCM–11, Gold Coast, Australia, 14th-18th July 1997
V - 293
Table 1 again lists the proportions of yarns in the final composite I-beam for the jacquardpreforms.
Table 1: Details of critical I-beam dimensions, fibre proportionsand overall composite fibre volume fractions
Loom I-beam DimensionsH, tw, W, tf (mm)
Longitudinal(%)
Transverse(%)
Binder(%)
Fibre vol.frac. (%)
Dobby 99, 6.0, 62, 3.9 56.4 41.2 2.4 51
Jacquard 99, 6.3, 62, 4.2 55.8 44.2 - 52
Consolidation
The preforms manufactured by both loom types were consolidated with vinyl ester resin by aprocess known as Vacuum Assisted Resin Injection (VARI). Generally, this process relies ondrawing resin through the preform by applying vacuum at one end with a resin reservoir at theother end (Fig. 4). Unlike resin transfer moulding techniques, where resin flow between inletports and outlets is primarily through the preform itself, in the VARI method the primaryresin flow is through a carrier which distributes the resin over the surface of the preform afterwhich the secondary flow is through the preform thickness. The resin therefore has lessdistance to travel through the preform and thus resin injection pressures do not need to be ashigh. These factors generally allow cheaper, more easily managed tooling to be used thussaving on production costs. One disadvantage is that a smooth tool surface on the finishedcomponent is not possible on the surface that was in contact with the carrier material,although this was not a critical consideration for this work.
Fig. 4: Illustration of the Vacuum Assisted Resin Injection technique
The VARI tooling set-up for the I-beams is illustrated in Fig. 5. This tooling was enclosed ina vacuum bag, which was necessary for the VARI process to work and also compacted thepreforms to achieve the required fibre volume fractions. It was found that the best results wereobtained when the carrier material was placed next to the flanges. The fillet space at thejunction of the C-channels and the flanges was filled with uniaxial E-glass yarn to preventpremature failure at this point. I-beams produced with this arrangement were found to be freeof voids with dimensions and fibre volume fractions very similar to the design values (Table1) although the flange thicknesses were less than the design values due to the restrictionsplaced by the set-up of the loom. The small differences in thickness between the two preformtypes was thought to be due to the slight changes in preform architecture and fibre volumefraction.

Volume V: Textile Composites and Characterisation
V - 294
Initial trials with the tooling were conducted with standard 2D glass fabric. It was found thatcutting to size and accurately maintaining the position of the large number of fabric layersrequired for the I-beams was very complicated and time-consuming and occasionally lead todefects in the consolidated beams. The use of the multilayer woven preforms significantlydecreased the time required for the setting up of the preform in the tooling by more than 50%.This demonstrates the potential advantages that can be gained in the production of complex-shaped components by the use of multilayer preforms that are woven to the required shape.
Resin distribution fabric
Preform
Tooling (wooden)
Resin outletResin Inlet
Fig. 5: Illustration of the tooling used for consolidation of the I-beams
TESTING OF I-BEAM
Shear Tests
Three preforms produced on the dobby handloom were consolidated into I-beams and testedin three point bend to determine the maximum shear load capacity of the weave architectureand beam dimensions selected during the design phase. Table 1 lists the dimensions of the I-beam cross-section whilst the test span used was 370 mm. To ensure failure of the web viashear, wooden blocks were placed inside the I-section on the points where the load wasintroduced to reinforce these areas and to prevent premature failure of the beam. These blockswere of the same timber used for the tooling and were glued into place using vinyl ester resinof the same composition as the resin in the beam.
Measurements of load and neutral axis displacement were made throughout the tests and thefailure load was used to calculate the shear load capacity of the I-beam. Table 2 shows theexperimentally measured shear load capacity (average of all three beams) compared with theshear load required by the design conditions. The results show that the weave architecture anddimensions chosen for the I-beam can adequately accommodate the maximum shear loadrequired by the original design. The measured average shear load of the beams (23.5 kN)gives a shear strength for the composite material of 37.6 MPa, which is a very similar result tothe strength obtained earlier by rail shear tests.

Proceedings of ICCM–11, Gold Coast, Australia, 14th-18th July 1997
V - 295
Bend Tests
The automatic jacquard loom was used to produce three I-beam preforms which wereconsolidated and tested in four-point bending in a pure bending rig [12] to determine theirbending stiffness and bending moment capacity. Table 1 lists the dimensions of the I-beamcross-section whilst the inner and outer spans of the test rig were 678 mm and 1292 mmrespectively. In a similar fashion to the previous three-point bend tests, wooden blocks wereglued inside the I-section of the beam to provide reinforcement at the loading points and thusensure failure of the beam within the inner span.
Table 2 again shows the results of the tests (average of all three beams) and compares themwith the design requirements. It is clear that the I-beams have a more than adequate bendingmoment capacity, almost twice that required. However, the flange dimensions, which controlthe beam’s moment of inertia, were selected to just satisfy the required minimum bendingstiffness calculated during the design phase. The experimental results for bending stiffnesswere found to be approximately 5% less than the design requirements. This shortfall isthought to be due to the actual thickness of the flange being less than the design value. Thisdifference would lower the bending stiffness of the I-beam below the design requirements.
Table 2: Mechanical properties of I-beams
Design ExperimentalShear Load Capacity (kN) 18.75 23.5 ± 2Bending Stiffness (1010 Nmm2) 4.69 4.47 ± 0.2Bending Moment Capacity (kNm) 3.75 7.32 ± 0.7
DISCUSSION AND CONCLUSIONS
The test results presented in the preceding section show that the I-beam manufactured byadvanced weaving and liquid moulding techniques successfully achieved the majority of itsdesign requirements. The one exception was a slightly lower bending stiffness that wasthought to have resulted from a reduction in the flange thickness. It should be noted that dueto the restrictions placed upon the beam design by the available looms, this design was farfrom optimised for its end use as a footbridge cross-member. The addition of ±45° fibres tothe web area to improve its shear performance would have allowed a reduction in the webcross-section and thus the weight of the beam. Similarly, if the initial set-up of the loom hadallowed a variation in the weave architecture between the flange and the web, a higherproportion of longitudinal fibres could have been placed in the flange thus improving thebeam’s bending performance. The placement of higher modulus carbon fibres in the flangewould also have improved the bending performance of the I-beam whilst at the same timeallowing a reduction in the weight of the beam.
Initial trials in utilising the VARI method to manufacture the I-beams had demonstrated thedifficulty of maintaining accurate positioning of the large number of layers of standard 2Dglass fabric required for the beams. The use of a smaller number of fabric pieces (multilayerwoven preforms) was observed to lead to a significant improvement in manufacturability. Anoptimal loom set-up would have allowed the preform to be manufactured as a single piece of

Volume V: Textile Composites and Characterisation
V - 296
multilayer fabric which would help reduce the set-up costs inherent in production methods,such as pultrusion.
It is therefore clear that advanced weaving techniques, coupled with improved processes forresin infiltration, have the ability to manufacture composite structural components to specifieddesign requirements. The use of multilayer weaving also demonstrated the potentialadvantages that could be gained by processes such as pultrusion by using single preforms thathave been woven to the required shape.
REFERENCES
1. “Cable news…”, Advanced Materials News, Millbank, P., Ed., No. 82, April 1996, pp 1-8.
2. McConnell, V. P., “Can composites rebuild America’s infrastructure?”, AdvancedComposites, November/December 1992, pp. 22-31.
3. Brooks, N., “GRP wraps up bridge repairs”, Reinforced Plastics, July/August 1995, pp30-32.
4. Zou, R. D., Jones, R., Hanna, S., Lam, Y. C., “An investigation on strengthening ofconcrete beam with GFRP laminates”, First Australasian Congress on AppliedMechanics, Melbourne, Australia, 21-23 February, 1996, Vol 1, Grzebieta, R., Wong, A.,Marco, J., Lam, Y., Eds., pp 461-466.
5. Weaver, A., “Carbon plate stops the cracks”, Reinforced Plastics, July/August 1995, pp34-37.
6. Weaver, A., “Hybrid bridges exploit composites durability”, Reinforced Plastics,July/August 1995, pp 24-29.
7. Composite News: Infrastructure, No. 59, 16 December, 1996, Loud, S., Ed. CompositesWorldwide, Inc., 1996, pp 6-8.
8. Strong, A. B., “Versatility in pultrusion”, Composites Fabrication, June 1996, pp 9-13.
9. Müller, J., “The extension of advanced composites into the machine industry”, 4th
International Conference on Automated Composites”, Nottingham, UK, September 6-7,1995, The Institute of Materials, pp 499-509.
10. Bannister, M., Herszberg, I., Nicolaidis, A., Coman, F., Leong, K.H., “The manufactureof glass/epoxy composites with multilayer woven architectures”, to be published inComposites Part A: Applied Science and Manufacturing.
11. Halpin, J., Tsai, S., “Effects of environmental factors on composite materials”, AFML-TR67-423, June 1969.
12. Cimpoeru, S., “The modelling of the collapse during roll-over of bus frames consisting ofsquare thin-walled tubes” Ph.D. thesis, Monash University, Melbourne, Australia,December, 1992.
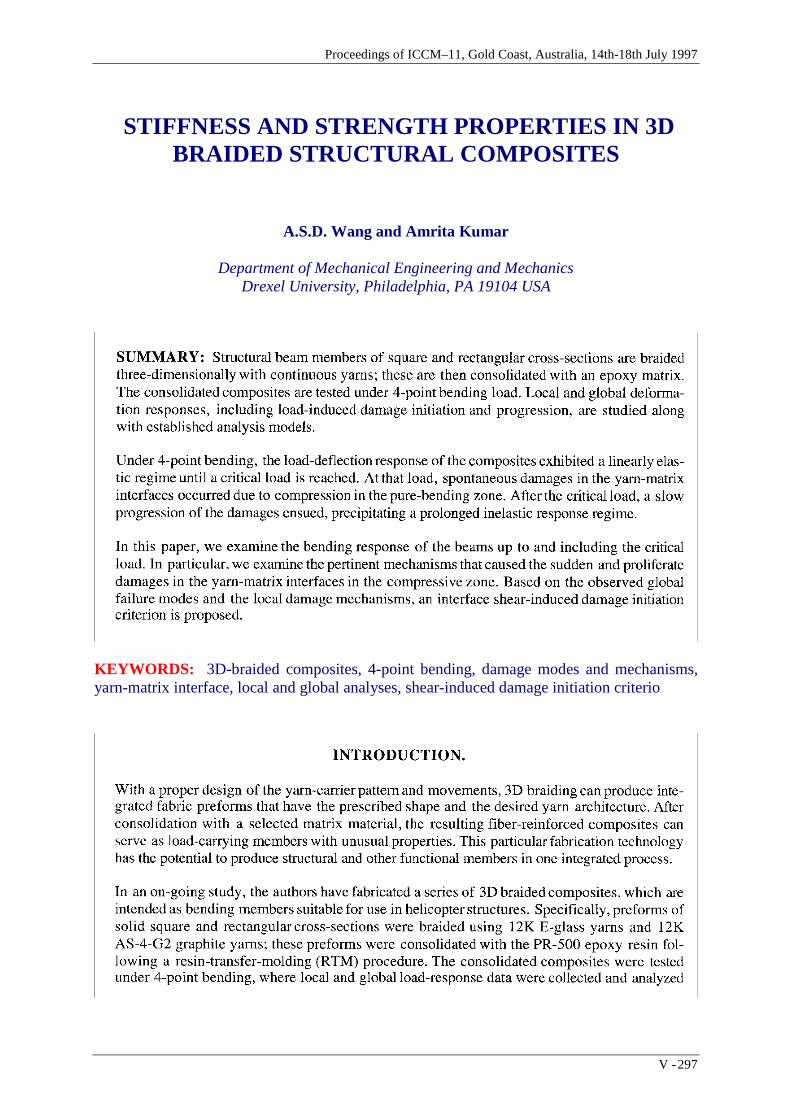
Proceedings of ICCM–11, Gold Coast, Australia, 14th-18th July 1997
V - 297
STIFFNESS AND STRENGTH PROPERTIES IN 3DBRAIDED STRUCTURAL COMPOSITES
A.S.D. Wang and Amrita Kumar
Department of Mechanical Engineering and MechanicsDrexel University, Philadelphia, PA 19104 USA
KEYWORDS: 3D-braided composites, 4-point bending, damage modes and mechanisms,yarn-matrix interface, local and global analyses, shear-induced damage initiation criterio

Volume V: Textile Composites and Characterisation
V - 298

Proceedings of ICCM–11, Gold Coast, Australia, 14th-18th July 1997
V - 299

Volume V: Textile Composites and Characterisation
V - 300

Proceedings of ICCM–11, Gold Coast, Australia, 14th-18th July 1997
V - 301

Volume V: Textile Composites and Characterisation
V - 302

Proceedings of ICCM–11, Gold Coast, Australia, 14th-18th July 1997
V - 303

Volume V: Textile Composites and Characterisation
V - 304

Proceedings of ICCM–11, Gold Coast, Australia, 14th-18th July 1997
V - 305
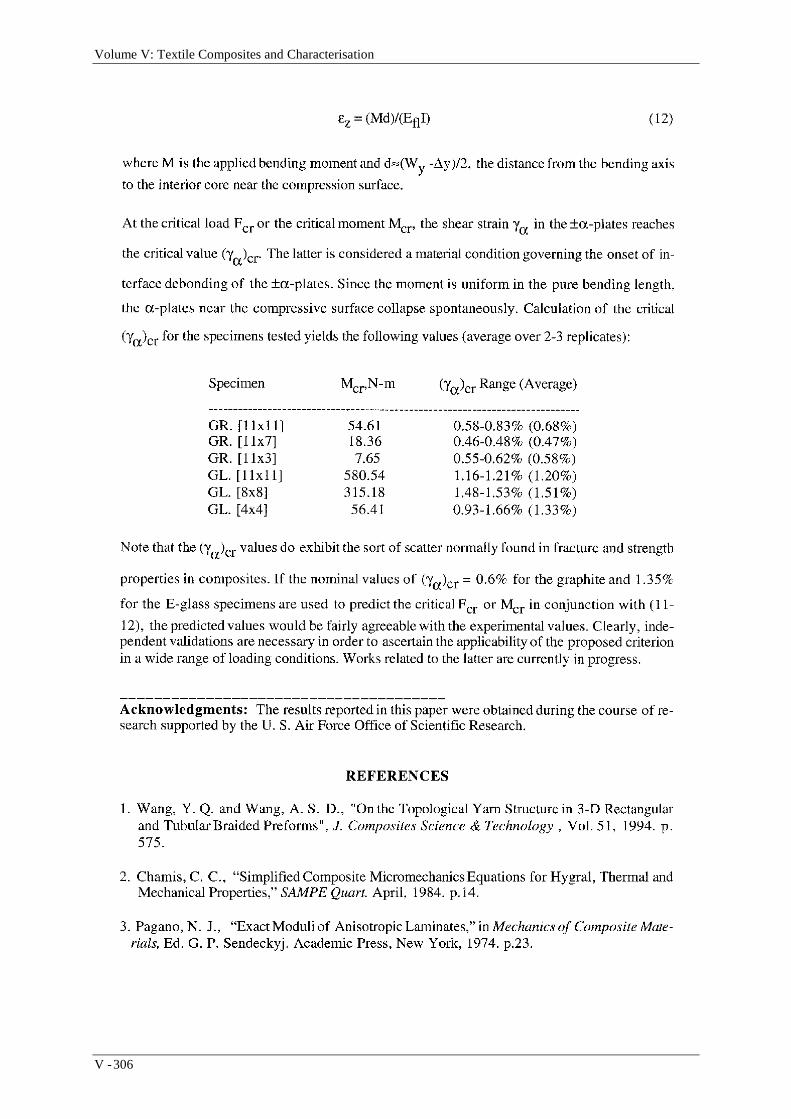
Volume V: Textile Composites and Characterisation
V - 306

Proceedings of ICCM–11, Gold Coast, Australia, 14th-18th July 1997
V - 307
PREDICTION OF THE COMPRESSION-AFTER-IMPACT STRENGTH OF 2-D BRAIDED COMPOSITES
Paul J. Falzon1 , Israel Herszberg2
1 Cooperative Research Centre for Advanced Composite Structures Ltd. (CRC-ACS),506 Lorimer St., Fishermens Bend, Victoria, 3207, Australia.
2 Sir Lawrence Wackett Centre for Aerospace Design Technology, Royal Melbourne Instituteof Technology, GPO Box 2476V, Melbourne, Victoria, 3001, Australia.
SUMMARY: This paper presents an analysis used to predict the compression-after-impact(CAI) strength of 2-D braided carbon/epoxy composites. A closed-form solution, developedto approximate the stress distribution of an orthotropic composite laminate with an ellipticalhole loaded in compression, was applied to estimate the stress distribution in the impactdamaged braided composite under compression loading. Then, using the semi-empirical pointstress failure model, the CAI strength was predicted. Comparisons made between predictedand measured CAI strengths revealed good agreement, with differences less than 10% in mostcases. The use of such models to predict failure of composites made from unidirectionalprepreg is of little advantage because the characteristic length depends on the ply orientation,hole size and hole aspect ratio. A major finding from this work is that for braided composites,one characteristic length (determined from experiment) was applicable for a range of damagegeometries and braid architectures.
KEYWORDS: braided composites, CAI strength, characteristic length, impact
INTRODUCTION
Fibre reinforced composite materials have been successfully employed as structural materialsfor various applications. These composites have shown superior performance over metals inapplications requiring high strength/stiffness, excellent fatigue and corrosion resistance, aswell as low weight. However, a major concern with composite materials is their susceptibilityto impact damage. Unlike metallic materials, composites can suffer a significant reduction inmechanical performance due to impact damage. Methods which have been used to addressthis problem include the application of toughened resins and the introduction of through-thickness fibre reinforcement. Well established and highly automated processes developed forthe textile industry, such as braiding [1], have the capability to fabricate near net-shapepreforms of the desired fibre orientations and necessary through-thickness reinforcement.Combined with a liquid moulding technique, there is the potential to produce reliable low-cost, high-quality components with improved damage tolerance.
To investigate the damage resistance and tolerance of braided composites, a series of low-velocity drop-weight impact tests were performed on 2-D braided carbon/epoxy laminates [2].Damaged specimens were then loaded in compression to measure their compression-after-impact (CAI) strength [2]. This paper presents an analysis used to predict the CAI strength of2-D braided carbon/epoxy composites measured from these tests.

Volume V: Textile Composites and Characterisation
V - 308
Impact damage introduced into a composite laminate results in a significant reduction instiffness in the damaged area, causing load to be redistributed to the undamaged region. Thisredistribution of load results in a stress concentration, similar to that expected of a panel withan open hole. In fact, the CAI damage behaviour found in the braided specimens was similarto that observed in composite panels with holes loaded in compression. A closed-formsolution, developed to approximate the stress distribution of an orthotropic compositelaminate with an elliptical hole loaded in compression, was applied to estimate the stressdistribution in the impact damaged braided composite under compression loading. Then,using the semi-empirical point stress and average stress failure models, the CAI strength waspredicted.
MATERIALS
A series of four different braid architectures have been considered in this study. Compressionspecimens were prepared from panels manufactured from 2-D triaxially braided preforms.The specimens tested are summarised in Table 1. The braided preforms were manufacturedfrom 12K AS4 carbon fibre tows using a 72 carrier Wardwell braider at the Center forComposite Materials, University of Delaware. They were manufactured as a tubular preformthen cut open to form a flat preform. The specimens were consolidated using Resin TransferMoulding (RTM) with Ciba Geigy RTM6 epoxy resin system. Note that specimen types BR-45a and BR-45b have identical fibre orientations, although BR-45b was a tighter braid.
Table 1: Summary of composite materials used in this study
LaminateI.D.
NominalThick.(mm)
FibreVolume
Fraction (%)
LaminateConstruction
No. ofplies
Percentageof 0° fibres
BR-45a 2.1 58 0°/±45° braid 5 26.1BR-45b 2.1 58 0°/±45° braid 4 26.1BR-60 2.1 58 0°/±60° braid 4 20.0BR-LA 2.1 58 0°/±45° braid 3 41.4
EXPERIMENT
A series of low-velocity drop-weight impact tests were performed on 2-D braidedcarbon/epoxy composites followed by compression tests on the damaged specimens. A briefdescription of the tests methods and findings is given in this section. Detailed results havebeen published elsewhere by Falzon et al. [2].
Impact Test
Impact testing of low to medium impact energy levels (up to 7 J/mm), were carried out onspecimens measuring 92 x 117 mm using an instrumented drop weight test rig [2]. Thespecimens were clamped using a support frame with a test window measuring 80 x 90 mm.The impactor, which had a hemispherical steel tup 12.5 mm in diameter and variable weightsranging between 200 and 1200 grams, was dropped from heights of up to 2 m to impact thespecimens at various energy levels. Only one impact was performed at each energy level.

Proceedings of ICCM–11, Gold Coast, Australia, 14th-18th July 1997
V - 309
Impacted specimens were then ultrasonically C-scanned to quantify the extent of damageintroduced into the specimens due to the impact event.
Ultrasonic C-scans revealed that post-impact damage zones of all specimens exhibited aquasi-circular, almost elliptical, shape for all energy levels considered (Fig. 1). Visualinspection of the impacted specimens revealed that the sustained damage was due primarily tothe delamination of plies. On the impacted surface of the braided specimens, at energy levelsexceeding 3 J/mm, there was evidence of compressive cracking which took the form of anindentation. The opposite face of the specimens exhibited fibre break-out or tensile splitting.Crack propagation tended to follow fibre directions and stop at fibre tow cross-over points.
Damagewidth
Fig. 1: Typical C-scans of an impacted 2-D braidedcomposite (Impact energy ≈ 4.5 J/mm)
Compression-After-Impact Test
The test rig used to measure the compression strengths of the impacted specimens [2]comprises three separate components - lower and upper clamping blocks between which thespecimen is set for testing, a pair of anti-buckling face plates with a 40 mm diameter centralwindow to ensure the impact damage zone is not restricted from propagating during the test,and a die press with a ball-and-cup arrangement to ensure the specimen is loaded axially. Thespecimens were loaded at a rate of 0.5 mm/min and the tests were terminated at the first onsetof failure. Failure was defined as the first sudden drop in load.
In all the specimens tested, failure initiated at the impacted region and progressed in adirection transverse to the loading direction, with little or no damage growth in the loaddirection. The indentation of the impact site and the area of fibre breakage reduced thestiffness across the damage area causing load to be redistributed into the undamaged region,thus increasing the stresses around the damage site. Global failure of the damaged specimensoccurred as a result of the kink band mechanism, and not from sub-laminate buckling as isfound in unidirectional prepreg materials. This redistribution of load at the impact site resultsin a stress concentration, similar to that expected of a panel with an open hole. In fact, theCAI damage behaviour found in the braided specimens was similar to that observed incomposite panels with holes loaded in compression. Soutis and Curtis [3] also found the CAIdamage pattern in laminated composites to be similar to that observed in laminated plates

Volume V: Textile Composites and Characterisation
V - 310
with open holes loaded in compression. The variation of CAI strength with damage width forall the specimens tested can be seen in Figures 4 to 7. Damage width is defined in Fig. 1.
MODELLING APPROACH
Impact damage introduced into a composite laminate results in a significant reduction instiffness in the damaged area, resulting in a complex stress distribution surrounding thedamaged zone. The reduction in compression strength is a result of this stress concentration.Attempts at predicting the reduced strength or CAI strength encompasses models of varyingdegrees of sophistication. Statistical methods have been proposed by Guild et al. [4] andPrichard and Hogg [5] which relate CAI strength with damage width using linear regression.Soutis and Curtis [3] applied their cohesive zone model, developed initially to predict notchedcompressive strengths, to estimate the CAI strength of some prepreg composites. Others [6]have modelled the damaged area as a soft inclusion. One approach proposed by Xiong andPoon [7] involved modelling the damaged area as a soft elliptical inclusion. Then using acomplex variable method outlined by Lekhnitskii [8], the in-plane stresses can be calculated.The CAI strength of the laminates is then predicted using an empirical failure criterion.
To predict the CAI strength of the braided composites, a similar approach was adopted. Thedifference being rather than modelling the damage as a soft inclusion, it was conservativelyassumed that the damage area behaved as an elliptical opening or hole. That is, the material inthe damaged area does not provide any load carrying capacity. As mentioned earlier, the CAIdamage behaviour found in the braided specimens was similar to that observed in compositepanels with holes loaded in compression. The accuracy of this assumption is dependent on theextent of impact damage. The assumption is more accurate in cases where impact damagecauses fibre fracture or penetration compared with events where impact loading causesinternal delaminations with only barely visible impact damage. The idealisation of animpacted braided composite panel is illustrated in Fig. 2. The dimensions of the ellipticalholes (2a and 2b) used in the analysis are measured from ultrasonic C-scan results, like thatshown in Fig. 1.
y
x2a
2b
Characteristiclength
σy
σy
Fig. 2: Idealised impact damage in a composite panel represented as an elliptical hole
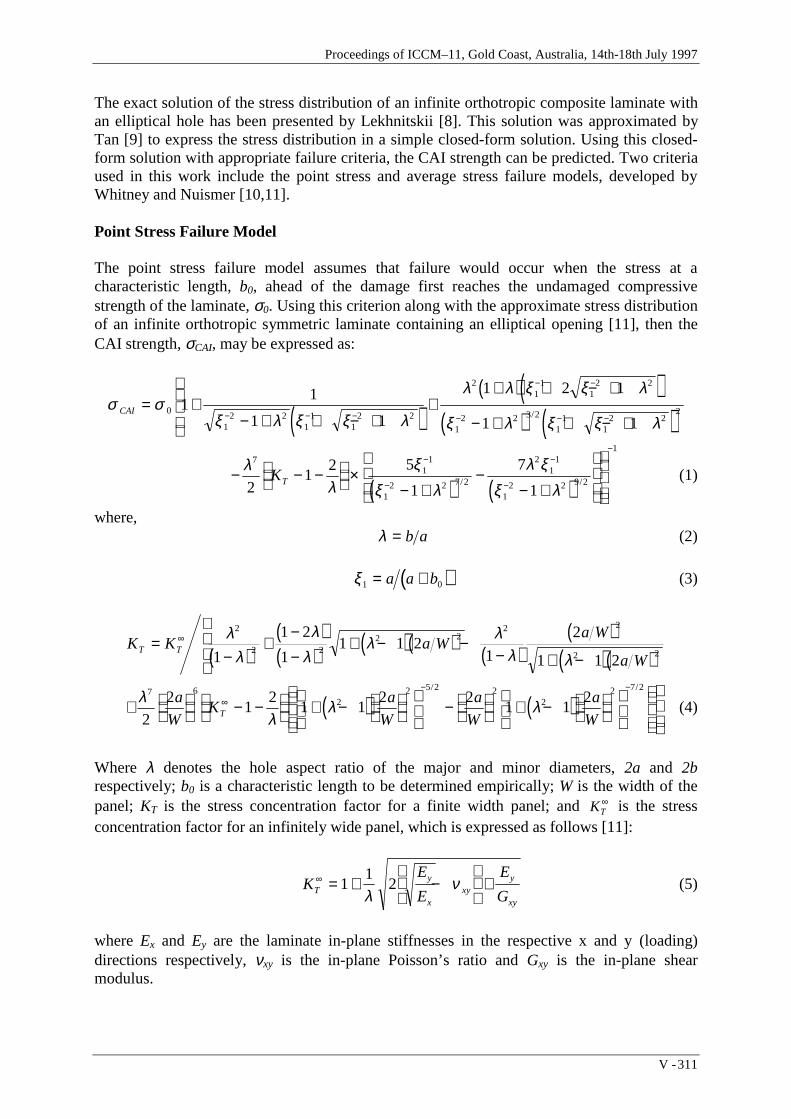
Proceedings of ICCM–11, Gold Coast, Australia, 14th-18th July 1997
V - 311
The exact solution of the stress distribution of an infinite orthotropic composite laminate withan elliptical hole has been presented by Lekhnitskii [8]. This solution was approximated byTan [9] to express the stress distribution in a simple closed-form solution. Using this closed-form solution with appropriate failure criteria, the CAI strength can be predicted. Two criteriaused in this work include the point stress and average stress failure models, developed byWhitney and Nuismer [10,11].
Point Stress Failure Model
The point stress failure model assumes that failure would occur when the stress at acharacteristic length, b0, ahead of the damage first reaches the undamaged compressivestrength of the laminate, σ0. Using this criterion along with the approximate stress distributionof an infinite orthotropic symmetric laminate containing an elliptical opening [11], then theCAI strength, σCAI, may be expressed as:
( )( )( )
( ) ( )σ σ
ξ λ ξ ξ λ
λ λ ξ ξ λ
ξ λ ξ ξ λCAI = +
− + + − +
+
+ + − +
− + + − +− − −
− −
− − −0
12 2
11
12 2
21
11
2 2
12 2 3 2
11
12 2
211
1 1
1 2 1
1 1/
( ) ( )− − −
×
− +−
− +
−
−
−
−
−
λλ
ξξ λ
λ ξξ λ
71
1
12 2 7 2
21
1
12 2 9 2
1
21
2 5
1
7
1KT / / (1)
where,λ = b a (2)
( )ξ1 0= +a a b (3)
( )( )( ) ( )( ) ( )
( )( )( )
K K a Wa W
a WT T=
−+
−−
+ − −− + −
∞ λλ
λλ
λ λλ λ
2
2 22 2
2 2
2 21
1 2
11 1 2
1
2
1 1 2
( ) ( )+
− −
+ −
−
+ −
∞− −
λλ
λ λ7 6
22 5 2 2
22 7 2
2
21
21 1
2 21 1
2a
WK
a
W
a
W
a
WT
/ /
(4)
Where λ denotes the hole aspect ratio of the major and minor diameters, 2a and 2brespectively; b0 is a characteristic length to be determined empirically; W is the width of thepanel; KT is the stress concentration factor for a finite width panel; and KT
∞ is the stressconcentration factor for an infinitely wide panel, which is expressed as follows [11]:
KE
E
E
GTy
xxy
y
xy
∞ = + −
+1
12
λν (5)
where Ex and Ey are the laminate in-plane stiffnesses in the respective x and y (loading)directions respectively, νxy is the in-plane Poisson’s ratio and Gxy is the in-plane shearmodulus.

Volume V: Textile Composites and Characterisation
V - 312
Average Stress Failure Model
The average stress failure model assumes that failure would occur when the averagedlaminate stress over a characteristic length, a0, away from the edge of the damage first reachesthe undamaged compressive strength of the laminate. Using this criterion along with theapproximate stress distribution of an infinite orthotropic symmetric laminate containing anelliptical opening [11], then σCAI may be expressed as:
( ) ( ) ( )σ σ λ
λξ λ
λξ λ λ
λ ξ λCAI =
−+ −
−− + −
− − +
− −
−0
2
2 21
2 22 2
2
22 21
1 2
11
1 1
( )
( ) ( )+ − −
×
− +−
− +
− −
−
λλ ξ λ
λξ λ
7
22 2 5 2
2
22 2 7 2
1
21
2 1
1 1KT / / (6)
where,
( )ξ 2 0= +a a a (7)
λ and KT have been defined in Eqns 2 and 4, respectively, and a0 is a characteristic length tobe determined empirically.
RESULTS AND DISCUSSION
Theoretical predictions of the CAI strength were made using damage dimensions obtainedfrom C-scans along with the elastic properties for each of the braid architectures tested. Thecritical parameter in the calculations is the characteristic length, which was determinedempirically for the two stress models. Fig. 3 shows the variation of characteristic length withdamage width. The characteristic lengths were determined so as to obtain an exact correlationbetween the predicted and measured CAI strength for each data point. It can be seen that thereis a linear relationship between the characteristic length and the damage width for the averagestress model, where as the characteristic length is independent of damage width for the pointstress model.
The criteria used in selecting the characteristic length included keeping it independent ofdamage size, damage aspect ratio and braid architecture, while maintaining good correlationbetween measured and predicted CAI strengths. Although the correlation could be furtherimproved by using different characteristic lengths for different braid architectures, it is theauthors opinion that a constant characteristic length value, which may sacrifice someaccuracy, is of considerably more use. Establishing a constant characteristic length removesthe necessity to perform tests to determine a new characteristic length for a new braidarchitecture. Using this philosophy, only the point stress model was used to predict the CAIstrength of braided composites. Using the values shown in Fig. 3, an average characteristiclength of 5.31 mm with a standard deviation of 1.52 mm was calculated.
Comparisons between the measured CAI strengths and those predicted by the point stressmodel are shown in Figures 4 to 7. Predictions for three characteristic lengths were calculated,based on the average characteristic length (b0 = 5.31 mm) and the upper and lower deviations(b0 = 6.83 mm and b0 = 3.79 mm respectively). As can be seen, the point stress model
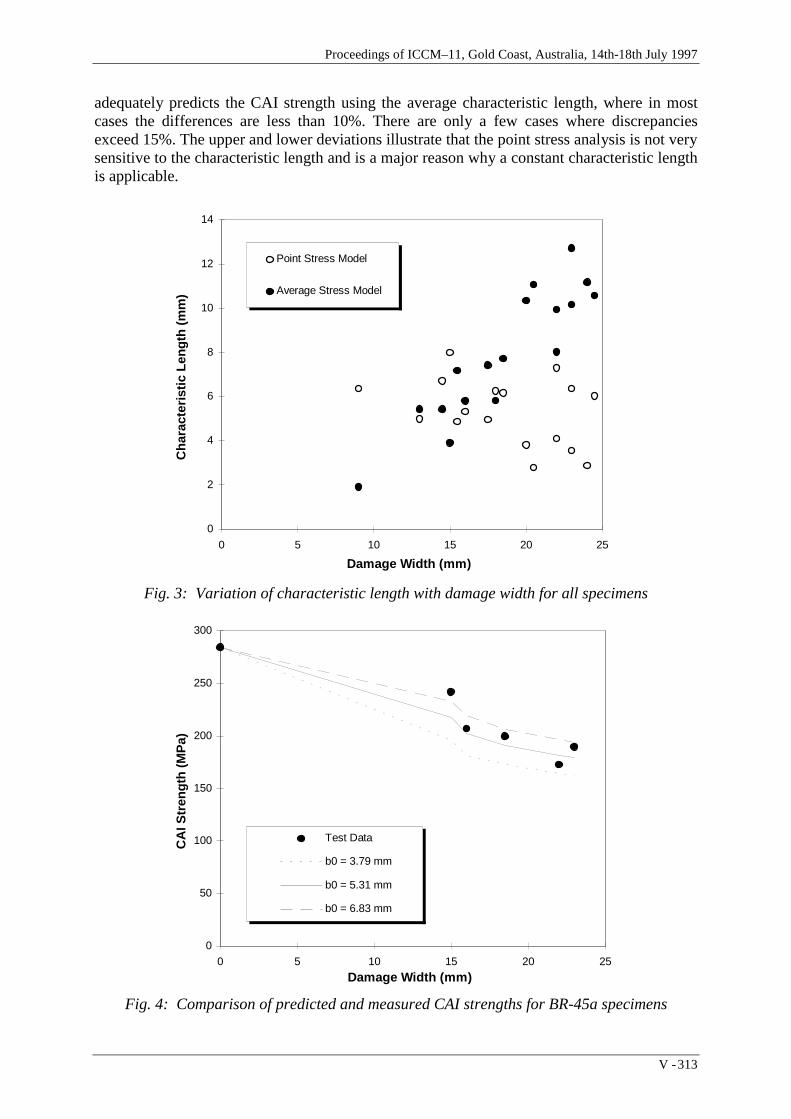
Proceedings of ICCM–11, Gold Coast, Australia, 14th-18th July 1997
V - 313
adequately predicts the CAI strength using the average characteristic length, where in mostcases the differences are less than 10%. There are only a few cases where discrepanciesexceed 15%. The upper and lower deviations illustrate that the point stress analysis is not verysensitive to the characteristic length and is a major reason why a constant characteristic lengthis applicable.
0
2
4
6
8
10
12
14
0 5 10 15 20 25
Damage Width (mm)
Cha
ract
eris
tic L
engt
h (m
m)
Point Stress Model
Average Stress Model
Fig. 3: Variation of characteristic length with damage width for all specimens
0
50
100
150
200
250
300
0 5 10 15 20 25
Damage Width (mm)
CA
I Str
engt
h (M
Pa)
Test Data
b0 = 3.79 mm
b0 = 5.31 mm
b0 = 6.83 mm
Fig. 4: Comparison of predicted and measured CAI strengths for BR-45a specimens
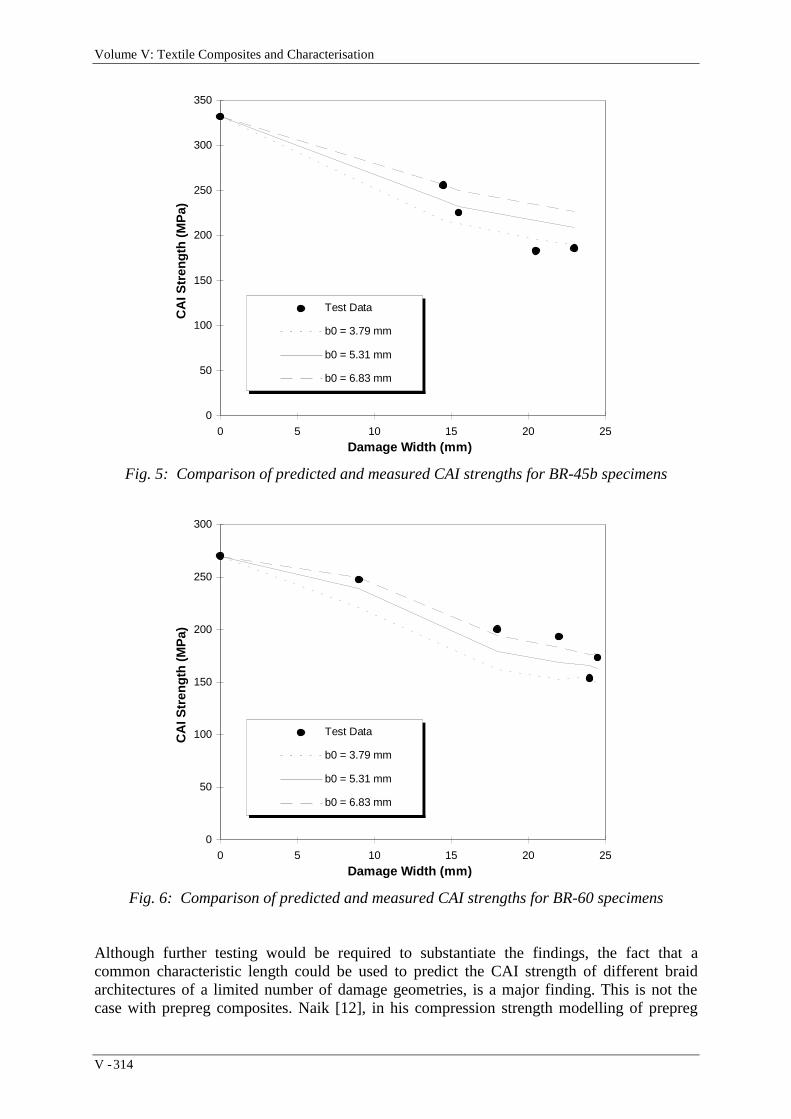
Volume V: Textile Composites and Characterisation
V - 314
0
50
100
150
200
250
300
350
0 5 10 15 20 25
Damage Width (mm)
CA
I Str
engt
h (M
Pa)
Test Data
b0 = 3.79 mm
b0 = 5.31 mm
b0 = 6.83 mm
Fig. 5: Comparison of predicted and measured CAI strengths for BR-45b specimens
0
50
100
150
200
250
300
0 5 10 15 20 25
Damage Width (mm)
CA
I Str
engt
h (M
Pa)
Test Data
b0 = 3.79 mm
b0 = 5.31 mm
b0 = 6.83 mm
Fig. 6: Comparison of predicted and measured CAI strengths for BR-60 specimens
Although further testing would be required to substantiate the findings, the fact that acommon characteristic length could be used to predict the CAI strength of different braidarchitectures of a limited number of damage geometries, is a major finding. This is not thecase with prepreg composites. Naik [12], in his compression strength modelling of prepreg
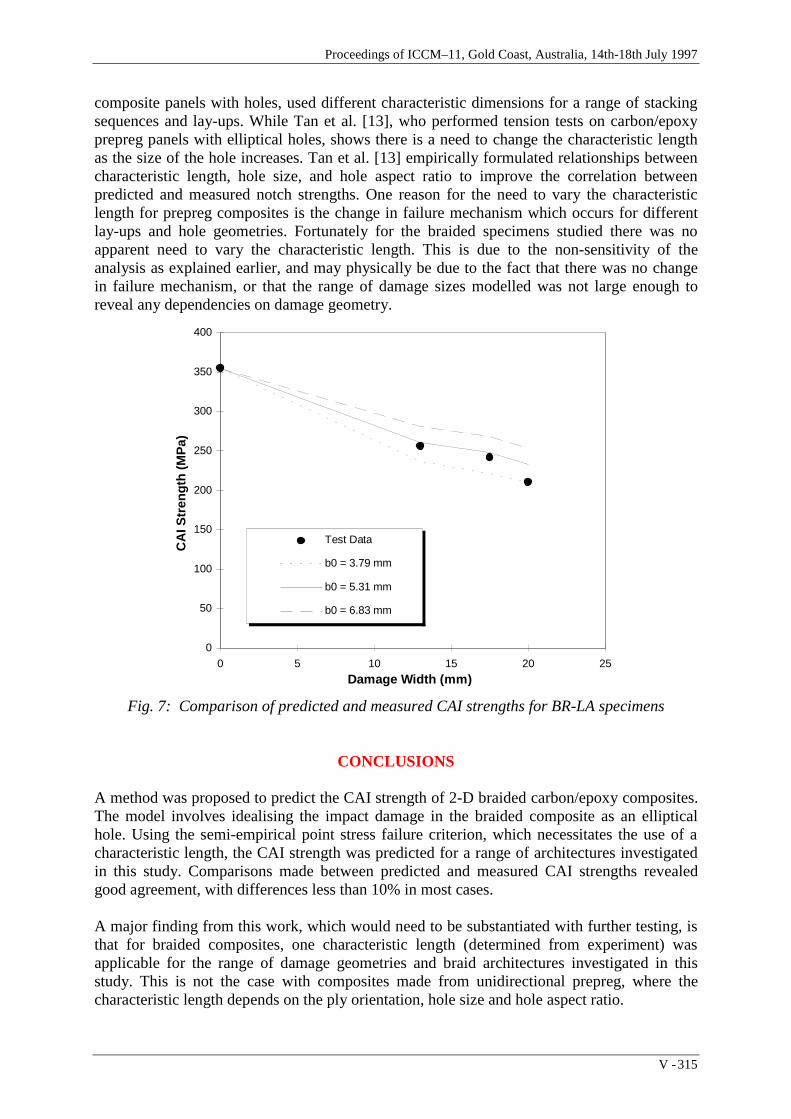
Proceedings of ICCM–11, Gold Coast, Australia, 14th-18th July 1997
V - 315
composite panels with holes, used different characteristic dimensions for a range of stackingsequences and lay-ups. While Tan et al. [13], who performed tension tests on carbon/epoxyprepreg panels with elliptical holes, shows there is a need to change the characteristic lengthas the size of the hole increases. Tan et al. [13] empirically formulated relationships betweencharacteristic length, hole size, and hole aspect ratio to improve the correlation betweenpredicted and measured notch strengths. One reason for the need to vary the characteristiclength for prepreg composites is the change in failure mechanism which occurs for differentlay-ups and hole geometries. Fortunately for the braided specimens studied there was noapparent need to vary the characteristic length. This is due to the non-sensitivity of theanalysis as explained earlier, and may physically be due to the fact that there was no changein failure mechanism, or that the range of damage sizes modelled was not large enough toreveal any dependencies on damage geometry.
0
50
100
150
200
250
300
350
400
0 5 10 15 20 25
Damage Width (mm)
CA
I Str
engt
h (M
Pa)
Test Data
b0 = 3.79 mm
b0 = 5.31 mm
b0 = 6.83 mm
Fig. 7: Comparison of predicted and measured CAI strengths for BR-LA specimens
CONCLUSIONS
A method was proposed to predict the CAI strength of 2-D braided carbon/epoxy composites.The model involves idealising the impact damage in the braided composite as an ellipticalhole. Using the semi-empirical point stress failure criterion, which necessitates the use of acharacteristic length, the CAI strength was predicted for a range of architectures investigatedin this study. Comparisons made between predicted and measured CAI strengths revealedgood agreement, with differences less than 10% in most cases.
A major finding from this work, which would need to be substantiated with further testing, isthat for braided composites, one characteristic length (determined from experiment) wasapplicable for the range of damage geometries and braid architectures investigated in thisstudy. This is not the case with composites made from unidirectional prepreg, where thecharacteristic length depends on the ply orientation, hole size and hole aspect ratio.

Volume V: Textile Composites and Characterisation
V - 316
REFERENCES
1. Falzon, P.J., Herszberg, I. and Karbhari, V.M., “Design and Manufacture of 2-D BraidedPreforms for Aerospace Structural Applications”, Proceedings of PICAST-2/AAC-6,Melbourne, Australia, March 1995, pp.539-544.
2. Falzon, P.J., Herszberg, I., Bannister, M.K. and Leong, K.H., “Compression andCompression-After-Impact Properties of 2-D Braided Carbon/Epoxy Composites”,Australasian Congress on Applied Mechanics, Australia, February 21-23, 1996, pp.297-302.
3. Soutis, C. and Curtis, P.T., “Prediction of the Post-Impact Compressive Strength ofCFRP Laminated Composites”, Composites Science & Technology, Vol. 56, 1996,pp.677-684.
4. Guild, F.J., Hogg, P.J. and Prichard, J.C., “A Model for the Reduction in CompressionStrength of Continuous Fibre Composites After Impact Damage”, Composites, Vol. 24,No. 4, 1993, pp.333-339.
5. Prichard, J.C. and Hogg, P.J., “The Role of Impact Damage in Post-Impact CompressionTesting”, Composites, Vol. 21, No. 6, 1990, pp.503-511.
6. Dost, E.F., Ilcewicz, L.B. and Gosse, J.H., “Sublaminate Stability Based Modelling ofImpact Damage Composite Laminates”, Proceedings of the American Society forComposites 3rd Conference, U.S.A., September 25-29, 1988, Seattle, USA, pp.354-363.
7. Xiong, Y. and Poon, C., “Failure Prediction of Composite Laminates Containing ImpactDamage”, National Research Council Canada, LTR-ST-1898, September 1992.
8. Lekhnitskii, S.G., Anisotropic Plates, Gordon and Breach Science Publishers, New York,1968.
9. Tan, S.C., “Laminated Composites Containing and Elliptical Opening. I. ApproximateStress Analysis and Fracture Models”, Journal of Composite Materials, Vol. 21, 1987,pp.925-948.
10. Whitney, J.M. and Nuismer, R.J., “Stress Fracture Criteria for Laminated CompositesContaining Stress Concentrations”, Journal of Composite Materials, Vol. 8, 1974,pp.253-265.
11. Nuismer, R.J. and Whitney, J.M., “Uniaxial Failure of Composite Laminates ContainingStress Concentrations”, Fracture Mechanics of Composites, ASTM STP 593, 1975,pp.117-142.
12. Naik, N., Woven Fabric Composites, Technomic Publishing Co., Philadelphia, 1996.
13. Tan, S.C., “Laminated Composites Containing and Elliptical Opening. II. Experiment andModel Modification”, Journal of Composite Materials, Vol. 21, 1987, pp.949-968.

Proceedings of ICCM–11, Gold Coast, Australia, 14th-18th July 1997
V - 317
A STUDY ON THE MICROSTRUCTURE OF THREE-DIMENSIONAL BRAIDS
L . Chen, X. M.Tao and C. L.Choy
The Hong Kong Polytechnic University, Hung Hom, Hong Kong
SUMMARY: This paper describes a study of the microstructure of three-dimensional braidsproduced by a four-step method. An analytical approach is employed in conjunction withexperimental investigations to establish the relationship between the braid structure andbraiding parameters. Based on microscopic observations of yarn orientation and distortion, wedivide a three-dimensional braid structure into three representative regions, i.e., the interior,surface and corner, and establish three types of microstructural unit-cell models for the threeregions, respectively. An equivalent cross sectional area has been defined by averaging theeffect of yarn localised distortion, based on which, the yarn packing factor has been examinedat the jamming conditions. Expressions for the fibre volume fractions in the three regions andthe whole braided composite have been derived accordingly. Based on these expressions, thetotal fibre volume fractions in several braided composites have been calculated and found tobe in good agreement with experimental results.
KEYWORDS: three-dimensional braids, microstructure, braided composites
INTRODUCTION
The properties and performance of a three-dimensional braided composite depend primarilyon the microstructure of braided preform and the mechanical and physical properties of theconstituent materials. In the past, a considerable amount of effort has been placed on theunderstanding of the microstructure of braids. Ko [1] first identified a unit cell representingthe fiber architecture of rectangular braided performs, which was a cuboid containing fourdiagonally intersecting yarns. Later Du and Ko [2] re-examined the earlier treatment andfound that the unit cell was oversimplified and incorrect. Li et al [3] reported an experimentalstudy of the internal structure of braids and identified a unit cell for braided composites, basedon the assumptions that yarns were straight rods with a circular cross-section and there wereno lateral deformations at the yarn cross-over points. Li et al also observed that the structureon the surface of the braid preforms was different from that in the interior. Subsequent studiesconducted by Lei [4] and Kosher [5] revealed that the corners were unique in the preformstructure. Recently, Wang [6] presented an analysis of the topological structure in three-dimensional braided preforms and defined three distinctive types of unit cells in the preforminterior, surface and corner regions, respectively.
To date, the topological structure of three-dimensional braids, which is determined bythe braiding sequence and number of yarns, can generally be understood on the basis ofprevious models. However, experimental evidence [7] showed that the mechanicalperformance of 3D braided composites deteriorated greatly by cutting the edge off thepreform. Moreover, the mechanical properties of the braided composites were affected by the

Volume V: Textile Composites and Characterisation
V - 318
yarn bundle size. These phenomena cannot be explained by existing models. Therefore, thereis a need to use more realistic geometrical unit cells, which combine the braid topology withthe yarn configuration, in order to successfully predict the mechanical properties of the three-dimensional braided composites. This paper presents a study of the microstructure of three-dimensional braids fabricated by a four-step method. An analytical approach is employed inconjunction with experimental investigations to establish the relationship between the braidstructure and the braiding parameters.
MICROSCOPIC OBSERVATIONS
Eight samples of three dimensional braid preforms were made by the four-step method. Thespecifications for the braids are given in Table 1. Carbon fibre T300-12K, an epoxy resinTED-85 and a curing agent, acid annydride-70, were used to fabricate the composite samples.The curing conditions were: 130oC for 2 hours, then 150oC for 1 hour, followed by 160oC for8 hours and finally 180oC for 3 hours. The final dimensions of the composite samples were250 x 25 x 6 (mm3). Samples of the braid preforms were embedded in a resin, Nej-o-lac, suchthat the cutting of the braids became easy and the yarns could be carefully removed from thebraids without alternating their original shapes. The rectangular braids were cut at 45o to itssides. Optical and electron scanning microscopes were used to examine the yarn surface andthe interior of braid preforms.
Table 1: Specifications of samples
Samples Dy(mm) m ×n α h(mm) γ θ β
HKT3002-1 0.757 22 × 6 19.0 5.22 26.0 10.8 7.3
HKT3003-1 0.757 22 × 6 21.0 4.70 28.5 12.0 8.1
HKT3004-1 0.757 22 × 6 21.0 4.73 28.5 12.0 8.1
HKT3005-1 0.757 22 × 6 21.5 4.60 29.1 12.3 8.3
HKT3002-2 0.757 19 × 5 40.0 2.57 49.9 25.0 17.3
HKT3003-2 0.757 19 × 5 40.0 2.59 49.9 25.0 17.3
HKT3004-2 0.757 19 × 5 40.0 2.60 49.9 25.0 17.3
HKT3005-2 0.757 19 × 5 39.0 2.64 48.9 24,2 16.7
Fig. 1: SEM micrograph of the interior of a four-step braid interior
Figure 1 is a micrograph of the cross-section in the braiding interior cut at a 45o angle withthe braid surface. It shows that the axes of the multifilament yarns remain straight in spite of
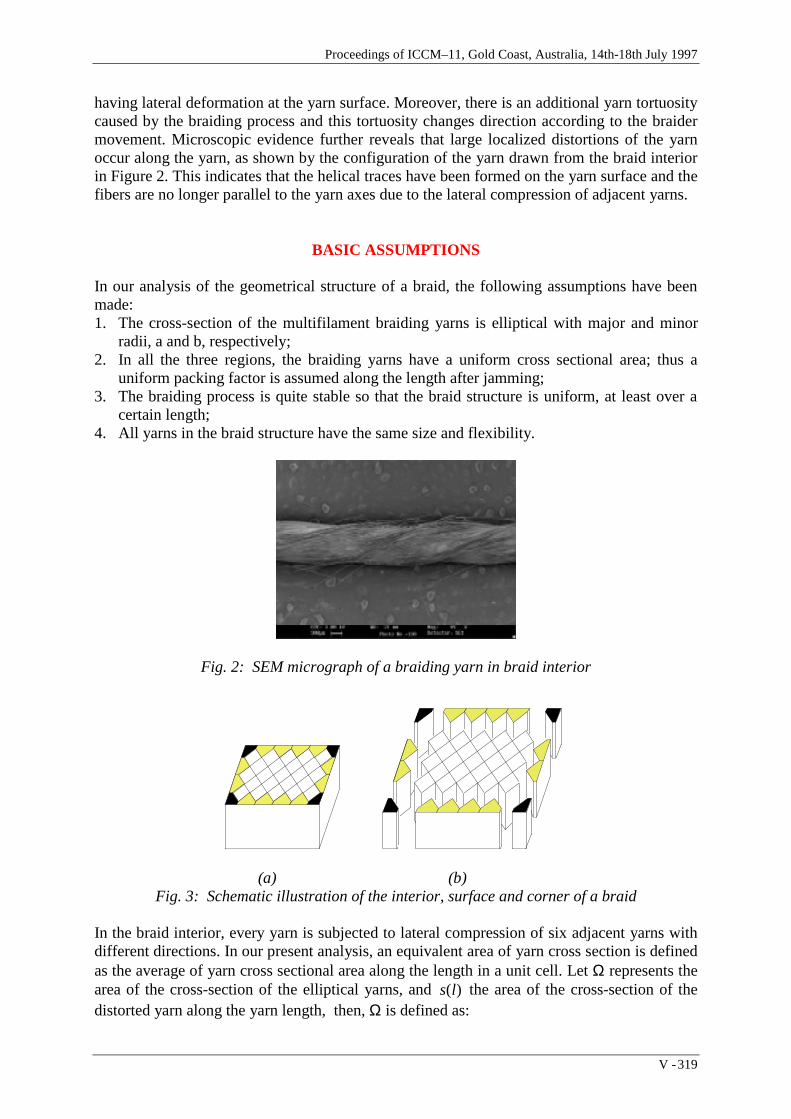
Proceedings of ICCM–11, Gold Coast, Australia, 14th-18th July 1997
V - 319
having lateral deformation at the yarn surface. Moreover, there is an additional yarn tortuositycaused by the braiding process and this tortuosity changes direction according to the braidermovement. Microscopic evidence further reveals that large localized distortions of the yarnoccur along the yarn, as shown by the configuration of the yarn drawn from the braid interiorin Figure 2. This indicates that the helical traces have been formed on the yarn surface and thefibers are no longer parallel to the yarn axes due to the lateral compression of adjacent yarns.
BASIC ASSUMPTIONS
In our analysis of the geometrical structure of a braid, the following assumptions have beenmade:1. The cross-section of the multifilament braiding yarns is elliptical with major and minor
radii, a and b, respectively;2. In all the three regions, the braiding yarns have a uniform cross sectional area; thus a
uniform packing factor is assumed along the length after jamming;3. The braiding process is quite stable so that the braid structure is uniform, at least over a
certain length;4. All yarns in the braid structure have the same size and flexibility.
Fig. 2: SEM micrograph of a braiding yarn in braid interior
(a) (b)Fig. 3: Schematic illustration of the interior, surface and corner of a braid
In the braid interior, every yarn is subjected to lateral compression of six adjacent yarns withdifferent directions. In our present analysis, an equivalent area of yarn cross section is definedas the average of yarn cross sectional area along the length in a unit cell. Let Ω represents thearea of the cross-section of the elliptical yarns, and s l( ) the area of the cross-section of thedistorted yarn along the yarn length, then, Ω is defined as:

Volume V: Textile Composites and Characterisation
V - 320
Ω = ∫1
0Ls l dl
L( ) (1)
where L is the length of a yarn in a unit-cell.
THREE TYPES OF UNIT CELLS
Selection of Control Volumes
As shown in Figure 3, a braid has a skin-core structure and can be divided into there regions:interior, surface and corner regions. Each of these three regions is built up by an identical unitcell, respectively, though the exact manner of composition depends on the initial yarn carrierpattern. The traces of yarn carriers in the interior, on the surface and the corner have theirunique features, which lead to the different yarn structures in the three regions. These regionsmust be treated separately.
01 03 05
11 12 13 14 15 16 17
20 21 22 23 24 25 26
31 32 33 34 35 36 37
40 41 42 43 44 45 46
51 52 53 54 55 56 57
60 61 62 63 64 65 66
72 74 76
13 15 17
11 01 21 03 23 05 25
12 33 14 35 16 37 26
31 20 41 22 43 24 45
32 53 34 55 36 57 46
51 40 61 42 63 44 65
52 72 54 74 56 76 66
60 62 64
11 21 23
33 13 35 15 37 17 25
12 31 01 41 03 43 05
53 14 55 16 57 26 45
32 51 20 61 22 63 24
72 34 74 36 76 46 65
52 60 40 62 42 64 44
54 56 66
(a) Original (b) Second step (c) Fourth step
Fig. 4: The movement of carriers during a machine cycle [6×6:(1-1)]
Although the braiding process is achieved by translational permutations of column and rowtracks, these permutations can be combined into a rotational operation as indicated by thediagonal lines in Figures 4b and 4c. Considering the carrier positions after every 2 and 4steps, the carriers connected by these lines exchange their positions by rotation. Thesecontinuous rotational exchanges result in the repeatability of the topological structure in thebraid interior. In our analysis, a control volume method is employed to describe thetopological structure of a three-dimensional braid. The control volume for the interior isdefined by the cuboid enclosed by carriers 33, 34, 45, 55, 64, 63, 52 and 42 in the originalpattern and two parallel planes separated by the height of four braiding steps. There aretwelve yarns in this control volume. The control volume for the surface is represented by acylinder with the bottom area enclosed by carriers 64, 65 and 74 while the corner one isenclosed by carriers 66 and 76.

Proceedings of ICCM–11, Gold Coast, Australia, 14th-18th July 1997
V - 321
Fig. 5: Yarn paths in braid interior during four braiding steps
Braid Interior Region
In the interior control volume, carriers 34, 55, 63 and 42 remain in the control volume afterthe 4-step machine cycle while the others move out. The spatial traces of the yarn carried bycarriers 34, 43 and 61 during the four braiding steps are shown in Figure 5a , where the linesconnecting the yarn carriers represent the yarn axes. Note that carriers 34, 43 exchange theirrespective positions after step 2 and carriers 34, 61 do so after step 4. Thus the yarn follows azigzag trace before compacting. However, when a uniform yarn-compacting action is appliedby yarn jamming, the yarns will be straightened and repositioned in the space as shown inFigure 5b. Figures 5b-5e illustrate the configuration of the axes of all the twelve yarns in thefour sections of the control volume. Assembling the four sections, the unit-cell of the braidinterior can be obtained as shown in Figure 6a.
X'
Y'
X
Z'
O'
h
450
γ
h
O'
h/2
4b4b
h/2
(a) (b) (c) d)Fig. 6: A unit-cell (a), a quarter unit-cell (b) and two sub-cells (c and d) in the braid interior
According to the orientation angles, the braid interior comprises four groups of yarns, andintersecting two sets of parallel planes of a cuboid. The control volume can be further divided
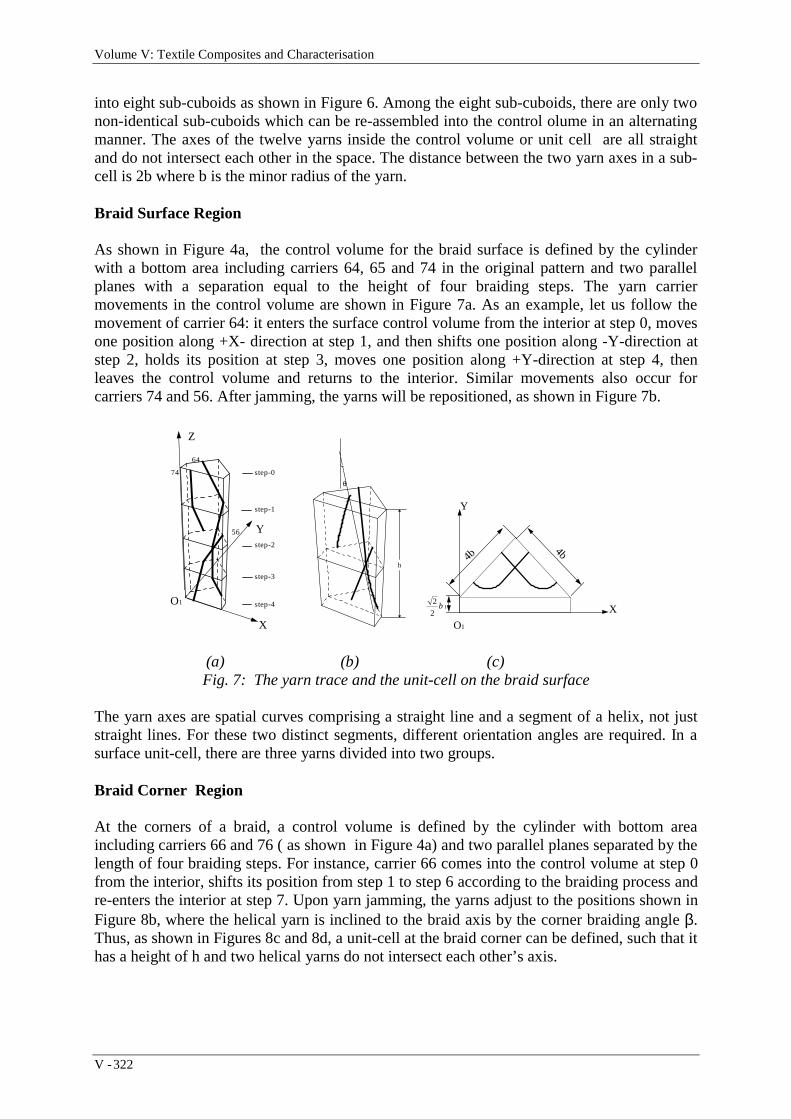
Volume V: Textile Composites and Characterisation
V - 322
into eight sub-cuboids as shown in Figure 6. Among the eight sub-cuboids, there are only twonon-identical sub-cuboids which can be re-assembled into the control olume in an alternatingmanner. The axes of the twelve yarns inside the control volume or unit cell are all straightand do not intersect each other in the space. The distance between the two yarn axes in a sub-cell is 2b where b is the minor radius of the yarn.
Braid Surface Region
As shown in Figure 4a, the control volume for the braid surface is defined by the cylinderwith a bottom area including carriers 64, 65 and 74 in the original pattern and two parallelplanes with a separation equal to the height of four braiding steps. The yarn carriermovements in the control volume are shown in Figure 7a. As an example, let us follow themovement of carrier 64: it enters the surface control volume from the interior at step 0, movesone position along +X- direction at step 1, and then shifts one position along -Y-direction atstep 2, holds its position at step 3, moves one position along +Y-direction at step 4, thenleaves the control volume and returns to the interior. Similar movements also occur forcarriers 74 and 56. After jamming, the yarns will be repositioned, as shown in Figure 7b.
64
74 step-0
step-1
56
step-2
step-3
step-4o
Y
Z
X
O1
θ
h
4b
4b
2b
O
X
Y
O1
2
2b
(a) (b) (c)Fig. 7: The yarn trace and the unit-cell on the braid surface
The yarn axes are spatial curves comprising a straight line and a segment of a helix, not juststraight lines. For these two distinct segments, different orientation angles are required. In asurface unit-cell, there are three yarns divided into two groups.
Braid Corner Region
At the corners of a braid, a control volume is defined by the cylinder with bottom areaincluding carriers 66 and 76 ( as shown in Figure 4a) and two parallel planes separated by thelength of four braiding steps. For instance, carrier 66 comes into the control volume at step 0from the interior, shifts its position from step 1 to step 6 according to the braiding process andre-enters the interior at step 7. Upon yarn jamming, the yarns adjust to the positions shown inFigure 8b, where the helical yarn is inclined to the braid axis by the corner braiding angle β.Thus, as shown in Figures 8c and 8d, a unit-cell at the braid corner can be defined, such that ithas a height of h and two helical yarns do not intersect each other’s axis.

Proceedings of ICCM–11, Gold Coast, Australia, 14th-18th July 1997
V - 323
X
step-0
step-1
step-2
step-3
step-4
step-5
step-6
step-7
step-8
6676
44
o
Y
Z
O2
66
76
44
β
h
X
Y
O
4b
2b
2b
O2
2
2b
2
2b
(a) (b) (c) (d)Fig. 8: Yarn traces at the corner and the corner unit-cell : (a) Yarn traces during 8 steps of
braiding; (b) Yarn traces after jamming; (c) and (d) The unit cell for the corner region.Relationship Between the Three Regions
Suppose one carrier in the interior occupies one unit volume. For a m x n braid, the volumesof the regions in term of the unit volume, as can be seen from Figures 9, are given in Table 2:
Table 2: Volumes occupied by the interior, surface and corner regions
Units M and N are Even Numbers M or N is not an Even NumberSurface 3( m + n - 4 ) / 2 3( m + n -2 ) / 2Corner 4 2Interior mn - m - n + 2 mn -m -n + 1Total mn + ( m + n ) / 2 mn + ( m + n ) / 2
an unit volume
ha
lf o
f a
n u
nit
volu
me
a unit volume
half
of a
uni
t vol
ume
a unit volume
hal
f of a
un
it vo
lum
e
(a) 8×6 pattern (b) 8×5 patternFig. 9: Volume occupied by the interior, surface and corner regions
Thus for the braids with m and n both even, the volume proportions of the regions in thewhole structure can be calculated as:

Volume V: Textile Composites and Characterisation
V - 324
( )( )
( )
Vm n
mn m n
Vm n
mn m n
Vmn m n
i
s
c
=− − +
+ +
=+ −+ +
=+ +
2 1 1 2
23 4
28
2
(2)
Similarly, for the case where either m or n is an odd number , the volume proportions of theregions are given by:
( )( )
( )
Vm n
mn m n
Vm n
mn m n
Vmn m n
i
s
c
=− −
+ +
=+ −+ +
=+ +
2 1 1
23 2
24
2
(3)
YARN PACKING FACTOR
The yarn packing factor can be defined as:
επ
= =D D
aby y2 2
4 4Ω(4)
where Dy is the equivalent diameter of a solid braiding yarn, which is determined by the yarntex and fibre density.
From the triangle marked in Figure 11b, we have the following geometric relation:
h b= 8 / tanγ (5)
γ
I
II
S
4b
4b
h
X'
Y'
Z'
Fig. 10: The geometry of the jamming condition

Proceedings of ICCM–11, Gold Coast, Australia, 14th-18th July 1997
V - 325
Upon yarn jamming, the yarns contact each other as shown in Figure 10. The equations forthe inclined elliptical-cylinder surface of two braiding yarns, Y1 and Y2, in the givencoordinate system are:
Y1: [( ) cos sin ] / ( ) /x b z a y b b− + + − =8 3 12 2 2 2γ γ (6)
Y2: ( ) / [( ) cos sin ] /x b b y b z a− + − + =3 4 12 2 2 2γ γ (7)
The plane, S, which is parallel to the elliptical-cylinders, Y1 and Y2, can be described by thefollowing expression:
Ax By Cz D+ + + = 0 (8)
The orientation vector of the axis of the elliptical-cylinder Y1 is -sinγ, 0, cosγ. The plane Sis parallel to Y1, thus the following condition is satisfied:
A C= / tanγ (9)
The orientation vector of the axis of the elliptical-cylinder Y2 is 0, -sinγ, cosγ. The plane Sis parallel to Y2; similarly, we have:
B C= / tanγ (10)
Dividing Equation 8 by C/tanγ yields :
x y z D+ + + ′ =tanγ 0 (11)
Since the plane S is a tangent plane to Y1 defined by Equation 6, then, by letting x=4b, andsolving Equations 6 and 11, there must be one and only one real solution:
′ = − + +D b a b11 2 2 2cos / cosγ γ (12)
A similar relation exists for Y2. Plane S is a tangent plane to Y2 described by Equation 7.Letting y=4b and solving Equations 7 and 11 leads to
′ = − − +D b a b7 2 2 2cos / cosγ γ (13)
By equating Equations 12 and 13, we obtain:
a b= 3 cosγ (14)
Substituting Equations 5 and 14 into Equation 4, the expression for the yarn-packing factor εcan be rewritten as follows:
ε γ γ γ γ= =16 3 3 16 3 32 2 2 2 2D h hy d/ ( tan cos ) / ( tan cos ) (15)
where hd=h/Dy, is a normalized pitch length.
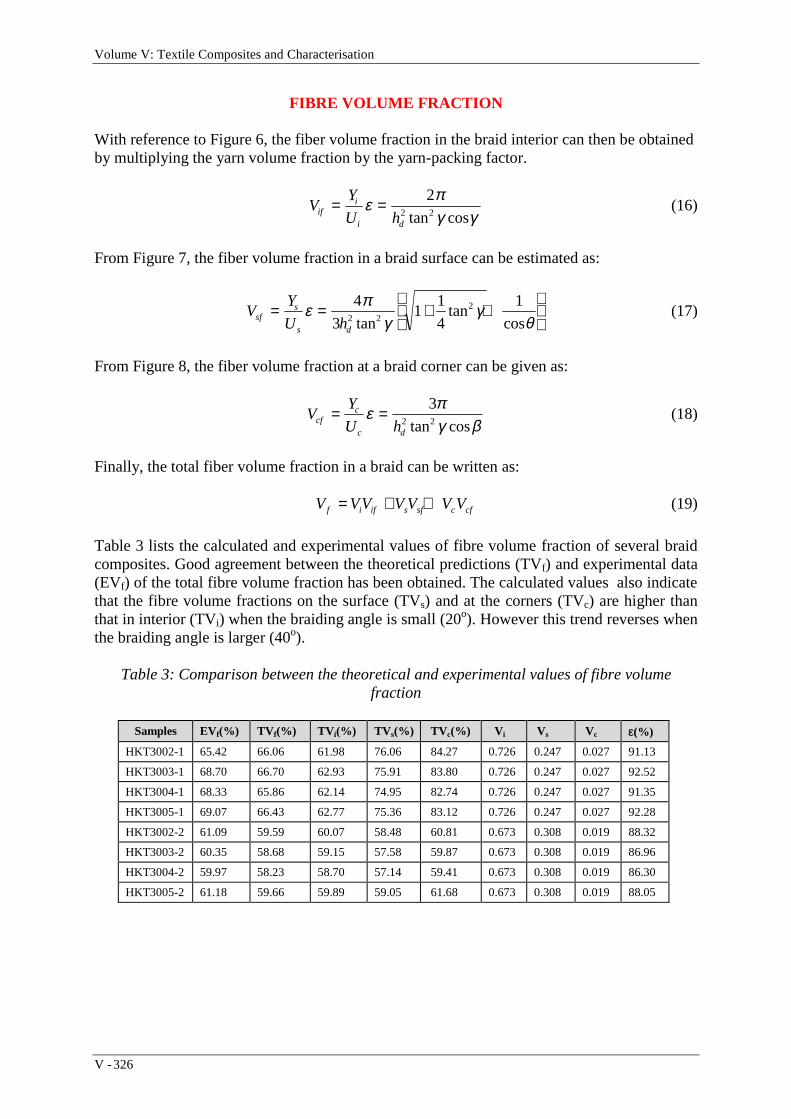
Volume V: Textile Composites and Characterisation
V - 326
FIBRE VOLUME FRACTION
With reference to Figure 6, the fiber volume fraction in the braid interior can then be obtainedby multiplying the yarn volume fraction by the yarn-packing factor.
VY
U hifi
i d
= =ε πγ γ
22 2tan cos
(16)
From Figure 7, the fiber volume fraction in a braid surface can be estimated as:
VY
U hsfs
s d
= = + +
ε π
γγ
θ4
31
1
4
12 2
2
tantan
cos(17)
From Figure 8, the fiber volume fraction at a braid corner can be given as:
VY
U hcfc
c d
= =ε πγ β
32 2tan cos
(18)
Finally, the total fiber volume fraction in a braid can be written as:
V VV V V V Vf i if s sf c cf= + + (19)
Table 3 lists the calculated and experimental values of fibre volume fraction of several braidcomposites. Good agreement between the theoretical predictions (TVf) and experimental data(EVf) of the total fibre volume fraction has been obtained. The calculated values also indicatethat the fibre volume fractions on the surface (TVs) and at the corners (TVc) are higher thanthat in interior (TVi) when the braiding angle is small (20o). However this trend reverses whenthe braiding angle is larger (40o).
Table 3: Comparison between the theoretical and experimental values of fibre volumefraction
Samples EVf(%) TVf(%) TVi(%) TVs(%) TVc(%) Vi Vs Vc ε(%)
HKT3002-1 65.42 66.06 61.98 76.06 84.27 0.726 0.247 0.027 91.13
HKT3003-1 68.70 66.70 62.93 75.91 83.80 0.726 0.247 0.027 92.52
HKT3004-1 68.33 65.86 62.14 74.95 82.74 0.726 0.247 0.027 91.35
HKT3005-1 69.07 66.43 62.77 75.36 83.12 0.726 0.247 0.027 92.28
HKT3002-2 61.09 59.59 60.07 58.48 60.81 0.673 0.308 0.019 88.32
HKT3003-2 60.35 58.68 59.15 57.58 59.87 0.673 0.308 0.019 86.96
HKT3004-2 59.97 58.23 58.70 57.14 59.41 0.673 0.308 0.019 86.30
HKT3005-2 61.18 59.66 59.89 59.05 61.68 0.673 0.308 0.019 88.05

Proceedings of ICCM–11, Gold Coast, Australia, 14th-18th July 1997
V - 327
CONCLUSION
In this paper, an analysis of the microstructure of three-dimensional braids produced by afour- step method has been presented. Three distinct unit cells have been defined for thethree regions of a 4-step braid made from multifilament yarns. According to the yarnorientation angles, the braid interior has been represented by a unit cell comprising twelvestraight yarns, intersecting two sets of parallel planes of the cuboid unit cell which can befurther divided into eight sub-cells. Among the eight sub-cells, there are only two non-identical cells which can be re-assembled into the unit cell in an alternating manner. In thesurface unit cell, the braiding yarn axes are spatial curves comprising a straight line and asegment of a helix. For these two distinct segments, different orientation angles have beendetermined. The unit-cell at the braid corner has been defined, as having two helical yarnswhich do not intersect each other’s axis.
In addition, an equivalent cross sectional area was defined by averaging the effect of yarnlocalized distortion, based on which, the yarn packing factor has been examined at thejamming conditions. Expressions for the fibre volume fractions in the three regions and thewhole braided composite have been derived accordingly. Based on these expressions, the totalfiber volume fraction in several braided composites have been calculated and found to be ingood agreement with experimental results.
ACKNOWLEDGMENT
One of us ( Mr. Chen L. ) wishes to acknowledge the financial support received from theHong Kong Polytechnic University for the work carried out in this project.
REFERENCES
1. Ko,F.K., "Three dimensional fabrics for composites-an introduction to the magnaweavestructure", Proc. ICCM-4, Japan Soc. Composite Material, Tokyo, Japan, 1982, p.1609.
2. Du,G.W. & Ko,F.K., "Unit cell geometry of 3-D braided structure", Proc.Am. Soc.Com.,1991.
3. W.Li, M.Hammad and A.El-Shiekh, "Structural analysis of 3-D braided preforms forcomposites", J. Text. Inst., 1990, 81 No 40, p.491-514.
4. Lei,C., Cai,Y.j. & Ko,F.K., "Finite element analysis of 3-D braided composite", In Adv. inEng.Software and Workstations, Elsevier Science, 1992, p.187-194.
5. T.D.Kostar and T-W.Chou, "Design and automated fabrication of 3-D braided preformsfor advanced structural composites", Computer Aided Design in Composite MaterialTechnology III , Elsevier Science, 1992, p.63-78.
6. Y.Q.Wang & A.S.D.Wang, "On the topological yarn structure of 3-D rectangular andtubular braided preforms", Composites Science and Technology, 51(1994), p.575-586.
7. F.K Ko, "Three Dimensional fabrics for composites", in “Textile Structural Composites”,Elsevier, 1989.

Volume V: Textile Composites and Characterisation
V - 328
THE EFFECT OF ARCHITECTURE ON THEMECHANICAL PROPERTIES OF KNITTED
COMPOSITES
K.O. Anwar 1, P.J. Callus 1, K.H. Leong 2, J. I. Curiskis 3 & I. Herszberg1
1 Sir Lawrence Wackett Centre for Aerospace Design and Technology,Royal Melbourne Institute of Technology, GPO Box 2476V, Melbourne, VIC 3001, Australia.
2 Cooperative Research Centre for Advanced Composite Structures Ltd.,506 Lorimer Street, Fishermens Bend, VIC 3207, Australia.
3 Department of Textile Technology, University of New South Wales,Sydney, NSW 2052, Australia.
SUMMARY: The aim of this paper is to investigate the tensile and compression properties,and failure mechanisms, of three different Milano ribs and one 1x1 rib weft-knit architecture.These fabrics were impregnated with vinyl ester resin to make thin, flat panels using the resintransfer moulding technique. The fibre volume fractions of the composites were maintainedconstant at approximately 53%. Tensile and compression specimens were cut in both the waleand the course directions and then tested to failure. Fractography was performed using astereo optical microscope to establish the locus of failure. The wale-tested specimens weresuperior in tensile properties to the course-tested specimens. Tensile properties were greatlyaffected by the loop structure of the knitted fabrics, whereas compression properties werealmost independent of test direction, loop length and loop density. It was observed that tensilefracture occurred in the planes of lowest fibre content for both specimens tested in the wale aswell as in the course directions. This coincided with fibre fractures at legs of the loops for thewale-tested specimens and at needle-sinker loops for the couse-tested specimens.
KEYWORDS: knit, rib, milano, wale, course, loop length, loop density, anisotropy.
INTRODUCTION
Considerable research has been directed at understanding the behaviour of composites madeusing textile manufacturing techniques in an attempt to gain industrial acceptance. One ofthese textile techniques, knitting, has been used, to produce structural preforms that providethe required fibre orientations and through-the-thickness fibre reinforcement. The near netshape manufacture of knitted preforms and their excellent drapability hold promise to be usedin the composite manufacturing industry as cost effective and mechanically efficient structuralcomponents. Unfortunately, there is insufficient understanding of the effect of knitted textilereinforcements on the mechanical behaviour of structural composites.
Marvin [1] is believed to be the earliest worker to have studied the tensile properties ofknitted glass/phenolic laminates with a view to replacing the metallic nose cones of subsonicand supersonic missiles. Rudd et al. [2] investigated plain weft-knit glass/polyester laminatesboth experimentally and analytically. Attempts were made to improve the stiffness of thelaminates by using cross-floated knitted fabric. Verpoest and Dendauw [3] showed

Proceedings of ICCM–11, Gold Coast, Australia, 14th-18th July 1997
V - 329
experimentally that plain weft knit glass/epoxy laminates were anisotropic and dependentupon the knit architecture, fibre volume fraction and degree of fabric stretching. Fatigueproperties of weft knitted composites were investigated by Chou et al. [4]. Wu et al. [5]showed that knitted structures greatly affect the in-plane anisotropic nature, tensile strength,and modulus of basic warp-knit fabric-reinforced composites. Ramakrishna and Hull [6]studied experimentally the tensile properties of 1x1 rib weft-knit carbon-fibre-fabric/epoxylaminates with and without inlay fibres. Significant increases in the modulus and tensilestrength were achieved by inserting unidirectional tows of carbon fibres in the coursedirection. More recently, Herszberg and colleagues [7-10] studied experimentally themechanical performance of weft-knit E glass/epoxy composites using the Milano rib and half-Milano architecture. The tensile properties of the half-Milano were found to be inferior tothose of the Milano rib and extremely anisotropic.
For this study, an epoxy-based vinyl ester resin was used. Derakane 411C-50 resin waschosen because it has an exceptionally low resin viscosity and has been specially designed forthe resin transfer moulding (RTM) process. Four different weft knit structures were studied.The effects of knit architecture, fibre orientation, loop lengths and loop density (course/cmand wale/cm) on the tensile and compression properties were discussed. Failure mechanismswere examined based on fractographic studies using a stereo optical microscope.
EXPERIMENTAL TECHNIQUES
Three different Milano rib (M1, M3, M9) and one 1x1 rib (R3) weft-knit architectures wereproduced from E-glass yarns by combining 2x68 tex on an 8-gauge V-bed knitting machine.Components of weft-knit loop structure are shown in Fig. 1. Rib knit fabrics contain loops inalternate groups of wales meshed on one side of the fabric with the loops in the remainingwales meshed on the opposite side. Each wale contains either all plain stitches or all purl orback stitches. In the 1x1 rib structure, every second stitch alternates from front to back. Fig.2(a) shows a schematic presentation of 1x1 rib structure. In the Milano, shown in Fig. 2(b),each complete repeat of the structure consists of three courses - two rows of plain or backloops, knitted on two separate sets of needles, which are held together by a row of 1x1 ribcourse. Since the face and the back surface are identical in construction, the resultant fabric iscompletely balanced.
Thin flat composite panels (405 mm x 540 mm) were fabricated by the resin transfermoulding technique using Derakane 411C-50 vinyl ester resin. Resin injection was performedwith 210 KPa at the inlet and 100 KPa vacuum at the outlet. The panels were postcured at120oC for an hour to optimise resin properties. In order to maintain fairly constant specimenthickness of 3 mm and fibre volume fraction of approximately 53%, the number of layers ofeach preform were 6, 6, 6 and 10 in types R3, M3, M1, and M9 respectively. Panel details aresummarised in Table 1.

Volume V: Textile Composites and Characterisation
V - 330

Proceedings of ICCM–11, Gold Coast, Australia, 14th-18th July 1997
V - 331
Table 1: Variation of weft-knit architectures and panel details
Loop density Loop length Panel detailsType Course
density(C/cm)
Waledensity(W/cm)
Plaincourse(mm)
Ribcourse(mm)
Fabriclayers/
testpanel
ArealWeight(g/m2)
VolumeFraction
(%)
R3 10.2 3.92 - 6.2 6 675 52.94M3 9.2 4.70 6.2 6.5 6 680 53.33M1 8.8 4.50 5.8 6.6 6 664 52.10M9 6.2 2.80 7.8 9.1 10 415 54.25
Tensile specimens (250 mm x 25 mm) were cut from the panels parallel to the wale (W) andthe course (C) direction. Tensile tests were performed on an MTS machine using a 128 mmgauge length extensometer, at room temperature and at a test speed of 0.5 mm/min. 250 seriesstrain gauges were bonded to the surface of the tensile specimens. Compression specimens(56 mm x 25 mm) were also cut in both the wale and the course direction and tested to failureusing a modified IITRI (Illinois Institute of Technology Research Institute) test rig on anMTS machine at a speed of 0.5 mm/min. The ultimate strength, strain to failure, elasticmodulus and Poisson’s ratio were determined for each specimen. Elastic modulus andPoisson’s ratio were calculated in the strain range of 0.1 to approximately 0.3%. Fracturepaths were recorded by taking photomicrographs of the tested specimens.
RESULTS AND DISCUSSION
Tensile properties
As shown in Table 1, the loop length and loop density for the three Milano rib and 1x1 ribarchitectures were different. The results of tensile tests are summarised in Table 2. It wasobserved that the tensile strength, tensile modulus and strain to failure in the wale directionwere higher than those in the course direction.
Table 2: Tensile properties of weft knitted fabric-reinforced composites
TypeStrength(MPa)
StrengthRatio
Tensile Modulus(GPa)
Strain to Failure(%)
W C W/C W C W CR3 96.0 75.8 1.27 14.7 14.0 1.40 0.84M3 122 82.8 1.47 14.9 13.2 2.20 1.40M1 134 83.0 1.62 14.3 12.3 2.40 1.40M9 160 113 1.41 15.5 14.1 2.40 2.00
Figure 3 shows the typical tensile stress-strain curves for all four weft-knit compositelaminates. On the whole, the response of all laminates was linear up to a ‘knee point’, whichoccurred at a strain of approximately 0.3%. Strains at that point were almost independent ofthe testing direction for all four structures. From the ‘knee point’, all specimens displayedsignificant softening, which continued until failure.

Volume V: Textile Composites and Characterisation
V - 332
0
40
80
120
160
200
0.000 0.005 0.010 0.015 0.020 0.025 0.030
Strain (mm/mm)
Ten
sile
Str
ess
(MP
a)
M1-W
M3-C
M9-C
R3-CM1-C
M3-w
M9-W
R3-W
Fig. 3: Tensile stress-strain curves of weft-knit composites.
0
25
50
75
100
125
150
175
200
Wale Course
Ten
sile
Str
ess
(MP
a)
R3
M3
M1
M9
(a)
Increasing loop density
Increasing loop length
0
2
4
6
8
10
12
14
16
18
Wale Course
Ten
sile
Mod
ulus
(G
Pa)
(b)
0.0
0.5
1.0
1.5
2.0
2.5
3.0
Wale Course(c)
Ten
sile
Str
ain
(%)
0.00
0.05
0.10
0.15
0.20
0.25
0.30
0.35
0.40
Wale Course
Poi
sson
's R
atio
(d)
Fig. 4: Tensile properties of weft knitted composites (a) strength, (b) elastic Modulus,(c) strain to failure, and (d) Poisson’s ratio
Inspection of Fig. 4(a) revealed that the tensile strength in the wale direction was much higherthan that in the course direction for all laminates. It was also observed that the tensile strength
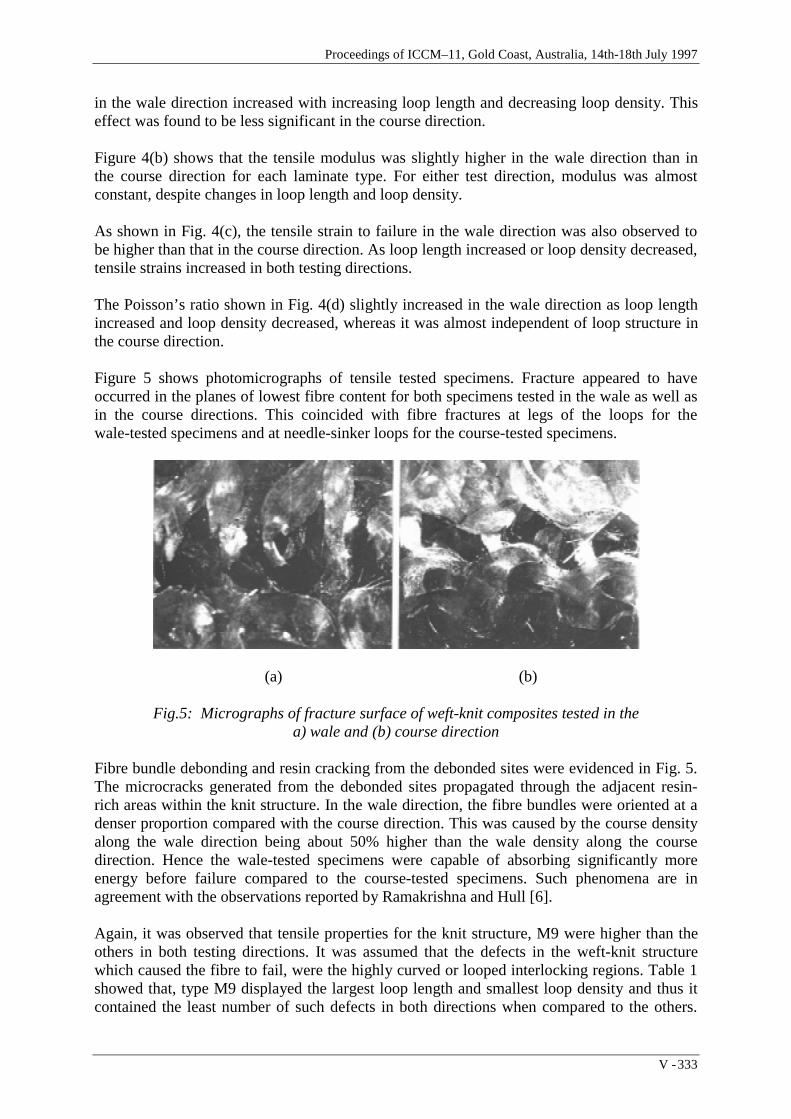
Proceedings of ICCM–11, Gold Coast, Australia, 14th-18th July 1997
V - 333
in the wale direction increased with increasing loop length and decreasing loop density. Thiseffect was found to be less significant in the course direction.
Figure 4(b) shows that the tensile modulus was slightly higher in the wale direction than inthe course direction for each laminate type. For either test direction, modulus was almostconstant, despite changes in loop length and loop density.
As shown in Fig. 4(c), the tensile strain to failure in the wale direction was also observed tobe higher than that in the course direction. As loop length increased or loop density decreased,tensile strains increased in both testing directions.
The Poisson’s ratio shown in Fig. 4(d) slightly increased in the wale direction as loop lengthincreased and loop density decreased, whereas it was almost independent of loop structure inthe course direction.
Figure 5 shows photomicrographs of tensile tested specimens. Fracture appeared to haveoccurred in the planes of lowest fibre content for both specimens tested in the wale as well asin the course directions. This coincided with fibre fractures at legs of the loops for thewale-tested specimens and at needle-sinker loops for the course-tested specimens.
(a) (b)
Fig.5: Micrographs of fracture surface of weft-knit composites tested in thea) wale and (b) course direction
Fibre bundle debonding and resin cracking from the debonded sites were evidenced in Fig. 5.The microcracks generated from the debonded sites propagated through the adjacent resin-rich areas within the knit structure. In the wale direction, the fibre bundles were oriented at adenser proportion compared with the course direction. This was caused by the course densityalong the wale direction being about 50% higher than the wale density along the coursedirection. Hence the wale-tested specimens were capable of absorbing significantly moreenergy before failure compared to the course-tested specimens. Such phenomena are inagreement with the observations reported by Ramakrishna and Hull [6].
Again, it was observed that tensile properties for the knit structure, M9 were higher than theothers in both testing directions. It was assumed that the defects in the weft-knit structurewhich caused the fibre to fail, were the highly curved or looped interlocking regions. Table 1showed that, type M9 displayed the largest loop length and smallest loop density and thus itcontained the least number of such defects in both directions when compared to the others.

Volume V: Textile Composites and Characterisation
V - 334
Therefore, type M9 proved to be the strongest among all the knit structures considered in thisstudy.
Compression Properties
Figure 6 shows the response of the weft-knit composite structures under compression. Thecurves were almost overlapping regardless of the test direction and the knee point occurred ata higher strain level of about 1.0%. Compression properties are summarised in Table 3.
0
40
80
120
160
200
0.000 0.005 0.010 0.015 0.020 0.025 0.030
Strain (mm/mm)
Com
pres
sive
Str
ess
(MP
a)
M9-C
M3-C
R3-CR3-WM3-W
M9-W
M1-C
M1-W
Fig. 6: Compression stress-strain curves of weft-knit composites
Table 3: Compression properties of weft knitted fabric-reinforced composites
TypeStrength(MPa)
Strengthratio
Compresive Modulus(MPa)
Strain to Failure(%)
W C W/C W C W CR3 162 159 1.02 10.5 9.82 2.10 2.50M3 169 163 1.04 11.9 9.65 2.00 2.50M1 160 156 1.03 10.0 11.4 1.80 1.70M9 180 181 0.99 12.0 11.3 1.90 2.20
Compression strengths, moduli and failure strains are shown in Fig. 7. Compressionproperties of weft-knit composite structures appeared to be almost independent of the knittingdirection and loop structure. It is proposed that under compression, knitted composites act asshort fibre reinforced composites, where the loop length is analogous to the short fibre length.The elastic-plastic analysis of short fibre composites by Agarwal and Broutman [11] suggeststhat, for the same applied load on the composite the stress within fibres will remainapproximately constant when the short fibre aspect ratio, l/d exceeds 25 (where l= fibre lengthand d=fibre diameter). In the present study of weft-knit structures under compression, theratio l/d ranges from 480 to 700. Since l/d >> 25, the stress supported by these fibres isdependent only on applied stress to composite, not on loop length. Hence knitted structureswith different loop lengths showed no significant variation in their compression properties.

Proceedings of ICCM–11, Gold Coast, Australia, 14th-18th July 1997
V - 335
0
25
50
75
100
125
150
175
200
Wale Course
Com
pres
sive
Str
ess
(MP
a)
R3
M3
M1
M9
(a)
Increasing loop length
Increasing loop density
0
2
4
6
8
10
12
14
Wale Course
Com
pres
sive
Mod
ulus
(G
Pa)
(b)
0.0
0.5
1.0
1.5
2.0
2.5
3.0
Wale Course(c)
Com
pres
sive
Str
ain
(%)
Fig. 7: Compression properties of weft-knit composites (a) strength,(b) elastic modulus, and (c) strain to failure
CONCLUSIONS
The weft-knit composite laminates tested were anisotropic in tensile strength and strain tofailure, but the elastic tensile modulus of these composites were similar in both the wale andthe course direction. In the wale direction, the fibre bundles were oriented at a denserproportion compared with the course direction. Hence the tensile properties in the waledirection were superior to the course direction.
Tensile strength and strain to failure were greatly affected by the loop length and loop density.With increasing loop length, the tensile strength and strain to failure increased, whereas loopdensity showed an inverse effect on these properties. The change was more predominant inthe wale direction than in the course direction. On the whole, the Milano rib structure seemedto be stronger than 1x1 rib structure.
The tensile Poisson’s ratio slightly increased in the wale direction with increasing loop lengthand decreasing loop density, whereas it was almost independent of loop structure in the coursedirection.
Volume V: Textile Composites and Characterisation
V - 336
Despite the influence of test direction, loop length and loop density on tensile properties, thecompression properties were seen to be almost unaffected by these parameters.
It was observed that tensile fracture occurred in the planes of lowest fibre content for bothspecimens tested in the wale as well as in the course directions. This coincided with fibrefractures at legs of the loops for the wale-tested specimens and at needle-sinker loops for thecouse-tested specimens.
ACKNOWLEDGEMENTS
The authors are grateful to S. Savçi and T. Sifniotis of the Department of Textile Technology,University of New South Wales for useful discussions and the supply of knitted fabrics andthe data outlined in Table 1. Thanks are also due to K. Houghton of CRC-ACS for assistancein test panel manufacture and specimen preparation, and to M. Wilson of Department ofAerospace Engineering, RMIT for assistance in conducting mechanical tests.
REFERENCES
1. Marvin, A. G., “The Development of Knitted Glass Fabrics for Use in Resin Lamination”,M.Sc. Thesis, University of Strathclyde, 1969.
2. Rudd, C.D, Owen, M. J. & Middleton, V.,“ Mechanical Properties of Weft Knit Glass
Fibre/Polyester Laminates”, Journal of Composites Science and Technology, Vol. 39,1990, pp. 261-277.
3. Verpoest, I.and Dendauw, J., “Mechanical Properties of Knitted Glass Fibre/Epoxy Resin
Laminates”, (Proc. Conf.) 37th International SAMPE Symposium, March 9-12, 1992, pp.369-377.
4. Chou, S., Chen, H.C. and Lai, C.C., “The Fatigue Properties of Weft-Knit Fabric
Reinforced Epoxy Resin Composites”, Journal of Composites Science and Technology,Vol. 45, 1992, pp. 283-291.
5. Wu, W.L., Kotaki, M. and Fujita, A.,“ Mechanical Properties of Warp- Knitted, Fabric-
Reinforced Composites”, Journal of Reinforced Plastics and Composites, Vol. 12, No.10, 1993, pp. 1096-1110.
6. Ramakrishna, S. and Hull, D.,“Tensile Behaviour of Knitted Carbon-Fibre-Fabric/Epoxy
Laminates-- Part I: Experimental”, Journal of Composites Science and Technology, Vol.50, No. 2, 1994, pp. 237-247.
7. Bannister, M.K and Herszberg, I.,“The Manufacture and Analysis of Composite
Structures from Knitted Preforms”, (Proc. Conf.) Fourth International Conference onAutomated Composites, September 6-7, 1995, Nottingham, U.K., Vol. 2, pp. 397-404.
Proceedings of ICCM–11, Gold Coast, Australia, 14th-18th July 1997
V - 337
8. Herszberg, I., Falzon, P.J., Leong, K.H. and Bannister, M.K., “Bearing Strength ofGlass/Epoxy Composites Manufactured from Weft-Knitted E-glass Fabric”, (Proc. Conf.)The First Australian Congress on Applied Mechanics, February 21-23, 1996, Melbourne,Australia, pp. 279-284.
9. Leong, K.H., Falzon, P.J., Bannister, M.K. and Herszberg, I.,“ An Investigation of the
Mechanical Performance of Weft-Knitted Milano Rib Glass/Epoxy Composites”,Submitted to Journal of Composites Science and Technology, 1996.
10. Leong, K.H., Nyugen, M. and Herszberg, I., “The Effect of Deformation of Glass Fibre
Knitted Fabrics on the Resultant Composite Tensile Properties”, To be presented at TheEleventh International Conference on Composite Materials, ICCM-11, Gold coast,Australia, July 14-18, 1997.
11. Agarwal, B.D. and Broutman, L.J., “Analysis and Performance of Fibre Composites”,
Second Edition, Chapter 4, Pages 122-128.

Volume V: Textile Composites and Characterisation
V - 338
WEFT-KNITTED GLASS-FIBRE PREFORMS FORCOMPOSITE MATERIALS
S. Savci and J.I. Curiskis
Department of Textile Technology, University of New South Wales, Sydney 2052, Australia
This work has been carried out as part of a CRC-ACS research programme.
SUMMARY: Weft knitted preforms have become increasingly popular in recent years for theprocessing of composite materials due to their low cost and exceptional mechanicalproperties. The main attributes of weft-knits for composite materials are their fatigue resistantproperties and their ability to conform to complex three-dimensional shapes, either by deepdrawing/moulding or by integral knitting techniques. The experimental work reported in thispaper examines various physical and mechanical properties of the dry preform with respect toknitting machine settings. The investigation of mechanical properties is directed towards theformability (drapability) of the dry preform in terms of KESF testing and a modified CBRplunger test method. The results demonstrate that both methods may provide useful designparameters of formability for subsequent composite processing.
KEYWORDS: weft-knitted preforms, formability, deep drawing, KESF testing.
INTRODUCTION
The use of textile technology, such as weaving and braiding, in the manufacture of preformsfor advanced composite materials has and continues to be under intense investigation due tothe potential of these processes to produce low-cost high-quality structures with improvedmechanical performance. In recent years, weft-knitted structures have become of increasinginterest due to their potential as crash/fatigue resistant materials and their ability to conform tocomplex three-dimensional shapes. The latter may be derived from deep drawing/mouldingtechniques utilising the formability properties of the flat preform or by integral knittingtechniques to manufacture the near net shape. In this paper, the term formability is preferredto drapability because, in the textile sense, the latter refers to the shape adopted by an initiallyflat fabric under the effects of gravity loading only rather than by drawing/mouldingprocesses. With integral knitting, the essential preform shape is actually manufactured on theknitting machine with added benefits of low material wastage and low labour costs [1],providing an appropriate machine type is available. While it may seem contradictory in viewof the three-dimensional nature of the knitted loop, weft-knitted preforms with inlayyarns/tows can also yield higher strength than that of woven fabrics because the inlay yarnsare essentially uncrimped [2].
Reports in the literature have generally been with respect to the mechanical properties ofcomposite test specimens and/or demonstrations of the shaping potential. The basicmechanical properties of weft-knitted composites have been extensively studied. The effect ofvolume fraction on the properties of weft-knitted composites has been of particular interest

Proceedings of ICCM–11, Gold Coast, Australia, 14th-18th July 1997
V - 339
[3]. Methods of increasing the fibre content and stiffness of knitted laminates, together withcomposite fracture mechanisms has also been studied [4]. Various weft-knitted compositestructures have been investigated with respect to stiffness and fatigue resistance [5] and, later,other structures were examined with respect to composite strength [6]. The effect of pre-stretch of the dry preform on composite properties has also been examined [7]. However,there have been no studies carried out on the properties of the dry preform and no formabilityconcepts have been developed for shaping. Yet it has been well established that weft knittingis an excellent candidate for forming complex shapes due to its formability properties. Theonly related area in which work has been undertaken is for woven fabrics [8].
Knowledge of the mechanical properties and formability of the dry preform is important forproviding a systematic engineering approach for weft-knitted preform design and manufactureand subsequent composite fabrication. Work to this end is currently being undertaken by theauthors, and progress is reported in this paper.
WEFT KNITTING BACKGROUND
In the textile industry, weft knitting is a well-established fabric-forming technology and alarge variety of structures can be manufactured depending upon machine type available [9].Such structures include simple plain knits, ribs, purls, interlocks and double-knit structures,such as full milano and punto-di-roma, as well as more complex designs in which surfaceeffects and/or colour are developed for apparel applications. For composite applications, thesimple and double-knit structures, together with the use of inlay, plating and integral knittingtechniques, are likely to be of greatest interest. Fundamental terms used to characterise suchweft-knitted structures include the following:
loop length, L (mm) = length of yarn to form one complete knitted stitch.average Lav, Lav(mm) = total length of yarn to form one repeat / no. of stitches in one
repeat.course density, c/cm = number of horizontal rows of loops per cm.wale density, w/cm = number of vertical columns of loops per cm.areal density, g/m2 = mass of fabric in grams / area of fabric in sqm.tightness factor, K =√tex / Lavrun-in-ratio, L1:L2 = ratio of loop lengths in one structural repeat.Tex, T = linear density in g/km
Available in the textile literature are many studies on the geometry and structural mechanicsof weft-knitted fabrics as well as the mechanics of fabric formation. They emphasise theimportance of loop length and run-in-ratio in the control of fabric dimensions and of otherbasic physical properties such as areal density. Such studies were initially carried out on plainfabrics [10] and later on double jersey constructions [11]. Further, these properties aredependent upon the existence of various relaxation states for the fabric due to such factors asthe visco-elastic nature of most textile fibres, the effects of inter-fibre friction and thesubsequent finishing treatments that may be applied to the fabric. Investigations into themechanics of weft knitting have shown that the variables of most importance in controllingloop length are the stitch cam setting, the input tension setting, the fabric take-down tension,and the yarn-metal friction [12]. The development of weft-knitted preforms composed ofhigh performance fibres must therefore recognise this pre-existing knowledge. Theknittability of high performance yarns has been shown to be dependent upon the frictional

Volume V: Textile Composites and Characterisation
V - 340
properties, pliability and strength of the yarn [13]. Glass fibres are very brittle in nature, havehigh stiffness and high coefficient of friction, and consequently require a low input tension,tension control and minimal metal surface contact for knitting.
EXPERIMENTAL PROCEDURE
A range of full milano rib structures together with their plain knit and 1x1 rib components(see Figure 1) were manufactured on an 8-gauge (E8) Stoll ANVH/BLM-es knitting machine- this is a computer-controlled rib-jacquard V-bed machine which uses the Sintralprogramming language.
Figure 1: a) Full Milano b) 1x1 Rib, c) plain tubular jersey nomenclature
These structures were produced with 68 x 2 tex glass fibre tows with silane size from SilenkaGlass Yarns. Yarn input tension and fabric take-down tension were set at minimal valuesconsistent with good knitting performance. In addition, the yarn feed path was linearised andmetal contact surfaces polished to reduce the effects of abrasion on the glass fibres. Differentvalues of stitch cam settings were set to produce different loop lengths within the preformstructures. All preforms were allowed to relax under standard ambient conditions of 25oC,65% relative humidity for a minimum of 24 hours prior to testing. Sampling was carried outin accordance with the Australian standard for testing and then quantified in terms of theirloop lengths, areal density, wale and course densities, thickness [14] and tightness factor.These physical tests were followed by mechanical testing on the Kawabata Evaluation Systemfor Fabrics (KES-FB) instrumentation, which was initially developed for fabric objectivemeasurement in the textile and clothing industries, and a simple formability test based on theCBR burst test for geotextiles.
Figure 2: Schematic representation of KES-FB instrumentation
The four fabric mechanical properties assessed using the KES-FB instrumentation are in-plane tension, in-plane shear, transverse compression and out of plane bending as shown inFigure 2. These instruments are designed to take measurements at low stress levels whilstproviding data on a wide range of parameters including deformation and recovery for eachmechanical property obtained [15]. The operating procedure for the KESF instrumentation isgiven elsewhere [16]. Figure 3 gives a typical representation of the deformation/recovery

Proceedings of ICCM–11, Gold Coast, Australia, 14th-18th July 1997
V - 341
curves for a fabric subjected to extension or lateral compression and bending or shear inKESF testing.
Figure 3: a) in-plane tension and transverse compression, b) in-plane shear and out-of planebending
The important features of the curves are that they are non-linear and exhibit hysteresis; thelatter implies that energy is lost during the deformation cycle. The hysteresis is shown by theshaded areas in the graphs and is due to inter-fibre friction effects and the visco-elasticbehaviour of the fibres [15]. In the textile and clothing industries, the following standardparameters have been defined from these curves [16]:
tensile LT tensile linearity WT/area Q1Q2Q3 %WT tensile energy area Q1 A Q2Q3 J/m2
RT tensile resilience area Q1 B Q2Q3 /WT %EMT tensile extensibility Q3 %
shear G shear rigidity slope Rig Nm/m2
2HG hysteresis of shear force at 0.5° width of Hys N/m2HG5 hysteresis of shear force at 5° width of Hys N/m
bending B bending rigidity slope Rig µNm2HB hysteresis of bending moment width of Hys µNm
compression LC compressional linearity WC/area Q1Q2Q3 %WC compressional energy area Q1 A Q2Q3 J/m2
RC compressional resilience area Q1 B Q2Q3 /WC %EMC compressibility Q3 %
The simple formability test was based on the CBR burst strength test for geotextiles [17]. Inthis test, a cylindrical plunger is forced through the centre of a circular specimen which isgripped around its entire circumference by clamps in a loading frame; Figure 4 illustrates theplunger and clamping arrangements. The plunger displacement and reactive force arerecorded. In the present case, the plunger is taken to a maximum displacement of 50 mmrather than to specimen failure (burst); the plunger displacement speed was set to 20mm/min.
Hys
Rig
A
Q2
Q1
Q3B

Volume V: Textile Composites and Characterisation
V - 342
specimen φ = 195mmclamp ringstogether withM10 bolts 60mmlong with M10nuts 8mm off
UPPER AND LOWER CLAMP RINGS WITHTHE SECIMEN
Figure 4. Plunger and clamping arrangement for the CBR test
RESULTS AND DISCUSSION
The results of the physical property tests are given in Table 1where Lr and Lp refer to thestitch cam settings on the knitting machine for the rib courses and the plain knit courses,respectively. From these tables, it is clear that larger loop lengths result from increasing thestitch cam settings for all three knit structure types, although the run-in-ratio decreases for themilano structures. Further, the increase in loop length(s) yields reductions in areal density,tightness factor, and wale and course densities. In the case of thickness, however, the effect isdependent upon knit structure as the loop length is increased, with thickness decreasing forthe milano fabrics and increasing for the plain knit and rib fabrics.
Table 1 Preform physical properties
PREFORM M3 M61 M9 R3 R6 R9 P61 P9g/sqm 670 601 434 742 607 504 396 290Lr (mm) 6.6 7.3 8.7 6.6 7.6 9.2 N/A N/ALp (mm) 5.8 6.7 9 N/A N/A N/A 6.6 8.92Lr:Lp 2.28 2.17 1.93 N/A N/A N/A N/A N/ALav 6.1 6.9 8.9 N/A N/A N/A N/A N/AC/cm 8.9 8.2 6.5 9.9 7.8 6.9 8.3 6.6W/cm 4.45 3.65 2.65 4.25 3.6 2.9 4.8 3.3Thickness (mm) 2.35 2.19 1.98 2.04 2.30 2.59 1.14 1.35K 1.92 1.64 1.27 1.77 1.53 1.27 1.77 1.31Lr (setting) 8.1 9.5 11 8.1 9.5 11 N/A N/ALp (setting) 10.1 11 13 N/A N/A N/A 11 13
The results were not only informative of the preforms’ physical properties but also providedan insight into the interaction between machine, yarn/tow and the structure being knitted. Themilano fabric M3 is at the limits of the knitting capabilities of the machine, ie. milano fabriccould not be knitted at smaller stitch cam settings due to excessive yarn/tow breaks, droppedstitches and knitting needle damage. The results for eight additional milano fabrics (notreported here) emphasise this knittability limit in terms of stitch cam settings. Although thislimit was not directly explored for the plain knit and rib structures, it is notable that the plainknit structure P3 could not be knitted even though its component in the milano M3 wassuccessfully manufactured at the low stitch cam setting, Lp=10.1. Further, while the results inTable1 indicate a general correlation between the various physical parameters of the milano
PLUNGERR2.5
70mm
50mm
184mm
6mm

Proceedings of ICCM–11, Gold Coast, Australia, 14th-18th July 1997
V - 343
structures and their plain knit and rib components, it is notable that the rib loop lengths differbetween the rib and milano structures at the higher stitch cam settings. These phenomena canbe explained with reference to the “robbing back theory” [12] which states that the looplength achieved is dependent on the maximum tension developed in the knitting zoneassociated with the stitch cam. This maximum tension is essentially constant (allowing forstatistical variabilities) when knitting simple structures such as plain knit and 1x1 rib. In thecase of full milano rib, the maximum tension alternates from the value of the plain loopcomponents for two courses to that of the rib loop components for one course. In addition, theunstable nature of the plain knit fabrics required a higher take-up tension to overcome theunbalanced internal forces inherent to these structures. This higher take-up tension wouldincrease the maximum tension within the knitting zone and yield higher loop lengths. In fact,this principle also accounts for the plain loop lengths being slightly smaller in the plain knitand the rib loop lengths being slightly larger in the 1x1 rib as compared to the correspondingcomponent values in the milano fabrics.
The results of the KES-FB tests are summarised in Figs 5-14 for three milano structures. It isto be noted that the hysteresis (energy loss) for all mechanical properties was substantiallyhigher than for most apparel fabrics (approximately 10-fold). It is highly probable that thesehysteresis losses are due to inter-fibre friction as the fibres are essentially elastic. Further, thefabrics display some permanent deformation upon removal of load. This is emphasised inFig. 15 which presents the results of a number of tensile cycles on one specimen.
LC
RC
0
5
10
15
20
25
30
1.2 1.4 1.6 1.8 2
Tightness factor
WC
0.00
0.20
0.40
0.60
0.80
1.00
1.20
1.2 1.4 1.6 1.8 2
Tightness factor
Figure 5: Compression linearity & resilience Figure 6: Compressional energy
w ale
0
10
20
30
40
50
60
70
1.2 1.4 1.6 1.8 2
Tightness factor
course
w ale
0
50
100
150
200
250
300
1.2 1.4 1.6 1.8 2
Tightness factor
course
Figure 7: Bending rigidity Figure 8: Hysteresis of bending moment

Volume V: Textile Composites and Characterisation
V - 344
w ale
0
50
100
150
200
250
300
1.2 1.4 1.6 1.8 2
Tightness factor
course 2HG5:w
2HG5:c
2HG:w2HG:c
0
5
10
15
20
25
1.2 1.4 1.6 1.8 2
Tightness Factor
Figure 9: Shear rigidity Figure 10: Shear hysteresis
RT:w
LT:c
RT:c
LT:w
010
2030
4050
60
1.2 1.4 1.6 1.8 2Tightness Factor
w ale
05
10
15202530
354045
1.2 1.4 1.6 1.8 2
Tightness factor
course
Figure 11: Tensile linearity and resilience Figure 12: Tensile energy
w ale
0
10
20
30
40
50
1.2 1.4 1.6 1.8 2
Tightness factor
course
EMC
0
5
10
15
20
25
30
35
1.2 1.4 1.6 1.8 2
Tightness factor
Figure 13: Tensile extensibility Figure 14: Compressibility
Figure 15: Tension deformation/recovery curve Figure 16: Helicopter door track pocket composite
0 10 20 3040
300
100
200
400
500F(gfpercm)

Proceedings of ICCM–11, Gold Coast, Australia, 14th-18th July 1997
V - 345
In general, increasing the tightness of the fabric results in hysteresis and rigidity increases forthe shear and bending properties. In the case of tensile and compressional behaviour, thehysteresis energy can be determined from the following relation,
hysteresis energy loss = Wx (1-Rx) where x = T(tensile), C(compression).
Thus, compressional hysteresis also increases as the fabric tightness is increased and this isaccompanied by a decrease in the compressional strain due to the increased quantity of fibreopposing the deformation. In the case of the tensile tests, increasing fabric tightness tends todecrease the load extension curve, with the middle tightness fabric showing a maximum intensile linearity and resilience, and energy and hysteresis in the course direction, together witha minimum in tensile extensibility, and energy and hysteresis in the wale direction. Furtherwork is currently being undertaken to examine these effects in terms of run-in-ratio as well asfabric tightness.
Fig. 16 illustrates a composite part of complex shape produced by deep-drawing a glass fibremilano preform with subsequent matrix impregnation by resin transfer moulding (RTM).Examination of fabric distortions in the final composite emphasise complex strain fieldsexhibiting high fabric shear and in-plane extensibility, together with areas of high curvature.Laboratory simulation of the deep-drawing process can be undertaken using formability testssuch as that previously described.
milano
rib
plain
0
0.1
0.2
0.3
0.4
0.5
0.6
0.7
0.8
1.2 1.4 1.6 1.8 2Tightness Factor
Energy
(J) M9
M61
M3
0
20
4060
80
100
120
0 20 40 60Displacement (mm)
Figure 17: Milano: Formability/energy Figure 18 Milano: Formability/displacement
P9
P61
0
20
40
60
80
0 20 40 60
Displacement (mm)
R3
R61
R9
02468
101214
0 20 40 60
Displacement (mm)
Figure 19: Plain: Formability/displacement Figure 20: Rib: Formability/displacement

Volume V: Textile Composites and Characterisation
V - 346
The results of these tests are shown in Figs 17-20 for the three milano structures and their riband plain knit components. With increasing tightness factor, the total energy yieldedincreases as does the slope of the load-displacement curves for all fabric structures tested.This is consistent with the above results for physical and mechanical behaviour. Interestingly,the results also suggest that the plain knit components are the dominating factor fordetermining resistance to load for the milano structures.
CONCLUSION
The results reported in this paper demonstrate that there is a definite interplay between thephysical properties of weft-knitted preforms and knitting machine settings through study ofthe working limits of the loop length dimensions together with replications of these settings indifferent structures.
The mechanical properties derived from the KESF testing are useful for determining theengineering formability of knit structures for subsequent composite processing. However, alltensile, shear, bending and compressive properties complement one another for this purpose.The simpler design parameters for assessing the formability offered by the modified CBRplunger test method require further investigation. Such work is in progress.
ACKNOWLEDGMENTS
The first author (SS) would like to thank the Corporate Research Centre for AdvancedComposite Structures (CRC-ACS) for the provision of a post graduate scholarship and fortheir financial support of this research. Useful discussions with Drs K.H. Leong and M.K.Bannister of the CRC-ACS and Assoc. Prof. I. Herszberg of RMIT University are alsogratefully acknowledged.
REFERENCES
1. Raz S., “Flat Knitting: the New Generation”, Bamberg, Meisenbach, 1991. 2. Marvin A.W., “Combined Weft-Knitted-Woven Fabrics”, Proc. Diamond Jubilee Conf. of
the Textile Institute: Studies in Modern Fabrics, London, 1970, pp 40-45. 3. Verpoest I. and Dendauw J., “Mechanical Properties of Knitted Glass Fibre/Epoxy Resin
Laminates” 37th International SAMPE Symposium, March 9-12, 1992. 4. Ramakrishna S. and Hull D., “Tensile Behaviour of Knitted Carbon-Fibre-Fabric/Epoxy
Laminates: Parts I & II”, Composites Science and Technology, vol 50, 1994, pp 237-258. 5. Chou S., Chen H.C. and Lai C.C. “The Fatigue Properties of Weft-Knit Fabric Reinforced
Epoxy Resin Composites”, Composite Science and Technology, vol 45, 1992 pp 283-291. 6. Wu W.L., Inoda M., Kotaki M., Goto A., Fujita A., Hamada H. and Maekawa Z.I.,
“Mechanical Properties of Weft Knitted Reinforced Composites” Journal of the JapanSociety for Composite Materials, vol 19, no 5, 1993, pp 17-26.

Proceedings of ICCM–11, Gold Coast, Australia, 14th-18th July 1997
V - 347
7. Ha S.W., Mayer J., Haan D.E., Petitmermet M. and Wintermantel E, “Knitted Carbon
Fibres Reinforced Biocompatible Thermoplastics, Mechanical Properties and StructureModelling”, 6th European Conference on Composite Materials, Sept 20-24, France, 1993,pp 637-642.
8. Cai Z., Yu J.Z. and Ko F.K. “Formability of Textile preforms for Composite Processing:
Parts 1 and 2” Composites Manufacturing, vol 5, no.2, Butterworth - Heinmann Ltd.,Oxford, 1994.
9. Spencer D., “Knitting Technology”, 2nd edition, Permagon Press, Oxford, 1989. 10. Hearle J.W.S., Grosberg P. and Backer S., “Structural Mechanics of Fibres, Yarns and
Fabrics”, vol 1, John Wiley and Sons Inc, New York, 1969. 11. Knapton J.J.F, “Knitting High Quality Double Jersey Cloth: Parts I & II”, Textile Institute
and Industry, Feb. & March, 1972. 12. Knapton J.J.F. and Munden D.L., “A Study of the Mechanism of Loop Formation on
Weft -Knitting Machinery: Parts I & II”, Textile Research Journal , vol 36, 1966, pp1072-1091.
13. Lau K.W. and Dias T., “Knittability of High Modulus Yarns”, Journal of the Textile
Institute, vol 85, no. 2, 1994, pp 173-91. 14. AS200.1.2.15., “Method 2.15 Physical tests - Determination of Thickness of Textile
Fabrics”, Methods of Test for Textiles, Standards Australia, 1989. 15. Harlock S.C., “Fabric Objective Measurement: Principles of Measurement”, Textile Asia,
July, 1989, pp 4-8. 16. Kato Tekko Co. Ltd., “KES-FB-1, KES-FB-2, KES-FB-3: Manual for Pure Bending
Tester, Tensile and Shear Tester, Compression Tester”, Kyoto, 1991. 17. AS30706.4., “Method 4: Determination of Burst Strength - California Bearing Ratio
Plunger Method”, Geotextiles - Methods of Test, Standards Australia, 1990.

Volume V: Textile Composites and Characterisation
V - 348
FABRICATION OF LARGE SCALE BRAIDEDCOMPOSITE WITH I-SHAPED STRUCTURE
Asami Nakai, Mikio Masui and Hiroyuki Hamada
Faculty of Textile Science, Kyoto Institute of TechnologyMatsugasaki, Sakyo-ku, Kyoto 606, Japan
SUMMARY: In these days, it is expected that textile preforms are applied to large scalecomposite structure since they have good stability and drapability. In this paper, the methodto fabricate large braided composite was proposed. Firstly the width of braided fabric when atype and a number of fiber bundle was changed was measured. As the result, it was evidentthat the width of braided fabric was narrow and huge braiding machine with large number ofspindles is necessary to fabricate large braided fabric. In this study the method which linkbraided fabric transversely with kited technique was introduced to fabricate a large braidedfabric without using a huge braided machine. Using this knitted technique, braided fabricscan be linked without injuring reinforcements. Tensile test of linked braided fabric wascarried out and it was evident that fabricating large braided composite without decreasingstrength was possible using this link method.
KEYWORDS : CAE, braid, large composite structure, link, knitted technique, loop stitch,tensile test, I-beam
INTRODUCTION
The properties of fiber reinforced plastic (FRP) are decided not only by the combination ofmatrix and reinforcing materials but also by the unique geometry of the reinforcements. Thegeometry of the reinforcements has been investigated in addition to development of fiber andresin. Composite materials reinforced with fabric preforms made by either woven, braided orknitted fabrics are currently being considered as alternatives to tape laminates. "Textile"composites can be defined as composite materials reinforced with textile fabrics such aswoven, knitted and braided fabrics. Manufacturing process for textile composites could alsobe automated, so it could potentially lead to lower costs. In textile forming technique notonly two-dimensional plate shape but also thick or three-dimensional shape can be fabricated.These textile preforms can be applied in structural composites with complex shapes, sincethey have good stability and drapability, and can be fabricated directly to their final shapes.Such fabric reinforced textile composites have potential for improved out-of-plane stiffness,strength, delamination resistance and toughness properties. It has been expected that textilecomposites are used widely as structural parts in various fields from these reasons.
There are many published papers related to textile composites. They are divided into threecategories; one is designing a new fabric that includes three dimensional weaving fabric, 2.5dimensional warp knitted fabric and so on. The second one is developing a new machine thatcan correspond to the new fabrics. The third one is mechanical properties of textilecomposites such as static properties and impact properties. In this category numerical

Proceedings of ICCM–11, Gold Coast, Australia, 14th-18th July 1997
V - 349
modeling of textile composites is included. According to these classifications we havedeveloped CAE system for braided composites as shown in Fig.1.
Fig. 1: CAE system for braided composites
In braided composites there are two basic fabrics; cord braiding and flat braiding.Determination of dimension of these fabrics such as width and thickness are very difficultproblem because they greatly depend on not only fiber characteristics such as type of fibers,number of filaments, diameter of filaments but also weaving structure as fiber orientationangle, density of weaving structure and so on. Therefore designing the fabrics is needed asshown in flow chart of CAE system, and detail of this problem would be mentioned in thelatter section. Another particular problem in the braided composites is that one machine canfabricate a specific braided fabric when materials type is fixed. The machine with largenumber of spindles can fabricate large braided fabric, however this large machine can notfabricate small braided fabric in proper fiber orientation state. Of course, small machine cannot make large fabric. That means applicable ability of braiding is very small in terms ofmachine. According these circumstances in order to expand application field of braidedcomposites wider an attempt that is fabricating large braided structure by using small machinewas made in this study. Concretely, large braided composite with I-shaped structure wasfabricated by using existing braiding machine in braiding technique and linking machine inknitting technique. First width of flat braided fabrics was examined by changing fiber types.After our basic concept of fabricating large braided structure was mentioned, someexperimental results were described. Here it was clear that proposed linking method was veryeffective. Finally large I beam was appeared.
Dimension of Braided Fabric
In this section the width of flat braided fabrics using some kinds of fiber bundles wasmeasured. The schematic of flat braided fabric is shown in Fig.2. Flat braided fabric has two

Volume V: Textile Composites and Characterisation
V - 350
dimensional shape like a belt. The fiber bundles are continuously oriented in this fabricbecause they reverse themselves at the side edge. Therefore, when tensile load applies to flatbraided fabric, all the fibers bare the load, so that it can become a string. The fibers willchange their orientation angles smaller and then the width will become narrow. This point isthe most important point for braided fabric. Changing orientation angle leads to changingfabric width. Moreover there are many different weaving structures. The surface of braidedfabric shows a zig-zag pattern since the fiber bundles alternately pass over and under eachother. Fig.3 shows repeating pattern in braided fabric, and (a) is Diamond braid where a fiberbundle continuously passes over one fiber bundle and then under one fiber bundle of theopposing group. Whereas Fig.3(b) shows Regular braid in which one fiber bundle passes twofiber bundles. The width of flat braided fabric depends on these braided patterns greatly.
Fig. 2: Schematic of flat braided fabric
(a) Diamond braid (b) Regular braid
Fig. 3: Braided pattern
Fiber bundles used in this experiment were glass fiber bundles with 2000 filaments and 900filaments. The diameter of a filament 17.0µ m. For Diamond braid the machine with 43spindles was used and for Regular braid the machine with 85 spindles was used. Also, twodifferent loading conditions were selected for changing fiber orientation angle; one was lightweight and the other was heavy weight. Table 1 shows measurement results of width in eachcase. According to these results the widths in the cases of heavy weight are smaller thanthose in the case of light weight. The maximum value was 82.0mm and this was a limitationby using these material systems and machines.
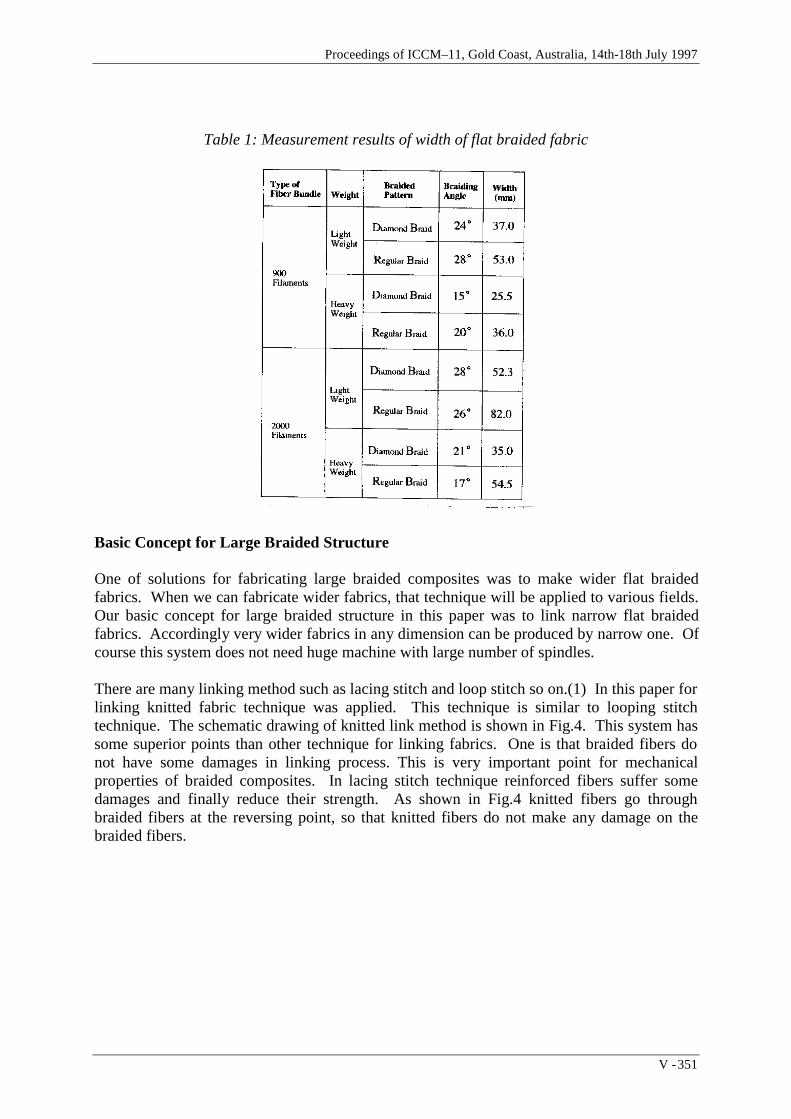
Proceedings of ICCM–11, Gold Coast, Australia, 14th-18th July 1997
V - 351
Table 1: Measurement results of width of flat braided fabric
Basic Concept for Large Braided Structure
One of solutions for fabricating large braided composites was to make wider flat braidedfabrics. When we can fabricate wider fabrics, that technique will be applied to various fields.Our basic concept for large braided structure in this paper was to link narrow flat braidedfabrics. Accordingly very wider fabrics in any dimension can be produced by narrow one. Ofcourse this system does not need huge machine with large number of spindles.
There are many linking method such as lacing stitch and loop stitch so on.(1) In this paper forlinking knitted fabric technique was applied. This technique is similar to looping stitchtechnique. The schematic drawing of knitted link method is shown in Fig.4. This system hassome superior points than other technique for linking fabrics. One is that braided fibers donot have some damages in linking process. This is very important point for mechanicalproperties of braided composites. In lacing stitch technique reinforced fibers suffer somedamages and finally reduce their strength. As shown in Fig.4 knitted fibers go throughbraided fibers at the reversing point, so that knitted fibers do not make any damage on thebraided fibers.

Volume V: Textile Composites and Characterisation
V - 352
Fig. 4: Schematic drawing of knitted link method
Experiments
Fibers used in the experiments was glass fiber bundles with 2000 filaments and flat braidedfabric was fabricated by the machine with 85 spindles. Fiber orientation angle to longitudinaldirection was 38 degree. Linking was made by using dial linking machine as shown in Fig.5.This machine is a commercial available machine and is not special machine for linking. Inthis experiment aramid fiber was used for linking fibers. Three different linking methodswere adopted as shown in Fig. 6; one was L shaped linking (L type) and the second one wassingle lap type link (S type), finally the third method was multi linked method (M type).(2) Inthese developed linking methods linking fibers do not make any damage on the braided fibers.After linking two flat braided fabrics, resin was impregnated into the fabrics and cured. Thelinked part was seemed to be the weakest part in the large braided structure. Therefore inorder to the effects of linking part on the composite properties tensile tests were performed.For comparison, transverse strength of flat braided composites was also measured.Dimensions of specimens are 30 mm of width , 80 mm of gauge length and 1.6 mm ofthickness.
Fig. 5: Dial knitted machine
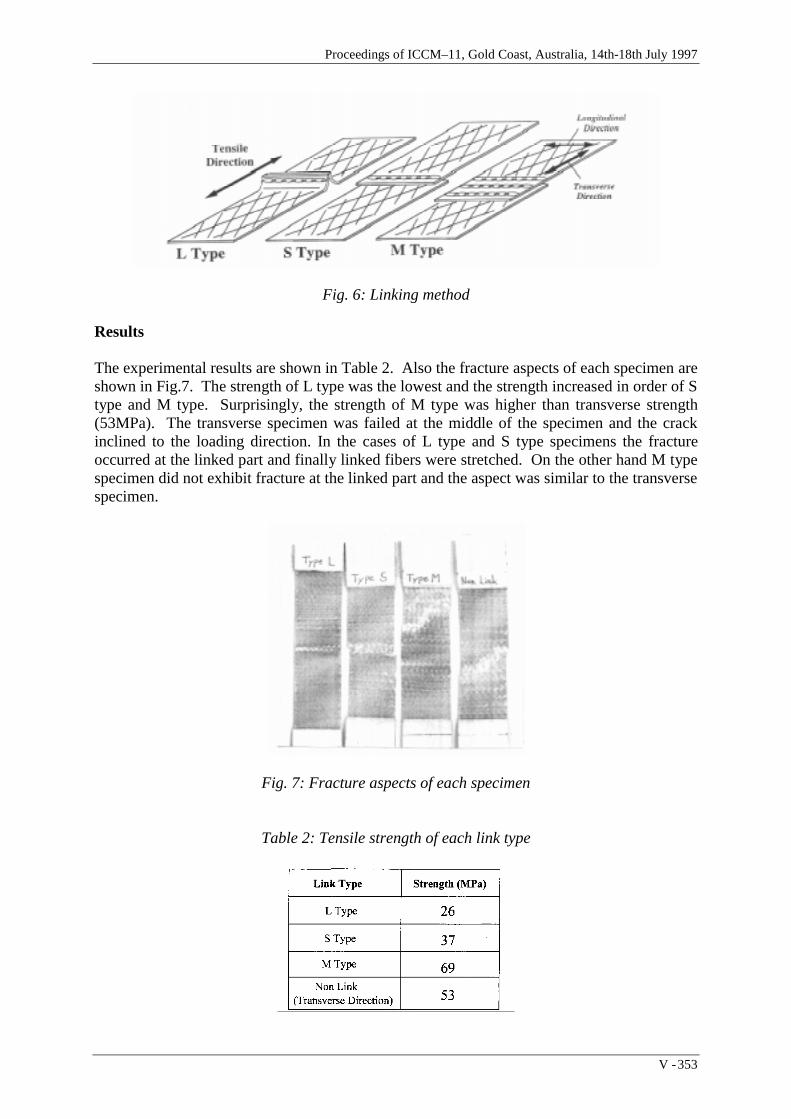
Proceedings of ICCM–11, Gold Coast, Australia, 14th-18th July 1997
V - 353
Fig. 6: Linking method
Results
The experimental results are shown in Table 2. Also the fracture aspects of each specimen areshown in Fig.7. The strength of L type was the lowest and the strength increased in order of Stype and M type. Surprisingly, the strength of M type was higher than transverse strength(53MPa). The transverse specimen was failed at the middle of the specimen and the crackinclined to the loading direction. In the cases of L type and S type specimens the fractureoccurred at the linked part and finally linked fibers were stretched. On the other hand M typespecimen did not exhibit fracture at the linked part and the aspect was similar to the transversespecimen.
Fig. 7: Fracture aspects of each specimen
Table 2: Tensile strength of each link type

Volume V: Textile Composites and Characterisation
V - 354
According to detail observation of fiber orientation state in these specimens, there were twopossible explanations for the strength differences between transverse specimen and M typespecimen. The transverse specimen was cut out from the center on flat braided fabrics,whereas the linked specimens were from the edge of the fabrics. Fig. 8 shows the schematicdrawings of fiber orientation state in flat braided fabric. Normally fiber orientation states aredivided into three regions; both side edge regions and the center region. Fiber orientationangle in each region is different. At the center both fiber bundles which across each otherhave same angle and at the side edge one group have low angle and the other has large angleto the loading direction (transverse direction). In the linked specimen there are some fibersoriented at small angle to loading direction, so that there was possibility that the strength ofthe M type specimen was higher than that of transverse specimens. Also in the transversespecimen the fibers were cut at the edge, whereas in the M type specimen the fiberscontinuously oriented through linking fibers between tabs. This state was similar to thespecimen to longitudinal specimen in which reinforcing fibers orient through out thespecimen from one end to the other end. This result was one of possible reason for thestrength differences. Consequently, M type linked method was very useful for fabricatinglarge scale braided structure without decrease the strength.
Fig. 8: Fiber orientation state in flat braided fabric
Large Scale I beam Braided Structure
In the I-shaped beam, connecting part between flange part and web part is the weakest point,so that our basic concept for braiding, that fiber continuously oriented throughout theproducts, is applied to the connecting part in our product. According to our previous paper theI beam posses higher bending strength than aluminum. For fabricating large scale I beam, T-shaped braided fabric and flat braided fabric were linked together. At the connecting partbetween flange part and web part T-shaped braided fabric was used, so that the fiber bundleoriented continuously from flange part to web part as shown in Fig. 9. Our final product of Ibeam at the moment was shown in Fig. 10 in which the thickness was 3 mm, the height was400 mm and width of flange was 400 mm. Further mechanical properties of these large scaleproducts were measured.

Proceedings of ICCM–11, Gold Coast, Australia, 14th-18th July 1997
V - 355
Fig. 9: Structure of large scale I beam
Fig. 10: Final product of large scale I beam
CONCLUSION
In this paper a method which can fabricate large scale braided structure was presented.Knitting technology was applied for linking narrow flat braided fabrics, and three kinds oflinking methods were proposed. M type linking provided higher strength than normal braidedfabrics. According to proposed method a big lack of braided composites could be solved, sothat it was believed that further usage of braided composites would be expanded.
REFERENCES
1. Handbook of Composite Materials, Japan Society for Composite Materials Edition, Nikkan Ko-gyo Sinbunsha Ltd., pp.197 (1989)
2. M. Y. Tsai and J. Morton, "The effect of a spew fillet on adhesive stress distributions in laminated composite single-lap joints", Composite Structures , 32, (1995), pp.123-131.
Volume V: Textile Composites and Characterisation
V - 356
MECHANICAL MODEL OF 3-DIMENSIONALMULTI-STEP BRAIDED COMPOSITES
Joon-Hyung Byun
Composite Materials Lab, Korea Institute of Machinery & MaterialsSangnam-Dong, Changwon, Korea.
SUMMARY: The mechanical model of 8-step braided composites has been proposed formore comprehensive understanding of three-dimensional (3-D) textile composites. Theanalysis includes the geometric model of unit cells, microstructural characteristics (i.e., yarnorientation and fiber volume fraction), and prediction of elastic constants of the composites.The coordinate transformation and the averaging of stiffness and compliance constants areutilized in the prediction of elastic constants. Since nine types of unit cells are identified in thethickness and width directions of 8-step braided composites, characterization of mechanicalproperties is based upon the macro-cell, which occupies the entire cross-section and the unitpitch length of the sample. Relatively good correlation has been observed between the modelprediction and the test results of the carbon/epoxy composite samples.
KEYWORDS: 8-step braiding, unit cell, coordinate transformation, macro-cell, averagestiffness, compliance, elastic constants
INTRODUCTION
Recent development of textile preforming technology has significantly expanded the potentialof three-dimensional (3-D) textile composites in various applications. Among several types of3-D reinforcements the braided preforms have gained considerable attention due to thepossibility of near-net shaping [1,2]. However, the application of 3-D rectangular braidedcomposites has some limitations due to the slow fabrication speed and cross-sectional size.There have been a lot of efforts to overcome the limitation of 3-D braiding. An automated 2-step braiding machine has been developed to increase the preforming speed [3], and theconcept of multi-step braiding has been proposed to broaden the range of attainable braidarchitecture [4]. Kostar and Chou [4] has demonstrated that the multi-step braiding canproduce 2-step, 4-step and 8-step braids.
By utilizing the concept of the multi-step braiding, the possibility of the microstructuraldesign of 3-D braided composites can be enlarged. The 2-step and 4-step braids have been thesubjects of extensive studies [5-8] due to their unique microstructure and performancecharacteristics. Although axial yarns can be inserted into a 4-step braid, the amount of axialyarn volume is less than that could be achieved in 2-step braids. Thus, the longitudinal elasticstiffness of 4-step braided composites is lower than that of 2-step braided composites but, 4-step braids are more conformable to a curved shape. The geometric pattern of 8-step braids isclose to that of 4-step braids, resulting in the similar characteristics for the compositesperformance. The advantage of 8-step braid is that the structure is more integrated that the 4-
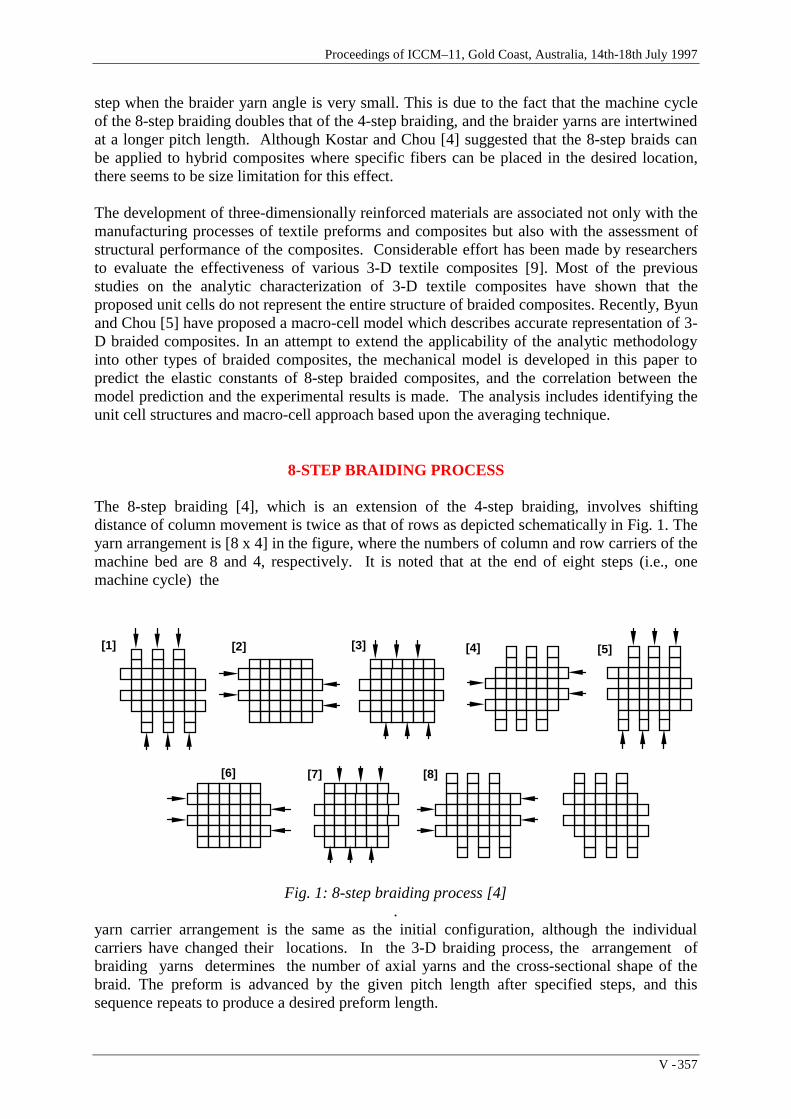
Proceedings of ICCM–11, Gold Coast, Australia, 14th-18th July 1997
V - 357
step when the braider yarn angle is very small. This is due to the fact that the machine cycleof the 8-step braiding doubles that of the 4-step braiding, and the braider yarns are intertwinedat a longer pitch length. Although Kostar and Chou [4] suggested that the 8-step braids canbe applied to hybrid composites where specific fibers can be placed in the desired location,there seems to be size limitation for this effect.
The development of three-dimensionally reinforced materials are associated not only with themanufacturing processes of textile preforms and composites but also with the assessment ofstructural performance of the composites. Considerable effort has been made by researchersto evaluate the effectiveness of various 3-D textile composites [9]. Most of the previousstudies on the analytic characterization of 3-D textile composites have shown that theproposed unit cells do not represent the entire structure of braided composites. Recently, Byunand Chou [5] have proposed a macro-cell model which describes accurate representation of 3-D braided composites. In an attempt to extend the applicability of the analytic methodologyinto other types of braided composites, the mechanical model is developed in this paper topredict the elastic constants of 8-step braided composites, and the correlation between themodel prediction and the experimental results is made. The analysis includes identifying theunit cell structures and macro-cell approach based upon the averaging technique.
8-STEP BRAIDING PROCESS
The 8-step braiding [4], which is an extension of the 4-step braiding, involves shiftingdistance of column movement is twice as that of rows as depicted schematically in Fig. 1. Theyarn arrangement is [8 x 4] in the figure, where the numbers of column and row carriers of themachine bed are 8 and 4, respectively. It is noted that at the end of eight steps (i.e., onemachine cycle) the
[1] [2] [3] [4] [5]
[6] [7] [8]
Fig. 1: 8-step braiding process [4].
yarn carrier arrangement is the same as the initial configuration, although the individualcarriers have changed their locations. In the 3-D braiding process, the arrangement ofbraiding yarns determines the number of axial yarns and the cross-sectional shape of thebraid. The preform is advanced by the given pitch length after specified steps, and thissequence repeats to produce a desired preform length.
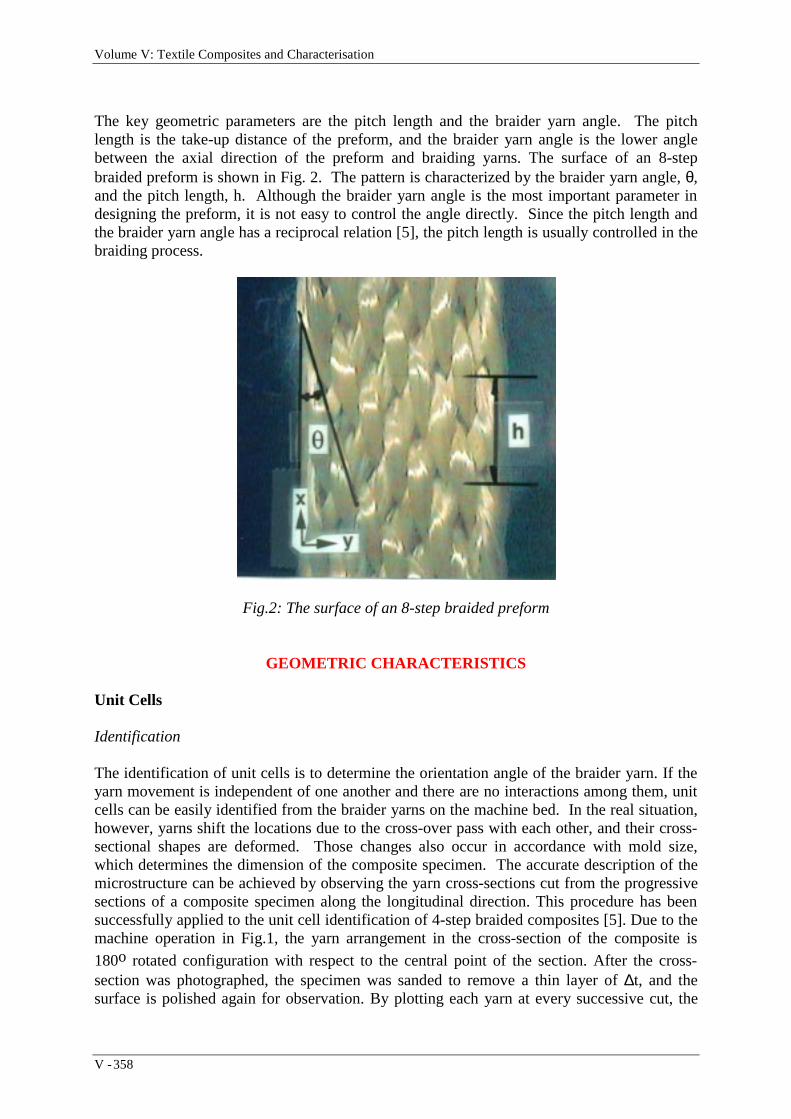
Volume V: Textile Composites and Characterisation
V - 358
The key geometric parameters are the pitch length and the braider yarn angle. The pitchlength is the take-up distance of the preform, and the braider yarn angle is the lower anglebetween the axial direction of the preform and braiding yarns. The surface of an 8-stepbraided preform is shown in Fig. 2. The pattern is characterized by the braider yarn angle, θ,and the pitch length, h. Although the braider yarn angle is the most important parameter indesigning the preform, it is not easy to control the angle directly. Since the pitch length andthe braider yarn angle has a reciprocal relation [5], the pitch length is usually controlled in thebraiding process.
Fig.2: The surface of an 8-step braided preform
GEOMETRIC CHARACTERISTICS
Unit Cells
Identification
The identification of unit cells is to determine the orientation angle of the braider yarn. If theyarn movement is independent of one another and there are no interactions among them, unitcells can be easily identified from the braider yarns on the machine bed. In the real situation,however, yarns shift the locations due to the cross-over pass with each other, and their cross-sectional shapes are deformed. Those changes also occur in accordance with mold size,which determines the dimension of the composite specimen. The accurate description of themicrostructure can be achieved by observing the yarn cross-sections cut from the progressivesections of a composite specimen along the longitudinal direction. This procedure has beensuccessfully applied to the unit cell identification of 4-step braided composites [5]. Due to themachine operation in Fig.1, the yarn arrangement in the cross-section of the composite is
180o rotated configuration with respect to the central point of the section. After the cross-section was photographed, the specimen was sanded to remove a thin layer of ∆t, and thesurface is polished again for observation. By plotting each yarn at every successive cut, the

Proceedings of ICCM–11, Gold Coast, Australia, 14th-18th July 1997
V - 359
yarn path was constructed as shown in Fig. 3. It should be noted that only the representativeyarn paths were plotted for clarity, and the distance between two neighboring point is ∆t inthe longitudinal direction (x-axis).
Yab
Z
1
3
24
5
6
78
9
W
T
Fig. 3: Yarn path of an 8-step braided composites for [8x4] arrangement
Idealization
Based upon Fig. 3, the unit cells of the composite can be constructed. Nine different types ofunit cells can be identified as shown in Fig. 4. Each unit cell is idealized as a parallelepipedcontaining a single yarn. The unit cell geometry can be described by the yarn orientationangle, and the unit cell size ( h, a, and b). Here, h is the pitch length, and a and b are relatedto the yarn movement on the machine bed and the preform compaction in the mold.Parameters a and b can be obtained from the width and the thickness of the sample. It is notedthat the yarn at the sides of the sample occupies half of the yarn width.
a = W
m+1 ; b = T
n+2 (1)
Utilizing Eqn 1, the braider yarn orientation angle can be expressed as follows:
θ1 = tan-1 (1h a2+b2 ) ; θ2 = tan-1 (
1h a2+4b2 ) (2)
θ3 = tan-1 (2h (2a)2+b2 ) ; θ4 = tan-1 (
2ah ) ; θ5 = tan-1 (
2h a2+b2 ) (3)
θ6A = tan-1 (3h a2+b2 ) ; θ6B = tan-1 (
32h a2+4b2 ) (4)
θ7A = tan-1 (ah ) ; θ7B = θ2 (5)
θ8A = tan-1 (3h a2+(b/2)2 ) ; θ8B = tan-1 (
32h a2+b2 ) (6)
θ9 = tan-1 (3h (2a)2+(3b)2 ) (7)

Volume V: Textile Composites and Characterisation
V - 360
Fiber Volume Fraction and Braider Yarn Angle
In order to analyze the macroscopic characteristics of 3-D textile composites, it is necessary toemploy the macro-cell approach. This approach is effective in characterizing the complexstructure of 3-D textile composites, in which no single unit cell repeats in the thickness andwidth directions. For the case of 8-step braided composites, the macro-cell encompasses theentire cross-section and the unit pitch length. Since the yarn cross-sectional area and theorientation angle have been obtained in the previous sections, the yarn volume in the macro-cell can be readily determined by multiplying the yarn area with the actual yarn length :
Vi = λh
ρκ cosθi (i = 1 - 9) (8)
where, λ, ρ and κ are the linear density of the yarn (kg/m), fiber density (kg/m3) and fiberpacking fraction. The fiber packing fraction is the local fiber volume fraction of the yarn.Thus, the fiber volume fraction of the 8-step braided composite can be determined byconsidering the number of each unit cell and the fiber packing fraction.
Vf = κΣNpVp
WTh (9)
where, Np is the number of unit cell type p in the macro-cell as shown in Fig. 5. Similarly, thebraider yarn orientation angle (θa) can be obtained by averaging the yarn angle for each unitcell and by taking into account the number of unit cells in the macro-cell.
θa = ΣNpθp
m(n+2)+n (10)
2a
h/3θ6B
h
2b
θ6A
2ab
h θ4
2a2b
hθ5
ab
h/2θ7B
θ7A
h
ab h/3
θ8B
θ8A
2a/3
h/3θ9
h
2b
4a
h/2θ3
h
2ba
2b
h
θ2
a/2b
hθ1
x
y
z
unit cell 1 unit cell 2 unit cell 3
unit cell 4 unit cell 5 unit cell 6
unit cell 7 unit cell 8 unit cell 9]
θ8B
θ9
Fig. 4: Unit cells for 8-step braided composites

Proceedings of ICCM–11, Gold Coast, Australia, 14th-18th July 1997
V - 361
Fig. 5: Unit cell distribution in the macro-cell
COMPOSITE ELASTIC PROPERTIES
The elastic properties of 8-step braided composites can be predicted based upon the fiber andmatrix properties and the three-dimensional fiber architecture. From the unit cellidentification, the macro-cell of the braided composites can be regarded as an assemblage ofanisotropic elastic unit cells whose properties are those of spatially oriented yarn and thematrix system. Since the principal material direction of the three-dimensionally located yarndo not coincide with the coordinate directions of our interest, the stress-strain relations aretransformed from one coordinate system to another. Then, the effective elastic constants of 3-D textile composites can be obtained in two ways, either by assuming uniform stress oruniform strain throughout the macro-cell. The assumption of uniform stress implies a serialstacking of unit cells and averaging of compliance constants. In a similar manner, the case ofuniform strain can be conceived as parallel arrangement of unit cells and averaging ofstiffness constants.
Coordinate Transformation
Figure 6 shows the coordinate systems of a spatially oriented yarn segment. The localcoordinate system is indicated as 1-2-3, where axis 1 coincides with axial yarn direction. Inthe global coordinate system, x-axis is along the composite longitudinal direction, and y-z-axes are in the width and thickness directions of the composite. The braider yarn orientationis indicated as θ, and angles, φ and ψ are defined as the off-axis and inclination angles,respectively.
123
X
Y
Z
φψ
θ
b
a
h
Fig. 6: Coordinate systems of a spatially oriented yarn segment

Volume V: Textile Composites and Characterisation
V - 362
The compliance matrix of the composite cylinder in the 1-2-3 coordinate system is expressedas follows due to the transverse isotropy,
(11)
where the Young's modulus Eij , shear modulus Gij , and Poisson's ratio νij are obtained fromthe fiber and matrix properties using micro-mechanics analysis. Then, the compliance matrixof the unidirectional composite rod, referring to the 123 coordinate system, is transformed to
[S'], referring to the xyz coordinate system:
where [T] is the transformation matrix, and [T]t is a transposed matrix of [T]. The generaltransformation matrix between the local and the global coordinate systems has the followingform [10]:
(13)
where α,β, and γ with subscripts are direction cosines, which can be simplified by setting the2-axis perpendicular to the z-axis from Fig. 6 :
α1 = cos(1,x) = cosφ cosψ ; α2 = cos(1,y) = sinφ cosψ ; α3 = cos(1,z) = sinψβ1 = cos(2,x) = -sinφ ; β2 = cos(2,y) = cosφ ; β3 = cos(2,z) = 0 (14)
γ1 = cos(3,x) = -cosφ sinψ ; γ2 = cos(3,y) = -sinφ sinψ ; γ3=cos(3,z)= cosψ
The coordinate transformation is conducted for the yarn segment in the unit cells. From Fig.4, φ and ψ for each unit cell can be expressed as follows.
φi = tan-1
tanθi
1+Ri2 ; ψi = tan-1 (Ri sinφi) (i = 1 - 9) (15)
where, R is the length ratio of the yarn segment in the y-direction with respect to that in the z-direction. For example, R1 = b/a, R3 = b/2a, R4 = 0, R6a = b/a, and R6b = 2b/a. Bycombining Eqns 14 and 15, transformation matrix [T] can be calculated for each type of unitcell, and the transformed compliance constants of braider yarns in the global coordinatesystem are determined from Eqn 12.

Proceedings of ICCM–11, Gold Coast, Australia, 14th-18th July 1997
V - 363
Elastic Constants
Considering the macro-cell (Fig. 5) under external force in the x-direction, the uniform straincan be assumed for each unit cell. For the yarns in the unit cell 8, however, their variousreinforcing directions result different elastic constants. Unit cell 8 consists of three yarnsegments which are arranged in series with respect to the x-axis. Thus, the uniform stressassumption is applied for these yarn segments, and the transformed compliance constants ofthese segments are averaged based upon their projected length in the x-axis. The other typesof unit cells do not need this averaging process because the yarn segments are in parallelarrangement in those unit cells. The averaged compliance constants of unit cell 8 is :
(S'ij )8 = 13 (S'ij ) 8a +
23 (S'ij ) 8b (16)
where, S'ij is the transformed compliance constants of each yarn segment.
In the macro-cell, in which all the unit cells are arranged in parallel under the loading in the x-direction, the deformation properties of the composite is obtained by averaging the stiffnessconstants of unit cells based upon their volume contribution.
Ccij =
ΣNpVp(C'ij )pWTh + (1-
ΣNpVpWTh ) (Cij )m (p = 1 - 9) (17)
where, V and C'ij with subscript, p, refer to the yarn volume and inverted stiffness matrix
from S'ij of each type of unit cell . The subscript m denotes the matrix material. It should benoted that the yarn volume is considered in Eqn 17 because the stiffness and compliancematrices are for the unidirectional composites. Finally, the stiffness matrix of the macro-cell is
inverted to the compliance matrix, Scij , and the elastic constants are then obtained as follows :
Exx = 1/Sc11 ; Eyy = 1/Sc
22 ; Ezz = 1/Sc
33
Gyz = 1/Sc44 ; Gzx = 1/Sc
55 ; Gxy = 1/Sc
66 (18)
νxy = - Sc12 /S
c11 ; νzx = - Sc
31 /Sc11 ; νyz = - Sc
32 /Sc22
CORRELATION
The 8-step braids were fabricated using 12K T300 carbon fiber, and the consolidation of thepreforms was accomplished by the resin transfer molding (RTM) technique using the epoxy
and curing agent. The samples were cured at 150 oC for two hours. In order to verify theanalytical characterization of 8-step braided composites, experiments on mechanical responsehave been conducted. Tensile test was performed to measure the longitudinal modulus andPoisson's ratio of the composites. The dimension of specimens was 12.9 mm x 4.3 mm x 229mm, and they were instrumented with biaxial strain gages of 6.35 mm in gage length. Alltests were conducted on a screw-driven Instron machine at a cross-head speed of 1.27mm/min.

Volume V: Textile Composites and Characterisation
V - 364
Table 1 summarizes the input data for the calculation, and the results of model prediction andexperiments. Relatively good correlation between the model prediction and the test resultscan be observed. It is also noted that three-dimensional elastic constants can be predicted inthe proposed mechanical model. This can provide important data in analyzing and designingthe structures consisting of 3-D textile composites.
Table 1: Input data for calculation, the model predictions and experimental results
Input Data Model Prediction Test ResultsMechanical Data Geometric and
Physical DataEngineeringConstants
EngineeringConstants
T300 Carbon Fiber E1f = 240 GPa E2f = 16.6 GPa G12f = 8.27 GPa G23f = 5.89 GPa
ν12f = 0.26Epoxy Em = 4 GPa
νm = 0.38
T = 4.3 mmW = 12.9 mmh = 15.0 mm[m x n] = [8 x 4]κ = 0.8
λ = 8.212 x 10⁻⁴
(kg/m)
ρ = 1.77 x 10³
(kg/m3)
Exx = 62.7 GPa Eyy = 9.97 GPa Ezz = 10.38 GPa Gyz = 3.77 GPa Gzx = 4.70 GPa Gxy = 5.06 GPa
νyz = 0.34
νzx = 0.25
νxy = 0.35
GeometricCharacteristics
θ = 12o
Vf = 0.46
Exx = 65.1 GPaEyy -Ezz -Gyz -Gzx -Gxy -
νyz -
νzx -
νxy = 0.37
GeometricCharacteristics
θ = 14o
Vf = 0.485
CONCLUSION
(1) A mechanical model has been proposed to predict the elastic properties of 8-stepbraided composites. Nine types of unit cell were identified by observing the samplecross-section in a progressive cut. The analytical approach for characterizing the 8-stepbraided composite was based upon the macro-cell, which basically occupies the entirecross-section and unit pitch length of the sample.
(2) The coordinate transformation and the averaging of stiffness and compliance constantsare utilized in the prediction of elastic constants. The experimental results comparedfavorably with the model predictions. Although the experimental characterization wasnot enough to support the model prediction due to the lack of established test methodsfor 3-D textile composites, the methodology introduced in this paper can be effectivelyutilized by the materials and structural designers in obtaining the three-dimensionalelastic constants of the composites.

Proceedings of ICCM–11, Gold Coast, Australia, 14th-18th July 1997
V - 365
REFERENCES
1. Chou, T-W., Microstructural Design of Fibrous Composites, Chapter 6 & 7, CambridgeUniversity Press, Cambridge, 1992.
2. Chou, T-W. and Ko, F.K., Textile Structural Composites, Pipes, R.B., Editor, ElsevierScience Publisher, 1989.
3. Byun, J-H., "Development of an Automated 2-Step Braiding Machine and the ProcessModel", Proceedings of Innovative Processing and Characterization of CompositeMaterials, ASME WAM, 1995, pp. 305-315.
4. Kostar, T.D. and Chou, T-W., "Process Simulation and Fabrication of Advanced Multi-Step Three-Dimensional Braided Preforms", J. Mat. Sci., 1994, Vol. 29, p. 2159.
5. Byun, J-H. and Chou, T-W., "Process-microstructure relationship of 2-step and 4-stepbraided composites", Composites Science and Technology, 1996, Vol. 56, pp. 235-251.
6. Pandy, R. and Hahn, H.T., "Designing with 4-Step Braided Fabric Composites",Composites Science and Technology, 1996, Vol. 56, pp. 623-634.
7. Du, G-W, Popper, P., and Chou, T-W.1991. "Analysis of 3-D Textile Preforms for Multi-directional Reinforcement of Composites", J. Mat. Sci., Vol. 26, pp.3438-3448.
8. Macander, A.B., Crane, R.M., and Camponeschi, E.T., "Fabrication and MechanicalProperties of Multidimensionally (X-D) Braided Composite Materials", ASTM STP 873,1986, pp. 422-445.
9. Byun, J-H., and Chou, T-W., "Three-Dimensional Textile Composites: A Review", 112thASME Winter Annual Meeting, Symposium on Composites in Transportation Vehicles,Atlanta,Georgia, Dec.1-6, 1991.
10. Lekhnitskii, S.G., Theory of Elasticity of an Anisotropic Elastic Body, San Francisco,Holden-Day, 1963.
Volume V: Textile Composites and Characterisation
V - 366
TOWARDS AN INTEGRATED PROCESSING MODELFOR A CO-MINGLED THERMOPLASTIC
COMPOSITE
T. A. Cain, M. D. Wakeman, R. Brooks, A. C. Long and C. D. Rudd
Department of Mechanical Engineering, University of Nottingham, UK.
SUMMARY: This paper describes work which has been undertaken in order to model thethree major processes which occur during the processing of a co-mingled thermoplasticcomposite, namely material deformation, consolidation and heat transfer. Materialdeformation has been modelled using a kinematic fabric draping model which predicts fibreorientation, and which may be used to estimate variations in local component thickness. Theconsolidation model, which predicts developed moulding pressure, is a 1-D formulation basedon fibre bed compaction and matrix flow in fibre bundles. Heat transfer during processing issimulated via a 1-D through-thickness formulation which predicts the temperature distributionwithin the laminate. This model uses simple convective and conductive boundary terms sothat the temperature distribution within the laminate may be determined at any instant fromthe end of pre-heat, up to the completion of moulding. The paper concludes with a discussionon the integration of these models, and the utility of the resulting processing model incomponent and process design.
KEYWORDS: modelling, co-mingled, thermoplastic, consolidation, fabric deformation, heattransfer
INTRODUCTION
Co-mingled fabrics allow production of parts containing aligned glass fibres at higher volumefractions using lower moulding pressures than are attainable using flow moulded materials.This makes them particularly attractive to the automotive industry with the potential topermit cost and weight benefits over established material systems. Several manufacturingroutes exist for processing of co-mingled materials including press moulding, vacuumbagging and autoclave moulding. In order to produce high quality laminates using any ofthese processes it is important to have an understanding of the effect of the processingparameters upon the finished laminate. Through the development and integration of modelsfor the deformation, consolidation and cooling of a co-mingled thermoplastic laminate, thecomponent design and process optimisation can be integrated with a reduced need forexperimentation and prototyping.

Proceedings of ICCM–11, Gold Coast, Australia, 14th-18th July 1997
V - 367
DEFORMATION
Several workers have investigated the application of large deformation shell finite-elementtheories to the prediction of draped fabric forms [1, 2]. Good results may be obtained via thisroute, but the method can appear computationally expensive in comparison to the kinematicfabric deformation models which others have used for drape simulation, notably Long [3] andVan West [4].
The fabric deformation simulation in this work is based on kinematic drape model developedat Nottingham. This model assumes that the fabric drapes over a surface via in-plane fabricshearing only.
In order to generate a unique solution for the draped configuration, one fibre path in each ofthe warp and the weft directions must be constrained. Fig. 1 shows the predicted fibreconfiguration when a fabric is draped over a thick disc mounted on a flat plate. In thisexample, symmetry has been used to reduce the scale of the modelling problem, and theconstrained fibre paths are co-incident with the planes of symmetry.
(a) General View (b) Plan View
Fig. 1: Draped fabric configuration—2 views
CONSOLIDATION
Previous investigators, notably Klinkmuller [5], Ye [6] and Van West [7], have studied theimpregnation and consolidation mechanisms occurring during the isothermal compaction ofco-mingled materials. Van West developed a 1-D consolidation model for co-mingledmaterials based on a worst-state case of fibre interspersion, with the glass and matrix materiallocated in two adjacent, but completely separate regions. Staged compaction of a co-mingledfabric has been used to obtain micrographs of the fibre dispersion and matrix impregnation atstates of consolidation ranging from unconsolidated to completely consolidated [8].Observations from these micrographs suggest a modification to the Van West Model whichallows improved simulation of the fibre dispersions for the material under study. In addition,

Volume V: Textile Composites and Characterisation
V - 368
an investigation into the effect of in-plane shear on fabric compaction has been undertaken inorder to allow further modification to the consolidation model.
Experimental Details
Materials
A balanced twill weave fabric of superficial density 650g/m2 consisting of a yarn of 60% bymass co-mingled E-glass and carbon black pigmented polypropylene supplied by Vetrotex SAInternational under the trade name "Twintex" was used throughout the studies. The glassfibres and the polypropylene filaments had nominal diameters of 17 and 20 - 25 micronsrespectively.
Specimens consisting solely of the glass reinforcement which is incorporated in Twintex wererequired in order to determine the compressive response of the fibre constituent. Samples ofmaterial were treated in a furnace at 400oC for 300 seconds to remove the polypropylenefilaments without disturbing the glass fibre architecture.
Isothermal Compaction Trials
An Instron Universal Mechanical Testing Machine model 1195 with a 100 kN load cell and amodel 3111 hot air oven was used to compact 100 x 100 mm squares of co-mingled fabricbetween steel platens. The temperature between the platens was monitored using K-typethermocouples. Four layers of fabric were placed into the platens at 180-185oC with athermocouple inserted into the centre of the fabric. When the temperature of the materialreached 180oC the fabric was compacted at 1mm/min. The laminate was cooled to 100oC, theload removed and the plaque extracted.
To investigate the consolidation mechanism 4 samples were prepared, with compaction to25%, 50%, 75% and 100% of the cross-head displacement required to produce fullconsolidation. The theoretical laminate height of 0.46mm/layer was calculated on the basis ofthe material superficial density, the constituent densities and fibre volume fraction. At 25%consolidation the reinforcement bundles were distinct and separate, with some matrix materialinterspersed within the bundle. At 50% consolidation the matrix had almost coalesced, butlarge voids remained within and around the bundles and dispersion of fibres within the matrixwas uneven. At 75% consolidation the laminate still contained significant voidage, but matrixand reinforcement were well interspersed, and the longitudinal bundles were increasing inaspect ratio as they were compressed. At 100% consolidation, the fibre distribution hadimproved still further, and little voidage remained.
Sheared Fabric Compaction
In order to investigate the effect on the compaction response of in-plane fabric shear, 4 layersof Twintex fabric were sheared to the required angle in a parallelogram clamping frame. Thefabric was then clamped at the periphery using a two-piece clamping frame, with one framelocated below the fabric, and the other located above the fabric, the two halves being joinedusing captive bolts and wing nuts.
Three groups of sheared samples were compacted:1. Fabric un-sheared, as a control.
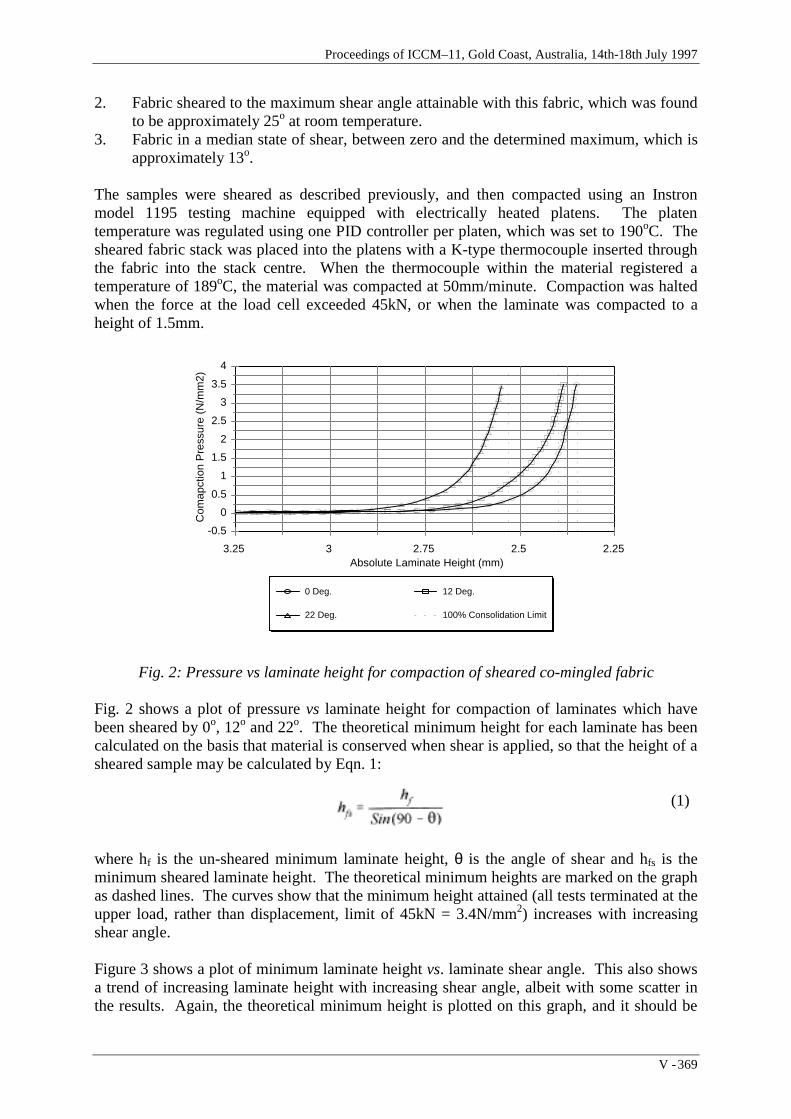
Proceedings of ICCM–11, Gold Coast, Australia, 14th-18th July 1997
V - 369
2. Fabric sheared to the maximum shear angle attainable with this fabric, which was foundto be approximately 25o at room temperature.
3. Fabric in a median state of shear, between zero and the determined maximum, which isapproximately 13o.
The samples were sheared as described previously, and then compacted using an Instronmodel 1195 testing machine equipped with electrically heated platens. The platentemperature was regulated using one PID controller per platen, which was set to 190oC. Thesheared fabric stack was placed into the platens with a K-type thermocouple inserted throughthe fabric into the stack centre. When the thermocouple within the material registered atemperature of 189oC, the material was compacted at 50mm/minute. Compaction was haltedwhen the force at the load cell exceeded 45kN, or when the laminate was compacted to aheight of 1.5mm.
-0.5
0
0.5
1
1.5
2
2.5
3
3.5
4
Com
apct
ion
Pre
ssur
e (N
/mm
2)
2.25 2.5 2.75 3 3.25 Absolute Laminate Height (mm)
0 Deg. 12 Deg.
22 Deg. 100% Consolidation Limit
Fig. 2: Pressure vs laminate height for compaction of sheared co-mingled fabric
Fig. 2 shows a plot of pressure vs laminate height for compaction of laminates which havebeen sheared by 0o, 12o and 22o. The theoretical minimum height for each laminate has beencalculated on the basis that material is conserved when shear is applied, so that the height of asheared sample may be calculated by Eqn. 1:
where hf is the un-sheared minimum laminate height, θ is the angle of shear and hfs is theminimum sheared laminate height. The theoretical minimum heights are marked on the graphas dashed lines. The curves show that the minimum height attained (all tests terminated at theupper load, rather than displacement, limit of 45kN = 3.4N/mm2) increases with increasingshear angle.
Figure 3 shows a plot of minimum laminate height vs. laminate shear angle. This also showsa trend of increasing laminate height with increasing shear angle, albeit with some scatter inthe results. Again, the theoretical minimum height is plotted on this graph, and it should be
(1)

Volume V: Textile Composites and Characterisation
V - 370
noted that all the experimental data lies above this curve. This may be attributed toincomplete consolidation of the test plaques - as soon as the upper load limit was reachedduring compaction, the testing machine cross-head returned to the upper set-point, removingall load from the plaque.
2.3
2.35
2.4
2.45
2.5
2.55
2.6 H
eigh
t (m
m)
12 14 16 18 20 22 24 Shear Angle (Deg.)
Laminate Ht. (189 C) Predicted Ht.
Fig. 3: Minimum Laminate Height Attained vs In-plane shear.
Consolidation Modelling
A 1-D isothermal consolidation model for co-mingled has been developed [8], which is basedon the work of Van West [7] and uses the same single fibre bundle unit-cell, but differs fromthe original in several of the modelling assumptions which are applied. The model assumes aconstant rate of compaction is applied to the material, the matrix material may be non-Newtonian, and the viscosity of the matrix material is temperature dependent. The materialresistance to compaction is assumed to be the sum of the fibre bed compressive response andthe matrix pressure. The impregnation portion of the model uses an ‘effective bundle radius’which is determined as the distance the matrix must flow to wet out the fibres, and is based onobservations of cross-sectional micrographs of the unconsolidated material. This model iscomposed of four sub-models:
Fibre Compaction
Modelling of the elastic response of the reinforcement is based on experimental data.Compaction tests were performed upon reinforcement only, which was obtained as describedpreviously. The reinforcement was lubricated with an automotive 20/50 oil ("Century"supplied by Chemac Ltd), and a single layer of reinforcement was compacted at 1mm/minuteusing an Instron model 1195 testing machine. It was found that the behaviour of the fibre bedcould be represented by a power-law relationship, where Pfb is the fibre bed pressure, h is theinstantaneous fibre bed height, and h0 is the initial fibre bed height, which was found to be0.3mm:

Proceedings of ICCM–11, Gold Coast, Australia, 14th-18th July 1997
V - 371
(2)
The constants A and b were calculated to be 0.0355 and 10.0 respectively.
Permeability
A modified Kozeny-Carman equation as proposed by Gutowski [9] is used to predict the fibrebundle permeability coefficient:
(3)
In Eqn (3), K is the permeability, ri is the fibre radius and vf is the instantaneous fibre volumefraction. The value of va, fibre volume fraction at zero permeability, was calculated to be 0.91assuming hexagonal close packing of fibres. The value of k', the modified Kozeny constant isbased on Seo's work [10] and uses a value of 0.9.
Impregnation
Impregnation of the fibre bed is governed by Darcy's law, which can be applied to acompacting circular fibre bundle (Eqn 4). In this polar form, Vr is the fluid (matrix) velocity,Ur is the fibre velocity, P is the pressure, K is the permeability, and µ is the fluid viscosity.The subscript 'r ' denotes 'at radius r'.
(4)
Matrix Shear Thinning
It is proposed that at ultimate compaction the reinforcing fibres will assume a hexagonal closepacked structure, and at each intermediate stage of compaction the fibres will lie in aproportionately packed hexagonal array. The mean inter-fibre spacing x, can then bedetermined from the instantaneous volume fraction vf by solving Eqn 5.
(5)
If the flow path between the fibres is idealised as a rectangular channel, then the shear-strainrate attributable to flow between the fibres is given by Eqn 6, where V is the matrix flowvelocity, n is the matrix power-law index, and γa is the shear strain rate.
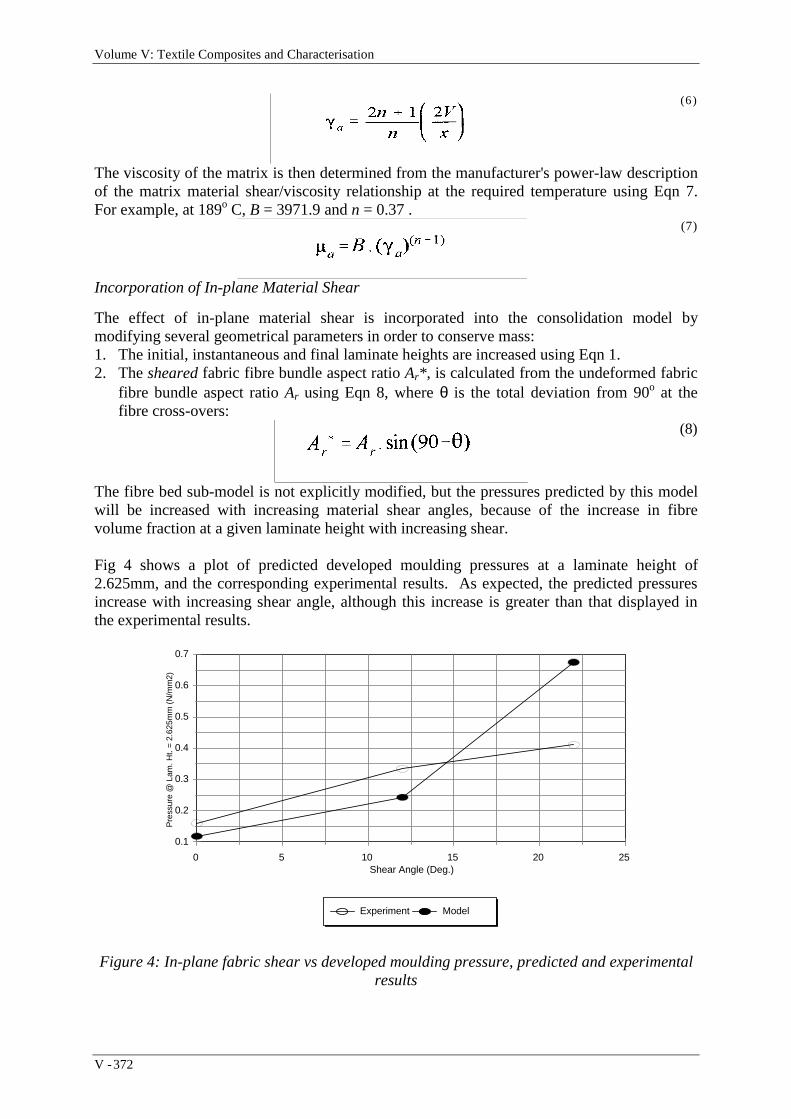
Volume V: Textile Composites and Characterisation
V - 372
(6)
The viscosity of the matrix is then determined from the manufacturer's power-law descriptionof the matrix material shear/viscosity relationship at the required temperature using Eqn 7.For example, at 189o C, B = 3971.9 and n = 0.37 .
(7)
Incorporation of In-plane Material Shear
The effect of in-plane material shear is incorporated into the consolidation model bymodifying several geometrical parameters in order to conserve mass:1. The initial, instantaneous and final laminate heights are increased using Eqn 1.2. The sheared fabric fibre bundle aspect ratio Ar* , is calculated from the undeformed fabric
fibre bundle aspect ratio Ar using Eqn 8, where θ is the total deviation from 90o at thefibre cross-overs:
(8)
The fibre bed sub-model is not explicitly modified, but the pressures predicted by this modelwill be increased with increasing material shear angles, because of the increase in fibrevolume fraction at a given laminate height with increasing shear.
Fig 4 shows a plot of predicted developed moulding pressures at a laminate height of2.625mm, and the corresponding experimental results. As expected, the predicted pressuresincrease with increasing shear angle, although this increase is greater than that displayed inthe experimental results.
0.1
0.2
0.3
0.4
0.5
0.6
0.7
Pre
ssur
e @
Lam
. Ht.
= 2
.625
mm
(N
/mm
2)
0 5 10 15 20 25 Shear Angle (Deg.)
Experiment Model
Figure 4: In-plane fabric shear vs developed moulding pressure, predicted and experimentalresults

Proceedings of ICCM–11, Gold Coast, Australia, 14th-18th July 1997
V - 373
HEAT TRANSFER
The cooling of a thin laminate may be idealised as a one-dimensional heat transfer problem.Internal heat conduction through the laminate thickness is governed by Eqn 9, where t is thetime, T is the temperature, x is the through-thickness coordinate, and α is the thermaldiffusivity of the laminate.
(9)
The laminate, which in the unconsolidated state consists of glass fibre, polypropylene and air,is idealised as a 'rule of mixtures' material [11]. That is, the laminate thermal properties arecalculated on a proportionate basis using the thermal properties of the constituents.
Eqn 9 may be discretised using a forward finite difference scheme, giving an expression forthe temperature at an interior node in the laminate in terms of the temperatures at theneighbouring nodes at the previous time step.
) 2F - 1 .(t + ) t + t .( F = t t) - (t ,(n)t) - (t ,1) + (nt) - (t ,1) - (ntn, ∆∆∆ (10)
In Eqn 10, the first temperature subscript denotes the nodal position, and the second denotesthe time step, while ∆t is the time step and F is the fourier number.
This formulation has been used in a heat transfer model for laminate cooling. This model isintended to describe the through-thickness temperature distribution within the laminate fromthe end of the preheat stage until completion of the moulding cycle. Three distinct coolingregimes are imposed:
1. The material is removed from the preheat facility, and is transported to the press. Heat islost by convection from the upper and lower laminate surfaces.
2. The material is placed in the mould, and the upper mould half is lowered towards thelaminate. Heat is lost by convection from the upper surface, and conduction form thelower surface.
3. The mould is closed, and compression of the laminate begins. Heat is lost by conductionfrom both upper and lower laminate surfaces until the moulding cycle is completed.
Fig. 6 shows sample output for the process heat transfer model for laminate materials, for anominal thermoforming process which uses a preheat temperature of 200o C, with a transittime from preheat to first tool contact of 10 seconds and a tool closure time of 3 seconds. Thetools are assumed to be massive in relation to the laminate charge and so maintain a steady-state temperature of 20oC. This figure shows that the heat lost during transport is relativelyinsignificant when compared to the much more rapid heat loss via conduction, which occursonce the material is placed in the mould.

Volume V: Textile Composites and Characterisation
V - 374
0
50
100
150
200
Tem
pera
ture
(D
eg. C
)0
4.48.8
13.17.
22.26.
Time (s)
Lower Surface
Upper Surface
Preheat EndsLaminate Lower surfaceContacts the Lower Tool
Laminate Upper surfaceContacts the Upper Tool
MouldingComplete
Fig: 6: Laminate process heat transfer model, sample output
PROCESS MODEL INTEGRATION
The simplest basis for integration of the three process models is based on the assumption thatduring the moulding of a component comprised from a co-mingled thermoplastic composite,deformation and consolidation of the fabric occur consecutively: The material is introducedinto the mould cavity and is formed during mould closure. Consolidation commences onceforming is complete. Laminate cooling may be modelled from the end of the preheat cycleuntil all points within the laminate fall below the crystallisation temperature of the matrixmaterial.
This idealisation allows the moulding process to be modelled by using the fabric deformationmodel to determine the local fibre orientations within the mould. If in-plane matrix flow isprohibited, then simulation of the compaction of the draped form is reduced to a serialapplication for the consolidation model to each area of the deformed fabric on a facet-by-facetbasis.
Fig. 6 shows the predicted fibre orientations when a fabric is formed over a 100mm diameterhemisphere. The main captions denote the fibre crossover angles, which have been used inconjunction with the consolidation model for sheared co-mingled materials to estimate thedeveloped moulding pressures for in-mould compaction of this part at 50mm/minute. Thepressure estimates are given as the bracketed values directly below the relevant material shearangle.
The heat transfer from the fabric can be considered during both deformation and consolidationby dividing the fabric thickness into a number of sub-layers. Using the through-thicknesstemperature distribution which is given by the heat transfer model, the material state may bedetermined within each sub-layer. The known temperatures can be used to determine the stateof the matrix within each sub-layer, and if molten, the viscosity of the matrix can beascertained. This updated viscosity data can be supplied to the consolidation model, allowingthe effect of local cooling as well as local fibre-architecture deformation to be accounted for.
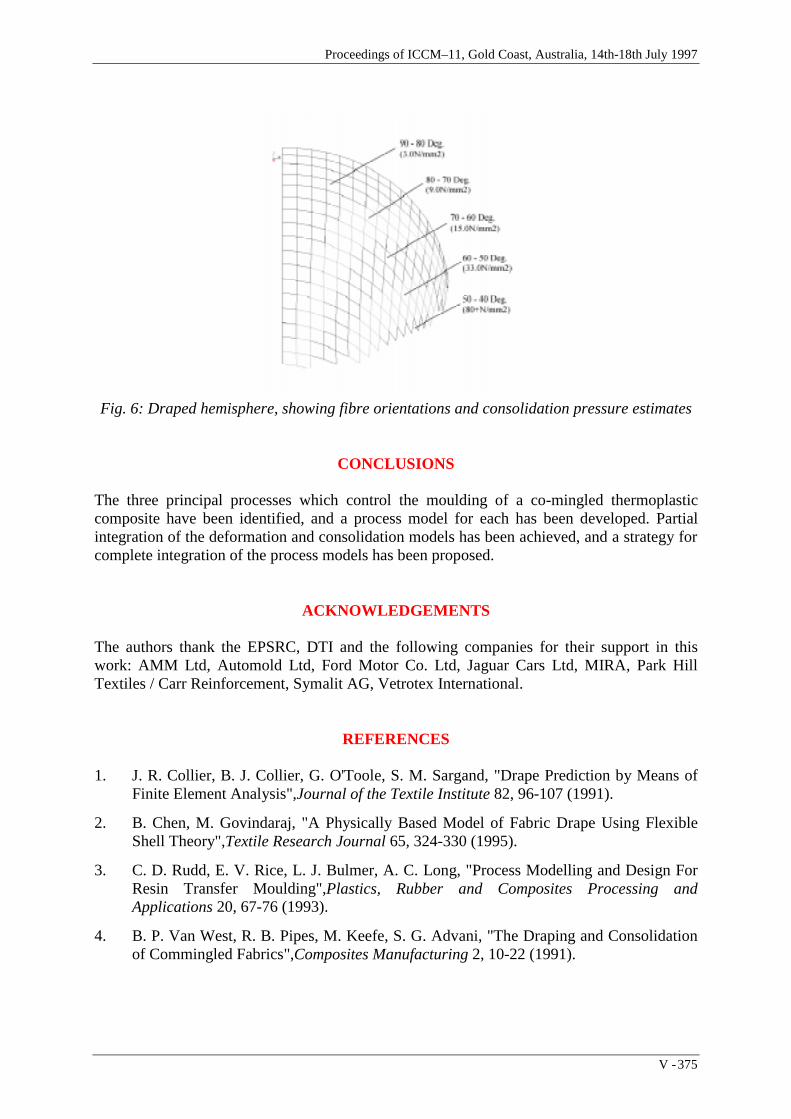
Proceedings of ICCM–11, Gold Coast, Australia, 14th-18th July 1997
V - 375
Fig. 6: Draped hemisphere, showing fibre orientations and consolidation pressure estimates
CONCLUSIONS
The three principal processes which control the moulding of a co-mingled thermoplasticcomposite have been identified, and a process model for each has been developed. Partialintegration of the deformation and consolidation models has been achieved, and a strategy forcomplete integration of the process models has been proposed.
ACKNOWLEDGEMENTS
The authors thank the EPSRC, DTI and the following companies for their support in thiswork: AMM Ltd, Automold Ltd, Ford Motor Co. Ltd, Jaguar Cars Ltd, MIRA, Park HillTextiles / Carr Reinforcement, Symalit AG, Vetrotex International.
REFERENCES
1. J. R. Collier, B. J. Collier, G. O'Toole, S. M. Sargand, "Drape Prediction by Means ofFinite Element Analysis",Journal of the Textile Institute 82, 96-107 (1991).
2. B. Chen, M. Govindaraj, "A Physically Based Model of Fabric Drape Using FlexibleShell Theory",Textile Research Journal 65, 324-330 (1995).
3. C. D. Rudd, E. V. Rice, L. J. Bulmer, A. C. Long, "Process Modelling and Design ForResin Transfer Moulding",Plastics, Rubber and Composites Processing andApplications 20, 67-76 (1993).
4. B. P. Van West, R. B. Pipes, M. Keefe, S. G. Advani, "The Draping and Consolidationof Commingled Fabrics",Composites Manufacturing 2, 10-22 (1991).

Volume V: Textile Composites and Characterisation
V - 376
5. V. Klinkmuller, M.-K. Um, M. Steffens, K. Friedrich, B.-S. Kim, "A New Model forImpregnation mechanisms in Different GF / PP Commingled Yarns",Applied CompositeMaterials 1, 351-371 (1995).
6. L. Ye, K. Friedrich, "Manufacturing of CF/PEEK Thermoplastic Composites FromFlexible Preforms", ICCM-10, Whistler, B.C., Canada (1995).
7. B. P. Van West, R. B. Pipes, S. G. Advani, "The Consolidation of CommingledThermoplastic Fabrics",Polymer Composites 12, 417-427 (1991).
8. T. A. Cain, M. D. Wakeman, R. Brooks, A. C. Long, C. D. Rudd, "IsothermalConsolidation of a Co-mingled Thermoplastic Composite", The Seventh EuropeanConference on Composite Materials, London, UK (Woodhead Publishing Ltd., 1996).
9. T. G. Gutowski, et al., "Consolidation Experiments for Laminate Composites",Journalof Composite Materials 21, 1987 (1987).
10. J. W. Seo, W. I. Lee, "A Model of the Resin Impregnation in ThermoplasticComposites",Journal of Composite Materials 25, 1127-1142 (1991).

Proceedings of ICCM–11, Gold Coast, Australia, 14th-18th July 1997
V - 377
A THEORETICAL FRAMEWORK FOR THECONSIDERATION OF DAMAGE ENTITIES IN 3D
WOVEN COMPOSITE STRUCTURES
S. John1 , F. Coman1, I. Herszberg2, M. Bannister3
1Royal Melbourne Institute of Technology, Department of Manufacturing SystemsEngineering, Bundoora East Campus, Vic. 3083, Australia.
2Royal Melbourne Institute of Technology, Department of Aerospace Engineering, The SirLawrence Wackett Centre for Aerospace Design Technology, GPO Box 2476V, Melbourne,
3001, Australia.3Cooperative Research Centre for Aerospace Structures, 506 Lorimer St. Fishermens Bend,
Vic.3207, Australia
SUMMARY : This paper addresses the microstructural features of multilayer wovencomposite materials and how they collectively contribute to the overall deformation response.Due to the complexity of perceived interplay amongst damage parameters within thecomposite material, an energy framework is used as a basis to rationalise the manifestation ofthese parameters within a deformation response scenario. These parameters are quantified ingeneral terms of damage tensors and are shown to resemble energy-type functions. Thediscussion in this paper is centred around geometrical features of fibre configurations inmultilayer woven glass fibre composite panels with a lattice of uncrimped warp and weftyarns supported by through-thickness weft binders.
KEYWORDS: damage entities, energy, representative volume element (RVE),thermodynamics, continuum mechanics, woven composites, deformation response
INTRODUCTION
The study of damage in composite structures has attracted some interest of late due toemerging technologies used in experimental and computational techniques. This increasedsophistication in obtaining credible experimental and computational data has allowed thedevelopment of analytical techniques that, for the first time, can incorporate these newphysical and computational data. The trend in recent years has been to gain an insight intothe progressive mechanics of failure rather than coming up with some universal failurecriterion in the study of the mechanical properties of composite structures.
This paper attempts to describe the damage progression, in the warp and weft directions, of 3-D woven polymer matrix composites when statically loaded in the tensile mode. The maindesign feature-based variables are the binder configurations and comparison in strengthbetween the warp and the weft directions; the binders are only present in the weft direction.A typical binder-architecture design used in the study reported in [1] is shown in Fig. 1:
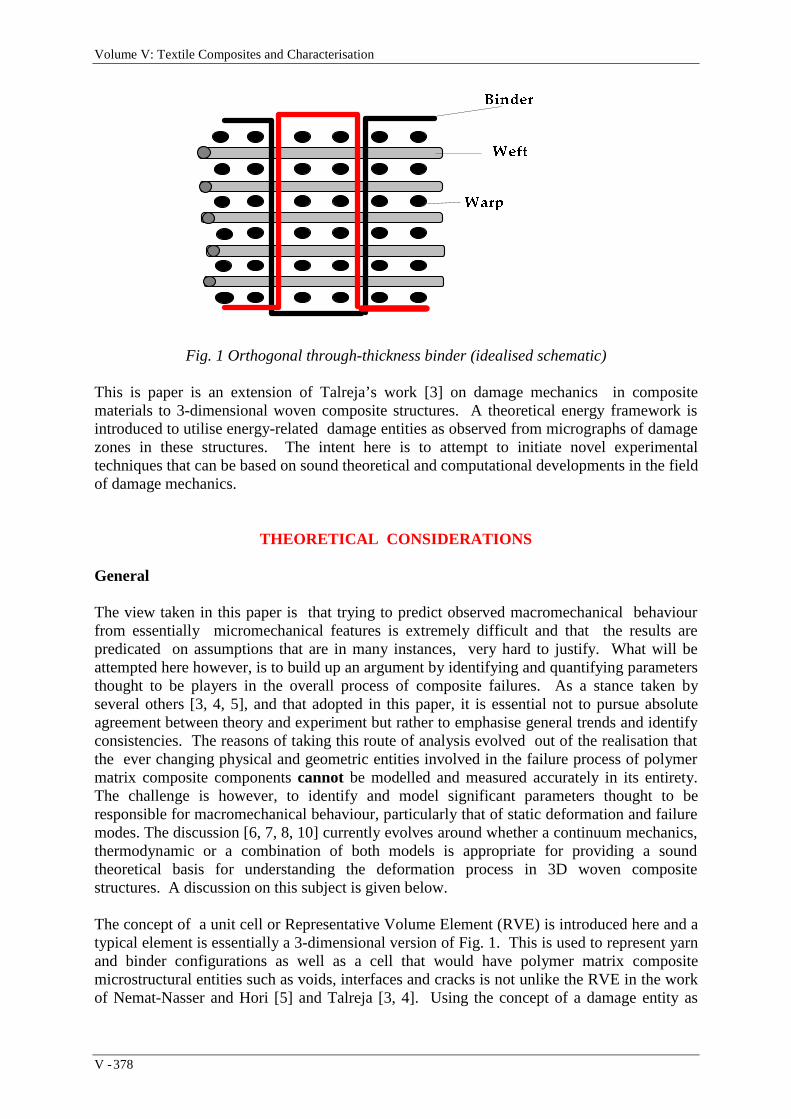
Volume V: Textile Composites and Characterisation
V - 378
%LQGHU
:HIW
:DUS
Fig. 1 Orthogonal through-thickness binder (idealised schematic)
This is paper is an extension of Talreja’s work [3] on damage mechanics in compositematerials to 3-dimensional woven composite structures. A theoretical energy framework isintroduced to utilise energy-related damage entities as observed from micrographs of damagezones in these structures. The intent here is to attempt to initiate novel experimentaltechniques that can be based on sound theoretical and computational developments in the fieldof damage mechanics.
THEORETICAL CONSIDERATIONS
General
The view taken in this paper is that trying to predict observed macromechanical behaviourfrom essentially micromechanical features is extremely difficult and that the results arepredicated on assumptions that are in many instances, very hard to justify. What will beattempted here however, is to build up an argument by identifying and quantifying parametersthought to be players in the overall process of composite failures. As a stance taken byseveral others [3, 4, 5], and that adopted in this paper, it is essential not to pursue absoluteagreement between theory and experiment but rather to emphasise general trends and identifyconsistencies. The reasons of taking this route of analysis evolved out of the realisation thatthe ever changing physical and geometric entities involved in the failure process of polymermatrix composite components cannot be modelled and measured accurately in its entirety.The challenge is however, to identify and model significant parameters thought to beresponsible for macromechanical behaviour, particularly that of static deformation and failuremodes. The discussion [6, 7, 8, 10] currently evolves around whether a continuum mechanics,thermodynamic or a combination of both models is appropriate for providing a soundtheoretical basis for understanding the deformation process in 3D woven compositestructures. A discussion on this subject is given below.
The concept of a unit cell or Representative Volume Element (RVE) is introduced here and atypical element is essentially a 3-dimensional version of Fig. 1. This is used to represent yarnand binder configurations as well as a cell that would have polymer matrix compositemicrostructural entities such as voids, interfaces and cracks is not unlike the RVE in the workof Nemat-Nasser and Hori [5] and Talreja [3, 4]. Using the concept of a damage entity as

Proceedings of ICCM–11, Gold Coast, Australia, 14th-18th July 1997
V - 379
defined by Talreja in [3], it is an individually identifiable change in the microstructuralconstitution of a solid which is brought about by an internal energy dissipative mechanism.Examples in the context of the present study include voids, cracks, debonds and interfacialslip. A vectorial representation of damage is chosen so that both magnitude and orientation ofthe damage is defined. A conceptual damage entity modified by Talreja [3], defines adamage entity dij as:
d a n dSij i j
S
= ∫ (1)
where S is the surface area of the damage entity; ai and nj are ‘damage-influencing’ andnormal vectors associated with the damage entity as shown in Fig. 2. If ai is taken as somefunction of displacement, then if ai is zero, dij fails to qualify as a damage entity. Anotherdefinition, a damage mode, [2] is a collective reference to a subset of damage entities which,on account of their geometrical features and the local driving forces, evolve in a similarfashion. Therefore, as shown in Fig. 2, assuming there are n distinct damage modes in theRVE of volume V, denoted by α = 1,2,.......n, a damage tensor is defined for each mode as:
DV
dij ijk
kα
α
α= ∑1
( ) (2)
where kα is the number of damage entities in the αth mode.
Fig. 2: A Damage entity: yet to be physically quantified
Equation (2) is then used as a field variable using the Coleman-Gurtin [6] theory ofthermomechanical response, to get stiffness-damage relationships as shown by Talreja et al[3, 7]. This essentially showed a form of virgin or undamaged property degradation as shownin Equation (3) below for the case of cross-ply laminates with intralaminar cracks:
S 59(ZLWK'DPDJH(QWLWLHV
QM
DL
α

Volume V: Textile Composites and Characterisation
V - 380
E E f C
E E f C
f C E
1 10
2 20
12 120
2
= −
= −
= −
( , )
( , )
( , )
ν
ν
ν ν (3)
Where E0 and ν0 is the Young’s modulus and the Poisson’s ratio respectively in theundamaged state and C is a combined representation of material constants and geometricalentities.
3-Dimensional Woven Composites
As the damage entity as defined in Equation (2) above is not feature or mechanism-specific,it can be applied to any RVE and all suspected damage entities can be incorporated in it. Asthe RVE for the 3-D composite structure considered here involves both geometric andinherent damage entities, the actual RVE for deformation analysis should strictly be thesuperpositioning of Fig. 1 (3D version [1]) and Fig. 2. Also, as mentioned above, thetheoretical thrust here is not to identify all the damage and geometrical entities responsiblefor deformation but to highlight prominent players in this process such as voids, fibre breaks,debond areas and fibre-matrix interface slip.
Consider the damage entity in Equation (1), dij , to be a form of dissipative (unrecoverable)work done by a damage entity such as a growing crack, then,
d a n dSw
aij i j Microcrack
S
= ⇒∫∂∂ (4)
where ∂w / ∂a is the local elastic energy release rate; w is the energy and a is the crack length.
Similarly, if dij represents some sort of work done by the damage entity such as a debond,then,
d a n dS deij i j
S
ij ij
eij= ⇒∫ ∫ σ0 (5)
where σ ij ij
ede
ij
0∫ is the strain energy density , dW/dV [2].
John et al [1] showed that the damage tensor for a 3-D woven composite structure shouldincorporate not only the inherent damage entities such as that represented by Equations (4)and (5), but also that from the woven yarn and binder configurations. Therefore, Equation (2)would decompose to:
DV
d dij ijk
k Inherent Damage ijk
k Woven Geometry= +
∑ ∑1
( ) ( )α
α
α
α (6)

Proceedings of ICCM–11, Gold Coast, Australia, 14th-18th July 1997
V - 381
Evidence of damage from the ‘Woven Geometry’ Component of Equation (6) is reported byJohn et al in [1].
DISCUSSION ON AN ENERGY-BASED CONSTITUTIVE FRAMEWORK
The need to quantify the damage variables above emanates from the desire to place theseevolving entities into a framework around which physical arguments can be made. The intenthere is to predict a material response to external forces rather than emerge with some sort offailure criterion for 3D woven composite components. Gurney [10] argues that continuummechanics cannot cater for stress-induced phase changes. Thermodynamic considerationsby Gurney [10], Talreja [3] and Colman et. al [5], have all resulted in considerations ofentities other than damage such as entropy, heat flux vectors and 'Helmholz' free energies; allof which are phenomenonistically difficult to measure and adapt to 3D composite structures.As a result, the following analysis is undertaken.
Assuming a RVE, α, shown in Fig. 2, is an isothermal, quasi-static and macro-elastic system,the energy transformations within it are both reversible and irreversible, albeit on amicroscale. Ignoring any phase change due to an evolving damage entity such as a disbond oran initiating crack, the external work, at time t = 0 (pre-damage evolution), W can beexpressed as:
dW d RdAo o= +Λ (7)
where Λ is reversible work, R is the fracture toughness, A is the ‘new crack area’ (in this case,meant to collectively represent voids, potential disbonds sites, friction and other irreversibleenergy phenomena) and subscript o refers to a the pre-mechanical induced damage state.Equation (7) is that used by Gurney [10] to describe elastic cracking and using this as asimplistic model to incorporate damage entities as described in Equations (4) to (6).Elucidating further, dΛ, will represent the reversible elastic within the RVE (such as locked instrain energy during the component manufacture), which is expected to dominate the minorirreversible energy changes represented by R dA.
Fig. 3: Schematic of suspected mechanics responsible for binder-inflicted damage
At time t > 0 (after the onset of damage induced by mechanical deformation), dΛ begins totransform to irreversible energy dissipation such as the damage from the binder causing
,QFUHDVLQJ GDPDJH EHFDXVH RILQFUHDVHG RXWRID[LV EHQGLQJ
IRUFHV
/RDGLQJ/RDGLQJ

Volume V: Textile Composites and Characterisation
V - 382
microcracks in the yarn tows as reported in [1] and illustrated in Fig. 3. Therefore Equation(7) becomes:
dW d RdA RdAi rt
t t
Intt
t t
Ext
i i
= + +=
=
=
=
∑ ∑Λ0 0
(8)
where,
d d RdAr ot
t t
Int
i
Λ Λ= −=
=
∑0
(9)
and the total summation of irreversible energies within the RVE is,
RdA RdA RdAt
t t
Totalt
t t
Intt
t t
Ext
i i i
=
=
=
=
=
=
∑ ∑ ∑= +0 0 0
(10)
where ti is the time during which irreversible new energy dissipations have occurred as adirect result of a diminished dΛr due to internal strain energy conversions from
reversible (dΛ) energy to irreversible ( RdAt
t ti
=
=
∑0
) energy. The RdAt
t t
Ext
i
=
=
∑0
component is the
irreversible energy transformations from disbonds, matrix cracking and so on, directlyattributable to the external load. From the results displayed in [1], it is postulated that if thedamage entities are identified and suitably quantified as energy terms similar to the strain
energy definition [1] in Equation (5), it can be equated to RdAt
t t
Total
i
=
=
∑0
, i.e,
RdA DV
d dt
t t
Total ij ijk
k Inherent Damage ijk
k Woven Geometry
i
=
=
∑ ∑ ∑⇒ = +
0
1( ) ( )
α
α
α
α (11)
CONCLUSION
From the analysis proposed above, it is clear that the challenge is how to quantify thedamage entities in Equations (4) - (6) and how these manifest themselves in an energyframework described in Equation (8) - (11). It needs to be recognised that while binders canhave a deleterious effect on the composite structure as proposed in Equation (6) and assuggested by John et. al in [1], it might have benefits in other ways. It must be stated herethat while a thermodynamically-based constituitive framework is probably a more rigorousand thorough approach to understanding micro and meso-phenomena in composite materials,parameters within it remain very difficult to measure. On the other hand, the continuummechanics approach is also, inherently flawed for quantifying entities with constantlyevolving geometrical and physical parameters. The energy approach is suggested as a modelto relate phenomena (physical and otherwise) in a deforming body. The challenge remainsthe proper definition of damage and other entities involved in the deformation response of

Proceedings of ICCM–11, Gold Coast, Australia, 14th-18th July 1997
V - 383
3D composite structures and how they can correctly be transformed to energy functions asindicated in Equation (11) .
REFERENCES
1. John S, Coman F, Herszberg I, Bannister M, Correlation of Weave Parameter-Micromodels of 3D Woven Composite Structures with its Macromechanical Properties,Proceedings of the 4th Int. Conference on Deformation & Fracture of Composites,Manchester, UK, 1997.
2. Sih G C, Dynamics of Composites with Cracks - contribution in Failure Mechanics ofComposites, Vol. 3, Editors Sih G C and Skudra A M, North-Holland Publishers, 1985.
3. Talreja R, Damage Mechanics of Composite Materials, Vol. 9, Composite MaterialsSeries, Elsevier publishers , 1994.
4. Talreja R, Damage Mechanics Concepts for Durability Analysis of CompositeMaterials, Keynote address and Proceedings of the 3rd Int. Conference onDeformation & Fracture of Composites, Guildford, UK, pp. 15-25, 1995.
5. Nemat-Nasser S and Hori M, Micromechanics: Overall Properties of HeterogeneousMaterials, North-Holland, Amsterdam, 1993.
6. Coleman B D and Gurtin M E, J. Chem. Phys., 47, pp 597-613, 1967.
7. Talreja R, Yalvac S, Yats L D and Wetters D G, Transverse Cracking and StiffnessReduction in Cross Ply laminates of Different Matrix Toughness, Journal of CompositeMaterials, Vol. 26, No. 11, 1992.
8. Backhouse R, Blakeman C and Irving P E, Mechanisms of Toughness Enhancement inCarbon Fibre Non-crimp Fabrics, Proceedings of the 3rd Int. Conference onDeformation & Fracture of Composites, Guildford, UK, pp. 307-316, 1995.
9. Dransfield K A, Bader M G, Baillie C A and Mai Y-W, The Effect of Cross-stitchingwith an Aramid Yarn on the Delamination Fracture Toughness of CFRPs, Proceedingsof the 3rd Int. Conference on Deformation & Fracture of Composites, Guildford, UK,pp. 414-423, 1995.
10. Gurney C, Continuum Mechanics and Thermodynamics in the Theory of Cracking,Philosophical Magazine A, Vol. 69, No. 1, pp. 33-43, 1994.

Volume V: Textile Composites and Characterisation
V - 384
EFFECT OF MATRIX RIVETTING IN WOVENFABRIC HOLES TO INTERLAMINAR FRACTURE
TOUGHNESS OF COMPOSITE LAMINATES
F. Gao1 and M. Yao2
1Department of Textile Engineering, 2 Department of Textile Materials, Northwest Institute ofTextile Science and Technology, Postbox135, Xi’an 710048, P.R. China.
SUMMARY: Matrix rivetting formed in woven fabric holes of woven fabric-reinforcedcomposite laminates is proposed. The geometry of fabric holes is analysed and a method forcalculating the matrix rivetting area is established. In order to know the effect of interlaminarmatrix rivetting to delamination resistibility, the relation between matrix rivetting area andinterlaminar fracture (G c1 and G c2 ) is studied. Glass-fiber plain woven fabrics with eightdifferent warp and filling densities are adopted to reinforce epoxy resin. The experimentalresults indicate that interlaminar fracture toughness will evidently increase with theincreasement of matrix rivetting area. It is suggested that weaves with relative low warp orfilling densities should be used to improve delamination growth resistibility of woven fabric-reinforced composite laminates when adhesion strength between fibers and matrices is lowand delamination occurred easily.
KEYWORDS: matrix rivetting, woven fabric hole, interlaminar fracture toughness
INTRODUCTION
Nowadays, woven fabric composite laminates are widely used in technical practice, especiallyin the field of aerospace, marine and sports technology. This is because of their favorablemechanical properties and low fabrication cost. Then, interplyer delamination is consideredthe most critical failure mode limiting the long-term fatigue life of certain compositelaminates [1]. Previous studies in this area have been largely concerned in improving fiber-matrix adhesion strength and using three-dimensional woven fabric and great effects hadbeen obtained in improving delamination growth resistance. But, for example, cost andfabrication, to a certain extent, their application have been limited. By a great amountobservation of delamination surface of fabric composite laminates we find that one part ofmatrix is peeled from the fiber surface and the other part in fabric holes is matrix fracture.Therefore, we propose that interlayers are combined by bonding between fibers and matricesand matrix rivettings formed in fabric holes. Vandeurzen and Naik analysed the effect of theyarn undulation to performance of woven fabric composites [2-4]. However, the influence ofwoven fabric holes is neglected. In order to know the effect of interlaminar matrix rivetting tointerlaminar fracture energy, two commonly used tests DCB (Double-Cantilever Bean) andENF (End-Notched Flexure) are adopted. Glass-fiber plain weaves with eight different warpand filling densities are adopted to reinforce epoxy resin. A three-dimensional analytical

Proceedings of ICCM–11, Gold Coast, Australia, 14th-18th July 1997
V - 385
model is presented to analyse the geometric characteristics of fabric holes to obtain matrixrivetting area.
RIVETTING AREA OF WOVEN FABRIC HOLES
The shape of matrix rivetting in woven fabric hole is determined by hole’s space shape.Therefore, it is necessary to analyse the hole’s geometric characteristics before we calculatethe rivetting area. The space shape of woven-fabric hole is not a sample cuboid asimagination. In fact, it is very complicated. Generally, the hole’s cross section is similar torectangle with relatively small acute angle as Figure.1(b) shows. The shape and size of crosssection will change with different position. The area of cross section is smallest in hole’scenter and it will expand with the increasement of the distance between section position andcenter. Considering fracture principle, we define the smallest cross section area as rivettingarea. To facilitate the analytical model of fabric hole we assume: 1) the cross section shape ofwarp and filling is track-round, as Fig.1(a) shows; 2) the spatial curve of warp and filling ininterlacing points circuncircle; 3) woven fabric structure phase is 5.0 [5].
Figure 1: Analytical mode of woven fabric hole
According to geometric symmetry of woven fabric hole, based on above assumption, matrixrivetting area Ar can be obtained by:
A A A Ar LONM OBD OPQ= − +4( ) (1)

Volume V: Textile Composites and Characterisation
V - 386
where ALONM is the rectangle area of LONM, AOBD and AOPQ represent the area of curve-side
triangle OBD and OPQ.ALONM can be calculated by warp and filling densities and yarns'width and thickness. However, the calculation of AOBD and AOPQ is relatively complicated.
So, a three-dimensional analytical model is established. By projective geometrical analysis ofcross section, the curve equation of curve OB can be expressed by:
Y x rR x R r
R x R r xf
f f f
f f f
( ) [( )
( )]= −
− − −
− − − −1
2 2
2 2 2 2
2 (2)
where Rf is the curve-radius of filling in interlacing point, 2r f is the thickness of filling.
Therefore, AOBD can be calculated by:
A Y x dxOBD
w w=+
∫ ( )/
0
2δ γ (3)
where δ W is the distance among warps, 2rW is the thickness of warp. In the same way, AOPQ
can be obtained. Now, we introduce a rivetting area corrected coefficient Kr :
KA
Arr
HIJK
= (4)
where AHIJK is the projective area of woven fabric hole. So, the percentage of rivetting area ofunit woven fabric area Pr (%) can be calculated by:
P K Er r(%) [ (%)]= −1 (5)
where E(%) is the percentage of yarn projective area of unit woven fabric area. Figure.2shows a SEM micrograph of glass-fiber plain woven fabric for reinforcement. The relevantparameters of glass-fiber plain woven fabrics with different warp and filling densities arelisted in Table 1.
Figure 2: A SEM micrograph of plain woven fabric

Proceedings of ICCM–11, Gold Coast, Australia, 14th-18th July 1997
V - 387
Table 1: Relevant parameters of glass-fiber plain woven fabric
Number ofGlass-Fiber Plain
Woven Fabric
Densities of Warpand Filling
(Ends and Picks/cm)
Kr(%)
E(%)
Pr(%)
1 20 22 1.279 93.75 7.992 20 20 1.257 92.51 9.343 20 16 1.236 90.23 12.074 20 12 1.219 87.89 15.135 14 14 1.328 95.68 5.746 14 12 1.292 93.79 8.027 14 10 1.273 91.91 10.308 14 8 1.259 89.86 12.77
EXPERIMENTAL
Material
Glass-fiber plain woven fabrics with different structure parameters (different rivetting area)are used to reinforce epoxy. Consolidation agent is triethlene amine.
Interlaminar Fracture Toughness Testing
In gerenal, interlaminar fracture toughness of composite laminates are determined byinterlaminar fracture energy. A number of test methods have been developed to measure theinterlaminar fracture energy of composite laminates [6]. The interlaminar fracture energy,measured in term of the strain energy release rate, is defined as the amount of strain energyreleased in propagating delamination by a unit length. In this experimental, two commonlyused interlaminar fracture toughness test methods of the double-cantilever beam (DCB) `testand the end-notched flexure (ENF) test are adopted to measure the strain energy release rateG c1 and G c2 under mode I loading and mode II loading. The specimens for both DOC test and
ENF test are rectangular beams 300x12x3mm3 cut from laminates(0 0 45 45 900 0 0 0 0/ / / / )− s . Initial delamination are formed by PBTP film (thickness 50 )m)embedded in the mid-place of the laminates. The unit crack length of propagatingdelaminaton is 10mm. The test are carried out on an Instron 1185 universal testing machine ata cross-head speed of 2mm/min [7]. In DCB test, optical microscope is used to observe crackinitiation.
RESULTS AND DISCUSSION
Figure 3 shows the variation of interlaminar fracture toughness with percentage of matrixrivetting area Pr(%). With the increasement of Pr(%), the values of both G c1 and G c2 willincrease evidently. Under the condition of a certain warp density, the reduction of fibervolume fraction 5~10% (by reducing filling density 10~20%) will obtain the improvement of

Volume V: Textile Composites and Characterisation
V - 388
interlaminar fracture toughness 50~100%. We consider the main reason is that the wovenfabrics with relative low warp or filling densities have more rivetting area and more matrixrivetting will formed in interlayers, so more fracture energy is needed in propagatingdelamination. Generally, tensile or shear fracture energy of per unit matrix area is larger thanthe energy of interface peeling between matrix and fiber. The delamination surface of bothDCB and ENF specimens were analysed with scanning electron microscope. Figure 4 showsfour SEM micrographs of the gold coated delamination fracture surfaces. At lowermagnification (a) and (b), shows the existence of matrix rivetting in woven fabric holes andthe fracture cross section shape of matrix rivetting. At higher magnification (c) and (d), showsthat matrices are peeled from the yarn surface. Observations indicate that delaminationfracture associates with the fracture of matrix rivetting and the failure of fiber/matrixinterface.
CONCLUSIONS
The test results indicated that matrices will form matrix rivetting in woven fabric holes ofwoven fabric-reinforced composite laminates and their influences upon interlaminar fracturetoughness of composite laminates are very evident. This research provided a convenient andeffective method to improve the interlaminar fracture toughness of woven fabric-reinforcedcomposite laminates by structure design of woven fabric. It is suggested that woven fabricswith relative low warp or filling densities should be adopted to improve delaminationresistibility of composite laminates when adhesion strength between fibers and matrices islow and delamination failure often occurs.
ACKNOWLEDGMENTS
Thanks are due to faculty of Textile Material Lab of Northwest Institute of Textile Scienceand Technology. Further thanks are addressed to Yiou KeXun who kindly supplied thetesting materials.

Proceedings of ICCM–11, Gold Coast, Australia, 14th-18th July 1997
V - 389
zG C1 G C2
(a) Warp densities: 20 Ends/cm
zG C1 G C2
(a) Warp densities: 14 Ends/s
Figure 3: Variation of interlaminar fracture toughness with percentage of matrix rivettingareaPr (%)

Volume V: Textile Composites and Characterisation
V - 390
Figure 4: Micrograph of delamination surface of woven fabric reinforcedcomposite laminates. SEM magnifications:(a),(b) 30 x; (c),(d) 500 x.
REFERENCES
1. D.J. Wilkins, J.R.Eisenmann, R.A. Camin, W.S.Margolis and R.A.Benson,characterizing delamination growth in graphite-epoxy, Damage in Composite Materials,ASTM STP 775 168 (1980).
2. P.Vandeurzn, J.Ivens and I.Verpoest, Structure-Performance Analysis of Two-Dimensional Woven Fabric Composites, Proceedings of the Tenth InternationalConference on composite materials (ICCM/10), Whistler, B.C., Canada, Vol.4, pp.261-268 (1995).
3. N.K.Naik, P.S.Shembekar, Elastic Behavior of Woven Fabric Composites, Journal ofcomposite Materials 26, No.15, pp. 2196-2246, (1992).
4. N.K.Naik, V.K.Ganesh, An analytical method for plain weave fabric composites,Composites, 26, pp.281-289, (1995).
5. M.Yao, Textile Materials, China Textile Industry Press, Beijing, 1988.6. L.A.Carlson and R.B.Pipes, Experimental Characterization of Advanced Composite
Materials, Prentice-Hall, Englewood Cliffs, New Jersey (1987).7. J.M.Whitney, I.M.Daniel and R.B.Pipes, Experimental Mechanics of Fiber Reinforced
composite Materials, Science Press, Beijing, 1990.

Proceedings of ICCM–11, Gold Coast, Australia, 14th-18th July 1997
V - 391
STRUCTURAL INTEGRITY OF DISCONTINUOUSBLADE STIFFENED BRAIDED AND WOVEN
COMPOSITE PANELS
Kunigal Shivakumar1, Mannur Sundaresan1, Peter Shyprykevich2,Vishnu S. Avva1, and Vivek Ramanujapuram1
1Center for Composite Materials Research, Department of Mechanical EngineeringNorth Carolina A&T State University, Greensboro, NC 27411
2FAA Tech Center, Atlantic City Int. Airport, NJ
SUMMARY: The objective of this study was to evaluate the structural integrity ofdiscontinuous blade stiffened panels made of textile preform composites and compare thefailure stresses and modes with that of conventional laminated stiffened panels. Three-dimensional braided and 3-D orthogonal woven composite panels were evaluated. Panelswere made of BASF G30-500 graphite fiber yarns and Dow Chemicals Tactix-123 matrix.Panels were consolidated by resin transfer molding. The panel configuration was similar tothat used in a previous FAA contract. Three-dimensional finite-element analysis was used toestablish the geometrical configuration and identify the regions of high stresses. Test resultsshowed that fracture in both braided and woven panels was by net section tensile failure.Notch root stress (strain) concentration causes failure initiation but its influence on theultimate strength was minimal. Failure initiation in braided panel was by peeling and inwoven panel it was by shear.
KEYWORDS: blade stiffened panel, braided composites, woven composites, tension load,structural integrity, resin transfer molding, 3-D finite-element analysis, stress concentration
INTRODUCTION
Advances made in laminated polymeric composites have proved that they are stronger, stiffer,and lighter than conventional metallic materials for number of applications, includingaerospace structures, sports equipment and transport structures. The current emphasis onaffordability of composite structures is driving material scientists and manufacturingtechnologists to focus on the use of low cost materials and manufacturing techniques. Textilefabric preforms and resin transfer molding (RTM) lend themselves to manufacture near netshape components. The RTM process uses cheaper dry preform and matrix instead ofexpensive prepregs. Hence, it is found to be a viable low cost manufacturing technique forstructural components.

Volume V: Textile Composites and Characterisation
V - 392
Figure 1.- Northrop-Grumman test specimen
A number of studies are being made in government agencies, industries, and universities toevaluate the engineering properties and structural integrity of textile composites. Theobjective of this paper is to evaluate the structural integrity of discontinuous blade stiffened 3-D braided and woven composite panels. Both analytical as well as experimental techniqueswere used for this purpose. Northrop-Grumman Corp. under a FAA contract investigated thestructural integrity of discontinuous blade stiffener in laminated composite panel (see Fig. 1)[1]. The present study is focused on integrally braided and woven composite panels. In suchpanels, problems associated with laminated composites no longer exists, but there may beother problems related to the fiber architecture. Both 3-D finite-element analysis andexperiments are conducted and the results are compared with each other and with the resultsof Northrop-Grumman test data.
TEST PANEL AND MATERIAL SYSTEM
In an earlier study Northrop-Grumman Corporation examined the structural integrity ofdiscontinuous blade stiffened laminated composite panel (see Fig. 1), fabricated fromunidirectional composite laminae. The purpose of that study was to establish a certificationprocedure for terminating stiffeners used in selected sections in transport aircraft wings. Inthe present study the focus is on the evaluation of the structural integrity of integrallyconstructed textile preform composite panels. These panels were made of BASFís G30-500graphite fibers and Dow Chemicals Tactix 123 matrix. Integral braiding and weavingtechnology was used in manufacturing the panels with stiffeners. Fabric architecture of thebraid is designated by (0/±17o) with 46% axials, whereas the 3-D orthogonal woven fabricarchitecture is (0/90/90) with 50% axials. The average fiber volume fractions of braided andwoven composites were 0.38 and 0.44 [2], respectively. Originally, the preform fabrics weremanufactured to have two-blade stiffeners and were resin transfer molded into two bladestiffened panels.

Proceedings of ICCM–11, Gold Coast, Australia, 14th-18th July 1997
V - 393
Figure 2: NCA&TSU test specimen
Table 1: In-situ Properties of stiffened Panels
Braided Woven
Property Panel B3a Panel W3bGPa (Msi) GPa (Msi)
Ex 67.8 (9.8) 77.9 (10.9)
Ey* 33.9 (4.9) 37.4 (5.4)
Ez* 33.9 (4.9) 37.4 (5.4)
Gxy 5.5 (0.8) 2.8 (0.4)
Gyz* 2.1 (0.3) 2.1 (0.3)
Gxz* 5.5 (0.8) 2.8 (0.4)
νxy 0.77 0.06
νyz* 0.05 0.05
νxz* 0.77 0.05
* Assumed Properties
The nominal dimensions of the panel were: length = 457 mm, width = 165 mm, thickness =6.1 mm, blade depth = 19 mm, and spacing between blades = 89 mm. From each of theseresin transfer molded panels, two single blade stiffened panel specimens as well as otherspecimens required for in-situ mechanical property evaluation were obtained. Figure 2 showsthe geometric configuration of the panel in terms of geometric parameters. A detailed finiteelement study [3] was conducted to establish these geometric parameters. The criteria usedwere: Constant strain should be present over a minimum length of 50 mm in both unnotchedand notched sections of the panel, and the highest strain concentration should occur at thenotch root. The grip length was designed based on the load required to fracture the panelusing friction grips. The geometry of the test specimens finally chosen for the discontinuousblade stiffened panel specimen is shown in Fig. 2.

Volume V: Textile Composites and Characterisation
V - 394
In-situ Properties
The ends of the panel were tabbed using 8 mm (5/16”) thick cross-ply glass/epoxy tabs. Thistab thickness was chosen based on the stiffener height at the grip end. In-situ properties ofbraided and woven panels were measured for simulating the panel test response by finiteelement analysis. Tension, compression, and Iosipescu shear specimens were extracted fromthe stiffened panels. These specimens were tested using procedures similar to the ASTM testprocedures [4, 5] to obtain Ez, νxy, and Gxy. At least 3 specimens were tested for each of theabove properties. Table 1 lists the average values of the different properties measured along withsome of the assumed properties which are indicated by the superscript ‘*’ in the table.
FINITE ELEMENT ANALYSIS OF TEST PANELS
Finite Element Model
A finite element model of one-quarter of the test panel is shown in Fig. 3. This model had 2575,20-node isoparametric solid element and 12,740 nodes. Symmetric boundary conditions wereimposed on z = 0 and x = l/2 planes. A uniform displacement ux was imposed on the specimenat x = 0. The displacement corresponding to an average axial strain of 1% was imposed. Tosimulate gripping conditions, additional rigid body displacement in y-direction was imposed at x= y = z = 0. Because the friction grips does not allow the tabbed length of the specimen to rotate,an equivalent condition was simulated by restraining y-direction displacement of the tabs.
A preliminary calculation showed that the tab deformation due to friction induced load in y-direction was about 0.05 mm (0.002 in.). Therefore one-half of this displacement was imposedon top and bottom tab surfaces. The material properties given in Table 1 were used for bothflange and stiffener of the panel. A linear elastic analysis [6] was conducted and thedisplacements, strains, and stresses were calculated at the nodes.

Proceedings of ICCM–11, Gold Coast, Australia, 14th-18th July 1997
V - 395
Finite-Element Results
Figure 4 shows a typical deformed shape of the finite-element model. Note that the deformationof the 2nd half of the model is added to get a total view of the panel deformation. The deformedshape indicate that: (1) Maximum strain occurs at top surface in the mid section of the paneland (2) Concentration of stiffener peeling (σy) and shear (τxy) stresses is present at the notchroot of the stiffener. Figures 5 and 6 show the distribution of σy and τxy ahead (towards theunnotched section) of the notch for both braided and woven panels. All stresses arenormalized by the average applied stress at the gripped ends. High stresses are limited to adistance of 25 mm from the notch root. Although the notch stress concentration varies from30% to 40% of the average σx stress, they are high enough to cause peeling and/or shearingof the stiffener. Orthogonal weaves are weak in shear, therefore, the failure can initiate asshearing failure. Braided composites are strong in shear but not in peeling (a matrix dominantdirection). Because of interlocking of fiber yarns, failure initiation by peeling would besuppressed. More details of the stress analysis are given in Ref. 3.

Volume V: Textile Composites and Characterisation
V - 396
STIFFENED PANEL TESTS
Instrumentation and test procedure
The panel specimens were instrumented with strain gages at selected locations as shown inFig. 7. Strain gages with 12.3 mm x 4.6 mm active grid were used. The strain gage readingsas well as load levels and displacements from the test machine were recorded using a 20channel strain gage data acquisition system. In addition, the corners between the stiffener andflange, where high peel and shear strains are expected, were coated with a thin uniform layerof typewriter correction fluid. This layer served in a manner similar to brittle coating,indicating regions of severe strains. Failure initiation in these regions were monitored duringthe tests. Panels were tested in an MTS 810 test machine, under load control, at the rate of22.24 KN/min. until failure.
Test Results
The load displacement curves for the braided and woven panels are shown in Figs. 8 and 9.The load-displacement response is initially linear and then it becomes nonlinear (softening).The softening was due to a number of microscopic failures initiating and progressing in thespecimens.
Most of the braided specimens showed first failure around the notch root of the stiffener. Asthe load increased, the number of cracks increased both at the notch root and all along thenotch section. Finally specimens failed as net section tensile failure.
In the woven panels the failure initiated as shear failure at the notch root and then leading toshearing of the stiffener. The final fracture was by the net section tensile failure of the panel.Three of the five panels fractured and the strength of remaining two exceeded the machinecapacity. Table 2 lists the fracture load and the fracture stress (based on the cross-sectionalarea at the notch section) of all the tested panels. The average fracture stress of the baridedand woven panels were 433.7 and 501.9 MPa, respectively. Data scatter was less than 2% for

Proceedings of ICCM–11, Gold Coast, Australia, 14th-18th July 1997
V - 397
woven panels and it was +17%/-15% for braided panels. In conclusion, fracture in bothbraided and woven panels was by net section tensile failure. Notch root stress (strain)concentration causes failure initiation but its influence on the ultimate strength is minimal.Failure initiation in braided panel is by peeling and in woven panel it is by shear.
Figure 10 shows load versus strainresponse at selected locations inthe braided panel. The locations atthe mid-section of the stiffener(Sg3 and Sg11, the strain gages atthe top and bottom surfaces), mid-section of the notch which was alsothe mid-section of the panel (Sg5and Sg9, the strain gages at the topand bottom surfaces), and the straingage Sg2, on the stiffener. Refer toFig. 7 for the description of thestrain gage locations. The top andbottom strain gage pair indicatethat the panel is subjected to bothbending and membrane strains.The bending strain at the mid-ssection of the panel is large(difference between Sg5 and Sg9 islarger than the difference betweenSg3 and Sg11). Furthermore,
stiffener does carry some load (non-zero strain). But the stiffener strain values are less than50% of the membrane strains. Note that the horizontal steps in the strain gage response areindicative of major failures in the specimen. Membrane and bending components of the strainat mid-section of the stiffener and the notch are shown in Figs. 11 and 12 respectively.
Table 2: Panel test results
Specimen NoArea of cross-
section @ Failure load
Fracture Strength
mm2KN MPa
Braided composite panels:B1B 362.1 133.4 368.5B3A 322.2 163.7 508.1B3B 319.3 154.8 484.8BT0 359.7 133.4 370.8BT1 411.5 179.6 436.5
Woven composite panelsW2A* 333.4 - -W3B 320.5 160.1 499.6W2B* 328.8 - -WT0 324.9 165.7 510.1WT1 354.5 175.8 496.1* Load exceeded test machine's capacity

Volume V: Textile Composites and Characterisation
V - 398
Membrane strains at these locations are almost identical for braided panel and the differencefor the woven panels is less than 10%. Bending strains., as it can be inferred from the finite-element results (see Fig. 4) is larger at the mid-section of the panel (location 3) than at themid-section of the stiffener (location 1). The bending strain at location 1 is almost half thebending strain at location 3 for braided composites. However, bending strain is much smaller(stabilized around 250 µε) for woven composite panel. The difference in the two compositesresults may be due to difference in the material properties.

Proceedings of ICCM–11, Gold Coast, Australia, 14th-18th July 1997
V - 399
Fig. 13 shows comparison of strains Sg1 and Sg3 obtained from the finite-element analysiswith the test data for the woven specimen. Broken lines through symbols represent theanalysis and solid lines represent the test. Finite-element strains at Sg1 agreed very wellwith test data, whereas the F-E strains at Sg3 were larger than the test data; but the differenceis less than 10% and may be due to local variations in the material properties.

Volume V: Textile Composites and Characterisation
V - 400
CONCLUDING REMARKS
The objective of this study was to evaluate the structural integrity of discontinuous bladestiffened panels made of textile preform composites and compare the failure stresses andmodes with that of conventional laminated stiffened panels. Three-dimensional braided and3-D orthogonal woven composite panels were evaluated. Panels were made of BASF G30-500 graphite fiber yarns and Dow Chemicals Tactix-123 matrix. Panels were consolidated byresin transfer molding. The panel configuration was similar to that was used in a previousFAA contract. Three-dimensional finite-element analysis was used to establish thegeometrical configuration and identify the regions of high stresses. Peel and shear stressconcentrations were found to be at the notch root and it was the site for failure initiation.Furthermore, the bending stress at the mid-section of the panel was larger than that at thestiffener section. Test results showed that fracture in both braided and woven panels was bynet section tensile failure. Notch root stress (strain) concentration causes failure initiation butits influence on the ultimate strength was minimal. Failure initiation in braided panel was bypeeling and in woven panel it was by shear. The average fracture stress of the barided andwoven panels were 433.7 and 501.9 MPa, respectively. Strains calculated from the finite-element analysis generally agreed with the test data.
ACKNOWLEDGMENTS
The CCMR authors acknowledge the financial support of the FAA Technical Center (GrantNo. 95-G-013), Atlantic City Airport, NJ.

Proceedings of ICCM–11, Gold Coast, Australia, 14th-18th July 1997
V - 401
REFERENCES
1. Shah, C.H., Kan, H.P., and Mahler, M., “Certification Methodology for StiffenerTerminations,” Northrop Grumman Final Report NASI-19347, January 1995.
2. Emehel, T. C. and Shivakumar, K. N., "Tow Collapse Model for CompressionStrength of Textile Composites", Proc. of ASC 10th Technical Conference, SantaMonica, Ca. October 18-20, 1995.
3. Vivek Ramanujapuram, Kunigal Shivakumar, Vishnu Avva, and Mannur Sundaresan,“Design of Discontinuous Blade Stiffened Textile Composite Test Panel”, 38th SDMConference, AIAA/ASME/ASCE/AHS/ASC, Kissimmee, Florida, April 8-10, 1997.
4. ASTM Standards 1993 Annual Book, Section 15, Vol. 15.03, American Society forTesting and Materials, Philadelphia, Pa.
5. Minguet, P. J., Fedro, M. J., and Gunther, C. K., “Test Methods for TextileComposites”, NASA CR-4609, July 1994.
6 DeSalvo, G. J., and Gorman, R. W., ANSYS Engineering Analysis System user'smanual, Version 4.4, Swanson Analysis Systems, Inc., Houston, PA , May 1989.

Volume V: Textile Composites and Characterisation
V - 402
INFLUENCE OF MOISTURE ABSORPTION ONHOT/WET COMPRESSIVE STRENGTH OF
T800H/PMR-15 CARBON/POLYIMIDE COMPOSITE
Yasumasa Hamaguchi, Toshiyuki Shimokawa, and Hisaya Katoh
Airframe Division, National Aerospace Laboratory6-13-1 Ohsawa, Mitaka, Tokyo 181, Japan
SUMMARY: Statistical compression tests for moisture absorbed specimens of aT800H/PMR-15 carbon/polyimide composite with a quasi-isotropic stacking sequence wereconducted at 260°C. These tests clarified the compression fracture mode, the influence ofmoisture absorption on hot/wet compressive strength, statistical properties of hot/wetcompressive strength, the effectiveness of a traveler coupon to monitor moisture absorption,and the relationship between specimen thickness and hot/wet compressive strength.
KEYWORDS: carbon/polyimide composite material, moisture absorption, hot/wetcompressive strength, fracture mode, statistical features, traveler coupon, specimen thickness.
INTRODUCTION
The authors are conducting a series of reliability evaluation tests for the static strength ofT800H/PMR-15 carbon/polyimide composite material. This material is a high temperaturepolymer composite to be applied to the tip fin and other secondary structures of the HOPE-X(H-II Orbiting PlanE), which is an experimental, unmanned, small space shuttle being jointlydeveloped by the National Aerospace Laboratory (NAL), and National Space DevelopmentAgency (NASDA).
One of the most important mechanical properties in applying polymer composites to the spacevehicle structures is hot/wet strength, especially hot/wet compressive strength. Manyfundamental studies on carbon/polyimide composites and their applications were conductedand reported in Refs. 1 and 2. However, not much design data [1-4] has been published forthese kinds of materials. The hot/wet tensile strength of polyimide composite materials isknown to be fairly lower than that at room temperature, as reported in Ref. 3. However, nodata of hot/wet compressive strength were found in Refs. 1 to 4. Moreover, statistical featuresof this property are not clarified for any carbon/polyimide materials, though this property isvery important and expected to have a relatively large scatter.
This study investigated the influence of moisture absorption on hot/wet compressive strengthand the distribution of hot/wet compressive strength of a T800H/PMR-15 carbon/polyimidecomposite. Static compression tests conducted at 260°C clarified the compressive failuremode, the influence of moisture absorption on hot/wet compressive strength, the statisticalproperties of hot/wet compressive strength, the effectiveness of a traveler coupon to monitor

Proceedings of ICCM–11, Gold Coast, Australia, 14th-18th July 1997
V - 403
the moisture content of a specimen tested, and the relationship between hot/wet compressivestrength and specimen thickness.
MATERIAL AND SPECIMEN
The prepreg tape of T800H/PMR-15 carbon/polyimide was supplied by Yokohama RubberCo. Laminate panels with a quasi-isotropic stacking sequence, 32 plies (45/0/-45/90)4S, andcoupon type specimens cut from these panels were made by Fuji Heavy Industries, Ltd. Aspecimen and a traveler coupon, i.e., an accompanied specimen, have the same configurationas illustrated in Fig. 1 and were not distinguished before a static test.
105
25.4
32 plies [45/0/-45/90]4S4. 288
(Nom.)
Fig. 1: Geometry of specimens and traveler coupons; dimensions in mm
MOISTURE ABSORPTION PROCESSING
Specimens were one by one sealed in a polyethylene bag and supplied to NAL. Thesespecimens were moisturized by the following process. The moisture content of a specimen inthis study was defined by that calculated from the weight change measured by a chemicalbalance.
Moisture Disorption Processing
At first specimens and traveler coupons were dried in a vacuum oven. Figure 2 presents therelationship between moisture disorption in weight percent and drying time in hours at 120°C.All specimens and traveler coupons were kept in the oven for 288 hours at 120°C. After thisprocessing, the moisture contents of specimens and traveler coupons were defined to be zeropercent.
-1.0
-0.8
-0.6
-0.4
-0.2
0.0
0 120 240 360 480 600
Time (hours)
Moi
sutu
re d
isor
ptio
n (
wt%
)
No. 1No. 13No. 25No. 37No. 49No. 61Mean
Fig. 2: Moisture disorption in weight percent and drying time in hours at 120°C

Volume V: Textile Composites and Characterisation
V - 404
Moisture Absorption Processing
Specimens and traveler coupons were soaked in a hot water bath for moisture absorption. Thetemperature of water was kept at 75°C. Figure 3 illustrates the relationship moistureabsorption in weight percent and soaking time in hours. Since after 576 hours moistureabsorption was considered to be saturated, the electric heater of the water bath was switchedoff. Specimens and traveler coupons were kept in this water bath in order to keep theirmoisture contents. However, this figure indicates the increase in the moisture content to about1.8% after the stop of electricity. This phenomena seems to be generated because of the lowersaturated vapor pressure inside of the specimen at room temperature than that at 75°C.
0.0
0.5
1.0
1.5
2.0
0 120 240 360 480 600 720 840 960 1080 1200Time (hours)
Moi
stur
e ab
sorp
tion
(wt%
)
No. 1No. 13No. 25No. 37No. 49No. 61Mean
RT75°C
Fig. 3: Moisture absorption in weight percent versus soaking time in hours
The specimens in which the moisture content exceeds the required value were dried in thevacuum oven again. Then the moisture content was adjusted close to the required value bywrapping a specimen in wet tissue or drying it by an electric dryer. To investigate thestatistical properties of hot/wet compressive strength, the water contents of 30 specimens and30 traveler coupons before tests were controlled to be 1.2 weight percent as a target value.This target is 70% of the saturated moisture content, 1.7%, estimated in the planning stage ofthis study. The actually controlled values were from 1.19% to 1.24%. In addition, to know theeffect for the large change of moisture content on the hot/wet compressive strength, threespecimens and traveler coupons each were adjusted to about 1.78%, and the same number ofspecimens and traveler coupons were also adjusted to 1.35%.
COMPRESSION TEST PROCEDURE
Figure 4 shows the external appearance of the compression test fixture clamping a specimenand a traveler coupon placed beside the specimen. Compression tests were conducted at260°C in an environmental chamber. This temperature is tentatively fixed as the upper limitof this material under mechanical loading for the structures of the HOPE-X. The temperaturesof the specimen and the traveler coupon during a test were measured by thermocouples of afoil gage type installed to both surfaces of the specimen and to one surface of the travelercoupon. The temperature near the opening of the chamber from which hot air blew in wascontrolled at 295°C. When the lower temperature of those measured on the specimen reached259°C, the compression test was started and finished under 261°C.
Heating a specimen up to 260°C and conducting the test were tried to be completed within 25to 35 minutes. All the tests were finished within this time range after placing the compression

Proceedings of ICCM–11, Gold Coast, Australia, 14th-18th July 1997
V - 405
test fixture clamping a specimen on a test platen in the chamber. The average time wasapproximately 32 minutes. No preheating was given to the test fixture before clamping aspecimen. Figure 5 indicates an example of temperature records of the specimen and travelercoupon. Since the traveler coupon was placed beside the specimen, the temperature of thetraveler coupon rose faster than that of the specimen.
Specimens were evenly sampled from the location of the original laminate panels. A couponadjacent to each specimen was selected as the traveler coupon in each test.
Fig. 4: External appearance of the compression test fixture clamping a specimen
0
50
100
150
200
250
300
0 5 10 15 20 25 30 35Time (minutes)
Tem
pera
ture
(°C
)
Traveler No. 43SurfaceBack
Test pieceNo. 44
Fig. 5: An example of temperature records of the specimen and traveler coupon duringa hot/wet compression test
Compressive strength is represented by the nominal strength based on the nominal thickness.A digital servo-hydraulic testing machine was used for static tests. The speed of the actuatormoving in a test was controlled at 1.3 mm/min.
Moisture content of the specimen and traveler coupon before and after a static test wasobtained by measuring their weights. Their moisture content was not necessarily equal butvery close. Not to disperse specimen debris, the testing machine was stopped by its limitfunction right after the specimen failed. This enabled an accurate measurement of themoisture content after the test.

Volume V: Textile Composites and Characterisation
V - 406
TEST RESULTS
Relationship Between Compressive Strength and Temperature
Figure 6 illustrates the relationship between compressive strength and temperature. In thesetest results, the data of dry compressive strength obtained by the authors before this studywere included.
This figure shows that the hot/wet compressive strength at 260°C is significantly lower thanthe dry compressive strength at 260°C; furthermore, on average, it is even lower than the drycompressive strength at 300°C.
0
100
200
300
400
500
600
700
800
0 50 100 150 200 250 300 350Temperature (°C)
Nom
inal
com
pres
sive
str
engt
h
(MP
a)
23°C/Dry, NAL, '91
260°C/Dry, NAL, '93
300°C/Dry, NAL, '93
260°C/Wet(1.2%), NAL, '95
260°C/Wet(1.78%), NAL, '95
T800H/PMR-15(45/0/-45/90)4S
Fig. 6: Compressive strength versus test temperature
Relationship Between Compressive Strength and Moisture Content
Figure 7 indicates the influence of moisture content on hot/wet compressive strength at260°C. The compressive strength may have a weak correlation with the moisture contentbefore the tests. However, a fairly clear correlation is recognized between the compressivestrength and the moisture content after the tests, i.e., the residual moisture content. Therefore,it should be considered that the compressive strength has a strong and negative correlationwith the residual moisture content. Moreover, this figure indicates that, if measurable, themoisture content of the specimen during static loading must be used. The specimen whichshowed the highest strength, about 350MPa, away from the group had an especially smallresidual moisture content. In this case the traveler coupon also had a very small moisturecontent after the test. Roughly a linear or semi-log linear line seems to be applicable torepresent their relationship.

Proceedings of ICCM–11, Gold Coast, Australia, 14th-18th July 1997
V - 407
0
100
200
300
400
500
0.0 0.5 1.0 1.5 2.0Moisture content (wt%)
Nom
inal
com
pres
sive
str
engt
h
(MP
a)Before test (1.2%)After testBefore test (1.35%)After testBefore test (1.78%)After test
Semi-log linear
Fig. 7: Influence of moisture content on hot/wet compressive strength at 260°C
Most specimens indicated a shear fracture mode, that is, the specimen was obliquely brokenon the side face. However, the specimen broken at the maximum strength showed a fracturemode of a rhombus shape as a side view dominantly caused by delamination. This fracturemode generally appears in a compression test at room temperature. This fact means that thefracture mode generally seen at room temperature appears when the residual moisture contentis low enough and in such case the hot/wet compressive strength is restored. Therefore, thelarge reduction in hot/wet compressive strength can be prevented, if the residual moisturecontent is kept low enough to show the general fracture mode at room temperature. Figure 7indicates that the fracture mode will change at around 0.6% of the residual moisture content.
Statistical Distribution of Hot/Wet Compressive Strength
Figure 8 illustrates the 30 observations of hot/wet compressive strength plotted on normalprobability paper. These data were obtained by the specimens of which moisture contentbefore the tests were adjusted to within 1.19 to 1.24%. Except for the value of the maximumstrength, these data fit a normal distribution very well. As described above, the maximumstrength is obtained by a different fracture mode. Therefore, this value should be removedfrom the data evaluated for structural design.
The mean hot/wet compressive strength is estimated to be 256 MPa from the censored data ofa sample size of 29 on this probability paper. This value is approximately 53% of the meandry compressive strength at 260°C in Fig. 6. The coefficient of variation as an index of datascatter is 8.9% and twice as large as that of the dry/room temperature compressive strength,obtained from a sample size of 30 [5]. This value is 2.5 times larger than that of drycompressive strength at 260°C, obtained from a sample size of 6.
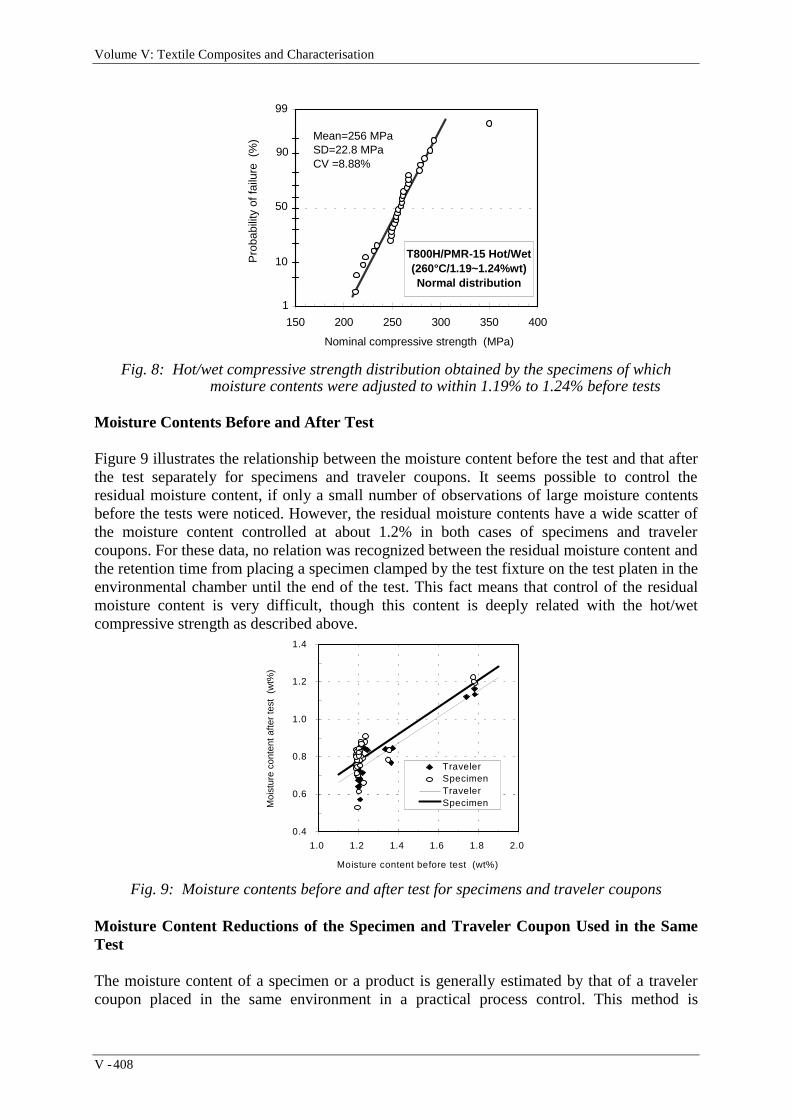
Volume V: Textile Composites and Characterisation
V - 408
150 200 250 300 350 400
Nominal compressive strength (MPa)
P
roba
bilit
y of
failu
re (
%)
1
10
50
90
99
T800H/PMR-15 Hot/Wet(260°C/1.19~1.24%wt)Normal distribution
Mean=256 MPaSD=22.8 MPaCV =8.88%
Fig. 8: Hot/wet compressive strength distribution obtained by the specimens of which moisture contents were adjusted to within 1.19% to 1.24% before tests
Moisture Contents Before and After Test
Figure 9 illustrates the relationship between the moisture content before the test and that afterthe test separately for specimens and traveler coupons. It seems possible to control theresidual moisture content, if only a small number of observations of large moisture contentsbefore the tests were noticed. However, the residual moisture contents have a wide scatter ofthe moisture content controlled at about 1.2% in both cases of specimens and travelercoupons. For these data, no relation was recognized between the residual moisture content andthe retention time from placing a specimen clamped by the test fixture on the test platen in theenvironmental chamber until the end of the test. This fact means that control of the residualmoisture content is very difficult, though this content is deeply related with the hot/wetcompressive strength as described above.
0.4
0.6
0.8
1.0
1.2
1.4
1.0 1.2 1.4 1.6 1.8 2.0
Moisture content before test (wt%)
Moi
stur
e co
nten
t afte
r te
st (
wt%
)
TravelerSpecimenTravelerSpecimen
Fig. 9: Moisture contents before and after test for specimens and traveler coupons
Moisture Content Reductions of the Specimen and Traveler Coupon Used in the SameTest
The moisture content of a specimen or a product is generally estimated by that of a travelercoupon placed in the same environment in a practical process control. This method is

Proceedings of ICCM–11, Gold Coast, Australia, 14th-18th July 1997
V - 409
discussed here. Figure 10 presents the relationship between the moisture reduction of thespecimen and that of the traveler coupon in the same test. Though the data points wereexpected to converge in a straight line, they are distributed in a wide band as shown in thisfigure. Therefore, to precisely estimate the moisture content by this method is impossible, buteffective enough for a rough estimation.
0.0
0.2
0.4
0.6
0.8
0.0 0.2 0.4 0.6 0.8
Specimen's moisture reduction (wt%)
Tra
vele
r's m
oist
ure
redu
ctio
n (
wt%
)
Fig. 10: The relationship between the moisture reduction of the specimen and that of thetraveler coupon in the same test
150
200
250
300
350
400
4.2 4.3 4.4 4.5 4.6
Thickness (mm)
Nom
inal
com
pres
sive
str
engt
h
(MP
a)
Batch A
Batch B
Fig. 11: Nominal hot/wet compressive strength versus measured specimen thickness
Relationship Between Hot/Wet Compressive Strength and Specimen Thickness
Specimens were machined from two panels cured at different times using the same curecondition. These specimens were separated from the original panels into two groups, calledBatch A and Batch B. Figure 11 presents the relationship between nominal hot/wetcompressive strength and measured specimen thickness, separated by each batch usingdifferent symbols. This figure shows that no correlation is recognized between hot/wetcompressive strength and specimen thickness within this study.

Volume V: Textile Composites and Characterisation
V - 410
CONCLUSIONS
The hot/wet compressive strength of the T800H/PMR-15 carbon/polyimide compositematerial was statistically investigated by static tests at 260°C. Major conclusions are asfollows:
(1) The fracture mode in most specimens is of shear fracture obliquely broken on the sideface. However, at the maximum strength, a fracture mode of a rhombus shape as a sideview, dominantly caused by delamination appeared, which is generally observed in a testat room temperature.
(2) Hot/wet compressive strength was deeply related with the residual moisture contentmeasured right after the test. When decreasing this content, the hot/wet compressivestrength became higher.
(3) The distribution form of the hot/wet compressive strength is approximated well with anormal distribution except for the maximum strength. The mean and coefficient ofvariation should be estimated from this censored distribution.
(4) The mean hot/wet compressive strength of specimens absorbing moisture of 1.19 to 1.24weight % before tests decreased to 53% of that of dry specimens at 260°C.
(5) The coefficient of variation of hot/wet compressive strength was approximately twice aslarge as that of room temperature/dry compressive strength.
(6) Control of the residual moisture content was considered difficult.(7) The traveler coupon used to monitor the moisture content of the specimen in the same test
is effective only for a rough estimation, but is difficult for an accurate estimation.(8) No strong correlation was found between hot/wet compressive strength and specimen
thickness.
ACKNOWLEDGMENT
The authors wish to thank Mr. Hirofumi Tamura, Fuji Heavy Industries, Ltd., for his valuablesuggestions to this study.
REFERENCES
1. Dexter, H.B., and Davis, J.G., Jr., eds., Graphite/Polyimide Composites, NASA CP-2079,1979.
2. High Temperature Polymer Matrix Composites, NASA CP-2385, 1985.3. McCleskey, S.F., Cushman, J.B., and Skoumal, D.E., “High Temperature Composites for
Advanced Missile and Space Transportation Systems,” AIAA Paper 82-0707, Proc. SDMConf., American Institute of Aeronautics and Astronautics, 1982, pp. 212-222.
4. Wilson, D.W., Pipes, R.B., Riegner, D., and Webster, J., “Mechanical Characterization ofPMR-15 Graphite/Polyimide Bolted Joints,” Test Methods and Design Allowables forFibrous Composites, ASTM STP 734, 1981, pp. 195-207.
5. Shimokawa, T., Hamaguchi, Y., and Kakuta, Y., “Statistical Evaluation of CompressiveMechanical Properties of a T800H/PMR-15 Carbon/Polyimide Composite,” Journal of theJapan Society for Composite Materials, Vol. 22, No. 5, 1996, pp. 184-192. (in Japanese)

Proceedings of ICCM–11, Gold Coast, Australia, 14th-18th July 1997
V - 411
STRENGTH REDUCTION OF GRP COMPOSITESEXPOSED TO HIGH TEMPERATURE MARINE
ENVIRONMENTS
J M Hale and A G Gibson
Department of Mechanical, Materials and Manufacturing EngineeringUniversity of Newcastle Upon Tyne, NE1 7RU, U.K.
SUMMARY: A programme of tests has been conducted to characterise the strength reductionof three GRP composites as a function of temperature and testing environment. The materialswere two E-glass reinforced epoxies and E-glass reinforced phenolic. The testingenvironments were sea water and crude oil condensate at temperatures from ambient to150°C. Results are presented for the strength of the three materials as a function oftemperature in fibre and resin dominated failure modes when tested dry and saturated in waterand oil respectively.• Fibre dominated strength is insensitive to high temparatures.• Resin dominated strength of epoxy based materials is greatly reduced at high temperatures.• Resin dominated strength of the phenolic based material is reduced only slightly at high
temperatures, but its low temperature strength is poor.• Sea water saturation greatly exacerbates the strength reduction of all the materials tested.
Oil has little effect.
KEYWORDS: GRP, FRP, tensile strength, tensile testing, environmental testing, sea water,marine environment, offshore environment
INTRODUCTION
Composite materials are progressively gaining acceptance for use in offshore applicationswhere their perceived virtues of low weight and good corrosion resistance are much soughtafter by designers and operators. Glass fibre reinforced plastics (GRP) in particular have wonwidespread acceptance in nonstructural applications, including fire water piping, decking andcable trays. There is however considerable interest in the use of GRP of various types inmore demanding applications offshore. Such new applications involve using the material incontact with aggressive process fluids at elevated temperatures. Examples of applicationsunder consideration include separator vessels (where various hydrocarbons and water arepresent at 70-80°C, with possible excursions above 100°C), subsea flowlines and, perhaps themost demanding application, down hole tubing and drill stream parts. Although thetemperatures involved in the most demanding down hole applications are too high to permitthe use of organic matrix composites, there is a range of applications where the temperaturesare somewhat lower and GRP offers significant potential advantages.
To help assess the suitability of GRP in these demanding offshore applications, a programmeof tests has been carried out to measure the strength of three candidate materials as a functionof temperature in typical operating environments. This is the work described in this paper.

Volume V: Textile Composites and Characterisation
V - 412
The effects of environment on GRP
Most tests carried out to date to determine the response of composite materials toenvironmental degradation have been carried out at ambient temperature. However, it isknown that elevated temperature softens most resins, particularly above the glass transitiontemperature (TG) [1]. This reduces the interlaminar shear strength and so the strength of thecomposite when it is loaded such that the fibres are not in pure tension. The glass fibres arenot susceptable to corrosion unless the absorbed water is acidic, in which case the effect canbe dramatic [2].
The flexural strength of glass/polyester laminates and glass/epoxy pipes aged in sea water atambient temperature have been shown to reduce by up to 20% within a year [3]. Absorbedwater is known to act as a plasticiser [4], reducing TG, and has been shown to reduce thestrength and modulus of amine cured epoxies [1]. It can thus be expected to exacerbate thisloss of properties at high temperatures.
The presence of oil is believed to have little effect on fibre composites. Polyester/glasslaminates exposed to dehydrated oil at temperatures up to 90°C for 90 days have been shownto behave in the same way as unexposed laminates [5].
EXPERIMENTAL DETAILS
Test Programme
The programme of tensile tests was undertaken on coupon specimens of three different GRPmaterials at elevated temperatures in two marine environments: natural sea water and oilcondensate. For comparison, the materials were also tested in the normal laboratoryenvironment (air at ambient humidity) and at ambient temperature in the test environments.
The tensile tests were carried out on specimens that had previously been saturated in the testenvironment. To ensure that the specimens were truly saturated, a series of absorption testswas first carried out on each material in each environment to determine the time required toreach saturation.
Tensile tests were carried out on coupon specimens with the fibre reinforcement laid in twodifferent directions: 0/90° and ±45° with respect to the direction of loading. With the fibresoriented at 0/90° approximately half of the fibres were loaded axially and so the failure wascontrolled by the strength of the fibres (fibre dominated failure mode). With the ±45°oriented fibres, the failure was largely controlled by the strength of the resin matrix (resindominated failure mode).
Tensile tests were carried out under quasi-static axial loading conditions with the specimen atconstant temperature and immersed in the test environment.

Proceedings of ICCM–11, Gold Coast, Australia, 14th-18th July 1997
V - 413
The tensile tests were carried out in the specially developed environmental tensile testingchamber shown schematically in Figure 1, described fully in [6]. Briefly, it consists of atensile testing machine (loading frame, hydraulic actuator, load cell and specimen grips)contained within a pressure vessel. This facility made possible the testing of specimenswhilst immersed in liquids at high temperatures above the normal boiling point. Boiling wasinhibited by allowing the pressure to rise as the temperature increased.
A particular feature of the testing chamber is the thermally defined gauge length. Thespecimen is heated to the test temperature only in a short region near its mid-length. The endsof the specimen remain relatively cool. Since the material is weakened at elevatedtemperatures, this differential heating ensures that the specimens always fail in the gaugelength and not at the entrance to the grips. This arrangement eliminates the need for specialspecimen geometry.
Test Environments
Natural Sea Water. Sea water was taken directly from the North Sea at the coast nearNewcastle upon Tyne.
Oil Condensate. Samples of crude oil, modified only by flashing off the light fractions, weresupplied by Philips Petroleum. The samples supplied were typical of light crudes.
MATERIALS
Resin Matrix Materials. Three generic resin types were chosen for this work, representingthe materials of greatest interest to the offshore community. These were:- aromatic amine (MDA) cured epoxy,
Figure 1: Schematic representation of the environmental tensile testing chamber

Volume V: Textile Composites and Characterisation
V - 414
- cycloaliphatic amine (IPD) cured epoxy, and- acid-cured phenolic.These resins are all capable of being processed into GRP components by liquid fabricationmethods such as contact moulding and filament winding.
The epoxy resins were of the type widely employed in the fabrication of GRP pipework. Thearomatic amine curing agent, MDA, is known to give resins with the higher TG and generallygood high temperature properties. Unfortunately there are some health and safety concernsabout the carcinogenicity of this material. This has led to its replacement in Europe, for someapplications, by the cycloaliphatic amine curing agent IPD which is less toxic. IPD is knownto give resins with a somewhat lower TG and hence inferior high temperature properties.Clarification of the relative thermal performance of composites based on these two keythermosetting resins in liquid environments was the main reason for their inclusion in the testprogramme.
The epoxy resins used for the fabrication of coupon samples were of the same compositionused for the commercial manufacture of GRP pipes. The epoxy component was supplied byShell Chemicals (Epikote 827). The IPD curing agent was Vestamin IPD, supplied by Hüllsand the MDA curing agent was Ancamine 1692, supplied by Anchor Chemicals (AirProducts). Both agents were used in the proportion recommended by the manufacturer of theepoxy resin.
The phenolic resin samples were fabricated from the acid-cured liquid phenolic resin,Cellobond J2042L, supplied by BP. They were cured by the addition of the manufacturers’recommended quantity of strong acid catalyst, Phencat 382.
Glass Reinforcement Material. The reinforcement used throughout was epoxy and phenoliccompatible E-glass woven rovings (600gm/m2), supplied by Owens Corning Fibreglass.
COUPON SPECIMEN MANUFACTURE
The specimens were made in-house by contact moulding, with dove-tail ends for mounting inpurpose-designed matching grips of the tensile testing machine. This technique ensured aconsistent fibre volume fraction from sample to sample and from sheet to sheet. The mouldincluded chamfered ends in which the dove-tails were built up by placing extra strips of glassbetween the normal fibre layers. The mould was used to make flat sheet laminate of 500 ×500mm, two sides of which had a 50mm wide dove-tail with an included angle of 10°. Thissheet was then cut into strips approximately 23mm wide using a fine tooth band saw. Thesestrips were then milled down to 21mm in order to minimise damage to the edges.The final specimen dimensions were 600mm long × 21mm wide × ≈3.5mm thick.
ABSORPTION TEST PROCEDURE
Samples 60mm and 100mm long were cut from the coupon specimens. The samples wereweighed initially and then immersed in the test liquids (sea water and oil condensate) at100°C. They were removed from the environment at intervals and reweighed. Thisprocedure was repeated until the rate of increase in mass had reduced to a level that indicatedthat effective saturation had been achieved.

Proceedings of ICCM–11, Gold Coast, Australia, 14th-18th July 1997
V - 415
TENSILE TEST PROCEDURE
Dry Tests. Specimens of the three material systems investigated were tested to failure atvarious temperatures in air (i.e. in the absence of any aggressive environment). The results ofthese tests were used as a baseline against which the subsequent tests on specimens subjectedto conditioning in the test environments could be compared.
Saturated Water Tests. Prior to testing, specimens were conditioned in the test environmentfor a period sufficient to ensure saturation (as determined in the absorption tests describedabove). Each specimen was loaded into the test rig and immersed in the environment asquickly as possible after removal from the conditioning chamber. The heater was switched onand, as soon as the gauge length had settled at the test temperature, the specimen was loadedquasi-statically to failure. Load and temperature were monitored and recorded for subsequentanalysis.
Saturated Condensate Tests. The testing procedure was the same as that for saturated watertesting, using the appropriate conditioning time to ensure saturation of the specimens prior totesting.
RESULTS
Absorption Tests
Sea Water Absorption. The waterabsorption data for coupon tests of thethree materials are given in Table 1.The water uptake was in all cases quitelow. The epoxies show a 1-2% increasein mass due to water absorption atsaturation and the phenolic, thoughslightly higher, was still only 2.2%.
It was found that the expected high initial rates of absorption varied between materials, butthat in all cases the rate of absorption quickly fell. In the case of the IPD epoxy and phenolicsystems there was little further uptake after two days immersion. With the MDA cured epoxythe time to effective saturation was five days.
Oil Condensate Absorption. As shownin Table 2, there was very littleabsorption of oil into the epoxymaterials. In the case of the phenolicresin composite, which is known to formvoids in the matrix, it is believed that theincreased mass is due to these voidsbeing filled rather than any interactionwith the fibre or matrix materials.
Table 1: Saturation of materials in sea water at100°C
Resin system Time tosaturation
Added massat saturation
MDA Epoxy 6 days 1.8%IPD epoxy 3 days 1.1%Phenolic 5 days 2.3%
Table 2: Saturation of materials in crude oilcondensate at 100°C
Resin system Time tosaturation
Added massat saturation
MDA Epoxy 5 days <0.1IPD epoxy 2 days <0.1Phenolic 2 days 1.4

Volume V: Textile Composites and Characterisation
V - 416
TENSILE TESTS
Dry Tests. The results for the matrix dominated±45° coupon tests (Figure 2) show that in all casesthe matrix material is strongly dependent ontemperature. At ambient temperature, the aromaticamine (MDA) cured epoxy was the strongest of thethree materials tested with a tensile strength of90MPa. This strength is only slightly reduced attemperatures up to 60°C, but is reduced by 50% to45MPa at about 110°C and to only 12MPa at 120°C.The aliphatic amine (IPD) cured epoxy system wasweaker than the aromatic at all temperatures andfollowed a similar curve. The tensile strength at ambient temperature was around 80 MPa,began to drop at only 40°C and was reduced to 50% of its initial strength (40 MPa) at 80°C.
At low temperatures the phenolic based material is weaker in the matrix dominated mode thaneither of the epoxy materials, but it is less affected by temperature than the epoxies due to itshigh TG. Even at a temperature of 160°C the strength of the phenolic material was reduced byonly 30% to 42MPa. Its tensile strength becomes greater than that of the MDA cured epoxymaterial (the stronger of the two epoxies) at about 100°C.
The results of the 0/90° dry tests (Figure 3) showthat the specimens were only marginally affectedby an increase in temperature. This is to beexpected in this fibre dominated mode since the E-glass is not greatly affected by moderatetemperatures. All three materials show a reductionin strength of approximately of 8% over the rangefrom ambient to 160°C.
Sea Water Tests. Figures 4-6 show the results oftensile tests carried out at various temperatures oncoupon specimens using the three resin systems inthe matrix dominated ±45° mode. In all cases thespecimens were saturated in sea water prior totesting and the tests were conducted with thespecimens in contact with the water. As may beseen, all three materials showed a reduction instrength due to the environment, but this effect wasmost pronounced in the two epoxy materials.
The results for the aromatic amine (MDA) curedepoxy material in Figure 4 show that this materialis only moderately affected by sea water atelevated temperatures. At ambient temperature,the strength of the saturated material is reduced byabout 15% relative to the dry material. Thestrength reduces as a function of temperaturesimilarly to the material in the dry state, being reduced by 50% to 40MPa at 100°C.
0102030405060708090
100
0 50 100 150Temperature (ºC)
Str
engt
h (M
Pa)
Phenolic (dry)
IPD Epoxy (dry)
MDA Epoxy (Dry)
Figure 2: ±45°specimens tested dry
0
50
100
150
200
250
300
0 50 100 150 200Temperature (ºC)
Str
engt
h (M
Pa)
IPD Epoxy
MDA Epoxy
Phenolic
Figure 3: 0/90° specimens tested dry
0102030405060708090
100
0 50 100 150Temperature (ºC)
Str
engt
h (M
Pa)
MDA Epoxy (Dry)
MDA Epoxy (wet)
Figure 4: strength reduction in ±45°MDA cured epoxy specimens due to
sea water saturation
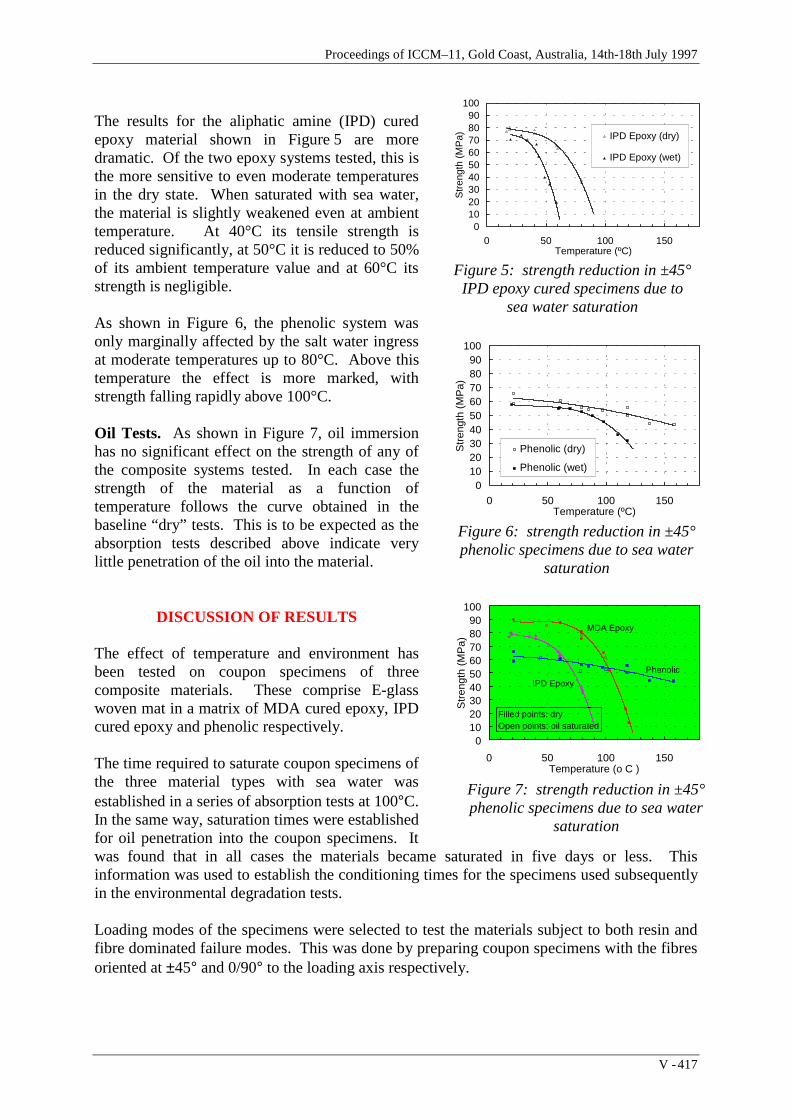
Proceedings of ICCM–11, Gold Coast, Australia, 14th-18th July 1997
V - 417
The results for the aliphatic amine (IPD) curedepoxy material shown in Figure 5 are moredramatic. Of the two epoxy systems tested, this isthe more sensitive to even moderate temperaturesin the dry state. When saturated with sea water,the material is slightly weakened even at ambienttemperature. At 40°C its tensile strength isreduced significantly, at 50°C it is reduced to 50%of its ambient temperature value and at 60°C itsstrength is negligible.
As shown in Figure 6, the phenolic system wasonly marginally affected by the salt water ingressat moderate temperatures up to 80°C. Above thistemperature the effect is more marked, withstrength falling rapidly above 100°C.
Oil Tests. As shown in Figure 7, oil immersionhas no significant effect on the strength of any ofthe composite systems tested. In each case thestrength of the material as a function oftemperature follows the curve obtained in thebaseline “dry” tests. This is to be expected as theabsorption tests described above indicate verylittle penetration of the oil into the material.
DISCUSSION OF RESULTS
The effect of temperature and environment hasbeen tested on coupon specimens of threecomposite materials. These comprise E-glasswoven mat in a matrix of MDA cured epoxy, IPDcured epoxy and phenolic respectively.
The time required to saturate coupon specimens ofthe three material types with sea water wasestablished in a series of absorption tests at 100°C.In the same way, saturation times were establishedfor oil penetration into the coupon specimens. Itwas found that in all cases the materials became saturated in five days or less. Thisinformation was used to establish the conditioning times for the specimens used subsequentlyin the environmental degradation tests.
Loading modes of the specimens were selected to test the materials subject to both resin andfibre dominated failure modes. This was done by preparing coupon specimens with the fibresoriented at ±45° and 0/90° to the loading axis respectively.
0102030405060708090
100
0 50 100 150Temperature (ºC)
Str
engt
h (M
Pa) IPD Epoxy (dry)
IPD Epoxy (wet)
Figure 5: strength reduction in ±45°IPD epoxy cured specimens due to
sea water saturation
0102030405060708090
100
0 50 100 150Temperature (ºC)
Str
engt
h (M
Pa)
Phenolic (dry)
Phenolic (wet)
Figure 6: strength reduction in ±45°phenolic specimens due to sea water
saturation
0102030405060708090
100
0 50 100 150Temperature (o C )
Str
engt
h (M
Pa)
MDA Epoxy
IPD Epoxy
Phenolic
Filled points: dryOpen points: oil saturated
Figure 7: strength reduction in ±45°phenolic specimens due to sea water
saturation

Volume V: Textile Composites and Characterisation
V - 418
In all cases, the strength of the coupon specimens was found to reduce as testing temperatureincreased. However, there was considerable variation between materials, both in terms of therate of fall off of strength with temperature and in the absolute value of the strength at anygiven temperature.
When not subjected to a hostile environment, the 0/90° (fibre dominated) materials were allonly slightly affected by increased temperature. However, the ±45° (resin dominated) epoxybased materials were strongly effected by increased temperature with strength greatlyreduced. This is due to the softening of the resin, particularly close to and above the glasstransition temperature (TG).
When tested in the dry state, the ±45° IPD cured epoxy, which was the weaker of the twoepoxy materials at room temperature, was also the more sensitive to temperature. By 80°Cthe strength had dropped from 80MPa to 35MPa, which might be considered the limit ofintegrity in the resin dominated failure mode. The ±45° MDA cured epoxy was also severelyweakened at high temperatures, dropping from 90MPa to 35MPa at 110°C, which might alsobe considered the limit of integrity in the matrix dominated mode. The ±45° phenolic basedmaterial was considerably weaker than either of the epoxy systems at low temperature, butwas shown to be much less sensitive to temperature. This is undoubtedly due to the high TG
of the material which prevents softening in the temperature range tested. The phenolicmaterial was found to be the strongest of the three materials in this mode at temperaturesabove 100°C, retaining a strength greater than 40MPa at 160°C. On the same basis it can beconsidered to have easily retained its integrity up to this high temperature.
As an alternative to an absolute residual strength, rate of strength loss migtht be a usefulcriterion for upper temperature limit of integrity since this reflects the sensitivity to smalltemperature excursions. On the basis of an integrity limit of 1MPa/degree, the resindominated integrity limits for dry MDA and IPD cured epoxy GRPs are 90°C and 60°Crespectively. On the same basis dry phenolic GRP retains its integrity to above 160°C.
All three materials tested showed a marked reduction in strength at all temperatures due to saltwater absorption. This effect is particularly marked in ±45° IPD cured epoxy couponspecimens, in which the strength is reduced to 35MPa at 50°C and becomes negligible above60°C. The effect is rather less significant in ±45° MDA in which the temperature for 35MPastrength is reduced from 110°C to just over 100°C. However, for the ±45° phenolic couponspecimens, which are particularly good when tested dry, the strength starts to fall awayrapidly at temperatures above 80°C and drops to 35MPa at 110°C, though the rate of strengthreduction of 0.8MPa/degree at that temperature.
IPD cured epoxy GRP loses its strength very quickly at elevated temperatures under theseconditions, reducing to 35MPa at only 50°C and reaching the 1MPa/degree integrity limitbelow 40°C. Clearly it is unsuited for use in contact with sea water at elevated temperatures.The MDA cured material is much better, retaining its integrity to 100°C and 90°C accordingto the 35MPa and 1MPa/degree criteria respectively.
Phenolic based GRP has excellent stability at moderate temperatures, with very little loss ofstrength below 80°C. Even at higher temperatures it retains good stability and reaches the35MPa integrity limit at 115°C, before the 1MPa/degree limit. However, its poor strength at

Proceedings of ICCM–11, Gold Coast, Australia, 14th-18th July 1997
V - 419
ambient temperature means that it is still weaker than the MDA cured epoxy material below90°C. Only above this temperature does it emerge as the best material of the three tested.
The integrity of phenolic based GRP at high temperatures when saturated in sea water is thusseen to be only slightly superior to that of a MDA epoxy material in terms of residualstrength. However, the phenolic material does have the advantage of much better stability inthat its strength is much less dependent on temperature changes at high temperatures. If theoperating temperature is not well defined at the design stage this could well be significant.
It is evident that immersion in oil, at least in the form of condensate, has very little effect onthe strength of GRP in any of the forms tested. For each material tested the data points forstrength at a given temperature lie squarely on the curve for the equivalent dry tests. This isto be expected since the absorption tests indicated very little ingress of the oil into any of thecomposite materials investigated in this work.
CONCLUSIONS
1. A cost effective methodology has been developed for preparing and testing the strength ofboth coupon and pipe specimens of fibre reinforced composite materials at elevatedtemperatures in liquid environments.
2. Three materials have been tested: E-glass reinforcement in cycloaliphatic amine (IPD)cured epoxy, aromatic amine (MDA) cured epoxy and acid-cured phenolic.
3. The time required for effective sea water saturation at a temperature of 100°C has beenestablished for each material. In all cases this is five days or less.
4. The effects of sea water saturation on strength have been quantified as a function oftemperature for the three material systems.
5. In all the materials tested, strength is reduced only slightly at elevated temperatures in fibredominated failure mode.
6. In matrix dominated failure mode, the strength of both epoxy based materials falls offrapidly at elevated temperatures. This effect occurs at lower temperature in IPD curedepoxy than MDA cured epoxy.
7. In matrix dominated failure mode, the strength of phenolic based GRP is less affected byhigh temperature. However, its strength is lower than epoxy materials at ambienttemperature. It was found to be stronger than IPD/epoxy GRP above 60°C and strongerthan MDA/epoxy GRP above 100°C. At all temperatures the phenolic based GRP wasfound to be less sensitive to temperature change than either of the epoxy based systems.
8. Sea water was found to be the most aggressive of the environments tested, reducing thestrength of all the materials at all temperatures. The strength reduction due to sea waterabsorption was approximately independent of temperature in MDA/epoxy GRP, butincreased with temperature in IPD/epoxy and phenolic GRPs.
Volume V: Textile Composites and Characterisation
V - 420
ACKNOWLEDGEMENTS
Thanks are due to the following sponsors of the Marinetech Research managed programme onThe Cost Effective Use of Fibre Reinforced Composites Offshore for their support and forpermission to publish this paper:
Admiralty Research Establishment, AGIP, Amerada Hess, Ameron bv, Amoco Research,Balmoral Group, BP Exploration, BP Research, Brasoil, British Gas, Bow Valley Petroleum,Ciba-Giegy, Conoco, Cray Valley Products, Dow Deutschland Inc, Elf (Aquitaine), Elf (UK),Enlchem spa, Exxon, Fibreforce Composites, Hunting Engineering plc, Kerr McGee Oil (UK)Ltd, MaTSU, Marine Technology Directorate Ltd, Mobil Research and Development, MobilNorth Sea Ltd, Norsk Hydro, PetroBras, Phillips Petroleum, Shell Expro, Statoil, Total OilMarine, UK Department of Energy, UK Ministry of Defence (Navy), UK Offshore SuppliesOffice, VSEL and Vosper Thornycroft. The programme involves the Universities ofNewcastle upon Tyne, Glasgow, Liverpool, Salford and UMIST.
REFERENCES
1. Hull D., An Introduction to Composite Materials, Cambridge University Press 1981
2. Morgan R.J., Structure-Property Relationships and the Environmental Sensitivity ofEpoxies, in: Developments in Reinforced Plastics - 1 (G. Pritchard - ed) Applied SciencePublishers, London, p211, (1980).
3. Ishida H., and Koenig J.L., Reinforcement Mechanism of Fiber-Glass Reinforced Plasticsunder Wet Conditions: a Review Polymer Engineering and Science, 18, (2), p128, (1978).
4. Carter H.G., and Kibler K.G., Langmuir-Type Model for Anomalous Moisture Diffusionin Composite Resins, Journal of Composite Materials, 12, p188, (1978).
5. Vinson J.R.(ed), Advanced Composite Materials - Environmental Effects, ASTM SpecialTechnical Publication 658, (1978).
6. Bunsell A.R., Hydrothermal Ageing of Composite Materials, Revue de L`InstitutFrancais du Petrole, 50, no1, (1995).

Proceedings of ICCM–11, Gold Coast, Australia, 14th-18th July 1997
V - 421
THE EFFECT OF THERMOPLASTIC ADDITIVESAND CARBON FIBRES ON THE THERMALLY
ENHANCED MOISTURE ABSORPTION BY EPOXYRESINS
James A. Hough, Frank R. Jones
Department of Engineering Materials, University of Sheffield, Mappin St, S1 3JD, UK
SUMMARY: The moisture absorption of the base resin, polyether sulphone (PES) modifiedblend and carbon fibre composite under isothermal and thermal spiking conditions has beenexamined. The addition of PES reduced proportionally the moisture in the isothermallyconditioned coupons but not for those thermally spiked. The maximum enhancementtemperature of 140°C, was a function of the base epoxy resin. A secondary relaxation peak(Tg2) developed at a significantly lower temperature than the main relaxation. For the PESmodified epoxy resin, thermal spiking did not reduce Tg2 below that for the isothermallyconditioned sample. However, in the presence of carbon fibres, Tg2 was sensitive to thermalspiking, indicating an interphasal component to the moisture mechanisms.
KEYWORDS: thermal spiking, moisture absorption, polyether sulphone, epoxy resin, carbonfibre composites
INTRODUCTION
Epoxy resins are the most common matrices for high performance carbon-fibre compositesbecause of the ease with which the curing process can be controlled. However they readilyabsorb moisture usually resulting in lower strength and softening temperature. Certainaircraft components can be exposed to temperatures in excess of 100°C for only a fewminutes [1]. Under conditions of rapid heating and cooling, the moisture absorption ofepoxy/carbon laminates can be increased significantly [2-4], over that for hygrothermalconditions. The mechanisms of enhanced moisture absorption as a result of a thermal spikeare unclear.
In this paper, the effect of the polyether sulphone (PES) thermoplastic modifier on thethermally enhanced moisture absorption of an epoxy resin system has been studied..
EXPERIMENTAL
MaterialsThe system chosen was the Fibredux 924 laminate system from Ciba Geigy. This is adiaminodiphenylsulphone cured TGDDM epoxy resin with added polyethersulphone (PES)thermoplastic. The manufacturer provided the base epoxy resin without added PES (924E),
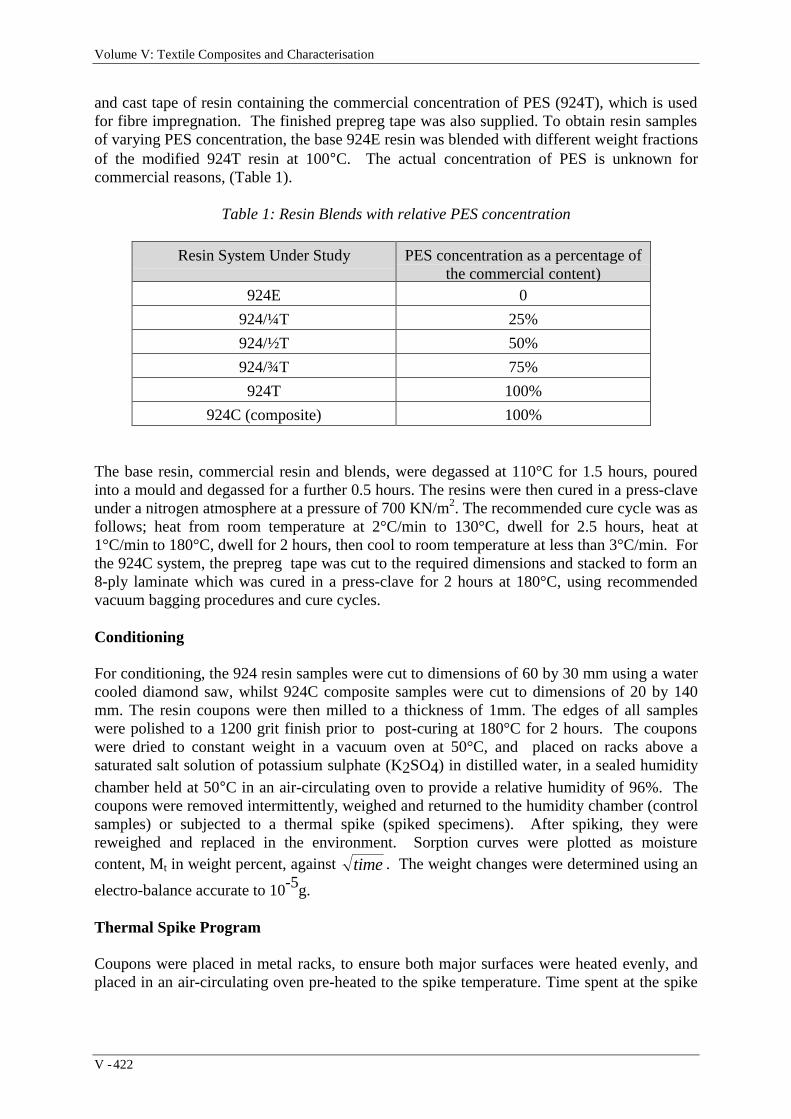
Volume V: Textile Composites and Characterisation
V - 422
and cast tape of resin containing the commercial concentration of PES (924T), which is usedfor fibre impregnation. The finished prepreg tape was also supplied. To obtain resin samplesof varying PES concentration, the base 924E resin was blended with different weight fractionsof the modified 924T resin at 100°C. The actual concentration of PES is unknown forcommercial reasons, (Table 1).
Table 1: Resin Blends with relative PES concentration
Resin System Under Study PES concentration as a percentage ofthe commercial content)
924E 0
924/¼T 25%
924/½T 50%
924/¾T 75%
924T 100%
924C (composite) 100%
The base resin, commercial resin and blends, were degassed at 110°C for 1.5 hours, pouredinto a mould and degassed for a further 0.5 hours. The resins were then cured in a press-claveunder a nitrogen atmosphere at a pressure of 700 KN/m2. The recommended cure cycle was asfollows; heat from room temperature at 2°C/min to 130°C, dwell for 2.5 hours, heat at1°C/min to 180°C, dwell for 2 hours, then cool to room temperature at less than 3°C/min. Forthe 924C system, the prepreg tape was cut to the required dimensions and stacked to form an8-ply laminate which was cured in a press-clave for 2 hours at 180°C, using recommendedvacuum bagging procedures and cure cycles.
Conditioning
For conditioning, the 924 resin samples were cut to dimensions of 60 by 30 mm using a watercooled diamond saw, whilst 924C composite samples were cut to dimensions of 20 by 140mm. The resin coupons were then milled to a thickness of 1mm. The edges of all sampleswere polished to a 1200 grit finish prior to post-curing at 180°C for 2 hours. The couponswere dried to constant weight in a vacuum oven at 50°C, and placed on racks above asaturated salt solution of potassium sulphate (K2SO4) in distilled water, in a sealed humiditychamber held at 50°C in an air-circulating oven to provide a relative humidity of 96%. Thecoupons were removed intermittently, weighed and returned to the humidity chamber (controlsamples) or subjected to a thermal spike (spiked specimens). After spiking, they werereweighed and replaced in the environment. Sorption curves were plotted as moisturecontent, Mt in weight percent, against time. The weight changes were determined using an
electro-balance accurate to 10-5g.
Thermal Spike Program
Coupons were placed in metal racks, to ensure both major surfaces were heated evenly, andplaced in an air-circulating oven pre-heated to the spike temperature. Time spent at the spike

Proceedings of ICCM–11, Gold Coast, Australia, 14th-18th July 1997
V - 423
temperature was calculated so that the specimen was maintained at this temperature for 1minute. Table 2 lists the spiking times for 924 8-ply laminates.
For consistency, the same spike times were used for the 1mm thick un-reinforced resinspecimens. The samples were and allowed to cool before replacement in the conditioningchambers.
Table 2: The time spent in the spike oven for samples spiked to between 100 and 200°C.
Thermal Spike Temperature (°C) Spike Time for O8 924 laminates andresin coupons (min.)
100 3.5
120 4
140 4.5
160 5
180 5.5
200 6
Thermomechanical Analysis
Dynamic Mechanical Thermal Analysis (DMTA) was performed in dual cantilever bendingmode using a Polymer Laboratories Mk II analyser. This allowed the effect of thermal spikingand enhanced moisture absorption on the viscoelastic properties, such as the glass transitiontemperature to be measured. Samples of dimensions 10 by 40 mm were cut from theconditioned specimens. For 924C samples, the fibres were at 90°C to the DMTA clamp faces.A frequency of 1Hz was used over a temperature of 50°C to 300°C.
RESULTS
Fig. 1 shows the moisture absorption curves for the 140°C spiked and control 08-924Ccoupons. For the 140°C spike curve, the peaks correspond to the moisture content prior to athermal spike , and the troughs correspond to the moisture content after a thermal spike.Moisture is lost during the thermal spike. For simplicity the moisture content after a thermalspike is omitted from subsequent plots of moisture absorption.
Figs. 2-4 show the moisture absorption curves for coupons of 924E resin, 924T epoxy/PESresin, and 924C composite respectively. These were subjected to 22 spikes to between 100°Cand 200°C, and 5000 hours conditioning.. The first 4 points on the curves are of the samevalue since the samples have not been spiked. Thus the fourth point on the curves representsthe moisture content prior to the first spike. It can be seen that spikes as low as 100°C result inan increased moisture concentration, in all three systems.

Volume V: Textile Composites and Characterisation
V - 424
The moisture concentration of the spiked samples exceeds that of the control samples after thefirst spike (i.e. the fifth point on the curves). Maximum moisture enhancement occurs insamples spiked to 140°C. Spiking above this temperature results in lower moisture absorption.After 5000 hours and 22 spikes, an equilibrium moisture content has not been reached for theresin systems, since moisture concentration is still increasing. This is also true of the unspikedcontrol resin specimens. The sorption curves for the 924C laminates show lower rates ofabsorption than their resin counterparts, however equilibrium is still not reached after 5000hours and 22 spikes. The highest rate of absorption was observed between the first andseventh spike for resin and composite coupons spiked to 160°C. After 12 spikes, the 140°Cspiked coupons absorb moisture at the highest rate.
0
1
2
3
0 20 40 60 80
140°C spikeisothermal/ 50°C
√Time/Thickness (√hours/mm)
Moi
stur
e C
onte
nt (
wt%
)
Fig.1: The effect of thermal spikes to 140°C on the moisture absorption of 924C-08 laminatesconditioned at 50°C/96% R.H
0
2
4
6
8
10
0 20 40 60 80
200°C180°C160°C140°C120°C100°Cisothermal/ 50°C
√Time/Thickness (√h/mm)
Moi
stu
re c
onte
nt
(wt%
)
0
2
4
6
8
10
0 20 40 60 80
√Time/Thickness (√h/mm)
Moi
stu
re c
onte
nt
(wt%
)
Fig.2: Moisture absorption curves for 924Eepoxy resin after 5000 hours conditioning &
22 thermal spikes
Fig.3: Moisture absorption curves for924T epoxy/PES resin after 5000 hoursconditioning & 22 thermal spikes. [See
Fig 2 for key]

Proceedings of ICCM–11, Gold Coast, Australia, 14th-18th July 1997
V - 425
Table 3 lists the final moisture contents of 924E, 924T resins, and 924C composite samplesafter 22 thermal spikes and over 5000 hours conditioning. Since moisture absorption is amatrix dominated property and the matrix volume fraction is approximately 35% of thecomposite, normalised values for the matrix moisture absorption in the 924C composite arealso presented. That is moisture contents are multiplied by 2.86, to calculate the moistureconcentration in the matrix alone. The normalised 924C value for moisture concentration inmatrix alone was 4.92 wt.%. The moisture concentration increases in the order924C<924T<924E, for each spike temperature. However, the normalised values for 924Csamples approximately equal those of the 924T resin alone. Thermal spikes to 140°C, themaximum moisture enhancement temperature, result in moisture concentrations of 9.66, 9.20,2.98 wt.% in the 924E, 924T and 924C systems respectively.
Table 3: Final moisture concentrations in 924E, 924T resins and 924C laminates
Moisture Content after 22 spikes & 5000 hours conditioning wt.%
Spike Temp(°C)
924E(no PES)
924T(with PES)
924C924C
(normalised)
isothermal/50 6.95 5.32 1.72 4.92
100 7.57 6.22 2.37 6.78
120 9.20 7.75 2.84 8.12
140 9.66 9.20 2.98 8.52
160 9.06 8.26 2.88 8.24
180 8.33 6.88 2.43 6.95
200 7.27 6.32 2.08 5.95
This represents an increase relative to the isothermal moisture concentrations, of 39% for the924E resin, and an increase of 73% for the 924T resin and 924C composite containing PES.Fig. 5 shows the moisture concentrations plotted as a function of spike temperature of all 3systems and the normalised matrix moisture concentration in the 924C laminates. It is seenthat a maximum moisture enhancement temperature exists at 140°C for all systems.
Under isothermal conditions the 924E base resin absorbed 6.95 wt.% moisture, while 924Ttoughened resin absorbed 5.32 wt.% moisture, and the 924C laminates absorbed 1.72 wt.%,which was the lowest moisture concentration.
Resin samples of differing PES content, as listed in Table 1, were conditioned for over 4000hours, and subjected to 18 thermal spikes to 140°C or 160°C. The absorption curves for thesesamples were similar in appearance to those for the isothermal 140°C and 160°C spiked 924Eand 924T resin specimens shown in Figs. 2 & 3. Table 4 lists the moisture concentrations
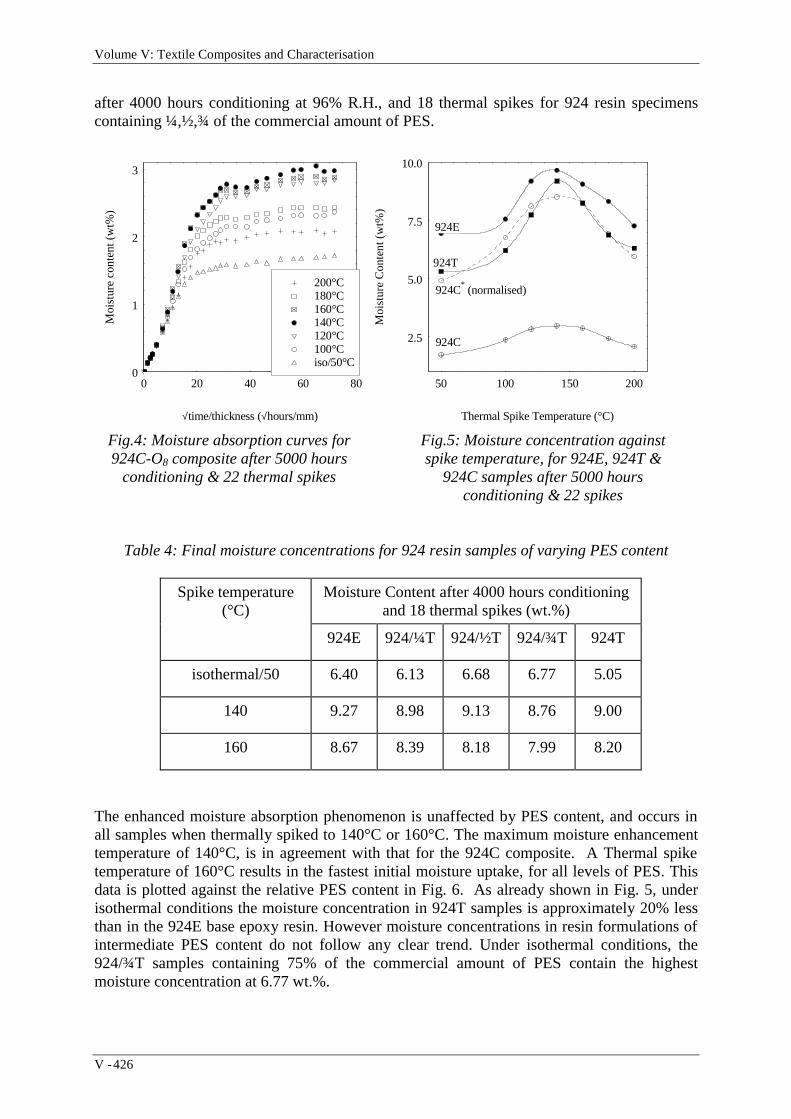
Volume V: Textile Composites and Characterisation
V - 426
after 4000 hours conditioning at 96% R.H., and 18 thermal spikes for 924 resin specimenscontaining ¼,½,¾ of the commercial amount of PES.
2.5
5.0
7.5
10.0
50 100 150 200
924C
924C* (normalised)
924T
924E
Thermal Spike Temperature (°C)
Moi
stur
e C
onte
nt (
wt%
)0
1
2
3
0 20 40 60 80
200°C180°C160°C140°C120°C100°Ciso/50°C
√time/thickness (√hours/mm)
Moi
stur
e c
onte
nt (
wt%
)
Table 4: Final moisture concentrations for 924 resin samples of varying PES content
Spike temperature(°C)
Moisture Content after 4000 hours conditioningand 18 thermal spikes (wt.%)
924E 924/¼T 924/½T 924/¾T 924T
isothermal/50 6.40 6.13 6.68 6.77 5.05
140 9.27 8.98 9.13 8.76 9.00
160 8.67 8.39 8.18 7.99 8.20
The enhanced moisture absorption phenomenon is unaffected by PES content, and occurs inall samples when thermally spiked to 140°C or 160°C. The maximum moisture enhancementtemperature of 140°C, is in agreement with that for the 924C composite. A Thermal spiketemperature of 160°C results in the fastest initial moisture uptake, for all levels of PES. Thisdata is plotted against the relative PES content in Fig. 6. As already shown in Fig. 5, underisothermal conditions the moisture concentration in 924T samples is approximately 20% lessthan in the 924E base epoxy resin. However moisture concentrations in resin formulations ofintermediate PES content do not follow any clear trend. Under isothermal conditions, the924/¾T samples containing 75% of the commercial amount of PES contain the highestmoisture concentration at 6.77 wt.%.
Fig.4: Moisture absorption curves for924C-O8 composite after 5000 hours
conditioning & 22 thermal spikes
Fig.5: Moisture concentration againstspike temperature, for 924E, 924T &
924C samples after 5000 hoursconditioning & 22 spikes

Proceedings of ICCM–11, Gold Coast, Australia, 14th-18th July 1997
V - 427
Figure 7, illustrates schematically the effect of thermal spiking and moisture absorption on theDMTA tanδ and storage modulus, log E’, curves for the resins and laminates. The tracesshown are for a dry as-cured sample, an isothermally conditioned sample, and a thermallyspiked sample. The primary tan δ peak, Tg1, which was observed for the as-cured/drysamples, fell slightly on isothermal moisture absorption. A secondary peak, Tg2, emerged inall wet specimens. This peak was least prominent for the 924E samples, compared to 924Tepoxy/PES samples. The intensity of the Tg2 peak was greatest and shifted to lowertemperatures in 924C laminates samples after moisture absorption and thermal spiking,relative to the two resin systems. It can be seen that the temperature at which the slope of thestorage modulus, log E’, curve begins to decrease rapidly, termed the glass transition onset,TgE’, is reduced on isothermal moisture absorption. This is further reduced when thelaminates are thermally spiked.
Fig. 8a) & b) plots of Tg1 and Tg2 for samples conditioned for over 5000 hours againstthermal spike temperature. It is seen that Tg1 for 924C laminates, is approximately 15° to20°C lower than for the 924E and 924T resin systems. Isothermal moisture absorption reducesTg1 by approximately 10°C for each system. Thermal spikes to 100°C further reduce Tg1 onlyslightly in the 924C and 924T samples to 239°C and 217°C respectively, but do not effect Tg1
in 924 samples which remains at approximately 240°C. Thermal spikes to 120°C and abovedo not significantly reduce Tg1 any further. For the dry systems, one relaxation peak wasobserved. However on isothermal moisture absorption a secondary relaxation peak, Tg2,emerges for all three systems, at a temperature between 174°C and 189°C. Thermal spikingto 100°C reduces Tg2 further by 22°C in 924 laminates, but is unaffected in the 924E and924T resin samples. Thermal spikes to 120°C and above does not reduce Tg2 further.
6
8
10
0.25 0.75
160°C spike140°C spikeisothermal/ 50°C
Weight fraction of 924T resin containing commercial amount of PES, to 924E base resin
Fin
al M
oist
ure
Con
tent
(w
t%)
Fig.6: Moisture content in 924 resin samples of differing PES content after 4000 hoursconditioning at 96% R.H., and 18 spikes

Volume V: Textile Composites and Characterisation
V - 428
Temperature
Ta
n δ
dry/ as curedisothermal /50°Cspiked
Temperature
stor
ag
e m
od
ulu
s, L
og E
'
Fig.7: Schematic illustration of the effect of moisture absorption and thermal spiking on theDMTA relaxation spectra, tan δ, and the storage modulus, log E’, in 924 systems
145
165
185
205
225
245
265
0 50 100 150 200
924E924T924C
Thermal Spike Temperature (°C)
Ta
n δ
Tg 1 p
ositi
ons
(°C
)
145
165
185
205
225
245
265
0 50 100 150 200
Thermal Spike Temperature (°C)
Ta
n δ
Tg 2 p
ositi
ons
(°C
)
Fig.8: Changes in DMTA a) primary and b) secondary tan δ peaks with thermal spiketemperature for 924E, 924T resin and 924C laminate systems
Fig. 9 shows how the glass transition onset temperature, TgE’, changes with thermal spiketemperature, for the three systems. It is seen that the dry/ as-cured TgE’ is 225°C for the 924Eresin, 201°C for the 924T resin, and 207°C for the 924C laminate. Isothermal absorption ofmoisture results in a TgE’ of 160°, 168° and 152°C for the 924E, 924T and 924C systemsrespectively. Thermal spikes to 100°C reduce TgE’ further in the 924T and 924C systems to153°C and 135°C respectively, whereas TgE’ for the 924E base epoxy is relatively unaffected.Thermal spikes to 120°C and above reduce TgE’ of 924C to a minimum of 129°C, 20°C lowerthan the TgE’ of both resin systems which are unaffected.

Proceedings of ICCM–11, Gold Coast, Australia, 14th-18th July 1997
V - 429
150
200
0 50 100 150 200
924E924T924C
Thermal Spike Temperature (°C)
Sto
rage
mod
ulu
s G
lass
Tra
nsiti
on O
nse
t
Fig.9: Changes in glass transition onset temperature, TgE’, with thermal spike temperature in924E, 924T resin and 924C composite systems
DISCUSSION
The absorption curves shown in Figs. 2-4, are non-Fickian for all 3 systems. That is anequilibrium moisture content is not reached, and the initial linear region does not account for60% of the total moisture absorbed. The addition of PES to the base epoxy resin, reduces theconcentration of moisture absorbed under isothermal conditions by approximately 20%. Theweight fraction of PES in the 924T commercial resin is considered to be approximately 18wt.%, hence this can be explained simply by the lower moisture absorption of the PEScomponent. The addition of carbon fibres, reduces the moisture concentration by a further65%. As shown in Fig. 5 the moisture concentration in 924C laminates when normalised tothe volume fraction of matrix, are close to that of the 924T resin-only samples. Thermalspiking results in an increased moisture concentration for all three systems. The 924E baseepoxy samples absorbed the most moisture, where the 924T resin and normalised 924Ccomposite values were approximately equal. Suggesting that the addition of carbon fibres hasa minimal effect on the enhanced moisture absorption phenomena. At the maximum moistureenhancement temperature of 140°C, the moisture concentration is increased by approximately40% in the 924E samples. In the 924T samples, the increase was 73%, to a concentrationclose to that of the 924E base epoxy system. Normalised data for the 924C composite showeda 73% increase to similar values. This implies that the addition of PES to the base epoxyreduces the amount of moisture absorbed under isothermal conditions, but when thermallyspiked to 140°C, the difference is less prominent..
Fig. 5 shows that the enhanced moisture absorption is greatest for the base epoxy resin, andthat the addition of PES and reinforcing carbon fibres does not affect this significantly.Microscopic examination of the spiked samples did not show any significant damage such asmicrocracks, voids or delaminations in the composite, confirming that the additional moisturemust reside in the polymer network on a molecular level [5]. Analysis of absorption curvesfor the resin samples with intermediate PES content, show that changing the weight fractionof PES does not alter the enhanced moisture absorption phenomena, and that the maximum

Volume V: Textile Composites and Characterisation
V - 430
moisture enhancement spike temperature remains at 140°C (Fig.6). Specimens spiked to thistemperature contained between 30 to 45% more moisture than the isothermally conditionedspecimens. However the moisture concentration did not decrease significantly with increasingPES content. Since this is an assumption behind the blending technology it is clear that themaximum moisture content after thermal spiking is not a simple dilution of the most moisturesensitive component. However the mixing procedure employed in the laboratory may differfrom that used commercially so that the homogeneity of the cured resin-blends may differfrom the commercial systems. Thus the re-distribution of unoccupied volume into freevolume of molecular size and microvoids of larger dimensions could be affected.
In Fig. 7 it is seen that the secondary relaxation peak Tg2 is most sensitive to thermallyenhanced moisture absorption. This suggests that the water may plasticise one component inthe polymer network more efficiently. Water present in a polymer network is oftenconsidered to be present in the free volume where it interrupts the attractive forces actingbetween polar structures in the network [6], leading to plasticisation. Thus at high moistureconcentrations a greater depression of Tg is predicted. This is true for isothermal absorption.However moisture absorbed through thermal spiking does not appear to plasticise the polymerfurther. It is evident from Fig.8b that the addition of PES to the base epoxy results in a largerreduction in Tg2 on moisture absorption. The implication of this result is that the PES phasemodifies the susceptibility of the epoxy resin network to plasticisation by water. However, analternative explanation could revolve around the dimensions of the unoccupied volume. It isalso evident that the addition of carbon fibres reduces Tg1 and Tg2 even further. The reasonsfor this are not clear, but one possible cause may be the presence of a sizing resin on the fibreswhich is usually epoxy based, and may combine with the matrix resin to form a cured regionof lower glass transition temperature (i.e. an interphase).
CONCLUSIONS
The enhanced moisture absorption which results from thermal spiking is shown to be afunction of the epoxy resin. Thermal spiking of 924E epoxy-only resin, epoxy/PES resin and924C laminates conditioned in humid environments, increased the rates and concentrations ofmoisture absorbed. Maximum moisture enhancement occurs at a spike temperature of 140°C.The addition of the thermoplastic PES and carbon fibres to the epoxy matrix reduced the totalmoisture absorbed under isothermal conditions. However, the enhanced moisture absorptionwas unaffected under thermal spiking. A secondary relaxation peak appears in the Tan δcurves for the wet resin and composites. Tg2 appears at the lowest temperature and withgreatest intensity for the composite. The non-modified base epoxy resin was the leastsusceptible. Thus the addition of PES and carbon fibres appears to increase the susceptibilityof the bulk resin to plasticisation under isothermal conditions. The extra moisture absorbed asa result of thermal spiking does not shift this secondary peak to lower temperatures. Themoisture is resident in the polymer network, rather than in thermally induced voids ormicrocracks. Moisture can be accommodated in the free volume of a polymer network, wherethe interactions between polar groups are displaced. This results in a reduction in glasstransition temperature. However this study indicates that the extra moisture as a result ofthermal spiking does not plasticise the polymer material in this manner. The enhancedmoisture absorption in thermally spiked epoxy resins is unaffected by the addition of the PESmodifier. Only the total moisture absorbed is affected. The softening point of 924C laminatesis reduced by thermal spikes of 100°C and above to well within the ‘Hot/Wet’ maximumservice temperature stated by the manufacturers.

Proceedings of ICCM–11, Gold Coast, Australia, 14th-18th July 1997
V - 431
ACKNOWLEDGEMENTS
We are indebted to DRA, Farnborough for financial support, Ciba Geigy plc, Duxford for theresins.
REFERENCES
1. Whiteside, J.B., DeIasi, R.J., Schulte, R.L., “Distribution of Absorbed Moisture inGraphite/Epoxy laminates After Real-time Environmental Cycling”, Long-term Behaviourof Composites, ASTM STP 813, K. O’Brien, Ed., American Society for Testing Materials,Philadelphia, 1983, pp. 192-205.
2. Clark, G., Saunders, D.S., van Blaricum, T.J., Richmond, M., “Moisture Absorption inGraphite/Epoxy Laminates”, Composites Science and Technology, vol. 39,1990, pp.355-375.
3. Adamson, M.J., “A Conceptual Model of the Thermal-Spike Mechanism inGraphite/Epoxy Laminates”, Long-term Behaviour of Composites, ASTM STP 813, K.O’Brien, Ed., American Society for Testing Materials, Philadelphia, 1983, pp. 192-205.
4. Xiang, Z.D., Jones, F.R., “Thermal Spike Induced Enhanced Moisture Absorption byPolymer Matrix Carbon Fibre Composites”, submitted to Composites Science andTechnology.
5. Hough, J.A., Xiang, Z.D., Jones F.R., “The effect of thermal spiking and resultantenhanced moisture absorption on the mechanical and viscoelastic properties of carbon fibrereinforced epoxy laminates”, Conference Proceedings of Experimental Techniques andDesign in Composite Materials/3, Cagliari, Italy, October 1996. in press.
6. Lee, M.C., Peppas, N.A., “Water Transport in Graphite/Epoxy Composites”, Journal ofApplied Polymer Science, vol.47, 1993, pp. 1349-1359.

Volume V: Textile Composites and Characterisation
V - 432
MODELLING OF ENVIRONMENTALLY INDUCEDDAMAGE IN POLYMER MATRIX COMPOSITES
Bethany J. Foch and Hugh L. McManus
Department of Aeronautics and Astronautics, Massachusetts Institute of Technology77 Massachusetts Ave, Cambridge, MA 02139
SUMMARY: An investigation has been performed into the behavior of composite laminatesexposed to severe environmental conditions. Given material properties, laminate geometryand specified cyclical thermal and moisture environments, a model predicts absorbedmoisture, chemical degradation, and stresses in the laminate as functions of position and time.A simplified solution allows very efficient calculations for large numbers of complex thermaland moisture cycles. Cases relevant to the proposed High Speed Civil Transport show twotypes of moisture absorption behavior: rapid fluctuation of levels near the surface, and gradualsettling to an easily computed equilibrium value in the interior. Chemical degradation is(based on preliminary, parametric calculations) shown to be a concern for surface plies.Stress levels due to these effects will enhance damage in surface plies. Stress effects do notfully account for observed moisture induced damage, suggesting material property changes orenhanced cracking mechanisms.
KEYWORDS : moisture, degradation, analysis, cyclic exposure, environmental effects,hygral stresses, thermal stresses, damage
INTRODUCTION
Aircraft systems such as the proposed High Speed Civil Transport (HSCT) experience severecyclic environments during normal operations. Aircraft skins reach extreme temperatures dueto high vehicle speeds; diffusion of moisture and oxygen into the material is accelerated bythese temperatures; these in turn can cause property changes and/or permanent materialdegradation. An example exposure cycle with time-dependent temperature and moisturelevels is shown below. This is a test cycle; similar cycles may be repeated over 20,000 timesin an aircraft lifetime. Under such conditions, thermal, hygral, and chemical degradationeffects result in a complex and time-varying stress profile over the course of manyexperimental or use cycles.
A set of models and computer codes has been developed to aid in the calculation of severeenvironmental effects. Using as inputs ambient temperature, relative humidity (RH), oxidativeenvironment, material properties and laminate geometry, the codes predict the material state,degraded properties, and resulting stress state as functions of position and time.

Proceedings of ICCM–11, Gold Coast, Australia, 14th-18th July 1997
V - 433
Fig. 1: Sample environmental test profile
BACKGROUND
The influence of environmental effects on composite structures has received a great deal ofattention in the literature. Investigators have attempted to decouple temperature, moisture andchemical effects [1-5] as well as analyze the interactions during combined exposure [6-11].
A good development of the behavior of a substance diffusing into another is given by Crank[12] and expanded by Springer [2] and Tsai and Hahn [3]. For a limited range ofenvironmental conditions, moisture sorption follows Fickian behavior. Moisture sorption into a laminate has a much slower diffusion rate than does temperature (~106 times slower). Forthis reason the laminate response to temperature change is often considered instantaneous andconstant across a laminate's thickness. Theories have been developed to account for thecoupled distributions of moisture and temperature [13]. Several mathematical formulationshave been developed in order to simplify the calculations required for predicting moisturesorption. Springer's "W8GAIN" model was developed in 1981 in order to predict thedistribution of moisture and temperature in a laminate exposed to wet conditions [14], andWeitsman developed a code (also in 1981) that searched for the most efficient calculation formoisture sorption in a laminate over time periods with fluctuating ambient conditions [7].
Chemical changes in composite materials attributed to environmental exposure are less wellunderstood than moisture effects. Several distinguishing characteristics mark chemicaldegradation: discoloration and embrittlement of the surface; weight loss; decrease of materialstrength; and microcracking. Recently, much work has been done to characterize thereactions occurring in the polymer in an attempt to understand these changes [4,5,15].
Calculations of stresses resulting from temperature, moisture, and degradation states in thematerial is common in the literature via micromechanics and composite laminated platetheory (CLPT). Tensile residual stresses that are inherent in general composite laminatesafter cool-down from cure temperature (due to ply coefficient of thermal expansionmismatch) may be at least partially relieved by moisture-induced stresses (resulting fromswelling of the laminate) [16]. Chemical degradation adds complexity, altering the materialproperties at the exposed surface. The potential for microcracking damage is high during

Volume V: Textile Composites and Characterisation
V - 434
cyclic environmental exposure [17-19,9]. Microcracking has been seen to increase thediffusion rate of moisture [20,21,6] resulting in non-Fickian sorption behavior.
MODEL DEVELOPMENT
A code was developed in order to characterize the state of a material exposed cyclically in airto an environmental profile in which temperature and moisture vary with time. User definedinputs include this profile, relevant material properties, laminate geometry and number ofcycles.
It is assumed that an infinite plate is exposed to uniform environmental conditioning on its topand bottom surfaces (z=0 and z=h). Diffusion is assumed to be one-dimensional through thethickness (the z direction). Temperature is constant through the thickness, and instantaneouslyequal to the time-varying ambient temperature.
Moisture Sorption
It is assumed that moisture and oxygen diffuse into the material following a one-dimensionalFickian law. Outlined below is the development for moisture; the reasoning for oxygendiffusion is similar. Fick's Law is given by:
0 C0t
= D0
2C
0z2(1)
where C is the concentration of moisture in the laminate, z is the through thickness direction,and D is the diffusion rate. The diffusion rate is dependent on the diffusion constant, D0,activation energy, EA, gas constant, R, and absolute temperature, T [12]:
Initial and boundary are required to solve Eqn 1. These are given below:
for t < 0 C(z) = C0(z) (3)for t > 0 C(0) = C∞(t) , C(h) = C∞(t) (4)
The value C0(z) is simply the initial state of moisture through the laminate. The quantity C_(t)represents the concentration at the surface. At every instant of exposure, the surface of thelaminate is assumed to be saturated at the level corresponding to the current atmosphericrelative humidity. Saturation level is a function of relative humidity, Φ, and materialconstants a and B, which must be determined empirically [2].
C∞ = a(Φ )B
(5)

Proceedings of ICCM–11, Gold Coast, Australia, 14th-18th July 1997
V - 435
An efficient solution to the above problem is needed to compute moisture and oxygen levelsin structures undergoing large numbers of complex thermal and environmental profiles. Here,profiles including relative humidities that remain constant over specified lengths of time (Fig.2a) and temperatures that remain constant or change at a constant rate (Fig. 2b) areconsidered. Such profiles can be repeated an arbitrary number of times.
RH
timet 1 t
2 t 3 t
4 t 0
Φ 2
Φ 3
Φ 1
Temp
timet 1 t
2 t 3 t
4 t 0
T 1
T 2
T 3
Fig. 2a: Possible moisture profile Fig. 2b: Possible temperature profile
A modal solution of Eqn 1 in the time interval starting at ti-1 is:
where the change in time ∆t = t - ti-1, and C_i is calculated from Φi using Eqn 5. In Eqn 6, Ani
represents the amplitude of each mode calculated from the concentration at time ti-1, and n isthe index of each mode. In order to find the first set of modal amplitudes from the initialconditions, we make use of a Fourier series expansion [22].
where the subscript 1 represents values at the first time step (i =1). We can therefore performthe first set of calculations for Ani, and use these values in Eqn 6 to find the concentrationlevels, C(z,t). In order to calculate subsequent modal amplitudes, An(i+1), and thus newconcentrations, we substitute C(z,ti) (from Eqn 6) for C0(z), and C_ (i+1) for C_1, in Eqn 7,simplify, integrate, and exploit the orthogonality of the sine function to get the general form:
where ∆ti = ti - ti -1. For the geometry of interest only odd values of n need to be calculated.This form is useful in that it does not require the evaluation of integrals of the form of Eqn 7except at the initial time step.

Volume V: Textile Composites and Characterisation
V - 436
The previous development is appropriate for periods of constant temperature, as the moisturediffusivity, D, is constant, and can be calculated via Eqn 2. For the segments with changingtemperatures, however, this calculation is complicated by the time dependence oftemperature. The resulting variation in D invalidates the solutions above. This problem issolved by substituting Eqn 2 into Eqn 6 and defining a modified time step, ∆t*. This yields anequation for the calculation of the current moisture concentration during a temperature ramp:
This allows easy calculation of moisture concentrations for each segment. The coefficientsAni are found by progressive application of Eqn 12, and then the concentration at any time canbe found from Eqn. 9. The calculations are repeated for as many cycles as needed.
Oxidative Degradation
The same scheme outlined above is used to calculate the diffusion of oxygen into thelaminate. Once the local oxygen concentration is calculated, both thermal and oxidativereactions altering the polymer structure in the laminate are calculated via the method outlinedby Cunningham and McManus [15]. The resulting output is in the form of a dimensionlessmetric, b, of the reaction process that is related to material mass loss. This metric is referredto below as the level of completeness of the reaction, reaching a value of one when all of theavailable material has been chemically degraded.
Stress Predictions
Varying thermal conditions, absorbed moisture, and chemical degradation of the material allaffect the stress state in the structure. The resulting stress state in the laminate can becomputed by including the environmental effects in a constitutive equation [24]:
σ ij = E ijkl ( T , C , b ) ε kl − α kl∆ T − β kl∆ C − χ klb [ ] (13)
In Eqn 13, Young's modulus, E, is dependent on the current temperature, T, the moistureconcentration, C, and the chemical state, b. The coefficients of thermal and moistureexpansion (α and β respectively) determine material expansion due to changes intemperature, ∆T, from the stress free temperature, T0 , and changes in moisture level from the

Proceedings of ICCM–11, Gold Coast, Australia, 14th-18th July 1997
V - 437
dry condition. The degradative effects are treated in much the same way, with χ representingthe coefficients of degradation induced expansion or shrinkage. This equation can be used inconjunction with composite laminate plate theory (CLPT) to determine stresses in each ply.An available code capable of handling all of the above effects, a modification of theIntegrated Composites Analyzer (ICAN) [24], was used to do these calculations.
ANALYSIS
Material properties for IM7/PETI-5 were supplied by the Boeing Company and McDonnellDouglas Aircraft [23]. Properties relating to moisture and oxygen diffusivity wereapproximated from values of similar materials (primarily C6000/PMR-15). Calculations weredone using values from Table 1, along with oxygen diffusion and reaction values from [15].
Table 1: Properties used
E11
GPa(ksi)
E22
GPa(ksi)
G12
GPa(ksi)
ν12 GIC
J/m2
(Btu/in2)
ρkg/m3
(lb/in3)
Xt
MPa(ksi)
Xc
MPa(ksi)
Yt
MPa(ksi)
Yc
MPa(ksi)
SMPa(ksi)
157.3(22.8)
9.7(1.4)
4.20(0.6)
0.33
1000(6x10⁻⁴)
1600(0.06)
2160(310)
1560(230)
70(10)
150(22)
80(12)
α11
µε/Kα22
µε/Kk1
W/m2Kk2
W/m2KDo
mm2/sEA
kJ/mola B To
(°F)-0.7 36.9 8.65 0.35 0.8 42 0.018 1 600
Results of some sample runs of the codes, using the material described above, in sixteen plylaminates of unidirectional ([0]16) or quasi-isotropic ([0/±45/90]2s) lay-up, exposed to up to5000 of the cycles shown in Fig. 1, are depicted in the following figures. Moisture levels aregiven as fractions of dry weights, which reach a maximum at 0.0153 (1.53%) for a RH levelof 85% (see Eqn 5). The initial moisture condition is specified as either dry (C0 = 0) orsaturated at 85% RH (C0 = 0.0153).
RESULTS
Results are presented in terms of time histories at specific locations, or profiles at specifictimes. Times are specified by cycles elapsed, and select times within a cycle are noted by thedesignations tA, tB, and tC from Fig. 1.
Cyclic moisture exposure causes two types of response under the conditions studied. The firstis vacillation of the moisture at the surface (shown in both Figures 3a and 3b). The first time,tA, designates the time just after cold, dry exposure. Due to the dry atmosphere, the very edgeof the laminate dries out. However, little moisture diffuses out at this low temperature in thegiven amount of time. The hot, dry exposure just before tB allows moisture near the surfaceto dry almost completely. The tC marker designates the period just after the warm, wetexposure, when the surface is saturated. Comparison of Figures 3a and 3b shows thatmoisture level fluctuation near the surface continues relatively unchanged with each cycle.The second type of response is the slow soak of moisture in towards the center of the

Volume V: Textile Composites and Characterisation
V - 438
laminate. This internal behavior does not respond to the cycling; instead, we can observe agradual change from cycle 2 (Fig. 3a) to cycle 100 (Fig. 3b).
Figure 4 shows a different perspective on these effects. Full time histories at different pointsin the material are shown. At the edge of the laminate, oscillations of the moisture is evident.The sharp rises and falls in moisture levels at the edges are a result of the boundary conditiondefined earlier: the surface is always saturated at the current ambient humidity. At one plythickness into the laminate, there are significant fluctuations in moisture level throughout eachcycle. At the center of the laminate, the slow change of moisture level can be seen.
Fig. 3: Snapshot of moisture levels at points in cycle 2 (a) and cycle 100 (b)
In Fig. 5, the slow change in the center of the laminate over many cycles is shown moreclearly. Experimental values based on weight change measurements during hygrothermalcycles are from reference [23]. The moisture content equilibrates at some non-zero level.Plots of the through-thickness moisture levels at distinct points in many cycles show this sametrend. Figure 6 shows concentration profiles at time tB in a 16 ply laminate over the course of100 cycles for two different initial conditions.
Fig. 4: Moisture fluctuations at various points in laminate
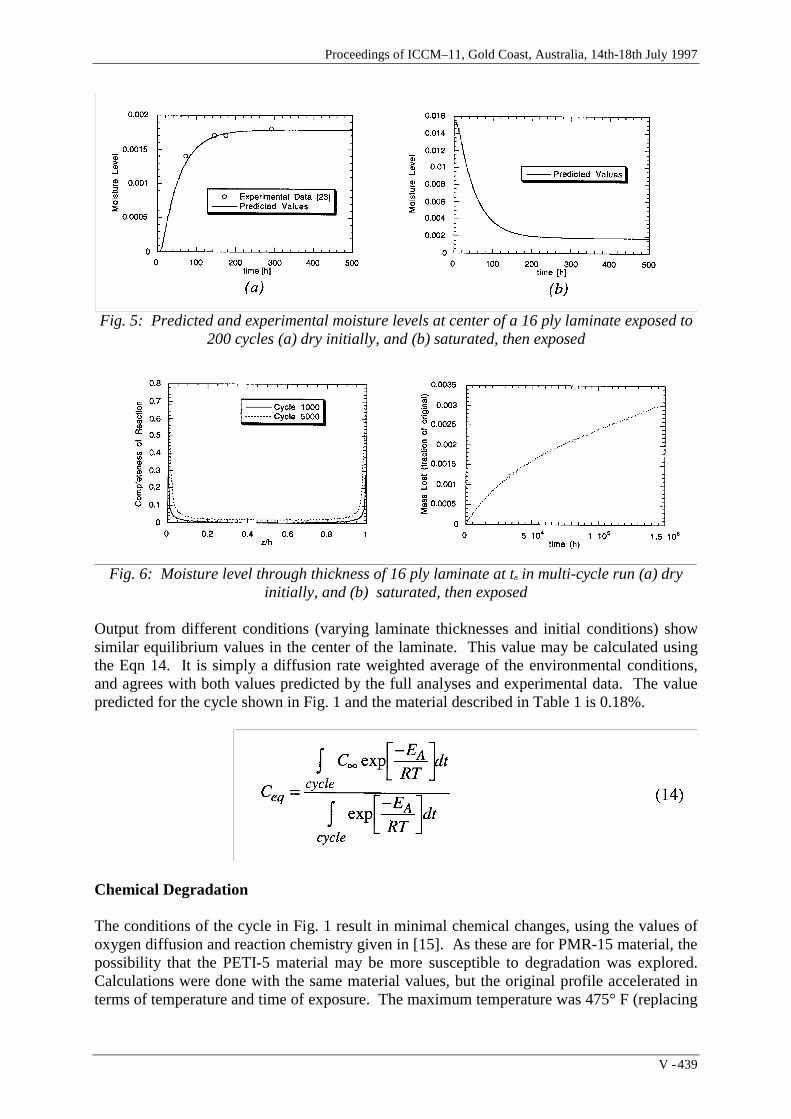
Proceedings of ICCM–11, Gold Coast, Australia, 14th-18th July 1997
V - 439
Fig. 5: Predicted and experimental moisture levels at center of a 16 ply laminate exposed to200 cycles (a) dry initially, and (b) saturated, then exposed
Fig. 6: Moisture level through thickness of 16 ply laminate at tB in multi-cycle run (a) dryinitially, and (b) saturated, then exposed
Output from different conditions (varying laminate thicknesses and initial conditions) showsimilar equilibrium values in the center of the laminate. This value may be calculated usingthe Eqn 14. It is simply a diffusion rate weighted average of the environmental conditions,and agrees with both values predicted by the full analyses and experimental data. The valuepredicted for the cycle shown in Fig. 1 and the material described in Table 1 is 0.18%.
Chemical Degradation
The conditions of the cycle in Fig. 1 result in minimal chemical changes, using the values ofoxygen diffusion and reaction chemistry given in [15]. As these are for PMR-15 material, thepossibility that the PETI-5 material may be more susceptible to degradation was explored.Calculations were done with the same material values, but the original profile accelerated interms of temperature and time of exposure. The maximum temperature was 475° F (replacing

Volume V: Textile Composites and Characterisation
V - 440
the 350° F segment in the cycle in Fig. 1), which was held for 2.5 hours (compared with 30minutes in the original). When the model was run simulating a 5000 cycle exposure, thedegradation shown in Figures 7 and 8 resulted. After one thousand cycles, there is non-trivialdegradation occurring at the surface. Such degradation is observed as a visible surface layer.This layer has been seen to correspond with altered material properties [4,5]. After as manyas five thousand cycles, the degradation has begun to grow toward the interior of the laminate.
Fig. 7: Completeness of reactions in 8 plylaminate exposed to an extreme cycle
Fig. 8: Total mass lost in laminate over5000 cycles
Stress States
Calculated stresses are shown as functions of position through the laminate under variousconditions. Only the stresses locally perpendicular to the fibers are shown as these are thestresses primarily responsible for microcracking. The matrix materials proposed for thisproject have very high cure temperatures, resulting in large thermal stresses in the quasi-isotropic ([0/±45/90]2s) laminates. Thermal stresses resulting from the profile depicted in Fig.1 range from approximately 3 ksi to 10 ksi.
In Fig. 9, stresses due solely to moisture sorption are shown. This laminate has been left in awet environment long enough to reach saturation, and subsequently cycled. As it begins thecycle, the external plies dry out first. The notable result of the hygral stresses in this exampleis the large gradient between the outer plies (loaded in tension) and the internal plies (loadedin compression). Figure 10 shows the stress field due to degradation at five thousand of thehigher temperature, extended time cycles. Stresses reach large tensile values near the surface.

Proceedings of ICCM–11, Gold Coast, Australia, 14th-18th July 1997
V - 441
CONCLUSIONS
A computationally efficient model has been developed for computing the response ofcomposite laminates to hygro-thermal cycling. This model predicts two significant effects ofcyclic moisture absorption: large fluctuations in absorbed moisture level at the materialsurface due to changing ambient conditions; and a slow increase in the interior of the laminateto an equilibrium level. This equilibrium level can be calculated easily using a simpletemperature-weighted average of the environmental conditions. The moisture absorptionresults agree with experimentally measured moisture gains.
Sample problems suggest that the environmentally-induced stress state is determinedprimarily by thermal stresses. If degradation takes place, it will result in significantlyenhanced stresses near the surface. This could explain the surface microcracking observed innumerous studies [4,5,11,13,15,18,19]. The moisture stresses, though smaller in magnitude,are non-trivial and can induce stress gradients through the thickness. The worst case hygralstresses are on the same order of magnitude as the thermal stresses. In particular, moisturestresses can be severe in unidirectional laminates undergoing dry-out from a saturatedcondition. The computed stresses do not fully explain the increased cracking observed underexposure to moisture [6,8,10,17,18,20], suggesting that there are mechanisms for moisture-induced cracking beyond moisture-induced stresses. The presence of moisture in the laminatecould cause temporary or permanent changes in material properties, in particular thetransverse fracture toughness, or it could enhance the cracking mechanisms in ways not yetunderstood.
ACKNOWLEDGMENTS
This work was supported by the Boeing Company, under Contract FO 563289 07LLN.
REFERENCES
1. Shen, C.H. and G.S. Springer, "Moisture Absorption and Desorption of CompositeMaterials," J. Composite Materials, Vol. 10, No. 1, 1976, pp. 2-20.
2. Springer, G.S., "Environmental Effects," Composites Design, 4th Ed., S. Tsai, ed., ThinkComposites, Dayton, Ohio, 1988, pp. 16-1 to 16-18.
3. Tsai, S.W, and H.T. Hahn, Introduction to Composite Materials, Technomic Publishing,Lancaster PA, 1980.
4. Bowles, K.J., "A Thermally Modified Polymer Matrix Composite Material withStructural Integrity to 371°C," Proceedings Twentieth SAMPE Technical Conference,Minneapolis, MN, Sept, 1988.
5. Roberts, G.D. and R.D. Vannucci, "Effect of Solution Concentration and AgingConditions on PMR-15 Resins," SAMPE Journal, Mar/Apr 1986, pp. 24-28.

Volume V: Textile Composites and Characterisation
V - 442
6. Burcham, L.J., M.R. VanLandingham, R.F. Eduljee, and J.W. Gillespie, "MoistureEffects on the Material Behavior of Graphite Polyimide Composites," Proceedings NinthInternational conference on Composite Materials, Newark, DE, Sept, 1994.
7. Weitsman, Y. "A Rapidly Convergent Scheme to Compute Moisture Profiles inComposite Materials under Fluctuating Ambient Conditions," J. Composite Materials,Vol. 15, No. 7, 1981, pp. 349-358.
8. Beckwith, S.W. and B.D. Wallace, "Effects of Aging and Environmental Conditions onKevlar/Epoxy Composites," SAMPE Quarterly, Vol. 14, No.6, July, 1983.
9. Upadhyay, P.C. and J. Prucz, "Parametric Damage Modeling of Composites due toMoisture Absorption," J. of Reinforced Plastics and Composites, Vol. 11, 1992, pp. 198-210.
10. Whiteside, J.B., R.J. DeIasi, and R.L. Schulte, "Distribution of Absorbed Moisture inGraphite/Epoxy Laminates After Real-Time Environmental Cycling," Long TermBehavior of Composites, ASTM STP 813, O'Brien, T.K., Ed., American Society forTesting and Materials, Philadelphia, 1983, pp. 192-205.
11. Ming, L, "The Environmental Effects of Carbon Fiber Reinforced PolyethersulphoneComposites," Proceedings Tenth International Conference on Composite Materials,Whistler, B.C., Canada, August, 1995, pp. 297-303.
12. Crank, J., The Mathematics of Diffusion, 2nd Ed., Clarendon Press, Oxford, England,1975.
13. Chang, W-J., T-C. Chen, and C.-I. Weng, "Transient Hygrothermal Stresses in anInfinitely Long Annular Cylinder," J. of Thermal Stresses, Vol. 14, 1991, pp. 439-454.
14. Springer, G.S. Environmental Effects on Composite Materials, Technomic Publishing,Lancaster, PA, Vols.1 and 2, 1981.
15. Cunningham, R. and McManus, H., "Coupled Diffusion-Reaction Models for Predictingthe Distribution of Degradation in Polymer Matrix Composites," Presented at the 1996ASME International Mechanical Engineering Congress and Exposition Atlanta, GA, Nov.1996.
16. Chamis, C.C., "Simplified Composite Micromechanics Equations for Hygral, Thermaland Mechanical Properties," SAMPE Quarterly, April, 1984, pp. 14-23.
17. Mandell, J.F., "Origin of Moisture Effects on Crack Propagation in Composites," Dept.of Materials Science and Engineering Research Report R77-4, Massachusetts Institute ofTechnology, Dec. 1977.
18. Martin, R.H., E.J. Siochi and T.S. Gates, "Isothermal Aging of IM7/8320 and IM7/5260,"Presented at the 7th Technical Conference on Composite Materials, The PennsylvaniaState University, University Park, PA, October, 1992.

Proceedings of ICCM–11, Gold Coast, Australia, 14th-18th July 1997
V - 443
19. Chester, R.J, and A.A. Baker, "Environmental Durability of F/A-18 Gr/Ep Composites,"Proceedings Tenth International Conference on Composite Materials, Whistler, B.C.,Canada, August, 1995, pp. 239-246.
20. Lucas, J.P. and J. Zhou, "Moisture Interaction Characteristics and Fracture in PolymerComposites," Proceedings Tenth International Conference on Composite Materials,Whistler, B.C., Canada, August, 1995, pp. 247-256.
21. Cai, L.-W. and Y. Weitsman, "Non-Fickian Moisture Diffusion in PolymericComposites," J. Composite Materials, Vol. 28, No.2, 1994, pp. 130-154.
22. Hildebrand, F.B. Advanced Calculus for Applications, Englewood Cliffs, N.J.: Prentice-Hall, 1976.
23. Zabora, R. Personal correspondence, July and September, 1996.
24. McManus, H.L. and C. Chamis, "Stress and Damage in Polymer Matrix CompositeMaterials Due to Material Degradation at High Temperatures," NASA TM 4682, January,1996.

Volume V: Textile Composites and Characterisation
V - 444
EXPERIMENTAL STUDIES ON COMPOSITEBONDED JOINTS
Steven L. Donaldson 1 and Ajit K. Roy 2
1 WL/MLBM, Bldg. 654, 2941 P St. Ste. 1, Wright-Patterson AFB, OH 45433-7750 USA2 University of Dayton Research Institute, 300 College Park Ave., Dayton, OH 45469 USA
SUMMARY: The double lap shear specimen is examined in detail to serve as a baseline forfurther research on the behavior of composite to composite adhesive bonded joints. Fourlaminate surface preparation techniques were examined in detail. The four are a simpleacetone wash, hand sanding, surface grinding, and grit blasting. A comparison is madebetween the 3D stress analysis and the experiments using small strain gages placed in regionsof high strain gradients. The results match well except in the region precisely at the corner ofthe adherends where stress singularities occur. The damage propagation modes wereobserved and characterized. Failure within the composite was the general mode of failure,resulting in final ultimate strengths which did not appear to be sensitive to the surfacepreparation method.
KEYWORDS: adhesive, bonding, failure modes, surface preparation, double lap joint,3501-6, FM-300
INTRODUCTION
An understanding of the behavior of bonded joints has become increasingly important to theU. S. Air Force. This is primarily for two reasons: first, the use of composite materials in AirForce aircraft has been increasing dramatically over the past decade, and with the futureintroduction of aircraft with higher percentages of highly loaded primary compositestructures, the need to repair these structures is critical. It is envisioned that many of therepairs will require adhesively bonded scarf joints. The second primary reason for therenewed interest in bonded structure is that many of the future concepts for low costcomposite structures entail large, highly unitized structures, for which adhesively bondedjoints may play a large role. For both of these applications, an understanding of the long-termperformance of the joints under repeat mechanical and environmental (primarily moisture andtemperature) loading is required.
The long range objective of the overall program, then, is to develop analysis methods for theaccurate prediction of failure in composite bonded joints. It is envisioned that this effort willentail many components, including fully three dimensional stress analysis, testing andcharacterization of failure, the extension or development of 3D failure criteria necessary forthe correlation between analysis and experiments, the understanding of cyclic moisture,temperature, and mechanical loading effects on failure in adhesively bonded composite joints,and, finally, the effects of 'real world' issues on bond failure, to include poor surfacepreparation, uneven curing of the bondline adhesive, and uneven bondline thickness. The

Proceedings of ICCM–11, Gold Coast, Australia, 14th-18th July 1997
V - 445
objective of the current study, however, is far more modest. It is to establish a baselineunderstanding of the failure modes of composite to composite adhesive bonds in the doublelap shear specimen (the description of and rationale for selection will be given in the nextsection). Further studies will continue to explore the areas described above.
MATERIALS, SPECIMEN CONFIGURATION AND PREPARATION
The material chosen for the adherents was Hercules AS4/3501-6, considered a wellcharacterized, commonly used carbon fiber reinforced brittle epoxy system. The adherentlay-ups were [0]16T. The bonding adhesive chosen was Cytec FM300-2U (neat film) andFM300-2K (film with 3% woven glass scrim).
The specimen geometry is shown in Fig. 1. The specimens were fabricated in several steps:first, the adherent plates, measuring 30.5 cm x 30.5 cm (12" x 12") were cured following themanufacturer's instructions. Next, the bonding surfaces underwent one of four surfacetreatments: 1. acetone wash only, 2. moderate hand sanding with 240 grit sandpaper,followed by an acetone wash, 3. surface grinding with a 56 grit silicon carbide wheel toremove 0.05 mm (0.002") of the panel surface, followed by an acetone wash, and 4. gritblasting with 30 grit particles at 0.62 MPa (90 psi), also followed by an acetone wash. Thefilm adhesive was then applied to the full sized plates; shim plates were added to prevent theadherents from bending during the application of external pressure, and the plates were placedin a hot press at 0.69 MPa (100 psi) to cure the adhesive. The adhesive cured according to themanufactures recommend cure cycle (Fig. 2) resulted in an unacceptable level of porosity anduneven bond quality, as shown by the C-scan results in Fig. 3. To remedy this, several stepswere taken. The first was the addition of a temperature hold step, at the point of minimumresin viscosity, at a temperature slightly below the final cure temperature, as depicted in Fig.4. It was believed the additional resin flow time would assist in allowing volatiles to escapefrom the adhesive. In addition, the plates were placed in an autoclave to apply the externalpressure, also 0.69 MPa (100 psi). The results are shown in Fig. 5, and indicate significantlyimproved bondline quality. Once cured, the panels were cut into 2.54 cm (1") widthspecimens, after which strain gages (in locations to be discussed) and tabs were applied.
The results of the various surface preparation techniques are shown in Figures 6-9, which arelow magnification views of the surfaces prior to bonding. In Fig. 6, the imprints of the wovenpeel ply texture in the surface of the laminate are apparent (recall that this laminate isunidirectional). Fig. 7 shows the effects of moderate hand sanding, where the peaks in thesurface resin have been removed, however the low regions are unaffected. Fig. 8 illustratesthe intermediate roughness created by the surface grinding, and Fig. 9 shows the highlyroughened surface from the grit blasting. It should be noted that, also in this same sequenceof surface preparation techniques, the surface roughness increases, as does the amount of fiberbreakage and microcrack formation in the laminate. The extreme case is depicted in Fig. 10,which is a high resolution magnification of the damage caused by the grit blasting. The highsurface roughness, broken fibers, resin splitting, and surface debris are apparent.
TEST RESULTS
Many of the specimens were instrumented with strain gages to monitor the surface strains atselect locations. Back-to-back gages on both the single adherent section of the specimen, as

Volume V: Textile Composites and Characterisation
V - 446
well as in the region of bond overlap, indicate by their nearly identical output that a high levelof symmetry exists in the specimen. In addition, very small gages, 0.38 mm (0.015") inlength, were located in regions on the specimen edges near the bond line. A sample outputfrom a single set of such gages is given in Fig. 11. It is worth noting that gages 4 and 5measure transverse strains, whereas gages 6 and 7 measure axial strains. Also, gages 4 and 6are located just in the corner region of the adherent, whereas gages 5 and 7 are also located onthe laminate, directly adjacent to the adhesive bond, but at a distance of 0.63 mm (0.25") fromthe end of the bondline. In this example, the specimen was loaded to a peak loadapproximately 30% of the load required to cause crack initiation, and approximately one fifthof the ultimate load. Even at this low load level, hysteresis can clearly be seen in the gageoutputs at the crack tip.
Two dimensional [1] and a three dimensional [2] analytical solutions for stress and strainwere developed for this configuration. The stress results for the 2D solution are presented inFig. 12. The results clearly show the non-uniformity in shear stress along the length of thespecimen, as well as the significant singular peel stress that develop at the ends of thebondline. In reality, the specimen has double free edges: the edges along the sides of thespecimen, as well as the edges perpendicular to the longitudinal axis of the specimen. Thestrain gage output was compared with the 3D results, and the comparison is given in Table 1.It is clear that the corner strains vary significantly between specimens, as well as betweenspecimens and the analytical solution. However, the strains 6.3 mm (0.25"), still fairly closeto the crack tip, match the analytical solution fairly well. It should be noted that the resultsfor the analytical solution were averaged over the gage area to provide a fair comparison.
25.4 mm(1")
108 mm(4.25")
108 mm(4.25")50.8 mm (2.0")
SPACER INSERTEDDURING TEST
0.13 mm (0.005")BONDLINE THICKNESS (TYPICAL)
Fig. 1: Configuration of the double lap shear shear specimen
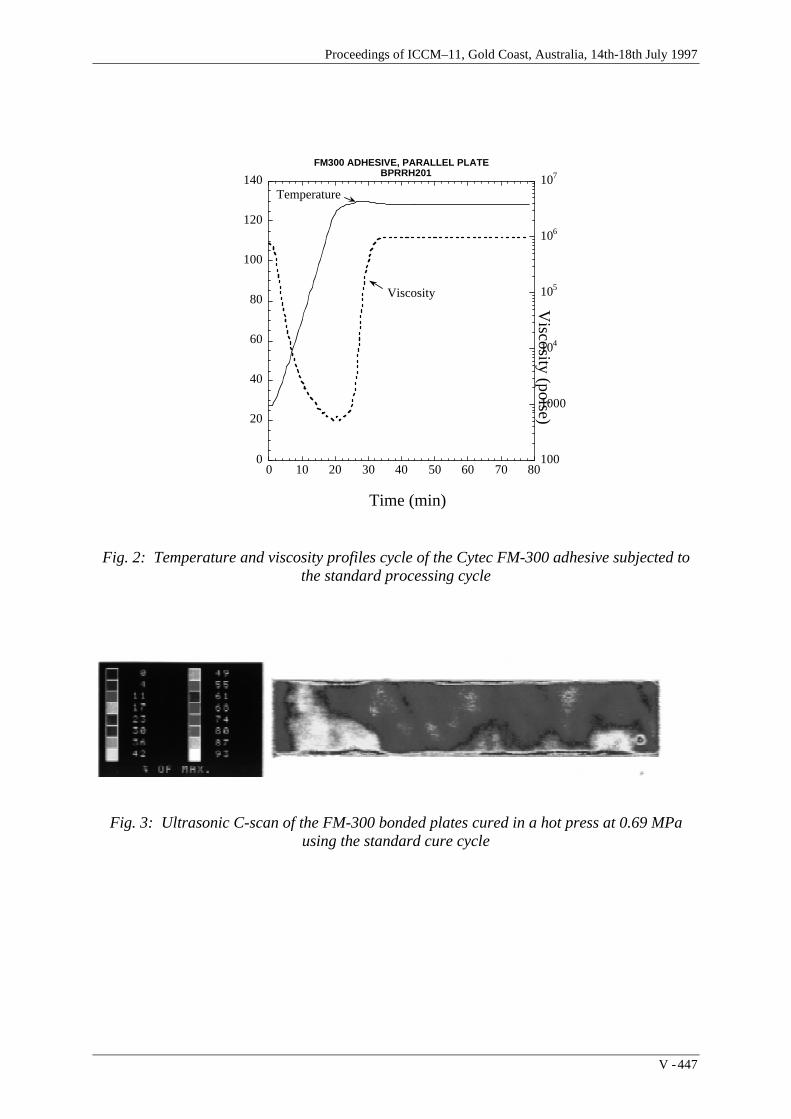
Proceedings of ICCM–11, Gold Coast, Australia, 14th-18th July 1997
V - 447
0
20
40
60
80
100
120
140
100
1000
104
105
106
107
0 10 20 30 40 50 60 70 80
FM300 ADHESIVE, PARALLEL PLATEBPRRH201
Viscosity (poise)
Time (min)
Temperature
Viscosity
Fig. 2: Temperature and viscosity profiles cycle of the Cytec FM-300 adhesive subjected tothe standard processing cycle
Fig. 3: Ultrasonic C-scan of the FM-300 bonded plates cured in a hot press at 0.69 MPausing the standard cure cycle
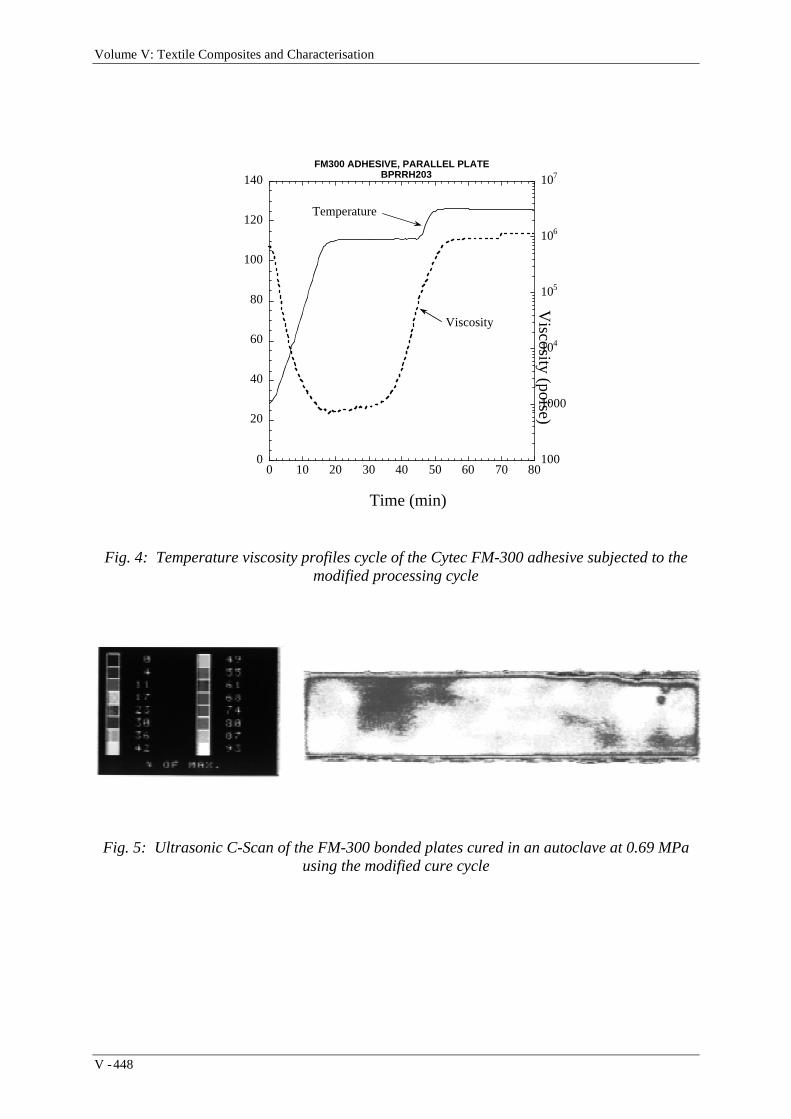
Volume V: Textile Composites and Characterisation
V - 448
0
20
40
60
80
100
120
140
100
1000
104
105
106
107
0 10 20 30 40 50 60 70 80
FM300 ADHESIVE, PARALLEL PLATEBPRRH203
Viscosity (poise)
Time (min)
Temperature
Viscosity
Fig. 4: Temperature viscosity profiles cycle of the Cytec FM-300 adhesive subjected to themodified processing cycle
Fig. 5: Ultrasonic C-Scan of the FM-300 bonded plates cured in an autoclave at 0.69 MPausing the modified cure cycle
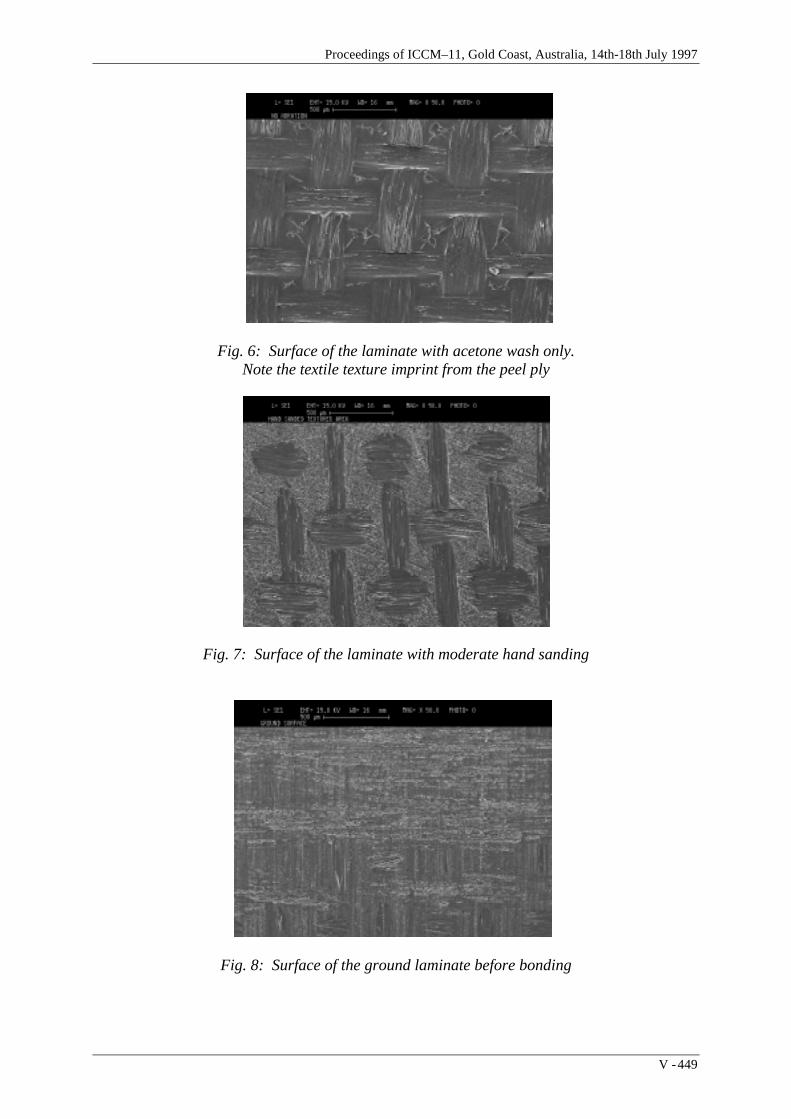
Proceedings of ICCM–11, Gold Coast, Australia, 14th-18th July 1997
V - 449
Fig. 6: Surface of the laminate with acetone wash only.Note the textile texture imprint from the peel ply
Fig. 7: Surface of the laminate with moderate hand sanding
Fig. 8: Surface of the ground laminate before bonding

Volume V: Textile Composites and Characterisation
V - 450
Fig. 9: Surface of the grit blasted laminate before bonding
Fig. 10: Close-up of the surface of the grit blasted laminate before bonding
l o a d i nu n l o a d
u n l o
4
5
6
7Loading Rate20 lb/sec
Fig. 11: Output from the 0.38 mm (0.015") size strain gages locatedon the specimen adherent edges adjacent to the adhesive bondline

Proceedings of ICCM–11, Gold Coast, Australia, 14th-18th July 1997
V - 451
-0.05
0.00
0.05
0.10
0.00 0.20 0.40 0.60 0.80 1.00
Lower InterfaceUpper Interface
Nor
mal
ized
Pee
l Ste
ss a
t the
Bon
dlin
e In
terf
aces
(σ z/ σ
x0 )
Normalized Distance Along the Bondline (x/b)
Lower bondline
bx
Upper bondline
Fig. 12(a): Normalized (by the axial stress in the single adherend) shear stress at thebondline interface as a function of bondline position
-0.20
-0.15
-0.10
-0.05
0.00
0.05
0.00 0.20 0.40 0.60 0.80 1.00
Lower InterfaceUpper Interface
Nor
mal
ized
She
ar S
tess
at t
he B
ondl
ine
Inte
rfac
es (
τ xz/σ
x0 )
Normalized Distance Along the Bondline (x/b)
Lower bondline
bx
Upper bondline
Fig. 12(b): Normalized (by the axial stress in the single adherend) shear stress at thebondline interface as a function of bondline position

Volume V: Textile Composites and Characterisation
V - 452
Table 1: Comparison of Experimental Strains and Analytical Predictions
CORNER STRAINS
EXP: DL2-2 EXP: DL3-1 ANALYTICAL
εx/εx0 0.2458 0.1915 0.1070
εy/εx0 0.0500 0.2010 0.7740
NEAR CORNER STRAINS 0.25” INSET
EXP: DL2-2 EXP: DL3-1 ANALYTICAL
εx/εx0 0.3933 0.3103 0.3529
εy/εx0 -0.1930 -0.1929 -0.1744
In order to observe the failure sequence, the edges of the specimens were polished prior totesting. Next, the specimens were loaded incrementally until crack initiation and propagationwas observed. Fluorescent die was applied to the polished edge while the specimens werestill under load. The loading was then removed, and the specimens edges were observedunder an optical microscope, illuminated by a flourescent light source. The onset of crackinitiation was also indicated by acoustic emission output. Failure in nearly all of thespecimens followed a regular pattern, as depicted in Fig. 13. The cracks generally initiated inthe region of maximum peel stress at 70% of the ultimate failure load. The cracks thenpropagated to approximately the midpoint of the specimen. A second crack, at the oppositeside of the bondline, then forms within the specimen. These cracks then link via a third crackwhich traverses the bondline.
The cracks, when observed under the optical microscope, appeared to be located at theinterface between the composite and the adherent. Upon careful examination under thescanning electron microscope, however, it was clearly observed that for all four surfacepreparation techniques, the failure was within the laminates themselves, just several fiberdiameters from the laminate surface. This is illustrated in Fig. 14, which shows clearly thepresence of fibers (as does the mating surface), indicating primary crack propagation withinthe laminate. In addition, as observed in the laminates before bonding, the number of brokenfibers increased when examining the acetone washed only, the hand sanded, the ground, andthe grit blasted specimens, respectively.
The ultimate failure loads are given in Table 2. It is felt that the variation in strength of thespecimens is not significantly effected by the surface preparation method (the high failurevalue in the acetone wash specimen is based on only one test).

Proceedings of ICCM–11, Gold Coast, Australia, 14th-18th July 1997
V - 453
AS4/3501-6: [0] 16
AS4/3501-6: [0] 16
AS4/3501-6: [0] 16
FM300: 0.005"
FM300: 0.005"
CrackInitiation
CrackInitiation AS4/3501-6: [0] 16
AS4/3501-6: [0] 16
AS4/3501-6: [0] 16
FM300: 0.005"
FM300: 0.005"
Crack
AS4/3501-6: [0] 16
AS4/3501-6: [0] 16
AS4/3501-6: [0] 16
AS4/3501-6: [0] 16
AS4/3501-6: [0] 16
AS4/3501-6: [0] 16
FM300: 0.005"
FM300: 0.005"
1 2
43
Crack Initiation (observed) Crack Propagation (observed)
Before Failure (speculated) Final Failure (observed)
Crack
Crack
Crack
Fig. 13: Depiction of the damage initiation and growth as seen by flourescent enhanced edgemicroscopy
Fig. 14: Typical image of the fracture surface showing intra-ply failure

Volume V: Textile Composites and Characterisation
V - 454
Table 2. Ultimate failure load for four surface preparation techniques
Failure Stress (Far Field in the Single Adherent) Number of
MPa (ksi) Specimens
Acetone wash 501 (72.7) 1
Hand sanding 439 (63.7) 3
Grinding 469 (68.0) 2
Grit blasting 453 (65.7) 3
DISCUSSION AND CONCLUSIONS
Several significant issues become apparent when examining the results. First, in the cornerregion of the specimen, potential viscoelastic effects may be present and must be accountedfor in the stress analysis. In addition, the shape of the adhesive fillet was generallyuncontrolled and may effect the stress state in that region.
The effect of surface preparation did not appear to have a significant effect on the specimenstrength. This may not be surprising, as all failures were observed to occur within thecomposite, and hence the intra-ply strengths dictate the failure level. However, as future testsare conducted under more extreme moisture and temperature conditions, the failure modesmay change.
Immediate future plans for this project include the use of full field moiré instead of straingages to monitor strains in the regions of high strain gradients, the use of multi-directionallaminates as adherents, and the testing of moisture conditioned specimens at cold, room, andelevated temperatures. An additional laminate and adhesive will also be added to the testmatrix. Longer term plans include the addition of alternate test geometries to alter the stressstate in the bond region.
In summary, the double lap shear specimen has been examined in detail to serve as a baselinefor further research on the behavior of composite to composite adhesive bonded joints. Fourlaminate surface preparation techniques were examined in detail. A comparison was madebetween the 3D stress analysis and the experiments using small strain gages placed in regionsof high strain gradients. The damage propagation modes were observed and characterized,and the final ultimate strengths reported and discussed with respect to them.
REFERENCES
1. Schoeppner, G. A. and Pagano, N. J., “Stress Fields and Energy Release Rates in Cross-ply Laminates”, submitted to International Journal of Solids and Structures, 1996.

Proceedings of ICCM–11, Gold Coast, Australia, 14th-18th July 1997
V - 455
2. Bogdanovich, A. E. and Rastogi, N., “3-D Variational Analysis of Bonded CompositePlates”, 1996 International Mechanical Engineering Congress and Exposition, Atlanta,GA, November 17-22, 1996. Proceedings of the ASME Aerospace Division, AD-Vol.52, 1996, pp. 123-143.
3. Chin, J. W. and Wightman, J. P., “Surface Characterization and Adhesive Bonding ofToughened Bismaleimide Composites”, Composites: Part A, Vol. 27A, 1996, pp. 419-428.

Volume V: Textile Composites and Characterisation
V - 456
THE EFFECT OF ENVIRONMENT ON THE DAMAGETOLERANCE OF GLASS AND CARBON FIBRE
REINFORCED EPOXY LAMINATES
G. A. Bibo1, P. J. Hogg1 and M. L. Kay2
1Department of Materials, Queen Mary and Westfield College, London, UK2National Physical Laboratory, Teddington, Middlesex, UK
SUMMARY: An examination of the damage tolerance of two distinctly differentperformance (carbon and glass fibre reinforced epoxy prepreg) composites, each targeted atseparate ends of the engineering market were put into context by subjecting them toenvironmental extremes. The conditioning was chosen such that it reflected likely scenariosin industry and facilitated an accelerated programme of testing. The observed response ofeach material to its particular environmental conditioning is discussed and the immediateimplications of these findings commentated upon, within the realms of their potentialapplication. Subsequently, the interpretation and relevancy of the damage tolerance test forthese extreme conditions was put into perspective.
KEYWORDS: accelerated testing, environmental cconditioning, compression after impact
INTRODUCTION
Compression after impact test data obtained under elevated temperature or moistureconditions requires careful interpretation compared with room temperature tests. This is dueto reduced fundamental strengths at high temperature and moisture and/or changes in failuremechanism induced by impact or subsequent compression testing. This paper examines thebehaviour of two well characterised materials, under extreme conditions of temperature andenvironmental exposure and compares the results to room temperature tests.
MATERIALS
Two principal reinforcement fibre types, carbon and glass, were used in this study andsubjected to extreme (accelerated) environmental conditions commensurate with theirindustrial applications e.g. carbon - aerospace and glass - chemical and marine.
The material tested under a range of high temperature impact and compression after impactconditions, was an Hexcel (formally Ciba Composites) 924C (a toughened epoxy with theTorayca T800H carbon fibre).
For the hygrothermal investigation, Hexcel’s (formally Ciba Composites) 913 resin systemwas reinforced by E-glass.
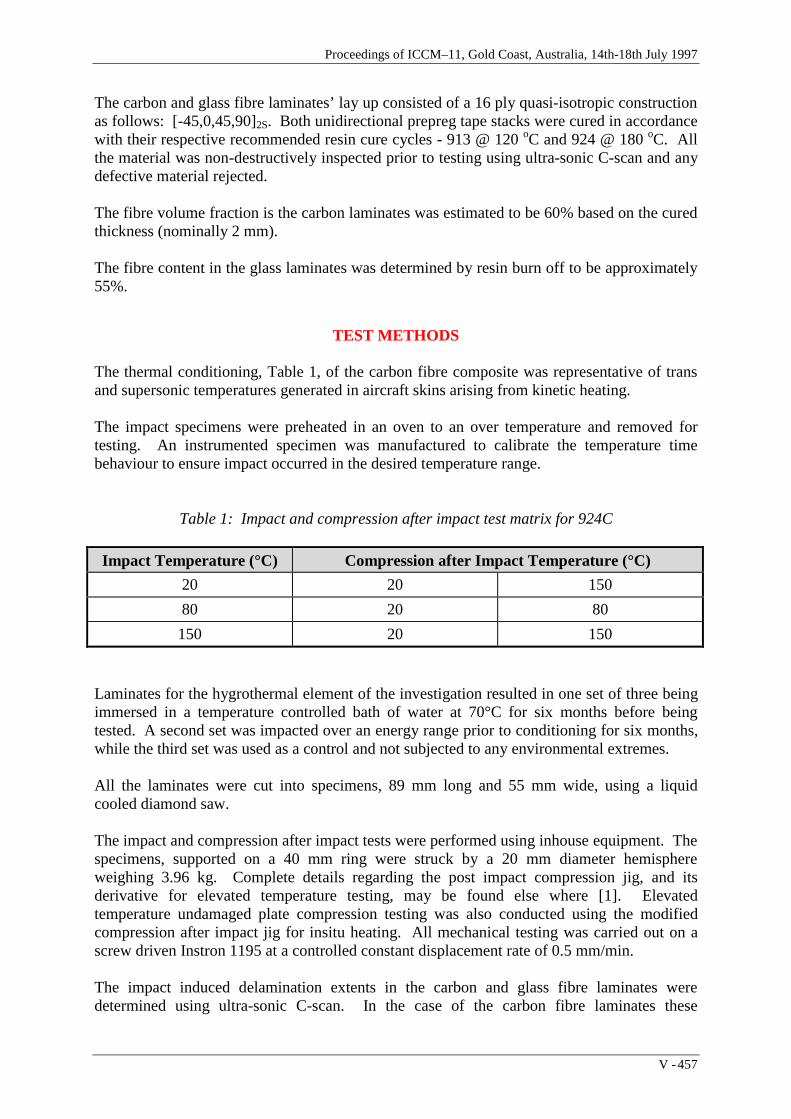
Proceedings of ICCM–11, Gold Coast, Australia, 14th-18th July 1997
V - 457
The carbon and glass fibre laminates’ lay up consisted of a 16 ply quasi-isotropic constructionas follows: [-45,0,45,90]2S. Both unidirectional prepreg tape stacks were cured in accordancewith their respective recommended resin cure cycles - 913 @ 120 oC and 924 @ 180 oC. Allthe material was non-destructively inspected prior to testing using ultra-sonic C-scan and anydefective material rejected.
The fibre volume fraction is the carbon laminates was estimated to be 60% based on the curedthickness (nominally 2 mm).
The fibre content in the glass laminates was determined by resin burn off to be approximately55%.
TEST METHODS
The thermal conditioning, Table 1, of the carbon fibre composite was representative of transand supersonic temperatures generated in aircraft skins arising from kinetic heating.
The impact specimens were preheated in an oven to an over temperature and removed fortesting. An instrumented specimen was manufactured to calibrate the temperature timebehaviour to ensure impact occurred in the desired temperature range.
Table 1: Impact and compression after impact test matrix for 924C
Impact Temperature (°C) Compression after Impact Temperature (°C)
20 20 150
80 20 80
150 20 150
Laminates for the hygrothermal element of the investigation resulted in one set of three beingimmersed in a temperature controlled bath of water at 70°C for six months before beingtested. A second set was impacted over an energy range prior to conditioning for six months,while the third set was used as a control and not subjected to any environmental extremes.
All the laminates were cut into specimens, 89 mm long and 55 mm wide, using a liquidcooled diamond saw.
The impact and compression after impact tests were performed using inhouse equipment. Thespecimens, supported on a 40 mm ring were struck by a 20 mm diameter hemisphereweighing 3.96 kg. Complete details regarding the post impact compression jig, and itsderivative for elevated temperature testing, may be found else where [1]. Elevatedtemperature undamaged plate compression testing was also conducted using the modifiedcompression after impact jig for insitu heating. All mechanical testing was carried out on ascrew driven Instron 1195 at a controlled constant displacement rate of 0.5 mm/min.
The impact induced delamination extents in the carbon and glass fibre laminates weredetermined using ultra-sonic C-scan. In the case of the carbon fibre laminates these

Volume V: Textile Composites and Characterisation
V - 458
specimens were also re-scanned after the residual compression phase to qualitatively measuredelamination propagation.
RESULTS
Elevated Temperature Testing
Impact
To facilitate ease of comparison, the 924C room temperature results are incorporated to definea baseline against which performance changes may be measured.
The impact induced delamination damage extent increases not only with incident energy, butalso with increasing temperature, Figure 1. This is particularly evident for the data generatedat 150 oC. At the highest impact energy level (6 J) used for this material, the roomtemperature delamination spread has been observed to approach the support dimensions, thusthe measured damage extent for the high temperature impact may be in error as they may beconstrained by the boundary conditions.
765432100
10
20
30
40
50
Room Temperature80 deg C150 deg C
Impact Energy (J)
Dam
age
Wid
th (
mm
)
Saturation Zone
Da
ma
ge
Th
resh
old
Zo
ne
Ring Support Diameter
Figure 1: Damage extent versus impact energy over a range temperatures
Undamaged Plate Compression Strength
The ‘undamaged plate compression strength’ decreases monotonically with increasingtemperature, Figure 2.
The plate compression tests conducted at 80 oC, unlike the room temperature tests failed at thebase support and not the unsupported region, in a splaying or brooming mode. At 150 oCsimilar fracture characteristics occur, however, the failure region is less extensive, the hightemperature having softened the matrix sufficiently to allow the composite to yield.

Proceedings of ICCM–11, Gold Coast, Australia, 14th-18th July 1997
V - 459
1501005000
100
200
300
400
500
Temperature deg C
Com
pres
sion
Str
engt
h (M
Pa)
Prediction Interval
Confidence Interval
Figure 2: Undamaged plate compression strength as a function of temperature
Compression After Impact
Figure’s 3a and 3b present the compression after strength versus impact energy and damageextent respectively for all the temperature combinations used, normalised with respect to the‘undamaged plate compression strength’ at that temperature.
864200.0
0.2
0.4
0.6
0.8
1.0
1.2
1.4
R.T/R.T
R.T/150
80/80
80/R.T
150/150
150/R.T
Impact Energy (J)
Nor
mal
ised
Res
idua
l Str
engt
h
Figure 3a: Normalised residual compression strength versus impact energy over atemperature range (impact temperature/compression after impact temperature)
The trends indicate, Figure 3a, that there is a slight improvement in the normalised residualstrength retention when the compression phase is performed at 150 oC, although there is littleor no apparent difference between room temperature and 80 oC strengths. However, when thenormalised residual strength is plotted against damage width, Figure 3b, the samplescompression tested at 150 oC now clearly show a higher relative strength retention comparedto those tested at room temperature and 80 oC.

Volume V: Textile Composites and Characterisation
V - 460
504030201000.0
0.2
0.4
0.6
0.8
1.0
1.2
1.4
R.T/R.T
R.T/150
80/80
80/R.T
150/150
150/R.T
Damage Width (mm)
Nor
mal
ised
Res
idua
l Str
engt
h
150 C P.I.C
R.T P.I.C
Figure 3b: Normalised residual compression strength versus damage extent over atemperature range (impact temperature/compression after impact temperature)
Hygrothermal Testing
Moisture Diffusion
Gravimetric analysis indicated that the glass/epoxy laminates resembled Fickean diffusion,although continued moisture uptake may occur through other mechanisms [2]. Visualobservation revealed that the specimens developed an opacity, with blisters occurring on theouter plies after approximately two months exposure.
Impact
To facilitate ease of comparison, unconditioned data are incorporated to define a datumagainst which changes may be determined. The impact induced delamination damage extentsin the unconditioned and six month environmentally (70 oC water) exposed glass/epoxy areplotted as a function of impact energy, Figure 4. The data demonstrate that samplesconditioned actually contained delamination damage better than the benchmark specimens.
0
10
20
30
40
50
Dam
age
Wid
th (
mm
)
0 2 4 6 8 10 12Impact Energy (J)
3: 6 months exposure before impact
2: 6 months exposure after impact
1: Unconditioned
Figure 4: Damage extent versus impact energy with and without conditioning

Proceedings of ICCM–11, Gold Coast, Australia, 14th-18th July 1997
V - 461
Compression After Impact
The compression after impact data are presented in the classical fashion, that is, againstincident energy, Figure 5a.
0
50
100
150
200
250
300
Res
idua
l Com
pres
sion
Str
engt
h (M
Pa)
0 2 4 6 8 10 12
Incident Impact Energy (J)
unconditioned
impact and then conditioned
Conditioned and then impacted
Figure 5a: Compression after impact strength versus impact energy for all conditions
The absolute trends indicate that the detrimental effect of delamination damage is exacerbatedby the addition of environmental exposure. The subtle difference being between thosesamples that were conditioned then impacted and those that were impacted then conditioned.
This affect is magnified when considering the residual strength on the basis of thedelamination damage extent, Figure 5b, and infact the presence of any impact induceddamage may be disregarded inview of the almost non-existent rate of strength loss withincreasing impact energy or damage extent, provided, a measure of the undamaged strength ofan exposed laminate is known.
0
100
200
300
400
Res
idua
l Com
pres
sion
Str
engt
h (M
Pa)
0 10 20 30 40 50
Damage Width (mm)
impacted and then conditioned
conditioned and then impacted
unconditioned
Figure 5b: Compression after impact strength versus damage extent for all conditions

Volume V: Textile Composites and Characterisation
V - 462
DISCUSSION
Carbon/Epoxy
While the 924C may not be the ideal candidate material choice for a second generationConcorde due to its instability at prolonged high temperature exposure, it may be indicative ofthe behaviour of the better suited resin systems, e.g. Bismaleimides (BMI) or polyimides.
The reduction in plate compression strength may only be representative of a trend, however,there is sufficient experimental evidence available clearly stating this link, much of itattributing this behaviour to fibre instability through a reduced matrix shear modulus [3-5].
Examination of the 924C’s compression after impact results, Figures 3a and 3b, demonstratesome interesting characteristics - the elevated temperature residual (normalised) compressionstrengths are higher for a given impact energy than the room temperature results, andespecially so if the impact themselves were generated at the high temperatures. This effect isaccentuated if the data are analysed on the basis of damage extent. On this Figure (3b), a linehas been drawn which divides all the data generated by compression testing at 150oC androom temperature, such that the elevated temperature data lie above this line and the roomtemperature below.
This behaviour may be partly explained by the post failure ultra-sonic C-scan of thespecimens, Figure 6. The interpretation may be that as the temperature in the compressionphase increases so the corresponding delamination propagation band decreases, suggestingthat the effective delamination extent is reduced [1].
R.T/R.T R.T/150o C
Impact Damage
CAI Damage Propagation
Impact Damage
CAI Damage Propagation
Figure 6: Schematic representations of room temperature impact and the subsequentpropagation of delaminations at: i) room temperature and ii) 150 oC

Proceedings of ICCM–11, Gold Coast, Australia, 14th-18th July 1997
V - 463
Glass/Epoxy
The trends observed in the carbon/epoxy composite in terms of undamaged strength may alsobe achieved through an increased presence of moisture in the composite. This, acting concertwith the hydrophilic nature of glass fibres (attack of the interface leading to irreversibledegradation) may further reduce fundamental properties [6].
The reduction in damage extent in the conditioned samples may be due to plasticisation of thematrix and reduction of the interfacial bond. This concentration of damage was linked to anincrease in crack density through the thickness of the laminate beneath the point of contact[7]. This mechanism may be more severe than wide spread delamination and mightresponsible, in conjunction with general matrix and fibre/matrix degradation, for the poorcompression after impact strength. However, the presence of damage prior to exposure maybe expected to further encourage fracture through extension of existing matrix anddelamination cracks leading to further reductions in residual strength, but this was not theobserved behaviour and may be due more to the changes in basic strength through exposure.
An Interpretation of the CAI Relevancy to Extreme Condition Testing
The combinations of test conditions for the carbon/epoxy specimens listed in the matrix(Table 1) reflect a range of potential temperatures when impact may occur, however, it mustbe emphasised that these specimens were mechanically unstressed, which, particularly at hightemperatures, may not be the case as the aircraft may be in flight. Consequently, the damagemay be greater, resulting in possible catastrophic failure by either penetration or immediatedelamination propagation induced by the pre-stressed state of the structure. Similar concernsmay be raised in regard the data generated by the hygrothermal testing.
Conventional wisdom has had the compression after impact strength analysed solely on thebasis of impact energy. The behaviour of the materials investigated in this programme clearlyshowed that this may lead to erroneous interpretations of the data.
It is a recipe for disaster if the essential elements of composite durability are not incorporatedin damage tolerance tests as room temperature data may not be extrapolated. The performanceof the 924C is surprisingly good when compared on the basis of its undamaged strength attemperature, exceeding that of the room temperature data. This result may not have beenexpected given the increase in damage extent with temperature.
In contrast, the mechanisms associated with hygrothermal testing may at first glance appearinsignificant, in terms of undamaged strength for these conditions, however, the nearpenetration of the laminate may have more serious consequences.
It has been argued in previous papers that the accepted approach to compression after impacttest analysis, whereby the residual strength is assessed as a function of impact energy ismisleading [8,9]. This is because the separate phenomena of damage creation and damagepropagation are not distinguished. The environmental influence of either temperature orexposure to moisture clearly exacerbates this problem. In some instances damage size islargely irrelevant, in others strength is linked to initial damage size. In some cases all damagepropagates (sideways), in others only partial propagation occurs. Consequently, simple trendsobserved between materials at room temperature and without long term environmentalexposure can not be assumed to continue under more aggressive test conditions. Materials

Volume V: Textile Composites and Characterisation
V - 464
that appear relatively good (compared to others) at room temperature and low humidity cannot be relied upon to hold the same relative position in any table of performance with hot orwet test conditions.
CONCLUSIONS
The link between impact damage size and the residual compression strength varies accordingto the temperature at testing and the environmental history of the specimen.
Now that composites are readily achieving more extensive acceptance among engineeringsectors it is now critical that stock is taken of where these materials have reached newapplications and examine their suitability, before a catastrophic failure results in confidencebeing undermined and their usage set back a number of years.
Misadventure and a lack of understanding of what the damage tolerance test provides mayrequire more infrastructure around the basic test to facilitate better judgement andinterpretation of the materials suitability to the chosen application.
ACKNOWLEDGEMENTS
The authors are grateful to the Engineering and Physical Sciences Research Council(EPSRC), the Defence Research Agency (DRA) and the National Physical Laboratory (NPL)for supporting this programme of work.
REFERENCES
1. Bibo, G. A., Hogg, P. J. and Kemp, M., “High-temperature damage tolerance of carbonfibre-reinforced plastics: 2. Post-impact compression characteristics”, Composites, Vol.26, No. 2, 1995, pp 91-102.
2. Mensitieri, G., Apicella, A., Nicolais, L., and Del Nobile, M. A., “Progress in durabilityanalysis of composite systems”, A. Cardon et al Eds , A A Balkema Publishers,Rotterdam, 1996, pp 249-258.
3. Bishop, S. M., “The mechanical performance and impact behaviour of carbon-fibrereinforced PEEK”, Composite Structures, 3, 1985, pp 295-318.
4. Fisher, J. M., Palazotto, A. N. and Sandhu, R. S., “A study of failure characteristics inthermoplastic composite material at (250 oC) 121 oC, Composites Technology andResearch, Vol. 13, No. 3, 1991, pp 152-160.
5. Lifshitz, J. M., “Strain rate, temperature and humidity influences on strength and moduliof a graphite/epoxy composite”, Composites Technology Review, Vol. 4, No. 1, 1982,pp 14-19.
6. Wyatt, R. C. and Ashbee, K. H. G., Fibre Science and Technology, Vol. 2, 1969, pp 29-40.

Proceedings of ICCM–11, Gold Coast, Australia, 14th-18th July 1997
V - 465
7. Hogg, P. J. and Kay, M. L., “The effect of environment on the damage tolerance ofglass and carbon fibre reinforced epoxy laminates”, Deformation and Fracture ofComposites, Manchester, UK, 1997, Institute of Materials.
8. Prichard, J. C. and Hogg, P. J., “The role of impact damage in post-impact compressiontesting”, Composites, Vol. 21, No. 6, 1990, pp 503-511.
9. Bibo, G. A., Hogg, P. J. and Kemp, M., “Damage tolerance of UD tape and textile glassreinforced epoxy”, 3rd International Conference on Deformation and Fracture ofComposites, Surrey, UK, 1995, pp 374-383.

Volume V: Textile Composites and Characterisation
V - 466
MECHANICAL BEHAVIOUR OF CARBON/MODIFIEDBISMALEIMIDE COMPOSITES AT ELEVATED
TEMPERATURES
X.J. Xian, F.G. Shin, C.L. Choy
Department of Applied Physics and Materials Research CenterThe Hong Kong Polytechnic University, Hong Kong
SUMMARY : The fracture toughness K1c , interlaminar shear strength τILSS and tensilestrength σt of composites of carbon fiber T300 reinforced modified bismaleimide QY8911(T300/MBMI) have been investigated in the temperature range 20-200oC. These arecompared with the corresponding results for carbon fiber composites with epoxy matrix(T300/EP). In-situ observation of the above experiments in the scanning electron microscopehas provided indications of important characteristics of dynamic crack propagation anddelamination development. T300/MBMI composites are found to have higher K1c, τILSS, andσt than the epoxy based composites. In general, the MBMI composites show a highertemperature resistance and lower crack and delamination propagation rates, and are thussuperior to the epoxy based composites. This is so because of the greater thermal stability andtoughness and better interfacial adhesion in the modified BMI matrix material. The failuremechanisms of the composites are investigated by analyses of SEM fractographs. Of thethree mechanical properties studied, interlaminar shear strength is most affected bytemperature.
KEYWORDS : carbon fiber reinforced modified bismaleimide composites, mechanicalbehaviour, fracture toughness, interlaminar shear, microstructure, elevated temperature
INTRODUCTION
Advanced fiber reinforced polymer matrix composites, as a class of high performancematerials, finds major use in structural applications. Very often, a judicious choice of thematrix material can enable special requirements to be met in particular applications. Epoxyresins are most popularly used in high performance fiber composites. Disadvantages ofepoxy-based composites, however, include low fracture toughness, low delaminationresistance and poor performance in a hot/wet environment. These reflect the inherentbrittleness and low thermal resistance of the epoxies. Compared to the epoxies, bismaleimide(BMI) resins exhibit better thermal as well as humidity resistance, and are thus more suited tobe used in demanding environments. BMIs are, however, brittle and difficult to process [1],and various chemical and physical modifications are the subject of active investigation.

Proceedings of ICCM–11, Gold Coast, Australia, 14th-18th July 1997
V - 467
This work makes use of a modified bismaleimide resin, QY8911 (MBMI-1), reported in [2].This MBMI-1 resin has good processability and possesses better toughness than BMI whileretaining the original advantages in thermal stability. We have previously investigated theimpact resistance [3] and the fracture fatigue [4] as well as the interlaminar fracture [5]behaviour of carbon fiber reinforced MBMI-1 composites (CF/MBMI-1) under roomtemperature conditions.
In the present work, the fracture toughness, interlaminar shear strength and tensile strength ofCF/MBMI-1 composites are evaluated at elevated temperatures and comparison ofperformance with epoxy-based CF composites is made. To gain an understanding of thethermal fracture and delamination processes, experiments have also been performed in ascanning electron microscope with in-suit heating and loading capabilities. We aim toprovide an evaluation of the thermal resistance as well as to elucidate the high temperaturefailure mechanisms in CF/MBMI-1 composites.
SPECIMENS AND EXPERIMENTAL METHODS
The specimens were made from T300 carbon fiber with modified bismaleimide QY8911(T300/MBMI-1) and epoxy EP618 (T300/EP) matrices. The MBMI-1 resin was prepared byincorporating a dispersion of thermoplastic PES particles in BMI resin [2]. The elongation atbreak of MBMI-1 (2.2%) matches that of T300 carbon fiber. The tensile strength andmodulus of MBMI-1 are 66 MPa and 3.5 GPa, respectively, and are higher than thecorresponding epoxy values. The fiber volume fraction in the composites was approximately65%; [0] and [±45] lay-ups were prepared from unidirectional prepregs of thickness 0.11 mm.The quality of the laminates was examined by the ultrasonic C-scan technique before test.Specimen dimensions conformed with ASTM D3039-76 for test of tensile strength, ASTMD2234-84 for interlaminar shear strength and ASTM E399 for fracture toughness. Testingwas performed on an Instron 1175 machine with an auxiliary high temperature oven. Fractureand short beam shear tests were also carried out on a Cambridge S-250 scanning electronmicroscope (SEM) with in-situ heating and loading capabilities. For SEM study, specimendimensions were reduced in proportion to the ASTM size. The damage process and dynamiccrack propagation could be observed and photographed in the SEM loading stage.Experiments in this study were performed at room temperature 20oC as well as at elevatedtemperatures (150 and 200oC).
COMPARISION OF CARBON FIBER REINFORCED MODIFIEDBISMALEIMIDE AND EPOXY COMPOSITES
The fracture toughness K1c, interlaminar shear strength τILSS and tensile strength σt ofT300/MBMI-1 [0] (U-B), T300/MBMI-1 [±45] (M-B), T300/Epoxy [0] (U-E) and T300/EP[±45] (M-E) specimens at various temperatures are shown in Table 1.

Volume V: Textile Composites and Characterisation
V - 468
Table 1: Comparison of mechanical properties of carbon fiber T300reinforced MBMI-1 and EP618 composites at elevated temperatures
SpecimenType Symbol
T Tensile Strength Interlaminar Shear Fracture ToughnessoC σt(MPa) R(%) τILSS (MPa) R(%) K1C (MPa m)R(%)
T300/MBMI-1 U-B [0]
T300/EP618 U-E [0]
T300/MBMI-1 M-B [±45]
T300/EP618 M-E [±45]
20 1327 100 90.1 100 46.4 100150 1163 88 54.7 61 41.6 90200 617 47 26.1 29 27.8 60
20 1275 100 72.8 100 30.6 100150 1049 71 12.4 17 18.0 59200 470 37 7.3 10 15.3 50
20 102 100 28.6 100 26.4 100150 72 71 4.9 17 5.1 19200 35 34 2.6 9 2.8 11
20 94 100 26.3 100 19.7 100150 52 56 2.3 9 2.4 12200 20 21 1.5 6 1.8 9
R-Retention Rate, MBMI-1 - Modified BMI Resin, EP618 - Epoxy Resin
Fracture Toughness
The room temperature fracture toughness K1c value of U-B (resp. M-B) is 46.4 MPam
(26.4 MPa m), and is 52% (34%) higher than that of U-E (resp. M-E). At 150oC, theretention rate R of K1c in U-B (resp. M-B) is 90% (19%) and is 31% (7%) better than in U-E(resp. M-E). At 200oC, although the R values of the MBMI-1 and EP composites arecomparable, the K1c value of U-B (resp. M-B) is 82% (56%) larger than that of U-E (resp.M-E). The [0] composites are seen to be much less affected by temperature than the [±45]composites. MBMI-1 composites in either lay-up have greater fracture toughness than in thecorresponding EP composites at all temperatures investigated. This is attributed to the greatertoughness of MBMI-1 at room temperature and at elevated temperatures.
Interlaminar Shear Strength
The room temperature τILSS value of U-B (resp. M-B) is 90.1 MPa (28.6 MPa) and is 24%(9%) higher than that of U-E (resp. M-E). At 150oC, the R value in U-B (M-B) is 61% (17%)and is 44% (8%) better than that in U-E (resp. M-E). At 200oC, the τILSS value of U-B (resp.M-B) is 258% (73%) larger than that of U-E (resp. M-E). Again, the [0] composites are lessaffected by temperature than the [±45] composites. MBMI-1 composites in either lay-up havegreater τILSS than in the corresponding EP composites at all temperatures investigated becauseMBMI-1 has better interfacial adhesion properties. Deterioration in τILSS in the [0]composites at elevated temperatures is much more marked than in the case of fracturetoughness or tensile strength, and is therefore a sensitive performance indicator for theevaluation of a new matrix material.

Proceedings of ICCM–11, Gold Coast, Australia, 14th-18th July 1997
V - 469
Tensile Strength
The room temperature σt value of U-B (resp. M-B) is 1327 MPa (102 MPa) and is a littlehigher than that of U-E (resp. M-E). At 150oC, the R value in U-B (resp. M-B) is 88% (71%)and is 17% (15%) better than that in U-E (resp. M-E). At 200oC, the σt value of U-B (resp.M-B) is 31% (75%) larger than that of U-E (resp. M-E). In the [0] composites, σt is mainlydetermined by the fiber performance, thus σt differences between MBMI-1 and EPcomposites are minimal; the matrix contribution is seen to become more apparent in [±45]composites, with those based on MBMI-1 giving higher retention rates.
From the above experimental results, it is clear that the fracture toughness, interlaminar shearstrength and tensile strength of T300/MBMI-1 composites are uniformly better than those ofT300/EP, at room temperature as well as at elevated temperatures.
IN-SITU SEM OBSERVATION OF FRACTURE TOUGHNESS TEST
Single edge notched specimens with notch length to specimen width of 0.3 were subjected tothree point bending fracture test in the SEM. Micrographs of the damage zone at the notch tipwere taken during test. The fracture process followed the three stages : (1) initial cracking atnotch tip, (2) crack propagation and development of damage, (3) failure and fracture.
For M-B (resp. M-E) at 150oC, cracks started to occur at the notch tip when the load levelreached 60% (29%) of fracture load Pf, and propagated along the 45o interface direction withfurther load increase (Fig. 1) (resp. Fig. 2). Sudden failure occurred at 98% Pf (73% Pf) level.At this point, M-E failed by brittle fracture while with M-B more 45o cracks began to developand complete fracture (Fig. 3) came at a slightly higher load. Comparing initial cracks, M-Ealso showed brittle cracking (Fig. 4), reflecting a break down of epoxy at the notch tip at150oC. Overall, damage in M-B is much less extensive than in M-E, indicating MBMI-1 hasa better thermal resistance than EP, and hence a higher fracture toughness for M-B.
For U-E at 200oC (150oC), the notch tip opened (Fig. 5) at 25% Pf (32% Pf) and started topropagate along the 0o interface direction at 30% Pf (49% Pf), resulting in more than one slipline (Fig. 6). The phenomenon of multiple slip lines does not normally occur in roomtemperature testing, and hence its occurrence suggests the thermal cracking of the epoxymatrix. For U-B, notch opening occurred at higher load levels, but U-B and U-E failed insimilar ways.
IN-SITU SEM OBSERVATION OF INTERLAMINAR SHEAR STRENGTH TEST
Short beam shear tests were performed in the SEM. For U-B (resp. U-E) at 200oC, noticeabledeformation occurred at 67% (27%) of the maximum load Pmax , then shear delamination at89% Pmax (63% Pmax). Beyond Pmax , the load recovered after a slight decrease, followed by asuccession of drops as interlaminar layers gave way. Fig. 7a (resp. Fig. 7b) shows thedelamination failure of U-B (resp. U-E). Shear delamination in U-B is less serious than in U-E. Interface debonding as observed in between the outermost plies and matrix damage in U-B(Fig. 8) are not as severe as in U-E (Fig. 9) where the epoxy is smashed with broken fibersvisible. The latter phenomenon does not occur in room temperature testing. For [±45]composites, failure also occurred via shear cracking at roughly 45o through the thickness of a
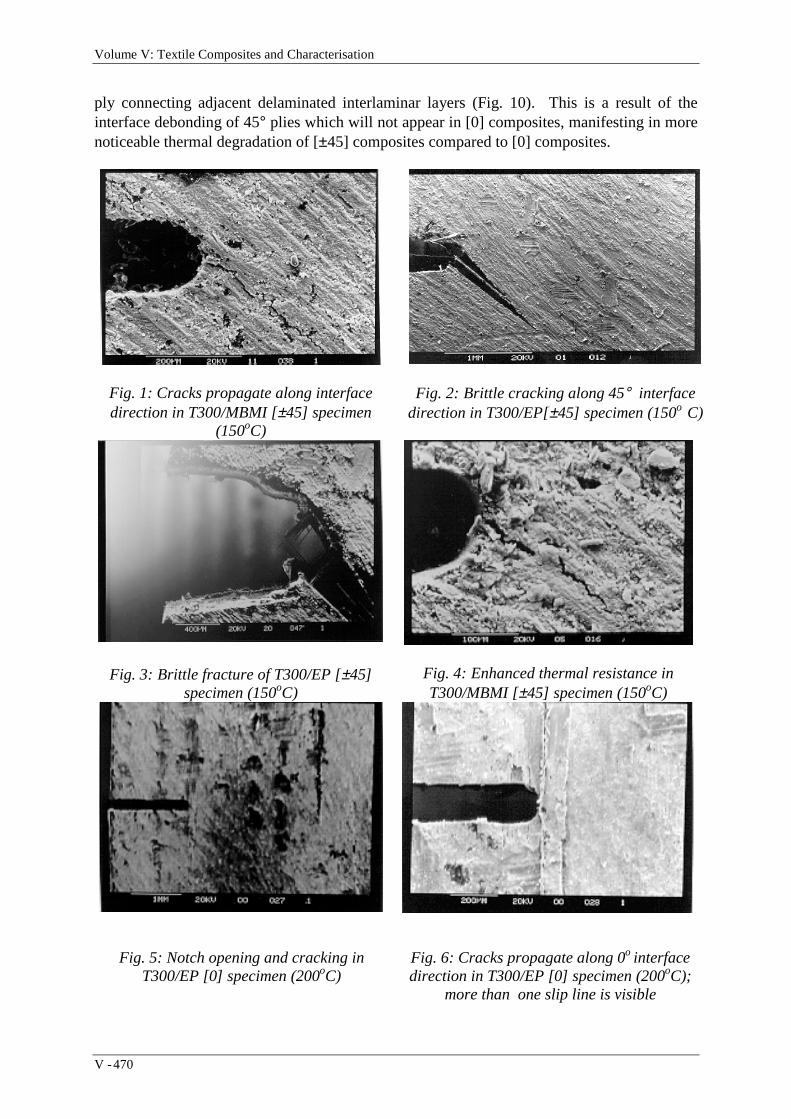
Volume V: Textile Composites and Characterisation
V - 470
ply connecting adjacent delaminated interlaminar layers (Fig. 10). This is a result of theinterface debonding of 45° plies which will not appear in [0] composites, manifesting in morenoticeable thermal degradation of [±45] composites compared to [0] composites.
Fig. 1: Cracks propagate along interfacedirection in T300/MBMI [±45] specimen
(150oC)
Fig. 2: Brittle cracking along 45° interfacedirection in T300/EP[±45] specimen (150o C)
Fig. 3: Brittle fracture of T300/EP [±45]specimen (150oC)
Fig. 4: Enhanced thermal resistance inT300/MBMI [±45] specimen (150oC)
Fig. 5: Notch opening and cracking inT300/EP [0] specimen (200oC)
Fig. 6: Cracks propagate along 0o interfacedirection in T300/EP [0] specimen (200oC);
more than one slip line is visible

Proceedings of ICCM–11, Gold Coast, Australia, 14th-18th July 1997
V - 471
(a) T300/MBMI [0] (b) T300/EP [0]Fig. 7: Interlaminar shear failure at
200oC
Fig. 8: Debonding in T300/MBMI [0] specimen(200oC)
Fig. 9: Debonded matrix and broken fiber in T300/EP [0] specimen
Fig. 10: 45o shear cracking through plythickness in T300/MBMI [±45] specimen
(150oC)
Fig. 11: Shear yielding in MBMI matrix at200oC
Fig. 12: Thermal cracking anddecomposition of epoxy matrix (200oC)

Volume V: Textile Composites and Characterisation
V - 472
RESIN DEGRADATION AT ELEVATED TEMPERATURES
Higher crosslink density and stiffer molecular chains contribute to the stronger interfacialadhesion in MBMI-1. At 200oC, the epoxy resin will experience thermal cracking as well aschemical decomposition, while MBMI-1 can still maintain good thermo-oxidative stability.Major decomposition of MBMI-1 resin occurs at approximately 390oC with glass transition at257oC, which are higher than epoxy’s 200oC and 150oC, respectively. Moreover, MBMI-1is toughened by PES particles, with a high fracture work of 2381 N-m. Its elongation at breakis 2.2%, which is 46% higher than epoxy’s 1.5%, matching that of T300. All these contributeto an adequate fiber-matrix adhesion and to the occurrence of shear yielding in MBMI-1composites even at elevated temperatures (Fig. 11). In epoxy composites at hightemperatures, however, interface debonding as well as matrix cracking and decompositionoften occur (Fig. 12).
CONCLUSION
(1) As a result of the good thermal resistance and thermal stability of MBMI-1, there is ahigh retention rate of mechanical properties, especially fracture toughness, inT300/MBMI-1 composites at elevated temperatures. In particular, the unidirectionalMBMI-1 composites seem to be capable of working in 150oC service environmentsunder all loading conditions investigated here, and perhaps also in 200oC environmentsto a limited extent. In all cases tested, MBMI-1 composites have a notable advantageover EP composites at 150oC.
(2) The PES-toughened MBMI-1 resin gives MBMI-1 [0] and MBMI-1 [±45] composites52% and 34% more fracture toughness than that found in EP [0] and EP [±45]composites, respectively. The good room-temperature toughness of MBMI-1composites also offers potential for practical applications.
(3) The thermal fracture mechanisms and failure processes of the carbon fiber MBMI-1 andEP composites have been characterized by in-situ observation of tests performed in theSEM. In MBMI-1 composites, delamination as well as notch tip blunting and crackingare delayed by the toughened matrix, especially at elevated temperatures. Interfacialadhesion and bonding tend to be less affected by temperature. However, in EPcomposites, the brittle nature and the lower thermal resistance of epoxy lead to earlieroccurrence of initial cracking, faster crack propagation rates and more seriousdelamination. At elevated temperatures, cracks propagate along the fiber direction as isthe case at room temperature. There are, however, more slip lines in the thermalenvironment. In both MBMI-1 and EP composites, interlaminar cracking through theply thickness also occur in [±45] composites, resulting in more serious thermaldegradation than in [0] composites. The thermal degradation in interlaminar shearstrength is more marked than in fracture toughness or tensile strength; this is because theeffect of debonding has less influence on tension and fracture. Important thermaldegradation mechanisms for the carbon fiber composites studied include matrixcracking, interface debonding and matrix decomposition, the latter being a limitingfactor for the performance of EP composites at 200oC.
(4) Our results indicate that MBMI-1 has high temperature resistance and good toughnessand MBMI-1 based carbon fiber composites can retain a useful fraction of room
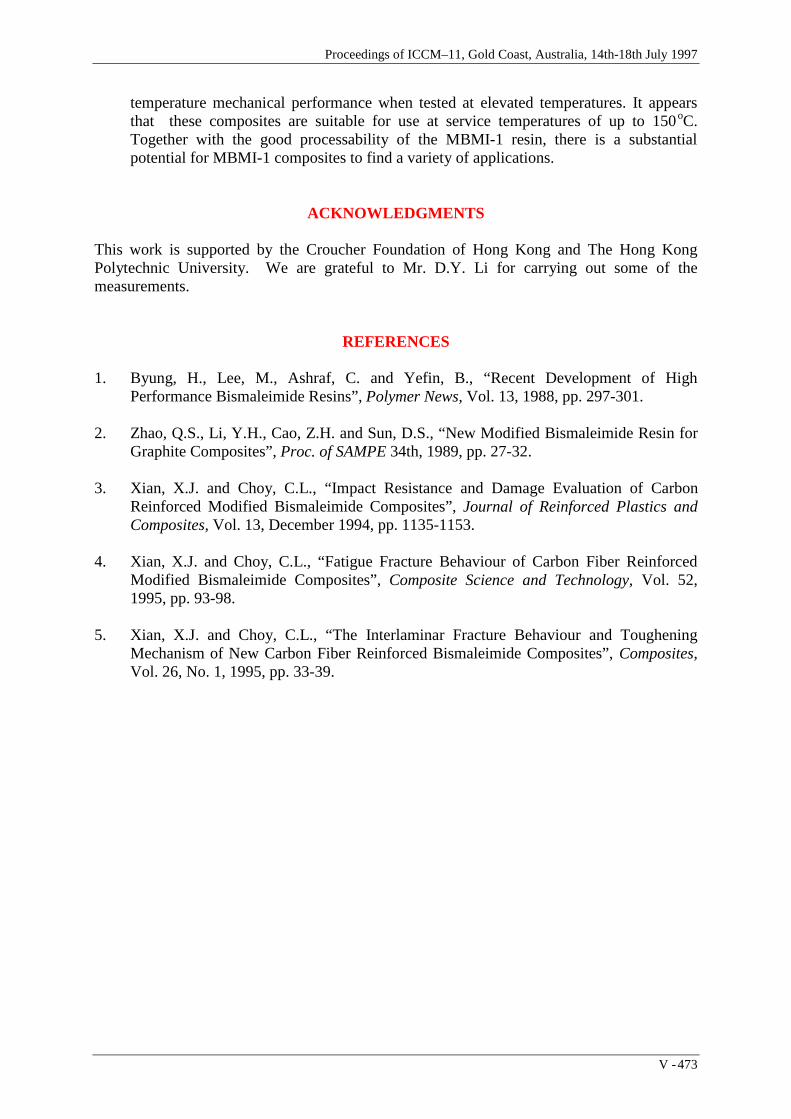
Proceedings of ICCM–11, Gold Coast, Australia, 14th-18th July 1997
V - 473
temperature mechanical performance when tested at elevated temperatures. It appearsthat these composites are suitable for use at service temperatures of up to 150oC.Together with the good processability of the MBMI-1 resin, there is a substantialpotential for MBMI-1 composites to find a variety of applications.
ACKNOWLEDGMENTS
This work is supported by the Croucher Foundation of Hong Kong and The Hong KongPolytechnic University. We are grateful to Mr. D.Y. Li for carrying out some of themeasurements.
REFERENCES
1. Byung, H., Lee, M., Ashraf, C. and Yefin, B., “Recent Development of HighPerformance Bismaleimide Resins”, Polymer News, Vol. 13, 1988, pp. 297-301.
2. Zhao, Q.S., Li, Y.H., Cao, Z.H. and Sun, D.S., “New Modified Bismaleimide Resin forGraphite Composites”, Proc. of SAMPE 34th, 1989, pp. 27-32.
3. Xian, X.J. and Choy, C.L., “Impact Resistance and Damage Evaluation of CarbonReinforced Modified Bismaleimide Composites”, Journal of Reinforced Plastics andComposites, Vol. 13, December 1994, pp. 1135-1153.
4. Xian, X.J. and Choy, C.L., “Fatigue Fracture Behaviour of Carbon Fiber ReinforcedModified Bismaleimide Composites”, Composite Science and Technology, Vol. 52,1995, pp. 93-98.
5. Xian, X.J. and Choy, C.L., “The Interlaminar Fracture Behaviour and TougheningMechanism of New Carbon Fiber Reinforced Bismaleimide Composites”, Composites,Vol. 26, No. 1, 1995, pp. 33-39.

Volume V: Textile Composites and Characterisation
V - 474
EVALUATION OF ULTIMATE STRENGTH OF HIGHTEMPERATURE COMPOSITE MATERIALS FOR SSTSTRUCTURES AT ELEVATED TEMPERATURES AND
AFTER THERMAL AGING
Toshiyuki Shimokawa1, Yasumasa Hamaguchi1, Yoshiaki Kakuta1, Hisaya Katoh1,Tomio Sanda2, Hiroshi Mizuno3, and Yasuhiro Toi4
1Airframe Division, National Aerospace Laboratory,6-13-1 Ohsawa, Mitaka, Tokyo 181, Japan
2Airframe Technology Research Department, Gifu Technical Institute,Kawasaki Heavy Industries, LTD., 1 Kawasaki, Kakamigahara 504, Japan
3Engineering Research Department, Nagoya Aerospace Systems,Mitsubishi Heavy Industries, LTD., 10 Oye, Minato, Nagoya 455, Japan
4Aerospace Division, Utsunomiya Plant, Fuji Heavy Industries, LTD.1-1-11 Yonan, Utsunomiya 320, Japan
SUMMARY: The objective of this experimental study was to evaluate the effect of thermalaging on the ultimate strength of three kinds of carbon/high-temperature polymer compositematerials, which are current candidate structural materials for a super sonic transport of thenext generation. The notched and unnotched panels, before being machined to specimens,were aged at 120°C and 180°C for up to 15,000 hours. Static tests at room and elevatedtemperatures before and after thermal aging provided the notched tensile, notchedcompressive, and short beam shear strengths. Moreover, the effects of five oxidation resistanttreatments on notched compressive strength at 180°C were investigated after thermal aging of5,000 hours at 180°C. The obtained results were presented and a possibility to develop anaccelerated environment test methodology is examined.
KEYWORDS: bismaleimide composites, thermoplastic polyimide composite, super sonictransport, notched strengths, short beam shear strength, thermal aging, oxidation resistanttreatments, accelerated test methodology
INTRODUCTION
The structures of super sonic transports (SST) of the next generation require long termdurability of structural materials in environments that include temperature, loads, and fluids,not only in constant states, but also during cyclic fluctuations. Moreover, the structuralweights must be drastically reduced to achieve commercial success. This requirementdemands a wide application of high temperature polymer composite materials.
Many fundamental studies have been conducted for investigating oxidation, micro-cracking,and weight loss by thermal aging, creep, etc. on high temperature polymer composites.
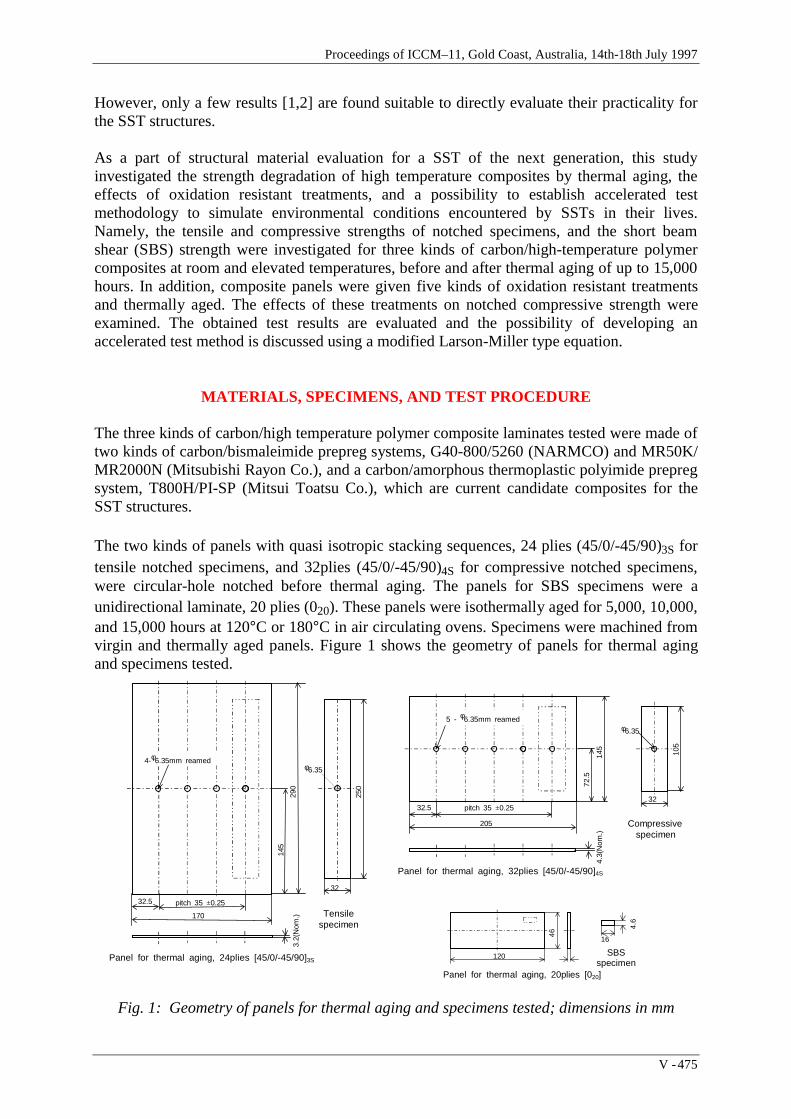
Proceedings of ICCM–11, Gold Coast, Australia, 14th-18th July 1997
V - 475
However, only a few results [1,2] are found suitable to directly evaluate their practicality forthe SST structures.
As a part of structural material evaluation for a SST of the next generation, this studyinvestigated the strength degradation of high temperature composites by thermal aging, theeffects of oxidation resistant treatments, and a possibility to establish accelerated testmethodology to simulate environmental conditions encountered by SSTs in their lives.Namely, the tensile and compressive strengths of notched specimens, and the short beamshear (SBS) strength were investigated for three kinds of carbon/high-temperature polymercomposites at room and elevated temperatures, before and after thermal aging of up to 15,000hours. In addition, composite panels were given five kinds of oxidation resistant treatmentsand thermally aged. The effects of these treatments on notched compressive strength wereexamined. The obtained test results are evaluated and the possibility of developing anaccelerated test method is discussed using a modified Larson-Miller type equation.
MATERIALS, SPECIMENS, AND TEST PROCEDURE
The three kinds of carbon/high temperature polymer composite laminates tested were made oftwo kinds of carbon/bismaleimide prepreg systems, G40-800/5260 (NARMCO) and MR50K/MR2000N (Mitsubishi Rayon Co.), and a carbon/amorphous thermoplastic polyimide prepregsystem, T800H/PI-SP (Mitsui Toatsu Co.), which are current candidate composites for theSST structures.
The two kinds of panels with quasi isotropic stacking sequences, 24 plies (45/0/-45/90)3S fortensile notched specimens, and 32plies (45/0/-45/90)4S for compressive notched specimens,were circular-hole notched before thermal aging. The panels for SBS specimens were aunidirectional laminate, 20 plies (020). These panels were isothermally aged for 5,000, 10,000,and 15,000 hours at 120°C or 180°C in air circulating ovens. Specimens were machined fromvirgin and thermally aged panels. Figure 1 shows the geometry of panels for thermal agingand specimens tested.
Fig. 1: Geometry of panels for thermal aging and specimens tested; dimensions in mm
32.5
170
145
290
Panel for thermal aging, 24plies [45/0/-45/90]3S
φ6.35
32
250
Tensilespecimen
pitch 35 ±0.25
4-φ6.35mm reamed
3.2(
Nom
.)
32.5
205
72.5
145
Panel for thermal aging, 32plies [45/0/-45/90]4S
φ6.35
32
105
Compressivespecimen
pitch 35 ±0.25
5 - φ6.35mm reamed
4.3(
Nom
.)
120
46
Panel for thermal aging, 20plies [020]
16
4.6
SBSspecimen

Volume V: Textile Composites and Characterisation
V - 476
Prior to static tests, specimens were dried in a vacuum oven for 6 hours at 70°C and then for144 hours at 110°C. Static tests were conducted at room and thermal aging temperatures.Moreover, the surfaces of the MR50K/MR2000N panels were given five kinds of oxidationresistant treatments. The effects of these treatments on notched compressive strength at 180°Cwere investigated after thermal aging of 5,000 hours at 180°C.
The notched tensile and notched compressive strengths are represented by nominal strengthcalculated using the nominal thickness based on the nominal prepreg thickness and the netwidth. The SBS strength is represented by net strength calculated using the measuredthickness.
TEST RESULTS
Notched Tensile Strength of G40-800/5260 Composite After Thermal Aging
Two batches of G40-800/5260 laminates were produced, and four specimens were used foreach test. Figure 2 presents the relationship between notched tensile strength and thermalaging time separated by the batches A and B. The presence of the strength degradation bythermal aging at 120°C is not clear. It is a future problem to elucidate that the obtained resultsare within a scatter band, or that the strength slightly decreases with thermal aging time. In thecase of thermal aging at 180°C, fairly large strength degradation appeared. Thermal agingtime over 15,000 hours is necessary to know if the strength degradation will saturate like inmetallic materials [3]. The strengths at room and thermal aging temperatures, at the sameaging time, are close for either thermal aging at 120°C or 180°C. A small difference betweenthe two batches of specimens appeared in the strength and degradation with thermal agingtime, as shown in Fig. 2.
There is no example to show the large scatter in notched tensile strengths observed for eachexperimental condition, i.e., a combination of test temperature, aging temperature, andthermal aging time.
0
100
200
300
400
500
600
700
800
Aging Time (hrs.)
Nom
inal
Str
engt
h (
MP
a)
120°C Aging, 23°C Test120°C Aging,120°C Test180°C Aging, 23°C Test180°C Aging,180°C Test
Carbon/Bismaleimide(G40-800/5260)
Tension Test Batch A
0(No aging)
5,000 10,000 15,0000
100
200
300
400
500
600
700
800
Aging Time (hrs.)
Nom
inal
Str
engt
h (
Mpa
)
120°C Aging, 23°C Test120°C Aging,120°C Test180°C Aging, 23°C Test180°C Aging,180°C Test
Carbon/Bismaleimide(G40-800/5260)
Tension Test Batch B
0(No aging)
5,000 10,000 15,000
Fig. 2: Notched tensile strength of G40-800/5260 carbon/bismaleimide composite versusthermal aging time for two batches A and B

Proceedings of ICCM–11, Gold Coast, Australia, 14th-18th July 1997
V - 477
Notched Compressive Strength After Thermal Aging
Figure 3 shows the relationships between notched compressive strength and thermal agingtime for the three kinds of high temperature polymer composites. Five specimens were usedfor each test in Fig. 3, except for a special case.
In the case of the G40-800/5260 bismaleimide composite and thermal aging at 120°C, thestrength at room temperature does not reduce with thermal aging time, but that at 120°Cslightly reduces. In the case of 180°C aging, the strength remarkably decreases with thermalaging time, and after 5,000 hours, this drop is almost proportional to thermal aging time. Asimilar trend of the notched compressive strength of a IM7/5260 composite at roomtemperature was reported by Rogalski [1]. The difference of the strengths at room and thermalaging temperatures at the same aging time are fairly large for thermal aging at both 120°C and180°C. This is different from the notched tensile strength in Fig. 2.
In the case of the MR50K/MR2000N bismaleimide composite and thermal aging at 120°C,the strength at 120°C shows a slight drop after thermal aging of 15,000 hours. In the case ofthermal aging at 180°C, the strength significantly decreases with thermal aging time. Thestrength degradation is especially great from 5,000 to 10,000 hours, and dulls after 10,000hours.
In the case of the T800H/PI-SP polyimide composite, non-aged strengths at room temperatureand 180°C are slightly lower in comparison with those of the other two materials. However,the strength degradation by thermal aging at 120°C and 180°C, up to 15,000 hours, was notfound.
There is no example to show the large scatter in notched compressive strengths observed foreach experimental condition and the three materials.
0
100
200
300
400
500
600
700
800
Aging Time (hrs.)
Nom
inal
Str
engt
h (
MP
a)
120°C Aging, 23°C Test120°C Aging, 120°C Test180°C Aging, 23°C Test180°C Aging, 180°C Test
Carbon/Bismaleimide(G40-800/5260)
0( No aging )
5,000 10,000 15,0000
100
200
300
400
500
600
700
800
Aging Time (hrs.)
Nom
inal
Str
engt
h
(MP
a)
No aging, 23°C Test120°C Aging,120°C Test180°C Aging,180°C Test
Carbon/Bismaleimide (MR50K/MR2000N)
0(No aging)
5,000 10,000 15,0000
100
200
300
400
500
600
700
800
Aging Time (hrs.)
Nom
inal
Str
engt
h
(MP
a)
No aging, 23°C Test120°C Aging, 120°C Test180°C Aging, 180°C Test
Carbon/Thermoplastic Polyimide (T800H/PI-SP)
0(No aging)
5,000 10,000 15,000
Fig. 3: Notched compressive strength versus thermal aging time for three kinds of high temperature composites

Volume V: Textile Composites and Characterisation
V - 478
Short Beam Shear Strength After Thermal Aging
In SBS tests, various behaviors appeared in the relationship between the central displacementof a SBS specimen and load, according to the combination of material, test temperature,thermal aging temperature, and thermal aging time. Therefore, it was difficult to physicallydefine the SBS strength in a way common to all cases. The SBS strength in this study isrepresented by the maximum stress which can be commonly determined for all test cases,though this definition is questionable as a SBS strength.
Figure 4 depicts the obtained results of SBS strength versus thermal aging time for three kindsof high temperature composites. The test number is fundamentally five for each case.
In these cases, for both carbon/bismaleimide composites, the SBS strengths at roomtemperature and at 120°C, did not drop after thermal aging at 120°C. The SBS strengths of theG40-800/5260 composite at room temperature and 180°C, after thermal aging at 180°C,reduced with fluctuations. In this material, the difference of strengths at room and thermalaging temperatures, at the same aging time, are large for thermal aging at bothe 120°C and180°C. This difference is largest among the notched tensile, notched compressive, and SBSstrengths, as presented in Figs. 2, 3, and 4.
The SBS strength of the MR50K/MR2000N composite at 180°C indicated a fairly large dropwith thermal aging time. The scatter of the SBS strength was high after the thermal aging at180°C.
In the case of the T800H/PI-SP composite, there was no reduction of the SBS strength afterthermal aging at 120°C and 180°C.
0
20
40
60
80
100
120
140
160
180
Aging Time (hrs.)
Mea
sure
d S
tren
gth
(M
Pa)
120°C Aging, 23°C Test120°C Aging, 120°C Test180°C Aging, 23°C Test180°C Aging, 180°C Test
Carbon/Bismaleimide(G40-800/5260)
0( No aging )
5,000 10,000 15,0000
20
40
60
80
100
120
140
160
180
Aging Time (hrs.)
Mea
sure
d S
tren
gth
(M
Pa)
No aging, 23°C Test120°C Aging, 120°C Test180°C Aging, 180°C Test
Carbon/Bismaleimide (MR50K/MR2000N)
0( No aging )
5,000 10,000 15,0000
20
40
60
80
100
120
140
160
180
Aging Time (hrs.)
Mea
sure
d S
tren
gth
(M
Pa)
No aging, 23°C Test120°C Aging, 120°C Test180°C Aging, 180°C Test
Carbon/Thermoplastic PolyimideT800H/PI-SP
0( No aging )
5,000 10,000 15,000
Fig. 4: Short beam shear (SBS) strength versus thermal aging time for three kinds of high temperature composites
Effect of Oxidation Resistant Treatment on Notched Compressive Strength
The notched compressive strength of the MR50K/MR2000N composite was heavily reducedby thermal aging at 180°C, as shown in Fig. 3. With respect to this material, the followingoxidation resistant treatments against circulating hot air were given to the panels to be

Proceedings of ICCM–11, Gold Coast, Australia, 14th-18th July 1997
V - 479
thermally aged, and the effects of these treatments on notched compressive strength wereinvestigated. Six panels of a new batch were made. They were of the same size indicated inFig. 1, and their surfaces and sections were given the following oxidation resistant treatments.A: no treatment given to get base data, B: holes were bolted, C: holes and sections weresealed by a bismaleimide resin, D: full surfaces and sections were painted by a thermalprotection paint, E: only holes and sections were painted by the same paint, F: covered by aglass fiber cloth. The main element of the thermal protection paint used was silicon.
Notched compressive specimens were machined from each panel after thermal aging of 5,000hours at 180°C. Compression tests were conducted at 180°C. Each case was tested four timesand the results obtained are presented in Fig. 5. In order to compare these results with thestrengths obtained at room temperature with no thermal aging, and those at 180°C afterthermal aging of 5,000 hours at 180°C in Fig. 3, the data of Fig. 3 were also plotted in Fig. 5.
The strengths at 180°C of the unprotected panels from different batches after the thermalaging are slightly different. This is considered to originate from the difference of the twobatches. The strength of the unprotected panel A and those of the protected panels B, D, E,and F are almost equal. Therefore, the protections B, D, E, and F had no effect on notchedcompressive strength. The protection C improved the average strength to only approximately10% higher than those of the other cases. This indicates a very important fact that if anappropriate protection method is selected, the strength degradation can be improved.
0
50
100
150
200
250
300
350
400
450
500
Nom
inal
Str
engt
h (
MP
a)
No aging 23°C test (Fig. 3)Unprotected (Fig. 3)A [Unprotected]B [Bolted]C [Hole & Edge sealed]D [All painted]E [Hole & Edge painted]F [G-cloth covered]Mean
Carbon/Bismaleimide (MR50K/MR2000N)
AB
C D E F
180°C x 5,000 hrs. Aging,180°C Test
Fig. 5: Effect of oxidation resistant treatment on the notched compressive strength ofMR50K/MR2000N carbon/bismaleimide composite
DISCUSSION
Characteristics of High Temperature Composite Materials
In the case of two kinds of bismaleimide composites, microscopic observation of the surfacesand sections indicated that the degradation by thermal aging at 180°C was produced mainlyby the matrix oxidation and micro-cracking in and inter the layers. No significant degradationcaused by thermal aging at 120°C was found on the panels of both bismaleimide composites.
Volume V: Textile Composites and Characterisation
V - 480
The upper limit of applicable temperature for both bismaleimide composites is considered tobe higher than 120°C, but lower than 180°C. It is necessary to find the upper limit betweenthe two temperatures. Moreover, the notched compressive strength of these materials at120°C, after thermal aging at 120°C, indicated a trend of slight degradation. Meanwhile,Rogalski presented no degradation of the notched compressive strength of the IM7/5260bismaleimide composite at room temperature after thermal aging of 16,000 hours at 149°C[1]. In order to discern this problem, it is necessary to conduct static tests at elevatedtemperatures after thermal aging longer than 15,000 hours.
In the G40-800/5260 composite, the ascending order of the strength differences at room andaging temperatures, at the same aging time, is notched tensile strength, notched compressivestrength, and SBS strength.
Figures 3 and 4 present promising results for the T800H/PI-SP thermoplastic polyimidecomposite; however, micro-cracks were observed after thermal aging at 120°C and 180°C inboth outer and inner layers. To prevent micro-cracking is an issue of vital importance for thismaterial.
In comparison of the test results in Fig. 4 with those in Fig. 3, the degradation tendency innotched compressive strength and SBS strength is a bit different for both bismaleimidecomposites after thermal aging at 180°C. However, the notched compressive strength did notdrop when no degradation appeared in the SBS strength, such as the SBS strength at roomtemperature and 120°C, after thermal aging at 120°C, and those of T800H/PI-SP composite at120°C and 180°C, after thermal aging at 120°C and 180°C respectively. These results providea rough suggestion that no degradation of SBS strength means no degradation in notchedcompressive strength.
A large scatter in the data points was observed in the SBS strength of the MR50K/MR2000Ncomposite after thermal aging at 180°C. Except for these cases, the scatter of test results isconsiderably small.
Application of a Modified Larson-Miller Equation in Analyzing the Strength AfterThermal Aging
Shimokawa and Katoh modified Larson-Miller’s equation, which is generally applied inanalyzing the creep strength of metals, as
ln ( ) ( ) lnS a b T c d T L= + ⋅ + + ⋅ , (1)
and used to analyze the strength of light metallic materials after thermal aging [3]. Strength isdenoted by S, temperature by T, aging time by L. a, b, c, and d are parameters. OriginalLarson-Miller’s equation is given by c=0.
Equation (1) indicates that if T is constant, lnS and lnL have a linear relationship. If at leastthe test results satisfy this relationship, an accelerated thermal aging test can be performed.The test results given in Figs. 2, 3, and 4 are separately plotted on double logarithmic graphpaper, though they are not presented here. Equation (1) is considered to be not applicable forthe test results except for the notched compressive and SBS strengths of the T800H/PI-SPcomposite. They were unchanged with thermal aging time. Meanwhile, Eq. (1) can be applied

Proceedings of ICCM–11, Gold Coast, Australia, 14th-18th July 1997
V - 481
for only the data within a limited range of aging time. This problem is left for futureinvestigation.
CONCLUSIONS
The notched tensile, notched compressive, and short beam shear strengths of two kinds ofbismaleimide composites and a kind of thermoplastic polyimide composite were investigatedat room and thermal aging temperatures, before and after thermal aging, up to 15,000 hours.Major conclusions obtained are as follows:
(1) In the case of the G40-800/5260 bismaleimide composite, the degradation of notchedtensile strength by thermal aging at 120°C was not clear. Although the notchedcompressive strength at room temperature was not reduced by thermal aging at 120°C, thisstrength at 120°C slightly decreased after thermal aging of 15,000 hours. The latter factwas also identical for the MR50K/ MR2000N bismaleimide composite.
(2) Significant reduction was observed in the notched tensile, notched compressive, and SBSstrengths of both G40-800/5260 and MR50K/MR2000N composites after thermal aging at180°C.
(3) In the case of the G40-800/5260 composite, a small difference between the specimens oftwo batches appeared in the notched tensile strength and its reduction with thermal agingtime.
(4) The upper limit of practically applicable temperatures for both G40-800/5260 andMR50K/ MR2000N composites is considered to be between 120°C and 180°C, though thenotched compressive strength of both materials at 120°C should be investigated, even afterthermal aging at 120°C for longer than 15,000 hours.
(5) In the case of the G40-800/5260 composite, the ascending order of the strength differencesat room and aging temperatures, at the same aging time, is notched tensile strength,notched compressive strength, and SBS strength.
(6) No degradation of notched compressive and SBS strengths was observed for theT800H/PI-SP thermoplastic polyimide composite after thermal aging at 120°C and 180°Cup to 15,000 hours.
(7) Only one kind of oxidation resistant treatment provided a slight improvement of thenotched compressive strength of the MR50K/MR2000N composite after thermal aging of5,000 hours at 180°C.
(8) Large scatter was observed only in the SBS strength of the MR50K/MR2000N compositeafter thermal aging at 180°C.
(9) At least the relationship between strength and thermal aging time, under a constant agingtemperature, must be linear on double logarithmic graph paper for an accelerated thermalaging test using a modified Larson-Miller’s equation. In the case of thermal aging at180°C, this kind of relationship was not observed for both bismaleimide composites.
REFERENCES
1. Rogalski, M.E., “Aging of Polymeric Materials for Use on HSCT,” SAE Technical PaperSeries 942162, SAE International, 1994.

Volume V: Textile Composites and Characterisation
V - 482
2. Poole, E.L. and Lin, K.Y., “Effects of Aging on Compressive Strength of CompositesAfter Impact,” AIAA-94-1532-CP, Proc. 35th SDM Conf., American Institute ofAeronautics and Astronautics, 1994, pp. 1683-1690.
3. Shimokawa, T. and Katoh, H., “Application of the Larson-Miller Equation to StrengthEstimation of Light Metallic Materials After Thermal Aging,” Proc. 34th AircraftSymposium, Japan Society for Aeronautical and Space Sciences, 1996, pp. 241-244. (inJapanese)
Proceedings of ICCM–11, Gold Coast, Australia, 14th-18th July 1997
V - 483
THE EFFECT OF MOISTURE ON THE INTERFACIALSTRENGTH OF GRAPHITE-EPOXY AND
E-GLASS-EPOXY COMPOSITES
W. L. Bradley, C. A. Wood, B.A. Pratt, and C. S. Chatawanich
Department of Mechanical Engineering and Offshore Technology Research CenterTexas A&M University, College Station, TX 77843-3123, USA
SUMMARY: The effect of absorbed moisture on the fiber/matrix interfacial strength and 900
ply strength have been studied for E-glass and carbon fiber reinforced epoxy. Single fiberfragmentation tests have indicated a 19% reduction in the interfacial strength in carbon/epoxycomposites which absorbed 1.4% of their matrix weight in seawater. Micro indentationmeasurement on E-glass/epoxy composites indicated a 25% reduction in the interfacial shearstrength when the absorbed seawater increased from 1.2 to 2.2% of the matrix weight. In-situobservations of fracture in an environmental scanning electron microscope with associatedcalculations indicated reductions in interfacial strength ranging from 0 to 30%, with 2/3rdsattributed to reductions in interfacial strength and the balance due to changes in the residualthermal stresses.
KEYWORDS: polymeric composites, carbon, E-glass, epoxy, seawater, interfacial strength,microindention, single fiber fragmentation test
INTRODUCTION
The prospect of large oil reserves at 2000m of ocean depth has created a significant interest inthe possibility of using polymeric composite tubulars for both drilling risers and productionrisers. The higher specific strength of polymeric composite material systems can potentiallyallow conventional equipment designed for drilling and oil production using floating shipsand platforms for depths of <1000m to be used at these greater depths by reducing thehanging weight of the tubulars. The potential use of polymeric matrix composites foroffshore applications has been recently reviewed [1] and the economic feasibility of usingpolymeric composite tubulars for production risers has already been demonstrated [2].
Polymeric matrix composites are known to have excellent fatigue resistance, do not corrode,and can be tailored to give optimal combinations of stiffness, strength, and thermal expansionby proper ply sequencing. The two technical obstacles to the use of polymeric compositematerials for offshore risers are joining and long-term durability. While polymeric compositematerials do not corrode like metals, they do absorb moisture, generally 1-3% of the weightof the matrix. This absorbed moisture can potentially soften the matrix, reduce the strength ofthe glass fibers (carbon fibers appear to be unaffected by moisture), and/or degrade thestrength of the fiber matrix interface. Since production risers will be immersed continuouslyfor 10-20 years, they will certainly reach saturation levels of moisture absorption eventually.Thus, the effect of the absorbed moisture on long term durability needs to be determined.

Volume V: Textile Composites and Characterisation
V - 484
The purpose of this study has been to investigate effect of the absorbed moisture on theinterfacial strength of several polymeric composite material systems. Direct observations ofthe initiation of damage in the systems investigated in this study indicate that the failurescenario begins with interfacial failure by debonding leading to transverse cracking, andsubsequently, delamination. Absorbed moisture can perturb this failure scenario by reducingthe chemical adhesion at the fiber/matrix interface, relaxing the residual compressive stressesat the fiber/matrix interface, reducing the ply level residual tensile stresses in the 90o plies,and toughening the polymeric matrix. Since these various effects of absorbed moisture canpotentially postpone interfacial failure or cause it to occur prematurely, a more careful studyhas been undertaken to determine the effect of absorbed moisture on the interfacial strengthand on the ply level mechanical stress at which interfacial failure leading to transversecracking occurs.
To determine the effect of absorbed moisture on the initiation of ply level damage in a multiaxial laminate, micro indentation tests [3] and tensile tests in-situ in an environmentalscanning electron microscope have been performed on specimens as received and specimensaged in seawater until a saturation level of moisture absorption has occurred. Single fiberfragmentation tests [4] have also been used to investigate the effect of absorbed moisture onthe interfacial shear strength.
EXPERIMENTAL AND ANALYTICAL PROCEDURES
Two polymeric composite material systems have been studied in this investigation: (a) a Shell828 epoxy (DGEBA), cured at 398K with meta-phenylene diamine (mPDA), reinforced withE-glass type 30 Owens Corning fibers and (b) a proprietary diglycidyl ether bisphenal-A(DGEBA) with 5% rubber added for toughening, with a cure temperature of 422K, reinforcedwith E-glass fibers and graphite fibers (a hybrid composite). Two different sizings were usedon the E-glass fibers in the 828 epoxy, one properly coated for compatibility with an epoxymatrix and the other coated for use with a vinyl ester. Hereafter, the 828 epoxy will bereferred to as Epoxy 1 and the proprietary epoxy with 5% rubber additions will be referred toas Epoxy 2.
Single-fiber fragmentation test specimens were prepared by casting AS4 carbon fibers fromHercules in a dog bone shaped tensile specimen of Epoxy 2. Load and displacementmeasurements were made during testing using a load cell and an LVDT, with fiber breaksrecorded using acoustic emission. Aging of specimens was done by emersion for 110 days insimulated seawater prepared from Instant Ocean Mix (purchased from a pet store). Otherspecimens were dried by heating in a vacuum furnace until the specimen weight stabilized.The moisture content for the three specimens tested were 0, 0.65 and 1.40% of the weight ofthe epoxy. The number of breaks as a function of strain was recorded and analyzed using theKelly-Tyson approach [5]. Fiber strength was calculated using Weibull statistics applied tothe single fiber fragmentation test itself, as suggested by Wagner [6]. The strain used todetermine the stresses which were then used in the Weibull distribution was calculated fromthe mechanical strain applied to the specimen, the thermal cool down strain, and the swellingstrain which occurs with moisture absorption. Additional information about the experimentaldetails and analysis are presented in Reference 7.

Proceedings of ICCM–11, Gold Coast, Australia, 14th-18th July 1997
V - 485
Micro indentation tests were performed on Epoxy 1 reinforced with E-glass fibers in alaminate made from prepreg with a stacking sequence of (45/90)s. Fiber volume fractionwas 0.65 and curing was at 398K for 2 hours. One laminate was made using E-glass with aproper sizing for vinyl ester to see how sensitive to sizing is the moisture sensitivity of theinterfacial strength. Some specimens were aged by soaking to saturation in simulatedseawater prepared from Instant Ocean Mix. Weight gain was 1% of the matrix weight, for atotal moisture content of 2.2%, since drying experiments indicated an initial moisture contentas fabricated of 1.2% of the matrix weight. Testing was performed on a carefully polishedsurface using an Interfacial Testing System (ITS) manufactured by Dow Chemical. Since thedebonding of glass fibers is gradual rather than at a single load, the debonding load was takenwhen debonding was >90o of the circumference of the fiber. The interfacial shear strengthwas determined using software which utilizes a linear elastic analysis [8]. During the testingof the aged specimens, it was necessary to keep the surface covered with seawater during thetesting to avoid changes in the measurement due to dehydration of the specimens.Approximately 10 interfacial shear strength measurements were made on each specimen.Additional experimental details are summarized on Reference 8.
Tensile tests were performed in an environmental scanning electron microscope (ESEM) toallow direct observations of the failure scenario of 90o plies. Special tensile specimens wereprepared by grinding and polishing the edges of rectangular specimens 38mm long by 6mmwide, as seen in Figure 1. The reduced specimen width at the midpoint of the specimenlength gives a maximum stress at this same location, causing the damage initiation to besufficiently localized to allow it to be captured in the early stages. Getting a goodmetallographic polish on a curved surface required the development of some new polishingtechniques. The aged specimens were tested in the ESEM with a 100% relative humidity toavoid dehydration during testing. Unaged specimens were tested at a much lower pressureand humidity in the ESEM. The specimens were loaded in displacement control, with bothload and displacement monitored. The displacements were applied in step wise fashion, withcareful surveying of the polished edge and photographic documentation of damageaccumulation being done at each displacement step.
The laminate load measured at a given displacement was used to calculate the ply levelstresses in the 90o plies at the initiation of debonding and at the first occurrence of transversecracking using software based on classical laminate theory [9]. The ply level residual stresseson cool down to room temperature were also calculated using the same laminate analysis [9].The residual stresses at the fiber/matrix interface were calculated using a micromechanicsanalysis based on linear elasticity called MICSTRAN [10,11]. MICSTRAN was also used tocalculate the local stress concentration as a function of location around the circumference ofthe fiber/matrix interface as seen in Fig. 1c. Thus, the local redial stresses at the fiber matrixinterface due to ply level mechanical and residual thermal stresses can be calculated.Alternatively, the residual thermal stresses at the fiber/matrix interface or the interfacialstrength for debonding due to normal stressing could be converted into an equivalent ply levelresidual or critical stress.

Volume V: Textile Composites and Characterisation
V - 486
Figure 1 a & b: The test geometry for specimens loaded to fracture in the ESEM, indicatingthe stacking sequence for the hybrid composites (E-glass and carbon/epoxy-2), (a) [Oc 190g] s
Figure 1c. Schematic showing the calculation of local radial stress at the fiber/matrixinterface as a function of the ply level thermal and mechanical stresses
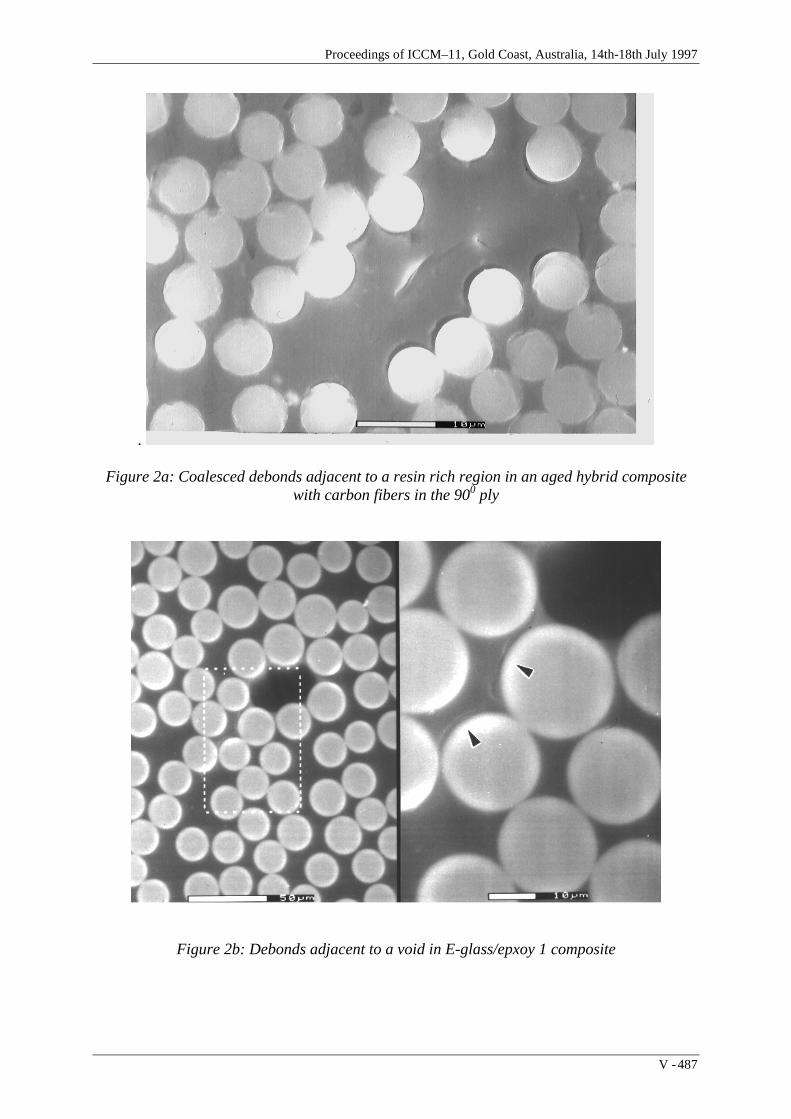
Proceedings of ICCM–11, Gold Coast, Australia, 14th-18th July 1997
V - 487
.
Figure 2a: Coalesced debonds adjacent to a resin rich region in an aged hybrid compositewith carbon fibers in the 900 ply
Figure 2b: Debonds adjacent to a void in E-glass/epxoy 1 composite

Volume V: Textile Composites and Characterisation
V - 488
RESULTS AND DISCUSSION
Direct observations of fracture in the ESEM is seen in Figure 3. In the E-glass/epoxy 1system, interfacial failures usually occurred first adjacent to local heterogeneities such asvoids whereas in the carbon and E-glass/epoxy 2 system it occurred adjacent to local resinrich regions. In neither case was debonding found to be in a homogeneous region of thecomposite microstructure. Once debonding initiated in a local region, new debonds werefound to take place adjacent to the original ones as the load is locally redistributed.
Figure 3: Interfacial shear strength determined from microindentation tests for E-glass/epoxy-1 system with an appropriate sizing for epoxy (158B) and a sizing for vinylesters
(366), unaged (1.2% moisture), and aged (2.2% moisture)
Figure 4: Interfacial shear strength for carbon/epoxy-2 system with different levels ofabsorbed seawater, determined using single fiber fragmentation tests
A general observations of randomly arranged debonds which ultimately begin to coalescewhen the local density reaches some critical level (like fiber failures) was never observed inany of the more than 50 tests run on a variety of specimens. It seems clear that debondingleading to transverse cracking is controlled by local heterogeneities and once initiated tends to

Proceedings of ICCM–11, Gold Coast, Australia, 14th-18th July 1997
V - 489
remain quite localized. Absorbed moisture was not found to affect the failure scenario, butonly the load levels at which debonding began and transverse cracking ultimately wasconsummated.
The results of the Micro indentation tests to measure interfacial strength are presented inFigure 3 for the carbon/epoxy-2 system. The effect of moisture level as manufacturedcompared to artificially dried is seen to be insignificant. The absorbed moisture at a saturationof 1.4%, however, gives a reduction of 19%.
The interfacial shear strength in the E-glass/epoxy-1 system as measured by the microindentation test is seen in Figure 4. Note that the E-glass with the proper 158B sizing had abetter unaged interfacial strength and was less moisture sensitive, losing only 25% of itsinterfacial strength. On the other hand, the E-glass with the 366 sizing for vinyl esters lostmore than 50% of its interfacial strength when saturated with seawater, indicating theimportance of the use of a proper sizing for seawater immersion applications.
To analyze the interfacial stress at the fiber/matrix interface at which interfacial debondingoccurs, the local stress at the fiber matrix interface was calculated beginning with the localstress due to ply level stress, as shown in Figure 1c, with the value of the stress concentrationfactor used being determined from MICSTRAN. Since almost all debonds were observed atthe top or bottom of the fibers (theta = 90o), the local stress due to ply level mechanical andresidual thermal stresses was evaluated at this position. The local interfacial residual thermalstress in the radial direction was also determined using MICSTRAN. Finally, the interfacialstrength was calculated as follows:
σ22 int = (σ22 mech ply+σ22 resid ply) x SC(θ=90o) + σrr int th (1)
where σ22 mech ply and σ22 resid ply are the mechanical stress due to external loading and theresidual thermal stress due to differntial thermal contraction during cool down (modified bymoisture induced swelling) in the 90o ply, SC is the stress concentration factor relating localstress in the radial direction to ply level stress, and σrr int th is the local residual thermal stressesdue to differential thermal contraction between the fiber and the matrix. It is worth notingthat the ply level residual thermal stress is tensile in the 900 plies whereas the local residualthermal stress is compressive. Thus, one is helpful in postponing debonding whereas theother makes debonding easier. Both the local level residual thermal stress and the interfacialstrength can be converted to equivalent ply level stresses using the stress concentration factor(SC), which is 1.45 for carbon fiber/epoxy and 1.82 for E-glass/epoxy. When the debondingoccurs next to a spherical void, an additional stress concentration factor of 2.18 [13] needs tobe multiplied times the 1.82 to calculate the local interfacial stress from ply level stresses or tocalculate equivalent ply level stresses from the local thermal residual stresses or interfacialstrength. Equation 1 can be rearranged to express the ply level mechanical stress at whichdebonding and subsequent transverse cracking occur, as follows:
σ22 mech ply = (σrr int - σrr int th)/SC - σ22 resid ply (2)

Volume V: Textile Composites and Characterisation
V - 490
Figure 5: The effect of absorbed seawater on the ply strength (lower, right) and on theinterfacial strength, local residual thermal stress normal to the fiber/matrix interface and plylevel thermal residual stress. Note the interfacial strength and local residual thermal stress
are expressed in equivalent ply level stresses which are calculated by dividing the localvalues by an appropriate stress concentration factor, as described in the text

Proceedings of ICCM–11, Gold Coast, Australia, 14th-18th July 1997
V - 491
At transverse cracking, σ22 mech ply is the 900 ply strength and σrr int is the interfacialstrength for stresses applied normal to the fiber matrix interface. The results of this analysisare presented in Figure 5 for all three systems. From an engineering point of view, the effectof the absorbed moisture on the mechanical stress level at which debonding and subsequenttransverse cracking initiates is most important, and is presented in Fig. 5, lower right. Theremaining three graphs allow one to infer the reasons for the observed changes in theallowable mechanical stress level in a seawater saturated polymeric composite. The absorbedmoisture decreases the residual thermal stresses in the radial direction at the fiber/matrixinterfacial, causing then to go net positive in two of the systems. However, the ply levelresidual thermal stresses which are tensile are relaxed by the absorbed seawater, which wouldgive a greater ply level mechanical strength. In each of the systems studied, the combinedeffects of the residual thermal stresses at the ply level and the local interfacial level was togive a net decrease in the ply level mechanical strength of between 1.4 and 4.2 MPA in thethree systems studied, or 6-8% of the respective unaged ply strength of the systems studied.
The reduction in interfacial strength resulted in a decrease in the ply strength ranging fromessentially zero in the system with only 1.0% increase in seawater to 10.1 MPa, or 20% in thecarbon/epoxy-2 system, which absorbed 1.3% seawater. It should be noted that the samesystem in the single fiber fragmentation test absorbed 1.4% seawater and gave a 19%reduction in the interfacial shear strength, which is surprisingly consistent, since one ismeasuring changes in interfacial strength for shear stressing and the other is measuringinterfacial strength for stresses applied perpendicular to the fiber/matrix interface; however,the absolute values of the unaged and aged interfacial strengths are different, as one mightexpect. These results suggest that 2/3rds of the overall decrease in the critical strain (orstress) at which damage begins in 90o plies is due to moisture reduced changes in interfacialstrength with the remaining 1/3rd due to changes in residual thermal stresses (at the ply andlocal level, combined).
The very low values of ply strength in the E-glass/epoxy-1 system were due to damageinitiation always occurring at small, spherical voids in the microstructure which wereintroduced during processing. While the overall void content was less than 1%, these voidsstill dominated the failure process in the 900 plies. The low ply strength in the E-glass/epoxy-2 was due to the very high ply thermal stresses due to the very stiff adjacent 0o plies of carbonfiber. In the E-glass/epoxy-1 system, the plies adjacent to the 90s were 45s of glass. In thegraphite/epoxy-2 system, adjacent 00 plies were E-glass.
Finally, the values presented in Figure 5 should be consider illustrative, but only semi-quantitative since the residual thermal stresses were not calculated with a viscoelastic analysisbut just used the room temperature modulus of the matrix. The stress concentration andthermal residual stresses calculated with MICSTRAN are dependent on the local fiberarrangement, with only diamond and square arrangement permitted. The actual fiberarrangements in the microstructure were more complicated and were generally neither squareor diamond arrays.

Volume V: Textile Composites and Characterisation
V - 492
REFERENCES
1. Gibson, A.G., “Composite Structures in Offshore Applications”, Composite Materialsin Marine Structures, Chapter 3, 1993, R.A. Shenoi, Ed. Cambridge Ocean TechnologySeries.
2. Tamarelle, P.J. C. and Sparks, C.P., Proceedings of Nineteenth Annual OffshoreTechnology Conference, Houston, TX, May 1987 (Richardson, TX: OffshoreTechnology Conference), p. 255.
3. Chen, E.J.H., and R.B. croman. 1993. “Microdebonding Investigation of the Effects ofThermal Residual Stress on the Bond Strength of a Graphite/Polyimide Composite”,Composites Science and Technology, 48: 173-179.
4. Drzal, L.T., Rich, M.J. and Lloyd, P.E., “Adhesion of Graphite Fibers to EpoxyMatrices: I. The Role of Fiber Surface Treatment”, Journal of Adhesion, Vol. 16, 1982,pp. 1-30.
5. Kelly, A. and Tyson, W.R., Journal Mech. Phys. Solids, 1965, Vol. 13, p.329.
6. Yavin, B., Gallis, H.E., Scherf, J., Eitan, A. and Wagner, H.D., “Continuous Monitoringof the Fragmentation Phenomenon in Single Fiber Composite Materials”, PolymerComposites, Vol. 12, No. 6, 1991, pp. 436-446.
7. Pratt, B, “Determining the Effect of Seawater on the Interfacial Shear Strength of FiberReinforced Eopoxies using the Single Fiber Fragmentation Test”, M.S. Thesis, TexasA&M University, December, 1996.
8. Chatawanich, Candy, “The Effect of Moisture on a Glass/Epoxy Composite”, M.S.Thesis, Texas A&M University, May 1996.
9. Wood, Catherine, “Determining The Effect of Seawater on the Interfacial Strength of anInterlayer E-Glass-Graphite/Epoxy Composite Using Observations of TransverseCracking Made in-Situation”, M.S. Thesis, Texas A&M University, September, 1996.
10 Chen, E.J.H., and R.B. Croman. 1993, “Microdebonding Investigation of the Effects ofThermal Residual Stress on the Bond Strength of a Graphite/Polyimide Composite”,Composites Science and Technology, 48: 173-179.
11. Naik, R.A. 1992. “Micromechanical Combined Stress Analysis - MICSTRAN, A UserManual”, NASA Contractor Report 189694, National Aeronautics and SpaceAdministration, Langley Research Center, Hampton, VA.
12. Crews, J.H., R.A. Naik, and S.J. Lubowinski. 1993. “An Analysis of Fiber-MatrixInterface Failure Stresses for a Range of Ply Stress States”, NASA TechnicalMemorandum 108999, National Aeronautics and Space Administration, LangleyResearch Center, Hampton, VA.
13. Timoshenko, S.P. and Goodier, J.N., Theory of Elasticity, New York: McGraw-HillBook Company, 1934.

Proceedings of ICCM–11, Gold Coast, Australia, 14th-18th July 1997
V - 493
DURABILITY OF FIBRE REINFORCED COMPOSITEMATERIALS AFTER TWENTY YEARS OF
EXPOSURE TO WEATHERING
A. Yoosefinejad and P. J. Hogg
Queen Mary and Westfield College,Department of Materials,
Mile End Road, London E1 4NS, UK
SUMMARY: Two GRP panels (a bus shelter and a building panel) of 12 and 20 years oldrespectively were obtained and their service histories were established. Test specimens wereprepared to mechanically characterise the weathered panels. Fresh GRP panels were obtainedfrom the manufacturers and the test data from them were used to establish the effect of 20years of weathering on the GRP panels. No significant deterioration in the moduli of theweathered panels was observed. The tensile and flexural strengths of the bus shelter hasshown a 40% decrease in comparison with the fresh panels.
KEYWORDS: durability, GRP, weathering, mechanical properties of GRP
INTRODUCTION
Although the use of fibre reinforced composite (FRC) materials is becoming wide spread inconstruction, their use dates back to the late sixties and early seventies as facia panels mostlyfor aesthetic purposes. One such panel has come to our possession at QMW. The panel wasinstalled in a council housing estate (Elgin Towers, London) which was subsequentlydemolished in 1993 and this particular panel (Panel A) was saved from destruction and finallyfound its way to QMW. The panel was estimated to be 20 years old and its primary purposewas as a cladding panel. It had no structural role but was subjected to environmental attack.The panel was exposed to open air on one side and the inner face was insulated withpolyurethane foam.
The panel, Fig. 1, was divided into two and one half was used to determine its mechanicalproperties and the fibre volume fraction.
At the same time as the panel arriving at QMW, London Transport (LT) was in the process ofupgrading London bus shelters with a new design and one of the bus shelters was situatedoutside the Engineering building of QMW. After it was dismantled the roof of the shelter wasdonated to us. The shelter consisted of a metal frame and chopped strand mat composite panel(Panel B), Fig. 2. LT were able to provide us with the date of manufacture and the name ofthe manufacturers. The shelter was in service from 1983-1995. The manufacturer gave us thedetails of the material and two further plates were sent to us (Panel C and D) whichrepresented the same lay up as the old bus shelter. All panels were mechanicallycharacterised.

Volume V: Textile Composites and Characterisation
V - 494
Approx 5 deg tapper
2010
1290
This is the line of tapper which reduces to zero almost at the bottom left hand corner.
34
110
215
15 deg
A - A
A A
Fig. 1: Schematic representation of panel A
THE AIMS
• to establish mechanical properties of the panels• to determine their constituents• to manufacture similar panels using more or less the same type of materials used in the
construction of the old panels• to provide a better understanding of the degree of degradation due to exposure to twenty
and twelve years of weathering by comparing the properties of the old and new panels
MECHANICAL CHARACTERISATION
The specimens were prepared according to ASTM standards. The samples were cut from thepanels and no additional cleaning was under-taken, unless strain gauges were necessary tocarry out testing. The panels showed typical matrix cracking on the exposed surfaces,particularly so on the bus shelter. Closer inspection of the bus shelter gel coat showed voidsfilled with dust and airborne particles such as vehicle emission which were consolidated in thevoids, perhaps by rain water. In some areas of the panel signs of rust spots were observedwhich were perhaps caused by metallic particles thrown about in the air by vehicles. Therewas no evidence that damage caused by the environment had penetrated the gel coat to thefibre and resin layer.
Mechanical test data revealed that panel A had superior mechanical properties in comparisonto panel B, as shown in Tables 1 and 2. The reason for this became apparent by further burn-off test on the two panels; the fibre content of the panel A was twice the amount obtainedfrom panel B. The average thickness of the both panels is the same, but the bus shelter wasgel coated on the both sides and average thickness of the gel coat was measured to be 0.6 mmThe data generated for panels C and D provided a base line to determine the degradation ofthe panel B. The stiffness values were very close compared with the weathered materials butthere was a marked difference in the strength values. Panels C and D yielded strength valuesof almost twice the values obtained from panel B.
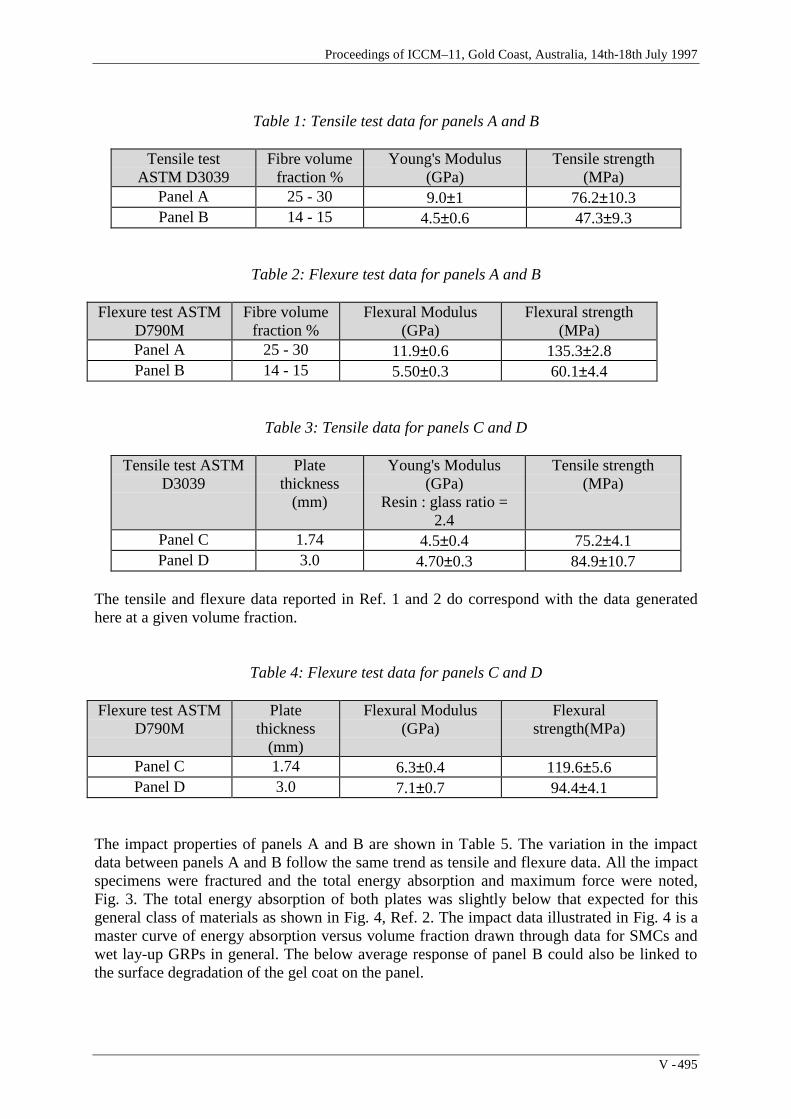
Proceedings of ICCM–11, Gold Coast, Australia, 14th-18th July 1997
V - 495
Table 1: Tensile test data for panels A and B
Tensile testASTM D3039
Fibre volumefraction %
Young's Modulus(GPa)
Tensile strength(MPa)
Panel A 25 - 30 9.0±1 76.2±10.3Panel B 14 - 15 4.5±0.6 47.3±9.3
Table 2: Flexure test data for panels A and B
Flexure test ASTMD790M
Fibre volumefraction %
Flexural Modulus(GPa)
Flexural strength(MPa)
Panel A 25 - 30 11.9±0.6 135.3±2.8Panel B 14 - 15 5.50±0.3 60.1±4.4
Table 3: Tensile data for panels C and D
Tensile test ASTMD3039
Platethickness
(mm)
Young's Modulus(GPa)
Resin : glass ratio =2.4
Tensile strength(MPa)
Panel C 1.74 4.5±0.4 75.2±4.1Panel D 3.0 4.70±0.3 84.9±10.7
The tensile and flexure data reported in Ref. 1 and 2 do correspond with the data generatedhere at a given volume fraction.
Table 4: Flexure test data for panels C and D
Flexure test ASTMD790M
Platethickness
(mm)
Flexural Modulus(GPa)
Flexuralstrength(MPa)
Panel C 1.74 6.3±0.4 119.6±5.6Panel D 3.0 7.1±0.7 94.4±4.1
The impact properties of panels A and B are shown in Table 5. The variation in the impactdata between panels A and B follow the same trend as tensile and flexure data. All the impactspecimens were fractured and the total energy absorption and maximum force were noted,Fig. 3. The total energy absorption of both plates was slightly below that expected for thisgeneral class of materials as shown in Fig. 4, Ref. 2. The impact data illustrated in Fig. 4 is amaster curve of energy absorption versus volume fraction drawn through data for SMCs andwet lay-up GRPs in general. The below average response of panel B could also be linked tothe surface degradation of the gel coat on the panel.

Volume V: Textile Composites and Characterisation
V - 496
Table 5: Impact properties of panels A and B
Thickness(mm)
Fibre volumefraction %
Force (N) Energy absorption(Joules)
Panel A 2.9 28-30 4500 13.7Panel B 2.9 14 - 15 1500 30
LONG TERM DATA
There is limited long term weathering data on chopped strand mat composite materials andone of such study was published by Norris et al. [3]. They reported an average increase of15% in tensile modulus during a two year study. The increase was due to the effect ofradiation which in turn increased the post curing. The flexural modulus was reported todecrease by 15 - 20% for the same duration, since flexural modulus depends on the surfaceproperties and since weathering degrades surfaces (as was observed on panels A and B)causing a reduction in flexural modulus.
CONCLUSION
The panels A and B were not exposed to any structural load for any significant period of timeand the only major attack had been due to the natural environment of the panels. The busshelter perhaps was more exposed to such conditions than the building panel since the busshelter was situated on a busy main road. The gel coat contained cracks and as a result ofwhich rain water and other effluents could have reached the fibres and the matrix. Mechanicaltest data had shown no significant deterioration in the stiffness of the panel B, but asignificant decrease in the strengths of the panel in comparison with the fresh samples wasobserved. This deterioration in strength has been primarily due to weathering. There were nodirect comparisons made with panel A since none of the panels tested were of the samevolume fraction. Thus only mechanical test data is reported and relative comparison can bemade with panels B, C and D.
ACKNOWLEDGEMENT
The authors would like to acknowledge Mr Trevor Starr of composite processing associationfor the supply of the panel A, Mr Clive Barton of London Transport (Adshel) for informationregarding the history of the bus shelter and also Mr David Barclay of Quality Mouldings forthe supply of panels and information regarding the lay up of the bus shelter materials.
REFERENCE
1. Johnson, A. F, Engineering design properties of GRP, British Plastics Federation.
2. Hogg, P. J and Woolstencroft, D. H. Non crimp thermoplastic composite fabrics:Aerospace solution to automotive problem. Advanced composite materials: Newdevelopments and applications conference proceedings, Detroit, Michigan USA, Sept.1991.

Proceedings of ICCM–11, Gold Coast, Australia, 14th-18th July 1997
V - 497
3. Norris J. F, Crowder, J. R and Probert, C. The weathering of glass reinforced polyestersunder stress-short term behaviour. Composites, Vol. 7, No. 3, 1976, pp 16-171.
Fig. 2: Photograph of the bus shelter prior to its removal

Volume V: Textile Composites and Characterisation
V - 498
Fig. 3: Building panel specimen after impact
0
20
40
60
80
100
120
140
160
180
0 50 100 150 200
t.Vf
GRP
SMC
Building Panel
Bus Shelter
Fig. 4: Energy absorption as function of plate thickness and fibre volume fraction

Proceedings of ICCM–11, Gold Coast, Australia, 14th-18th July 1997
V - 499
STATISTICAL ANALYSIS OF WATER ABSORPTIONIN COMPOSITE MATERIALS
B.Hu X.J.Gong J.C.Kneip G.Verchery
Institut Supérieur de l'Automobile et des Transports (ISAT) - Université de Bourgogne49, Rue Mademoiselle - Bourgeois - B.P. 31 - 58027 - NEVERS CEDEX - FRANCE
SUMMARY: The objective of the present work is to study the statistical characteristics ofdata obtained on the moisture absorption process of composite materials. For this purpose, theglass/epoxy composite specimens were immersed in distilled water at a temperature of 46°Cand the moisture content of specimen was measured in function of time. The analytical resultsindicated that the statistical distributions of the moisture content closely approximated thenormal distribution on the nearly whole absorption process. Based on this, the statistical lawof the moisture content was described and a reliability curve of water absorption was givenwhich may be practically employed for the moisture absorption process of glass/epoxylaminated composites.
KEYWORDS: water absorption, moisture content, statistical analysis, normal distribution
INTRODUCTION
Hygrothermal environments have evident effects on the mechanical properties of compositematerials. For this reason, moisture absorption has received much attention since thebeginning of use of composites in structural applications. However, there is often aconsiderable spread in the reported results obtained on the moisture absorption process.Twenty or thirty percent variations in the data are quite common. In some cases, the results
obtained by different laboratories even differ by forty percent or more[1, 2]. This fact leads togreat loss of confidence of potential users in published data.
In this paper, a statistical technique was used to study the statistical characteristics of thesemeasured moisture parameters and the conclusions obtained here should be useful to theresearchers and engineers in the field.
EXPERIMENT
All tests were performed on 8 ply glass/epoxy specimens having the following laminatedtypes a) [0°]8, b) [90°]8, c) [±45°]2s and d) [0°/±45°/90°]s. The nominal dimensions were:thickness h = 2.00 mm, width b = 15.00 mm and length l = 150.00 mm. The fiber volumefraction was about 60 percent for all specimens.
The specimens were primarily dried in a dry environment chamber until no more weightlosses were observed. The dry specimens were then immersed in distilled water at a constanttemperature about 46°C. The weight changes of specimens were measured by weighing themperiodically on a mettler analytical balance with an accuracy of 0.001g.

Volume V: Textile Composites and Characterisation
V - 500
CLASSICAL LAW AND EXPERIMENTAL RESULTS
Fick's Law
It has been demonstrated that under most conditions the moisture content of composites such
as glass/epoxy may be calculated using the equivalent unidirectional Fick's law[1], namely:
(1)
where c is the moisture concentration at time t at a point a distance x from the surface and Dis the moisture diffusivity.
Using the Equation (1), we obtain the moisture content of the specimens studied :
(2)
According to Shen and Springer[1], Equation (2) may be approximated by :
(3)
where Mm is the maximum moisture content and t is the immersion time.
In fact, the water also enters the specimen through the "edges"(surfaces hl and hb), so D inEquation (2) and (3) should be considered as a equivalent diffusivity , it can be expressed
as[1]:
(4)
where Dx, Dy, Dz are the diffusivity respectively along the direction of thickness h, length l,and width b of the specimens.
According to Equation (4), the process of water absorption will vary with the laminated types
of composites due to "Edge Effects"[1]. But, the real cases have showed that the errors ofmeasured data were much more important than this kind of "Edge Effects", so that, the
calculated results by Equation (4) nearly lost their practical significances [3]. Analysing thecauses, we think the Equation (4) is only a mathematical diffusion model, some moreimportant parameters were not taken into account [3], such as the factors of manufacturingprocess, the inherent variation of different laminates and so on.
However, considering the considerable dispersion of data, these factors, including thevariation of different laminates, may be treated as random variables in the statistical analysis.

Proceedings of ICCM–11, Gold Coast, Australia, 14th-18th July 1997
V - 501
The Moisture Content
The weight change of specimen is defined as:
(5)
It should be noted that the change of weight is complex because this parameter includes
weight gain due to water absorption and weight loss due to material dissolution[4,5].However, in the early stage of the process, the weight loss is relatively small and could beneglected. Here, in order to simplify the analysis we approximately regard the total weightchange M as the moisture content of material during whole absorption process studied.
So, using equation (5), we can measure M as a function of immersion time for the fourdifferent laminates ([0°]8, [90°]8, [±45°]2s and [0°/±45°/90°]s). The Figure 1 presentsexperimental results of M obtained in function of the root of the immersion time. It isinteresting to note that the data dispersion is remarkable during the whole water absorptionprocess and face to this dispersion, it is not so significant the effect of the laminate type on thevalues of M. If we fit the experimental results with the Fick's law curve (Eq.3) in Figure 1,the classical Fick' law seems giving a good tendency, but it can't give any assessment ofdispersion of the measured moisture parameter. Therefore we will use statistical technique tostudy the dispersion characteristics of M and try to give a statistical law for describing thewater absorption process, where each M measured for any laminate type whatever will beconsidered as one event .
201816141210864200,0
0,2
0,4
0,6
0,8
0°
45°
90°
0/45/90°
Equation (3)
moi
stur
e co
nten
t M (
%)
The root of the immersion time (√days)
Figure 1: Moisture content in function of the root of the immersion timefor the four laminates of glass/epoxy

Volume V: Textile Composites and Characterisation
V - 502
STATISTICAL LAW OF WATER ABSORPTION
Test Method for Normal Distribution
As well known, the statistical advantages of the normal distribution are quite considerable andmany physical measurements has been found following approximately the normal curve. Thenormal distribution corresponds to the following equation:
(6)
where F(x) is the cumulative probability from -∞ to an assigned value x, µ is the mean of thepopulation and σ is the standard deviation of the population.
In order to determine whether the frequency distribution of the M values for a givenimmersion time approximates a normal distribusion, the following steps have be performed:1. range the data of M from smallest to largest value and divide them into a series of equal-
valued "class intervals", and calculate, for the class interval number i, the mean of M:Mi;
2. determine the frequency of the data falling within class interval number i and thecorresponding cumulative frequency, the last was transformed then as the standardnormal variable µpi with the help of the statistical table of normal distribution;
3. The Mi values so obtained are plotted against the µpi values. If these points can be fittedwell with a straight line, the normal distribution of the measured M is verified.
This method will be used for determining the statistical distribution of the moisture parameter.
Statistical Distributions of the Moisture Content
In our statistical analysis, under the same immersion time, the M measurement has beencarried out on at least 21 specimens, which are grouped as a sample of population. Thepopulation, in this case, is the collection of all laminated types of composite studied whichpossessed the same volume fraction of the fiber and were tested under the same condition.Certainly, this treatment will provide us a statistical law in a more broad sense.
Using the method mentioned above, we have tested 15 groups of data correspondingrespectively to different immersion times. The relations between M and µp are illustrated inFigure 2 . It is indicated that the points for each immersion time correspond well to a straightline and so we can conclude that the statistical distributions of the moisture content wellapproximate the Normal Distribution on the nearly whole absorption process.

Proceedings of ICCM–11, Gold Coast, Australia, 14th-18th July 1997
V - 503
210-1-20,0
0,2
0,4
0,6
0,8 9 days
25 days
49 days
81 days
100 days
121 days
144 days
196 days225 days
256 days
16 days
169 days
moi
stur
e co
nten
t M (
%)
standard normal variable µp
Figure 2: The relations between M and µp
This resultant can be described as:
(7)
where M (t) is the mean of the population, σ(t) is the standard deviation of the populationfor a given immersion time t and µp is the standard normal variable.
Table 1 presents the results obtained for the normal parameters M (t) and σ(t) at eachimmersion time studied.
Table 1: Estimated parameters M (t) and s(t) in function of the immersion time
Immersion timet (days)
Mean of thepopulation µ (%)
Standard deviationσ (%)
Linear correlationcoeffient r
4 0.184 0.0417 0.994 16 0.243 0.0472 0.984 25 0.297 0.0435 0.990 49 0.404 0.0455 0.984 64 0.462 0.0447 0.990 81 0.499 0.0449 0.993 100 0.537 0.0498 0.978 121 0.563 0.0519 0.991 144 0.596 0.0520 0.983 169 0.619 0.0480 0.987 196 0.636 0.0527 0.992 225 0.648 0.0574 0.997 256 0.665 0.0641 0.990

Volume V: Textile Composites and Characterisation
V - 504
Correlation to Fick's Law
Based on the results of M (t) presented in Table 1, we can estimate the maximum moisture
content: Mµm = 0.68%, and the moisture diffusivity Dµ = 6.251×10⁻⁸ mm2/sec. They arenecessary to establish the Fick's law (Eq. 3). The figure 3 makes a comparison between the
points of M (t) presented in Table 1 and the equation 3, a good correlation has beenobserved.
201816141210864200,0
0,2
0,4
0,6
0,8
data points in Table 1
Equation (8)
M (
t) (
%)
The root of the immersion time (√days)
Figure 3: M (t) as a function of the root of the immersion time
Similarly, analysing the standard deviation σ(t) obtained (Tab.1), it seems that the results ofσ(t) can be well described by an empirical model as ( to see Figure 4):
(9)
where A = 0,037%, B = 0,0127days-1/2 .
So, the statitical law of the moisture content M(t) can be written as :
(10)
where µp is the standard normal variable and the second term of the equation may be regardedas the statistical modification of classical Fick' law.

Proceedings of ICCM–11, Gold Coast, Australia, 14th-18th July 1997
V - 505
201816141210864200,02
0,03
0,04
0,05
0,06
0,07
0,08data points in Table 1
data points not used(t
) (
%)
Equation (9)
σ
The root of the immersion time (√days)
Figure 4: σ(t) as a function of the root of the immersion time
Application — Reliability Curve of M(t)
Based on the above results, we can deal quantitatively with the dispersion of water absorptionprocess. The reliability curve of M(t) is a valuable example.
If we define the reliability degree R=0.90, the values of M(t) under the cumulative probability5% (correspond to µp = -1.645) and 95% (correspond to µp = 1.645) can be determined byusing equation (10). Plotting the results on the figure 5, a reliability curve of M(t) isobtained. It means that for the 8 ply glass/epoxy specimens with a 65% volume fraction of thefiber under a test condition of this paper, it has 90% reliability for the M(t) to fall within theinterval of 5% and 95% cumulative probability curves presented in figure 5.
201816141210864200,0
0,2
0,4
0,6
0,8
M (t)
M (t) under 5% C.P.
M (t) under 95% C.P.moi
stur
e co
nten
t M (
%)
The root of the immersion time (√days)Figure 5: Reliability curve of M versus √t (C.P. — cumulative probability)

Volume V: Textile Composites and Characterisation
V - 506
In the same way, we can obtain the reliability curve of M(t) for any reliability degree R (0.95,0.99 or others).
These curves provide a statistical estimate of the water absorption process; moreover, theyprovide an analytical base for us to study the dispersion on degradation of mechanicalproperties of composite materials due to water absorption.
CONCLUSIONS
On the basis of the results obtained, the following conclusions can be made regarding thestatistical analysis on the water absorption process of the glass/epoxy composites:
1. The statistical analysis of this paper is established on the specimens which possess thesame volume fraction of the fiber but different laminated types. This kind of treatmentwill result in a statistical law in a more broad sense.
2. The statistical distributions of the moisture content well approximate the NormalDistribution on the nearly whole absorption process.
3. The statistical law of water absorption can be described as the classical Fick' law withaddition to a statistical modification.
4. A reliability curve of the moisture content M(t) is given which may be practicallyemployed for the water absorption process of the glass/epoxy composites.
ACKNOWLEDGMENT
The authors would like to express appreciation to Mr. Sh.AIVAZZADEH for supporting thework presented here.
REFERENCE
1. Springer, G.S., Environment Effects on Composites Materials, Vol. 1, TechnomicPublishing Co. Inc., 1981.
2. Springer, G.S., Environment Effects on Composites Materials, Vol. 2, TechnomicPublishing Co. Inc., 1981.
3. Hu B., Gong X.J., "Modélisation de l'absorption de l'eau dans les composite stratifiésverre/époxyde", MECAMAT, Journée scientifique et Technique, Chatillon, France, 29mai 1997
4. Morii T., "Weight Changes of Randomly Oriented GRP Panel in Hot Water", CompositesScience and Technology, Vol. 49, 1993, pp. 209-216.
5. Morii T., "Weight Changes of the Fiber/Matrix Interface in GRP Panels Immersed in HotWater", Composites Science and Technology, Vol. 50, 1993, pp. 373-379.
6. Baillargeon G., Méthodes Statistiques de L'ingenieur, Les Editions SMG, 1990.
7. Dieter Engineering Design - a Materials and Processing Approach, McGraw-Hill Inc.,1991.

Proceedings of ICCM–11, Gold Coast, Australia, 14th-18th July 1997
V - 507
DURABILITY OF ISOTHERMALLY AGED POLYMERMATRIX COMPOSITES
David Harmon
McDonnell Douglas Aerospace, P. O. Box 516, MC S102-1322, St. Louis, MO 63166, USA
SUMMARY: Several composite material systems representing different classes of polymermaterials have been selected for an isothermal aging program designed to assess the durabilityof these systems when exposed to temperatures up to 232°C/450°F. Data discussed willinclude results up to 10,000 hours of aging. Properties that are monitored include weight loss,glass transition temperature, and various mechanical properties. The results of these studieshave identified systems which have better temperature stability and have helped identify someof the dominant degradation processes that effect residual physical and mechanical properties.This data is being used to develop strength and life prediction analyses which in turn will beused for screening potential accelerated aging methodologies.
KEYWORDS: composite durability, long term aging, accelerated aging, residual strength,prediction methodology, oxidation/diffusion
INTRODUCTION
An understanding of advanced polymeric matrix composite (PMC) material durabilitybehavior in the extreme flight regimes associated with the High Speed Civil Transport(HSCT) is necessary before these materials can be implemented. PMC materials underdevelopment for advanced military aircraft may meet these durability requirements, but arecostly and not optimized for the long-term elevated temperature HSCT environment. Long-term and accelerated test procedures and methods are required to shorten the development andverification time of new PMC materials for the HSCT.
Under the High Speed Research program, NASA and an industry team, composed of TheBoeing Company, McDonnell Douglas Aerospace, Lockheed-Martin Aeronautical Systems,and Northrop-Grumman Corporation, are working together to assess the long term durabilityof candidate polymer matrix composite material systems. This work is divided into threetasks: Database Generation, Prediction Methodology, and Accelerated Aging TestMethodology. Efforts conducted under this program in each of these areas has provided thefoundation for the current NASA/Industry Materials and Structures Program for the HSCT.
The database generation task is designed to provide test data for material systems which havebeen exposed to real time, long term exposure conditions. This is being accomplished in abuilding block fashion which allows for an understanding of the individual factors whichcontrol the mechanisms which dominate the material performance. Aging conditions includeisothermal aging, isothermal aging with an applied constant axial load, thermal cycling, andthermomechanical fatigue. It is also in this task in which real time, long term flight profiletesting is being conducted. Large composite panels have been placed in test frames withovens and are being subject to a simulated flight profile. These tests will be conducted for up

Volume V: Textile Composites and Characterisation
V - 508
to 60,000 hours and will provide the necessary real time data to which the accelerated testmethods will be compared for purposes of verification.
In the accelerated test methodology task, additional testing is being performed to examinehow it may be possible to accelerate the aging process in the composite materials withoutchanging the degradation mechanism as compared to the real time test results. Changing thedamage mechanism would invalidate the accelerated test technique. To accomplish this goal,additional testing is performed to specifically examine those factors and their magnitudeswhich have the most effect on material behavior, both physically and mechanically.Examples of the types of aging conditions are: isothermal aging at temperatures slightlybelow the glass transition temperature, changing the exposure environment (i.e. argon, air,oxygen), examining the effects of moisture and ultraviolet radiation, etc.. Essentially, theconcept is to make use of those environmental factors that the aircraft will be exposed tonaturally and increase their magnitude to determine if the aging process can be accelerated.And if so, how fast can it be accelerated. This task also allows for the examination ofsynergistic effects associated with exposing the composite material system to two or moreenvironmental conditions at the same time.
Once an understanding of how the material behaves under different exposure conditions isobtained, then analysis methods may be developed and used to predict the materialperformance. This is being accomplished under the prediction methodology task. Thesemethods will be used to help define the exact accelerated test conditions needed to acceleratethe aging process for a material system. It is important to note that the accelerated testmethods will be material dependent. It is presumptuous to believe that all material age thesame way and therefore will degrade identically. In this program, we have selected candidateand model materials for evaluation. The candidate material is one which is hoped will showlittle or no degradation over 1 lifetime of aging. While that means the material is good for theaircraft, it tells us little of how to accelerate the aging process in the material. Therefore,model materials are also chosen which are known to degrade over 1 lifetime of exposure.Ideally, the chosen model material is of the same family as the candidate material such thatany accelerated methods that are proven to work for the model system may also work for thecandidate system over a longer period of time.
DATABASE GENERATION
In the Database Generation task, efforts are focused on the selection and screening ofcandidate polymeric composite materials that showed potential to operate for long duration(>60,000 hours) at temperatures between 121°C/250°F and 177°C/350°F. Eight (8) materialsystems were initially selected for a series of mechanical and physical screening tests afterisothermal aging as shown in Figure 1. The objective of these screening tests was to selectthree (3) material systems for extensive long-term thermal aging studies and to select two (2)material systems for accelerated test methodology development. Results discussed willinclude test data of material systems aged up to 10,000 hours [1]. Aging of these systems willcontinue past 60,000 hours.
A series of physical/chemical tests were performed on each of the eight screening materialsto: l) characterize the material systems for comparison with each other, 2) establish baselinevalues for each of the material systems for later comparison with aged data; and 3) developpossible screening tools. Each of these physical/chemical tests provided information about

Proceedings of ICCM–11, Gold Coast, Australia, 14th-18th July 1997
V - 509
the material system on the molecular or microscopic level as compared to the mechanicaltesting that provided data on a macroscopic scale. It is critical that data from both themicroscopic and macroscopic scales be gathered on these materials systems for comparisonand correlation. At the temperatures of the HSCT flight environment, the long-term durabilityof a material system depends ultimately on the molecular properties of the polymer chain andon the interface of the resin with the carbon fibers as well as their microscopic order ormorphology. In addition, it is crucial to establish and understand the nature of the molecular-structure/macroscopic property relationships that exist in these high performance polymersystems if meaningful accelerated aging studies are to be conducted.
Weight change and microcracking measurements shown in Figures 2 and 3 were madeperiodically to determine the effect of aging at the various temperatures on the differentmaterial properties. It is obvious from these measurements that the thermoplastic IM7/ITXand the thermoplastic/polyimide IM7/K3B appear to have been the least affected by the agingconditions. Based on these results, these two materials and a third, G40-800/XU71787.09Lcyanate ester, were chosen for more extensive mechanical testing and evaluation. BothIM7/ITX and IM7/K3B were considered candidate HSCT material systems at 149°C/300°Fand 177°C/350°F, respectively. The cyanate ester system, G40-800/XU71787.09L, waschosen as a model material system at 177°C/350°F.
Mechanical tests conducted on IM7/ITX, IM7/K3B, and G40-800/XU71787.09L includedopen-hole tension, open hole compression , and compression strength after impact on quasi-isotropic laminates. Data from these tests are shown in Figures 4 and 5. Glass transitiontemperature measurements also shown in Figure 5 were also made on the unaged and agedmaterial. The data is consistent in that the IM7/K3B and IM7/ITX material systems show nostatistical degradation in mechanical properties, while the G40-800/XU71787.09L materialsystem does. Glass transition temperature increased with aging time for IM7/ITX, wasconstant for IM7/K3B, and decreased for G40-800/XU71787.09L.
ACCELERATED TEST METHODOLOGY
The goal in this effort was to establish a method for obtaining end-of-life thermomechanicalproperties of advanced polymer matrix composites through accelerated aging. Consideringthat future aircraft require two lifetimes of testing to meet reliability requirements as currentlyoutlined by the Federal Aviation Administration, a means of obtaining certification in anaccelerated fashion is required. This accelerated certification testing must simulate flight andproduce the failure modes and property degradation expected during the aircraft lifetime.
An environment screening program was performed to identify test parameters and magnitudesrequired to accelerate the aging process. The test program included exposure temperatures of177°C/350°F, 193°C/380°F, 204°C/400°F, and 232°C/450°F, and pressure levels of 0.14 atm,1.0 atm, and 6.8 atm. Exposure times ranged from 250 hours to 2000 hours. Panel lay-upwas a 16 ply quasi-isotropic panel [45/0/-45/90]2s. Studies for this effort concentrated on twopolymeric composite material systems; IM7/K3B and G40-800/XU71787.09L. Chemical,physical and mechanical studies were conducted on specimens after exposure to the variousaccelerated aging environments. Weight loss was large for the G40-800/XU71787.09Lmaterial system relative to IM7/K3B. This data is plotted in Figure 6.

Volume V: Textile Composites and Characterisation
V - 510
An empirical model was developed to predict weight loss response of the G40-800/XU71787.09L system to temperature and pressure. Data correlation with this model isprovided Figure 7. This model assumed a diffusion controlled process through the thicknessof the laminate. Diffusivity data was calculated for each weight loss curve and plotted toprovide relationships with exposure temperature, pressure, and time. Edge effects were alsoaccounted for by dividing the diffusivity by a geometry dependent factor.
The model was used to define accelerated aging environments based on the premise thatequivalent laminate weight loss results in equivalent damage. Three accelerated agingconditions were defined to provide identical weight loss measurements to real time agingconditions for the G40-800/XU71787.09L material system:
Real Time Aging Condition Accelerated Test Condition (ATC)177°C/350°F, 1.0 atm, 5000 hours 204°C/400°F , 1.0 atm, 960 hours (ATC #1)177°C/350°F, 1.0 atm, 5000 hours 182°C/360°F , 6.8 atm, 990 hours (ATC #2)177°C/350°F, 1.0 atm, 10000 hours 204°C/400°F , 1.0 atm, 2000 hours (ATC #3)
A second set of G40-800/XU71787.09L panels with different length to width ratios ascompared to the original screening tests were aged under the real time and the acceleratedaged conditions described above. Weight loss measurements compared very well with themodel predictions. Weight loss for the 5000 hour real time condition and the two acceleratedaging conditions (ATC #1 and ATC #2) was 0.57%. It should be noted that the model wasderived with data which had accumulated at most 5000 hour of exposure time. Therefore, the10000 hour weight loss prediction was an extrapolation of the available data and as a resultwas the case with the worst agreement with the data. In fact, it took 2900 hours of exposureat 204°C/400°F and 1.0 atm in order to match the 10000 hour weight loss measurement underreal time conditions.
Mechanical property testing was also performed to determine if weight loss could be atracking parameter to which mechanical property changes in the material system could belinked. Open hole tension and compression tests were conducted at room and elevatedtemperatures and compared to data from all aging conditions as shown in Figure 8. The datawas plotted against the simulated time for the accelerated aging conditions. For all conditionsexcept one the data from all aged conditions fell within the scatter band. Statistically, theaccelerated aged conditions provided the same residual properties as the real time conditions.The one case in which that was not true was for the elevated temperature open holecompression test performed after 10000 hours of aging. The residual strength of theaccelerated aged panel fell well below the residual strength of the real time aged panel.
The poor correlation after 10,000 hours at 204°C/400°F can be traced to the glass transitiontemperature of the material. Dynamic mechanical analysis of specimens from aged panelsshows that the glass transition temperature changes significantly as the material ages as can beobserved in Figure 9. For less than 5,000 hours, the glass transition temperature (Tg) does notchange significantly at the two lower aging temperature; and little change is observed in themechanical properties. After 10,000 hours at 177°C/350°F, the Tg is reduced to 242°C/468°Fwhich is still well above the elevated test temperature of 177°C/350°F. For the ATC #3(2,900 hours at 204°C/400°F ) condition, however, the Tg has dropped to 182°C/360°Fwhich is below the aging temperature and only 10°C above the test temperature. It is notsurprising that the compression strength was severely degraded.

Proceedings of ICCM–11, Gold Coast, Australia, 14th-18th July 1997
V - 511
PREDICTION METHODOLOGY
Under the Prediction Methodology task, efforts are directed toward developing both aphysical degradation (aging) model and a structural mechanics model to account for long termaging effects on the residual mechanical properties of polymer matrix composites. The longterm goal of this work is to combine these models into one analysis package that would allowan engineer to predict residual properties of candidate polymer matrix composite materialsafter exposure to a typical HSCT environment. This will be particularly useful in definingaccelerated aging theromechanical spectra.
The overall predictive methodology for polymer composites has three parts. First, develop amodel capable of predicting the change in a physical parameter, such as weight change orglass transition temperature, due to the exposure environment. Second, establish anempirical, material dependent relationship between the physical parameter and specificmechanical properties (i.e. stiffness, strength, etc.). Third, the “aged” lamina properties arefed into a laminate strength code to predict the residual properties of the laminate. The entireanalysis package is called ISAAC (Integrated Strength Analysis for Aged Composites). Workis currently on-going in each of these three areas. The overall prediction methodology isbeing validated by predicting the results of the many aged laminate tests.
The physical aging model concentrated on an oxygen diffusion/oxidation model toanalytically simulate the diffusion of oxygen into the composite and the subsequent oxidationof the polymer material [2-5]. Diffusion and reaction rate data was measured from controlledexperiments on G40-800/XU71787.09L and IM7/K3B material systems. This data was usedin a finite element model to measure the concentration of oxygen through the thickness of thelaminate. The results are plotted in Figure 10. Based on photomicrographs of the surfacelayers, a two-phase model was develop which allowed a surface “ash” layer to form withdifferent diffusion and reaction rate constants than the center core laminate. The model wascorrelated with “ash” layer thickness measurements as shown in Figure 11 for G40-800/XU71787.09L laminates aged at 149°C/300°F and 177°C/350°F [6].
The strength analysis portion of the ISAAC code allows prediction of laminate modulus [7]and strength based on constituent and ply properties. The analysis can be used for predictingunnotched and center notched laminates subject to axial and/or bending running loads [8, 9].The analysis is done on a ply-by-ply basis and provides output every time a ply is predicted tofail. Failure modes are determined and specified based on ply failures. Multiple failurecriteria are provided including maximum stress, maximum strain, modified maximum shearstrain (based on work done by Hart-Smith [10]), Tsai-Hill, and Tsai-Wu. The effects ofthermal residual stresses may also be included in the analysis.
This portion of the ISAAC code was designed to accept constituent and ply properties afterbeing degraded due to long term exposure to harsh environments. Currently, the analysis canbe used to predict the strength and stiffness of aged composite coupons when provideddegraded constituent and lamina data. ISAAC predictions and test data for the G40-800/XU71787.09L material system are shown in Figure 12. The ply-by-ply nature of theinput allows different levels of deterioration for layers closer to the surface of the laminate.The ISAAC code, in its current form, is well suited for performing trade studies to evaluatethe effects of degradation on laminate mechanical performance. These trade studies havecorrelated laminate mechanical properties with ply degradation as a function of ply location inthe laminate. These studies have been useful in defining the number of surface plies which

Volume V: Textile Composites and Characterisation
V - 512
must be degraded in order to match aged material response. Although not completed, the longterm goal for the ISAAC strength analysis code is to tie it to physical aging model whichwould determine the amount of degradation as a function of ply location and environment.
CONCLUSIONS
Key to the development of a High Speed Civil Transport is ensuring that the materialsselected are capable of withstanding the exposure conditions for an estimated lifetime of60,000 hours. However, without adequate test data, reliable prediction capability, andverifiable accelerated test methodology this cannot be accomplished. Each of these tasks arevery important and rely on each other.
In this paper, a brief review is provided which demonstrates the type of data being developedunder each of the three main tasks: Database Generation, Accelerated Test Methodology, andPrediction Methodology. Data is provided for several systems with particular attentionfocused on the cyanate ester material system, G40-800/XU71787.09L. This material systemis a good example of one which shows significant degradation within the operating envelopeof the HSCT. As a result this material is not considered a candidate material system. Testingon this system continued however, because it was originally considered a model materialsystem. Further testing discovered its key degradation mechanism to be a drop in glasstransition temperature as aging exposure time increased. This drop was accelerated at higheraging temperatures. In order to develop reliable and accurate prediction methods for G40-800/XU71787.09L, it would be necessary to map the glass transition temperature as afunction of each exposure condition and then to model the effect of a change in Tg withchanges in mechanical properties. However, since the degradation mechanism of G40-800/XU71787.09L is not the same as the candidate materials further work on this system isnot required. Instead new model materials are now being defined and similar exploratorytesting is underway.
It is prudent to point out that the risk associated with the development of accurate and reliableaccelerated test techniques is high. In fact, it may be too lofty a goal. A more likely outcomeof this work could be a series of screening tests to which a material would be subject. Furthertesting of the material system would be dependent on passing each preceding test series. If amaterial passes each test series, than it would be a candidate for long term exposure testingand eventual use on the aircraft. The testing and analytical efforts discussed are required todefine these screening tests. Ideally, this work will provide a template which will define thetypes of tests that should be conducted on new materials as they become available.
REFERENCES
1. Renieri, M. P., Hipp, R. C., Harmon, D. M., Grayson, M. A., Wanthal, S. P., Finefield, M.A., and Saff. C. R., “High Speed Research: Composite Materials and StructuresDevelopment”, NASA Contractor Report 198346, Part 1, September 1996.
2. Emanuel, N. M. and Buchachenko, A. L., Chemical Physics of Polymer Degradation andStabilization, translated from Russian by E. N. Ilyina, VNU Science Press, Utrecht, theNetherlands, 1987.

Proceedings of ICCM–11, Gold Coast, Australia, 14th-18th July 1997
V - 513
3. Crank J., The Mathematics of Diffusion, 2nd Ed., Oxford University Press, New York,1975.
4. Carslaw, H. S. and Jaeger, J. C., Conduction of Heat in Solids, 2nd Ed., 1959.
5. Zienkiewicz, O. C. and Parekh, C. J., "Transient Field Problems: Two-Dimensional andThree-Dimensional Analysis by Isoparametric Finite Elements," International Journal forNumerical Methods in Engineering, Vol. 2, pp. 61-71, 1970.
6. Nam, J. D. and Seferis, J. C., “Anisotropic Thermo-Oxidative Stability of Carbon FiberReinforced Polymeric Composites,” SAMPE Quarterly, June 1992.
7. Jones, R. M., Mechanics of Composite Materials, McGraw-Hill Company, St. Louis,1975.
8. Harmon, D. M. and Finefield, M. A., "Thermomechanical Load History Effects in MetalMatrix Composites - 3rd Interim Report", MDA 93B0050, February 1993.
9. Lehknitskii, S. G., Anisotropic Plates, Gordon and Breach Science Publishers, 1968.
10. Hart-Smith, L. J., "A Scientific Approach to Composite Laminate Strength Prediction,"DAC 8467, April 1990.
Material Material Polymer Aging TemperaturesID Name Family 121°C/250°F 149°C/300°F 177°C/350°FA IM7/ITX Thermoplastic X XB IM7/SP500-2 Epoxy X XC IM7/5250-4 Bismaleimide X XD G60-600/5250-4 Bismaleimide X XE IM7/3135 Bismaleimide X XF IM7/K3B Polyimide X XG G40-800/XU71787.09L Cyanate Ester X XH IM7/AB-BCB-MI Benzocyclobutene X X
Figure 1: Polymer composites in durability program
149°C/300°F
-1.2
-0.8
-0.4
0
0 2500 5000 7500 10000Exposure Time, Hours
Wei
ght C
hang
e, %
A
B
CD
177°C/350°F
-1.2
-0.8
-0.4
0
0 2500 5000 7500 10000Exposure Time, Hours
Wei
ght C
hang
e, %
E
F
G H
Figure 2: Thermal aging screening
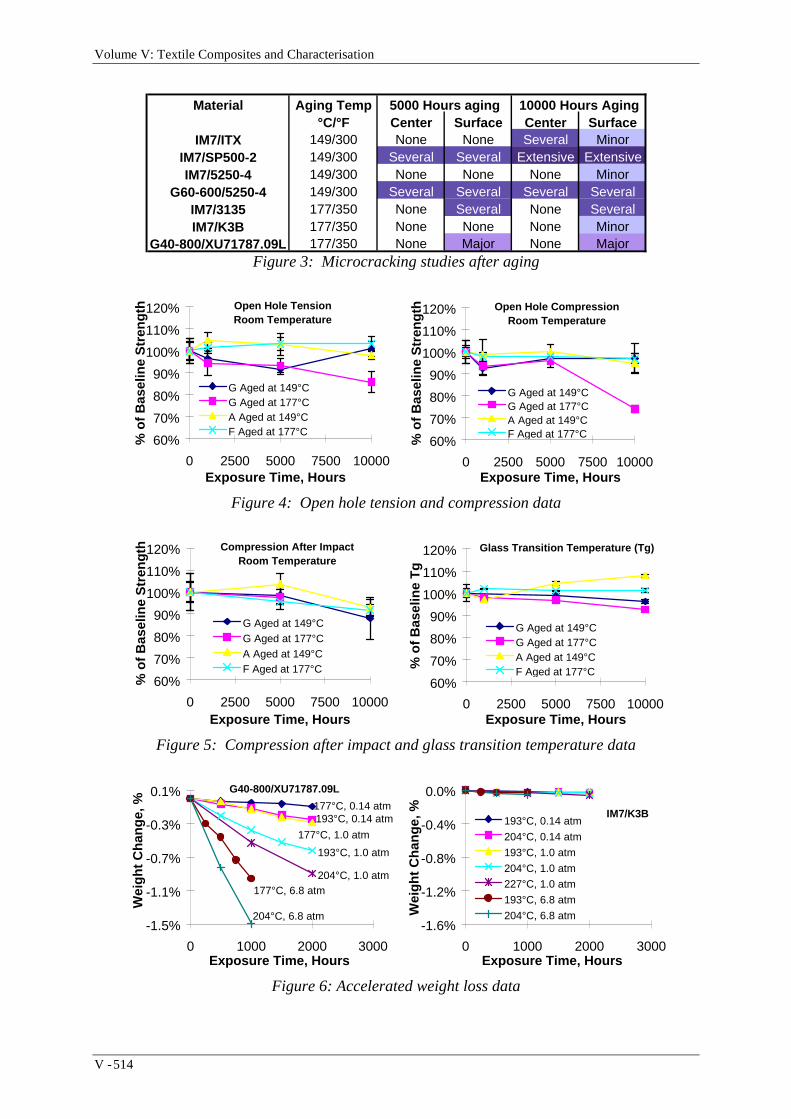
Volume V: Textile Composites and Characterisation
V - 514
Material Aging Temp 5000 Hours aging 10000 Hours Aging°C/°F Center Surface Center Surface
IM7/ITX 149/300 None None Several MinorIM7/SP500-2 149/300 Several Several Extensive ExtensiveIM7/5250-4 149/300 None None None Minor
G60-600/5250-4 149/300 Several Several Several SeveralIM7/3135 177/350 None Several None SeveralIM7/K3B 177/350 None None None Minor
G40-800/XU71787.09L 177/350 None Major None MajorFigure 3: Microcracking studies after aging
Open Hole TensionRoom Temperature
60%
70%
80%
90%
100%
110%
120%
0 2500 5000 7500 10000Exposure Time, Hours
G Aged at 149°CG Aged at 177°CA Aged at 149°CF Aged at 177°C
% o
f Bas
elin
e S
tren
gth Open Hole Compression
Room Temperature
60%
70%
80%
90%
100%
110%
120%
0 2500 5000 7500 10000Exposure Time, Hours
G Aged at 149°CG Aged at 177°CA Aged at 149°CF Aged at 177°C%
of B
asel
ine
Str
engt
h
Figure 4: Open hole tension and compression data
Compression After ImpactRoom Temperature
60%
70%
80%
90%
100%
110%
120%
0 2500 5000 7500 10000Exposure Time, Hours
G Aged at 149°CG Aged at 177°CA Aged at 149°CF Aged at 177°C
% o
f Bas
elin
e S
tren
gth Glass Transition Temperature (Tg)
60%
70%
80%
90%
100%
110%
120%
0 2500 5000 7500 10000Exposure Time, Hours
G Aged at 149°CG Aged at 177°CA Aged at 149°CF Aged at 177°C
% o
f Bas
elin
e T
g
Figure 5: Compression after impact and glass transition temperature data
G40-800/XU71787.09L
-1.5%
-1.1%
-0.7%
-0.3%
0.1%
0 1000 2000 3000Exposure Time, Hours
Wei
ght C
hang
e, % 177°C, 0.14 atm
193°C, 0.14 atm
177°C, 1.0 atm
193°C, 1.0 atm
204°C, 1.0 atm177°C, 6.8 atm
204°C, 6.8 atm
IM7/K3B
-1.6%
-1.2%
-0.8%
-0.4%
0.0%
0 1000 2000 3000Exposure Time, Hours
193°C, 0.14 atm
204°C, 0.14 atm
193°C, 1.0 atm
204°C, 1.0 atm
227°C, 1.0 atm
193°C, 6.8 atm
204°C, 6.8 atmWei
ght C
hang
e, %
Figure 6: Accelerated weight loss data

Proceedings of ICCM–11, Gold Coast, Australia, 14th-18th July 1997
V - 515
G40-800/XU71787.09L
-2.5%
-1.5%
-0.5%
0.5%
1 10 100 1000 10000
Exposure Time, Hours
177°C, 1.0 atm193°C, 1.0 atm204°C, 1.0 atm177°C, 1.0 atm (Model)193°C, 1.0 atm (Model)204°C, 1.0 atm (Model)W
eigh
t Cha
nge,
%
G40-800/XU71787.09L
-4.5%
-3.5%
-2.5%
-1.5%
-0.5%
0.5%
1 10 100 1000 10000Exposure Time, Hours
193°C, 0.14 atm193°C, 1.0 atm193°C, 6.8 atm193°C, 0.14 atm (Model)193°C, 1.0 atm (Model)193°C, 6.8 atm (Model)W
eigh
t Cha
nge,
%
Figure 7: Model weight loss predictions for G40-800/XU71787.09L
Open Hole Tension177°C
20%
40%
60%
80%
100%
120%
0 2500 5000 7500 10000Exposure Time, Hours
177°C, 1.0 atm (Real Time)204°C, 1.0 atm (ATC #1 & #3)182°C, 6.8 atm (ATC #2)
% o
f Bas
elin
e S
tren
gth
Open Hole Compression177°C
20%
40%
60%
80%
100%
120%
0 2500 5000 7500 10000Exposure Time, Hours
177°C, 1.0 atm (Real Time)204°F, 1.0 atm (ATC #1 & #3)182°C, 6.8 atm (ATC #2)%
of B
asel
ine
Str
engt
h
Figure 8: Accelerated and real time open hole tension and compression data
Exposure Time, Hours
149
177
204
232
260
Aged at 149°C
Aged at 177°C
Aged at 204°C
Gla
ss T
rans
ition
Tem
pera
ture
(°C
)
0 5000 1000075002500
Aging Above Tg
Figure 9: DMA data for G40-800/XU71787.09L

Volume V: Textile Composites and Characterisation
V - 516
0.000
0.010
0.020
0.030
0.040
0.050
0.000 0.025 0.051 0.076 0.102 0.127
Oxy
gen
Con
cent
ratio
n
Distance from Surface, cm.
Neat K3B100 Hours at 45°C
DataPrediction
Figure 10: Oxygen diffusion model correlation
Ash
Lay
er T
hick
ness
, cm
.
Exposure Time, 1000 Hours
PredictionPhotomicrographs
Aged at 177°C in Air
0.0000
0.0025
0.0051
0.0076Point Used to DefineAsh Layer Diffusivity
0 5 10 15 20
0.0076
0.0051
0.0025
0.00000 5 10 15 20
Ash
Lay
er T
hick
ness
, cm
.
Exposure Time, 1000 Hours
PredictionPhotomicrographs
Aged at 149°C in Air
Figure 11: Ash layer model correlation
1000080006000400020000
0
138
276
414
552
690
Exposure Time, Hours
Predictions Used AcceleratedLamina Aging Data
ISAAC 177°C, 1.0 atm, (Real Time)182°C, 6.8 atm, 1000 hours (Accelerated)204°C, 1.0 atm, 1K & 5K hours (Accelerated)
Ope
n H
ole
Ten
sion
Str
engt
h, M
Pa
Figure 12: ISAAC strength predictions

Proceedings of ICCM–11, Gold Coast, Australia, 14th-18th July 1997
V - 517
THE MECHANICAL TESTING OF CONTINUOUSFIBRE REINFORCED THERMOPLASTIC PIPES
B.J. Chapman1, J.T. Evans1, S.R. Frost2 and A.G. Gibson1
1 Centre for Composite Materials Engineering,University of Newcastle upon Tyne, Newcastle upon Tyne NE1 7RU, U.K.
2 Shell Research and Technology Centre, P.O. Box 38000,1030 BN Amsterdam, The Netherlands.
SUMMARY: The results of tests on reinforced thermoplastic pipes, internally pressurised withclosed end conditions, are reported. Because the fibres used for reinforcement are not infiltrated,a feature of the deformation at low pressures is a high degree of non-linearity. The behaviour canbe understood if it is assumed that non-linear visco-elastic and plastic deformation of thepolyethylene occurs without fibre loading over a range of strain required to straighten the fibreyarn. At higher strains load is increasingly borne by the fibres up to the point of rupture. Thestrain pressure relations are interpreted in terms of netting analysis and laminate theory.
KEYWORDS: reinforced thermoplastics, pressurised pipes, reinforcing tape, non-infiltratedfibres, non-linear deformation.
INTRODUCTION
Reinforced thermoplastic pipes (RTPs) possess an attractive combination of properties. Theyhave good strength under internal pressure, flexibility in installation and good corrosionresistance. These features make RTPs attractive for replacing steel and glass fibre-reinforcedthermosets. Possible applications include offshore flexible risers and umbilicals and onshoreflow lines. The materials costs of RTPs greatly outweigh those of steel and glass reinforcedepoxy but owing to the particular combination of properties of RTPs, resulting in ease ofhandling during installation, the total capital expenditure costs are comparable with otherpipeline options. In addition, because of its good corrosion resistance, the life of an RTP may beup to four times longer than the equivalent steel pipeline in many operations. Consequently, thereis much current interest in the development of RTP systems. The introduction of RTPs can beviewed as a development leading on from the polyethylene pipes that have replaced cast iron inlow pressure gas and water distribution systems. The advantage of RTPs is that they have muchhigher pressure capacity, whilst retaining much of the bending flexibility of polyethylene.
MATERIALS AND METHOD
The RTPs were manufactured using a special composite tape (Fig. 1). This consists of non-infiltrated aramid yarn encapsulated in medium density polyethylene (MDPE) to form tape,105 mm wide and 0.85 mm thick. The tape contains 0.32 volume fraction of fibres and has a

Volume V: Textile Composites and Characterisation
V - 518
Young's modulus of 27.8 GPa in the fibre direction and 0.5 GPa in the transverse direction.The in-plane shear modulus is 0.4 GPa and the Poisson's ratio is 0.315 for transversecontraction in reaction to a strain applied parallel to the fibres. The tubes were manufacturedusing a pull-winding process in which the tape was wrapped around either a MDPE or a highdensity polyethylene (HDPE) liner to provide a reinforcement inclined at ±55° to the tubeaxis. An outer skin of MDPE was then added by an extrusion process. Tubes supplied by twomanufacturers were tested. Specimens supplied by Wavin (MDPE liner) contained two tapelayers (internal diameter 100 mm, total wall thickness of 25 mm). The tubes supplied byTubes d'Aquitaine contained four tape layers over a HDPE liner with a MDPE skin (internaldiameter 141 mm, total wall thickness 31.2 mm).
A particular problem in testing RTPs is attachment of the end fittings. Because of thedifficulty in forming a strong adhesive bond with thermoplastics, mechanical methods offitting are preferred. The Wavin RTPs were press fitted into PECAT fittings (supplied byWASK-RFM). These are steel-flanged end fittings with a steel core fitted with O-rings. Theend closure for the Tubes d'Aquitaine RTP was made by cutting an external thread in theouter MDPE layer. A threaded aluminium fitting was screwed on over the tube end. The tubeswere tested in 1.5 m lengths by hydraulically pressurising at a mean rate of 10 bar per minutein the region of linear behaviour.
Hoop strain was deduced from the mean change in the tube diameter measured at the centre ofthe specimen and at two other points 100 mm on either side. The changes in diameter weremeasured with linear displacement transducers held in special fittings. With the Wavinspecimens, the axial strain was deduced from change in length of the tube measured withthree linear displacement transducers spaced 120° apart around the circumference andconnected to the end fittings. This measurement is liable to error if there is any slippage in theend fittings. The axial strain for the Tubes d'Aquitaine specimens were measured over ashorter gauge length using transducers attached to the tube surface with special fittings.
RESULTS
Examples of the strain-pressure relations are shown in Figs. 2. It is possible that the hoop strainincreases linearly with pressure at very low pressures but on the pressure scale adopted for thetests the hoop strain is decidedly non-linear up to a strain of between 1.5 and 2%. Thus, asubstantial hoop strain accumulates with relatively little pressure increase. At hoop strains largerthan a critical value the pressure rises more rapidly for a given strain increment to give anapproximately linear strain-pressure relation up to the burst point. These results can berationalised if it is assumed that the aramid fibres do not begin to support the hoop stress untilafter the critical strain has accumulated. This is possible if the fibres within the yarn are initiallyslack and have to straighten to begin to support the load. The critical strain is required to take upthe slack in the fibres and is here termed the "take up" strain. On this interpretation, thedeformation observed in the non-linear region simply reflects the deformation of thepolyethylene, without any effect of the fibres. An analytical model has been developed to
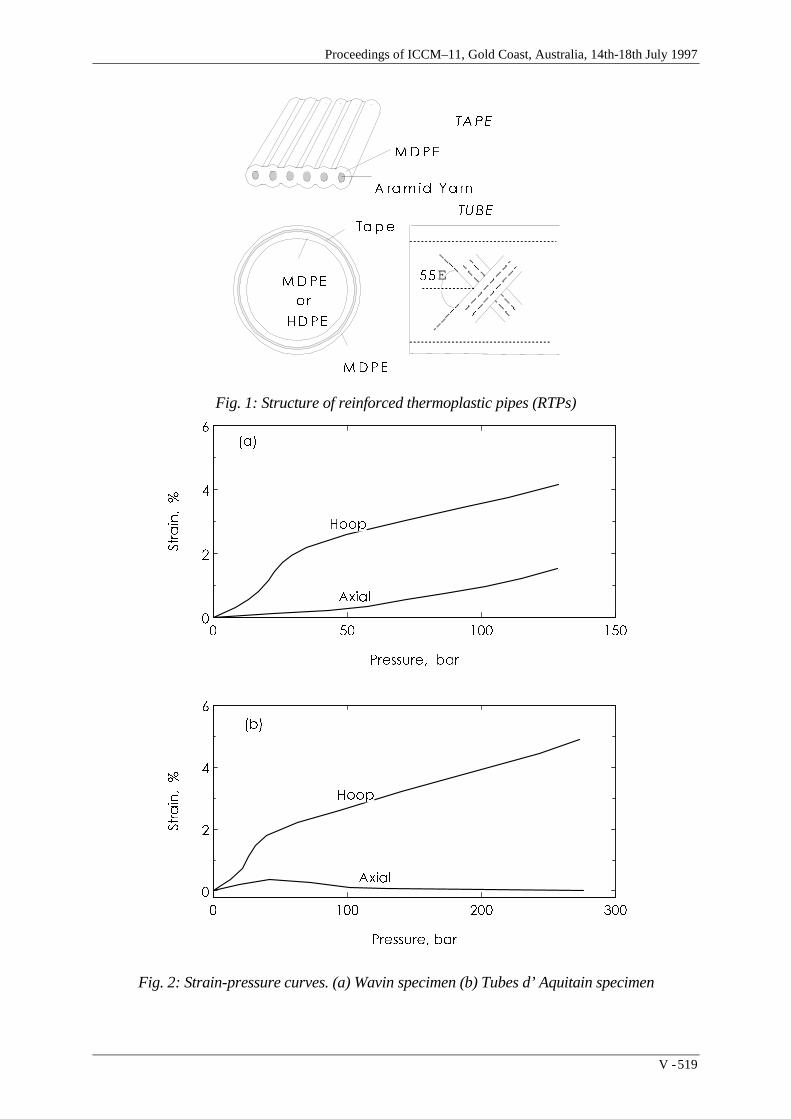
Proceedings of ICCM–11, Gold Coast, Australia, 14th-18th July 1997
V - 519
7$3(
$ UDP LG <D UQ
0'3(
E
78%(
7DSH
0'3(
0'3(
+'3(
RU
Fig. 1: Structure of reinforced thermoplastic pipes (RTPs)
D
$[LDO
+RRS
3UHVVXUH EDU
6WUDLQ
$[LDO
+RRS
E
3UHVVXUH EDU
6WUDLQ
Fig. 2: Strain-pressure curves. (a) Wavin specimen (b) Tubes d’ Aquitain specimen

Volume V: Textile Composites and Characterisation
V - 520
1HWWLQJDQDO\VLVVORSH
1HWWLQJDQDO\VLVZLWKRIIVHW
3RO\HWK\OHQHRQO\
D
$[LDO
+RRS
3UHVVXUHEDU
6WUDLQ
1HWWLQJDQDO\VLV
/DPLQDWHDQDO\VLV
$[LDO
+RRS
E
3UHVVXUHEDU
6WUDLQ
Fig. 3: Experimental data (points) fitted with composite curves (a) Wavin specimen (b) Tubesd’Aquitaine specimen
account for the size of the take up strain in terms of fibre characteristics [1] but this is notpresented here.

Proceedings of ICCM–11, Gold Coast, Australia, 14th-18th July 1997
V - 521
In contrast to the hoop strain, the axial strain does not exhibit pronounced non-linearity in thepressure range from zero to 40 bar. In other words, as the tube inflates, with an increasing hoopdeformation of the polyethylene, the axial strain increases by a much smaller amount. It will beargued below that the difference is due to the influence of the deviatoric stress components onplastic or non-linear visco-elastic deformation.
The axial strain-pressure relation in the Wavin specimen showed a degree of non-linearity atpressures greater than about 60 bar with a reduced slope at the higher pressures (Fig. 2 (a)). Theaxial strain in the Tubes d'Aquitaine specimen showed a small increase with pressure up to about25 bar but reduced towards zero at higher pressures (Fig. 2 (b)). The burst pressure was 128 bar for the Wavin specimen and 273 bar for the Tubes d'Aquitainespecimens. The form of the rupture was similar in all cases. It is probable that rupture beginswhen a critical fraction of the fibres in any location have fractured. Rupture then proceeds bynecking of the polyethylene wall in the through-thickness direction. This is followed byextension of the rupture along one of the fibre directions accompanied by extrusion of fibresthrough the gap in the wall and depressurisation. The Wavin tubes exhibited a 150 mm longrupture after depressurisation. The length of rupture was slightly larger (200 mm) in the Tubesd'Aquitaine specimens and was found to zig-zag following both fibre directions alternately in thecourse of its development. The location of the rupture sites was found to vary. In somespecimens the sites were located near the end fittings. In other specimens the rupture occurredcloser to the central portion of the tube.
Analysis Of Deformation
For simplicity we assume the thin wall approximation for the stresses so that the effect of radialpressure is ignored. We also consider membrane stresses only and ignore bending stresses thatmight arise, for example, from the constraints exerted by the end fittings [2]. The referencecoordinates are θ for the circumferential direction, r for the radial direction and z for the axialdirection. The system is statically determinate, so with the thin wall approximation for a closedend cylinder, diameter D and wall thickness t the applied stress components are: σθθ = σh, σrr =0, and σzz = ½σh, where σh = pD/2t.
Plastic or Non-linear Visco-elastic Deformation
In the pressure and strain range before the take up strain has accumulated the deformation isbelieved to reflect only the deformation of the polyethylene, with no influence exerted by thefibres. This idea is supported by the curve shown in Fig 3(a) of stress-strain data for MDPE tubes[3] fitted to the non-linear deformation observed in the RTP. However, no large scale, non-lineardeformation is indicated by the axial strain at low pressures. The difference between the hoopand axial strain behaviour is believed to arise from the response of the material to the deviatoricstress components, as discussed below.
Pressure cycling tests and creep tests [1] have revealed that the non-linear deformation iscomposed of both plastic and non-linear visco-elastic components. Approximately, one half ofthe hoop strain observed in the take up region is plastic and irreversible. The other half of the

Volume V: Textile Composites and Characterisation
V - 522
non-linear strain is reversible and rate and time dependent. The axial strain in the take up regionwas also found to be visco-elastic, but on a much smaller scale than the hoop strain.
It is well known that plastic deformation responds only to the deviatoric components of stress(e.g. ref. 4). We assume here that the same is true for non-linear, visco-elastic deformation. Sincethe hydrostatic stress component is equal to ½σh, the deviatoric components are: sθθ = ½σh, srr =−½σh and szz = 0. The Prandtl-Reuss equations [4] give the total elastic-plastic strain rates interms of the stress rates and the deviatoric stress components, i.e.
where E is Young's modulus and ν is Poisson's ratio. The parameter λ can be considered tocontrol the rate of plastic strain and has to be determined from a flow criterion for a fulldescription of plasticity. However, in the present case we need only note that, by inspection ofeqns. (1), plastic deformation cannot contribute a component to the axial strain ezz because szz =0. Thus plastic or visco-elastic deformation causes the tube to inflate with no change in axiallength from these modes of deformation. The increase in the hoop strain from plasticity isentirely accommodated by a plastic contraction in the through-thickness direction.
Elastic Deformation at Strains Above the Take Up Strain
When the take up strain has been exceeded, the overall deformation becomes elastic again. Thearamid fibres now support an increasing proportion of the hoop force and constrain furtherdeformation of the yielded polyethylene. Since the polyethylene is in the plastic state it cansupport only a portion of the total load to an extent determined by its yield or flow stress. Theelastic deformation can thus be approximated by ignoring the polyethylene and considering onlythe fibres. In this case it is appropriate to use netting analysis [5,6]. Treating the reinforcing tapeas an entity, the netting analysis prediction for both the hoop and axial strain is
where Et is the longitudinal Young's modulus of the reinforcing tape and Vt is the volumefraction of the tape. This gives a reasonable fit for the slope of the hoop strain-pressure curve forthe Wavin specimen if an offset strain of 1.6% is added to allow for the take up strain (Fig. 3(a)).Netting analysis also predicts that the axial strain is equal to the hoop strain. This is not the caseat lower pressures, but at pressures greater than about 70 bar, netting analysis gives a reasonableapproximation to the slope of the axial strain-pressure relation (Fig. 3(a)).
The results for the Tubes d'Aquitaine specimen are more difficult to explain. The constitution ofthe Wavin and Tubes d'Aquitaine specimens are similar, and although there may be small
θθ θθ θθ
θθ
θθ
σ ν σ σ λ
σ ν σ σ λ
σ ν σ σ λ
[ ( ) ]
[ ( ) ]
[ ( ) ]
e = E
- + + s ,
e = E
- + + s ,
e = E
- + + s ,
rr zz
rr rr zz rr
zz zz rr zz
1
1
1
(1)
θθσ
e = e = E V
,zzh
t t
32 (2)
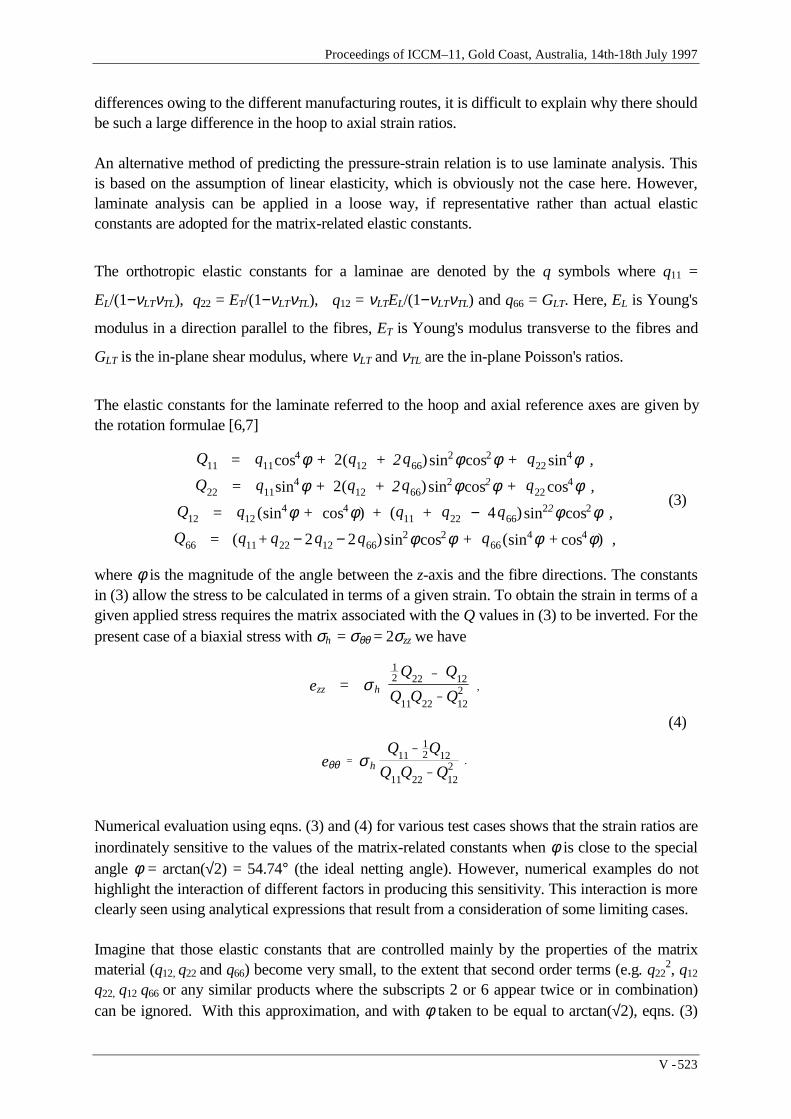
Proceedings of ICCM–11, Gold Coast, Australia, 14th-18th July 1997
V - 523
differences owing to the different manufacturing routes, it is difficult to explain why there shouldbe such a large difference in the hoop to axial strain ratios.
An alternative method of predicting the pressure-strain relation is to use laminate analysis. Thisis based on the assumption of linear elasticity, which is obviously not the case here. However,laminate analysis can be applied in a loose way, if representative rather than actual elasticconstants are adopted for the matrix-related elastic constants.
The orthotropic elastic constants for a laminae are denoted by the q symbols where q11 =
EL/(1−νLTνTL), q22 = ET/(1−νLTνTL), q12 = νLTEL/(1−νLTνTL) and q66 = GLT. Here, EL is Young's
modulus in a direction parallel to the fibres, ET is Young's modulus transverse to the fibres and
GLT is the in-plane shear modulus, where νLT and νTL are the in-plane Poisson's ratios.
The elastic constants for the laminate referred to the hoop and axial reference axes are given bythe rotation formulae [6,7]
where φ is the magnitude of the angle between the z-axis and the fibre directions. The constantsin (3) allow the stress to be calculated in terms of a given strain. To obtain the strain in terms of agiven applied stress requires the matrix associated with the Q values in (3) to be inverted. For thepresent case of a biaxial stress with σh = σθθ = 2σzz we have
Numerical evaluation using eqns. (3) and (4) for various test cases shows that the strain ratios areinordinately sensitive to the values of the matrix-related constants when φ is close to the specialangle φ = arctan(√2) = 54.74° (the ideal netting angle). However, numerical examples do nothighlight the interaction of different factors in producing this sensitivity. This interaction is moreclearly seen using analytical expressions that result from a consideration of some limiting cases.
Imagine that those elastic constants that are controlled mainly by the properties of the matrixmaterial (q12, q22 and q66) become very small, to the extent that second order terms (e.g. q22
2, q12
q22, q12 q66 or any similar products where the subscripts 2 or 6 appear twice or in combination)can be ignored. With this approximation, and with φ taken to be equal to arctan(√2), eqns. (3)
11 114
12 662 2
224
22 114
12 662
224
12 124 4
11 22 662 2
66 11 22 12 662 2
2
2
4
2 2
Q = q + q + 2q + q ,
Q = q + q + 2q + q ,
Q = q + + q + q q ,
Q = q + q q q +
2
2
cos ( )sin cos sin
sin ( )sin cos cos
(sin cos ) ( )sin cos
( )sin cos
φ φ φ φφ φ φ φ
φ φ φ φφ φ
−
− − q + ,664 4(sin cos )φ φ
(3)
zz h
,
= h
.
e = Q Q
Q Q Q
eQ Q
Q Q Q
σ
σθθ
12 22 12
11 22 122
1112 12
11 22 122
−
−
−
−
(4)

Volume V: Textile Composites and Characterisation
V - 524
and (4) can be used to obtain simpler analytical expressions. After some algebraic manipulation,the details of which are not shown here, we obtain:
The effect of taking various limits can now be obtained by inspection of eqn. (5). The keyparameter is the ratio ET/GLT.
(i) If ET goes to zero whilst GLT remains finite, both ezz and eθ go to the limiting value3/2 σh/EL, i.e. the strain ratio is unity. If the term EL is identified with EtVt the result isidentical to that of netting analysis.
(ii) If GLT goes to zero whilst ET remains finite, the limiting strain values are
In this case, the hoop strain is more than twice the value predicted by netting analysisand the axial strain is negative.
(iii) Another special case worth investigating is when the axial strain is zero. The ratio ofET to GLT where this occurs can be obtained from eqn. (5). The following particularresult for the hoop strain then obtains when ezz = 0:
In this case, in addition to the fact that the axial strain has been set to zero, the predictedhoop strain is about 50% larger than the netting analysis result.
Equation (7) was fitted to the results for the Tubes d'Aquitaine specimen (Fig. 3(b)). Althoughthe axial strain corresponds approximately with the experimental data, as is imposed by adoptingeqn. (7), the predicted hoop strain is larger than is observed experimentally. On the other hand,although the netting analysis prediction (with 1.4% offset) fits the observed hoop strain well, thepredicted axial strain does not correspond with the experimental observations.
DISCUSSION
The take up strain observed in the present work is a consequence of the reinforcing fibres notbeing infiltrated. In contrast with the present results, thermoplastic tubes reinforced with glass
zzh
L
LT T LT
T LT
h
L
LT T LT
T LT
e = E
+ E / G
+ E / G ,
e = E
+ + E / G
+ E / G .
32
8 1 2
8
32
8 2
8
σ ν
σ νθθ
[ ( ) ]
[ ]
[ ( ) ]
[ ]
−
(5)
zz LT h L
LT h L
e = + / E ,
e = + / E .
− 32 1 2
32 2
( )
( )
ν σ
ν σθθ
(6)
θθσ
e = E
.h
L
94 (7)

Proceedings of ICCM–11, Gold Coast, Australia, 14th-18th July 1997
V - 525
fibres that are infiltrated do not exhibit the non-linear behaviour shown in Fig. 2 [8]. In thepresent case, the polyethylene components have to yield in order load the fibres. Althoughyielding of the polyethylene produces a larger hoop strain than would otherwise occur with fullyinfiltrated fibres, the associated properties confer useful, additional advantages on RTPs. Forexample, the flexural resistance of the tubes is low as a consequence of the non-infiltration. Thus,the tubes are easily coiled, giving considerable flexibility in installation. In addition, if an RTP iscollapsed by external pressure or concentrated loads, its subsequent ability to contain highpressure is very little affected [1].
At strains greater than the take up strain, the hoop strain behaves as predicted by netting analysis.However, the axial strain as a function of pressure is observed to be less predictable. This is notentirely unexpected, since in netting analysis the fibres can only support the load when they areinclined at exactly the ideal angle, i.e. some shear resistance is required to compensate for anyslight deviation from the ideal angle. Laminate analysis is preferred in this case although there isuncertainty about its application to fibres in a non-linear matrix. When the matrix-related elasticconstants become very small, as might be considered an approximation when the matrix isplastic, the predicted strain ratio is rather sensitive to the ratio of the notional transverse andshear moduli. Thus, a full analysis of elastic fibres in a non-linear, yielding matrix is required toresolve this point.
CONCLUSIONS
Pressure tests have been carried out on closed end reinforced thermoplastic pipes.
(ii) The hoop strain-pressure relation shows a high degree of non-linearity in the early stages ofdeformation. Because the fibres are not infiltrated, the polyethylene has to yield by plastic andnon-linear visco-elastic deformation to load the fibres.
(iii) The axial strain does not exhibit non-linearity in the low pressure region because thedeviatoric component of stress in the axial direction is zero.
(iv) Netting analysis can account for the hoop strain at strains greater than the take up strain.
(v) The axial strain is less predictable than the hoop strain. Some approximations derived fromlaminate analysis have been used to investigate this point.
ACKNOWLEDGEMENTS
One of the authors (BJC) gratefully acknowledges the support of an Engineering and ScienceResearch Council CASE award (with Shell Research) in the period when this work was done.

Volume V: Textile Composites and Characterisation
V - 526
REFERENCES
1. B.J. Chapman, University of Newcastle upon Tyne, unpublished results 1996.
2. S.R. Frost, Shell Research and Technology Centre, Amsterdam, private communication.
3. L.M. dos Reis Henrique, R.B. Goldman, "Thin-walled Laminated Composite CylindricalTubes: Part I- Boundary Value Problems", Journal of Composites, Vol. 9, 1987, pp. 47-52.
4. R. Hill, `Theory of Plasticity', Oxford University Press ,1950.
5. T.G. Rogers, `Problems for Helically Wound Cylinders' in Continuum Theory of theMechanics of Fibre-Reinforced Composites (ed. A.J.M. Spencer), pp.147-178, Springer-Verlag, 1984.
6. D. Hull, `An Introduction to Composite Materials', Cambridge University Press, 1981.
7. S.G. Lekhnitskii, `Theory of Elasticity of an Anisoptopic Body', Holden-Day (SanFrancisco), 1963.
8. A. Fahrer, University of Newcastle upon Tyne, private communication 1996.

Proceedings of ICCM–11, Gold Coast, Australia, 14th-18th July 1997
V - 527
QUALITY CONTROL OF GLASS FIBREREINFORCED PLASTIC LONG TUBULAR MEMBERS
Carlo A. Castiglioni, Andrea Spessa
Structural Engineering Dept. (DIS), Politecnico di MilanoP.zza Leonardo da Vinci 32, 20100 Milano, Italy
SUMMARY: This paper presents the results of an experimental analysis on the mechanicalproperties of glass-fibre reinforced plastic (GRP) tubular conical columns widely used ascable supports by telephone and electric companies.
The aim of the study is mainly a quality control for the assessment of the characteristic valuesof the Young's modulus and the tensile strength of the material to be performed on specimensmanufactured by different firms. Tensile tests have been carried out on specimens cut fromthe columns accordingly UNIPLAST EN-61 and ASTM D638-72. Usually, recommendationsfor bending tests (UNIPLAST EN-63 and ASTM D790-71) consider the possibility ofevaluating the Young modulus of the material by testing small size specimens (of the samekind of the tensile specimens). Due to the large curvature of the tubes considered in this study,whose diameter is variable between 150 mm and 250 mm, the "slices" cut from the tubes forobtaining the specimens are not plane. A testing procedure was then identified, to performfour points bending tests on large size specimens (2 meters long) cut from the central portionof the tubes. Furthermore, compression tests have been performed on stubs.
The experimental data obtained from the 3 different types of testing and their statistics arecompared and discussed.
KEYWORDS: long tubular members, mechanical behaviour, tensile Young’s modulus ofelasticity, tensile strength, bending modulus of elasticity
INTRODUCTION
Glass-fibre reinforced plastic columns are being extensively used for supporting light weightssuch as cables, lamps or antennas. They have many advantages over conventional materials(like wood, steel or concrete) such as light weight and high corrosion resistance and the massproduction (as well as the technical improvements achieved in the last two decades) makecomposite materials convenient with respect to conventional ones from an economical pointof view. Since 1984 GRP poles have been used in Italy to support overhead lines; manyshapes and geometries are available, depending on the producer and on the application;usually, however, these poles were no more than 8 meters long. In 1990 a longer pile, 9meters long, was adopted by a Company for sustaining overhead lines in street crossing. Thisoccasion originated a co-operation between the Company and the Structural EngineeringDepartment of Politecnico di Milano, with the aim of performing:

Volume V: Textile Composites and Characterisation
V - 528
1) a quality control of the mechanical properties of the poles, manufactured by various firmsall over the national territory;
2) a reliability analysis of the products delivered by the various manufacturers.
In the study, attention was concentrated on poles having an hollow truncated conical shape, 9meters long; the maximum external diameter is equal to 250 mm and the minimum externaldiameter at the top section is equal to 115 mm. The nominal wall thickness is equal to 7.0mm. All poles possess a perfectly smooth external surface and thus qualify at the 1st level ofASTM 2563-70 rules. Furthermore, the external surface is overlaid with a special not wovenfabric, which guarantees protection against UV rays and environmental chemical attacks.
As the production procedures of these poles, which are centrifuged, are such that the glassfibre content (and consequently the mechanical properties of the material) vary along thelongitudinal axis of the member, for each pole 5 portions were identified along thelongitudinal axis (Fig. 1). From 4 portions compression and tensile specimens were obtainedwhile from the intermediate portion a 2 m long specimen was obtained to be submitted tobending tests.
Usually, recommendations for bending tests - e.g. EN-63, ASTM D790-71 - consider thepossibility of evaluating the Young modulus of the material by testing small size specimens(of the same kind of the tensile specimens) “sliced” from the member. Due to the largecurvature of the tubes under evaluation, whose diameter is variable between 150 mm and 250mm, the "slices" cut from the tubes, for obtaining the specimens are not plane. A testingprocedure was then identified, to perform four points bending tests on 2 meters longspecimens cut from the central portion of the columns.
Specimens cut from the 9 meters long polewere collected from six different producers;each firm provided 5 poles; for each poleprovided one 2.0 m long specimen forbending test, 4 stubs for compression test anda total of 100 specimens for tensile test. Asecond phase of this study dealt with the axialload carrying capacity of these members. Fullscale tests were carried out on 9 m long polesto analyse the behaviour of these membersunder working conditions. Experimentalbuckling tests were carried out on full scaletubes to analyse the working behaviour of thepole (Ref. /1/). The results of the first phaseare herein presented and discussed.Concluding remarks complete the paper.
LEVEL 1TENSILE
COMPRESSION
LEVEL 3BENDING
LEVEL 2TENSILE
COMPRESSION
LEVEL 4TENSILE
COMPRESSIONLEVEL 5TENSILE
COMPRESSION
Fig. 1: Specimen outcoming zones

Proceedings of ICCM–11, Gold Coast, Australia, 14th-18th July 1997
V - 529
WORKING CONDITIONS OF THE MEMBERS AND MATERIALCHARACTERISTICS
Working conditions and Material
A particular application of tubular conical columns is their use as cable support by telephoneand electric companies. With regard to this application the buckling problem is mainlyconnected to the corner poles of the lines which are guyed in order to reduce lateraldeflections due to the transversal component of the cable tension. Hence, these members aresubjected to compression and bending; the amplitude of the axial load depends on thetransversal force and the guy inclination. The poles are usually driven into the ground for alength of 1.3 ± 0.2 m, and can be considered as cantilevered, with a 7.7 ± 0.2 m free length.Concerning to these working conditions, the companies adopting GRP poles defined technicalrecommendations about mechanical and geometrical properties, that should be provided bythe different manufacturers. The leading requirements were related to the mean thickness(equal to 7 mm), the tensile strength (greater than 160 MPa) and the modulus of elasticity(greater than 20000 MPa).
Furthermore, all poles must guarantee protection against UV and chemical attacks.
All the poles were made by centrifugal casting, a production technique for fabricatingcylindrical and conical shapes in which glass-fibre mats and roving are positioned inside ahollow mandrel designed to be heated and rotated as resin is cured. The internal side of themandrel reproduces the external shape of the product. By controlling step by step the angularvelocity - slow rotational velocity during the resin filling and a faster velocity during thecuring - and the resin viscosity - mainly operating on the mandrel temperature -, it is possibleto get a well impregnated fabric with an almost constant thickness; the poles tested, had athickness included between 6.4 and 7.1 millimetres.
The poles were all produced with unsatured (thermosetting) polyester resins, with E-glassfibres and fabrics.
EXPERIMENTAL PROCEDURE
Defining the mechanical properties of the material in the case of truncated conical tubes is nota conventional problem since:
- the specimens cut from the manufact do not result plane but they have concavity, whichcould produce difficulties during the test; as a matter of fact, in tensile tests, the clampscan carve the specimen that can break. Furthermore, in conventional bending test thespecimen convexity makes hard the correct load application and the specimen arcbehaviour in transversal direction causes bias in the results.
- glass-fibre reinforced plastic, as all the fibre-reinforced materials, towers for itsanisotropic behaviour, and it is strongly influenced from profile working like thepreparation of the specimen.

Volume V: Textile Composites and Characterisation
V - 530
Since the aim was to get a reliable value of mechanical properties of the material, it wasdecided to consider specimens with dimension not influenced from tool working by derivingthem from longitudinal and transversal cutting, at different levels of the pole axis.
The specimens were manufactured in six batches from six different producers. Eachmanufacturer provided 5 poles. Each pole was cut in 5 sections. From the intermediatesection, 2 meter long, a 4 point bending test specimen was obtained. From each of the twoupper and the two lower sections one compression test specimen having a slenderness ratio λ= 6 according to the UNIPLAST 4279 specifications (ASTM D695-69 prescribes λ = 11÷15)and five 400 mm long tensile test specimens were obtained.
In total each manufacturer provided:• five 2 meter long flexural specimens• one hundred 400 mm long tensile specimens• twenty λ = 6 compression stubs.
Furthermore, since the aim of the study was to get information about the product quality froma mechanical performance point of view, an evaluation of physical specimen parameters wascarried out to determinate glassfibre volumetric content and specimen thickness. By tensilestrength and Young’s modulus, the effective rigidity was calculated and correlated to the glasspercentage and specimen thickness.
Tensile Tests
Tensile tests were carried out on specimens 25mm wide and 400 mm long, to get a mid-partlength equal to 200 mm where the stress is notinfluenced by the external clamps and by the toolworking of the ends; in fact, to prepare thespecimen, both ends were worked by some resincured and levelled to make the surfacescomplanate with the clamps of the testingmachine (EN-61). Furthermore, to improve theadherence between the specimen and the clamps,some carborundum dust was applied on the resinreinforcements at the ends.
The specimen is qualitatively illustrated in Fig. 2.
Test were carried out by means of a Schenk universal testing machine having a 2000 kN totalcapacity.
The load applied on the specimen was measured by a dynamometer while the elongation wasgot by LVDT, with reference length equal to 100 mm, directly applied on the specimen.
By this way it was possible to measure the exact strain of the specimen and to keep out anyspurious component due to the axial strain of the testing machine and to the sliding of thespecimen between the clamps.
Fig. 2: Tensile specimen (qualitative)

Proceedings of ICCM–11, Gold Coast, Australia, 14th-18th July 1997
V - 531
Compression Tests
The measured compression strength of composites is sensitive to the specimen configurationand the fixture used for loading. Compression tests have been performed on 4 stubs percolumn. The slenderness λ for stubs has been evaluated as the ratio between specimen lengthand midspan radius of inertia. All stubs have the same slenderness equal to 6, according to theItalian rule UNIPLAST 4279. The slenderness has been adopted to define the specimenlength, as a function of its transversal dimensions. The experimental analysis was carried outon stubs obtained from cutting the poles at different levels as it is illustrated in Fig. 1. The teststubs were cut to size with a high degree of accuracy using a diamond tip saw, and, later on,levelled with a precision within 0.1 mm. The analysis was performed by displacementcontrolled centred compression tests using a numeric control testing machine MTS withmaximum load equal to 2300 kN. This machine is adequately stiff and rigid enough to reduceany possible secondary effect such as the machine/test-rig interaction. The stub displacementswere measured by four LVDTs installed between the testing machine plates in oppositediametral positions. Before leading the specimens to collapse, compression loading cycleswere applied to each specimen to evaluate its behaviour and testing repeatability underdifferent load levels.
Bending Tests
As the aim of the investigation was to get information about the in service behaviour of thepoles and in order to avoid the procedural problems involved with the large curvature of themembers, resulting in a concavity of the specimens usually prescribed by recommendationsfor bending tests, it was decided to disregard recommended testing procedures such as thoseproposed in UNIPLAST EN-63 and, in the case of bending tests, to identify an ad hoc testingprocedure, operating on large size specimens (2.0 meters long) cut from the central portion ofthe pole. The cutting position along the pole axis was decided according to the followingitems:
• the mats are usually positioned not uniformly along the pole axis and, because of thetruncated cone shape, the most of them are concentrated in the lower part of the polewhere the diameter is maximum. Only few mats go up to the end of the pole while all theothers stop at different elevations; similar distributions are adopted by variousmanufacturers although the length of each mat is different for every producer. As a matterof fact, in order to get information about the average behaviour, it was decided to analysea part of the pole were mats are distributed on average; the mechanical properties, in fact,are related to the glass fibre content and higher values could be obtained by testing thepole lower part which usually represents the most stressed section if the member is acantilever.
• the poles are produced by different firms and consequently their dimensions are differentfor the various manufactures.
In order to maintain the same testing configuration for all specimens, it was asked to themanufacturers to provide - from the intermediate part of the pole - a 2.0 m long specimen,having a given diameter at two cross section spaced 1800 mm. In fact, the specimens weresupported at the end by two wooden saddles of 100 mm-width. The saddles were shaped tokeep the longitudinal axis of the specimen horizontal and to surround a semicircular half of
Volume V: Textile Composites and Characterisation
V - 532
the tube. This support shape reduces deformability and section ovalization under the appliedloads and prevents out-of-plane displacements of the specimen.
Furthermore, rubber pads (Teflon) were placed on both supports in order to reduce frictionbetween the saddle and the specimen and to avoid local failures; of course, this testingconfiguration caused the specimen to have well defined transversal dimensions.
An hydraulic jack was used to apply the load that was distributed to two loading pointslocated at the third points of the stub using a steel beam and two additional wooden saddles.The magnitude of the total applied load (i.e., two times the load at each load point on the log)was monitored by a load cell placed in series with the hydraulic jack.
Vertical displacements were measured using 5 linear LVDT. The deflections were measuredat the specimen midspan, at the two load points and at 5/12 and 7/12 of the span.
Each specimen was loaded in a series of short term loading/unloading cycles to verify themechanical behaviour and its reproducibility under different load levels.
The target load was fixed equal to 100 kN although some stubs collapsed before the targetload was reached.
RESULTS
The normal model was used to calculate the characteristic values B. They have beencalculated in terms of the sample mean X and standard deviation S using the formula:
B X kS= − (1)
where k is a coefficient connected to the risk formulation 1-α and to the confidence level. A95% probability of survival was assumed, connected to 95% confidence level, in order todefine the characteristic values of the various properties.
To get information about production quality by mechanical material properties, all the dataobtained were computed following the described procedure.
The computing was mainly aimed to identify the elastic modulus mean value Em, the root-
mean-square deviation S and the Young's modulus characteristic value Eb by the application
of :
E E kSb m= − (2)
Tensile Young's Modulus
Because of the small specimen width equal to 25 mm, the area A was measured by concavityneglecting.
The initial tangent Young's modulus ET was computed by the following formula:

Proceedings of ICCM–11, Gold Coast, Australia, 14th-18th July 1997
V - 533
El R F
A ZT =⋅ ⋅
⋅0 1
1
∆∆
(3)
where l0 = 100 mm is the LVDT reference length, R is the magnification typical transformer
coefficient, ∆F1 is the load variation and ∆Z1 is the apparent elongation variation
connected to ∆F1.
The test results showed an increasing of the Young’s modulus with strain. The tensile secantmodulus of elasticity ES was evaluated according to UNI-EN61, basing on Eqn. 3 with ∆Z1corresponding to a 0.5% apparent elongation percentage.
Considering the target values, testing phase was carried out as shown in Table 1 where areillustrated the values got for the poles manufactured by the six different firms herein called A,B, C, D, E and F.
Table 1: Tensile Young’s modulus statistics
FIRM EmT(MPa)
EbT(MPa)
S(MPa)
A 26495 21175 2700
B 23384 20383 1436
C 25230 22640 1282
D 22586 20241 782
E 22616 16817 2416
F 22944 19669 1621
A global analysis of results has been carried out as shown in Fig. 3 where the Young'smodulus distribution is illustrated; it was derived considering the whole batch. The figureshows that the specimens that don't touch the target value are less than 3.5% of the total.Despite this fact, because of the standard deviation high value - S = 2598 MPa - the resultingcharacteristic value of the tensile Young modulus is 19733 MPa, a little lower than the targetrequired. Then, a statistical analysis has been performed considering the zone where thespecimen was got from; all the specimens were cut from 4 different pole levels as shown inFig. 1. Table 2 illustrates the results got for each level; it shows how the Young's modulusincreases moving from the top of the pole - level 1 - to its lower part - level 5 -. Level 5 showslower values than level 4 ; it is due to a great result dispersion with 20 results above 26000MPa. Neglecting them, the target values are got.

Volume V: Textile Composites and Characterisation
V - 534
Table 2: Tensile Young’s modulus statistics per level
Level 1 Level 2 Level 4 Level 5
EmT (MPa) 24064 24308 24456 23885
EbT (MPa) 17569 19302 20581 20246
S (MPa) 3168 2515 1947 1793
The mean values are always greater than the target required; the characteristic values aregreater than the target only for the fourth and the fifth levels. The values progress is mainlydue to the high concentration of glass-fibre in the lowest part of the pole where there is themost stressed section in operative conditions. By this reason, it seemed acceptable to re-calculate the distribution of tensile elastic modulus values of Fig. 3 by ignoring specimenswhich belong to level 1.
The result is shown in Fig. 4: by re-analysing the new sample, a value of EbT = 21372 MPa
is obtained, satisfying the minimum required.
0
0.00002
0.00004
0.00006
0.00008
0.0001
0.00012
0.00014
0.00016
0 5000 10000 15000 20000 25000 30000 35000 40000
E t (MPa)
Target
00.000020.000040.000060.000080.0001
0.000120.000140.000160.000180.0002
0 5000 10000 15000 20000 25000 30000 35000 40000
E t (MPa)
Target
Fig. 3:Young’s modulus distribution (all levels) Fig. 4:Young’s modulus distribution (levels 2,4 & 5)
Tensile Strength
The ultimate tensile strength was evaluated for the four levels with the same procedure usedfor Young’s Modulus computing; main results are shortly resumed in Table 3.
Table 3: Ultimate tensile strength statistics for each pile level
Level 1 Level 2 Level 4 Level 5fmT (MPa) 281.8 292.6 301.3 311.1
fbT (MPa) 183.5 199.7 183.6 193.6
S (MPa) 47.9 46.7 59.2 59.0
where fmT and fbT are respectively the mean value and the characteristic value for theultimate tensile strength. The distribution is shown in Fig. 5. The correlation between tensilestrength and glassfibre volumetric content is discussed in § 5.

Proceedings of ICCM–11, Gold Coast, Australia, 14th-18th July 1997
V - 535
Thickness
A statistical analysis of specimen thickness was performed during tensile tests.
About half of the total specimen sample has a thickness lower then the 7 mm required. Themean value is 7.15 mm but, being S = 1.17 mm, the characteristic value is 5.03 mm; in Fig. 6the Young's modulus is correlated to the specimen thickness; a large scattering is evident.According to the "mixing rule" (Voigt model), the figure also shows that at increasingthickness corresponds a decreasing tensile modulus.
If Egf and Em are respectively the glassfibre and the matrix Young's modulus and α is theglassfibre volumetric content, the composite Young's modulus can be derived from thefollowing formula:
E E E Et gf m= + − +α α( ) int1 (4)
where Eint means the effect of the different lateral strain due to the different Poisson's ratios
of the two materials. In elastic field Eint is negligible. Being Egf >> Em , if during
manufacturing α value decreases - i.e. the resin volumetric content increases more then theglassfibre volumetric content - also the value of Et decreases.
Furthermore, the ultimate tensile strength appeared to decrease with the increasing thickness;this fact confirms the need for caution in applying design allowables derived from small scaletests to large GRP structures.
00.0010.0020.0030.0040.0050.0060.0070.008
0 100 200 300 400 500 600
f T
TARGET
16000180002000022000240002600028000300003200034000
5.00 6.00 7.00 8.00 9.00 10.00
thickness [mm]
Fig. 5: Tensile strength distribution Fig. 6: ET predicted by thickness
Compressive Modulus of Elasticity
The experimental analysis was carried out by MTS testing machine. This is able to provide amaximum load of 2300 kN. The high magnification drum recorder integral to the MTSmachine was used to plot the load/end-shortening curves.
Cyclic loads were applied to each specimen to evaluate its behaviour and the repeatabilityunder different load levels. After the checking and several loading and unloading tests, thespecimen was then tested to failure.

Volume V: Textile Composites and Characterisation
V - 536
Since the testing machine had a displacement controlled process, collapse of the panel wasdenoted as a sudden reduction in load.
The theoretical specimen shortening was estimated by numerical integration of the virtualwork equation. The shortening was calculated as the mean of the two values measured byLVDT placed between the testing machine plates on opposite sides.
The secant modulus of elasticity was evaluated by numerical computing of the slope of thelines connecting in the stress and strain plane points corresponding to load increments equalto 10 kN.
By a statistical interpretation of the results, the mean value computed for different load levelswas obtained. Furthermore, the standard deviation allowed interesting information about thelinearity of the diagram to be obtained. The characteristic value of the modulus of elasticitymeasured by compression tests resulted far from the minimum required. Mainly, the Young’smodulus showed a decreasing behaviour with strain increasing. These values are illustrated inTable 4, where EmC is the mean value while EbC is the characteristic value.
Table 4: Compressive modulus of elesticity statistics
FIRM EmC(MPa)
EbC(MPa)
S(MPa)
A 17011 12975 1345
B 20716 13532 2395
C 20093 12956 2379
D 20691 12389 2768
E 21333 16423 1637
F 20552 13865 2229
Bending Modulus of Elasticity
The load was applied within the elastic range and removed to allow the specimen to furthersettle.
After the checking and several loading and unloading tests, the specimen was then tested tofailure. For all tests fibre breaking could be heard well before final failure. There was quite asignificant variation in the way the failures occurred. In few cases it initiated on the supportsdue to the shear force. In bending there are displacement gradients also in the circumferentialdirection in addition to those gradients in the axial direction. The intralayers stressesassociated with these displacement gradients, coupled with the brittle nature of the material,can be severe enough to cause material failure within these boundary regions. In most casesfailure started at the loading seddles or in the mid span zone. The values computed areillustrated in Table 5, where EmB is the mean value while EbB is the basis value.
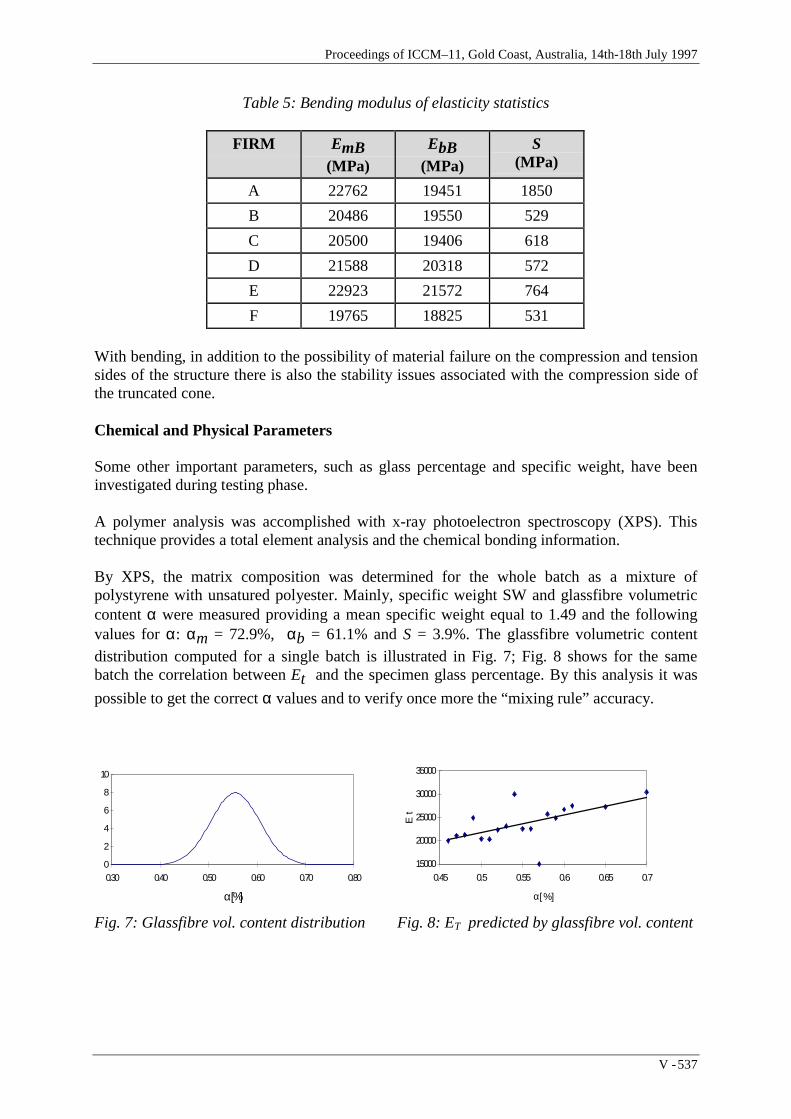
Proceedings of ICCM–11, Gold Coast, Australia, 14th-18th July 1997
V - 537
Table 5: Bending modulus of elasticity statistics
FIRM EmB(MPa)
EbB(MPa)
S(MPa)
A 22762 19451 1850
B 20486 19550 529
C 20500 19406 618
D 21588 20318 572
E 22923 21572 764
F 19765 18825 531
With bending, in addition to the possibility of material failure on the compression and tensionsides of the structure there is also the stability issues associated with the compression side ofthe truncated cone.
Chemical and Physical Parameters
Some other important parameters, such as glass percentage and specific weight, have beeninvestigated during testing phase.
A polymer analysis was accomplished with x-ray photoelectron spectroscopy (XPS). Thistechnique provides a total element analysis and the chemical bonding information.
By XPS, the matrix composition was determined for the whole batch as a mixture ofpolystyrene with unsatured polyester. Mainly, specific weight SW and glassfibre volumetriccontent α were measured providing a mean specific weight equal to 1.49 and the followingvalues for α: αm = 72.9%, αb = 61.1% and S = 3.9%. The glassfibre volumetric contentdistribution computed for a single batch is illustrated in Fig. 7; Fig. 8 shows for the samebatch the correlation between Et and the specimen glass percentage. By this analysis it was
possible to get the correct α values and to verify once more the “mixing rule” accuracy.
0
2
4
6
8
10
0.30 0.40 0.50 0.60 0.70 0.80
α [%]
15000
20000
25000
30000
35000
0.45 0.5 0.55 0.6 0.65 0.7
α [ % ]
E t
Fig. 7: Glassfibre vol. content distribution Fig. 8: ET predicted by glassfibre vol. content
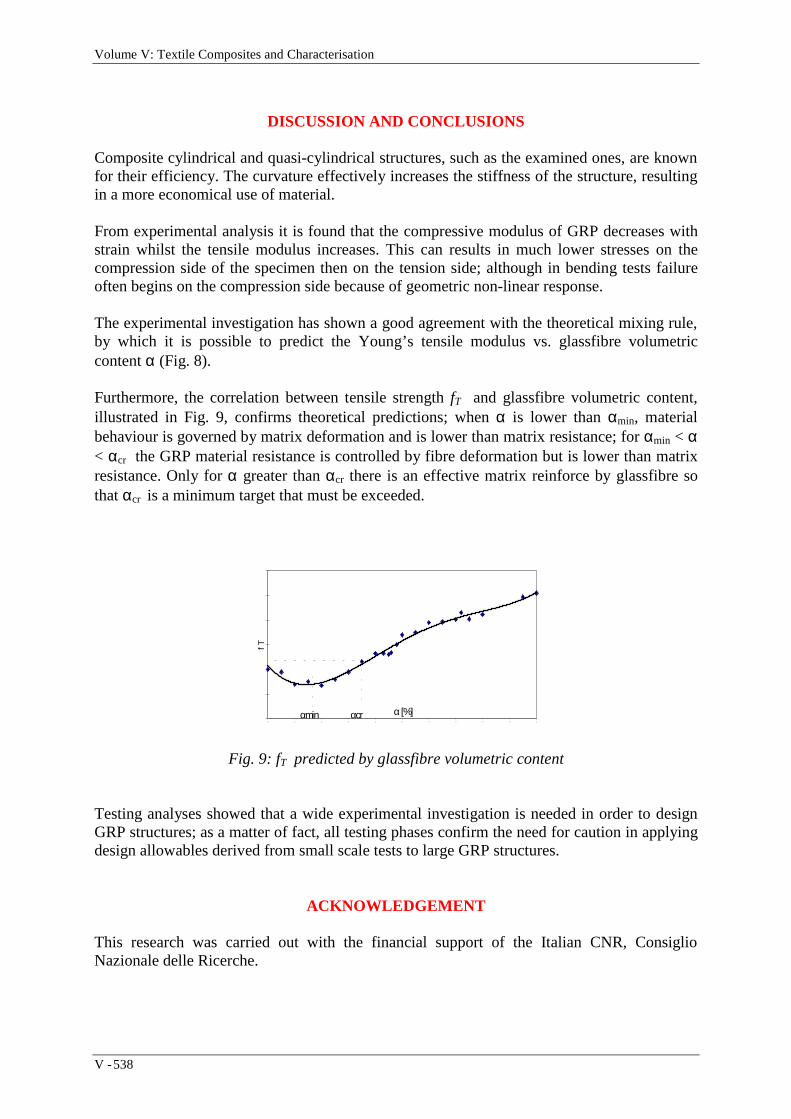
Volume V: Textile Composites and Characterisation
V - 538
DISCUSSION AND CONCLUSIONS
Composite cylindrical and quasi-cylindrical structures, such as the examined ones, are knownfor their efficiency. The curvature effectively increases the stiffness of the structure, resultingin a more economical use of material.
From experimental analysis it is found that the compressive modulus of GRP decreases withstrain whilst the tensile modulus increases. This can results in much lower stresses on thecompression side of the specimen then on the tension side; although in bending tests failureoften begins on the compression side because of geometric non-linear response.
The experimental investigation has shown a good agreement with the theoretical mixing rule,by which it is possible to predict the Young’s tensile modulus vs. glassfibre volumetriccontent α (Fig. 8).
Furthermore, the correlation between tensile strength fT and glassfibre volumetric content,illustrated in Fig. 9, confirms theoretical predictions; when α is lower than αmin, materialbehaviour is governed by matrix deformation and is lower than matrix resistance; for αmin < α< αcr the GRP material resistance is controlled by fibre deformation but is lower than matrixresistance. Only for α greater than αcr there is an effective matrix reinforce by glassfibre sothat αcr is a minimum target that must be exceeded.
0.00 0.10 0.20 0.30 0.40 0.50 0.60 0.70 0.80 0.90 1.00
α [%]
f T
αmin αcr
Fig. 9: fT predicted by glassfibre volumetric content
Testing analyses showed that a wide experimental investigation is needed in order to designGRP structures; as a matter of fact, all testing phases confirm the need for caution in applyingdesign allowables derived from small scale tests to large GRP structures.
ACKNOWLEDGEMENT
This research was carried out with the financial support of the Italian CNR, ConsiglioNazionale delle Ricerche.

Proceedings of ICCM–11, Gold Coast, Australia, 14th-18th July 1997
V - 539
REFERENCES
1. Castiglioni C.A., Spessa A., “Axial load carrying capacity of glassfibre reinforcedplastic long tubolar members”, Proceedings of the Tenth International Conference onComposite Materials, Whistler, British Columbia, Canada, August 14-18, 1995.
2. UNIPLAST En 61 “Materie plastiche rinforzate con fibra di vetro. Determinazionedelle caratteristiche a trazione”, UNI 1978.
3. Agarwal B. D., Broutman L. J., Analysis and Performance of Fiber Composite, JohnWiley & Sons, 1980.
4. Calcote L. R., The Analysis of Laminated Composite Materials”, Van NostrandReinhold Company, 1969.
5. Castiglioni C. A., “Controllo di qualità su campioni di tubi rastremati in vetroresina”,Internal Report, Structural Engineering Dept., Politecnico di Milano, 1993.
6. Chawla K. K., Composite Materials, Springer-Verlag, 1987

Volume V: Textile Composites and Characterisation
V - 540
MICROMECHANICAL MODELLING OF THEDAMAGE INITIATION AND THE COMPETITIONBETWEEN DIFFERENT MECHANISMS OF ± 55°
FILAMENT-WOUND GLASS-FIBRE/EPOXY-RESINTUBES
Jinbo Bai, Gengkai Hu* and Philippe Bompard
Lab. MSS/MAT, CNRS URA 850,Ecole Centrale de Paris, 92295 Châtenay Malabry CEDEX, France
* Applied Mechanics Department, Beijing Institute of Technology, P.R.China
SUMMARY : The objective of this paper is to investigate the damage initiation mechanismsand the competition between different mechanisms of ± 55° filament-wound glass-fibre/epoxy-resin tubes under biaxial loading. First, the microstructure, mechanical behaviourand damage initiation mechanisms were determined. Then, micromechanical modelling of thedamage initiation was conducted in order to determine the mechanical conditions under whichdifferent microcracking mechanisms occur and the critical szz/sqq ratios which correspond tothe change from interfacial failure to microcracking at porosity. The porosity volume fractionshould be kept below 5% to avoid any detrimental effect. Failure envelopes of our compositetube were predicted based on the different criteria at meso- and microscopic scales. Thepredicted results in an internal pressure dominated region are conservative compared withexperimental ones. The possible improvement may reside in introducing a variation of theshear modulus due to the matrix viscous effect and the interfacial sliding effect.
KEYWORDS: composite filament-wound tube, interply and intraply porosity, axial tensile,internal pressure and combined loading, damage, transversal cracking, delamination,micromechanical modelling
INTRODUCTION
Filament-wound glass fibre reinforced epoxy (GRE) tubes are increasingly being used forhigh pressure containment in chemical plant and aerospace applications, and also in the oiland nuclear industry [1-5]. The design of this kind of tube was optimised essentially for thefabrication of internal pressure containers which are frequently thin-walled and possesscharacterisations like low cost and weight effective utilisation of materials. Their fabricationroute consists of impregnating the fibre strands with resin and then winding them on to arotating mandrel of a predetermined fibre path under controlled tension. The wound part iscured in an oven to form the final product which has continuous fibres of the same orientationand axisymmetrical configuration. The most frequently observed microstructural defects ofthis kind of composite structure are inter and intra-ply porosity in the matrix, non-uniformfibre distribution (local fibre volume fraction fluctuation and interlayer fibre free resin layer)

Proceedings of ICCM–11, Gold Coast, Australia, 14th-18th July 1997
V - 541
and fibre deviation off the ± 55° alignment. A series of mechanical tests have been carried outwith various combinations of hoop and axial stresses. The investigation of mechanisms offailure has shown that there are fibre/interface/matrix interactions and interactions betweenlayers which have a dominant effect on the early stages of mechanical failure and damage(microcracking and delamination) initiation [1-10]. To account for these micromechanicaleffects, it is necessary to perform analyses of the stress states especially the interply stresscomponents and their sensitivity to the microstructural defects [11].
This paper begins with a description of our numerical models, the material properties and thestructure analysed. In the results and discussion section, we will focus on the stress states andtheir sensitivity to microstructural defects and damage. After a micromechanical analysis, thecompetition between different mechanisms and the effect of a few important factors will bediscussed. Failure envelopes of the composite tube will also be presented.
NUMERICAL MODELLING DESCRIPTION
Material Characteristics of Tubing Structure
The internal and external diameters of the tubes are 60 mm and 65 mm respectively. Theaverage thickness of each ply is 0.417 mm. The lay-up sequence is [55°/-55°]3. The epoxyresin used is CIBA - GEIGY LY 556. The fibres are roving 2400 TEX (Vetrotex). In Table 1the Young's moduli E and the Poisson's ratios n of the resin and the fibres are shown. Thebasic constituents of the composite ply (fibres and resin) are assumed as isotropic materialswith linear elastic behaviour. Mechanical characteristics of unidirectional ply are needed asinput data for the 3D finite element calculations. Many approximate averaging and asymptotichomogenisation techniques have been proposed to obtain the overall characteristics of aheterogeneous material containing periodically or randomly distributed inhomogeneities. Inthis paper we used the Mori-Tanaka theory [10]. The nominal average fibre volume fraction is56%. Moreover, each unidirectional reinforced ply is considered as an orthotropic materialwith two privileged directions: longitudinal (fibre direction) and transversal (perpendicular tothe previous) directions. Six independent coefficients are required for its complete mechanicalbehaviour characterisation. In Table 1 the six homogenised elastic moduli are given expressedin a local orthotropic system (1, 2, 3) as defined in Fig. 1, where E1 and E2 are transverse andlongitudinal Young’s moduli, nij the Poisson ratios and Gij the shear moduli.
Table 1. Mechanical properties of fibres, resin and a unidirectional ply. Engineeringconstants
E (MPa) n sr (MPa) er (%)
Epoxy resin 3400 0.35 40 1.7
Glass fibre 73800 0.23 2400 -
E1 (Gpa) E2 (GPa) n12 n23 G13 (GPa) G23 (GPa)
10.26 42.89 0.067 0.28 3.58 4.03

Volume V: Textile Composites and Characterisation
V - 542
Numerical Models and Results of Numerical Calculation
A whole tube is shown in Fig. 2. The total height of the structure equals 2H = 330 mm. In thefollowing calculations, it is supposed that the internal pressure p = 10 MPa and the tensileforce T=10 kN imposed on the tube extremity, are uniformly distributed on the correspondingfaces. The 3D finite element calculations were first conducted on a long whole tube [11]. Thechoice of modelling a whole tube was made in order to avoid any hoop boundary conditioneffect. The stress distribution through the thickness presented in Fig.3 represents typicalresults for composite shells. The results were obtained for the cases of pure internal p=10MPa (sqq=120MPa) and pure tensile T=10 kN (szz=20.37 MPa), respectively. In the case ofpure internal pressure the stress S22 which is higher in the internal ply slowly drops by 8% onmoving towards the external ply.
EXPERIMENTAL PROCEDURE
Test Procedure and Data Acquisition Systems
Tubular specimens from three different manufacture lots (Lot A, B and C) were tested on aMTS hydraulic tensile machine. Constant crosshead speed of 0.03 mm/s was maintained
1 2
3
Tube axis
Fibre
θ = ± 55Á
H
So r
z
Fig. 1. Local orthotropic system Fig. 2. Geometry features of the numerical models
-50
0
50
100
150
30 30.5 31 31.5 32r (mm)
S11
S22
S33
S23
S23
-15
-10
-5
0
5
10
15
30 30.5 31 31.5 32r (mm)
S33
S22
Fig.3(a,b). Stress distributions for the pure internal pressure (left) and tensile loading (right)expressed in local co-ordinates.

Proceedings of ICCM–11, Gold Coast, Australia, 14th-18th July 1997
V - 543
during the pure tensile test. For pure internal pressure and combined loading, the loading rateis 0.16 MPas-1. Several specimens under the same loading conditions were tested. A biaxialtesting apparatus and a special gripping system designed by LMARC (Besançon, France), wasdeveloped to test the tubular specimens under various loading conditions [6]. This testingfacility is capable of applying up to 100 kN axial load in tension or compression, and 80 MPainternal pressure. The reason to choose displacement controlled loading pattern for puretensile tests is to obtain a well developed delamination process, which should produce samedamage mechanisms before the peak force as force controlled loading pattern.
The system recorded axial load and position from the servohydraulic machine; axial and hoopstrains from the extensometers; the pressure and piston displacement from the pressureintensifier. Real time data acquisition, storage and test pilotage were achieved by the programLabview. The specimens were also carefully observed during the progress of the test in orderto detect the eventual whitening, cracking and delamination which could be then correlatedwith the load-displacement and AE traces. Some tests were stopped at selected load levels sothat further micro-examination could be performed using optical or electron microscopy.
Mechanical Behaviour of Composite Tube Specimens
Pure tensile test results and mechanisms of damage initiation
A typical stress-strain curve up to failure is shown in Fig. 4. There is a pronounced peak at astrain of about 1.2%. The curves are essentially linear and elastic for strains lower than 0.5%.The applied fracture force is 30 kN (corresponding fracture stress 61 MPa) for Lot A tubesand 36 kN (corresponding fracture stress 73 MPa) for Lot B tubes. A significant difference inAE signal intensity was noticed for the three types of tubes. Compared to Lot A tubes, therewas a delay (thus moving to higher stress levels) in AE for Lot B and Lot C tubes. The firstbut very few signals were recorded at 6 MPa for Lot A tubes, at 10 MPa for Lot B tubes andat 24 MPa for Lot C tubes.
Fig. 4. Typical pure tensile stress-strain curve for a Lot B tube.
The first damage mechanism is the matrix cracking, the cracks initiating in the zones free offibres or in the outer resin skin. The cracks are of mode I nature and often perpendicular to the
Volume V: Textile Composites and Characterisation
V - 544
macroscopical loading direction. In increasing the stress level, the second damage mechanismis observed and is the transverse cracking. The average value of this stress is about 30 MPafor the tubes tested in this study. Observations of the specimens loaded to a lower stress levelshowed that the cracks were mainly located at the vicinity of the porosity, indicating thestrong effect of porosity on the damage initiation mechanism. Furthermore, these cracks aremore numerous in the internal ply where there is more porosity and which is highly stressed.They progress and appear in all plies with increasing stress level. In the case of Lot A and LotB tubes, localised deformation occurred around one main crack along the filament direction.Delamination then initiates and propagates from the main cracks at the interface betweenplies, which corresponds to the post-peak plateau on the stress-strain curve in Fig. 4. Thecracking was, however, more dispersed in Lot C tubes resulting in some kind of necking as inmetals. In this zone, there is no longer adhesion between the fibres and the matrix. The realgauge length of the specimen is much reduced.
Pure internal test results and mechanisms of damage initiation
The pure internal pressure tests were performed at a loading rate of 1.6 bar/s. Pressure wasgradually increased to the final values. Typical stress-strain (longitudinal and circumferential)curves for a Lot B tube specimen are shown in Fig. 5. The curves were essentially linear andelastic for strains lower than 1%. The tubes, being much stronger when loaded in thisdirection, were not tested up to failure in order to examine the damage initiation mechanisms.Lower density of AE was recorded for the three types of tubes in comparison to pure tensiletesting.
For Lot B tubes, a few matrix microcracks were observed in the external resin layer at sqq =210 MPa. These cracks did not cause the initiation of transverse cracking. For a higher stresslevel (sqq = 320 MPa), delamination was initiated either due to the intraply matrix cracking orto the interply porosity, being located between the two external plies. Whitening was observedon the outer skin of the tubes though few damage traces were found on a large examinationsurface. The whitening phenomenon has been investigated by several authors [5] and has beenattributed mainly to local interface debonding and matrix cracking. A thorough study is beingconducted in order to correlate the local stress state to this phenomenon. A significantdifference was noticed between these cracks and the transverse cracks under pure tensileloading. In the case of pure internal pressure, a damaged or microcracked band propagatesaround the fibres without attacking their interface.
Observation of a Lot A tube specimen loaded to sqq = 240 MPa revealed delamination,indicating the possible influence of numerous voids contained in this kind of tube.
Combined loading test results and mechanisms of damage initiation
Tests with various szz/sqq ratios were also performed at a loading rate of 1.6 bar/s regardinginternal pressure. The load was gradually increased to the final values. In general, as far as themechanical response was considered, the tubes appeared stronger than in pure internalpressure tests. The tubes were not tested up to failure in order to examine the damageinitiation mechanisms. The results are presented in two groups regarding the szz/sqq ratiovalue.
Tests with szz/sqq equal to 0.5: A typical stress-strain curve for a Lot A tube specimen is shownin Fig. 6. for szz/sqq equal to 0.5, i.e. internal pressure testing with an end effect. Very similar

Proceedings of ICCM–11, Gold Coast, Australia, 14th-18th July 1997
V - 545
damage initiation mechanisms to axial tensile tests were observed, meaning matrix crackingfirst (sqq = 75 MPa) followed by transverse cracking (sqq = 110 MPa). However, the differencebetween the loading conditions in question and pure internal pressure is that the matrixcracking is more effective in provoking transverse cracking initiation. Transverse crackingwas the main damage mechanism which initiated from pre-existing defects, matrix crackingor porosity. For lower stress levels, transverse cracking remained inside one ply. For higherstress levels, however, it crossed several plies. This could be due either to the change of crackdirection inside the interply resin layer when the former crosses it, or to just a few crackshaving joint traces on the observation plane. It should be noted that there seems to be acorrelation between the transverse cracking and the delamination in this kind of loading. Apossible process is the transversal cracking giving rise to the delamination at the interfacewhen it propagates through the interply resin layer. For a Lot B tube specimen, delaminationwas not observed at sqq = 365 MPa. Only transverse cracking was initiated at the intraplyporosity.
,
-0.03 -0.02 -0.01 0 0.01 0.02 0.03Circum ferent ial strain
0
50
100
150
200
250
300
Longi tudina l strain
rentia l stress
Fig. 5. Typical pure internal pressure stress-strain curves for a Lot B tube.
Tests with szz/sqq equal to 0.1, 0.2 and 0.3: The purpose of this series of tests was to determinethe critical ratio of shift of the main damage mechanism from transverse cracking todelamination. According to the microscopical observations, it seems that the shift occurred forszz/sqq between 0.2 and 0.3. No transverse cracking was observed for szz/sqq equal to 0.1 and0.2. No delamination was observed for szz/sqq equal to 0.3. A cautionary phenomenon is aheavily damaged band observed at the interface between the two external plies for a test ratioof szz/sqq equal to 0.1, in which some kind of crazing was produced probably by shear stresses.
Finally, Figure 7a summarises the behaviour of the tubes by relating the damage mechanismsto the applied stresses obtained by microscopical observation and experimental tests.

Volume V: Textile Composites and Characterisation
V - 546
Fig. 6. Typical stress-strain curve for a Lot A tube tested with szz/sqq = 0.5.
FAILURE PREDICTION OF A PLY BY MICROMECHANICAL MODELLING
Three local failure modes are investigated, which enable to study the competition betweendifferent damage mechanisms and to determine the corresponding critical macroscopic loads.The three failure criteria employed here are based on the experimental observations,corresponding to three damage mechanisms: (a) micro-crack initiation from the cavities(porosity), (b) crack initiation at the interface of matrix and fibre by interfacial shear stress,and (c) transverse ply crack initiated at the interface by interfacial normal stress. Using thesethree local damage criteria, it is possible to determine the corresponding macroscopic appliedloads. The method can be explained as following: under a given combined macroscopicloading, the stress fields in each ply can be determined; then both the stresses near the voids,and normal and shear stresses along the interface in each ply can be evaluated by means ofmicromechanical methods. Subsequently we compare these local stresses with correspondingcritical values and determine in this manner the strength of composite tube. The followinglocal values are chosen: σnc = 80 MPa, τc = 53.3 MPa: when the principle maximum stressnear a void reaches 80 MPa, a crack will be initiated at this void; when the interfacial shearstress reaches 53.3 MPa, a crack will be initiated or sliding will take place at the interface;when the interfacial normal stress reaches 80 MPa, a crack will be initiated at the interface bydebonding. The choice of 80 MPa for snc was made after a uniaxial tensile test on pure resinspecimens. The maximum value is considered as the fracture strength of the resin. There areno credible values for tc. Most probably, a ratio smaller than 2 should be used for snc/tc, avalue of 1.5 was used in this investigation.
Figure 7b shows the predicted results together with the experimental ones. It can be seen thatin an internal pressure dominated region the predicted results by micromechanical approachare again conservative. Explanation for such a difference is not evident, since from amesoscopic point of view, the predicted results have the same tendency (conservativeprediction for internal pressure dominated region). It should be mentioned that the

Proceedings of ICCM–11, Gold Coast, Australia, 14th-18th July 1997
V - 547
delamination observed in this study is always of interply nature. It is not controlled directly bythe stresses inside plies, but depends on the different deformation patterns inside two adjacentplies. The incompatible shear strains between two plies may be the origin of delamination.They change sign when crossing the interface between two plies. The thin resin layer betweenplies may be the preferred site for delamination initiation.
Fig. 7a. Stress envelope with damage mechanisms and failure modes for different szz/sqq
ratios
DISCUSSION
Comparison with Microscopical Observations
The general tendency predicted by the micromechanical modelling agrees well withmicromechanism observation. The threshold stresses increase with an increasing szz/sqq ratio.In the case of tensile loading, the first damage mechanism was matrix cracking, the cracksinitiating at the zones free of fibres or at the outer resin skin. The second damage mechanismobserved was transverse cracking, being mainly located at the vicinity of the porosity,indicating the strong effect of porosity on the damage initiation. In the case of internalpressure loading, besides a few matrix microcracks being observed in the external resin layer,for a higher stress level, delamination initiated either from the intraply matrix cracking orfrom the interply porosity. Whitening was also observed on the outer skin of the tubes thoughfew damage traces were found on a large examination surface.
According to the micromechanical modelling prediction, one should be able to observe, for atensile test, the cracks initiating at the porosity first for szz = 62 MPa. Some kind of interfacialfailure due to interfacial shear stresses should also be visible for a higher stress level. In thecase of internal pressure loading, interfacial sliding due to interfacial shear stresses wouldoccur for sqq = 120 MPa. The explanation of the absence of this phenomenon in microscopicalobservations on long tube specimens may reside in the constraint effect of symmetricfilament-wound tubes. The sliding along the continuous fibres is or not possible or withoutany noticeable traces. This sliding might be also partially reversible due to the viscous effect

Volume V: Textile Composites and Characterisation
V - 548
of the matrix or the elastic nature of it. A special study is under progress at the moment whichwill help to understand this phenomenon. It can be concluded that this interfacial slidingoccurred at a pre-polished free surface at about sqq = - 90 MPa in compression and sqq = 140MPa in hoop tensile tests. This observation indicates that the choice of tc = 53 MPa for thelocal interfacial fracture criteria is relatively correct.
On the contrary, for combined loading with szz/sqq > 1.9, another mechanism related to theinterface failure, is very detrimental on the composite tube behaviour: debonding byinterfacial normal stress. The threshold stress is quite high and increases with the szz/sqq ratios.The average effect results in very numerous microcracks (one crack for one fibre). Acontinuous path can be created easily by these cracks which leads to weeping. Stress transfercapacity of the fibres and the tube integrity can be/or not much deteriorated. Themacroscopical loading level should be kept below a certain value above which there is stillmargin before the local stress fields to reach this fracture criterion. A possible way to take intoaccount the effect of both of these two mechanisms is to reduce the corresponding modulusfor each of them, namely reducing Gl for interfacial shear stress damage and E3 for interfacialnormal stress damage.
Fig. 7b. Comparison between micromechanical modelling and experimental results (filled cycle)
Effect of the Choice of Local Criteria
In this study, values of σnc = 80 MPa, τc = 53.3 MPa were used as the local critical strengthsand the absence of coupling of tc and snc for the local fracture criteria. Physically, there wouldbe some interaction effect between these two components, as in most cases. However, theexperimental data is insufficient to qualify this. Differences in the state of stress and thegeometry of the problem will result in vastly different failure mechanisms. The poker-chipstrains to failure in the primary loading direction were 0.5-0.8%, so the uniaxial stress state incomposite matrices may therefore by itself be a sufficient explanation for low values oftransverse composite strains to failure. Furthermore an investigation of pressurised glass-fibre/polyester pipes provides an example of how transverse cracks form early in the

Proceedings of ICCM–11, Gold Coast, Australia, 14th-18th July 1997
V - 549
deformation process of a composite structure. Onset of weepage due to transverse cracksoccurred at transverse strains of about 0.2% whereas final failure occurred much later. On theother hand, it was recently proposed that with polymers, which have extended covalentlybonded structures, molecular disruption in shear is as difficult as it is in tension, and may wellbe activated by tension instead of shear. Subsequently the failure process in shear tests isalmost certainly tension rather than shear.
From a quantitative point of view, the micromechanical prediction gave higher thresholdstresses for first damage initiation (transverse cracking) than observations in principallytensile loading regions. Two explanations could be given, one is that the value of snc was notcorrectly chosen. The second may be that the stress state effect was not correctly representedby the micromechanical modelling - average theory. To improve this prediction, tests under asimilar stress state should be performed in order to determine the critical values for snc and tc.Under internal pressure loading, only delamination was observed as a main damage mode at astress level much higher than that for interfacial shear failure predicted by micromechanicalmodelling. The plies are subjected to 3D loading with a very large in-plane shear stress,meaning shear along the fibre axis. This situation does not correspond to any known tests inliterature.
Effect of the Number and Volume Fraction of Voids (Porosity)
Micromechanical modelling indicates that the average effect of an increase in the void volumefraction on the local stress field, proportionally increased, is small. A local mechanical effectof the porosity is the increase in the stress concentration at the interface. A complementarycoefficient of stress concentration Ktc should be introduced to take into account this effect,because the micromechanical modelling gives only an average effect. By 2D Finite Elementcalculation, it was found that for fv = 0.05 and a cubical distribution of fibres and porosity, Ktc
equals 1.2. This coefficient, larger than one, will still reduce the strength of the interface. Thetechnical importance of this effect is that a void can affect the interface of the fibres in itsenvironment, showing again the detrimental effect in increasing the number of voids.
In practice, a detrimental effect of porosity is to provide more nucleation sites for microcracksand then to reduce the length of the propagation path before their coalescence. To get aquantitative description, the concept of the representative defect is used. The value of fv =0.05 (volume fraction of porosity) means having one void in the ply thickness direction withina circumferential distance of about 625 mm in the case of ideal distribution. The propagationdistance is reduced to 210 mm (half thickness). If fv increases to 0.1, there may be two voidsin the thickness direction (in the worst case), the propagation distance becoming 105 mm.From this point of view, a small size porosity of is more detrimental than a larger size one,for the same volume fraction. The present authors suggest a limit of fv below 5% in order toavoid any possible detrimental effect.
In this study an aspect ratio of 15 was used for the porosity in the micromechanicalmodelling. The choice of this value is a result from an average over the microstructuralanalysis information. According to the microstructural analysis in [1], some of the voids havean aspect ratio larger than 15. The porosity is less stressed with a smaller aspect ratio. Thisenhancing effect, however, is stabilised for an aspect ratio larger than 14.

Volume V: Textile Composites and Characterisation
V - 550
CONCLUSIONS
A micromechanical model based on the Mori-Tanaka Theory is used which enables thedetermination of the local stress fields at the interface and at the porosity in a critically loadedply of the studied composite tube. The general tendency of the threshold stresses predicted bythe micromechanical modelling agrees well with the micromechanism observation. Themodelling also provided useful information in order to correlate the microscale damage to themacroscopical behaviour of the tubes under combined loading. The porosity volume fractionshould be kept below 5% to avoid any detrimental effect. There still remains some work to bedone in order to improve the local criteria and the choice of critical stress values used in them.
ACKNOWLEDGEMENTS
The present research is supported by EDF-DER (Electricité de France). The authors aregrateful to Drs. F. Nagot, J. Le Bras and M. Lasne (EDF-MTC) and Professor D. François fortheir discussions. The work was carried out in the laboratory MSS/MAT of Ecole CentraleParis (CNRS URA 850). We would like to acknowledge the assistance rendered by ourcolleagues.
REFERENCES
1. Bai, J.B., Seeleuthner, Ph. & Bompard, Ph., Mechanical behaviour of ± 55° filament-wound glass-fibre/epoxy-resin tubes: Part I - Microstructure analyses and mechanicalbehaviour and damage mechanisms of composite tubes under pure tensile, pure internalpressure and combined loading, Composite Science and Technology, Vol. 56, 1996 (inpress).
2. Karayaka, M., Srinivasan, S., Miyase, A. & Wang, S.S., Leakage damage and failure ofglass-fibre reinforced composite tubular vessels under combined internal pressure andaxial loading, Proceedings of 10th Int. Conf. on Composite Materials (ICCM-10), Vol.I, 1995, pp. I-747 - 54.
3. Anderssen, R., Gradin, P.A., Gustafson, C-G. & Nygard, P., Prediction of crackdevelopment and stiffness degradation in angle-ply filament wound pipes, ibid., pp. I-407 - 14.
4. Frost, S.R., Predicting the long term fatigue behaviour of filament wound glassfibre/epoxy matrix pipes, ibid., pp. I-649 - 56.
5. Bader, M.G., Bailey, J.E., Curtis, P.T. & Parvizi, A., The mechanisms of initiation anddevelopment of damage in multi-axial fibre-reinforced plastics laminates, Proc. of 3rdInt. Conf. on materials (ICM-3), Cambridge, England, August 1979, pp. 227-39.
6. Pérreux, D., Maire, J.F., Siqueria, C., Varchon, D. & Oytana, C., Multiaxial testing ofcomposite materials, Matériaux et Techniques, vol. 6-7, 1993, pp. 37-40.

Proceedings of ICCM–11, Gold Coast, Australia, 14th-18th July 1997
V - 551
7. Mok-Yeo, B. L. & Bader, M.G., Sub-critical damage in glass-fibre/epoxy-resinlaminates: use of laser diffraction and CLSM technique, Proc. of 10th Int. Conf. onComposite materials, Whistler, August 1995, Vol. V, pp. V-357-64.
8. Carroll, M., Ellyin, F., Kujawski, D. & Chiu, A.S., The rate-dependent behaviour of ±55° filament-wound glass-fibre/epoxy tubes under biaxial loading, Composite Scienceand Technology, Vol. 55, 1995, pp. 391-403.
9. Mok-Yeo, B. L. & Bader, M.G., Influence of winding angle on the strength anddeformation of filament-wound composite tubes subjected to uniaxial and biaxial loads,ibid., Vol. 46, 1993, pp. 363-78.
10. Bai, J.B., Hu, G.K. & Bompard, Ph., Mechanical behaviour of ± 55° filament-woundglass-fibre/epoxy-resin tubes: Part II - Micromechanical modelling of the damageinitiation - competition of the different mechanisms, Vol. 56, 1996 (in press).
11. Demyanushko, K. & Bai, J.B., Local and global stress state analyses of a ± 55° filamentwinding tube with damage effect, submitted to Composite Structures, 1996.

Volume V: Textile Composites and Characterisation
V - 552
EFFECT OF STACKING SEQUENCE ON STRENGTHAND FAILURE PROCESS IN QUASI-ISOTROPIC
CFRP LAMINATES WITH TOUGHENEDINTERLAMINAR LAYERS
Shinji Ogihara1, Nobuo Takeda2, Satoshi Kobayashi1 and Akira Kobayashi1
1Department of Mechanical Engineering, Science University of Tokyo, 2641 Yamasaki, Noda, Chiba 278, Japan
2Center for Collaborative Research (CCR), The University of Tokyo,4-6-1 Komaba, Meguro-ku, Tokyo 153, Japan
SUMMARY: Effects of stacking sequences on the strength and microscopic failure processesin quasi-isotropic CFRP laminates under static tensile loading are investigated. Observationof microscopic failure process is conducted by using an optical microscope and a X-rayradiography. The material system used is a CFRP with a toughened interlaminar layer atevery ply interface. The stacking sequences are (0/45/90/-45)s and (45/0/-45/90)s. By theedge observation of the plain specimens, transverse crack density is measured as a function oflaminate stress. By the X-ray radiography observation, delamination onset and growth isdetected. To discuss the transverse cracking, a modeling based on damage mechanicsanalysis is conducted. To explain delamination behavior, a simple energy release rateanalysis is conducted.
KEYWORDS: delamination, energy release rate, interlaminar layer, microscopic failureprocess, quasi-isotropic laminates, strength, transverse crack, X-ray radiography
INTRODUCTION
Carbon fiber reinforced plastics (CFRP) are used in the form of multidirectional laminates.Failure process in CFRP laminates involves unique damages, such as, transverse cracks anddelamination. It is very important to understand the behavior of these microscopic damages.
O'Brien [1] conducted static and fatigue tensile tests on quasi-isotropic CFRP laminates.Delamination onset and growth were observed by X-ray radiography. He derived the energyrelease rate associated with free-edge delamination by using the classical lamination theory.
Masters and Reifsnider [2] observed multiplication of transverse cracks in quasi-isotropicCFRP laminates under tensile loading by using the replica technique. It was found that thetransverse crack density saturates before the final fracture of the laminates. They explainedthe saturated crack density by using the shear-lag analysis.

Proceedings of ICCM–11, Gold Coast, Australia, 14th-18th July 1997
V - 553
As listed above, the experimental observations of damage progress in quasi-isotropic CFRPlaminates have been conducted, but the modeling of damage progress is not well established.
On the other hand, it is pointed out that CFRP has low interlaminar fracture toughness. Toovercome this problem, some methods to toughen laminates are suggested. One of them is toutilize good processability of thermoset resin and high fracture toughness of thermoplasticresin. This hybridization of thermoset and thermoplastic resins is achieved by dispersingparticulate thermoplastic resin into thermoset base resin. One example of these materialsystems is T800H/3900-2 which is used in the present study [3, 4].
The effectiveness of employment of the interlaminar layers to enhance the interlaminarfracture toughness is proved [3, 4], but the mechanical behavior of their laminates is not wellunderstood including microscopic failure process. In the present study, effects of stackingsequences on the strength and microscopic failure processes in quasi-isotropic CFRPlaminates with toughened interlaminar layers under tensile loading are investigated.
EXPERIMENTAL PROCEDURE
Materials
A material system used is interlaminar toughened carbon/epoxy T800H/3900-2 laminates inwhich polyamide particle-dispersed epoxy matrix layers are placed between each layer. TheT800H/3900-2 prepreg system has tough and fine polyamide particles on its surfaces, whichresults in formation of the interlaminar-toughened layers at every ply interface in thelaminates. The thickness of the interlaminar-toughened layers is about 30µm. The laminateconfigurations are quasi-isotropic (0/45/90/-45)s and (45/0/-45/90)s. The fiber volumefraction is about 55 %. The specimen size is 150 mm long and 25 mm wide. GFRP tabs areglued on the specimens which results in specimen gage length of 90 mm.
Damage Observation
Quasi-static tensile tests are performed at room temperature. The crosshead speed is0.5mm/min. By the observation of polished specimen edge, damage progress is measured asa function of laminate strain. During the tests, the testing machine is periodically stopped,and the specimen edge is observed by an optical microscope. Observed area is 50 mm long atthe center of the specimen. The number of transverse cracks in each ply is counted to obtainthe transverse crack density, which is defined as the number of transverse cracks per unitlength.
The specimens are also observed by a X-ray radiography. By the X-ray radiography,delamination onset and growth are detected. Iodozinc (ZnI), a dye penetrant opaque to X-rays, is applied along the specimen edge. Specimens are exposed to X-rays for 150 s at 20 kVand 2 mA. A X-ray point-source unit positioned 570 mm away from the specimen is used.
Volume V: Textile Composites and Characterisation
V - 554
RESULTS
Table 1 shows the mechanical properties of T800H/3900-2 quasi-isotropic laminates. Figure1 shows typical stress-strain curves and damage progress in the laminates. Large effect ofstacking sequence is seen in tensile strength, that is, tensile strength of (0/45/90/-45)slaminate is higher than that of (45/0/-45/90)s laminate. It should be noticed that Young'smodulus and failure strain are very similar. In stress-strain curves of (45/0/-45/90)s laminate,more knee points or discontinuous points are observed than in those of (0/45/90/-45)slaminates, which may be due to occurrences of severe damages.
Figure 2 shows edge damage state observed by an optical microscope in (a) (0/45/90/-45)s at
σ = 785MPa where σ is laminate stress, (b) (45/0/-45/90)s at σ =550MPa and (c) (45/0/-45/90)s at σ = 733MPa. Figure 3 shows transverse crack density as a function of laminatestrain in (a) (0/45/90/-45)s and (b) (45/0/-45/90)s laminates.
In (0/45/90/-45)s laminates, the first microscopic damage observed is a transverse crack in90° ply. At higher strain levels, transverse cracks in 45° and -45° plies are observed. As thelaminate strain increases, the number of transverse cracks in each ply increases. Thetransverse cracks in 45° ply run through the thickness of two adjacent -45° plies at the centerof the laminate. The transverse crack density in 90° ply is much higher than those in 45° and-45° plies. The transverse crack density in -45° ply is slightly higher than that in 45° ply. Inthis laminate configuration, delamination is not observed in the failure process.
In (45/0/-45/90)s laminates, the transverse cracks in 90° ply and free-edge delamination at -45/90 interface are observed at similar strain level. At higher strain levels, transverse cracksin -45° ply are observed, but not in 45° ply. In 45° ply, surface damage as shown in Fig.2 (b)is observed. Delamination in 90° ply is also observed.
Figure 4 shows X-radiographs of T800H/3900-2 (45/0/-45/90)s ((a) σ=452MPa, (b)
σ=517MPa, (c) σ=581MPa, (d) σ=646MPa, (e) σ=711MPa). Delamination growth in thelaminate width direction and transverse crack multiplication is clearly observed.
DISCUSSION
Transverse Cracking
To explain the difference in transverse cracking due to the difference in stacking sequence,micromechanical modeling is conducted. In the present study, the energy release rateassociated transverse crack formation is considered.
Gudmundson and Zang [5] developed an analytical model for the prediction of thethermoelastic properties of composite laminates containing transverse cracks. The in-planecompliance matrix of laminates with transverse cracks , SII(c),can be expressed using in-plane compliance matrix without transverse cracks, SII , as
Proceedings of ICCM–11, Gold Coast, Australia, 14th-18th July 1997
V - 555
SII(c) = SII( )−1 − νk
k=1
N∑ ρk Ak( )T ββ ki Ai
i=1
N∑
−1
(1)
where v: volume fraction of ply k, ρ: normalized crack density in ply k, A: matrix defined bycompliance matrix of each ply and unit normal vector on the crack surface, ββ: matrixassociated with average crack opening displacement. In the present study, the energy releaserate associated with transverse crack formation is derived.
Assuming that transverse cracks occur at a constant load and that they occur at the midwaybetween the existing transverse cracks, the energy release rate when the transverse crackdensity becomes 2ρ from ρ, Gt(2ρ) at laminate stress σ is expressed as
G 2ρ( ) =σ2
2
1
E 2ρ( )−
1
E ρ( )
h
ρt (2)
where E(2ρ) and E(ρ): Young's modulus of the laminate in which the transverse crack densityis 2ρ and ρ, respectively, h: the laminate thickness and t: the cracking ply thickness. Young'smodulus of the laminate is obtained by using eq.(1) as a function of the transverse crackdensity. In the present study, normalized energy release rate associated with transversecracking, Gtn, when ρ→0 defined as
Gtn =ρ→0lim
G 2ρ( )σ2 (3)
is calculated. Material properties used in the analysis are listed in Table 2.
Table 3 shows the normalized energy release rate associated with transverse cracking in eachply. In (0/45/90/-45)s laminate, the energy release rate in -45° ply is higher than in 45° ply,which corresponds to the results that transverse crack density is higher in -45° ply than in 45°ply. In (45/0/-45/90)s laminate, the energy release rate in 45° ply is very small which isconsistent with the experimental result that transverse crack is not observed. In 45° ply, thesurface damage is observed instead of transverse cracks as shown in Fig.2 (b). In bothlaminates, the energy release rate in 90° ply is relatively small though many transverse cracksare observed. This implies that the critical energy release rate in 90° ply is smaller than thatin 45° (or -45°) ply. The analysis will be a basis for a quantitative estimation of transversecrack density.
Delamination
O'Brien [1] derived an equation for the energy release rate associated with straight-edgedelamination growth, Gd, as
Gd =ε2h2m
ELAM − E*( ) (4)
where ε: the nominal strain, m: the number of delaminations formed and ELAM and E*: thelaminate modulus before and after delamination. In the present study, normalized energyrelease rate associated with delamination growth, Gdn, defined as

Volume V: Textile Composites and Characterisation
V - 556
Gdn =Gd
ε 2h (5)
is calculated. Material properties used in the analysis are lised in Table 2. Table 4 showsthe normalized energy release rate associated with delamination growth at each ply interface.It is found that the energy release rate at -45/90 interface at which delamination was observedis much higher than that at other interfaces. This implies that this analysis is useful to predictdelamination location.
CONCLUSION
Tensile tests are conducted on quasi-isotropic CFRP laminates with toughened interlaminarlayers. Effects of stacking sequences on the strength and microscopic failure processes areinvestigated. Observation of microscopic failure process is conducted by using an opticalmicroscope and a X-ray radiography. To explain the difference in microscopic failure processdue to the difference in stacking sequence, micromechanical modeling of damage onset andgrowth is conducted. Micromechanical modeling based on the precise observation ofmicroscopic failure process will be a basis for damage tolerance design.
REFERENCE
1. O'Brien, T.K., "Characterization of Delamination Onset and Growth in a CompositeLaminates", ASTM STP 775, 1982, pp. 140-167
2. Masters, J.E. and Reifsnider, K.L., "An Investigation of Cumulative DamageDevelopment in Quasi-Isotropic Graphite/Epoxy Laminates", ASTM STP 775, 1982,pp. 40-61
3. Odagiri, N., Murai, T. and Tobukuro, K., "Toughness Improved High PerformanceTORAYCA Prepreg T800H/3900 Series", Proceedings of 33rd International SAMPESymposium, 1988, pp. 272-283
4. Odagiri, N., Kishi, H. and Nakane, T., T800H/3900-2 Toughened Epoxy PrepregSystem : Toughening Concept and Mechanism", Proceedings of American Society forComposites, 6th Technical Conference, 1991, pp. 46-52
5. Gudmundson, P. and Zang, W., "An Analytic Model for Thermoelastic Properties ofComposite Laminates Containing Transverse Matrix Cracks", Int. J. Solids Structures,30, 1993, pp. 3211-3231
Table 1. Mechanical properties of T800H/3900-2 quasi-isotropic laminates.
Laminates Young'sModulus (GPa)
TensileStrength (MPa)
Failure Strain(%)
(0/45/90/-45)s 52.8 799 1.48
(45/0/-45/90)s 53.4 744 1.49
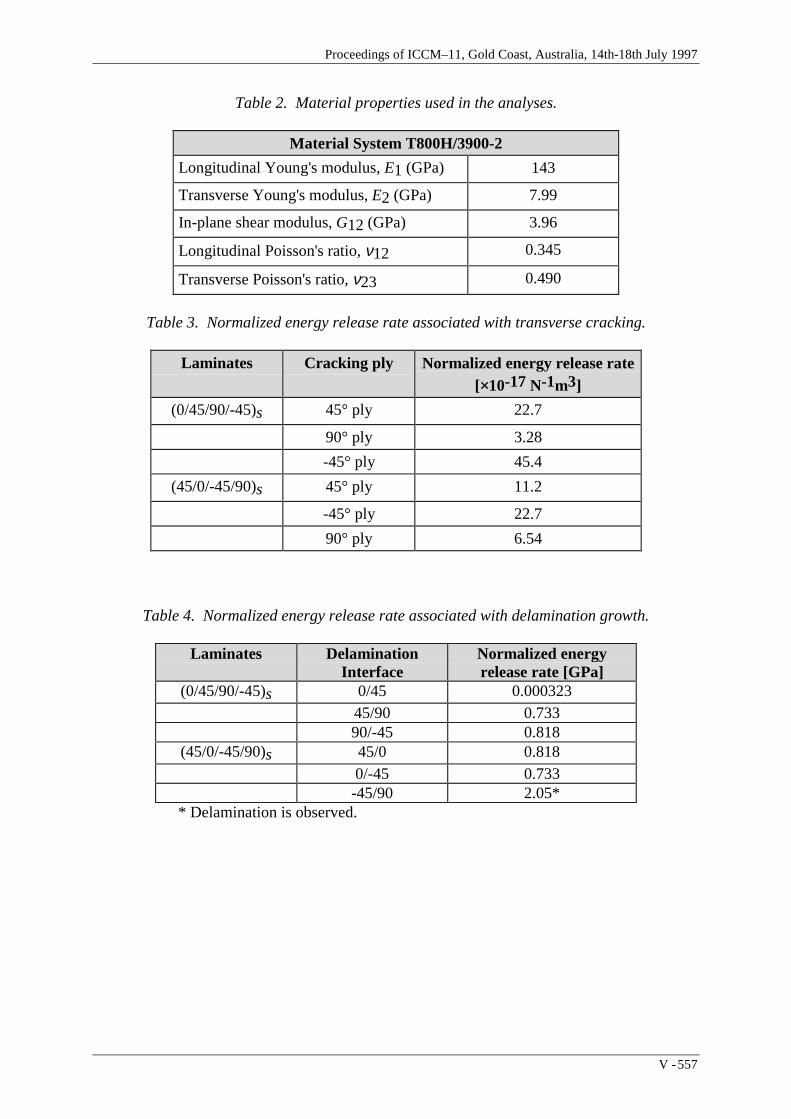
Proceedings of ICCM–11, Gold Coast, Australia, 14th-18th July 1997
V - 557
Table 2. Material properties used in the analyses.
Material System T800H/3900-2
Longitudinal Young's modulus, E1 (GPa) 143
Transverse Young's modulus, E2 (GPa) 7.99
In-plane shear modulus, G12 (GPa) 3.96
Longitudinal Poisson's ratio, ν12 0.345
Transverse Poisson's ratio, ν23 0.490
Table 3. Normalized energy release rate associated with transverse cracking.
Laminates Cracking ply Normalized energy release rate[×10-17 N-1m3]
(0/45/90/-45)s 45° ply 22.7
90° ply 3.28
-45° ply 45.4
(45/0/-45/90)s 45° ply 11.2
-45° ply 22.7
90° ply 6.54
Table 4. Normalized energy release rate associated with delamination growth.
Laminates DelaminationInterface
Normalized energyrelease rate [GPa]
(0/45/90/-45)s 0/45 0.00032345/90 0.73390/-45 0.818
(45/0/-45/90)s 45/0 0.8180/-45 0.733-45/90 2.05*
* Delamination is observed.

Volume V: Textile Composites and Characterisation
V - 558
Figure 1: Typical stress-strain curves and damage progress in T800H/3900-2 quasi-isotropiclaminates. (a) (0/45/90/-45)s (b) (45/0/-45/90)s
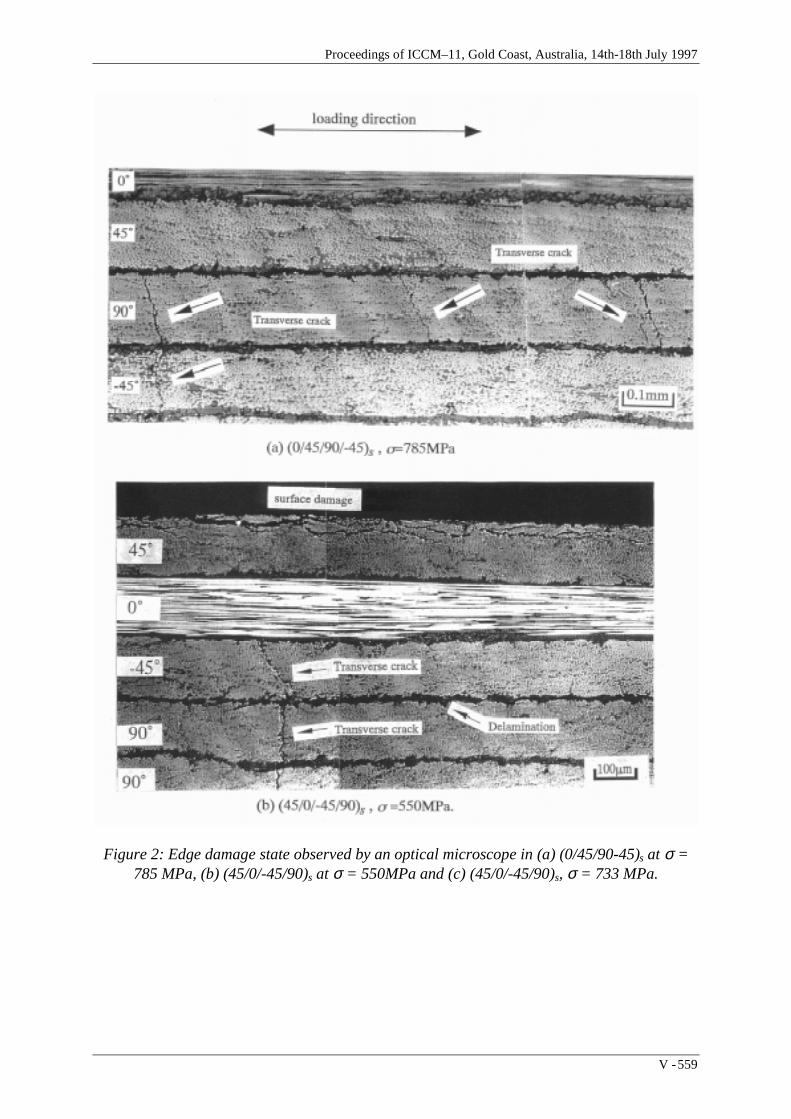
Proceedings of ICCM–11, Gold Coast, Australia, 14th-18th July 1997
V - 559
Figure 2: Edge damage state observed by an optical microscope in (a) (0/45/90-45)s at σ =785 MPa, (b) (45/0/-45/90)s at σ = 550MPa and (c) (45/0/-45/90)s, σ = 733 MPa.

Volume V: Textile Composites and Characterisation
V - 560
Figure 2: (Continued) Edge damage state observed by an optical microscope in (a) (0/45/90-45)s at σ = 785 MPa, (b) (45/0/-45/90)s at σ = 550MPa and (c) (45/0/-45/90)s, σ = 733 MPa.
Figure 3: Transverse crack density as a function of laminate strain in T800H/3900-2 quasi-isotropic laminates. (a) (0/45/90-45)s, (b) (45/0/-45/90)s

Proceedings of ICCM–11, Gold Coast, Australia, 14th-18th July 1997
V - 561
Figure 4: X-radiographs of T800H/3900-2 (45/0/-45/90)s, (a) σ = 452 MPa (b) σ = 517MPa, (c) σ = 581 MPA, (d) σ = 646 MPa (e) σ = 711Mpa.

Volume V: Textile Composites and Characterisation
V - 562
EXPERIMENTAL MICRO-MECHANICALCHARACTERIZATION OF INTERLAMINAR SHEARDEFORMATION IN INTERLAMINAR-TOUGHENED
CFRP LAMINATES
Nobuo Takeda1 and Shinji Ogihara
2
1Composites Science and Mechanics Laboratory, Center for Collaborative Research (CCR),The University of Tokyo, 4-6-1 Komaba, Meguro-ku, Tokyo 153, Japan
2Dept. Mech. Eng., Science University of Tokyo, 2641 Yamasaki, Noda, Chiba 278, Japan
SUMMARY: Tensile tests of CFRP cross-ply laminates with interlaminar resin layers werecarried out in a SEM (scanning electron microscope), and microscopic interlaminardeformation and damage near the transverse crack tip was visualized by micro-lines or micro-grids on the specimen edge surface. The local deformation around the transverse crack tip wasobserved at 20°C, 80°C, 120°C, and 160°C to evaluate the effect of thermal residual stress onthe microscopic deformation and damage in the interlaminar region near transverse crack tips.Temperature dependence of interlaminar shear deformation in the resin-rich interlaminarregion was clearly demonstrated microscopically. Temperature dependence of the axial COD(crack opening displacement) was also measured. The displacement field of the specimenedge surface obtained from these experimental results were compared with the twodimensional approximate elastic analysis.
KEYWORDS: crack opening displacement, cross-ply laminate, interlaminar sheardeformation, micro-line/grid methods, temperature effect, transverse crack, thermal residualstress, Young's modulus reduction
INTRODUCTION
In many applications of fiber-reinforced plastics, they are mainly used in the form ofmultidirectional laminates. Among these composites, cross-ply laminates have beenextensively investigated [1-7] through both theoretical and experimental studies because thisis a basic laminate configuration. The failure process of cross-ply laminates is known toinvlove an accumulation of transverse cracks and delamination.
Most previous studies of the failure process of cross-ply laminates have been focused on theexperimental measurement of transverse crack density as a function of applied load or thetheoretical prediction of the onset of transverse cracking and its multiplication. Inconjunction with the theoretical prediction of mechanical behavior and damage progress ofcracked laminates, micromechanical stress analyses of damaged cross-ply laminates havebeen conducted.
Takeda and Ogihara [2, 3] conducted in-situ observation of microscopic failure process inCFRP cross-ply laminates at R.T. and at 80°C. Progressive damage parameters, the

Proceedings of ICCM–11, Gold Coast, Australia, 14th-18th July 1997
V - 563
transverse crack density and delamination ratio, were presented. They pointed out that thethermal residual stress had significant effect on the failure process and that quantitativeestimation of thermal residual stress was important.
Hashin [4] conducted variational stress analysis for cracked cross-ply laminates under tensionand shear, and predicted stiffness reduction. In the analysis, an admissible stress state wasassumed and the principle of minimum complementary energy was applied. Nairn [5]extended Hashin's analysis to consider the thermal residual stresses and derived the energyrelease rate associated with transverse crack formation. The energy release rate was used topredict transverse crack density as a function of laminate stress.
Lee et al. [6] proposed a mathematical model for predicting the stiffness reduction of crackedcross-ply laminates. In their analysis, the principle of minimum potential energy was utilizedwith assumed displacement fields. McCartney [7] analyzed stress transfer between 0° and 90°plies in cracked cross-ply laminates. The solutions were determined to satisfy the stress-strain-temperature relations either exactly or in an average sense.
In recent years, interleaved laminates have been developed in which resin rich layers areplaced in interlaminar regions to enhance the interlaminar fracture toughness of CFRPlaminates and to restrict delamination onset. In this paper, micro-lines or micro-grids wereprinted on edge surface of interleaved CFRP cross-ply laminate specimens to measure thelocal displacement fields near the transverse crack. Observations are carried out in a scanningelectron microscope (SEM) at different temperatures to evaluate the effect of thermal residualstress on the local deformation. Quantitative measurement of microscopic deformation wasconducted and the experimental results were compared with the predictions based on twodimensional approximate elastic analysis. Loading-unloading testes were also conducted toobtain the Young's modulus reduction as a function of the transverse crack density. Areasonable agreement between the experimental results and analytical predictions wereobtained.
EXPERIMENT
Materials
Two material systems were used. One was interleaved CFRP, T800H/3631-FM300, withepoxy resin (FM300) layers about 100µm thick between 0° and 90° plies. Another wastoughness-improved CFRP, T800H/3900-2, with selectively toughened interlaminar layersabout 30µm thick at all the ply interfaces. The interlaminar layers have tough and finethermoplastic resin particles dispersed in the base epoxy resin.
T800H is a high strength carbon fiber. The 3631 is a modified epoxy system with improvedtoughness compared with a conventional TGDDM/DDS epoxy system. The averagethickness of each ply was 0.135mm for T800H/3631-FM300 and 0.190mm for T800H/3900-2. The fiber volume fraction was about 45% for T800H/3631-FM300 and about 55% forT800H/3900-2. The low fiber volume fraction for T800H/3631-FM300 is due to the insert ofthe FM300 resin film. The laminate configuration was cross-ply (0/904/0).

Volume V: Textile Composites and Characterisation
V - 564
Preparation of Micro-lines and Micro-grids
The micro-lines or micro-grids were made using the photo-lithography technique on specimenedge surfaces. First, the surface of the specimen was polished, then coated by the photo-resist, or photo-chemical reactive resin. The specimen was heated to cure the resist, and thesurface was exposed to the light through the photo-mask, or the glass plate with micro-lines orgrids. Then the exposed part of the resist was removed in the developer, and vacuum-evaporated metal was deposited on the surface. Finally, the remaining resist was removed inthe solvent to prepare the micro-lines or grids on the specimen surface.
Measurement of Microscopic Deformation and Young's Modulus Reduction
Tensile tests of CFRP symmetric cross-ply laminates were carried out in a SEM (scanningelectron microscope) with a servo-hydraulic loading machine and a specimen heating unit.The specimen was loaded at 20°C until the transverse crack intervals became uniform, and theimages of local area near the crack tip and a whole view of the crack were photographed.Then the temperature was raised to 80°C and the crack was photographed again. Thisprocedure was repeated at 120°C and 160°C. The COD of the transverse cracks and theinterlaminar shear strain, γxy (=0v/0x+0u/0y) near the transverse crack tip were measured fromthese photos, where u and v are displacements in x and y directions, respectively (Fig.1).Since the 0u/0y component is considered small, the shear strain was replaced by 0v/0x in thefollowing. Both the average shear strain in interleaf and the shear strain at 90°/interleafinterface were measured.
Loading-unloading tests were also conducted to obtain Young's modulus reduction as afunction of the transverse crack density. The loading-unloading procedure cycles wererepeated several times with continuous recording of the stress-strain curves. The laminateconfigurations used in the loading-unloading tests were cross-ply (0/90m/0) where m = 4, 8and 12 for both material systems.
ANALYSIS
In the present study, stress and displacement fields in an interleaved CFRP cross-plylaminates with transverse cracks are analyzed [8]. The analysis is based on the twodimensional model developed by McCartney [7] which assumes that generalized plane strainconditions prevail. Account is taken of thermal residual stresses arising from a mismatch inthermal expansion coefficients of 0°, 90° plies and the interleaf layer.
Consider a cross-ply laminate subjected to mechanical and thermal loading as shown in Fig.1in which interleaf layers are of thickness t. In the present study, two cases are considered; (a)the transverse crack tip stops at 90°/interleaf interface, and (b) transverse crack penetrates intothe interleaf and stops at 0°/interleaf interface. The displacement in y-direction in interleaf, vi,and that in 90° ply, vm, are expressed as

Proceedings of ICCM–11, Gold Coast, Australia, 14th-18th July 1997
V - 565
vi =1
µ i −ν ' T
m
E' Tm
b x− a( )C' y( )− C' ' ' y( ) b
E' i −
1
6x3 − a3( )+
1
2a2 x − a( )
+ a + t +b
2
1
2x2 − a2( )− a x− a( )
−
ab
6E' Tm a − 3 h + t( ) x − a( )
+ A2 y( )
(1)
vm =b
2a
1
µTm −
ν 'Tm
E'Tm
x2 − a2( )C' y( )
+ b
6aE' Tm C' ' ' y( ) 1
4x
4 − a4( )− 3
2a h+ t( ) x
2 − a2( )
+ A2 y( ) (2)
where a and b are thicknesses of 90° and 0° plies, respectively, C(y) is a function found foreach case, and A2(y) is an arbitrary function arising from integration. E, µ, and ν areconstants determined from the mechanical properties of the plies and the interleaf material.The shear strain and crack opening displacement are compared with experimental results.
By using the displacement fields obtained above, Young's modulus reduction as a function ofthe transverse crack density can be derived for each case [8]. The experimental results werecompared with the analytical predictions.
RESULTS AND DISCUSSION
Figure 2 shows a transverse crack in a T800H/3631-FM300 cross-ply laminate (σ=216MPa,20°C, where σ is laminate stress). By printing micro-lines, we can clearly observe sheardeformation in FM300 layer and damage (fiber/matrix interfacial debonding) near transversecrack tip. By inserting the FM300 layer, delamination from the tips of the transverse crackswere not observed which is due to the enhancement of interlaminar fracture toughness. Thetransverse crack tip propagates into the FM300 layer at some depth and crack tip blunting canbe observed.
Figure 3 shows the temperature dependence of the shear strain for T800H/3631-FM300 as afunction of distance from the crack tip. The shear strain at 160°C is much larger than that atother temperatures, which is considered due to the drastic reduction in the shear modulus ofFM300 at 160°C. The average shear strain in the interleaf layer is larger than that at90°/interleaf interface. In Fig.3, the analytical predictions are also shown for Case (b),because it seems more realistic than Case (a). The thermo-mechanical properties used in theanalysis are shown in Table 1. The most values in Table 1 are taken from Ref.(9).
Figure 4 shows the temperature dependence of COD as a function of the position in thethickness direction. The experimental results shows that temperature dependence of COD issmall. This is due to the combined effect of the decrease in the thermal residual stress and thedecrease in shear modulus of the interleaf and 90° ply at higher temperature. In Fig.4, theanalytical predictions are also shown for both Cases (a) and (b). Cases (a) and (b) areconsidered lower and upper bounds for COD. For more quantitative estimation of COD, amodel in which a transverse crack penetrates into the interleaf at arbitrary depth is necessary.

Volume V: Textile Composites and Characterisation
V - 566
Figure 5 shows a transverse crack in a T800H/3900-2 cross-ply laminate (σ = 160MPa, (a)20°C, (b) 160°C). As the temperature rises, the COD in the interlaminar layer increases,while that at the center of the 90° layer changes little.
Figure 6 shows the local highly-deformed area near a transverse crack tip in a T800H/3900-2cross-ply laminate. It is observed that at 160°C the shear strain in the interlaminar layerbecomes rather large. The shear strain in 90° ply, on the contrary, slightly decreases.
Figure 7 shows the temperature dependence of the shear strain for T800H/3900-2 as afunction of distance from the crack tip. Larger shear strain is observed in the interlaminarlayer at higher temperature, which is considered due to the softening of the interlaminar layer.This corresponds well with the experimental results where the COD in the interlaminar layermagnifies at higher temperature. In Fig.7, the analytical predictions are also shown for Case(b). A reasonable agreement is obtained between the experimental and analytical resultsexcept for 160°C. With more proper selection of mechanical properties of interleaf materialas a function of temperature, the deformation will be predicted more precisely.
Figure 8 shows the temperature dependence of COD as a function of the position in thethickness direction for T800H/3900-2. Similar to T800H/3631-FM300, temperaturedependence of COD is small. This is considered to be due to the reduction in the thermalresidual stress and the decrease in the load transmission capability of the softened interlaminarlayer. In Fig.8, the analytical predictions are also shown for both Cases (a) and (b). Thedifference in lower and upper bounds for COD is smaller than for T800H/3631-FM300,because the interleaf thickness is small. Case (b) seems to be a good approximation to thismaterial system.
Figures 9 and 10 show the comparison of experimental results and analytical predictions forthe Young's modulus reduction at room temperature in T800H/3631-FM300 andT800H/3900-2 cross-ply laminates, respectively. The analytical results are shown only forCase (a) because the difference between the cases are very small. A reasonable agreement isobtained between the experimental and analytical results. Similar results were obtained athigher temperatures.
CONCLUSIONS
Tensile tests of interleaved CFRP cross-ply laminates were carried out in a SEM, andmicroscopic interlaminar deformation and damage around the transverse crack was observedat different temperatures by means of micro-lines or grids printed on the specimen edgesurface. Temperature dependence of the experimentally-obtained interlaminar shear strainand crack opening displacement were compared with the two-dimensional approximate elasticanalysis.
Loading-unloading testes were also conducted to obtain the Young's modulus reduction as afunction of the transverse crack density. A reasonable agreement between the experimentaland analytical results were obtained.

Proceedings of ICCM–11, Gold Coast, Australia, 14th-18th July 1997
V - 567
REFERENCES
1. Bailey, J.E., Curtis, P.T., and Parvizi, A., "On the Transverse Cracking and LongitudinalSplitting Behavior of Glass and Carbon Fiber Reinforced Epoxy Cross Ply Laminates andthe Effect of Poisson and Thermally Generated Strain", Proc. R. Soc. Lond., A., 366,1979, PP. 599-623.
2. Takeda, N. and Ogihara, S., "In-Situ Observation and Probabilistic Prediction ofMicroscopic Failure Processes in CFRP Cross-Ply Laminates", Comp. Sci. Tech., 52,1994, pp. 183-195.
3. Takeda, N. and Ogihara, S., "Initiation and Growth of Delamination from the Tips ofTransverse Cracks in CFRP Cross-Ply Laminates", Comp. Sci. Tech., 52, 1994, pp. 309-318.
4. Hashin, Z., "Analysis of Cracked Laminates: A Variational Approach", Mechanics ofMaterials, 4, 1985, pp. 121-136.
5. Nairn, J.A., "The Strain Energy Release Rate of Composite Microcracking: A VariationalApproach", J. Comp. Mat., 23, 1989, pp. 1106-1129.
6. Lee, J.W., Allen, D.H. and Harris, C.E., "Internal State Variable Approach for PredictingStiffness Reductions in Fibrous Laminated Composites with Matrix Cracks", J. Comp.Mater., 23, 1989, pp. 1273-1291.
7. McCartney, L.N., "Theory of Stress Transfer in a 0°-90°-0° Cross-Ply LaminateContaining a Parallel Array of Transverse Cracks", J. Mech. Phys. Solids, 40, 1992, pp.27-68.
8. Ogihara, S., Takeda, N. and Kobayashi A., Submitted for publication.
9. Takeda, N., Niizuma, H., Ogihara, S. and Kobayashi, A., "Experimental Evaluation ofThermal Residual Stress in CFRP Cross-Ply Laminates", Materials System, 14, 1995, pp.73-78 (in Japanese).
Table 1. Material Properties Used in the Analysis.
T800H/3631-FM300T800H/3631 FM300EA (GPa) 169-0.111xT Ei (GPa) 2.65-0.010xTET (GPa) 9.62-0.010xT ν i 0.38GA (GPa) 4.50 α i (/°C) 60.6 x 10⁻⁶
νA 0.349
νT 0.490
αA (/°C) 0.10x10⁻⁶
αT (/°C) 35.5x10⁻⁶

Volume V: Textile Composites and Characterisation
V - 568
T800H/3900-2Base Composite Polyamide Particle-
Dispersed LayerEA (GPa) 132-0.090xT Ei (GPa) 2.71-0.0105xTET (GPa) 8.17-0.007xT ν i 0.38GA (GPa) 4.50 α i (/°C) 60.6x 10⁻⁶
νA 0.349
νT 0.490
αA (/°C) -1.73x10⁻⁶
αT (/°C) 34.7x10⁻⁶
T: degrees centigrade (°C)

Proceedings of ICCM–11, Gold Coast, Australia, 14th-18th July 1997
V - 569
Fig. 5 Transverse Crack Tip in T800H/3900-2 Fig.6 Interlaminar Shear Deformation(Laminate Stress=160MPa, (a) 20°C, (b) 160°C). near Transverse Crack Tip in
T800H/3900-2 (Laminate Stress=160MPa, (a) 20°C, (b) 160°C).
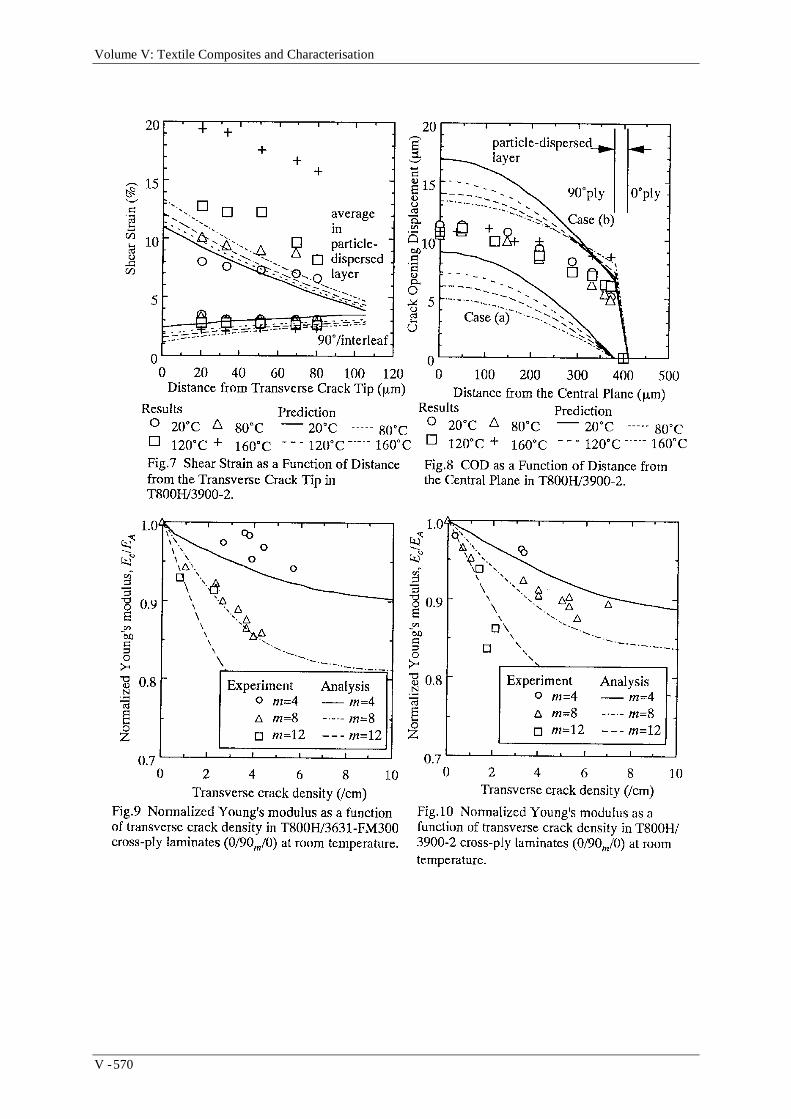
Volume V: Textile Composites and Characterisation
V - 570

Proceedings of ICCM–11, Gold Coast, Australia, 14th-18th July 1997
V - 571
ACCURATE ESTIMATION OF THE ELASTICPROPERTIES OF POROUS FIBERS
Richards Thissell,1 Anna K. Zurek,1 and Frank Addessio2
Materials Research and Processing Science, MS: G7552. Fluid Dynamics, MS: B21 Los Alamos National Laboratory
Los Alamos NM 87545
SUMMARY: A procedure is described to calculate polycrystalline anisotropic fiber elasticproperties with cylindrical symmetry and porosity. It uses a preferred orientation model(tomé ellipsoidal self-consistent model) for the determination of anisotropic elastic propertiesfor the case of highly oriented carbon fibers. The model predictions, corrected for porosity,are compared to back-calculated fiber elastic properties of an IM6/3501-6 unidirectionalcomposite whose elastic properties have been determined via resonant ultrasoundspectroscopy. The Halpin-Tsai equations used to back-calculated fiber elastic properties arefound to be inappropriate for anisotropic composite constituents. Modifications are proposedto the Halpin-Tsai equations to expand their applicability to anisotropic reinforcementmaterials.
KEYWORDS: anisotropy, elastic properties, preferred orientation, porosity correction,resonant ultrasound spectroscopy, self-consistent methods.
INTRODUCTION
Many reinforcement materials commonly used in composites are anisotropic andpolycrystalline with a strong preferred orientation. A long standing and difficult problem isthe estimation of the anisotropic constituent elastic properties because experimentalmeasurements of non-axial reinforcement properties are often difficult. Numerical methodsfor simulating bulk composite material performance require composite constituent elasticproperties and would benefit from accurate estimates of constituent anisotropic elasticproperties.
The Halpin-Tsai equations accurately describe composite elastic properties when theconstituent materials are isotropic [1]. Application of the Halpin-Tsai equations tocomposites consisting of anisotropic constituent materials, such as carbon and graphite fibers,require accurate determination of the constituent elastic properties. The longitudinal fiberproperties are relatively easy to measure, but measurement of the transverse and shearproperties are very difficult.
Graphite is one of the most anisotropic single crystals currently known. The single crystalanisotropy arises due to the bonding types within the lattice. Figure 1 shows the lattice ofgraphite and its two different bond types. Sp2 bonds are strong planar bonds, while π* bondsare weak. Table 1 lists unirradiated and irradiated graphite single crystal elastic constants.

Volume V: Textile Composites and Characterisation
V - 572
a = 2 .5 Åb = 2 .5 Å
c = 6 .7 Å
A
B
A
B
A
1.2
4π3 .3 4 5 Å
S p1 .4 2 Å
0 .70"
4.93
4"L
3 .779"L12
3
ρ = 2 26 0 k g /m3
2
∗
a
c
Blakslee et. al. [2] values were measured from highly oriented compression annealedpyrolytic polycrystalline graphite which can be made in dimensions large enough for accuratedetermination of elastic properties via standard testing techniques. Naturally occurringgraphite single crystals are often only a few millimeters in size which limits the testingmethods applicable for determining elastic constants [2]. Measurements of naturallyoccurring single crystals can indicate elastic stiffnesses that can differ by 1/3 for c33 up to afactor of eight for the off-diagonal terms [3] from the values listed in Table 1. Although,some of the values in Table 1 differ significantly from measurements of naturally occurringsingle crystals, they are assumed to be the best representation of single crystal graphite elasticproperties.
Fig. 1: Graphite lattice and bonding. The space group is P1, the stacking sequence is ABAB.The extreme anisotropy is due to the large difference in bonding type between the ab plane
and the bc and ac planes. The ab plane contains strongly covalent sp2 bonds of ~1020kJ/mole bond energy, while the bc and ac planes contain weak π* bonds of ~10 kJ/mole bond
energy. Also note that each carbon not at a vertex of the P1 unit cell does not have a π*
bond.
Table 1: Elastic Constants of Single CrystalGraphite in GPa
ElasticStiffness
Unirradiated Irradiated Ref.
c11 1060 1060 [2]c33 36.5 36.5 [2]c12 180 180 [2]c13 15 15 [2]c44 0.246 (average of
20)3.965 (average of four
at neutron dose of7.1x1018 nvt)
[5]
The shear term between basal planes, c44, has the lowest stiffness and is worth particularmention because it is the most difficult to determine and it is the most sensitive to the
Proceedings of ICCM–11, Gold Coast, Australia, 14th-18th July 1997
V - 573
presence of dislocations and defects in the lattice. For example, neutron irradiation inducedimperfections that pin dislocations [4] and increase c44 from 0.250±0.033 GPa to 3.965±0.212GPa [5]. The bonding between basal sheets is so weak that shear between them has littleresistance unless defects are present. Neutron induced point defects, grain boundaries, andnanometer-sized porosity (called Hohlstellen) can all act to impede dislocation motion [4].This is important for carbon fibers that contain significant nanometer sized grains andporosity. An analysis of polycrystalline graphite elastic constants [6] concluded that thecrystallite shear term c44 is the controlling factor to explain the effect of neutron irradiation onthe polycrystalline elastic moduli. It is important to note that the graphites in the latter studyhad an average crystallite size of 1000-5000 Å, far larger than the crystallite size in carbonfibers. Fourdeux’s [7] neutron irradiation of carbon fibers experiments resulted in thelongitudinal modulus to increase by about 10 %, implying that dislocations in carbon fibersare not completely pinned by the porosity and small crystallite size. Therefore, the questionremains as to which bound of c44 is more suitable to represent carbon fiber’s elasticproperties.
This paper first discusses preferred orientation descriptors in carbon, and follows with adiscussion of three elastic constant models applied to sp2 bonded anisotropic carbon fibers.We use the Tomé ellipsoidal self-consistent model [8] to predict the polycrystalline elasticproperties. We apply this model into a procedure to determine polycrystalline porous fiberelastic properties starting with three measured properties; the longitudinal fiber modulus, fiberdensity, and single crystal elastic properties of graphite from Table 1. We fit the Tomé modelprediction for longitudinal elastic modulus, corrected for porosity, to known fiber longitudinalmodulus by adjusting the effective preferred orientation. Finally, a comparison is madebetween the elastic model predictions of fiber elastic constants and those back calculated froma composite laminate.
Description of Preferred Orientation in Carbon Fibers
Experimental determination of x-ray (002) diffraction intensity, I(ϕ), for slender carbon andgraphite fibers is complicated and error prone. Orienting bundles of fibers along a single axisis difficult for the extreme preferred orientation usually encountered with the fibers.Therefore, the effective I(ϕ) that is measured of a fiber bundle in an x-ray machine is aconvolution of the actual I(ϕ) with spreading due to angular dispersion of fibers within thefiber tow. Bacon and Schalamon [9] have shown that fiber types with identicalexperimentally measured orientation half-widths can have measured axial Young’s modulidiffering by over a factor of three. Reynolds [10] described a focused x-ray technique thatcan measure the (002) diffraction arc from single fibers in a few hours of exposure. Thistechnique eliminates the spreading of the true I(ϕ) due to slight misorientations of fibers in atow. The (002) distributions shown in Fig. 2 were measured using this technique. This figureshows a graph of an experimentally measured I(ϕ) for a Type I (~2500 °C heat treatmenttemperature) carbon fiber under no load and under 0.79 GPa tension. This graph alsocompares intensity expressed in one parameter with a similar two-parameter approximation:
( )I mϕ ϕ= sin and ( )I m qϕ ϕ= sin . (1a,b)

Volume V: Textile Composites and Characterisation
V - 574
65 70 75 80 85 90
φ, degrees
0.1
0.2
0.3
0.4
0.5
0.6
0.7
0.8
0.9
1
I(φ),dimensionless
Unloaded experimental intensityUnloaded one parameter fitUnloaded two parameter fit0.79 GPa experimental intensity0.79 GPa one parameter fit0.79 GPa two parameter fit
Fig. 2: Comparison of (1a) and (1b) with experimental (002) x-ray diffraction intensities fora single Type 1 (~2500 °C heat treatment temperature) carbon fiber. The experimental datais from [10]. Loading the fiber to 0.79 GPa increases the preferred orientation significantly.
The results of the fits are listed in Table 3.
Table 2: (002) Diffraction Arc Approximation FitsUnloaded Fiber (002) I(ϕ)Approximation Fit Results
Loaded Fiber (002) I(ϕ)Approximation Fit Results
OneParameter
TwoParameter
OneParameter
TwoParameter
q 0.99463 0.99503m 26.1551 20.10889 37.01956 27.71807χ2 0.00127 0.00036 0.00142 0.00035
The effect of loading is to increase the degree of preferred orientation. The one-parameter fithas three times the error in χ2 (sum of the squares of the deviations) compared to the two-parameter fit for both of the experimental measurements. Isotropy is achieved by setting m =0. Increasing m is indicative of increasing preferred orientation and hence anisotropy.
Polycrystalline Elastic Constant Models
Three models are discussed to predict the elastic constants of polycrystalline materials basedupon preferred orientation of the crystallites. These models are: the Voigt uniform stress,Reuss uniform strain, and Tomé ellipsoidal self-consistent models.
An inherent limitation of two of these models, the Voigt uniform strain model and the Reussuniform stress model, is that they ignore the complex interactions at the crystallite boundariesnecessary to accommodate the strain and stress jump conditions [3]. The uniform stressmodel assumes that the stress is constant among the crystallites and provides the upper limitof polycrystalline elastic constants. The uniform strain model assumes that the strain isconstant among the crystallites, and is therefore provides the lower bound of polycrystallineelastic constants. The differences between these two models increase with increasingcrystallite anisotropy and decreasing preferred orientation for most crystals.

Proceedings of ICCM–11, Gold Coast, Australia, 14th-18th July 1997
V - 575
The self-consistent model considers the case of an elastic inclusion embedded in ahomogeneous equivalent medium (HEM) with the same elastic properties as those of thepolycrystal [11, 12]. This model assumes that the bulk strain is the average of the individualcrystallite strains. The advantage of the self-consistent model over the constant stress andconstant strain models is that it considers the interactions of a grain with the surroundingHEM. The self-consistent model can also take into account non-equiaxed grain shapes.Graphites and carbons have crystallite grain shapes that depend strongly on depositionconditions, heat treatment temperatures, and meso-phase (intermediate phase(es) betweeninitial hydrocarbon and final carbon phase) deformation conditions.
The ellipsoidal self-consistent model [8] solves the problem of an ellipsoidal elastic inclusion(ellipsoidal Eshelby inclusion [13]) embedded in a HEM. The self-consistency arises fromnumerically adjusting the elastic properties of the HEM to coincide with the average of theinclusions. This model accurately represents intergranular interactions only in very orientedpolycrystalline highly anisotropic materials. The ability of this model to accurately predictelastic constants in highly oriented carbon fibers will be evaluated in the following section.
We applied the ellipsoidal self-consistent model to calculate carbon fiber elastic constants. Acomputer program, written by Tomé, takes an input file which describes the preferredorientation as weighting factors at a given angular window in a coordinate system asdescribed in the Bunge notation [14]. The file orientation weights were calculated using:
( )∫ ∫+ +
ϕ
ϕ
θ
θϕθ ϕθθθ=
1 1
sin,
j
j
i
i
ddIw ,(2)
where0,, =ωδϕ=ϕδθ=θ ji ji , (3)
I(θ) is given by equation (1b), θ, ϕ, ω are the Bunge angles, δ is angular window width, and i,j are the angular window steps. Typical analyses were performed using 1368 equivalentgrains to represent the distribution of preferred orientation. The Tomé program alsocalculates elastic constants using the uniform stress and uniform strain models, hence the two-parameter approximation, (1b), can be conveniently employed. Model predictions differed byabout 10 % when the two parameter approximation (1b) for I(θ) was used instead of the oneparameter approximation (1a) for the cases shown in Fig. 2.
Carbons consisting of sp2 bonding can exhibit extremely anisotropic elastic and thermalexpansion properties, and are hence excellent example materials to develop a practicalanalytical procedure to predict their elastic constants. Furthermore, significant porosity existsin these materials due to packing effects caused by the small crystallite size of carbons andgraphites combined with the typically large crystallite aspect ratios. The porosity consists ofnanometer-sized voids. These voids can also become highly ellipsoidal in carbon fibersexhibiting a large degree of preferred orientation.

Volume V: Textile Composites and Characterisation
V - 576
APPLICATION OF ELASTIC CONSTANT MODELS TO ORIENTED SP2 BONDEDCARBON FIBERS
Carbon fibers have significant porosity on the order of 20 %. This porosity has a very largeaspect ratio along the fiber axis [7]. The effect of porosity is accounted for by the applicationof the Halpin-Tsai equations [1]. Based on an analysis of x-ray circular intensitymeasurements [7], the porosity aspect ratio is 100,000. The rule of mixtures is applied tocorrect the Poisson’s ratios for the effect of porosity.
Table 3: Elastic Model Calculations of Carbon FibersCase: Type I
Fiber,No stress,IrradiatedProperties
Type IFiber,
No stress,IrradiatedProperties
Type IFiber,
No stress,Non-
IrradiatedProperties
Type IIFiber, IM-
6,IrradiatedProperties
Type IIFiber, IM-
6, Non-IrradiatedProperties
Type IIFiber, IM-
6, Non-IrradiatedProperties
M 20.10889(see Table
2)
4.5 (fitted) 7.15(fitted)
3.35(fitted)
4.85(fitted)
3.6 (fitted)
1 0.14 0.14 0.14 0.25 0.25 0.14Crystallite 2 0.14 0.14 0.14 0.25 0.25 0.14Lengths 3 0.86 0.86 0.86 0.75 0.75 0.86
E11, 700.65 601.96 646.14 542.87 607.60 577.84Upper E33, 292.09 308.70 292.57 317.46 302.50 311.24Bound
(Voigt):G12=G13,Gpa
171.72 178.16 175.65 178.09 176.68 176.83
G23, 105.82 120.92 112.63 125.48 117.85 122.40υ12=υ13 0.15 0.17 0.17 0.17 0.17 0.17
υ31 0.06 0.09 0.08 0.10 0.09 0.10υ32 0.24 0.21 0.22 0.20 0.21 0.20
Experiment: E11, 355, [10] 355, [10] 355, [10] 276 276 276G12= G13, GPa 24.8, [10] 24.8, [10] 24.8, [10]
E11, GPa 531.16 354.27 354.74 276.83 275.47 277.41E22=E33, GPa 37.50 48.46 25.13 55.93 32.33 30.93G12= G13, GPa 56.77 55.80 40.11 54.26 39.81 38.12Self- G23, 12.08 17.58 8.19 20.68 11.03 10.55
Consisten υ12=υ13 0.34 0.38 0.46 0.35 0.42 0.44υ31 0.02 0.05 0.03 0.07 0.05 0.05υ32 0.37 0.28 0.41 0.26 0.35 0.35E11, 75.23 31.86 2.64 27.00 2.19 1.95
Lower E33, 17.91 16.87 1.29 16.94 1.27 1.26Bound
(Reuss):G12=G13,GPa
6.36 7.15 0.45 7.25 0.47 0.48
G23, 5.32 5.58 0.37 5.68 0.37 0.38υ12=υ13 0.33 0.33 0.38 0.32 0.38 0.38
υ31 0.08 0.18 0.19 0.20 0.23 0.26υ32 0.47 0.39 0.56 0.37 0.53 0.50
Comparison of the calculated elastic constants with literature reported and measuredexperimental data requires conversion of the elastic constants to engineering Young’s moduliand Poisson’s ratios. The models calculate elastic constants with the 3 axis along the fiber

Proceedings of ICCM–11, Gold Coast, Australia, 14th-18th July 1997
V - 577
axis, and the 2 and 1 axes normal to the fiber axis, thereby maintaining hexagonal symmetry.Common engineering design practice is to consider the fiber axis to be along the 1 axis, calledspecially orthotropic symmetry. Therefore a coordinate transformation is performed on thecalculated elastic constants notation via the fourth order tensor transformation rule [15].
Table 3 compares the three models for two different carbon fibers, a Type I fiber (~2500 °CHTT) whose experimental (002) diffraction arc is shown in Fig 2, and a Type II fiber(Hercules IM-6 ~1600 °C HTT). The reported moduli and Poisson’s ratios are corrected forporosity as described above and are listed using specially orthotropic symmetry. Theellipsoidal crystallite lengths are reported using hexagonal symmetry notation with the 3 axisalong the fiber axis. The lengths are dimensionless and only the ratios of the lengths areimportant. The values used are qualitatively obtained from high-resolution transmissionmicrographs [7, 16]. The value of q used in (1b) is held constant at 0.99463 for all of thecases. The density used for the Type I fiber is that reported for the Type II fiber (ρ = 1.76g/cm3) and should be considered conservatively low; the actual density may be 5-8 % higher.Note that none of the models accurately predict the experimentally measured axial modulusfor the Type I fiber when the experimental (002) diffraction arc is used. m from (1b) isadjusted in the second and third columns such that the self-consistent model Young’smodulus along the fiber, E11, fits the experimental measurement. However, the shearmodulus, G12, predicted by the self-consistent model does not closely correspond toReynolds’s experimental measurement, even for the non-irradiated single crystal propertycase. Columns four through six compare the results when m is fitted so that the self-consistent model prediction for E11 matches the experimental fiber axial moduli for HerculesIM6 fiber. Column four uses the irradiated single crystal higher value for c44, while columnfive shows the results when the non-irradiated lower value is used. The non-fitted parametersdiffer by up to 50 % between the two cases of c44. Column six uses the same single crystalproperties as five, but with a larger crystallite aspect ratio. The lower bound and upper boundcases are listed to illustrate the difference between their predictions and experimentalmeasurements of carbon fiber elastic constants. This is attributed to the high, but far fromperfect, degree of preferred orientation common in carbon fibers. The magnitude of thedifference between the upper and lower bound model values also illustrate the severity of theproblem of estimating elastic constants of polycrystals consisting of highly anisotropiccrystallites. There is also a tremendous difference between the upper and lower bound modelvalues and the experimentally measured moduli. This second difference is in contrast to whathas been previously determined for less anisotropic bulk carbons where the porositycorrected, lower bond model (constant stress) predicted moduli were very close toexperimental measurements [3].
Effect of c-Axis Spacing on the Elastic Models Predictions
Polycrystalline graphite and carbon fibers have an interlayer c axis spacing as determinedfrom the x-ray analysis that is greater than the single crystal value shown in Table 1. The c-axis spacing in polycrystalline graphite is a strong function of maximum heat treatmenttemperature and a weak function of maximum heat treatment time [17]. For example, Type 1carbon fibers have a c axis spacing of about 3.39 Å [18]. The increase in c-axis spacingeffects the crystallite density and elastic stiffnesses c33, and possibly c13 and c44. This resultsin a unit cell volume expansion of about 1.3 % and hence a theoretical density of 2230 kg/m3.Since actual fiber densities are considerably smaller, due to the presence of nano-porosity,small changes in the c-axis spacing have a negligible effect on the macroscopic density.Decreasing c33 by 25 % of the value in Table 1 had no significant effect on the three elastic

Volume V: Textile Composites and Characterisation
V - 578
models’ results for the case of a sine approximation with m = 10, q = 0.994. This and theresults shown in Table 3 indicate that the models’ predicted elastic constants are mostlydependent upon the graphite single crystal c11, c44, and the polycrystalline preferredorientation.
RESONANT ULTRASOUND SPECTROSCOPY OF A LAMINATED COMPOSITE
We have used Resonant Ultrasound Spectroscopy (RUS) to determine the elastic constants ofa unidirectional laminated composite of IM6 fibers in a 3501/6 epoxy matrix (vf = 0.62). RUScan determine all of the elastic constants at once to a deterministic level of accuracy, the levelof which depends upon the material, quality of machining of the sample, appropriateness ofthe symmetry model, and identification of the fitting peaks [19]. It is especially accurate indetermining the shear elastic constants and this is facilitated by the first few resonances thatare usually strong and are almost entirely due to shear modes. This also has the advantage ofincreasing the accuracy of determining the c11 and c12.
The application of RUS to fibrous composite systems is relatively new and poses specialdifficulties. RUS has recently been applied to determine the elastic constants of a ceramic-fiber laminated-ceramic matrix composite and many similarities exist in the application topolymer matrix composites [20]. There are significant differences that are important in RUSbetween laminated ceramic fiber ceramic matrix composites and carbon fiber laminatedpolymer matrix composites. These include the much lower Q (resonant gain factor) typical inpolymers, a far greater anisotropy and greater differences in stiffness constants between thefiber and matrix. The lower Q factor in the polymer composite leads to broader peaks oflower intensity. The typically lower values for the shear and transverse elastic constants inthe polymer composite results in many more predicted peaks. The combination of low Q andlow shear and transverse elastic constants results in many lost peaks that must be correctlyaccounted for in the fitting process. Hence, reasonably accurate starting values of the elasticconstants must be provided.
The sample dimensions were 5.70 (5.691), 5.44 (5.437), and 6.20 (6.207) mm, along the 1, 2,and 3 (fiber) axes, using the hexagonal symmetry orientation. The values in parentheses arethe best-fit sample dimensions. The composite spectrum was scanned from 100 kHz to 1MHz and 31 peaks were identified and are listed in Table 4. Fig. 3 shows an example scan.Several scans were performed with repositioning the sample between the transducers fromone scan to the next in order to improve the distinction between real and false resonances dueto contact artifacts. Each scan was an average of 5 or 8 individual scans to improve the signalto noise ratio. 293 peaks were estimated from the fitting program between the lowest andhighest observed resonance; and the best fit assuming hexagonal (transversely isotropic)symmetry resulted in a RMS error of 0.23%. This is approximately the same overall error towhat has been reported for the other laminated composite [20]. This level of error may be thelowest that can be expected from laminated fibrous composite materials, although it istypically about an order of magnitude higher than what can be achieved in polycrystallinemetals. The error that could be obtained by starting with the manufacturer supplied elasticconstant data shown in Table is ~2.35% RMS. Iterating around that data results in the axialc11 dropping to ~150 GPa, an unrealistically low value considering the ease of traditionalmeasurement and rule of mixture prediction of that property. The lowest RMS error obtainedafter iterating around the manufacturer supplied data is about ~0.50% RMS.
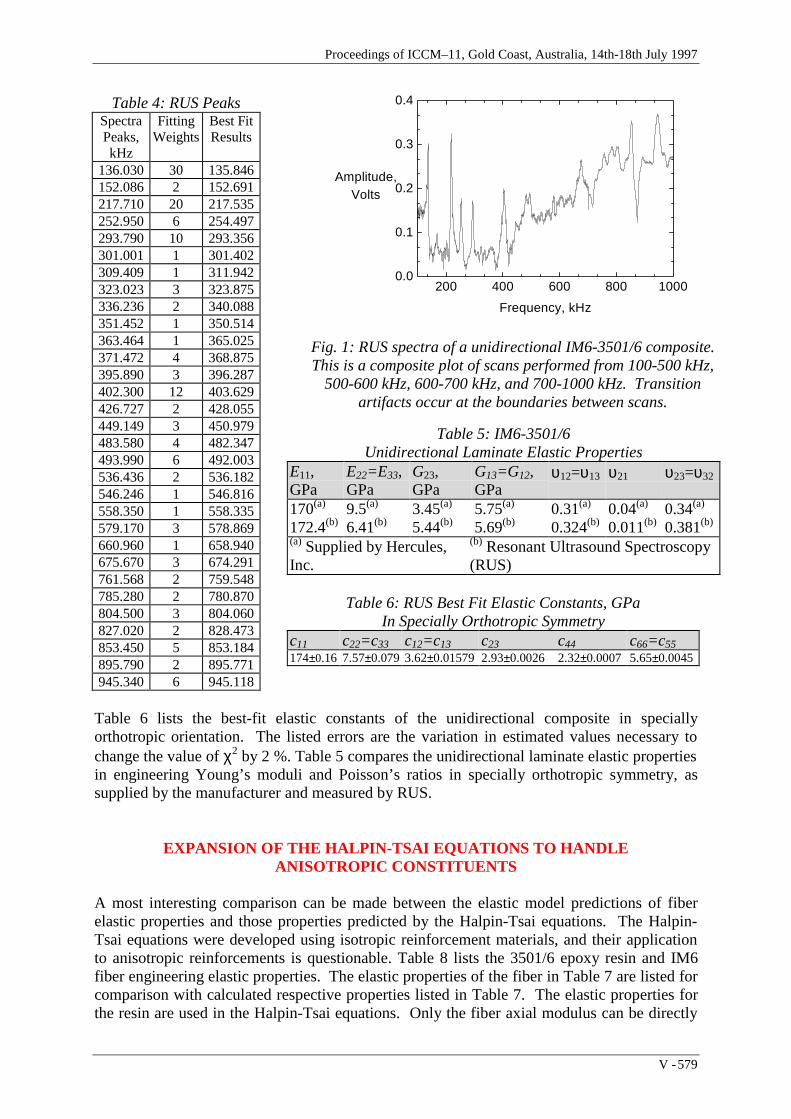
Proceedings of ICCM–11, Gold Coast, Australia, 14th-18th July 1997
V - 579
Table 4: RUS PeaksSpectraPeaks,kHz
FittingWeights
Best FitResults
136.030 30 135.846152.086 2 152.691217.710 20 217.535252.950 6 254.497293.790 10 293.356301.001 1 301.402309.409 1 311.942323.023 3 323.875336.236 2 340.088351.452 1 350.514363.464 1 365.025371.472 4 368.875395.890 3 396.287402.300 12 403.629426.727 2 428.055449.149 3 450.979483.580 4 482.347493.990 6 492.003536.436 2 536.182546.246 1 546.816558.350 1 558.335579.170 3 578.869660.960 1 658.940675.670 3 674.291761.568 2 759.548785.280 2 780.870804.500 3 804.060827.020 2 828.473853.450 5 853.184895.790 2 895.771945.340 6 945.118
Table 6 lists the best-fit elastic constants of the unidirectional composite in speciallyorthotropic orientation. The listed errors are the variation in estimated values necessary tochange the value of χ2 by 2 %. Table 5 compares the unidirectional laminate elastic propertiesin engineering Young’s moduli and Poisson’s ratios in specially orthotropic symmetry, assupplied by the manufacturer and measured by RUS.
EXPANSION OF THE HALPIN-TSAI EQUATIONS TO HANDLEANISOTROPIC CONSTITUENTS
A most interesting comparison can be made between the elastic model predictions of fiberelastic properties and those properties predicted by the Halpin-Tsai equations. The Halpin-Tsai equations were developed using isotropic reinforcement materials, and their applicationto anisotropic reinforcements is questionable. Table 8 lists the 3501/6 epoxy resin and IM6fiber engineering elastic properties. The elastic properties of the fiber in Table 7 are listed forcomparison with calculated respective properties listed in Table 7. The elastic properties forthe resin are used in the Halpin-Tsai equations. Only the fiber axial modulus can be directly
200 400 600 800 10000.0
0.1
0.2
0.3
0.4
Amplitude,Volts
Frequency, kHz
Fig. 1: RUS spectra of a unidirectional IM6-3501/6 composite.This is a composite plot of scans performed from 100-500 kHz,
500-600 kHz, 600-700 kHz, and 700-1000 kHz. Transitionartifacts occur at the boundaries between scans.
Table 5: IM6-3501/6Unidirectional Laminate Elastic Properties
E11,GPa
E22=E33,GPa
G23,GPa
G13=G12,GPa
υ12=υ13 υ21 υ23=υ32
170(a)
172.4(b)9.5(a)
6.41(b)3.45(a)
5.44(b)5.75(a)
5.69(b)0.31(a)
0.324(b)0.04(a)
0.011(b)0.34(a)
0.381(b)
(a) Supplied by Hercules,Inc.
(b) Resonant Ultrasound Spectroscopy(RUS)
Table 6: RUS Best Fit Elastic Constants, GPaIn Specially Orthotropic Symmetry
c11 c22=c33 c12=c13 c23 c44 c66=c55174±0.16 7.57±0.079 3.62±0.01579 2.93±0.0026 2.32±0.0007 5.65±0.0045

Volume V: Textile Composites and Characterisation
V - 580
determined, the other listed elastic properties were back-calculated from laminate data. Table7 lists fiber properties predicted from the Halpin-Tsai equations in column two. Acomparison of these properties to the self-consistent model predictions of the IM6 fiber listedin Table 3, which are repeated in column one of Table 7, is not close. However, the followingmodifications can be made to the Halpin-Tsai equations that will greatly increase thecorrespondence between the laminate measured Halpin-Tsai back-calculated fiber propertiesand those predicted by the ellipsoidal self-consistent elastic model of preferred orientation,when corrected for porosity. υ21 of the composite and the fiber can be calculated by:
11
221221 E
Eυ=υ .
(4)
The fiber Poisson’s ratios listed in column two and three of Table 7 are calculated using therule of mixtures, as suggested by Halpin [1]. υ21 in columns two and three of Table 7 arecalculated using (4).
The modification for the calculation of E22 utilizes the Sih, Paris, and Irwin effective modulusfor orthotropic materials [21], which has been previously employed to correlate mode Ifracture toughness with fracture energy in orthotropic materials. The effective modulus isgiven by:
( ) ( )( ) ( )( )
( )
( )
2/1
332366
233
223
33112
12661133236612
212
2/1
2
3323112
123323
33112
123323
22
222
22
−
−
+
−−+++−−
++−−
−+=
ccc
cc
cccccccccc
cccccc
cccccE eff
.(5)
when expressed in elastic stiffness constants for specially orthotropic orientation. The cij in
(5) are corrected for fiber porosity using the Halpin-Tsai equations for the diagonal terms andthe rule-of-mixtures for the off-diagonal terms. Thus, for determining E22 using the Halpin-Tsai equations, the engineering elastic property of the reinforcement, pr, becomes:
=
11
2222
22
E
EEp effE
r . (6)
The correction factors when calculating the shear terms involve non-integer powers. pr
becomes:
3/223
3/1122312
2312 , GGpGGp Gr
Gr == (7a, b)
for determining G12 and G23, respectively.
A comparison between column one and column three of Table 7 reveals a closecorrespondence among all of the engineering elastic constants, with the exception of E22,where the difference is 13.7%. These corrections are admittedly rather arbitrary due to thelimited number of experimental cases (present and isotropic), but(6)-(7a, b) have the advantage that in the limit of isotropy they simplify back to E and G,respectively.

Proceedings of ICCM–11, Gold Coast, Australia, 14th-18th July 1997
V - 581
Table 7: Comparison of Elastic Model PredictedFiber Properties and Halpin-Tsai Predicted
Fiber Properties
Property
Self-Consistent(Table 3,case 4)
Halpin-TsaiBack
CalculatedFrom RUS
data
Modified Halpin-Tsai Back
Calculated FromRUS data
E11, GPa 275.47 276 276E22=E33,
GPa32.33 8.15 37.45
G13=G12,GPa
39.81 20.97 39.88
G23, GPa 11.03 17.11 11.25υ12=υ13 0.423 0.299 0.410
υ21 0.052 0.00754 0.058υ23=υ32 0.352 0.391 0.350
Table 8: Composite Constituent PropertiesProperty
IM6Fiber
3501/6 Epoxy
E11,GPa
276(a) 4.24(a), 4.275(b)
E22,GPa
13.8(a)
G12,GPa
108(a) 1.793(b)
υ12 0.28(a) 0.365(a), 0.34(b)
υ23 0.30(a)
ρ,g/cm3
1.76(a) 1.265
(a) Supplied by Hercules, Inc.(b) Courtesy of Don Adams, University ofWyoming.
SUMMARY
The ellipsoidal self-consistent model provides much more accurate predictions of elasticconstants of highly oriented carbon fibers than either the constant stress or constant strainmodels. However, model predictions when experimental (002) diffraction arcs are usedsignificantly overestimate the axial fiber moduli. The correspondence improves considerablywhen corrections are made for porosity and m is adjusted such that the ellipsoidal self-consistent model prediction for E11 matches the experimentally measured axial modulus. Theessential effect of adjusting m in such a fashion is to provide a correction for the complexstress and strain accommodations occurring at the graphite crystallite grain boundaries thatdiffer from the mathematically ideal accommodations implicit in the ellipsoidal self-consistent model. The porosity correction is made using the Halpin-Tsai equations to account

Volume V: Textile Composites and Characterisation
V - 582
for the long axial aspect ratios of fiber porosity reported by TEM investigations [7, 9]. Anadvantage of choosing the fiber density and axial modulus as inputs is that they are easilymeasured accurately and are usually supplied by the fiber manufacturer.
Significant differences occur in model predictions, which depend upon the chosen singlecrystal value of c44. The ellipsoidal self-consistent model predictions based upon theirradiated (pinned glissile dislocations) single crystal c44 value overestimates the fibertransverse and shear elastic properties by a significant factor. Use of the non-irradiated singlecrystal c44 value yields much more realistic fiber elastic properties. This result addresses thequestion of the role of the small crystallite size and porosity in Type II fibers. Grainboundaries and spherical porosity (Hohlstellen) have been observed in the TEM to impede themotion of glissile dislocations in graphite [4]. The elastic model predictions indicate thatgrain boundaries and porosity in carbon fibers do not significantly impede the motion ofglissile dislocations.
Significant differences exist between the Halpin-Tsai equations back calculated fiberproperties from RUS measured unidirectional composite laminate properties and the predictedproperties based upon the Tomé ellipsoidal self-consistent model. These differences areattributed to the fact that the Halpin-Tsai equations were developed using isotropicreinforcement materials and hence are not directly applicable to cases of anisotropicreinforcement materials. Simple correction factors are proposed that greatly improve thecorrespondence between the self-consistent model predictions and the RUS back calculatedfiber properties. These correction factors simplify back to the original Halpin-Tsai equationsin the limit of isotropic reinforcement materials.
ACKNOWLEDGEMENTS
The authors wish to thank Carlos Tomé for helpful discussions and access to his ellipsoidalself-consistent model source code. Al Migliori and Timothy Darling are greatly appreciatedfor tutelage in RUS. Roland deWit is thanked for giving a fascinating lecture at the 1996Mechanics-Materials Linkage summer course that provided the motivation for this work. CarlCady is thanked for his meticulous review and numerous suggestions for this manuscript.This work was funded by the DoD/DOE Joint Munitions Program.
REFERENCES
1. Halpin, J. C., Primer on Composite Materials Analysis, Technomic PublishingCompany, Inc., Lancaster, 1992.
2. Blakslee, O. L., D. G. Proctor, E. J. Seldin, G. B. Spence, and T. Weng, "ElasticConstants of Compression -Annealed Pyrolytic Graphite," Journal of Applied Physics,Vol. 41, No. 8, July 1970, pp. 3373-3382.
3. Price, R. J., "Young's Modulus of Pyrolytic Carbon in Relation to PreferredOrientation," Philosophical Magazine, Vol. Series 8, No. 12, 1965, pp. 561-571.
4. Bacon, R., and Richard Sprague, "Direct Observation of Imperfections In GraphiteSingle Crystals", Fifth Conference on Carbon, Pennsylvania State University, 1961,Vol. 1, pp. 466-472.

Proceedings of ICCM–11, Gold Coast, Australia, 14th-18th July 1997
V - 583
5. Seldin, E. J., and C. W. Nezbeda, "Elastic Constants and Electron-MicroscopyObservations of Neutron-Irradiated Compression-Annealed Pyrolytic and Single-Crystal Graphite," Journal of Applied Physics, Vol. 41, No. 8, July 1970, pp. 3389-3400.
6. Kelly, B. T., "The Elastic Constants of Polycrystalline Carbons and Graphites,"Philosophical Magazine, Vol. 9, No. 1964, pp. 721-737.
7. Fourdeux, A., R. Perret, and W. Ruland, "General Structural Features of CarbonFibres", Ist International Conference on Carbon Fibres, 1971, Vol. pp. 57-67.
8. Tomé, C., "Chapter 7: Tensor Properties of Textured Polycrystals," in Textures &Anisotropy, edited by F. Kocks, C. Tomé, and R. Wenk (Cambridge University Press,Cambridge, 1996).
9. Bacon, R., and W. A. Schalamon, "Physical Properties of High Modulus GraphiteFibers Made From A Rayon Precursor," Applied Polymer Symposia, Vol. 9, No. 1969,pp. 285-292.
10. Reynolds, W. N., "Structure and Mechanical Properties of Carbon Fibres", 3rdInternational Conference on Industrial Carbons and Graphites, London, 1970, Vol. pp.427-430.
11. Humbert, M., and J. Diz, "Some Practical Features for Calculating The PolycrystallineElastic Properties From Texture," Journal of Applied Crystallography, Vol. 24, No.1991, pp. 978-981.
12. Diz, J., and M. Humbert, "Practical Aspects of Calculating the Elastic Properties ofPolycrystals from the Texture According to Different Models," Journal of AppliedCrystallography, Vol. 25, No. 1992, pp. 756-760.
13. Eshelby, J. D., "The Determination of The Elastic Field Of An Ellipsoidal Inclusion,and Related Problems," Proceedings of the Royal Society of London, Vol. A241, No.1957, pp. 376-396.
14. Wenk, H. R., and U. F. Kocks, "The Representation of Orientation Distributions,"Metallurgical Transactions A, Vol. 18A, No. June 1987, pp. 1083-1092.
15. Nye, J. F., Physical Properties of Crystals: Their Representation by Tensors andMatrices, Clarendon Press, Oxford, 1959.
16. Johnson, W., "The Structure of PAN Based Carbon Fibres and Relationship to PhysicalProperties," in Strong Fibres, edited by W. W. a. B. V. Perov (North Holland,Amsterdam, 1985), Vol. 1, p. 389-443.
17. Fair, F. V., and F. M. Collins, "Effect of Residence Time on Graphitization At SeveralTemperatures", Fifth Conference on Carbon, Pennsylvania State University, 1961, Vol.1, pp. 503-508.
Volume V: Textile Composites and Characterisation
V - 584
18. Brydges, W. T., D. V. Badami, and J. C. Joiner, "The Structure and Elastic Propertiesof Carbon Fibres," Applied Polymer Symposia, Vol. 9, No. 1969, pp. 255-261.
19. Migliori, A., J. L. Sarrao, William M. Visscher, T. M. Bell, Ming Lei, Z. Fisk, and R. J.Leisure, "Resonant Ultrasound Spectroscopic Techniques for Measurement of theElastic Moduli of Solids," Physica B, Vol. 183, No. 1993, pp. 1-24.
20. Yongmei Liu, Y. H., Fuming Chu, and Terrance E. Mitchell, "Elastic Properties ofLaminated Calcium Aluminosilicate/Silicon Carbide Composites Determined ByResonant Ultrasound Spectroscopy," Journal of the American Ceramic Society, Vol. 80,No. 1, 1997, pp. 142-148.
21. Sih, G. C., P. C. Paris, and G. R. Irwin, "On Cracks In Rectilinearly AnisotropicBodies," International Journal of Fracture, Vol. 1, No. 1, 1965, pp. 189-203.

Proceedings of ICCM–11, Gold Coast, Australia, 14th-18th July 1997
V - 585
PREDICTION OF THE LARGE STRAINMECHANICAL BEHAVIOUR OF HETEROGENEOUS
POLYMER SYSTEMS BY A MULTI-LEVELAPPROACH
R.J.M Smit, W.A.M.. Brekelmans and H.E.H.Meijer
Faculty of MechanicalEngineering, Eindhoven University ofTechnology, P.O. Box 513, 5600MB Eindhoven, The Netherlands
KEYWORDS: homogenisation, global-local analysis, multi-level finite elements,heterogeneous polymers

Volume V: Textile Composites and Characterisation
V - 586

Proceedings of ICCM–11, Gold Coast, Australia, 14th-18th July 1997
V - 587

Volume V: Textile Composites and Characterisation
V - 588
Proceedings of ICCM–11, Gold Coast, Australia, 14th-18th July 1997
V - 589

Volume V: Textile Composites and Characterisation
V - 590

Proceedings of ICCM–11, Gold Coast, Australia, 14th-18th July 1997
V - 591

Volume V: Textile Composites and Characterisation
V - 592

Proceedings of ICCM–11, Gold Coast, Australia, 14th-18th July 1997
V - 593

Volume V: Textile Composites and Characterisation
V - 594
Proceedings of ICCM–11, Gold Coast, Australia, 14th-18th July 1997
V - 595
CALCULATION OF EFFECTIVE MODULI OFVISCOELASTIC COMPOSITES WITH PERIODIC
MICROSTRUCTURES USING A HOMOGENIZATIONMETHOD
Yeong-Moo Yi, Sang-Hoon Park and Sung-Kie Youn
Department of Mechanical Engineering, Korea Advanced Institute of Science andTechnology, 373-1,Gusung-dong, Yusung-gu, Taejon, 305-701, Korea
SUMMARY: For composites with viscoelastic material phases, a systematic way ofcalculating the effective viscoelastic moduli in time domain is developed. With the effectivemoduli in time domain, effective complex moduli in frequency domain are obtained by usingthe Fourier transformation. The problem of calculating the effective moduli of generalvicoelastic composites is formulated using the asymptotic homogenization method. Thememory effects due to the homogenization are presented in general form and a sufficientcondition for the effects to disappear is discussed. The effective relaxation moduli arecalculated in Laplace transformed domain and are numerically inverse-transformed into timedomain. Numerical examples are presented to illustrate and verify present approach and todiscuss the memory effects. Results show that due to the presence of memory effects,additional terms are required for the accurate inverse Laplace transformation in the Pronyseries approximation of the homogenized relaxation moduli.
KEY WORDS: effective moduli, viscoelastic, homogenization, memory effects.
INTRODUCTION
The behavior of the composite materials is highly complex and the characterization of theconstitutive behavior is important for accurate analysis of composite structures. But it isalmost impossible to analyze the composite structures on the microscopic level byconsidering the heterogeneity of composite materials. There are several different approachesto obtain the macroscopic properties of such composites. Among many other methods ofobtaining the effective moduli, the asymptotic homogenization method[1,2] has severalattractive features mainly due to its systematic mathematical approach. Hollister and Kikuchi[3,4] showed that the homogenization method gave better estimations of the effective elasticmoduli of composites than standard mechanics approaches.
Although Sanchez-Palencia [1] and Suquet [5] have dealt with the problems for the simplecases of the Voigt model and the Maxwell model, respectively, in viscoelastic composites, thediscussions on the estimation of the effective relaxation moduli or the effective creepcompliances of general viscoelastic composites in time domain are rarely found.

Volume V: Textile Composites and Characterisation
V - 596
EFFECTIVE VISCOELASTIC MODULI BY A HOMOGENIZATION METHOD
A heterogeneous medium with a periodic structure may be replaced by an effectivehomogeneous one when the period is very small compared to the global length scale. In thehomogenization method, the field variables are assumed to vary in the multiple scales, i.e., inthe local and global scales and they are represented by asymptotic expansions in each spatialscale. Due to the periodicity of the microstructure, field variables such as displacement, strain,and stress are assumed to be periodic with respect to the local scale. The effective moduli arethen obtained by investigating the asymptotic behavior of the medium as the period of themicrostructure goes to zero.
Derivation of the Homogenized Moduli
To deal with two different length scales associated with the microscopic and the macroscopicbehaviors, the global coordinate is designated by x and the local coordinate by y. The globalcoordinate and the local coordinate are related with each other by a positive real parameterε as follows.
y x= / ε (1)
For the averaging process of the homogenization, the mean operator, ~, on Y is defined asfollows . Y is the measure of Y.
~• = •∫1
Y Y dy (2)
The following problem of viscoelastic composites with a periodic microstructure isconsidered, where the inertia effects and the body forces are not present.
∂σ∂
εij
j
t
x
( )x,= 0 in Ω (3)
uiε ∂= 0 on 1Ω , σ ∂ε
ij j in F= on 2Ω (4)
σ τ∂ τ
∂ττε ε
ε
ij ijklklt t
ed( ) ( )
( ( ))x, x,
u x,= −∫ G
t
0(5)
where Ω is an open connected domain, ∂1Ω the displacement-prescribed boundary, ∂2Ωthe traction-prescribed boundary, and Fi the traction force on ∂2Ω . G tijkl
ε ( , )x is relaxation
tensor.
Since G ,tijklε ( )x is dependent on ε, ui
ε ( )x is also dependent on ε. The asymptotic behavior is
to be observed as ε goes to zero. u tiε ( )x, has an asymptotic expansion as follows.
u ,t u ,t u , ,t u , ,ti i i iε ε ε ε( ) ( ) ( ) ( ) ;x x x y x y y x /= + + +0 1 2 2
= (6)

Proceedings of ICCM–11, Gold Coast, Australia, 14th-18th July 1997
V - 597
where uim( , )x y is Y-periodic in y and is independent of ε. The asymptotic expansions for eij
ε
and σ εij are obtained as follows.
e ,t e ,t e , ,t e , ,tij ij ij ijε ε ε ε( ) ( ( )) ( ) ( ) ;x u x x y x y y x /= = + +0 1
= (7)
σ σ εσ εεij ij ijt t t( ) ( , ) ( , ) ;x, x y, x y, y x /= + +0 1
= (8)
e e eij ijx ijy0 0 1( ) ( ) ( )x y, u u, t = + (9a)
σ τ ∂ τ∂τ
τij ijkl
tklG
ed0
0
0
( ) ( )( )
x, y, y,x, y,
t t= −∫
(9b)
In (9) the subscripts x and y mean the differentiation with respect to xi and yi , respectively.
By introducing (8) into (3), arranging it against ε −1 and ε 0, applying the mean operator, weobtain following two equations.
∂σ∂
ij0( , )x y,t
yj
= 0 (10)
∂σ∂
~ ( , )ij
j
t
x
0 x= 0 (11)
Equations (10) and (11) represent the local and the global problems, respectively. By solvingthe local problem (10), the homogenized viscoelastic moduli can be obtained. ApplyingLaplace transformation to (10), the local problem becomes
[ ]− =∂∂
∂∂y
sG s e s e ssG s
yjijkl kly klx
ijkl
j
( ) ( ( , )) ( ( ))( ( ))
y, u x y, u x,y,1 0 (12)
where variables with ^ indicate that they are Laplace transformed. Then the followingvariational formulation of the local problem is obtained in Laplace transformed domain.
Find s t
sG e s e dy e s sG e dyijkl kly ijyY klx ijkl ijyY
( , )
( ) ( ( , )) ( ) ( ( , )) ( ) ( )
u x, y
y, u x, y v u x, y y, v
1
1 0
such tha
s s∫ ∫= − (13)
In (13), when u0 is given, u1 can be obtained in terms of u0 . To treat this problem, we definea space with the associated inner product as follows.
~ ~V VY Y= u u∈ = 0 (14)
( ) ( ) ( ) ( )~u,v y u vV ijkl kly ijyYY
sG e e dy= ∫ (15)
( ( ) ) ( ) ( ) ,~
~w ,v y, v vkl V ijkl ijyY Ys sG s e dy VY
= ∀ ∈∫ (16)
Then (13) becomes
( ( ( , )) ( , ) ) ,~
~e s s Vklx kl V YYu x w y + u x y v v0 1 0( , , ),s = ∀ ∈ (17)

Volume V: Textile Composites and Characterisation
V - 598
Therefore, u1 is given in terms of u0 and wkl as follows.
( , ) ( ( )) ( ) ( )u x y u x w y C x1 0, , , ,s e s s sklx kl= − + (18)
By applying inverse Laplace transform to (18), we obtain
σ τ ∂∂τ
τ
τ τ τ ττ
ij ijkl klx
mnx kly mn
t G y t e
p e p dp d
0
0
0
0
0
( , ) ( , ) ( ( , ))
( ( , )( )) ( ( )( ))
x y u x
u x w y
,
,
= −
− −
∫
∫
t
e
(19)
By using the Leibnitz rule, by changing the order of the double integration, and by applyingthe mean operator, the homogenized stress-strain relations are obtained as follows.
~ ( ) ( ) ( ( , ))σ τ ∂∂τ
τ τij ijklh
klxt t e0
0
0= −∫ G d
tu x (20)
where the homogenized viscoelastic relaxation modulus, Gijklh , is given as follows.
G t G t p pijklh
ijkl ijmn mny( ) ( , ) ( , ) ( ( , ))~
= −
∫y y w ykl - G t e dp
0
t (21)
Consequently, when the original moduli are replaced by the corresponding homogenizedones, the homogenized problem has exactly the same form as the original problem defined byequations (3),(4) and (5).
Calculation of the Effective Relaxation Moduli
By taking Laplace transformation of (21), we obtain
[ ] sG s sG s e sijklh
ijmn mk nl mny kl
~ ( ) ( ) ( ( ))= −y, w y,δ δ (22)
where ( , )w ykl s is the solution of the following local problem in Laplace transformeddomain.
sG s e s e dy sG s e dy Vijmn mny kl ijyY ijkl ijyY Y ( ) ( ( )) ( ) ( ) ( ) ,
~y, w y, v y, v v∫ ∫= ∀ ∈ (23)
Gijklh t( ) can be obtained from inverse Laplace transformation of ( )Gijkl
h s which is obtained
from (22). Note that (23) has nearly the same form as the typical elastostatic problems. Theright-hand side of (23) acts like body forces. The boundary conditions are specified in the
form of periodic boundary conditions on wkl . The homogenized elastic moduli can becalculated by the finite element codes with slight modifications.

Proceedings of ICCM–11, Gold Coast, Australia, 14th-18th July 1997
V - 599
MEMORY EFFECTS
In addition to the original memories of the constituent materials of viscoelastic composites,the homogenization process induces the additional long-term memories. This behavior istermed as the memory effects. Sanchez-Palencia[1] and Suquet[5] showed that the long-termmemory appeared as a result of homogenization for composites in which the viscoelasticphase is treated with a Voigt model or a Maxwell model. In the following, the memory effectsare discussed in the general form.
Memory Effects
The integral term in (21) represents the memory effects. It can be seen that the homogenizedrelaxation moduli depend on the history of the relaxation moduli of the constituent materialsas well as on the current value of the moduli. If the relaxation moduli G tijkl ( )y, is separable
with respect to space and time , the memory effects do not appear. If G tijkl ( )y, is separable in
y and t, Laplace transform of G tijkl ( )y, is given by
sG s sF T sijkl ijkl ( ) ( ) ( )y, y= (24)
Plugging (24) into (23), the following local problem is obtained.
sT s F e e dy sT s F e dy Vijmn mny kl ijyY ijkl ijyY Y( ) ( ) ( ) ( ) ( ) ( ) ( ) ,
~y w v y v v∫ ∫= ∀ ∈ (25)
From (25), it is evident that wkl is not a function of s. Thus from (22), we obtain
[ ] sG s sT s F e sT s Fijklh
ijmn mk nl mny kl ijklh~
( ) ( ) ( ) ( ( )) ( )= − =y w yδ δ (26-a)
G t F T tijklh
ijklh( ) ( )= (26-b)
From the above results, it can be seen that the memory effects come from the coupling effectsof the spatial and the temporal variations of the viscoelastic moduli. The memory effectsmake the homogenization problem complicated. It is required to solve the local problem forevery s if the relaxation moduli are not separable with respect to space and time variables,while it is sufficient to solve the local problem only once when the relaxation moduli areseparable as can be seen in [25].
Inverse Laplace Transformation
Since the homogenized relaxation moduli are calculated in Laplace transformed domain,inverse Laplace transformation is required if the memory effects appear. In the present work,the least-square fitting in Laplace transformed domain is employed based on the Prony seriesrepresentations of the relaxation moduli. Since it is difficult to optimize the relaxation timesof the fitting function because of its nonlinear behavior, the relaxation times should beproperly chosen in the region where the relaxation curve changes rapidly [6]. Because ofmemory effects, more terms in the Prony series are required in the fitting function than thenumber of terms in the Prony series representations. Once the approximations are made in the

Volume V: Textile Composites and Characterisation
V - 600
Laplace transformed domain, the relaxation moduli in time domain and the complex modulias well as the loss tangent in frequency domain are readily obtained using the known relations[7].
NUMERICAL EXAMPLES AND DISCUSSIONS
Numerical examples are presented to discuss the memory effects and their applications. In thefollowing examples, two dimensional plane stress states is considered and the constituentmaterials are assumed isotropic.
As a first example, in order to observe the memory effects, a viscoelastic composite with theelastic circular inclusions in the viscoelastic matrix in which the stiffness of the elasticinclusions is comparable to that of the viscoelastic matrix is treated. The moduli andPoisson’s ratio of the elastic inclusions are
E = 20, = ν 0.21 (27)
The moduli of the viscoelastic matrix, which are represented by using the standard linear solidmodel [7] , are given by
E t e t( ) ,= + −3 17 = ν 0.38 (28)
The volume fraction of the inclusions is 40%. Due to the presence of the long term memoryeffects, the homogenized relaxation moduli cannot be represented exactly with the standardlinear solid model. It is, therefore, required to introduce additional terms in the Prony seriesrepresentation. To see the effect of the number of the terms in the Prony seriesapproximations, the number of relaxation terms (Nf) is varied by 1, 3, 5, and 7. Figure 1 showsthe results. They show that small errors introduced in the Prony series approximations of thehomogenized relaxation moduli in Laplace transformed domain may cause large errors inconverting the data into those of time and frequency domains.As a second example, composites with the microstructure composed of two isotropicviscoelastic materials with different relaxation times are used. The relaxation moduli aregiven as follows.
E t e t( ) ,/= + −3 17 10 ν = for material 10.38 (29)
E t e t( ) ,= + −3 17 = for material 2ν 0.38 (30)
The effective moduli of the two composites are calculated. In the first composite, material 1 isused as the circular inclusion and material 2 as the matrix, and in the second one, the roles ofmaterial 1 and 2 are interchanged. The volume fractions of material 1 and 2 are the same inboth composites, i.e., 50%, respectively. Figure 2 shows the calculated results. The resultsshow that the loss tangents and thus the damping effects of the homogenized materials as afunction of frequency can be significantly affected by the configurations of the microstructureas well as the relaxation moduli of the constituent materials. Also figure 2 (c) shows that wemay be able to get the increased damping effect in a certain desired frequency interval byfabricating the composites, which has a special microstructural configuration, of two or moreviscoelastic materials even if each of the constituent material has low damping effect in thatfrequency interval.

Proceedings of ICCM–11, Gold Coast, Australia, 14th-18th July 1997
V - 601
CONCLUSIONS
A systematic way of calculating the effective or homogenized relaxation moduli of thegeneral linear viscoelastic composite materials in time domain is developed by using ahomogenization method. The memory effects due to homogenization have been presented ingeneral form and it has been shown that the memory effects disappear if the relaxation moduliare separable in space and time. The memory effects make the numerical inverse Laplacetransformation very complicated.
The memory effects and inverse Laplace transformation are discussed in detail. Due to thepresence of the memory effects, in the Prony series approximation of the homogenizedrelaxation moduli, the additional terms are required for the accurate inverse Laplacetransformation. It is also shown in the numerical example that maximum damping can beachieved by choosing specific configuration of the microstructures of the composites.
REFERENCES
1. Sanchez-Palencia E., Non-Homogeneous Media and Vibration Theory, Lecture Notes inPhysics 127., Springer-Verlag, Berlin, 1980.
2. Bensoussan A., Lions J. -L., and Papanicolaou G., Asymptotic analysis for PeriodicStructures, Studies in Mathematics and Its Applications 5, Amsterdam, North-Holland,1978.
3. Hollister S. J. and Kikuchi N., “A comparison of homogenization and standard mechanicsanalyses for periodic porous composites”, Comp. Mech., Vol. 10, 1992, pp. 73-95.
4. Guedes J. M. and Kikuchi N., “Preprocessing and postprocessing for materials based onthe homogenization method with adaptive finite element methods”, Comp. Meth. Appl.Mech. Engng., Vol. 83, 1990, pp. 143-198.
5. Suquet P.M., Elements of homogenization for inelastic solid mechanics, HomogenizationTechniques for Composite Media (Eds. E. Sanchez-Palencia and A. Zaoui), LectureNotes in Physics 272: pp. 193-278, Springer-Verlag, Berlin, 1987.
6. Cost T. L. and Becker E. B., “A multidata method of approximate Laplace tranforminversion” , Int. J. Numer. Meth. Engng., Vol. 2, 1970, pp. 207-219.
7. Christensen R. M., Theory of Viscoelasticity: An Introduction, 2nd Ed., Academic Press.,New York, 1982.

Volume V: Textile Composites and Characterisation
V - 602
10-4 10-3 10-2 10-1 100 101 102 103 1040
5
10
15
20
25
Homogenized Nf = 1
Nf = 3
Nf = 5
Nf = 7
Dh 11
s(a)
10-3 10-2 10-1 100 101 102
0
5
10
15
20
25
Nf = 1
Nf = 3
Nf = 5
Nf = 7
Dh 11
t(b)
10-3 10-2 10-1 100 101 1020.0
0.2
0.4
0.6
0.8
Nf = 1
Nf = 3
Nf = 5
Nf = 7
tan
δ
ω
(c)
Fig. 1: Effect of number of fitting terms; a) effective modulus in Laplace transformeddomain, b) effective modulus in time domain and c) effective loss tangent in frequency
domain.
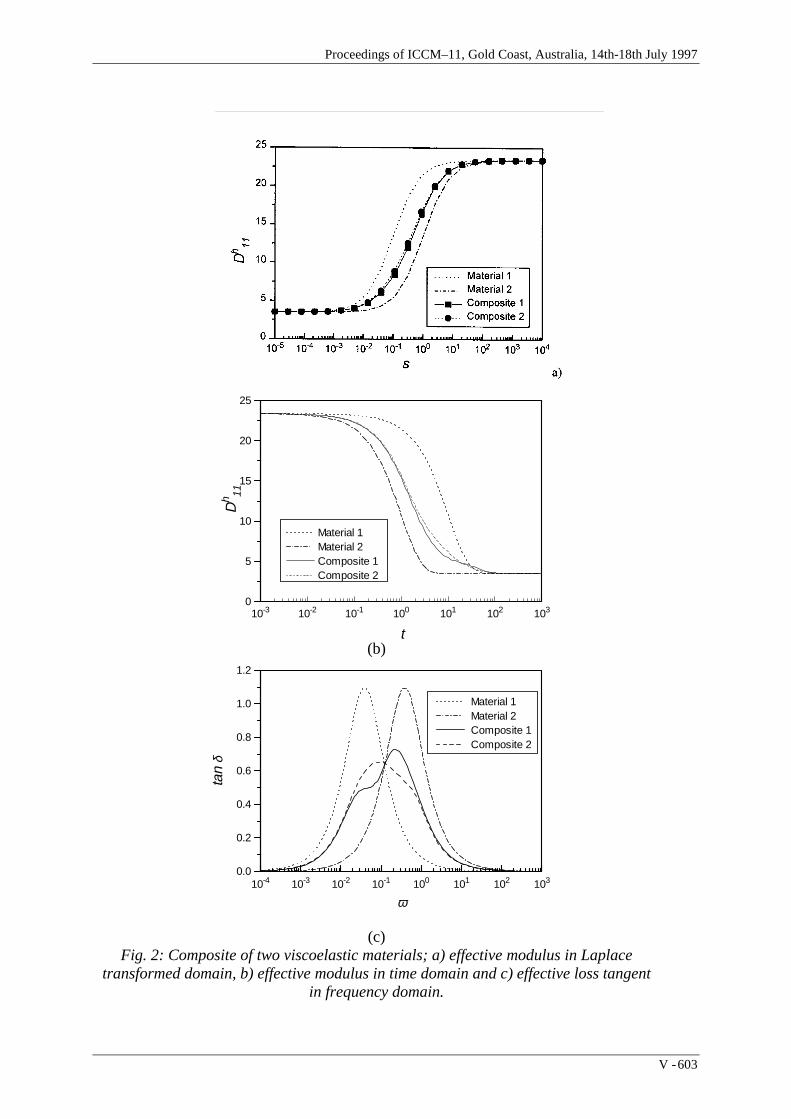
Proceedings of ICCM–11, Gold Coast, Australia, 14th-18th July 1997
V - 603
10-3 10-2 10-1 100 101 102 1030
5
10
15
20
25
Material 1 Material 2 Composite 1 Composite 2
Dh 11
t(b)
10-4 10-3 10-2 10-1 100 101 102 1030.0
0.2
0.4
0.6
0.8
1.0
1.2
Material 1 Material 2 Composite 1 Composite 2
tan
δ
ω
(c)Fig. 2: Composite of two viscoelastic materials; a) effective modulus in Laplace
transformed domain, b) effective modulus in time domain and c) effective loss tangentin frequency domain.

Volume V: Textile Composites and Characterisation
V - 604
BEHAVIOUR OF DELAMINATED BEAM-PLATESUNDER COMBINED THERMAL AND MECHANICAL
LOADS
Kosuke Hayakawa and Takahira Aoki
Department of Aeronautics and Astronautics, University of Tokyo,7-3-1 Hongo, Bunkyo-ku, Tokyo, Japan 113
KEYWORDS: composite laminate, delamination, buckling, combined load, thermal load
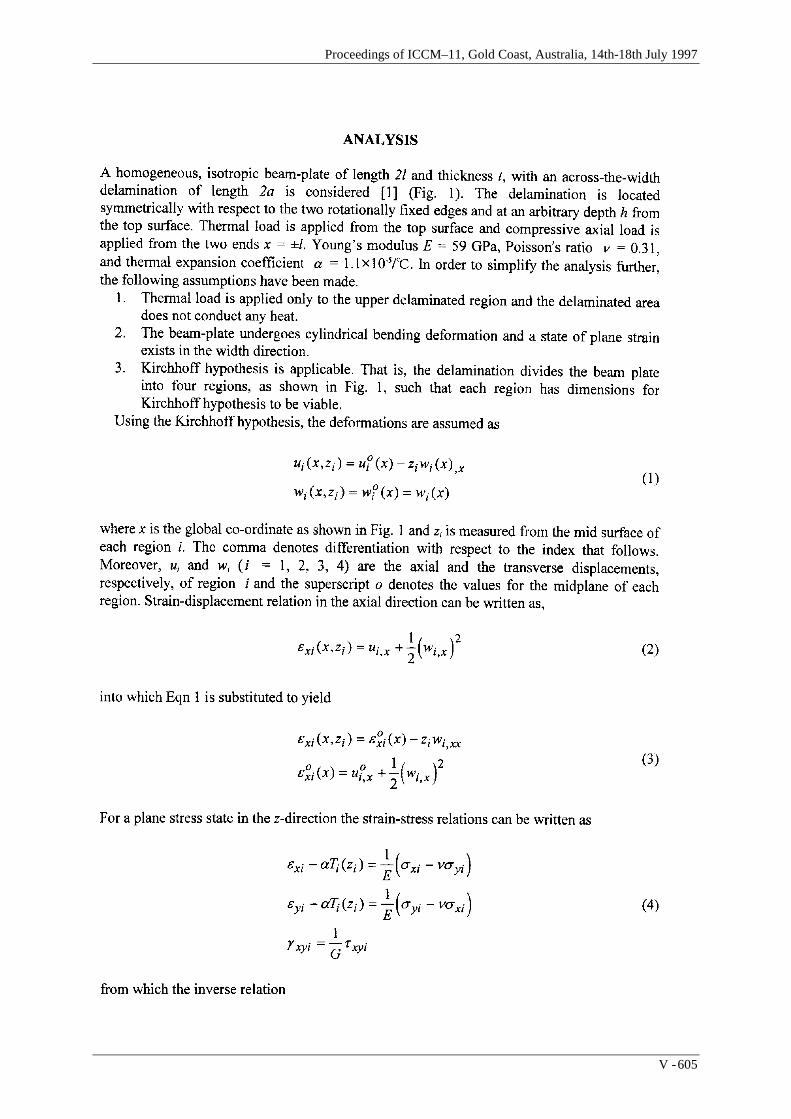
Proceedings of ICCM–11, Gold Coast, Australia, 14th-18th July 1997
V - 605
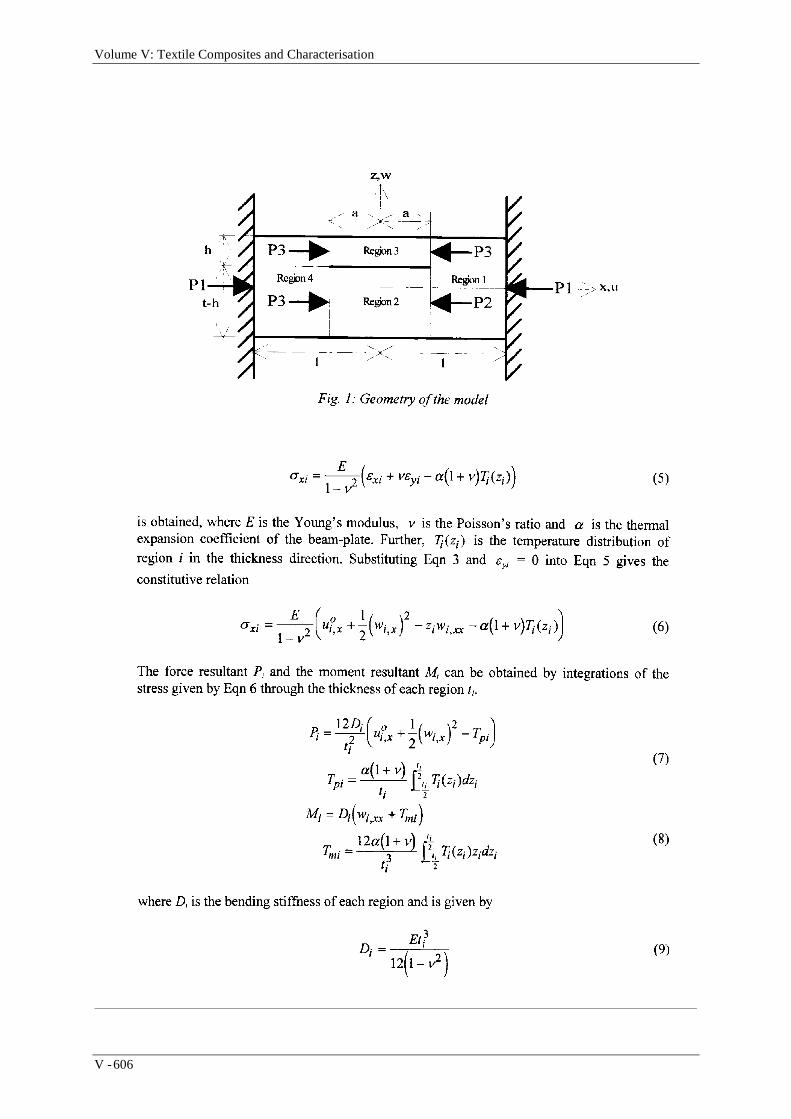
Volume V: Textile Composites and Characterisation
V - 606
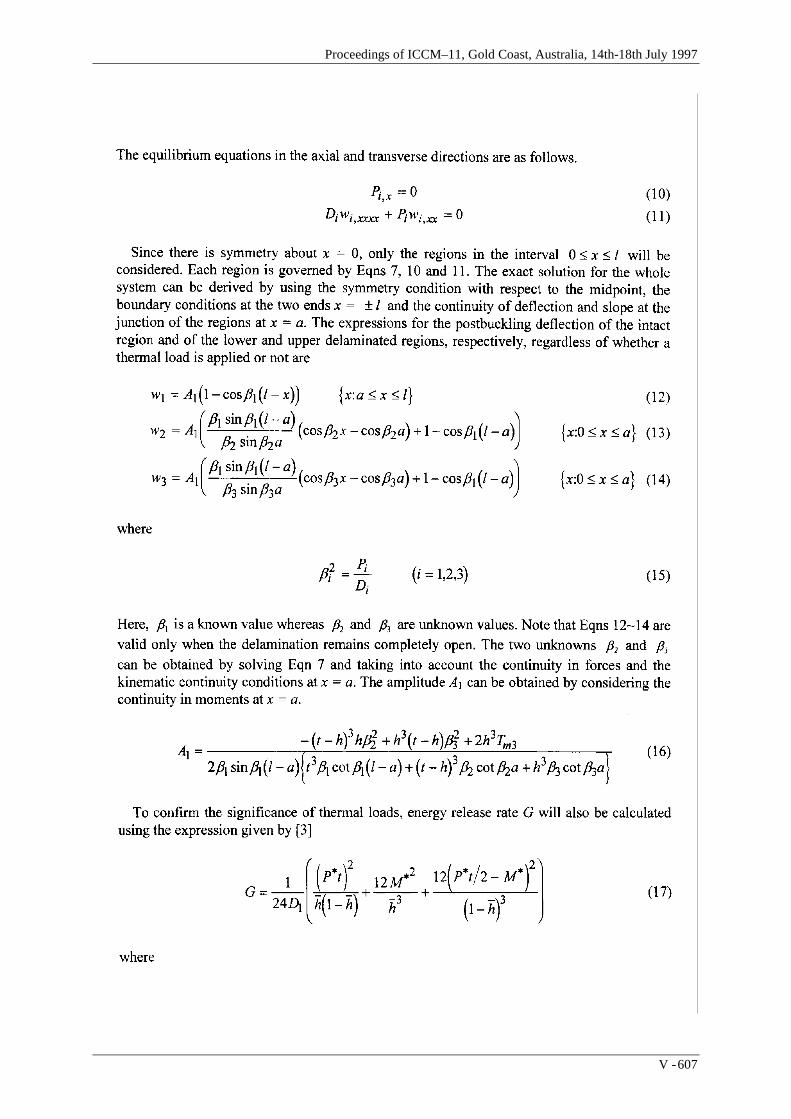
Proceedings of ICCM–11, Gold Coast, Australia, 14th-18th July 1997
V - 607

Volume V: Textile Composites and Characterisation
V - 608

Proceedings of ICCM–11, Gold Coast, Australia, 14th-18th July 1997
V - 609
Volume V: Textile Composites and Characterisation
V - 610

Proceedings of ICCM–11, Gold Coast, Australia, 14th-18th July 1997
V - 611

Volume V: Textile Composites and Characterisation
V - 612

Proceedings of ICCM–11, Gold Coast, Australia, 14th-18th July 1997
V - 613

Volume V: Textile Composites and Characterisation
V - 614
MECHANICAL PROPERTIES OF 3-DCARBON/BISMALEIMIDE HEAT-RESISTANT
COMPOSITES
Ippei Susuki1, Masahiro Shinya2, and Yosiharu Yasui3
1Head of Damage Mechanism Section, Airframe Division, National Aerospace Laboratory,7-44-1Jindaiji Higashi-machi, Chofu, Tokyo 182, Japan
2Material and Process Engineer, Chemical Research Section,Engineering ResearchDepartment, Mitsubishi Heavy Industries, Ltd., 10 Oye-cho, Minato-ku, Nagoya 455, Japan
3Assistant General Manager, Mechanical Research Group, R&D Center,Toyoda Automatic Loom Works, Ltd., 8 Chaya, Kyowa-cho, Obu-shi, Aichi-ken 474, Japan
SUMMARY: Mechanical properties of three-dimensional (3-D) carbon/bismaleimide wovencomposite were investigated and compared to two dimensional textile laminates of the samematerial system under static tension, compression, and compression-after-impact tests.Bismaleimide (BMI) 5250-4 resin from Cytek, Inc. was chosen as the matrix in this study dueto it being a candidate resin for use in high-temperature composite airframe structures for nextgeneration supersonic transport. A near net-shape dry 3-D preform comprising pi-by-fourorientation carbon fibers reinforced with orthogonal z-direction fibers was prepared afterwhich molding took place utilizing the resin film infusion (RFI) process. A high volumefraction of about 56% was attained by this 3-D processing due to the use of straight in-planefibers. Experimental results showed the longitudinal modulus of both materials to be fairlysimilar, though the transverse modulus of the 3-D composite was slightly higher. Both thelongitudinal tensile and compressive strength of the 3-D composite were approximately 6%lower than those of the 2-D laminate, while the compression-after-impact strength of the 3-Dwas significantly higher than that of the 2-D composite. The impact damage were alsoexamined by the ultrasonic scanning method.
KEYWORDS: 3-D composite, carbon/bismaleimide composite, heat resistant materials,textile, resin film infusion, compression test, tension test, CAI strength
INTRODUCTION
The application fields of polymeric composite structures have been increasingly expanded inthe past few decades especially for the structures where weight are at a premium. A typicalexample of this kind of structures is composite airframes. After twenty years of scheduledflights of Concorde, the next generation supersonic transports are expected to be developedand manufactured in the near future for replying to the estimated air travel growth [1]. Inorder to produce an economically viable supersonic transport, it is required to develop andapply high performance polymeric composite materials which will be durable for long termhigh temperature adverse environments and more tolerable against impact damages [2,3].Laminated plates of fiber reinforced plastics have been widely adopted to the compositestructures as load bearing components. However, increased use of advanced compositematerials has required that processes other than traditional prepreg layups and autoclave curebe developed to meet design properties and damage tolerance requirements of structures [4-6].

Proceedings of ICCM–11, Gold Coast, Australia, 14th-18th July 1997
V - 615
Three-dimensional (3-D) textile composites offer potential improvements in the ability of acomposite structure to survive a high energy impact with minimal decrease of strength [7-9].
In this work, fundamental mechanical properties of 3-D carbon/bismaleimide compositeplates were investigated experimentally including in-plane tensile/compressive elasticconstants, static tensile and compressive strength, and compression strength after impact. Anear net-shape dry fiber preform was formed by pi-by-four fiber orientation in a x-y plainwith orthogonal z-direction fiber reinforcement. Firstly, our research work was concentratedon attaining a higher volume fraction of a 3-D dry fiber preform. Secondly, resin filminfusion (RFI) processes were studied for making thin plates of carbon/bismaleimide 3-Dcomposites. All specimens were cut out from the plates. In this study, Cytec 5250-4 resinwas used for RFI processes, and our estimated volume fraction was about 54 to 57%. In-plane tension and compression tests were carried out and stiffness and strength were measuredand compared to two-dimensional (2-D) quasi-isotropic materials which have beenlaminated of dry cloth plies, and about the same volume fraction values. Our experimentalresults show that the longitudinal modulus of both materials is quite similar, but that thetransverse modulus of the 3-D is slightly higher. In terms of strength, the longitudinal tensileand also compressive strength of the 3-D composite was approximately 6% lower than thoseof the 2-D laminate. The CAI test was carried out based on the SACMA method. Thethickness of our specimens were all about 5 mm. The 3-D composites showed a much highercompressive strength after impact damage than that of 2-D ones. The 3-D compositesmaintained about 68% values after the impact damage energy of 1500 in-lb/in, and 60% for2000 in-lb/in. The damage area was examined by the ultrasonic scanning method, and wefound both composites have about the same projected damaged areas for these impact energylevels. However, smaller and more distributed cracks seemed to be formed during the impactfor the 3-D composites, and this characteristics contributed the compressive strength of the 3-D materials to keep higher levels.
WEAVING PROCESSES FOR THREE-DIMENSIONAL (3-D) FABRICS
The dry fabric preforms were produced by our thrusting apparatus which is schematicallyshown in Fig.2.1. All 3-D fabrics were formed in two steps. The first step is arranging of in-plane fibers to make a lamina. In this work, these were arranged along 00, 450 or 900 line byengaging with many restriction members such as pins, located with a predetermined pitch ona frame[9]. The second step is insertion of z-direction fibers. The thrusting apparatus for z-direction fiber is consisted mainly of (1) a movable support table which supports the frameand is movable by a predetermined pitch , (2) a press plate which presses the laminated fiberlayers , and guides the needles, (3) the perforating needles which make pre-holes in the fiberlayers to prevent from damage caused by the insertion of the z-direction fibers, (4) theinserting needles which thrust z-direction fibers, and (5) a lock yarn needle which inserts alock yarn into loop of z-direction fibers. These z-fibers are thrusted by many insertingneedles, which are arranged in a series, into the laminated fiber layers.
Details of the weaving processes are:(1) pushing the laminated fiber layers by press plate ,(2) making pre-holes to the laminated fiber layers by perforating needles ,(3) thrusting the inserting needles to the laminated fiber layers with z-direction fibers,(4) making loops of z-direction fibers by a little going back of inserting needles, and
inserting a lock yarn into the loops,
Volume V: Textile Composites and Characterisation
V - 616
(5) pulling back the inserting needles and tightening the z-direction fibers.
A sample of our dry fabric preforms and a schematic drawing are shown in Fig.2.2 andFig.2.3. The advantages of this production method are;
(1) high quality and high volume fraction of 3-D fabric, because the lamination issupported by pins until the insertion of z-direction fibers are completed, and fiberstraightness is maintained, and because we use perforated needles, press plate andspecial tension device ,
(2) capability of high productivity, because z-direction fibers are inserted in a seriestogether ,
(3) capability for production of complex shape fabric by developing of frame and table.
FABRICATION PROCESSES OF BMI-RESIN COMPOSITES
To fabricate a composite part, it is necessary, as in the case of 3-dimensional fabrics, to havemolding process performed including impregnation and curing of resin for the preformswhich are made of only the "dry" base reinforcement fiber materials. In this study, we haveused the resin film infusion (RFI) process as molding method. The principle of this concept isshown in Fig.3.1. The resin has been prepared in the form of a film or a panel beforehand.The resin film/panel was applied to both sides of the preform. Then, they were heated in avacuum environment to have resin melted and impregnated into the preform by capillaryaction. Further heating of the assembly was accomplished to cure the impregnated resin.This method used much simpler equipment and operations compared to the general resintransfer molding where resin was impregnated into the preform by applying pressure.Therefore, this method can be considered advantageous for applications to aircraft skins, etc.where relative simpler shapes of preforms are used, because the satisfactory quality level offormed parts can be assured as well as a shorter molding time [10]. Figure 3.2 shows theequipment used for RFI process. The center of the equipment is a vacuum chamber. It can beused to fabricate a part of maximum 200mmW x 300mmL using the metal mold die placed inthe vacuum chamber. Figure 3-3 shows the molding cycle. The resin was melted andimpregnated at temperature of 1000C in a vacuum environment of 540mmHg minimum. Thespecimens were cured at 1910C. After that, they were applied to post-cure process attemperature of 2270C. Figure 3-4 shows the section of specimen. The satisfactory qualityparts which have almost free from voids, interlaminar cracks, etc. can be fabricated up tomaximum thickness of 6mm by the above process.
Table 3-1 shows the specification of the specimens used in this work. The 5 axes 3dimensional (with 4 in-plane axes directions in 0(, -45(, +45(, 90( and additional one axis inthickness direction) composite (3-D) and 2 dimensional composite (2-D) was prepared. 2-Dspecimen aims at giving the reference. 3-D's preform is the mentioned 3D-fabric and 2-D'spreform is lamination of dry cloths that is pre-impregnated textile. Both 3-D and 2-Dspecimens were fabricated by the same molding process. Two types of carbon fiber, MR50Kof Mitsubishi Rayon and T900 of Toray, were used. MR50K was used for in-plane directionfiber as a plenty of data were available for this material. It was used as a yarn for 3-Dspecimen, and satin woven fabric for 2-D specimen. T900 twist yarn was used for 3-Dthrough-the-thickness direction fiber. The used resin was bismaleimide resin #5250-4-RTMof Cytec. This resin was chosen from several different types of bismaleimide resins by

Proceedings of ICCM–11, Gold Coast, Australia, 14th-18th July 1997
V - 617
comparing the previous test results of their characteristics on better workability, and lesspossibilities of having voids and/or interlaminar cracks.
TESTING
Specimen Configurations and Testing Methods
Various test methods have been investigated to evaluate the stiffness and strength of textilecomposites properly, as these materials tend to be less homogeneous than conventional tapelaminates, and are known their failure processes are significantly different [11,12]. Thereseems to be little data base, especially for the 3-D composites, to build up a standard testmethod. In this study, we focused on the mechanical properties of those compared to the 2-Dlaminates which we have already had some experiences and test results. Specimenconfigurations of in-plane tension, compression, and CAI test are shown Fig. 4.1. TheSACMA( Suppliers of Advanced Composite Materials Association) method was adopted forthe CAI test method [13]. Specimens were impacted at room temperature with a spherical tipimpactor at 1500 or 2000 inch-pounds/inch thickness of the energy level. Tensile tests wereconducted on the MTS machine under load controlled mode. The compressive tests and CAItest were conducted on the Instron machine under displacement controlled mode at acrosshead speed of 0.4 mm/min and 0.5 mm/min respectively.
Tensile Properties
The 5mm long strain gages were bonded at both surfaces in the longitudinal and transversedirections. Four strain data with loading one were recorded to a developed digital dataacquisition system using personal computer. Fig.4.2 and Fig 4.3 are the sample stress-straincurves of 2-D and 3-D specimens. As seen in these figures, the longitudinal modulus of bothmaterials is quite similar, but that the transverse modulus of the 3-D is slightly higher. Interms of strength, the longitudinal tensile strength of the 3-D's are about 6% lower than that ofthe 2-D laminates.
Compressive Properties
Similar to tensile test specimens, 3mm long strain gages were bonded at both surfaces andmeasured and recorded by the data acquisition system. The stress-strain curves of 2-D and 3-D specimen under static compressive loads are shown at Fig.4.4 and Fig.4.5, respectively.Again, the longitudinal modulus of both materials is quite similar, but that the transversemodulus of the 3-D is slightly higher. The compressive strength of the 3-D's are about 6%lower than that of the 2-D laminates.
Compression-after-impact Properties
Out-of-plane impact damages were investigated by a ultrasonic imaging system prior tocompressive failure tests of CAI specimens. The damage area was measured and examinedby the ultrasonic C-scanning method, and our data showed both of 2-D and 3-D compositeshave about the same projected damaged areas for 1500 and 2000in-lb-in impact energy levels.However, as seen in Fig. 4.6 and Fig. 4.7, smaller and more distributed cracks seemed to beformed during the impact for the 3-D composites. The growth of interlaminar failures wasobserved to be arrested by the through-thickness reinforcement fibers. Load vs. strain curves

Volume V: Textile Composites and Characterisation
V - 618
of compression tests after 1500 or 2000in-lb-in impact damages were shown in Fig.4.8 to Fig.4.11. Strains were measured at the locations of the both sides, S1,S2,S3,S4, as indicated inthe SACMA recommendations. Our experiments showed that the 3-D composites maintainedabout 68% values after the impact damage energy of 1500 in-lb/in, and 60% for 2000 in-lb/in.
Properties of 3-D Composites
The longitudinal modulus of both materials is quite similar, but that the transverse modulus ofthe 3-D is slightly higher. Both the tensile and compressive strength of the 3-D compositewere approximately 6% lower than those of the 2-D laminate, while the 3-D compositesshowed a much higher compressive strength after impact damage than that of the 2-Dcomposite. The 3-D composites maintained about 68% values after the impact damage energyof 1500 in-lb/in, and 60% for 2000 in-lb/in. Preliminary ultrasonic C-scan data indicated thez-fiber in the 3-D composite contributed to arrest the propagations of distributed cracksgenerated by out-of-plane impacts. Experimental results are summarized in Table 5.1
CONCLUSIONS
A high volume fraction of about 56% was attained in this work for the 3Dcarbon/bismaleimide composite which was molded by resin film infusion process. Althoughthe data are limited, the compression-after-impact strength of the 3-D composites weresignificantly higher than that of the 2-D composites.
REFERENCES
1. Condit, P.M.,"Performance, Process, and Value: Commercial Aircraft Design in the21st Century", Proc. of World Aviation Congress and Exposition, 1996.
2. Rogalski, M.E.,"Aging of polymeric materials for use on HSCT", SAE 942162, 1994.
3. Shin, E.E. et al.,"Durability and critical fundamental aging mechanisms of hightemperature polymer matrix carbon fiber composites: Part I", IMECE, Proc. ASMEMatl. Div. MD-Vol.69-1, 1995, pp183-189.
4. Shim,S.B., Ahn K., and Seferis,J.C.,"Cracks and microcracks in stitched structuralcomposites manufactured with resin film infusion process", J. of Advanced Materials,July, 1995, pp48-62.
5. NASA CP- 3178,"Third NASA Advanced Composites Technology Conference", 1994.
6. NASA CP-3311, "Mechanics of Textile Composites Conference", 1995.
7. Chou,S.C.,Chen H.-C. and Wu,C.-C.,"BMI resin composites reinforced with 3D carbon-fibre fabrics", Comp. Sci. & Tech. 43, 1992, pp 117-128.
8. Burgess,K.and Paradis,S.,"Application of 3-D woven preforms to laminatedcomposites", AIAA Aircraft Engr.Tech., and Oper. Congr., Sept., 1995, AIAA 95-3890.
9. Pending U.S. patent application ,Yasui, Hori, Amano and Takeuchi , Method andapparatus for production of a three-dimensional fabric, Feb.5, 1996.
10. Yamamoto, et al. "Three Dimensional Fabric Composite Forming Method", Next Gen.Comp. Tech. Handbook, Japan Industrial Standard Assoc., p.254 - 265.

Proceedings of ICCM–11, Gold Coast, Australia, 14th-18th July 1997
V - 619
11. Minguet,P.J., Fedro,M.J., and Gunther,C.K.,"Test Methods for Textile Composites",NASA CR-4609, 1994.
12. Masters,J.E., and Portanova,M.A.,"Standard Test Methods for Textile Composites",NASA CR-4751, 1996.
13. SACMA Recommended Test Method: SRM 2-88.

Volume V: Textile Composites and Characterisation
V - 620

Proceedings of ICCM–11, Gold Coast, Australia, 14th-18th July 1997
V - 621

Volume V: Textile Composites and Characterisation
V - 622

Proceedings of ICCM–11, Gold Coast, Australia, 14th-18th July 1997
V - 623

Volume V: Textile Composites and Characterisation
V - 624

Proceedings of ICCM–11, Gold Coast, Australia, 14th-18th July 1997
V - 625
EVALUATION OF THE ELASTIC PROPERTIES OFFIBER REINFORCED COMPOSITES BY THE
VARYING-SPAN METHOD
S. Javad Jalali and Farid Taheri
Department of Civil Engineering, Technical University of Nova ScotiaHalifax, Nova Scotia, Canada B3J 2X4
SUMMARY: Fiber reinforced plastic composites suffer from low shear modulus. Therefore,when such materials are subjected to three- or four-point bending tests, the predictedlongitudinal modulus will include the effect of shear deformation, except when the specimenhas a large span to depth ratio (L/h). This characteristic was used by the authors to introducethe potential of a new methodology for the simultaneous evaluation of the longitudinal andshear moduli (E and G) of composite materials [1]. In the present work, the proposed testingmethod is used to evaluate the properties of graphite/epoxy and Kevlar/epoxy composites.The effect of variable strain rates which is inherent in the method is also studied, and theresults are presented. The results agree very well with those obtained by the other methodsthereby confirming the integrity, efficiency and the reliability of the proposed method. Thereliability of the method is also investigated and confirmed by the statistical means.
KEYWORDS: composite materials, fiber reinforced plastics, testing methods, tensilemodulus, through-the-thickness shear modulus, shear modulus, varying-span method.
INTRODUCTION
Fiber reinforced plastic composites (FRPC) can be classified as orthotropic materials with 9independent elastic constants. Referring to Fig. 1, these constants are the elastic Moduli ( E11,E22, E33), the Poisson’s ratios (ν12, ν13, ν23), and the shear moduli (G12, G13, G23) inorthogonal directions. To evaluate these properties several methods have been developed andused. However, only a few methods have gained popularity in practice. For instance, thestandard procedure for evaluating tensile modulus and strength and the Poisson’s ratio ofFRPC is to subject a flat and rectangular specimen to direct tensile loading (ASTM D3039-93). One must, however, ensure that any bending due to misalignment of the specimen and/orthe system itself is minimized. The specimens must be tabbed at the grip regions to ensurethat they will not fail prematurely due to stress concentration. Moreover, hydraulic grips(very costly) are often required when testing moderately thick laminates.
Due to the above stringent requirements, and the simplicity and ease offered by a flexural test,ASTM flexural test method D790M-93 has gained a special popularity in industry. However,due to the shear coupling effect, the flexural modulus obtained by this method for specimenswith small span to depth ratios (L/h) is not reliable . To eliminate this problem, Zweben et al.[2] suggested the use of specimens with L/h>60 . The flexural modulus obtained forspecimens with the aspect ratios greater than 60 agrees well with the result of the tensile test[3], however the flexural strength are usually more than the tensile strength obtained by the

Volume V: Textile Composites and Characterisation
V - 626
tensile test. The latter difference should not be construed as a shortfall of the method. Indeed,most structures are subjected to flexural loading in service. Therefore, the response of thematerial in flexural test is actually very close to its condition in service.
1
3
2
Fig.2: Definition of material principal axes for a lamina.
The most accurate results for the shear properties are believed to be obtained by applying atorsion load to a thin wall tube specimen [4]. Nevertheless, because of the difficulty involvedin the preparation of the tubular specimen, other methods are usually employed in industry.The most common methods for the evaluation of shear properties are rail shear test [5](ASTM D4255M-83), 10o off-axis [6], ±45o tensile test [7] (ASTM3518-94), Iosipescu [8](ASTM D5379-93), and the short-beam [9] (ASTM D2344-84) shear test. Among thesemethods, with the exception to the short-beam and the Iosipescu shear tests, non of the otherscan be used to evaluate the out-of-plane properties of FRPC. Moreover, the short-beam sheartest can provide only an apparent through-the-thickness shear strength of a material, while theIosipescu shear test requires a specimen with minimum thickness of 20 mm (hence, difficultto prepare). The shortfalls identified above indicate a distinct requirement for a more practicaltest method capable of evaluating the through-the-thickness shear modulus of FRPC. An indepth overview of the advantages and disadvantages of the above test methods was presentedin Ref. 1 and 10.
In summary, common to most of the available test methods, the specimens are not subjectedto a combined state of stresses that they often experience during their service. Therefore, theevaluated properties from these methods may not represent the true in service behavior of thematerials. The ideal test method would have the following additional capabilities andattributes.
1- would use specimens extracted directly from as-received materials.2- would use specimens with simple geometry.3- would not require additional alteration and machining of the specimen.4- would use a simple fixture, without elaborate mounting requirement.5- would not require strain gages and/or other expensive instrumentation.6- would produce reliable results.7- would be capable of providing several properties from the same set of tests.
The proposed method in this work is believed to have most of the desired attributes of theabove list. The method is based on subjecting rectangular specimens with different span todepth ratio (L/h) to three-point bending. Therefore, the proposed test method is referred to as“the Varying-Span Method” (VSM), hereafter. Both longitudinal modulus and the through-the-thickness shear modulus of the specimens along with the flexural and interlaminar shear
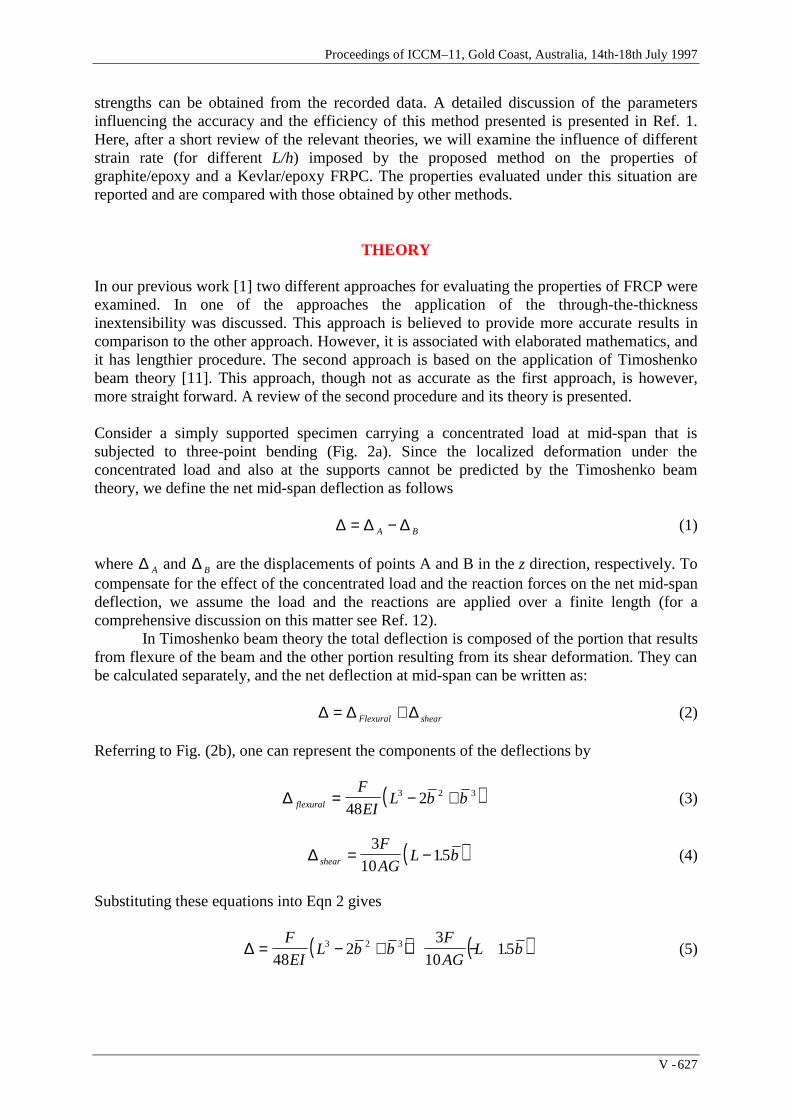
Proceedings of ICCM–11, Gold Coast, Australia, 14th-18th July 1997
V - 627
strengths can be obtained from the recorded data. A detailed discussion of the parametersinfluencing the accuracy and the efficiency of this method presented is presented in Ref. 1.Here, after a short review of the relevant theories, we will examine the influence of differentstrain rate (for different L/h) imposed by the proposed method on the properties ofgraphite/epoxy and a Kevlar/epoxy FRPC. The properties evaluated under this situation arereported and are compared with those obtained by other methods.
THEORY
In our previous work [1] two different approaches for evaluating the properties of FRCP wereexamined. In one of the approaches the application of the through-the-thicknessinextensibility was discussed. This approach is believed to provide more accurate results incomparison to the other approach. However, it is associated with elaborated mathematics, andit has lengthier procedure. The second approach is based on the application of Timoshenkobeam theory [11]. This approach, though not as accurate as the first approach, is however,more straight forward. A review of the second procedure and its theory is presented.
Consider a simply supported specimen carrying a concentrated load at mid-span that issubjected to three-point bending (Fig. 2a). Since the localized deformation under theconcentrated load and also at the supports cannot be predicted by the Timoshenko beamtheory, we define the net mid-span deflection as follows
∆ ∆ ∆= −A B (1)
where ∆ A and ∆ B are the displacements of points A and B in the z direction, respectively. Tocompensate for the effect of the concentrated load and the reaction forces on the net mid-spandeflection, we assume the load and the reactions are applied over a finite length (for acomprehensive discussion on this matter see Ref. 12).
In Timoshenko beam theory the total deflection is composed of the portion that resultsfrom flexure of the beam and the other portion resulting from its shear deformation. They canbe calculated separately, and the net deflection at mid-span can be written as:
∆ ∆ ∆= +Flexural shear (2)
Referring to Fig. (2b), one can represent the components of the deflections by
( )∆ flexural
F
EIL b b= − +
4823 2 3 (3)
( )∆ shear
F
AGL b= −
3
1015. (4)
Substituting these equations into Eqn 2 gives
( ) ( )∆ = − + + −F
EIL b b
F
AGL b
482
3
10153 2 3 . (5)

Volume V: Textile Composites and Characterisation
V - 628
where I and A are the moment of inertia and the area of the beam section, respectively. Thevalue of b plays an important role in the accuracy of the results, and it is more convenient toset it as a fraction of the beam depth.
b h= α (6)
The value of α is not constant and depends to the geometry of the specimen and the propertiesof the material. The exact value of α can be obtained from the graphs presented in Ref. 1.However, pre requisite to use of the graphs is the knowledge of the material properties. If nodata exists, admissible values can be obtained by the rule of mixture. Nevertheless as it wasshown in Ref. 1, for practical purposes the use of an approximate value α=0.7 can producereliable results. When the width to depth ratio of the specimens are approximately 5, theexpected errors with this assumption will be lower than 0.5% for E and lower than 4.5% forG. With some manipulations one can write Eqn 5 in the following form.
1 1 1 2
′= +
E E GJ
h
L (7)
where
′ =
− +
E
F
b
L
h
L
h42
3
2 3
∆α α (8)
J
L
hL
h
h
L
h
L
=−
− +
1215
2 2 32.
. α
α α (9)
and b is the width of the beam. In the above, ′E is the apparent modulus of elasticity thatincludes the shear effect. Therefore, ′E is not a constant value and changes as a function ofthe span. ′E value, however, approaches E when L/h ratio becomes reasonably large. J isalways smaller than 1.2 and approaches to this value for large L/h.
2b2b
2bF
b4
F
b2B
A
h
LL
F
(b)(a)
Fig. 2: Equivalence of the concentrated and the reactions forces with uniformly distributedloads.
Equation 7 as outlined in Fig. 3 is the equation of a line that will be referred to as the“characteristic line” of the material hereafter. The intercept and the slope of this line represent1 / E and 1 / G of the material, respectively. Therefore, for establishing the characteristic lineof a material one needs to perform at least two flexural tests (Fig. 2a), on specimens with

Proceedings of ICCM–11, Gold Coast, Australia, 14th-18th July 1997
V - 629
different spans. The slope of the load-deflection curve of each test provides a F / ∆ value forEqn 8, from which one can calculate the ′E value that corresponds to a specific value ofJ(h/L)2. Since each test produces a point in the coordinate system of Fig. 3, having the resultsof two tests, theoretically, enables one to define the properties of the characteristic line.However, to improve the accuracy and the reliability of the results, it is necessary to do morethan two tests and therefore, one needs to employ a linear regression analysis to obtain thebest fitted line.
( )1
G= tan ϕ
( )J hL
2
1
′E
ϕ
1
E
Fig. 3: The characteristic line of the material
EXPERIMENTAL WORK
The proposed method was examined by conducting a series of tests on 0o unidirectionalgraphite/epoxy and Kevlar/epoxy specimens. The specimens of graphite/epoxy were cut from300×300 mm hand lay-up panels composed of 24 layers of Fiberite graphite/epoxy prepreg.The panels were vacuum bagged and were cured in an autoclave with the curing cyclespecified by the supplier of the prepreg. The panels were then cut into strips of approximately12.5 mm width from which the specimens with different lengths were obtained. To eliminatethe excess resin rich surface layers of the specimens and also insuring uniform and smooththickness, the specimens were sanded with No. 400 silicon carbide powder. The thickness ofthe specimens for the VSM varied between 2.51 and 2.72 mm. The same procedure wasfollowed to prepare the specimens for tensile tests. Three specimens with 25 mm width werealso cut from a cross ply laminate panel at angle 45o for the ASTM ±45o shear tests. Thethickness of the specimens for the tensile test was between 2.33 and 2.51 mm and for the ±45o
shear test it varied between 2.41 and 2.51 m. The specimens of Kevlar/epoxy were cut from a150 mm pultruded panel with an average thickness of 1.9 mm. The width of the specimenswas about 12.5 mm. No sanding or polishing was applied.
The specimens were tested by the use of a special apparatus designed and fabricated for theVSM at Technical University of Nova Scotia (TUNS). The apparatus enabled us to accuratelymeasure the net mid-span deflection as a function of the applied load. The loading wasapplied by an universal MTS testing machine.
As it was mentioned in our earlier work [1], it is not possible to maintain a constant strain rate(for different L/h) for both the longitudinal and the shear deformations, simultaneously, in theVSM. To ensure a constant strain rate for the longitudinal strain, the net mid-span deflectionrate must vary according to the following equation

Volume V: Textile Composites and Characterisation
V - 630
.max∆ = +
ε L
E
G
h
L
L
h0 2
1
6 (10)
where maxε is the strain rate at the outermost layer of the specimen. To produce a constantshear strain rate the following relation must hold
. .∆ = +
γ avr L
G
E
L
h0 6 0 5
2
(11)
where γ avr is the average shear strain rate of the section. It should be noted that a constant netmid-span deflection could not be maintained by our loading machine; consequently, thedeflection rates from Eqns 10 and 11 were directly used to establish the speed of the actuatorfor each test. Eqns 10 and 11 indicate that in order to produce a constant longitudinal or shearstain rates a knowledge of the approximate value of E/G is necessary. It should be noted thatthe results are not very sensitive to this parameter. In fact, our analysis indicated that for L/h≅30, under a constant longitudinal strain rate, a large variation in the assumed value of E/Gdid not appreciably change the resulting speed of the actuator. However, for L/h≅5.5 the speedfor E/G=30 is only 1.5 times of what is required for E/G=10. This difference in the speed ofthe actuator cannot have a considerable effect on the results of common composite materialswhich, in general, are not very strain rate sensitive. Furthermore, it is instructive to note thatthe pre-assumption of E/G value is not a difficult task. Such a value can be obtained with areasonable accuracy from relevant literature and/or by the use of the rule of mixture.Nevertheless, several tests were conducted to establish the validity of the claims made on theeffect E/G and also the influence of the strain rate as obtained by Eqns 10 and 11. Thevariables for all tests are tabulated in Table 1.
Each sets of specimens were tested with 5 different spans. At least three specimens weretested for each span. Each specimen was tested twice. In the first test, depending to thelinearity limit, the specimen was loaded to about 50% to 80% of its failure load. The test wasstopped before the specimen showed significant nonlinearity. In the second test, the specimenwas loaded to failure. The initial slope of the load-deflection curve of each test was evaluated.This value was used to represent F / ∆ in Eqn 10 and its corresponding ′E was calculated. Aplot of 1 / ′E versus J h L( / )2 for the results obtained from the first time loading is presented
Table 1: Test variables for different sets of specimens
Designation Material Equation E/G maxε γ avr
GR-1 Graphite/epoxy 10 30 0.01 var.GR-2 Graphite/epoxy 10 30 0.01 var.GR-3 Graphite/epoxy 10 10 0.01 var.GR-4 Graphite/epoxy 11 30 var. 0.01K-1 Kevlar/epoxy 10 30 0.01 var.K-2 Kevlar/epoxy 10 30 0.01 var.K-3 Kevlar/epoxy 10 10 0.01 var.K-4 Kevlar/epoxy 10 10 0.01 var.K-5 Kevlar/epoxy 11 30 var. 0.01K-6 Kevlar/epoxy 11 30 var. 0.01

Proceedings of ICCM–11, Gold Coast, Australia, 14th-18th July 1997
V - 631
in Fig. 4. A similar plot was obtained for the results of the second time loading, however forthe sake of brevity the plot is not presented in here. The E and G value obtained from differentsets of specimen are presented in Table 2 and 3. As stated earlier, an approximate value ofα=0.7 was used for all cases.
The overall distributions of the data points in Fig. 4, for both materials, present a linear trend,therefore, confirming the applicability of the proposed method for the selected materials.Furthermore, the results do not indicate an obvious dependency to the different situationstabulated in Table 1. Consequently, it can be concluded that the varying strain rate imposedby the proposed test method did not influence the results. The selected speeds of the actuatorused for testing three different sets of beams having L/h<15 were comparable. For L/h≅30, therequired speed of the actuator to produce a constant shear strain rate for E/G=30 was about 3times higher than that required for maintaining a constant longitudinal strain rate. This ratioapproaches to 9 for E/G=10. However, since in specimens with large L/h only a very smallportion of the deflection is due to the shear deformation, thus, the significance of maintaininga constant shear strain rate vanishes. On the other hand, the importance of constantlongitudinal strain rate increases as L/h becomes large. It should be noted that based on theapplication of the proposed method, there is no apparent relation between the propertiesobtained for the selected materials and the various strain rates that was imposed duringtesting. However, it is recommended that Eqn 10 (along with an appropriate value of E/G ) beused for general purposes.
Table 2: G13 and E11 of Graphite/epoxy (GPa)First loading Second loading
Designation GR-1 GR-2 GR-3 GR-4 GR-1 GR-2 GR-3 GR-4E11 151.9 150.8 155.8 149.4 151.0 153.1 156.4 151.0G13 4.55 4.59 4.32 5.07 4.87 4.7 4.44 4.88
Table 3: G13 and E11 of Kevlar/Epoxy (GPa)
First loading Second loadingGroup K-1 K-2 K-3 K-4 K-5 K-6 K-1 K-2 K-3 K-4 K-5 K-6E11 66.9 67.9 69.7 68.3 67.6 69.4 66.0 68.4 68.9 67.6 67.4 68.3G13 1.82 1.75 1.59 1.71 1.73 1.68 1.76 1.62 1.58 1.69 1.68 1.73
Graphite/Epoxy
0.006
0.009
0.012
0.015
0 0.01 0.02 0.03 0.04
J(h/L) 2
1/E
' (m
m2/k
N)
GR-1GR-2GR-3GR-4
Kevlar/Epoxy
0.014
0.018
0.022
0.026
0.03
0 0.005 0.01 0.015 0.02 0.025
J(h/L) 2
1/E
' (m
m2/k
N)
K-1
K-2K-3
K-4
K-5
K-6
Figure 4: Plot of 1 / ′E versus J h L( / )2
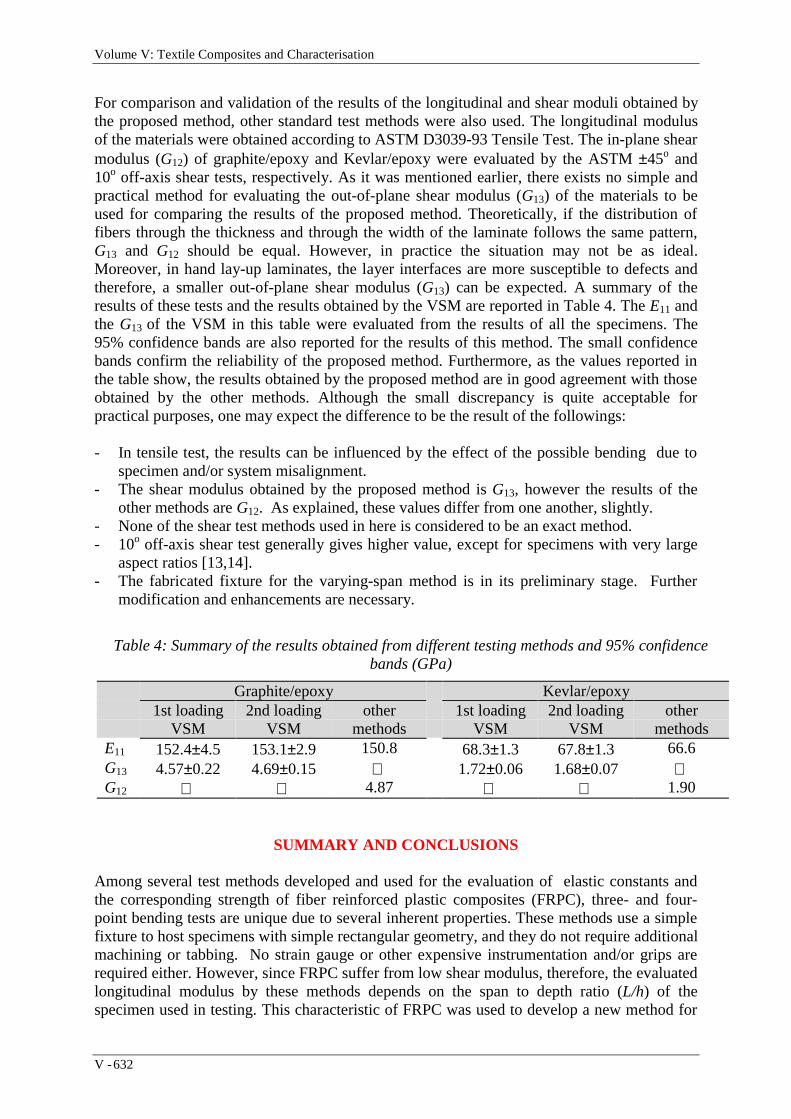
Volume V: Textile Composites and Characterisation
V - 632
For comparison and validation of the results of the longitudinal and shear moduli obtained bythe proposed method, other standard test methods were also used. The longitudinal modulusof the materials were obtained according to ASTM D3039-93 Tensile Test. The in-plane shearmodulus (G12) of graphite/epoxy and Kevlar/epoxy were evaluated by the ASTM ±45o and10o off-axis shear tests, respectively. As it was mentioned earlier, there exists no simple andpractical method for evaluating the out-of-plane shear modulus (G13) of the materials to beused for comparing the results of the proposed method. Theoretically, if the distribution offibers through the thickness and through the width of the laminate follows the same pattern,G13 and G12 should be equal. However, in practice the situation may not be as ideal.Moreover, in hand lay-up laminates, the layer interfaces are more susceptible to defects andtherefore, a smaller out-of-plane shear modulus (G13) can be expected. A summary of theresults of these tests and the results obtained by the VSM are reported in Table 4. The E11 andthe G13 of the VSM in this table were evaluated from the results of all the specimens. The95% confidence bands are also reported for the results of this method. The small confidencebands confirm the reliability of the proposed method. Furthermore, as the values reported inthe table show, the results obtained by the proposed method are in good agreement with thoseobtained by the other methods. Although the small discrepancy is quite acceptable forpractical purposes, one may expect the difference to be the result of the followings:
- In tensile test, the results can be influenced by the effect of the possible bending due tospecimen and/or system misalignment.
- The shear modulus obtained by the proposed method is G13, however the results of theother methods are G12. As explained, these values differ from one another, slightly.
- None of the shear test methods used in here is considered to be an exact method.- 10o off-axis shear test generally gives higher value, except for specimens with very large
aspect ratios [13,14].- The fabricated fixture for the varying-span method is in its preliminary stage. Further
modification and enhancements are necessary.
SUMMARY AND CONCLUSIONS
Among several test methods developed and used for the evaluation of elastic constants andthe corresponding strength of fiber reinforced plastic composites (FRPC), three- and four-point bending tests are unique due to several inherent properties. These methods use a simplefixture to host specimens with simple rectangular geometry, and they do not require additionalmachining or tabbing. No strain gauge or other expensive instrumentation and/or grips arerequired either. However, since FRPC suffer from low shear modulus, therefore, the evaluatedlongitudinal modulus by these methods depends on the span to depth ratio (L/h) of thespecimen used in testing. This characteristic of FRPC was used to develop a new method for
Table 4: Summary of the results obtained from different testing methods and 95% confidencebands (GPa)
Graphite/epoxy Kevlar/epoxy1st loading
VSM2nd loading
VSMother
methods1st loading
VSM2nd loading
VSMother
methodsE11 152.4±4.5 153.1±2.9 150.8 68.3±1.3 67.8±1.3 66.6G13 4.57±0.22 4.69±0.15 1.72±0.06 1.68±0.07 G12 4.87 1.90

Proceedings of ICCM–11, Gold Coast, Australia, 14th-18th July 1997
V - 633
simultaneous evaluation of their longitudinal and shear moduli. The proposed method usesspecimens with simple rectangular geometry and different spans, and therefore, the method isreferred to as “the varying span method” (VSM). This method was used to evaluate thelongitudinal and shear moduli of unidirectional 0o graphite/epoxy and 0o Kevlar/epoxy. Theeffect of different strain rate (for different L/h) that is inhered in this method was investigatedby performing tests under three different situations, with the results presented in Table 1. Noobvious dependency was observed between the obtained moduli, and the different situations.However, in general, the use of Eqn 10 which ensures a reasonable constant strain rate isrecommended. The 95% confidence band of the evaluated values along with the closeagreement of the results with those obtained by the other methods validate the integrity andthe reliability of the proposed method.
ACKNOWLEDGMENT
The work presented was supported by a scholarship of the Ministry of Culture and HigherEducation of Islamic Republic of Iran to the first author, and NSERC operating grant No.OGP0090736, awarded to the second author. The authors are grateful to these agencies.Acknowledgment is also due to Advanced Material Engineering Center (AMEC) forproviding us with the use of their facilities and raw materials. Special thanks goes to Mr.Mike Pineo for his assistance. TW Pultrusion Ltd. is also acknowledged for providing us withmaterial.
REFERENCES
1. Jalali, S.J. and Taheri, F., “A New Test Method for Measuring The Longitudinal andShear Moduli of Fiber Reinforced Composites,” Submitted for publication to J.Composite materials, 1997.
2. Zweben, C., Smith, W.S., and Wardle, M.W., “Test Methods for Fiber Tensile Strength,
Composite Flexural Modulus and Properties of Fabric-Reinforced Laminates,” CompositeMaterials: Testing and Design (Fifth Conference), ASTM STP 674, S.W. Tsai, Ed.,American Society for Testing and Materials, 1979, pp. 228-262.
3. Whitney, J.M., Browning, C.E. and Mair, A., “Analysis of The Flexural Test for
Laminated Composite Materials,” Composite Materials: Testing and Design (ThirdConference), ASTM STP 546, American Society for Testing and Materials, 1974, pp. 30-45.
4. Pagano, N.J. and Whitney, J.M., “Geometric Design of Composite Cylindrical
Characterization Specimens,” J. Composite Materials, Vol. 4, 1970, pp. 360-378. 5. Garcia, R., Weisshaar, T.A. and McWithey, R.R., “An Experimental and Analytical
Investigation of the Rail Shear-test Method as Applied to Composite Materials,”Experimental Mechanics, Vol. 20, 1980, pp. 273-279.
6. Chamis, C.C. and Sinclair, J.H. “Ten-deg Off-Axis Test for Shear Properties in Fiber
Composites,” Experimental Mechanics, Vol. 17, 1977, pp. 339-346.

Volume V: Textile Composites and Characterisation
V - 634
7. Rosen, B.W., “A Simple procedure for Experimental Determination of the LongitudinalShear Modulus of Unidirectional Composites,” J. Composite Materials, Vol. 6, 1972, pp.552-554.
8. Adams, D.F. and Walrath, D.E., “Current Status of the Iosipescu Shear Test Method,” J.
Composite Materials, Vol. 21, 1987 pp. 494-507. 9. Xie, M. and Adams, D.F., “Study of Three- and Four-Point Shear Testing of
Unidirectional Composite Materials,” Composites, Vol. 26, No. 9, 1995, pp. 653-659. 10. Lee, S. and Munro, M., “Evaluation of In-Plane Shear Test Methods for Advanced
Composite Materials by the Decision Analysis Technique,” Composites, Vol. 17, No. 1,1986, pp. 13-22.
11. Timoshenko, S.P. and Gere, J.M., Mechanics of Materials, 1972, Van Nostrand Reinhold
Company, New York. 12. Jalali, S.J. and Taheri, F., “An Analytical Solution for Cross-Ply Laminated Plates Under
Cylindrical Bending Based on Through-the-Thickness Inextensibility, Part I- Staticloading,” to be published, Int. J. Solids and Structures, 1997.
13. Pindera, M.-J. and Herakovich, C.T., “Shear Characterization of Unidirectional
Composites with the Off-Axis Tension Test,” Experimental Mechanics, Vol. 26, 1986, pp.103-112.
14. Pindera, M., Choksi, G., Hidde J.S. and Herakovich, C.T., “A Methodology for Accurate
Shear Characterization of Unidirectional Composites,” J. Composite Materials, Vol. 21,1987, pp. 1164-1184.
Proceedings of ICCM–11, Gold Coast, Australia, 14th-18th July 1997
V - 635
EXPERIMENTAL BEHAVIOR OF GRAPHITE-EPOXYPANELS WITH HOLES UNDER BIAXIAL
COMPRESSION AND SHEAR LOADS
Giulio Romeo and Giacomo Frulla
Department of Aerospace Engineering,Politecnico di Torino, Corso Duca degli Abruzzi 24, 10129 Torino, Italy
KEYWORDS: buckling, postbuckling, cutouts, plates, biaxial compression and shear

Volume V: Textile Composites and Characterisation
V - 636

Proceedings of ICCM–11, Gold Coast, Australia, 14th-18th July 1997
V - 637

Volume V: Textile Composites and Characterisation
V - 638
Proceedings of ICCM–11, Gold Coast, Australia, 14th-18th July 1997
V - 639

Volume V: Textile Composites and Characterisation
V - 640

Proceedings of ICCM–11, Gold Coast, Australia, 14th-18th July 1997
V - 641

Volume V: Textile Composites and Characterisation
V - 642

Proceedings of ICCM–11, Gold Coast, Australia, 14th-18th July 1997
V - 643
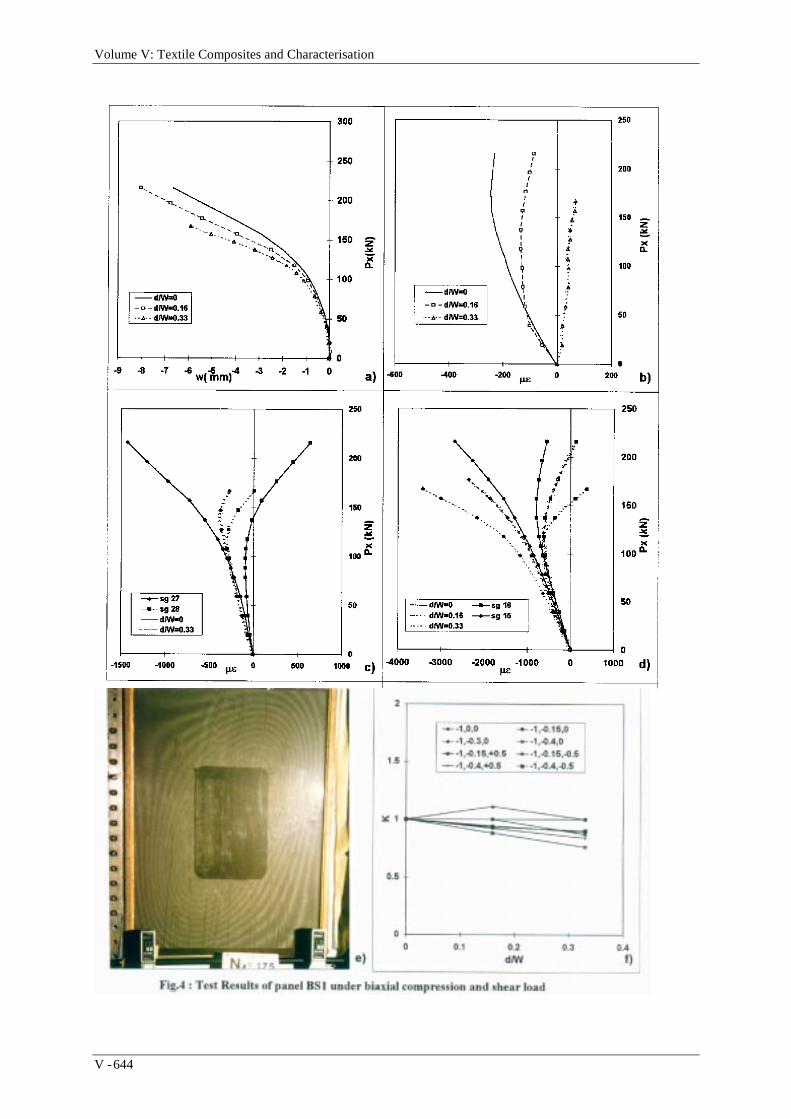
Volume V: Textile Composites and Characterisation
V - 644

Proceedings of ICCM–11, Gold Coast, Australia, 14th-18th July 1997
V - 645
INFLUENCE OF COOLING RATE ONMORPHOLOGICAL AND MECHANICAL
PROPERTIES OF THERMOPLASTIC COMPOSITES
Helen C. Y. Cartledge1, Caroline A. Baillie 2 and Yiu Wing Mai 1
1 Centre for Advanced Materials Technology, Department of Mechanical and MechatronicEngineering University of Sydney NSW 2006 Australia
2 Department of Materials, Imperial College of Science, Technology and MedicinePrince Consort Road, London SW7 2BP, UK
SUMMARY: The influence of cooling rate on the Morphology (crystallinity, phases,transcrystallization) and mechanical properties (transverse flexural tensile, shear strength andmodulus, Iosipescu shear strength) has been investigated for both thin films and bulkunidirectional commingled yarn GF/PA6 composites. Cooling condition from fast to slow, -60(C/min, -3(C/min and -1(C/min, were achieved at 1.5 MPa pressure. XRD and DSCtechniques were used to analyse the matrix morphology. SEM observation was used toexamine the fracture surfaces of the tested samples. The results indicate that a differentmorphology was found at each different cooling condition. When the cooling rate was shiftedfrom fast to slow, crystallinity and the ratio of α/γ phases were increased in the PA6 matrixassociated with enhanced transcrystallinity and interfacial bond. Consequently, themechanical properties such as tensile and shear strength and elastic modulus, were improved.
KEYWORDS: GF/PA6, cooling rate, crystallinity, α and γ phases, transcrystallinity,interfacial strength, tensile and shear strength, modulus
INTRODUCTION
The mechanical properties of semi-crystalline polymer composites depend on manymorphological factors including crystallinity and phases of the matrix and transcrystallinity ofthe interface, etc, which are determined by thermal processing. However, it is still unclearhow phases of the polymers effect the mechanical behaviour of the polymer composites andhow to control the morphologies during manufacturing.
The purpose of this study is to find optimum thermal processing condition for thermoplasticcomposites to enhance the mechanical properties of these composites. GF/PA6 is commonlyused in industrial applications and was selected for this study.
EXPERIMENTAL TECHNIQUE
Materials and Manufacture
Unidirectional GF/PA6 commingled yarn with an E-glass fibre weight fraction of 60%(Vf=40%) was supplied by Toyobo Co., Japan. The consolidating process of the composites

Volume V: Textile Composites and Characterisation
V - 646
was carried out at 245(C and 1.5 MPa pressure for 10 minutes by using a hydraulic loadinghot-press machine. To obtain the different microstructures in the composites, three differentcooling processes were conducted, cooled in cold water: -60(C/min, air: -3(C/min and cooledwith hot press: -1(C/min with 1.5 MPa pressure. The final dimension of the samples were 200mm X 200 mm X 4 mm.
Morphological Study
X-Ray Diffraction (XRD) and Differential Scanning Calorimetry (DSC) techniques were usedto examine the effect of cooling rate on the morphology of the PA6 matrix. The influence ofcooling rate on transcrystallization and microstructure of the GF/PA6 composite thin filmswas investigated using Polarised Optical Microscopy (POM).
Mechanical Testing
90( three point bending tests were performed according to ASTM 790M-92 to study theinfluence of cooling rate on the interfacial tensile strength and elastic modulus of thecomposites. The geometry of the specimens are 80 mm x 10 mm x 4 mm with the fibresperpendicular to the specimen length.
0( double V-notch specimens were used for Iosipescu tests according to ASTM D5379M-93to measure the interfacial shear strength of GF/PA6 subjected in the different cooling rates.The specimens were cut with fibres parallel to the longitudinal axis-0 degree from theGF/PA6 composite. The geometry of the specimens are 80 mm long, 20 mm wide and 4 mmthick. Two 90( angle notches were cut at the specimen midlength with faces oriented at +45(
and -45( to the longitudinal axis. The notches were introduced using a vertical millingmachine Pacific FTV-2S with a specially designed parallel fixture. Special care was taken touse optimum cutting rates. A freshly-sharpened cutting tool was used to minimise pre-testdamage and produce a sharp notch. The notch tip radius were about 120 µm.
To achieve a pure shear failure in the mid-length of the beam, the width between the twonotches tips was reduced to 3 mm instead of the 12 mm which is specified by the ASTMD5379M-93 standard. Both tests were carried out on an Instron 4302 machine at roomtemperature. SEM observation was used to examine the fracture surfaces of the testedsamples.
RESULTS AND DISCUSSION
Morphology
The results from XRD and DSC analysis indicated that crystallinity of the GF/PA6composites strongly depend on the cooling rates. Figure 1 shows the clear different intensitiesbetween the three different cooled GF/PA6 bulk samples in the XRD tests. The area under thesharp peaks represents the crystalline volume in the composites [5]. As it can be seen from theXRD chart, figure 1, that there are two peaks appearing in all of the three cooling ratessamples, α and γ phases.
In general, an orderly packed crystalline polymer has higher density than that of a loosely andrandom packed amorphous polymer. The more crystalline structure formed in the polymers,the more energy should be needed to damage the high density polymers.
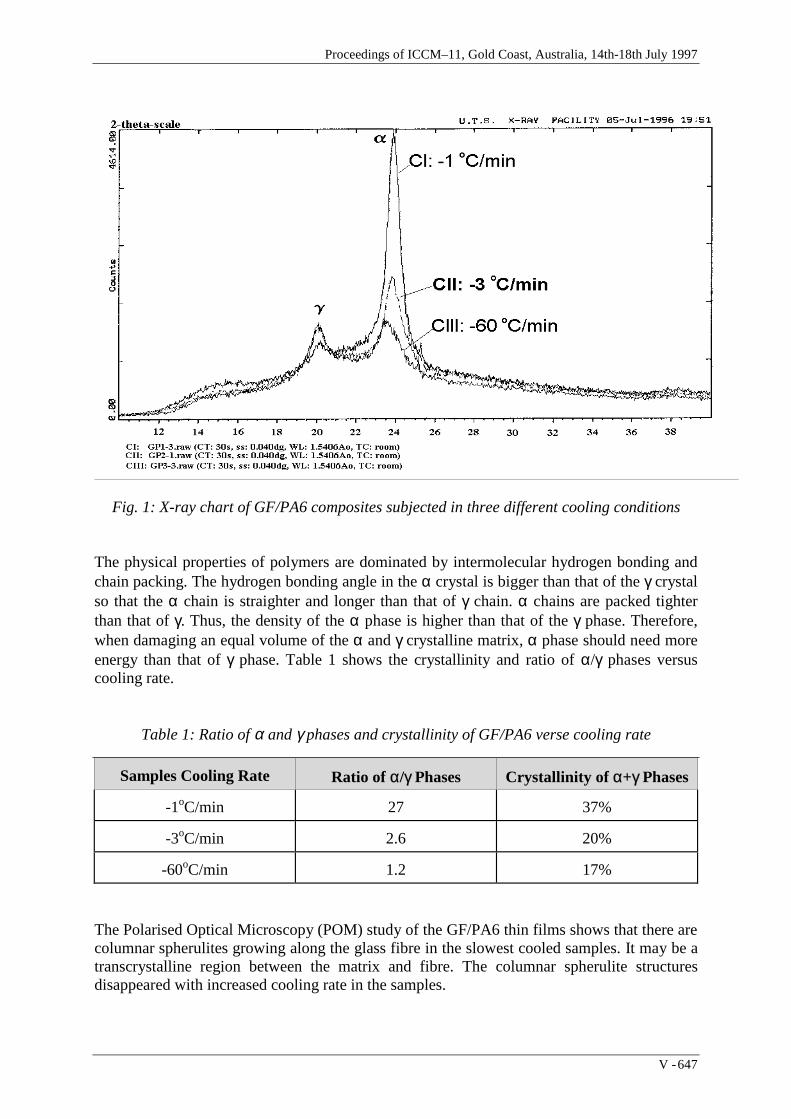
Proceedings of ICCM–11, Gold Coast, Australia, 14th-18th July 1997
V - 647
Fig. 1: X-ray chart of GF/PA6 composites subjected in three different cooling conditions
The physical properties of polymers are dominated by intermolecular hydrogen bonding andchain packing. The hydrogen bonding angle in the α crystal is bigger than that of the γ crystalso that the α chain is straighter and longer than that of γ chain. α chains are packed tighterthan that of γ. Thus, the density of the α phase is higher than that of the γ phase. Therefore,when damaging an equal volume of the α and γ crystalline matrix, α phase should need moreenergy than that of γ phase. Table 1 shows the crystallinity and ratio of α/γ phases versuscooling rate.
Table 1: Ratio of α and γ phases and crystallinity of GF/PA6 verse cooling rate
Samples Cooling Rate Ratio of α/γ Phases Crystallinity of α+γ Phases
-1oC/min 27 37%
-3oC/min 2.6 20%
-60oC/min 1.2 17%
The Polarised Optical Microscopy (POM) study of the GF/PA6 thin films shows that there arecolumnar spherulites growing along the glass fibre in the slowest cooled samples. It may be atranscrystalline region between the matrix and fibre. The columnar spherulite structuresdisappeared with increased cooling rate in the samples.

Volume V: Textile Composites and Characterisation
V - 648
Mechanical Properties
Returning now to the mechanical tests. It can be seen that the tensile and shear strengths ofthe GF/PA6 composites are dramatically affected by the cooling rate. The flexural elasticmodulus are effected as well. In table 2 it is shown that reducing the cooling rate lead toenhancing the strengths and modulus.
Table 2: The flexural maximum tensile strength and modulus versus cooling rate in 90( threepoint bending test, ultimate failure shear strength versus cooling rate in 0( Iosipescu tests.
Samples coolingrate
Flexural Testσmax (MPa)
Iosipescu Testτult (MPa)
Flexural TestE (GPa)
-1oC/min 42.89 120 4.3
-3oC/min 33.79 91 3.5
-60oC/min 25.58 79 2.4
The maximum tensile stress, σmax, obtained from 90( flexural test reflects the tensile strengthof the interfacial bonding. The ultimate shear stress, τult which was obtained from 0(Iosipescu test, occurs at the midlength of the specimen and between the two notch tips. Itreflects the shear strength of the GF/PA6 composite interfacial bonding. The modulus reflectsthe stiffness of PA6 matrix. Therefore, with increasing cooling rate interfacial bond in tensionand shear is reduced.
Effect of Morphology on Fracture Mechanisms
The SEM observations show that the rupture surfaces of the flexural and Iosipescu specimensoccur between the fibre and the matrix (see figs 2 and 3). Figure 2a and 2b show the fracturesurfaces of the GF/PA6 samples subjected in -1(C/min and -60(C/min, respectively, at thelowest point of the midspan in flexural test. Figure 3a and 3b show the fracture surfaces of theGF/PA6 samples subjected in -1(C/min and -60(C/min, respectively, in the midplane of themidspan in Iosipescu test.
It can be seen that there is matrix tears and interfacial debonding in the fracture surfaces.There is more resin adhering to the fibres for the slower cooling rate than that of fast cooling.Thus, it can be inferred that the interfacial strength is stronger for the slowest coolingsamples, verifying the previous results. It was also found in the SEM photos, figure 2a andfigure 3a, that there is a large amount of fibre breakage appearing in slowest cooled samples.It should be attributed to the strong interfacial bond transferring the force to the fibres.
A high crystallinity and large amount of α phase formed in the slow cooling samples, it givesthe matrix higher density and strength which contributes to the maximum tensile stress, σmax,and modulus in flexural tests. The slow cooling leads to the formation of a transcrystallinelayer which gives the composite strong interfacial bond and contributes to the ultimate shearstress, τult, in Iosipescu tests and maximum tensile stress, σmax, in flexural tests.

Proceedings of ICCM–11, Gold Coast, Australia, 14th-18th July 1997
V - 649
Fig. 2a: SEM photo of midspan lowest point fracture surface from flexural test, -1(C/mincooling rate sample
Fig. 2b: SEM photo of midspan lowest point fracture surface from flexural test, -60(C/mincooling rate sample

Volume V: Textile Composites and Characterisation
V - 650
Fig. 3a: SEM photo of midplane fracture surface from Iosipescu test, -1(C/min cooling ratesample
Fig. 3b: SEM photo of midplane fracture surface from Iosipescu test, -60(C/min cooling ratesample

Proceedings of ICCM–11, Gold Coast, Australia, 14th-18th July 1997
V - 651
CONCLUSIONS
The results obtained in this research lead to the following conclusions.1) The crystallinity of PA6 strongly depends on cooling rate during thermal processing.
Slow cooling leads to higher crystallinity and more α crystals formed than fastcooling. The increased α phase leads to higher density of PA6 matrix.
2) The transcrystallinity of GF/PA6 strongly depends on the cooling rate too. Slowcooling leads to the formation of a transcrystalline layer.
3) It is assumed that the high density matrix and strong interfacial bonding between fibreand matrix indicated by Iosipescu, flexural tests and SEM observation result in bettermechanical properties in the slow cooled GF/PA6 composite samples than that of fastcooled samples.
4) This is considered to be due to the slow cooling leads to 37% crystallinity and largeamount α phase formed in the PA6 matrix which give the composite a harder matrixand higher tensile strength than that of fast cooling. It also improves the interfacialbonding condition and gives the composite higher interfacial strength than that of fastcooling.
REFERENCES
1. D. S. Delkar and N. V. Bhat, “Investigation of structural and mechanical propertiesof copper-chloride-doped nylon-6 films”, Journal of Applied Polymer Science, 1991,v43, p191-200.
2. T. J. Bessell, D. Hull and J. B. Shortall, “The effect of polymerization conditions andcrystallinity on the mechanical properties and fracture of spherulitic nylon 6”,Journal of Materials Science, 1975, v10, p1127-1136.
3. M. L. Shiao, S. V. Nair, P.D. Garrett and R. E. Pollard, “Effect of glass-fibrereinforcement and annealing on microstructure and mechanical behaviour of nylon6.6”, Journal of Materials Science, 1994, v29, part I: p1973-1981, part II: p1739-1752.
4. I. Arvanitoyannis and E. Psomiadou, “Composites of anionic (Co)polyamides (nylon6/nylon 12) with short glass E-fibres. Preparation and Properties”, Journal of AppliedPolymer Science, 1994, v51, p1883-1899.
5. F. W. Billmeyer, JR., Textbook of Polymer Science, New York, A Wiley-IntersciencePublication, 1984.

Volume V: Textile Composites and Characterisation
V - 652
ANALYSIS OF INTERLAMINAR STRESSES IN ANINTERNALLY-DROPPED PLY REGION
Jaewook Rhim and Anthony J. Vizzini
Composites Research LaboratoryDepartment of Aerospace Engineering, University of Maryland,
College Park, Maryland 20742
KEYWORDS: taper, ply drop, discontinuity, interlaminar stresses, polynomial interpolation,finite elements

Proceedings of ICCM–11, Gold Coast, Australia, 14th-18th July 1997
V - 653

Volume V: Textile Composites and Characterisation
V - 654

Proceedings of ICCM–11, Gold Coast, Australia, 14th-18th July 1997
V - 655
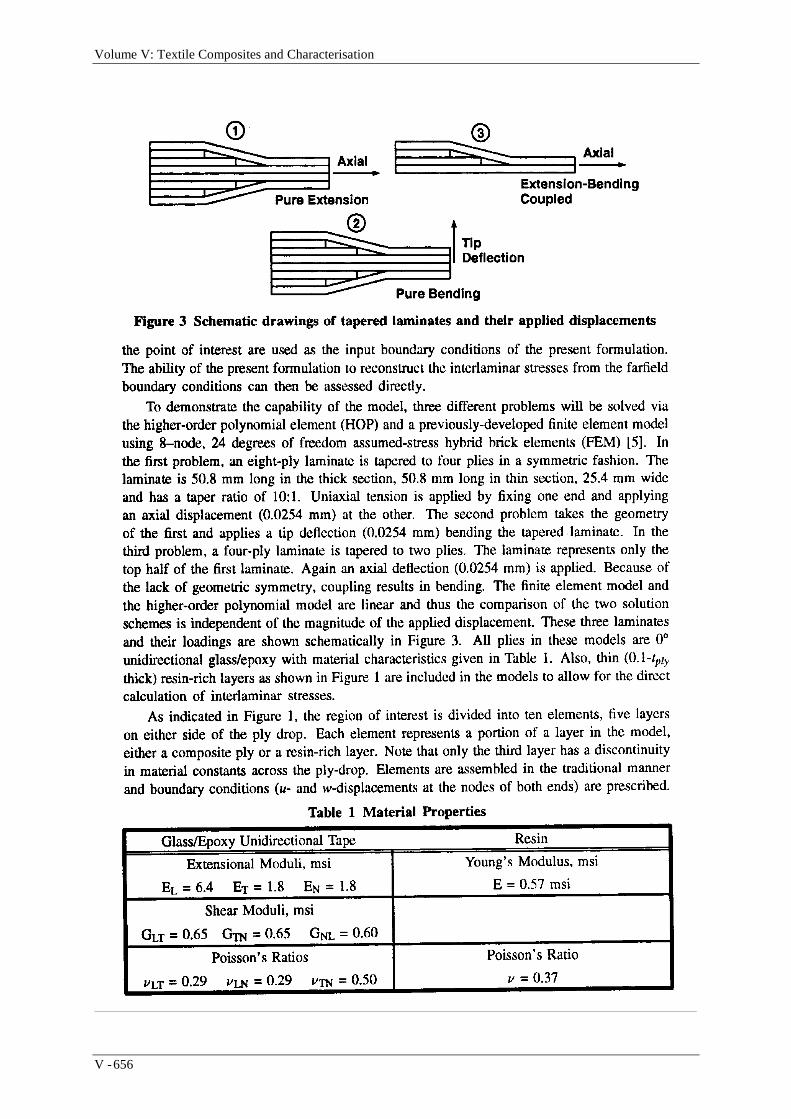
Volume V: Textile Composites and Characterisation
V - 656
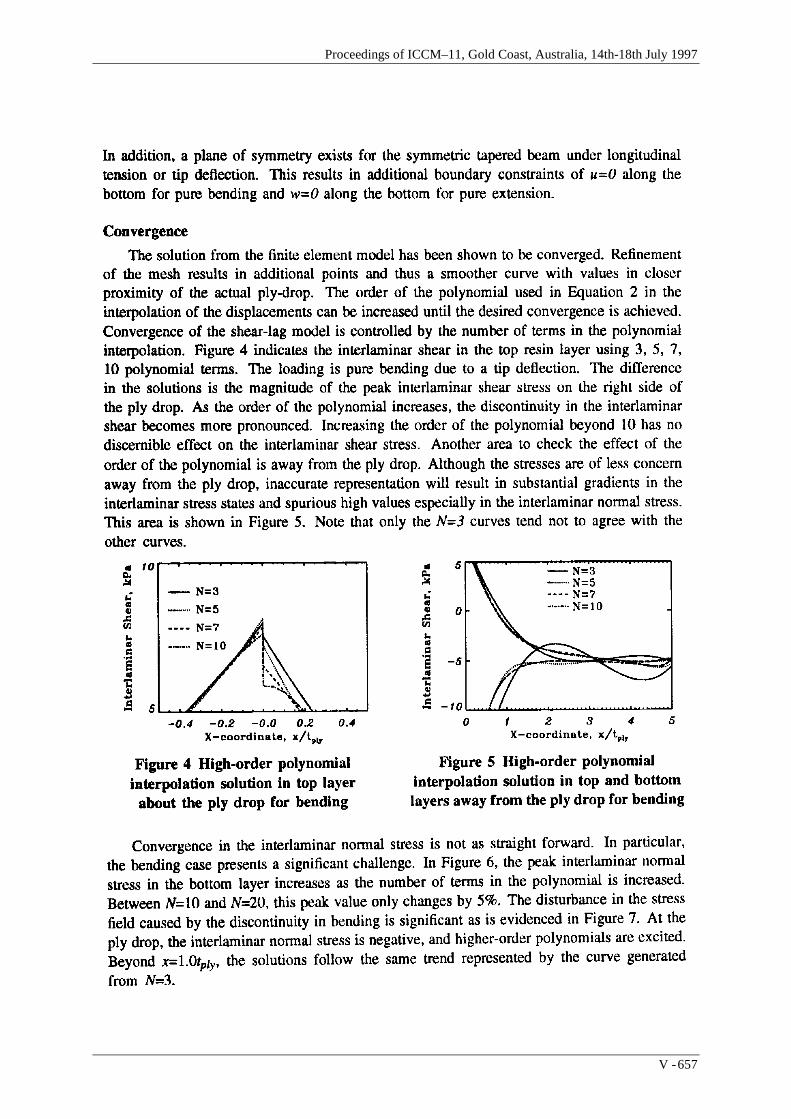
Proceedings of ICCM–11, Gold Coast, Australia, 14th-18th July 1997
V - 657
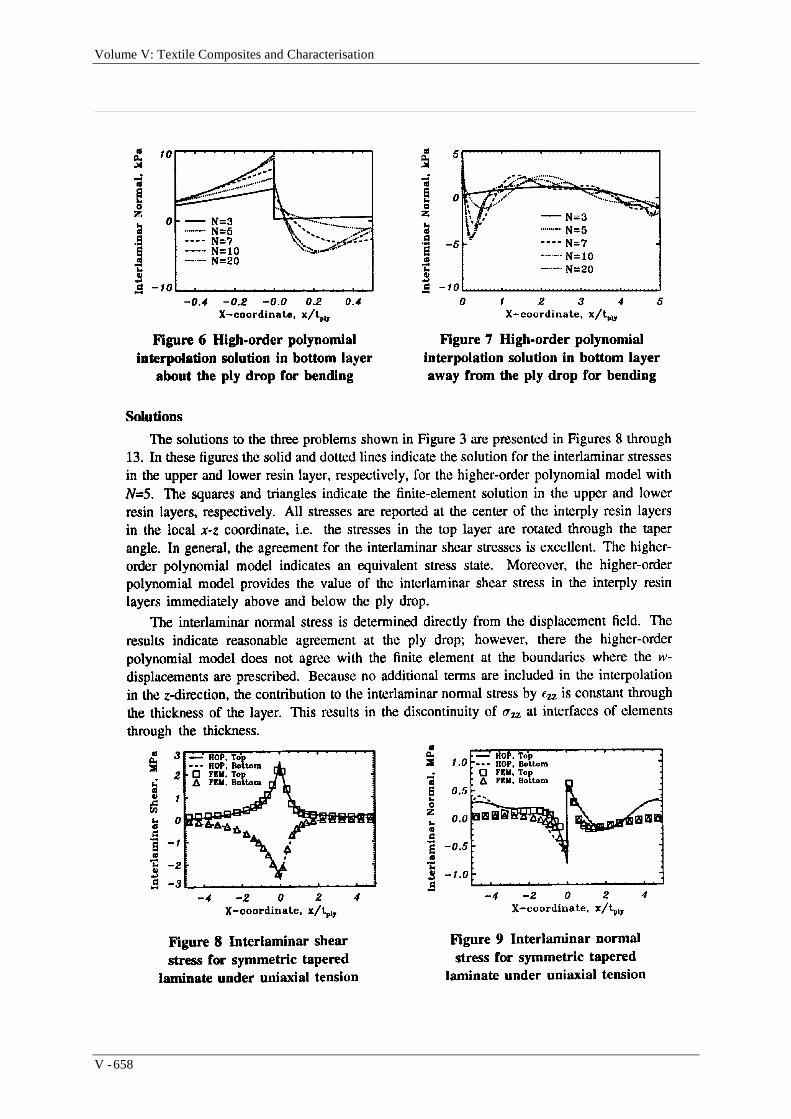
Volume V: Textile Composites and Characterisation
V - 658
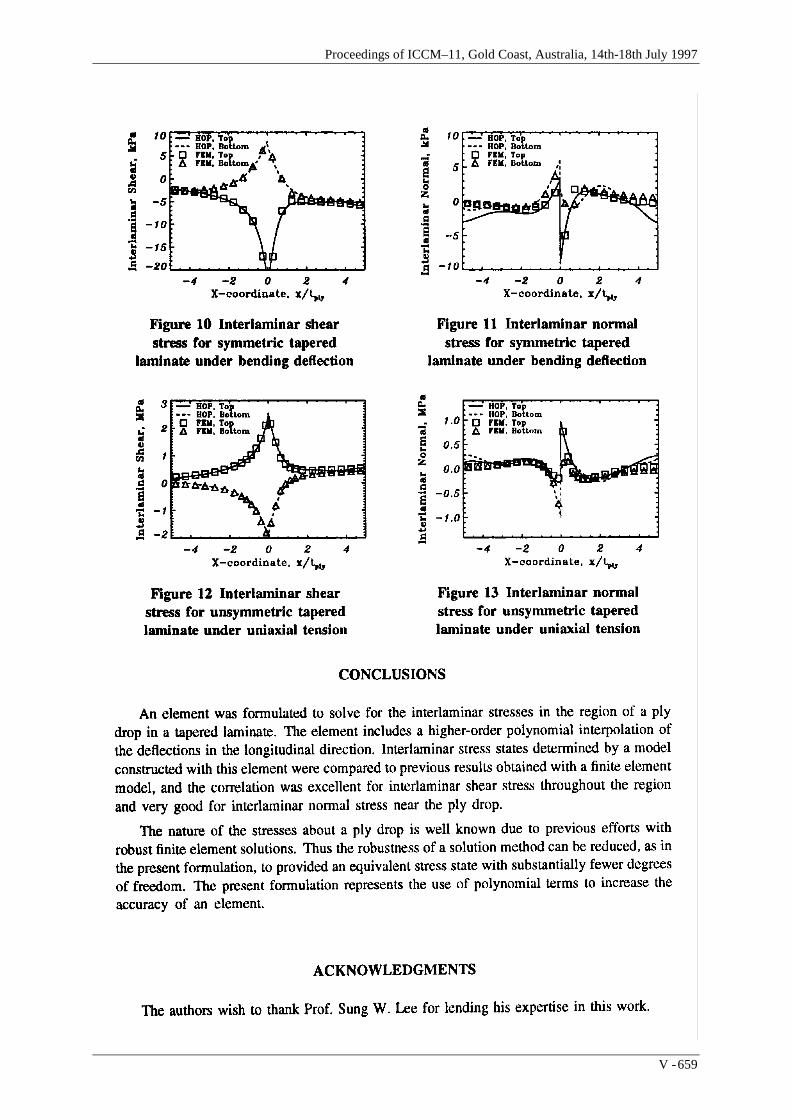
Proceedings of ICCM–11, Gold Coast, Australia, 14th-18th July 1997
V - 659

Volume V: Textile Composites and Characterisation
V - 660

Proceedings of ICCM–11, Gold Coast, Australia, 14th-18th July 1997
V - 661

Volume V: Textile Composites and Characterisation
V - 662
STRESS TRANSFER MECHANICS FOR MULTIPLEPLY LAMINATES FOR AXIAL LOADING AND
BENDING
L. N. McCartney and C. Pierse
Centre for Materials Measurement & Technology, National Physical Laboratory, Teddington, Middx. UK,TW11 OLW
KEYWORDS: laminates, stress transfer, bending, ply cracking, flexural modulus

Proceedings of ICCM–11, Gold Coast, Australia, 14th-18th July 1997
V - 663

Volume V: Textile Composites and Characterisation
V - 664

Proceedings of ICCM–11, Gold Coast, Australia, 14th-18th July 1997
V - 665

Volume V: Textile Composites and Characterisation
V - 666

Proceedings of ICCM–11, Gold Coast, Australia, 14th-18th July 1997
V - 667
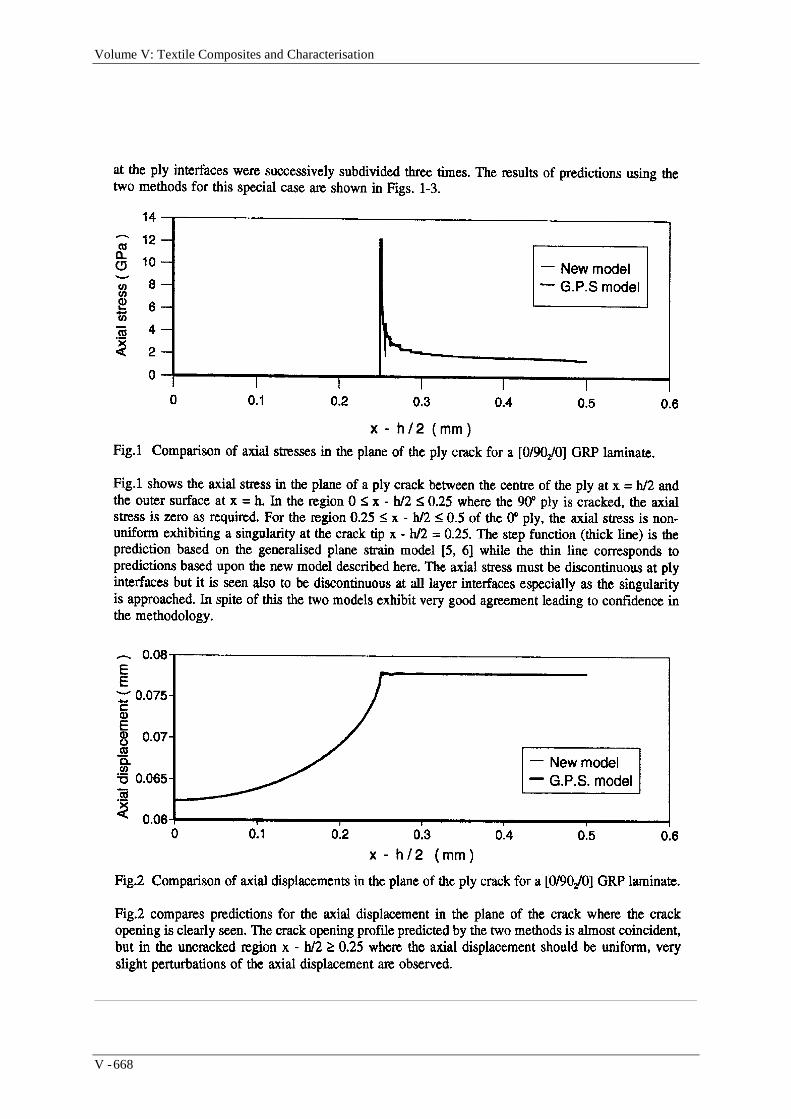
Volume V: Textile Composites and Characterisation
V - 668

Proceedings of ICCM–11, Gold Coast, Australia, 14th-18th July 1997
V - 669

Volume V: Textile Composites and Characterisation
V - 670

Proceedings of ICCM–11, Gold Coast, Australia, 14th-18th July 1997
V - 671

Volume V: Textile Composites and Characterisation
V - 672
COMPARISON OF FAILURE PREDICTIONMETHODS FOR GLASS/EPOXY AND CARBON/EPOXY LAMINATES UNDER BIAXIAL STRESS
M. J. Hinton1, P. D. Soden2 and A. S. Kaddour2
1 Structural Materials Centre, DRA, Fort Halstead, Sevenoaks, Kent, TN14 7BP, UK.2 Applied Mechanics Division, UMIST, Sackville Street, Manchester, M60 1QD, UK.
SUMMARY: A world wide exercise is currently underway to determine the current status ofmethods for predicting the strength of fibre composite laminates. The exercise is believed tobe unique in that it employs an identical set of test cases, input data and output parameters foreach theory evaluated, thus facilitating a direct comparison. Additionally, and mostimportantly, the predictions are being made by the originators of the theories. As part of theexercise, the originators were asked to predict the failure stresses and complete biaxial failureenvelopes for two specific laminate configurations, namely (±30/90) glass/epoxy and(0/±45/90) carbon/epoxy materials. This paper contains a comparison of the predicted failureenvelopes along with the input data provided to the contributors. The biaxial failureenvelopes are superimposed on top of each other and grouped in a convenient manner. Barcharts are also provided, at selected stress ratios, to simplify the comparison of strengthpredictions for each theory.
KEYWORDS: biaxial envelopes, failure theories, international exercise, glass, carbon/epoxy,comparative study
INTRODUCTION
The origin of the world wide ‘failure exercise’ can be traced to an ‘experts meeting’ held at StAlbans, England in 1991 on the subject of ‘Failure of Polymeric Composites and Structures:Mechanisms and Criteria for the Prediction of Performance’. The meeting was organised by theUK Institution of Mechanical Engineers together with the UK Engineering and PhysicalSciences Research Council, who invited expert delegates from many countries to attend. Themeeting took the form of a series of formal presentations interspersed with informal discussiongroups. One of the principal findings which emerged was the lack of faith in the failure criteria,in current use. Attendees concluded that there was a lack of evidence to show whether any of thecriteria could provide accurate and meaningful predictions of failure in composite components.
As a result of that meeting, an exercise was launched by Hinton and Soden in 1992 [1] todetermine the quality of the current methods for predicting failure in composite laminates. In theexercise, selected workers in the field, including leading academics and developers ofsoftware/numerical codes, were invited to submit papers to a strictly controlled format. A seriesof laminate configurations, load cases and input data were defined by the organisers. Test caseswere selected to challenge the theories to the full, embodying a wide range of parameters. Theseincluded fibre type (carbon and glass), matrix type (different epoxies) and the type of lay-up(unidirectional lamina and angle ply laminates, cross ply laminate, quasi-isotropic laminate and a

Proceedings of ICCM–11, Gold Coast, Australia, 14th-18th July 1997
V - 673
generally oriented laminate) and loading conditions which included uniaxial and biaxial tension,compression and shear and various combinations.
The exercise is being run in two phases:
Part A consists of papers submitted by the contributors who were asked to predict thestress/strain/strength response for each test case, having first provided a description of thetheory employed and commented on any strengths or weaknesses of the method. This is a‘blind’ test, as the authors have had no sight of any experimental data prior to making thepredictions. At the end of this phase, predictions from the authors can be compared andcontrasted against each other to identify where (or if) there is convergence or divergence.
Part B will be initiated by providing the contributors with the experimental data for each test casedefined in Part A. Authors will then be in a position to compare their predictions withexperimental evidence. They are then invited to provide a second paper, containingimprovements to their theories or other appropriate clarifications as to the applicability of thetheory or admissibility of the experimental evidence.
At the time of writing, Part A is nearing completion and Part B is about to start. In due course,Parts A and B will be published, in full, in the journal ‘Composites Science and Technology’.This paper contains an overview of Part A and a slice of the results.
BACKGROUND TO THE SELECTION OF THE PARTICIPANTS
Any attempt to represent the views of all of the groups working on failure theories, worldwide,would be an impossible task. Instead, theories containing distinctly differing analyticalapproaches were sought, to represent as wide a spectrum as possible. Following a comprehensivepublicity campaign in international journals, 38 leading exponents of certain theories wereapproached to participate in the exercise. For a variety of reasons, (lack of time being a commonone !) a number declined to take part. In the final outcome 11 groups agreed to take part, givingthe breadth and gravity required to ensure that a genuinely authentic exercise would result. Asummary of the participating groups is provided in Table 1. Selected works published by thesecontributors and/or their groups are listed in Refs [2-13].
INPUT DATA SUPPLIED TO THE PARTICIPANTS
For all the predictions, the authors were asked to use identical input data, so that the theoriescould be compared on a ‘level playing field’. This would also allow independent bodies to beable to attribute any differences between the outcomes of all predictions to inherent features inthe formulation of the contributors' theories. Therefore, all the contributors were supplied withidentical sets of properties (elastic constants, strengths, stress strain curves etc) for the laminatesanalyzed. Data was provided at the constituent fibre / matrix level and at the lamina level(Tables 2 to 4).

Volume V: Textile Composites and Characterisation
V - 674
Table 1: A summary of participants and approaches represented in the exercise.
Contributor Organisation Approach Represented
Chamis C C, Gotsis P Kand Minnetyan L
NASA Lewis, Cleveland, USA ICAN and CODSTRANmicromechanics basedsoftware.
Hart-Smith L J McDonnell Douglas, Longbeach, USA Generalised Tresca.
Hart-Smith L J McDonnell Douglas, Longbeach, USA Max Strain theory.
Eckold G C AEA Technology, UK Applying British Standardpressure vessel design codes.
Edge E C British Aerospace, Warton, UK British Aerospace (BAe) In-house design method.
McCartney L National Physical Laboratory, London, UK Physically based ‘DamageMechanics’.
Puck A and
Schurmann H
Technische Hochchule, Darmstadt, Germany Physically based 3-Dphenomenological models.
Wolfe W E and
Butalia T S
Department of Civil Engineering, Ohio StateUniversity, Columbus, Ohio.
Maximum strain energymethod, due to Sandhu(Wright Patterson Labs,Dayton, Ohio)
Sun C T and Tao J X Purdue University School of Aeronautics &Astronautics, West Lafayette, Indiana, USA.
Linear and non-linearanalysis (non-linear is FEbased plus a plasticitymodel).
Zinoviev P, Grigoriev SV, Labedeva O V andTairova L R
Institute of Composite Technologies, Orevo,Moskovkaya, Russia.
General application andmethods.
Tsai S W and
Liu K-S
Aeronautics and Astronautics Department,Stanford University, California, USA.
Interactive progressive
quadratic failure criterion .
Rotem A Faculty of Mechanical Engineering,Technion-Israel Institute of Technology,Haifa, Israel.
Interactive stress theory.
Table 2: Type of unidirectional laminae, fibres and matrices used in the analysis.
Matl Type Fibre Type Matrix Type (all Epoxies)
1 E-Glass fibres, 1200tex, Silenka MY750/ HY917/ DY063, Ciba Geigy
2 E-Glass fibres, 21xK43, Gevetex LY556/HT907/DY063, Ciba Geigy
3 T300 carbon fibres, Toray BSL914C, Ciba Geigy
4 AS4 carbon fibres, Hercules 3501-6, Hercules

Proceedings of ICCM–11, Gold Coast, Australia, 14th-18th July 1997
V - 675
Table 3: Mechanical properties of various unidirectional laminae.
Material 4 3 2 1
Vf % 60 60 62 60
E1 GPa 126* 138 53.48 45.6
E2 GPa 11 11 17.7 16.2
G12 GPa 6.6* 5.5* 5.83* 5.83*
υ12 0.28 0.28 0.278 0.278
υ23 0.4 0.4 0.4 0.4
XT MPa 1950** 1500 1140 1280
XC MPa 1480 900 570 800
YT MPa 48 27 35 40
YC MPa 200** 200 114 145**
S12 MPa 79** 80** 72** 73**
ε1T % 1.38 1.087 2.132 2.807
ε1C % 1.175 0.652 1.065 1.754
ε2T % 0.436 0.245 0.197 0.246
ε2C % 2.0 1.818 0.644 1.2
γ12u % 2 4 3.8 4
GIC J/m2 220 220 165 165
α1 10-6/(C -1 -1 8.6 8.6
α2 10-6/(C 26 26 26.4 26.4
Curing temperature (C 177 120 120 120
* Initial modulus, ** Nonlinear stress strain curves are provided.
Table 4: Mechanical properties of fibres.
Fibre type 4 3 2 1
Ef1 GPa 225 230 80 74
Ef2 GPa 15 15 80 74
Gf12 GPa 15 15 33.33 30.8
υf12 0.2 0.2 0.2 0.2
Gf23 7 7 33.33 30.8
XfT MPa 3350 2500 2150 2150
XfC MPa 2500 2000 1450 1450
εf1T % 1.488 1.086 2.687 2.905
εf1C % 1.111 0.869 1.813 1.959
αf1 10-6/(C -0.5 -0.7 4.9 4.9
αf2 10-6/(C 15 12 4.9 4.9

Volume V: Textile Composites and Characterisation
V - 676
The composite systems used in the test cases are listed in Table 5. It should be noted that theE-glass fibres were treated as being isotropic whereas the carbon fibres were treated as beinganisotropic.
Table 5: Mechanical properties of various matrices.
Matrix type 4 3 2 1
Em GPa 4.2 4.0 3.35 3.35
Gm GPa 1.567 1.481 1.24 1.24
υm 0.34 0.35 0.35 0.35
YmT MPa 69 75 80 80
YmC MPa 250 150 120 120
Sm MPa 50 70 - -
εmT % 1.7 4 5 5
αm 10-6/(C 45 55 58 58
In order to exercise the theories thoroughly, several laminate configurations and loadcombinations were chosen. These are referred to as the ‘test cases’ and are outlined in Table6.
Table 6: Details of the laminates and loading conditions used by the participants.
Laminate Configuration MaterialType
Loading (a wide range of biaxial stress ratiosunless other wise indicated)
(0) unidirectional lamina 2 (GRP) σy-τxy failure envelope
(0) unidirectional lamina 3 (CFRP) σx-τxy failure envelope
(0) unidirectional lamina 3 (CFRP) σx-σy failure envelope
(0/90)s cross ply laminate 1 (GRP) Uniaxial tension, SR=1/0
(±45)s angle ply laminate 1 (GRP) SR=1/1 and 1/-1
(±55)s angle ply laminate 1 (GRP) σx-σy failure envelope and SR=1/0 and 2/1
(90/±30)s laminate 2 (GRP) σx-σy failure envelope
(90/±30)s laminate 2 (GRP) σx-τxy failure envelope
(0/±45/90)s quasi-isotropic laminate 4 (CFRP) σx-σy failure envelope and SR=1/0 and 2/1
THEORETICAL RESULTS
Having described the overall scope of the failure exercise in the preceding paragraphs, a slice ofthe data, emerging from Part A, is presented below. In order to avoid prejudicing the ethos of theoverall exercise, for the purposes of this ‘advanced’ paper the data is presented without specificreference to the originating author (readers will need to wait until Part A is published, in full, forthis information). Though this reduces the impact somewhat, a number of very useful lessons canbe drawn from the information. The theories used by their originators are referred to as A , B, C,D, E,.... and M. (It is worth mentioning that two contributors have used more than one theory in
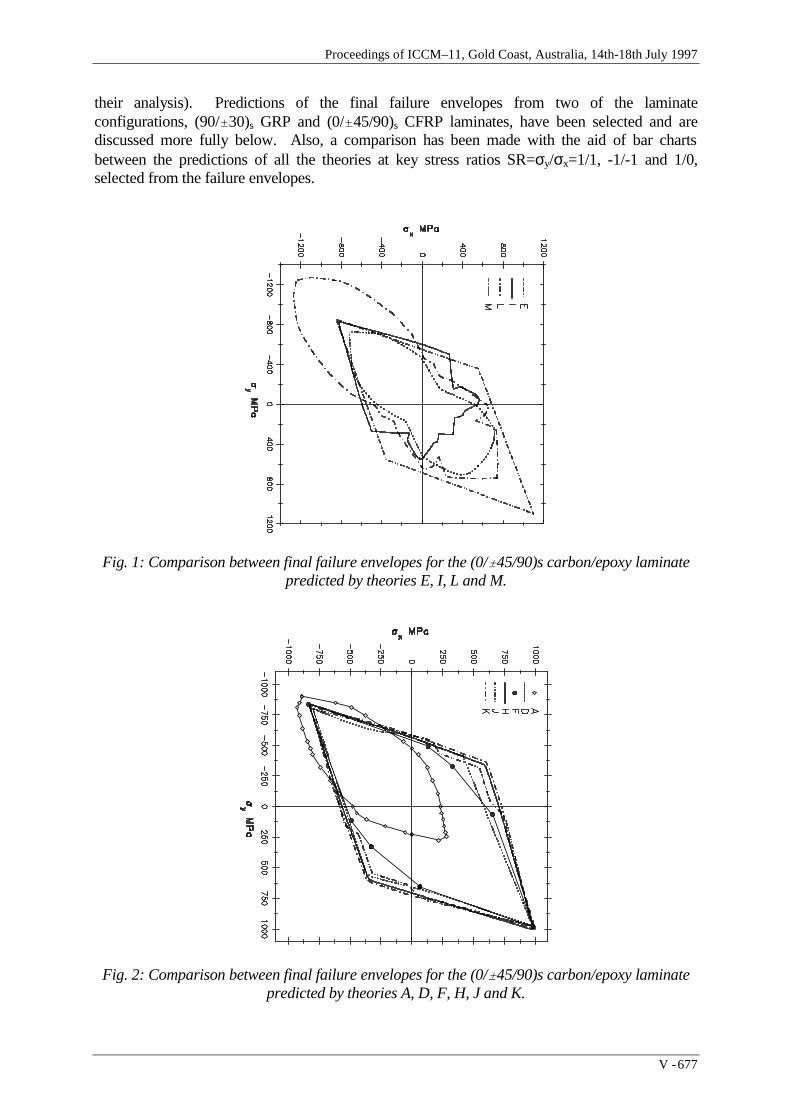
Proceedings of ICCM–11, Gold Coast, Australia, 14th-18th July 1997
V - 677
their analysis). Predictions of the final failure envelopes from two of the laminateconfigurations, (90/30)s GRP and (0/45/90)s CFRP laminates, have been selected and arediscussed more fully below. Also, a comparison has been made with the aid of bar chartsbetween the predictions of all the theories at key stress ratios SR=σy/σx=1/1, -1/-1 and 1/0,selected from the failure envelopes.
Fig. 1: Comparison between final failure envelopes for the (0/45/90)s carbon/epoxy laminatepredicted by theories E, I, L and M.
Fig. 2: Comparison between final failure envelopes for the (0/45/90)s carbon/epoxy laminatepredicted by theories A, D, F, H, J and K.

Volume V: Textile Composites and Characterisation
V - 678
AS4/3501-6, (0/45/90)s Quasi-Isotropic Carbon/Epoxy
Figs 1 to 2 show the final failure envelopes predicted by different contributors for thisconfiguration. The envelopes are superimposed in order to observe the general differencesbetween the various predictions. Figs 3-5 concentrate on comparing the predicted strengths atspecified stress ratios. For this purpose, bar-charts are presented showing ‘initial’ and ‘final’strengths (where appropriate) at biaxial stress ratios of SR=σy/σx=1/1, -1/-1 and 1/0, selectedfrom the failure envelopes.
Fig. 3: Initial and final failure stresses predicted by various theories (A-M) for (0/45/90)slaminate at SR=1/0.
Fig. 4: Initial and final failure stresses predicted by various theories (A-M) for (0/45/90)slaminate at SR=1/1.
Fig. 5: Initial and final failure stresses predicted by various theories for (0/45/90)s laminate at SR=-1/-1.

Proceedings of ICCM–11, Gold Coast, Australia, 14th-18th July 1997
V - 679
The most immediate impression one gets from Figs 1 and 2 is that the predictions fall broadlyinto two camps. In the first, one can see that theories (D, E, F, H, J and K) predict failureenvelopes which are nearly identical in shape and in magnitude. However, in the second, eachtheory predicts an envelope which is unique in shape and in magnitude (A, I, L, M). Indeed thereare no common features at all. A more detailed insight can be gained through examination ofFigs 3-5. At the extremes of prediction (ie lowest prediction compared with highest prediction),the differences between the theories are more than 400% at a stress ratio of 1/1 (Fig 4, between Iand E), more than 300% at 1/0 (Fig 3, between A and K) and more than 50% at -1/-1 (Fig 5,between L and M) for the final failure stresses. For the initial failure, the differences between thetheories are more than 30 fold at SR=1/1 (Fig 4, between E and D), 20 fold at SR=1/0 (Fig 3,between E and D) and just over 70% at SR=-1/-1 (Fig 5, between L and M).
It is noted that all the theories predicted the initial failure load to be the same as the final failureunder SR=-1/-1.
E-glass/LY556, (90 /30 )s glass/epoxy
Fig. 6: Biaxial final failure envelopes for (90/30) laminate predicted bytheories A,C, D, E, K and M.
Fig. 7: Biaxial final failure envelopes for (90/30) laminate predicted by theories B, F, H, I, J and L.

Volume V: Textile Composites and Characterisation
V - 680
Figs 6 to 7 show the final failure envelopes predicted by different contributors for thisconfiguration. As above, the envelopes are superimposed in order to observe the generaldifferences between the various predictions. Figs 8-10 concentrate on comparing the predictedstrengths at specified stress ratios. For this purpose, bar-charts are presented showing ‘initial’and ‘final’ strengths (where appropriate) at biaxial ratios of SR=1/1, -1/-1 and 1/0.
The final failure envelopes of theories C, D, E and K (Fig 6) and F, H and J (Fig 7) are similar inshape in most parts of the stress space while theories A and M (Fig 6) and B, I and L (Fig 7) donot have many common features.
Fig. 8: Predicted initial and failure stresses versus theory label for (90/30)Glass/epoxy laminate under SR=1/0.
Fig. 9: Predicted initial and failure stresses versus theory label for (90/30)Glass/epoxy laminate under SR=1/1.
Fig. 10: Predicted initial and failure stresses versus theory label for (90/30)glass/epoxy laminate under SR=-1/-1.

Proceedings of ICCM–11, Gold Coast, Australia, 14th-18th July 1997
V - 681
Comparisons between the final failure stresses show that at the extremes of prediction (i.e. thelowest prediction compared with the highest prediction), the differences between the theories are10 fold at SR=1/0 (Fig 8, between A and D), more than 8 fold at SR=1/1 (Fig 9, between A andE) and just above 50% at SR=-1/-1 (Fig 10, between H and L). Larger differences were noticedin the prediction of the initial failure strengths where the differences reached 33 fold for SR=1/1(Fig 9, between E and B), 12 fold at SR=1/0 (Fig 8, between F and B) and about 4 fold at SR=-1/-1 (Fig 10, between E and C).
CONCLUSIONS
1. Leading failure theories, currently available, have been identified as part of a world wideexercise to determine the current status of methods for predicting the strength of fibrecomposite laminates.
2. The comparison between various theories is highlighting, on one hand, the richness of thetheoretical understanding of the mechanics of composite materials and, on the other hand, thelarge diversity in the predictive accuracy of the existing theories.
3. In this paper, the leading theories have been employed, by their originators, to predict theresponse of two laminate configurations ((90 /30 )s glass/epoxy, and (0/45/90) quasi-isotropic carbon/epoxy laminates) when subjected to in-plane biaxial loading. The resultsshow dramatic differences in predicted strengths, depending on the theory used. Differences(lowest to highest) in the final strengths as great as 400% have been demonstrated, even forwhat is often assumed to be a well understood situation, a quasi-isotropic laminate.
4. The widely diverging predictions are a clear indication that this theoretical area is far frommature and is in need of a concerted action to set it on a firmer footing. The alternative fordesigners will be to continue to rely on a ‘make and test’ philosophy, which is rapidlybeginning to price composite materials / structures out of certain markets.
5. This paper contains a slice of that data from a world wide failure exercise. It is hoped that,once completed, the exercise will help contribute to an improved understanding within thecomposites community.
REFERENCES
1. Hinton M J and Soden P D,“Failure criteria for composite laminates”, Composite Scienceand Technology, V22, pp 121-122, 1991.
2. Sun C T and Chen J L, “A simple flow rule for characterising non linear behaviour of fibrecomposites”, Journal of Composite Materials, V23, pp1009-1020, 1989.
3. Rotem A and Nelson H G, “Fatigue behaviour of graphite epoxy laminate at elevatedtemperatures”, ASTM, STP 723, pp152-173, 1981.
4. Tsai S W , Theory of Composite Design, Think Composites, Palo Alto, 1992
5. Puck A, “Failure criteria for highly stresses fibre plastics composites which met requirementsof design practice”, Kunststoffe, V82, pp34-38, 1992.
6. Edge E C, Final report, BAe report SOR (177) October 1987, with addendum 1, Feb 1989.

Volume V: Textile Composites and Characterisation
V - 682
7. Sandhu R S, “Nonlinear analysis of unidirectional and angle ply laminates”, Journal ofAircraft, V13, pp104-111, 1976.
8. Alfutov N A and Zinoviev P A, “Deformation and failure of fibrous composites with brittlepolymeric matrix under plane stress”, in Mechanics of Composites, ( I.F. Obraztsov and V VVasiliev, eds.), Moscow MIR publishers, 1982.
9. Murthy D L N and Chamis C C, “ICAN, Integrated Composite analyzer users andprogrammers manual”, NASA-TP-2515, 1985.
10. McCartney L N, “Theory of stress transfer in 0-90-0 cross ply laminate containing a parallelarray of transverse cracks”, Journal of Mechanics and Physics of Solids, V40, P27-68, 1992.
11. Hart-Smith L J,“The truncated maximum strain composite failure model”, Composites, V24,P587-591, 1993.
12. Hart-Smith L J, “Predicting the strength of fibrous composites by an orthotropicgeneralisation of the maximum-shear-stress (Tresca) condition”, Proc. I Mech Eng, Part G,Journal Of Aerospace Engineering, V208, pp9-18, 1994.
13. Eckold G C, “ A design method for filament wound GRP vessels and pipework”,Composites, V16, pp 41-47, 1985
Proceedings of ICCM–11, Gold Coast, Australia, 14th-18th July 1997
V - 683
COMPRESSIVE FAILURE UNDER FLEXURALLOADING: EFFECTS OF SPECIMEN SIZE, STRAIN
GRADIENT AND FIBRE WAVINESS
Michael R. Wisnom
University of Bristol, Department of Aerospace Engineering,University Walk, Bristol B28 ITR, U.K.,
KEYWORDS: compressive failure, flexural loading, strain gradient, size effects, shear instability, microbuckling, fibre waviness

Volume V: Textile Composites and Characterisation
V - 684

Proceedings of ICCM–11, Gold Coast, Australia, 14th-18th July 1997
V - 685

Volume V: Textile Composites and Characterisation
V - 686

Proceedings of ICCM–11, Gold Coast, Australia, 14th-18th July 1997
V - 687

Volume V: Textile Composites and Characterisation
V - 688

Proceedings of ICCM–11, Gold Coast, Australia, 14th-18th July 1997
V - 689

Volume V: Textile Composites and Characterisation
V - 690

Proceedings of ICCM–11, Gold Coast, Australia, 14th-18th July 1997
V - 691

Volume V: Textile Composites and Characterisation
V - 692

Proceedings of ICCM–11, Gold Coast, Australia, 14th-18th July 1997
V - 693
HIGH STRAIN RATE MECHANICAL PROPERTIESOF A TOROSPHERICAL SHELL COMPOSED OF
IM7/E7T1-2 GRAPHITE EPOXY COMPOSITE
Alexander T. Dee1, Jack R. Vinson1 and George Leon2
1 Department of Mechanical Engineering, University of Delaware.2 Electric Boat Division, General Dynamics, Groton, Connecticut.
SUMMARY: Polymer matrix composites offer excellent mechanical properties such as highspecific strength and stiffness, making them attractive for applications in several naval,aerospace, automotive, and recreational-sports structural components. Although manycomposite materials are selected for applications where high strain rate loading is probable,little is known of their responses to shock loading. Mechanical properties can varysignificantly with strain rate. Therefore, the use of static properties in the analysis and designof structures which undergo dynamic loading may unfortunately lead to very conservative,overweight designs or lead to designs which fail prematurely and unexpectedly. The use ofdynamic material properties ensures that designs are optimized for structural integrity andweight efficiency when subjected to dynamic loading.
In this study, a Split Hopkinson Pressure Bar is used to obtain high-strain-rate, compressivemechanical properties of a 48 inch diameter, quasi-isotropic, torospherical shell composed ofIM7/E7T1-2 graphite epoxy composite. The shell is part of an external, pressure-proofstorage module which is attached to a submersible vehicle and designed to support equipmentinternally at atmospheric pressure. In combat situations, this structure may be exposed tounderwater explosions, therefore warranting the need for dynamic material properties. For in-plane and out-of-plane directions, the yield strength, yield strain, ultimate strength, ultimatestrain, and modulus of elasticity are presented for strain rates varying from 381 sec-1 to 1154sec-1. The data from the 49 dynamic tests are statistically analyzed, represented by equations,compared to quasi-static material properties, and discussed in some detail.
KEYWORDS: high-strain-rate, IM7/E7T1-2, Split Hopkinson Pressure Bar.
INTRODUCTION
The Split Hopkinson Pressure Bar facility at the University of Delaware is described Ref. 1.Impact is initiated by releasing nitrogen gas from a pressurized chamber which causes thespecimen to be compressed between the two bars. The striker bar is displaced on Teflon ringsthrough the barrel where it strikes the incident bar (bar 1). The velocity of the striker bar, Vsb,just prior to impact is measured using two infrared beams set four inches apart.
Upon impact with the striker bar, the incident bar receives an elastic compressive strain wavewith a wave velocity CB and a wave shape εI(t) and is displaced along its length axis. This baris guided by Teflon bearings which are bolted to a steel I-beam and secured on a reinforcedconcrete base to minimize any vibration. When the wave reaches the bar 1-specimeninterface, a portion of the incident wave is reflected back into bar 1 as a tensile wave with a

Volume V: Textile Composites and Characterisation
V - 694
wave shape εR(t). The remaining portion is transmitted into the specimen as a compressivewave. The wave transmitted into the specimen travels through the specimen and reaches thespecimen-bar 2 interface, where a portion of the wave is reflected back into the specimen.The remaining portion is transmitted into bar 2 as a compressive wave with a wave shapeεT(t). Bar 2 is displaced similarly to bar 1, but is arrested after the test by a simple dash pot.
Because the specimen length is short compared to the bar lengths, the initial stress wave in thespecimen undergoes numerous internal reflections during the test. It is calculated that theinitial wave duration in a typical specimen is approximately two microseconds. Within acomposite material specimen, there may be differences in the wave speed in the fiber andmatrix materials. However, if a minimum of four wave reflections within the specimen isachieved prior to specimen failure, the stress distribution along the specimen length issmoothed out and the specimen is assumed to be in a uniform state of stress at any instant[2,3]. At the University of Delaware SHPB, the wave pulse time window (defined as the timeit takes a wave to travel the length of the striker bar and back) is approximately 290microseconds. Thus, to record information accurately at specimen failure, the specimen mustfail within 290 microseconds after the start of the test and also after a time such that fourinternal reflections in the specimen has been achieved.
Strain gages are mounted on bars 1 and 2 equidistant from the specimen interfaces and areconnected to an oscilloscope. The oscilloscope records and stores the output from the straingages. Using this data, the stress and strain versus time of the specimen during the test can becalculated for the strain rate of that particular test.
MATERIAL DESCRIPTION
The shell is made of IM7/E7T1-2 (rubber toughened) with the following quasi-isotropic lay-up: [45/135/902/45/135/02/45/135/905[45/135/08/45/135/908]545/135/05/45/135]s. A sectionof the torospherical shell was provided by the Electric Boat Division of General Dynamics.
SPECIMEN PREPARATION
Compression specimens in the shape of right circular cylinders (1/4 inches in diameter and3/8 inches in length) were machined from the shell and prepared for testing by the seniorauthor. Care was taken to machine samples which displayed minimal visible effects of theinherent shell curvature. However, the effects of the curvature are expected to give somevariation in the results. Another source of error is due to the stacking sequence coupled withthe small diameter of each test sample. Since core drilling was done at random locations inthe through-thickness, specimens are expected to have slightly different stacking sequences.
TEST RESULTS
Since the laminate lay-up is such that the shell is quasi-isotropic, the 1-direction refers to anyin-plane direction, while the 3-direction denotes the through-thickness direction perpendicularto the fibers. For completeness, all the data from the 24 tests in the 1-direction and the 25tests in the 3-direction are presented in Tables 1 and 2. Quasi-static tests were performed onan Instron universal machine at a strain rate of 0.05 inches/second. Quasi-static strength datafor the shell material is provided in Table 5. These data will allow other researchers to studyand analyze the tests independently. These data are then presented statistically in Tables 3, 4,and 6 which provide mean values and standard deviations.
Proceedings of ICCM–11, Gold Coast, Australia, 14th-18th July 1997
V - 695
STATISTICAL ANALYSIS, RESULTS, AND DISCUSSION
It is interesting to see that with the complexities of these high strain rate tests, and the smallsample sizes, how small the coefficient of variance (COV), (i.e. the ratio of standard deviationto mean value, given as a percentage), is for the various mechanical properties as shown inTable 7. The highest COV value is 35.8% (on a modulus of elasticity) while the lowest COVis 2.1% (on a yield strength).
To analyze the trends from Tables 3, 4, and 6, it is important to define significant differences.For the present purpose, a quantity P is said to be significantly different from Q if the meanvalue of P falls outside the region of the mean ± 3 standard deviations of Q. The ± 3 standarddeviations are plotted as error bars for each relevant dynamic material property in Figures 1-5as a visual means of determining significant differences.
From Table 3, it is seen that there is little significant difference in the range of strain rates forthe 1-direction. Only the strain rates of groups D and E are significantly different from thegroup A strain rate. Failure of the specimens was achieved at each strain rate. Yielding wasnot found in the 1-direction except at the low strain rate. Therefore, in the strain rate rangebetween 381.1 sec-1 and 457.1 sec-1, a transition from ductile to brittle behavior must occur.This trend from ductile behavior to brittle behavior has been noticed in other polymer matrixcomposite materials. Concerning ultimate strength, Figure 1 shows that these values do notdiffer significantly with strain rate. Ultimate strain values show that group D is significantlydifferent to group C, and that group E is significantly different to groups B and C (Figure 2).Modulus of elasticity values show little dependence on strain rate. Only the group A modulusof elasticity is significantly different from the other groups (Figure 5).
From Table 4, strain rates in the 3-direction are generally significantly different except thatgroups F, G, H, and J are not significantly different from group I, and Group I is notsignificantly different from group J. Yielding was found in the 3-direction for all strain rates,and yield strength values show an increasing trend with strain rate. Yield strength values ofgroups F and G are significantly different from the other groups with the exception of groupH, and groups H and J are only significantly different from group F. Group I is onlysignificantly different from groups F and J (Figure 3b). Yield strain values show anincreasing trend with strain rate but have little significant difference among the groups. Onlythe yield strain of group F is significantly different from the other groups (Figure 4). Ultimatestrength, ultimate strain, and modulus of elasticity all show no strain rate dependence (Figures3a, 4, and 5, respectively).
It is seen that significant differences are prevalent when comparing dynamic materialproperties to the quasi-static material properties in Table 6. The quasi-static ultimate strengthvalue in the 1-direction is significantly different only from groups C and E. However, theultimate strength value of groups A-E are all significantly different from the quasi-staticvalue. For the 3-direction, the ultimate strength quasi-static value shows a significantdifference only to group F. However, the ultimate strength value of groups F-J are allsignificantly different from the quasi-static value. Yielding was not present in quasi-statictests for either the 1 nor the 3-direction.

Volume V: Textile Composites and Characterisation
V - 696
FRACTOGRAPHY
Figure 6 shows a scanning electron microscope (SEM) photo of a 1-direction fracture surfacetested at 527 sec-1. The photo shows interfacial debonding, resin cusps associated with brittlefracture in resin rich areas [4], and resin cracks. Figure 7 shows an SEM photo of a 3-direction fracture surface tested at 245 sec-1. The photo shows interfacial debonding and fiberfracture near a large crack.
CONCLUSIONS
The data from these 49 experiments for the IM7/E7T1-2 torospherical shell in the in-planeand through-thickness directions provides a data bank for this material at room temperaturefor strain rates between 381 sec-1 to 1154 sec-1. Yielding in the 1-direction occurs only at thelow strain rate. Thus, there is a transition from a ductile to a brittle behavior between strainrates of 381 sec-1 and 457 sec-1. Yielding is present in the 3-direction for all strain rates,with yield strength increasing 2.13 times and yield strain increasing 4.97 times between strainrates of 382 sec-1 and 1154 sec-1.
The ultimate strength in the 1-direction is strain rate insensitive. Ultimate strain and modulusof elasticity are nearly strain rate insensitive, with only the group A ultimate strain andmodulus of elasticity being significantly different from the other groups. In the 3-direction,the ultimate strength, ultimate strain, and modulus of elasticity are strain rate insensitive.
There are significant differences between dynamic and quasi-static compressive materialproperties. In the 1-direction, the quasi-static ultimate strength is lower than all dynamicultimate strengths. The quasi-static ultimate strength in the 1-direction is 29.4% lower thanthe highest, dynamic ultimate strength reported. In the 3-direction, the quasi-static ultimatestrength is higher than its dynamic counterpart, being 28.3% higher than the lowest dynamicultimate strength.
Yielding was not observed in quasi-static compression tests. Since yielding is seen in the 1-direction only at the lowest strain rate of 381 sec-1, the 1-direction appears to display a secondtransitional behavior: the first being the transition from ductile to brittle behavior discussedearlier, and the second being a transition from brittle to ductile behavior between quasi-staticloading and the 381 sec-1 strain rate. Since yielding is seen in all the 3-direction dynamictests, a transition from brittle to ductile behavior must exist between quasi-static loading andthe 382 sec-1 strain rate. More experiments may provide greater detail for all of the aboveconclusions.

Proceedings of ICCM–11, Gold Coast, Australia, 14th-18th July 1997
V - 697
y = 8.5128x + 75079
R2 = 0.0395
0.00E+00
2.00E+04
4.00E+04
6.00E+04
8.00E+04
1.00E+05
1.20E+05
1.40E+05
0 100 200 300 400 500 600
Strain Rate (/sec)
Stress(psi)
Ave Yield Strength
Ave Ult Strength
Ave Quasi-Static Ult Strength
Ave Ult Strength - 3 St Dev
Ave Ult Strength + 3 St Dev
Linear (Ave Ult Strength)
A
B
C D E
Fig. 1: Ultimate and Yield Strength as a Function of Strain Rate: Torospherical ShellComposed of IM7/E7T1-2, 1-direction
y = 9E-06x + 0.008
R2 = 0.4229
0.00%
0.50%
1.00%
1.50%
2.00%
2.50%
3.00%
3.50%
4.00%
4.50%
0 100 200 300 400 500 600
Strain(in/in)
Ave Ult StrainAve Quasi-Static Ult StrainAve Yield StrainAve. Ult. Strain - 3 St DevAve Ult Strain + 3 St DevLinear (Ave Ult Strain)
Strain Rate (/sec)
A
B C D
E
Fig. 2: Ultimate and Yield Strain as a Function of Strain Rate: Torospherical ShellComposed of IM7/E7T1-2, 1-Direction

Volume V: Textile Composites and Characterisation
V - 698
y = 10.522x + 70006
R2 = 0.4998
0.00E+00
2.00E+04
4.00E+04
6.00E+04
8.00E+04
1.00E+05
1.20E+05
0 200 400 600 800 1000 1200Strain Rate (/sec)
Stress(psi)
Ave Ult StrengthAve Quasi-Static Ult StrengthAve Ult Strength - 3 St DevAve Ult Strength + 3 St DevLinear (Ave Ult Strength)
F
G
H IJ
Fig. 3a: Ultimate Strength as a Function of Strain Rate: Torospherical Shell Composed ofIM7/E7T1-2, 3-Direction
y = 33.603x + 12324
R2 = 0.9068
0.00E+00
2.00E+04
4.00E+04
6.00E+04
8.00E+04
1.00E+05
1.20E+05
0 200 400 600 800 1000 1200Strain Rate (/sec)
Stress(psi)
Ave Quasi-Static Ult Strength
Ave Yield Strength
Ave Yield Strength - 3 St Dev
Ave Yield Strength + 3 St Dev
Linear (Ave Yield Strength)
F
G
H I J
Fig. 3b: Yield Strength as a Function of Strain Rate: Torospherical Shell Composed ofIM7/E7T1-2, 3-Direction

Proceedings of ICCM–11, Gold Coast, Australia, 14th-18th July 1997
V - 699
y = -2E-06x + 0.0522
R2 = 0.0608
y = 2E-05x - 0.0018
R2 = 0.8982
-2.00%
0.00%
2.00%
4.00%
6.00%
8.00%
10.00%
12.00%
14.00%
16.00%
0 200 400 600 800 1000 1200
Strain Rate (/sec)
Strain(%)
Ave Yield StrainAve Ult StrainAve Quasi-Static Ult StrainAve Yield Strain - 3 St DevAve Yield Strain + 3 St DevAve Ult Strain - 3 St DevAve Ult Strain + 3 St DevLinear (Ave Ult Strain)Linear (Ave Yield Strain)
F
F
G
G
H
H
I
I
J
J
Fig. 4: Ultimate and Yield Strain as a Function of Strain Rate: Torospherical ShellComposed of IM7/E7T1-2, 3-Direction
y = 988.34x + 2E+06
R2 = 0.3917
y = 182.77x2 - 194298x + 6E+07
R2 = 0.9465
-2.00E+06
0.00E+00
2.00E+06
4.00E+06
6.00E+06
8.00E+06
1.00E+07
1.20E+07
1.40E+07
1.60E+07
0 200 400 600 800 1000 1200
Strain Rate (/sec)
Modulus(psi)
Ave Modulus, 1-DirAve Modulus, 3-DirAve Quasi-Static Modulus, 1-DirAve Quasi-Static Modulus, 3-DirAve Modulus - 3 St Dev, 1 DirAve Modulus + 3 St Dev, 1-DirAve Modulus + 3 St Dev, 3-DirAve Modulus - 3 St Dev, 3-DirLinear (Ave Modulus, 3-Dir)Poly. (Ave Modulus, 1-Dir)
A
B
C
D
E
F
G H
I J
Fig. 5: Modulus of Elasticity as a Function of Strain Rate: Torospherical Shell Composedof IM7/E7T1-2

Volume V: Textile Composites and Characterisation
V - 700
Table 1: Torospherical Shell Composed of IM7/E7T1-2: 1-Direction TestsGroup Pressure Strain Yield Strength Ult Strength Yield Ult Strain Modulus Notes
(psi) Rate (psi) (psi) Strain (%) (psi)(/sec) (%)
A1 20 349 6.52E+04 8.50E+04 0.63% 1.26% 1.04E+07 Fracture predominately A2 20 387 6.30E+04 7.11E+04 0.60% 1.20% 1.06E+07 in the fiber direction.A3 20 434 5.70E+04 5.97E+04 0.71% 1.61% 8.06E+06 Fracture between pliesA4 20 351 6.18E+04 8.06E+04 0.65% 1.19% 9.49E+06 adjacent to theA5 20 384 - 9.68E+04 - 0.81% 1.20E+07 woven ply visible.
B1 40 527 - 7.62E+04 - 1.10% 6.93E+06 Fracture predominately B2 40 514 - 6.46E+04 - 1.10% 5.88E+06 in the fiber direction.B3 40 370 - 8.54E+04 - 1.17% 7.30E+06 Fracture between pliesB4 40 481 - 7.16E+04 - 1.20% 5.97E+06 adjacent to theB5 40 393 - 7.35E+04 - 1.14% 6.45E+06 woven ply visible.
C1 60 433 - 9.35E+04 - 1.13% 8.27E+06 Fracture predominately C2 60 520 - 7.78E+04 - 1.17% 6.65E+06 in the fiber direction.C3 60 490 - 7.62E+04 - 1.19% 6.41E+06 Fracture between pliesC4 60 406 - 8.59E+04 - 1.15% 7.47E+06 adjacent to the woven
ply visible. Many splinters.
D1 80 468 - 9.41E+04 - 1.24% 7.59E+06 Fracture mostly in theD2 80 666 - 7.57E+04 - 1.28% 5.90E+06 fiber direction. FractureD3 80 420 - 6.56E+04 - 1.11% 5.91E+06 between plies adjacent to D4 80 619 - 8.32E+04 - 1.31% 6.35E+06 woven ply visible. Many D5 80 611 - 8.27E+04 - 1.30% 6.36E+06 splintered fragments.
E1 100 465 - 7.41E+04 - 1.27% 6.00E+06 Fracture mostly in theE2 100 712 - 7.35E+04 - 1.65% 4.46E+06 fiber direction. FractureE3 100 573 - 8.32E+04 - 1.42% 5.86E+06 between plies adjacent to E4 100 552 - 8.16E+04 - 1.41% 5.79E+06 woven ply visible. Many E5 100 515 - 8.79E+04 - 1.28% 6.87E+06 splintered fragments.
Fig. 6: SEM photo of a 1-directionspecimen failure surface tested at 527 sec-1,showing interfacial debonding, resin cracks,
and cusps
Fig. 7: SEM Photo of a 3-Direction SpecimenFailure Surface Tested at 245 sec-1, showingfiber failure and interfacial debonding near a
crack
1250x, 30 kV 640x, 30 kV
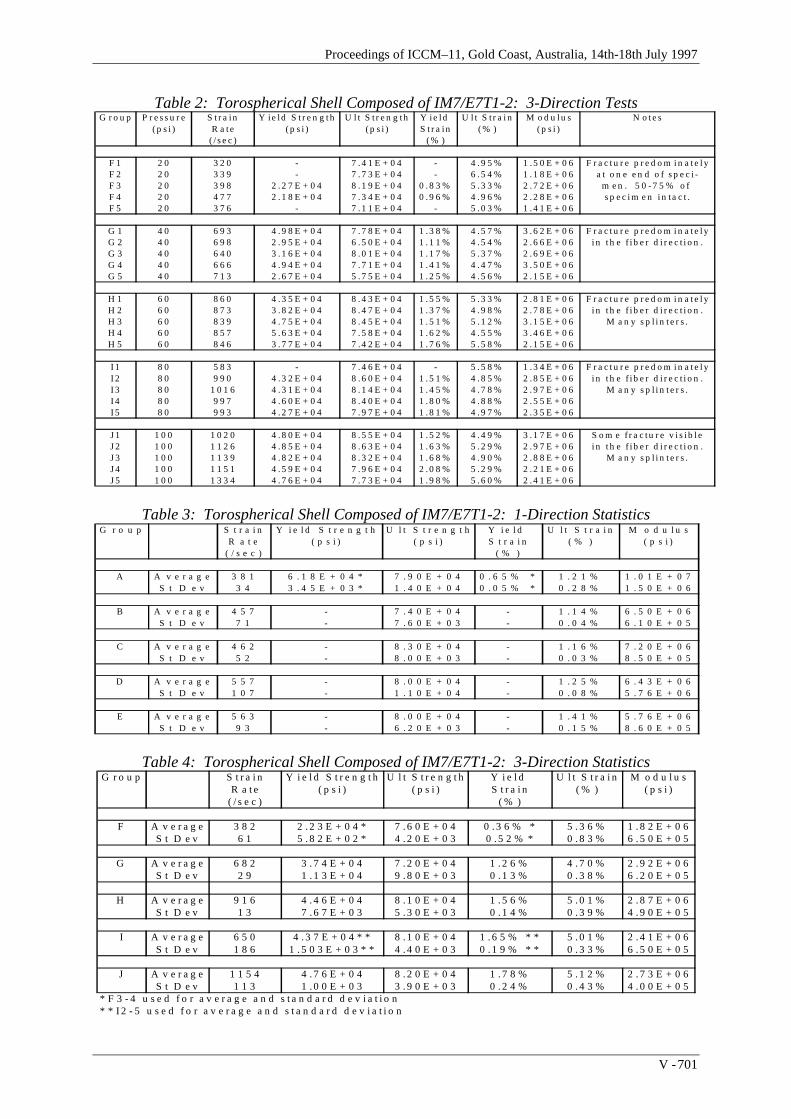
Proceedings of ICCM–11, Gold Coast, Australia, 14th-18th July 1997
V - 701
Table 2: Torospherical Shell Composed of IM7/E7T1-2: 3-Direction TestsG r o u p P r e s s u r e S t r a in Y ie ld S t r e n g t h U l t S t r e n g th Y ie ld U l t S t r a i n M o d u l u s N o t e s
( p s i ) R a t e ( p s i ) ( p s i ) S t r a in ( % ) ( p s i )( / s e c ) ( % )
F 1 2 0 3 2 0 - 7 .4 1 E + 0 4 - 4 .9 5 % 1 .5 0 E + 0 6 F r a c t u r e p r e d o m i n a t e l yF 2 2 0 3 3 9 - 7 .7 3 E + 0 4 - 6 .5 4 % 1 .1 8 E + 0 6 a t o n e e n d o f s p e c i -F 3 2 0 3 9 8 2 .2 7 E + 0 4 8 .1 9 E + 0 4 0 .8 3 % 5 .3 3 % 2 .7 2 E + 0 6 m e n . 5 0 - 7 5 % o f F 4 2 0 4 7 7 2 .1 8 E + 0 4 7 .3 4 E + 0 4 0 .9 6 % 4 .9 6 % 2 .2 8 E + 0 6 s p e c i m e n i n ta c t .F 5 2 0 3 7 6 - 7 .1 1 E + 0 4 - 5 .0 3 % 1 .4 1 E + 0 6
G 1 4 0 6 9 3 4 .9 8 E + 0 4 7 .7 8 E + 0 4 1 .3 8 % 4 .5 7 % 3 .6 2 E + 0 6 F r a c t u r e p r e d o m i n a t e l yG 2 4 0 6 9 8 2 .9 5 E + 0 4 6 .5 0 E + 0 4 1 .1 1 % 4 .5 4 % 2 .6 6 E + 0 6 i n t h e f i b e r d i r e c t i o n .G 3 4 0 6 4 0 3 .1 6 E + 0 4 8 .0 1 E + 0 4 1 .1 7 % 5 .3 7 % 2 .6 9 E + 0 6G 4 4 0 6 6 6 4 .9 4 E + 0 4 7 .7 1 E + 0 4 1 .4 1 % 4 .4 7 % 3 .5 0 E + 0 6G 5 4 0 7 1 3 2 .6 7 E + 0 4 5 .7 5 E + 0 4 1 .2 5 % 4 .5 6 % 2 .1 5 E + 0 6
H 1 6 0 8 6 0 4 .3 5 E + 0 4 8 .4 3 E + 0 4 1 .5 5 % 5 .3 3 % 2 .8 1 E + 0 6 F r a c t u r e p r e d o m i n a t e l yH 2 6 0 8 7 3 3 .8 2 E + 0 4 8 .4 7 E + 0 4 1 .3 7 % 4 .9 8 % 2 .7 8 E + 0 6 i n t h e f i b e r d i r e c t i o n .H 3 6 0 8 3 9 4 .7 5 E + 0 4 8 .4 5 E + 0 4 1 .5 1 % 5 .1 2 % 3 .1 5 E + 0 6 M a n y s p l i n t e r s .H 4 6 0 8 5 7 5 .6 3 E + 0 4 7 .5 8 E + 0 4 1 .6 2 % 4 .5 5 % 3 .4 6 E + 0 6H 5 6 0 8 4 6 3 .7 7 E + 0 4 7 .4 2 E + 0 4 1 .7 6 % 5 .5 8 % 2 .1 5 E + 0 6
I 1 8 0 5 8 3 - 7 .4 6 E + 0 4 - 5 .5 8 % 1 .3 4 E + 0 6 F r a c t u r e p r e d o m i n a t e l yI 2 8 0 9 9 0 4 .3 2 E + 0 4 8 .6 0 E + 0 4 1 .5 1 % 4 .8 5 % 2 .8 5 E + 0 6 i n t h e f i b e r d i r e c t i o n .I 3 8 0 1 0 1 6 4 .3 1 E + 0 4 8 .1 4 E + 0 4 1 .4 5 % 4 .7 8 % 2 .9 7 E + 0 6 M a n y s p l i n t e r s .I 4 8 0 9 9 7 4 .6 0 E + 0 4 8 .4 0 E + 0 4 1 .8 0 % 4 .8 8 % 2 .5 5 E + 0 6I 5 8 0 9 9 3 4 .2 7 E + 0 4 7 .9 7 E + 0 4 1 .8 1 % 4 .9 7 % 2 .3 5 E + 0 6
J 1 1 0 0 1 0 2 0 4 .8 0 E + 0 4 8 .5 5 E + 0 4 1 .5 2 % 4 .4 9 % 3 .1 7 E + 0 6 S o m e f r a c tu r e v i s i b l eJ 2 1 0 0 1 1 2 6 4 .8 5 E + 0 4 8 .6 3 E + 0 4 1 .6 3 % 5 .2 9 % 2 .9 7 E + 0 6 i n t h e f i b e r d i r e c t i o n .J 3 1 0 0 1 1 3 9 4 .8 2 E + 0 4 8 .3 2 E + 0 4 1 .6 8 % 4 .9 0 % 2 .8 8 E + 0 6 M a n y s p l i n t e r s .J 4 1 0 0 1 1 5 1 4 .5 9 E + 0 4 7 .9 6 E + 0 4 2 .0 8 % 5 .2 9 % 2 .2 1 E + 0 6J 5 1 0 0 1 3 3 4 4 .7 6 E + 0 4 7 .7 3 E + 0 4 1 .9 8 % 5 .6 0 % 2 .4 1 E + 0 6
Table 3: Torospherical Shell Composed of IM7/E7T1-2: 1-Direction StatisticsG r o u p S t r a i n Y i e l d S t r e n g t h U l t S t r e n g t h Y i e l d U l t S t r a i n M o d u l u s
R a t e ( p s i ) ( p s i ) S t r a i n ( % ) ( p s i )( / s e c ) ( % )
A A v e r a g e 3 8 1 6 . 1 8 E + 0 4 * 7 . 9 0 E + 0 4 0 . 6 5 % * 1 . 2 1 % 1 . 0 1 E + 0 7S t D e v 3 4 3 . 4 5 E + 0 3 * 1 . 4 0 E + 0 4 0 . 0 5 % * 0 . 2 8 % 1 . 5 0 E + 0 6
B A v e r a g e 4 5 7 - 7 . 4 0 E + 0 4 - 1 . 1 4 % 6 . 5 0 E + 0 6S t D e v 7 1 - 7 . 6 0 E + 0 3 - 0 . 0 4 % 6 . 1 0 E + 0 5
C A v e r a g e 4 6 2 - 8 . 3 0 E + 0 4 - 1 . 1 6 % 7 . 2 0 E + 0 6S t D e v 5 2 - 8 . 0 0 E + 0 3 - 0 . 0 3 % 8 . 5 0 E + 0 5
D A v e r a g e 5 5 7 - 8 . 0 0 E + 0 4 - 1 . 2 5 % 6 . 4 3 E + 0 6S t D e v 1 0 7 - 1 . 1 0 E + 0 4 - 0 . 0 8 % 5 . 7 6 E + 0 6
E A v e r a g e 5 6 3 - 8 . 0 0 E + 0 4 - 1 . 4 1 % 5 . 7 6 E + 0 6S t D e v 9 3 - 6 . 2 0 E + 0 3 - 0 . 1 5 % 8 . 6 0 E + 0 5
Table 4: Torospherical Shell Composed of IM7/E7T1-2: 3-Direction StatisticsG r o u p S t r a i n Y i e l d S t r e n g t h U l t S t r e n g t h Y i e l d U l t S t r a i n M o d u l u s
R a t e ( p s i ) ( p s i ) S t r a i n ( % ) ( p s i )( / s e c ) ( % )
F A v e r a g e 3 8 2 2 . 2 3 E + 0 4 * 7 . 6 0 E + 0 4 0 . 3 6 % * 5 . 3 6 % 1 . 8 2 E + 0 6S t D e v 6 1 5 . 8 2 E + 0 2 * 4 . 2 0 E + 0 3 0 . 5 2 % * 0 . 8 3 % 6 . 5 0 E + 0 5
G A v e r a g e 6 8 2 3 . 7 4 E + 0 4 7 . 2 0 E + 0 4 1 . 2 6 % 4 . 7 0 % 2 . 9 2 E + 0 6S t D e v 2 9 1 . 1 3 E + 0 4 9 . 8 0 E + 0 3 0 . 1 3 % 0 . 3 8 % 6 . 2 0 E + 0 5
H A v e r a g e 9 1 6 4 . 4 6 E + 0 4 8 . 1 0 E + 0 4 1 . 5 6 % 5 . 0 1 % 2 . 8 7 E + 0 6S t D e v 1 3 7 . 6 7 E + 0 3 5 . 3 0 E + 0 3 0 . 1 4 % 0 . 3 9 % 4 . 9 0 E + 0 5
I A v e r a g e 6 5 0 4 . 3 7 E + 0 4 * * 8 . 1 0 E + 0 4 1 . 6 5 % * * 5 . 0 1 % 2 . 4 1 E + 0 6S t D e v 1 8 6 1 . 5 0 3 E + 0 3 * * 4 . 4 0 E + 0 3 0 . 1 9 % * * 0 . 3 3 % 6 . 5 0 E + 0 5
J A v e r a g e 1 1 5 4 4 . 7 6 E + 0 4 8 . 2 0 E + 0 4 1 . 7 8 % 5 . 1 2 % 2 . 7 3 E + 0 6S t D e v 1 1 3 1 . 0 0 E + 0 3 3 . 9 0 E + 0 3 0 . 2 4 % 0 . 4 3 % 4 . 0 0 E + 0 5
* F 3 - 4 u s e d f o r a v e r a g e a n d s t a n d a r d d e v i a t i o n* * I 2 - 5 u s e d f o r a v e r a g e a n d s t a n d a r d d e v i a t i o n

Volume V: Textile Composites and Characterisation
V - 702
Table 5: Torospherical Shell Composed of IM7/E7T1-2: Quasi-Static TestsD ir e c t io n N u m b e r Y ie ld S t r e n g t h U lt S t r e n g t h
( p s i) ( p s i)
1 1 - 6 . 3 3 E + 0 41 2 - 4 . 7 8 E + 0 41 3 - 6 . 4 7 E + 0 43 1 - 9 . 3 8 E + 0 43 2 - 9 . 1 0 E + 0 4
Table 6: Torospherical Shell Composed of IM7/E7T1-2: Quasi-Static StatisticsD ir e c t io n U lt S t r e n g t h
( p s i)1 a v e r a g e 5 . 8 6 E + 0 4
s t d e v 9 . 3 7 E + 0 33 a v e r a g e 9 . 2 4 E + 0 4
s t d e v 1 . 9 9 E + 0 3
Table 7: Variance of the Dynamic Mechanical PropertiesP r o p e r t y 1 - D ir e c t io n 3 - D ir e c t io n
S t r a in R a t e 9 . 0 - 1 9 . 1 % 1 . 5 - 1 6 %Y ie ld S t r e n g t h 5 . 6 0 % 2 . 1 - 3 0 . 2 %
U lt im a t e S t r e n g t h 7 . 7 - 1 7 . 8 % 1 . 7 - 1 3 . 7 %Y ie ld S t r a in 7 . 3 0 % 9 . 1 - 1 3 . 6 %
U lt im a t e S t r a in 2 . 2 - 2 3 . 4 % 6 . 5 - 1 5 . 4 %M o d u lu s 9 . 4 - 1 4 . 4 % 1 4 . 7 - 3 5 . 8 %
REFERENCES
1. Powers, B.M., J.R. Vinson and I.W. Hall, “High Strain Rate Mechanical PropertiesIM7/8551-7 Graphite Epoxy Composite,” Proceedings of the 10th Technical Conferenceof the American Society for Composites, October 1995.
2. Sierakowski, R.L., “Dynamic Measurements of the Mechanical Properties of FilamentaryComposites,” In Dynamic Response of Composite Materials, SEM, 1985.
3. Ravichandran, G. and G. Subhash, “Critical Appraisal of Limiting Strain Rates forCompression Testing of Ceramics in a Split Hopkinson Pressure Bar,” In Journal of theAmerican Ceramic Society, Volume 77, Number 1, January 1994, pp. 263-267.
4. Gilchrist, M.D., N Svensson, “A Fractographic Analysis of Delamination withinMultidirectional Carbon/Epoxy Laminates,” Composites Science and Technology,Volume 55, 1995, pp 195-207.
5. Yoon, H.S., “Dynamic Void Growth in a Non-Linear Viscous Solid,” Ph.D. Thesis,Department of Mechanical Engineering, University of Delaware, 1987.
6. Zukas, J. (ed.), Impact Dynamics, John Wiley and Sons, New York, N.J., 1982.
7. Choe, G.H., “Impact Testing of Composite Materials at High Strain Rates,” Master’sThesis, Department of Mechanical Engineering, University of Delaware, 1989.
8. Powers, B.M., “High Strain Rate Effects on the Properties of Composite Materials,”Master’s Thesis, Department of Mechanical Engineering, University of Delaware, 1995.

Proceedings of ICCM–11, Gold Coast, Australia, 14th-18th July 1997
V - 703
9. Powers, B.M., J.R. Vinson, I.W. Hall and R.F. Hubbard, “High Strain Rate MechanicalProperties of Cycom 5920/1583,” Proceedings of the 36thAIAA/ASME/ASCE/AHS/ASC Structures, Structural Dynamics and MaterialsConference, April 1995, pp. 2386-2392.
10. Powers, B.M., J.R. Vinson, I.W. Hall and V. Nardone, “High Strain Rate MechanicalProperties of Silicon Carbide Reinforced 2080 Aluminum Metal Matrix Composites,”Proceedings of the 10th International Conference on Composite Materials, 1995, pp. 317-322.
11. Powers, B.M. and J.R. Vinson, “High Strain Rate Effects on Materials in SandwichConstruction,” Proceedings of the Third International Conference on SandwichConstructions, 1995, pp. 769-778.

Volume V: Textile Composites and Characterisation
V - 704
MICROMECHANICAL APPROACH TO THESTRENGTH OF UNDIRECTIONAL COMPOSITES
Atsushi Wada and Hiroshi Fukuda
Department of Materials Science and TechnologyScience University of Tokyo, Yamazaki, Noda, Chiba 278, Japan
KEYWORDS: unidirectional composites, stress concentration factor, Monte Carlosimulation, Rosen model, Zweben model, parametric study, comparison with experiment

Proceedings of ICCM–11, Gold Coast, Australia, 14th-18th July 1997
V - 705

Volume V: Textile Composites and Characterisation
V - 706

Proceedings of ICCM–11, Gold Coast, Australia, 14th-18th July 1997
V - 707

Volume V: Textile Composites and Characterisation
V - 708

Proceedings of ICCM–11, Gold Coast, Australia, 14th-18th July 1997
V - 709

Volume V: Textile Composites and Characterisation
V - 710

Proceedings of ICCM–11, Gold Coast, Australia, 14th-18th July 1997
V - 711
A PHENOMENOLOGICAL-MECHANISTIC MODELFOR RANDOM FIBER COMPOSITE STIFFNESS AND
STRENGTH PREDICTION
Yi Zhang and D.L. Sikarskie
Department of Mechanical Engineering and Engineering Mechanics Michigan TechnologicalUniversity, Houghton, MI 49931
KEYWORDS: random fiber composite, failure, stiffness, strength

Volume V: Textile Composites and Characterisation
V - 712

Proceedings of ICCM–11, Gold Coast, Australia, 14th-18th July 1997
V - 713

Volume V: Textile Composites and Characterisation
V - 714

Proceedings of ICCM–11, Gold Coast, Australia, 14th-18th July 1997
V - 715

Volume V: Textile Composites and Characterisation
V - 716

Proceedings of ICCM–11, Gold Coast, Australia, 14th-18th July 1997
V - 717

Volume V: Textile Composites and Characterisation
V - 718

Proceedings of ICCM–11, Gold Coast, Australia, 14th-18th July 1997
V - 719

Volume V: Textile Composites and Characterisation
V - 720

Proceedings of ICCM–11, Gold Coast, Australia, 14th-18th July 1997
V - 721
DETERMINING THE INTER-PLY AND INTRA-PLYVISCOSITIES OF UNI-AXIAL THERMOPLASTICCOMPOSITES BY THE ROLLER BEND METHOD
T.A. Martin 1 and I.F. Collins2
1Department of Mechanical Engineering, The University of Auckland,Private Bag 92019, Auckland, New Zealand
2Department of Engineering Science, The University of Auckland,Private Bag 92019, Auckland, New Zealand
SUMMARY: As high-speed manufacturing technology for forming continuous fibrereinforced thermoplastics (CFRTs) has developed, the need to reliably characterise thethermo-rheological material properties of CFRTs has increased. This paper investigates theprimary deformation mechanism of viscous shear and considers the development of anexperimental method to determine the inter-ply and the intra-ply shear properties of uni-directional laminates. By simply melting the strips and pulling them through a series ofrollers, the steady state drawing forces are measured and related to the material’s longitudinalviscosity. The advantage of using this method lies in its ease of execution. The results showthat, while the inter-ply shear viscosity of PLYTRON is slightly lower than the intra-ply shearviscosity, it is much higher than that reported elsewhere. The polymer also displays a typicalshear thinning behaviour. The roller bend technique can be used to characterise the shearproperties of many other thermoplastic composites.
KEYWORDS: inter-ply shear viscosity, thermoplastic composite sheets, continuous fibres
INTRODUCTION
Continuous fibre reinforced thermoplastic (CFRT) materials have become increasinglypopular in recent years due to the relative ease with which they can be molded intocomponents. By simply melting the matrix polymer and applying moderate forces, complexgeometries can be formed. In this molten state the matrix behaves like a viscous liquid and thefibres, which retain their elasticity, introduce a high degree of anisotropy into the material. Topredict the physical response of these materials in a real forming situation, it is necessary tofirstly understand the way in which they deform and secondly to determine their relevantmaterial properties. Thus it is important to consider the heirarchy of flow mechanismsdescribed by Cogswell and Leach [1]; resin percolation, transverse squeeze flow, inter-plyshear and intra-ply shear. These four flow mechanisms pertain to CFRT sheets with uni-directional plies and they are commonly present in combination, depending on the formingoperation. Resin percolation and transverse squeeze flow, are typically associated withconsolidation and welding processes, so they are not the main focus of this paper. However,inter-ply and intra-ply shear, are absolutely essential for shaping processes which induce

Volume V: Textile Composites and Characterisation
V - 722
single and double curvature in a sheet. To form parts with single curvature the plies mustshear through their thicknesses or slide over one another in the resin rich layers between theplies. When double curvature is required, intra-ply shear also takes place, that is, shear alongthe fibres within the plane of the sheet. In order to progress towards analytical/numericalforming solutions, which accurately reflect real moulding processes, both these mechanismsrequire investigation.
To quantify the viscous material properties of CFRTs, a number or authors have suggestedvarious types of experimental methods; the ply pull-out test [2], the torsional rheometry test[3], the picture frame test [4] and the vee-bend test [5]. These techniques have variousproblems associated with them. The ply pull-out test often leads to gross fibre bundlemovement during testing which alters the material behaviour and the transverse movement ofthe plies cannot be easily constrained. The torsional rheometry test is really only suited toinfinitesimal deformations and the longitudinal shear response cannot be separated from thetransverse shear response, without making prior assumptions about the material’s constitutivebehaviour. The picture frame test suffers from a similar problem. Furthermore, the flowmechanism is complicated by inducing squeeze flow within the plane of the sheet. A vee-bendtest provides a much better method for determining the inter-ply shear properties of CFRTlaminates, but it is not suitable for measuring the intra-ply shear properties and much datareduction is required to calculate the viscosity of the material from the non-linear loadresponse curves.
This paper examines a new method for measuring the shear properties of CFRTs. The rollerbend technique is experimentally simpler than any previously suggested methods, inducesfinite strains at realistic strain rates and specifically isolates the shear response of the material.Consider the schematic diagram of the experimental set-up shown in Figure 1. An initiallystraight laminate, with its fibres aligned along its length, is forced to shear through itsthickness by bending around three rollers. In this case, a plane strain forming condition isenforced by circular side plates, indicated by dotted circles in Figure 1. The deformation istherefore entirely kinematically specified in the bend region. As the strip is pulled upwards itexperiences a positive-negative-positive shear sequence, so that it exits the final roll as a flatsheet. The strip is pulled through the rollers until a steady state is reached, and for eachforming speed the measured drawing force can be directly related to the steady state viscosityof the material. In addition, by turning the specimen 90° in the test apparatus, either the intra-ply or inter-ply material properties can be readily measured. This approach could be adoptedas a standard technique to measure and compare the viscous properties of variousthermoplastic composite laminates in their molten states. While this paper investigatesPLYTRON test specimens, the objective is not to provide an exhaustive study of the shearproperties of PLYTRON, but rather to demonstrate the principle of the roller bend technique.
THEORY
The analytical model presented in this section yields a mathematical description of the effectsof the forming speed and the roller/strip geometry on the steady state drawing forces. Thetheory pertains to an idealised material model, which accounts for the fluid nature of themolten polymer and the high elongational stiffness of the fibres, by treating the compositelike an incompressible viscous continuum containing thin homogeneously distributedinextensible cords [6].

Proceedings of ICCM–11, Gold Coast, Australia, 14th-18th July 1997
V - 723
Fig. 1: A diagram of the roller bend test concept
Constraints and Kinematics
In the continuum considered here the fibres all lie in parallel surfaces in the plane ofdeformation and each fibre path is characterised by a field of unit tangent vectors, a, as shownin Figure 2. The components of a are denoted ai. During the deformation the fibres areconvected with the continuum, so that the same material particles lie on the same fibre at anygiven time. The orthogonal trajectories to the a-lines are characterised by a field of unitnormal vectors, n. The components of n are denoted ni. The n-lines are not material curves ingeneral, because the particles lying on an n-line before deformation will not necessarily lie onthe same n-line after deformation. We now consider the kinematic constraints imposed on thisidealised material. The incompressibilty and fibre inextensibility conditions are respectivelyexpressed by
∂∂v
= =i
iiix
d 0 and a ax
a a di j i j ij
∂∂v
= = 0i
j
(1)

Volume V: Textile Composites and Characterisation
V - 724
φ
n a
C
GH
F
D
A B
φ
E
V
r
Fig. 2: An idealised sheetwrapped around a roller.
where x refers to the spatial coordinates of the velocityvector, v, and dij is the rate of deformation tensor defined by
dx xij
i
j
j
i
= +
1
2
∂∂
∂∂
v v (2)
The rate of change of a is given by
v
a axi k
i
k
=∂∂
(3)
For a detailed derivation of these equations the reader isrefered to Rogers and O’Neill [7]. Consider the deformationof a flat sheet wrapped around a single roller in Figure 2.Two side plates, not illustrated in the diagram, arepositioned on either side of the large central roller toprevent the laminate from spreading normal to the plane.
Pipkin and Rogers [8] have derived the governing equations for plane strain deformations ofincompressible, inextensible materials and two significant results follow from their work: (a)the initially straight fibres remain in parallel surfaces, so the normal lines main straight and(b) the thickness of the sheet does not change during forming. These two requirements permitonly simple shear deformations along the fibres. The amount of shear in the continuum ismeasured by the change in angle between two adjacent fibres. As there is no deformation upto the normal line BG in Figure 2, the shear strain along any normal line in the fan regionBCFG is equal to the fibre angle, φ, and the shear rate is equal to the rate of rotation of anormal line, φ .
Stress in a Constrained Material
The total stress in a constrained material can be thought of as the sum of a reaction stress, rij ,
and an extra stress, Sij .
σ δij ij ij ij i j i j ijr S p a a Ta a S= + = − − + +( ) (4)
where Sij satisfies the constraints a a Si j ij = 0 andn n Si j ij = 0 . In other words, Sij has no normal
stress component on surface elements normal to the a direction or the n direction. Thereaction stress does no work in a deformation and the reactions p and T arise as a result of theincompressibility and fibre inextensibility constraints respectively. T is the total tension onelements normal to the fibre direction and p represents the total pressure on elements normalto the n direction. These scalar terms must be determined by solving the equilibriumequations, whereas the deviatoric stress tensor, Sij , needs to be specified by an appropriate
constitutive relationship. If the material has reflectional symmetry in the x3 plane and thedeformation is homogeneous, under plane strain conditions the only non-zero components ofσij are
σ δij ij i j i j i j j i i ja a a a a n a n S k k= − − + + + +p( ) T S( ) 33 (5)
where k is the vector normal to the plane of deformation.

Proceedings of ICCM–11, Gold Coast, Australia, 14th-18th July 1997
V - 725
Constitutive Equation
In the present analysis, the deformation of an incompressible fluid reinforced with a singlefamily of inextensible fibres in the (x1,x2) plane is considered. According to Rogers [9], theconstitutive relationship for a viscous fluid subjected to these two constraints is given by
S d a a d a a dij T ij L T i k kj j k ki= + − +2 2µ µ µ( )( ) (6)
where µL and µT are the respective viscosities of the continuum along and transverse to the
fibres. In a plane strain deformation, v3=d33=0, so that, σ33=-p. Hence, a stress must beapplied normal to the plane of deformation to maintain the plane strain condition. Usingequations (5) and (6) it is readily shown that
S = = = =a n a n S a n di j ij i j ij L i j ij Lσ µ µ φ2 (7)
where S is the shear stress associated with simple shear along the fibre direction. For aviscous fluid model, S depends only on the shear rate. In this particular example the onlymaterial property which can be determined in the constitutive equation is the longitudinalshear viscosity, µ
L. If a shear thinning fluid material model is chosen, instead of a linear
viscous fluid model, then a power law expression for the apparent viscosity, µL, as a function
of the shear rate can be introduced, so that
µφ
φL Lnm= = −S
1 (8)
where mL is the pseudo longitudinal shear thinning viscosity and n is the consistency index.By including fibre layers in the laminate which are not aligned with the longitudinal direction,the transverse shear viscosity may also be determined [5]. So a similar expression could bewritten for µT in terms of mT and n. It is likely that n depends only on the shear thinningbehaviour of the matrix polymer and is unaffected by the anisotropy in the composite,although it could be a function of the fibre volume fraction. When n=1 the fluid becomesNewtonian.
Stress Equilibrium
Consider the equilibrium of the force resultants acting on an elementary cross section of thedeformed plate shown in Figure 3. When the only boundary traction is the pressure exerted onthe inner surface, it is a simple matter to deduce that
∂∂φT
S*
*− = 0 and TS
r**+ =∂
∂φ 0 0p(9)
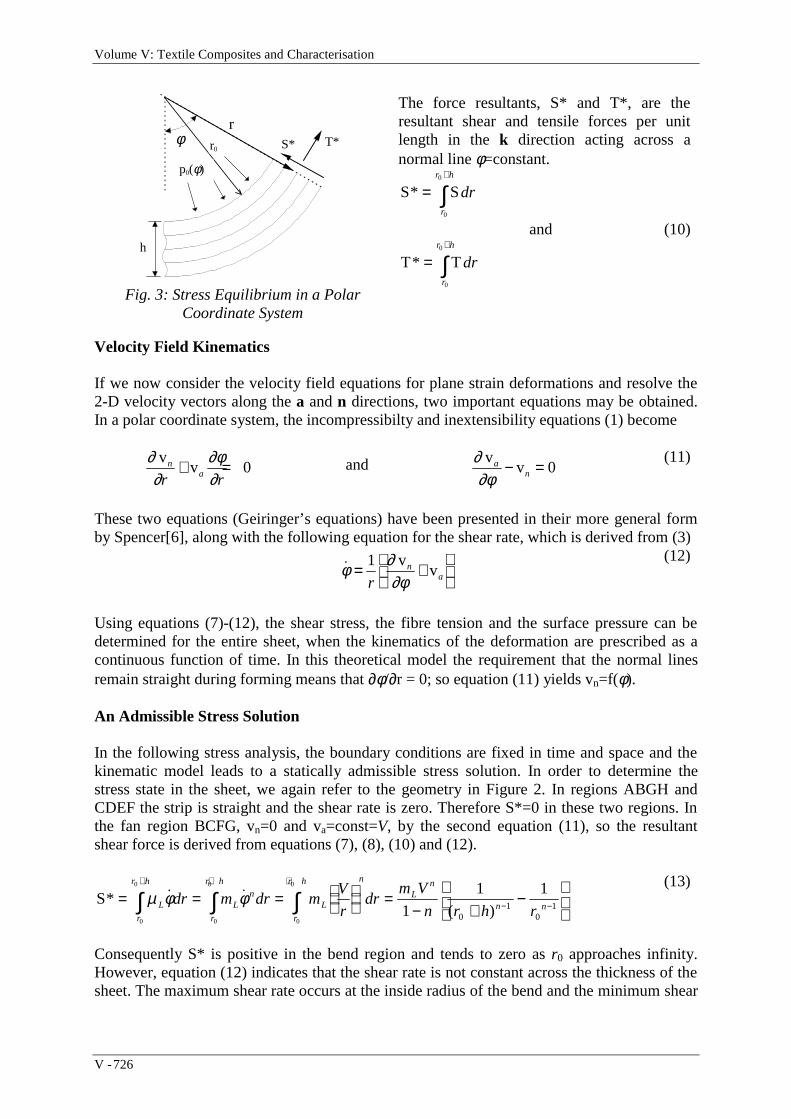
Volume V: Textile Composites and Characterisation
V - 726
r0φ
p0(φ)
h
S* T*r
Fig. 3: Stress Equilibrium in a PolarCoordinate System
The force resultants, S* and T*, are theresultant shear and tensile forces per unitlength in the k direction acting across anormal line φ=constant.
S* S=+
∫ drr
r h
0
0
and (10)
T* T=+
∫ drr
r h
0
0
Velocity Field Kinematics
If we now consider the velocity field equations for plane strain deformations and resolve the2-D velocity vectors along the a and n directions, two important equations may be obtained.In a polar coordinate system, the incompressibilty and inextensibility equations (1) become
∂∂
∂φ∂
vvn
ar r+ = 0 and ∂
∂φv
van− = 0
(11)
These two equations (Geiringer’s equations) have been presented in their more general formby Spencer[6], along with the following equation for the shear rate, which is derived from (3)
v
vφ ∂∂φ
= +
1
rn
a
(12)
Using equations (7)-(12), the shear stress, the fibre tension and the surface pressure can bedetermined for the entire sheet, when the kinematics of the deformation are prescribed as acontinuous function of time. In this theoretical model the requirement that the normal linesremain straight during forming means that ∂φ/∂r = 0; so equation (11) yields vn=f(φ).
An Admissible Stress Solution
In the following stress analysis, the boundary conditions are fixed in time and space and thekinematic model leads to a statically admissible stress solution. In order to determine thestress state in the sheet, we again refer to the geometry in Figure 2. In regions ABGH andCDEF the strip is straight and the shear rate is zero. Therefore S*=0 in these two regions. Inthe fan region BCFG, vn=0 and va=const=V, by the second equation (11), so the resultantshear force is derived from equations (7), (8), (10) and (12).
S*
( )= = =
=
− +−
+ + +
− −∫ ∫ ∫µ φ φL
r
r h
Ln
r
r h
L
r
r h n
Ln
n ndr m dr m
V
rdr
m V
n r h r0
0
0
0
0
0
1
1 1
01
01
(13)
Consequently S* is positive in the bend region and tends to zero as r0 approaches infinity.However, equation (12) indicates that the shear rate is not constant across the thickness of thesheet. The maximum shear rate occurs at the inside radius of the bend and the minimum shear
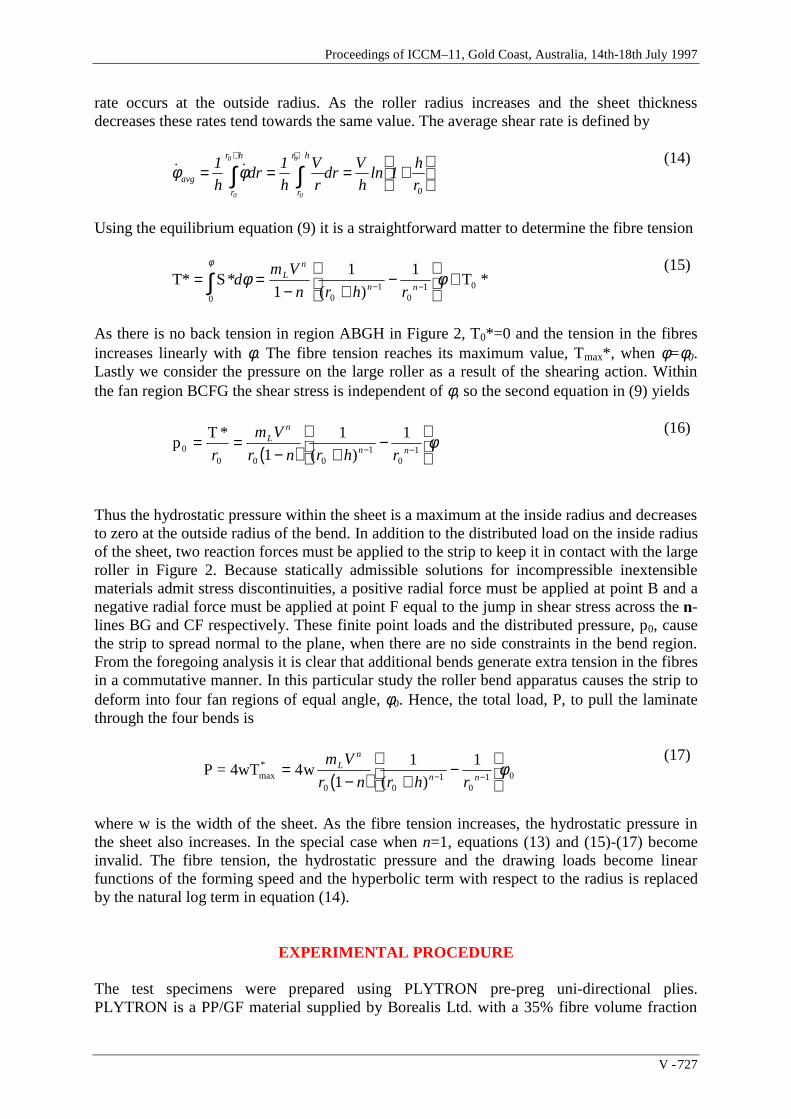
Proceedings of ICCM–11, Gold Coast, Australia, 14th-18th July 1997
V - 727
rate occurs at the outside radius. As the roller radius increases and the sheet thicknessdecreases these rates tend towards the same value. The average shear rate is defined by
lnφ φavg
r
r h
r
r h
hdr
h
V
rdr
V
h
h
r= = = +
+ +
∫ ∫1 11
0
0
0
0
0
(14)
Using the equilibrium equation (9) it is a straightforward matter to determine the fibre tension
T* S* T= =− +
−
+∫ − −
0 01
01 01
1 1φ
φ φdm V
n r h rL
n
n n( )*
(15)
As there is no back tension in region ABGH in Figure 2, T0*=0 and the tension in the fibresincreases linearly with φ. The fibre tension reaches its maximum value, Tmax*, when φ=φ0.Lastly we consider the pressure on the large roller as a result of the shearing action. Withinthe fan region BCFG the shear stress is independent of φ, so the second equation in (9) yields
( )p
T0
0 0 01
011
1 1= =− +
−
− −
*
( )r
m V
r n r h rL
n
n nφ
(16)
Thus the hydrostatic pressure within the sheet is a maximum at the inside radius and decreasesto zero at the outside radius of the bend. In addition to the distributed load on the inside radiusof the sheet, two reaction forces must be applied to the strip to keep it in contact with the largeroller in Figure 2. Because statically admissible solutions for incompressible inextensiblematerials admit stress discontinuities, a positive radial force must be applied at point B and anegative radial force must be applied at point F equal to the jump in shear stress across the n-lines BG and CF respectively. These finite point loads and the distributed pressure, p0, causethe strip to spread normal to the plane, when there are no side constraints in the bend region.From the foregoing analysis it is clear that additional bends generate extra tension in the fibresin a commutative manner. In this particular study the roller bend apparatus causes the strip todeform into four fan regions of equal angle, φ0. Hence, the total load, P, to pull the laminatethrough the four bends is
( )P = 4wT wmax
* =− +
−
− −4
1
1 1
0 01
01 0
m V
r n r h rL
n
n n( )φ
(17)
where w is the width of the sheet. As the fibre tension increases, the hydrostatic pressure inthe sheet also increases. In the special case when n=1, equations (13) and (15)-(17) becomeinvalid. The fibre tension, the hydrostatic pressure and the drawing loads become linearfunctions of the forming speed and the hyperbolic term with respect to the radius is replacedby the natural log term in equation (14).
EXPERIMENTAL PROCEDURE
The test specimens were prepared using PLYTRON pre-preg uni-directional plies.PLYTRON is a PP/GF material supplied by Borealis Ltd. with a 35% fibre volume fraction

Volume V: Textile Composites and Characterisation
V - 728
and a melting temperature of 168°C. The pre-preg plies were consolidated between heatedplatens in a Satim press at a pressure of 1MPa to produce a 9.3mm thick laminate. Thislaminate was subsequently cut up into test strips 340mm long and 9.3mm wide. Theexperimental apparatus consisted of four sets of rolls supported between two parallel plates asshown in Figure 4. The parallel plates were attached to a base plate which was screwed onto acylindrical Aluminium tube. An additional carbon/epoxy tube was subsequently attached tothis tube. Each set of rolls consisted of a large roll and a small roll. These were designed sothat the test specimens could fit into a 10mm square gap, as shown in Figure 5. This gap wasslightly larger than the dimensions of the test specimens to allow for thermal expansion in thepolymer upon melting. By inserting the strips in the roller bend apparatus at 0° or 90°, theinter-ply and the intra-ply shear properties could be measured respectively. The upper threesets of rolls could be located in three different positions to test bend angles of 41.4°, 60° and90°. After some initial tests the 41.4° bend angle was selected to minimise the hydrostaticpressure in the strip during forming. The roller bearing system consisted of tapered stainlesssteel pins, which were spring loaded to apply a constant side force to the rollers. Thisarrangement was cost effective and eliminated the need for high temperature ball bearings.The bulk of the test equipment, including the rolls, was manufactured from Aluminium tominimise the thermal capacity of the device. The test equipment was mounted in anenviromental chamber and attached to the cross-head of a Zwick tensile testing machine. Theoven and the apparatus were pre-heated to the melting temperature of the specimen. Toeliminate any thermal gradients in the chamber, the carbon/epoxy cylindrical tube was used toinsulate the apparatus from the ambient temperature outside the oven. Each test strip wasgripped by a set of spring loaded jaws inside the oven and allowed to hang in theenvironmental chamber between the rolls. The forming rolls were initially aligned with thespecimen to avoid bending it until it had reached its melting temperature. A thermocouple wasput into each sheet at a point 50mm below the grips, to ensure an accurate measurement of thestrip temperature. As soon as the matrix polymer had completely melted, the forming rollswere translated in the horizontal direction and fixed in place. A further 15 minutes was thenallowed to let the strip temperature stabilise. The Zwick cross-head was moved downwards,so that the strip was pulled through the roller bend apparatus at speeds of 100-1000 mm/min.While the strips were being formed, a 1kN load cell was used to measure the drawing loads.The load data was stored on disk and the results are illustrated in the next section.
Fig. 4: A plan view of the rolls
40
50
10

Proceedings of ICCM–11, Gold Coast, Australia, 14th-18th July 1997
V - 729
Fig. 5: Experimental apparatus
RESULTS AND DISCUSSION
The first set of experimental results, shown in Figure 6, illustrates the effect of forming speedon the inter-ply shear response of PLYTRON at 180°C. The first thing which is immediatelyevident from these results is the small forces needed to draw the thermoplastic compositespecimens through the bending rolls. Secondly, the curves follow a consistent pattern anddemonstrate some fluctuations in the steady state region. These fluctuations become moreirregular with increasing forming speed. For a viscous fluid material it is not surprising thatthe drawing loads increase with the forming speed; however, the drawing speed has increasedby an order of magnitude, while the steady state drawing forces have only increased by afactor of three. This result demonstrates the non-Newtonian shear thinning behaviour ofPLYTRON. To eliminate the transient start up phase and the unsteady tail end results, theaverage steady state forming load was calculated for displacements from 30mm to 80mm.These average values are indicated by dotted lines in Figure 6. The effect of forming speed onthe intra-ply drawing forces is demonstrated in Figure 7. Again the forming loads increasenon-linearly with the forming speed. In this case the shape of the load curves is similar tothose shown in Figure 6 except at higher forming speeds, where the curves tend to rise to apeak and then drop down to a much lower value for the remainder of the process. This featuremay be explained in terms of the transverse spreading phenomenon, which was caused by thehydrostatic pressure in the bend region. Unfortunately the experimental side plates could notextend to the outside thickness of the bend because of physical interference from the otherrolls. So instead of deforming in a plane strain mode, the edges of the strip tended to widen inthe regions between the rolls and then get squashed at the points where the rolls came intocontact with each other. This was particularly a problem for the intra-ply specimens at higherforming speeds and is evident by the increasing irregularity in the load results of Figure 7.This problem could be solved by introducing fixed side plates over the entire lengths of the

Volume V: Textile Composites and Characterisation
V - 730
Figure 6: Drawing load versus displacement for inter-ply shear tests at various formingspeeds. Forming temperature=180°C
0.00
1.00
2.00
3.00
4.00
5.00
6.00
7.00
8.00
9.00
10.00
0.00 10.00 20.00 30.00 40.00 50.00 60.00 70.00 80.00 90.00 100.00
Displacement (mm)
Load
(N
)
100 mm/min 200 mm/min 500 mm/min 1000 mm/min
Average Values
0.00
2.00
4.00
6.00
8.00
10.00
12.00
0.00 10.00 20.00 30.00 40.00 50.00 60.00 70.00 80.00 90.00 100.00
Displacem ent (m m )
Load
(N
)
100 m m /m in 200 m m /m in 500 m m /m in 1000 m m /m in
Average Values
Figure 7: Drawing load versus displacement for Intra-ply shear tests at various formingspeeds. Forming temperature=180°C

Proceedings of ICCM–11, Gold Coast, Australia, 14th-18th July 1997
V - 731
strips. Such a physical constraint would add a friction load to the side of the specimens, butthis could be measured and subtracted from the total load to determine the fibre tension due toshearing. Alternatively, interlocking sprockets could be used instead of solid circular sideplates.
At each forming speed a dead load test was performed to determine the friction loadassociated with the roller bearings and polymer adhesion. By pulling a straight strip throughthe aligned rolls, the steady state dead load was found to be 0.3N regardless of the formingspeed. This dead load was subtracted from the average gross forming loads shown in Figure 6and Figure 7. Using this data, the drawing forces were plotted against the forming speed on alog-log scale and a linear regression was used to determine the pseudo longitudinal shearviscosity and the consistency index of the material from equation (17). The linear regressioncurves and the experimental steady state forming loads are shown in Figure 8. For the intra-ply tests the 1000mm/min data point was ignored in the regression analysis due to theunreliability caused by the transverse spreading effects.
The results indicate that the intra-ply shear viscosity of PLYTRON is about 25% higher thanthe inter-ply shear viscosity. Given the possible error in the intra-ply drawing loads at higherforming speeds, it is likely that the consistency indices could be much closer to each other inreality. A typical n value for Polyproylene is 0.3-0.4. Thus the shear thinning effect is mostlikely attributed to the behaviour of the polymer and is only mildly affected by the presence ofthe fibres. In comparison with the vee-bend test results [10] for the inter-ply shear viscosity ofPLYTRON, the roller bend inter-ply shear viscosity appears to be about 75 times greater. Thismassive increase in the shear viscosity may be due to the present use of a thin pre-pregmaterial. This unexpected outcome might be explained by considering the micro-structure inthe experimental specimens. Micrographs of the specimens used in the roller bend tests, withan average ply thickness of 0.2125mm, showed a much more uniform fibre distribution incomparison with the specimens used for the vee-bend tests. In particular, the vee bend testspecimens were made from 0.5mm thick plies and showed resin rich regions between the pliesand bundled fibre spacing within the laminate. The vee-bend specimens would probably showa significant difference between their inter-ply and intra-ply shear properties. For ahomogeneous micro-structure the inter-ply and intra-ply shear viscosities converge. Thus thecomposite tends towards a transversely isotropic material behaviour. The increased shearviscosity in the current results has implications regarding the formability of the material. A
1.00
10.00
0.10 1.00 10.00 100.00
Forming Speed (mm/s)
Load
(N
)
Intra-ply Shear Inter-ply Shear
n=0.448
m L =25059 Pa.sn
n=0.561
m L =32825 Pa.sn
Figure 8: A log-log plot of the steady state loadsversus forming speed

Volume V: Textile Composites and Characterisation
V - 732
CFRT material which resists shear deformation will naturally require higher forming stressesand is more likely to exhibit fibre wrinkling and gross buckling. In the current experimentalsetup the elastic loads are applied directly to the rollers, while the load cell only measures theviscous energy dissipated by the movement of the strip. If the material exhibits visco-elasticeffects, these can only be considered by measuring the loads on the rolls. This feature couldbe incorporated into future tests.
CONCLUSIONS
The roller bend technique is in principle ideally suited to isolating and measuring the inter-plyand intra-ply shear properties of molten continuous fibre thermoplastic composites. Theexperimental method can be easily executed and the steady state drawing forces can bequickly converted into steady shear viscosity data. The theory also correctly predicts thetransverse spreading of the uni-directional laminates due to shearing. Unfortunately, themulti-bend apparatus did not enforce a plane strain condition across the entire strip thickness,so the test specimens attempted to spread rather than shear during forming. More reliableexperimental data might be obtained with fixed side plates or interlocking sprocket sideplates. A comparison between the inter-ply and intra-ply shear properties of PLYTRON wasmade possible using the roller bend technique. This has never been done before. The resultsindicate that for a homogeneously distributed fibre micro-structure, the intra-ply viscosity isnot much greater than the inter-ply viscosity. Consequently, the material behaves in a nearlytransversely isotropic manner. The reduction in viscosity of the composite with increasingforming speed appears to be independent of the in-plane or out-of-plane shear mode and canbe attibuted to the power-law shear thinning behaviour of the polymer matrix. The calculatedinter-ply pseudo longitudinal viscosity of PLYTRON was found to be significantly higherthan that reported elsewhere. This could be due to the use of a thinner pre-preg material and auniform distribution of fibres across the laminate. Further experimental investigation isrequired to verify this finding.
ACKNOWLEDGEMENTS
Dr. Todd Martin would like to thank the Institut für Verbundwerkstoffe (IVW) GmbH,Germany, for hosting him as a guest scientist in 1996, and the Deutscher AkademischerAustauschdienst (DAAD) for providing a short term research scholarship. The authors alsogratefully acknowledge the support received from the Foundation for Research, Science andTechnology, N.Z., for conducting this research.
REFERENCES
1. Cogswell, F.N., Leach, D.C., “Processing Science of Continuous Fibre ReinforcedThermoplastic Composites,” SAMPE Journal, Vol. 24, No. 3, 1988, pp. 11-14.
2. Goshawk, J.A., Jones, R.S., “The Flow of Continuous Fibre Reinforced Composites inSteady Shear,” Composites Science and Technology, Vol. 56, 1996 , pp. 63-74.
3. Groves, D.J., Bellamy, A.M., Stocks, D.M., “Anisotropic Rheology of Continuous FibreThermoplastic Composites,” Composites, Vol. 23, No. 2, 1992, pp. 75-80.

Proceedings of ICCM–11, Gold Coast, Australia, 14th-18th July 1997
V - 733
4. McGuinness, G.B., Canavan, R.A., Nestor, T.A., O Bradaigh, C.M., “A Picture FrameIntra-ply Shearing Test for Unidirectional and Fabric Reinforced Composite Melts,”ASME Winter Annual Meeting, San Francisco, Nov 1995.
5. Dykes, R., Martin, T.A., Bhattacharyya, D., “Determination of Longitudinal andTransverse Behaviour of Continuous Fibre-Reinforced Composites from Vee-Bending,”Fourth Int. Conference on Flow Processes in Composite Materials, FPCM ‘96,Aberystwyth, Wales, Sept. 9-11. 1996.
6. Spencer, A.J.M., “Deformations of Fibre Reinforced Materials,” Clarendon Press,Oxford, 1972.
7. Rogers, T.G., O’Neill, J.M., “Theoretical Analysis of Forming Flows of Fibre-Reinforced Composites,” Composites Manufacturing, Vol. 2, No. 3, 1991, pp. 153-159.
8. Pipkin, A.C., Rogers, T.G., “Plane Deformations of Incompressible Fibre ReinforcedMaterials,” Journal of Applied Mechanics, Transactions of the ASME, Sept 1971, pp.634-640.
9. Rogers, T.G., “Rheological Characterization of Anisotropic Materials,” Composites,Vol. 20, No. 1, Jan 1989, pp. 21-27.
10. Martin, T.A., Mander, S.J., Dykes, R.J., Bhattacharyya, D., “Bending of ContinuousFibre Reinforced Thermoplastic Sheets,” Composite Sheet Forming, ed. D.Bhattacharyya, Composite Materials Science Publishers, Amsterdam, Netherlands,1997.

Volume V: Textile Composites and Characterisation
V - 734
THERMAL SHOCK RESISTANCE OF HYBRIDPARTICULATE-FILLED EPOXY COMPOSITES
Masatoshi Kubouchi1, Tetsuya Handa2, Ken Tsuda1,Toshio Shimizu3 and Mitsuhiko Koyama4
1 Tokyo Institute of Technology, 2-12-1, O-okayama, Meguro-ku, Tokyo 152 JAPAN.2 Graduate School, Tokyo Institute of Technology,
2-12-1, O-okayama, Meguro-ku, Tokyo 152 JAPAN.3 Heavy Apparatus Engineering Lab., Toshiba Co.,
1, Toshiba-cho, Fuchu-shi, Tokyo 183 JAPAN.4 Generator Dept., Toshiba Co., 2-4, Suehiro-cho, Tsurumi-ku, Yokohama 230 JAPAN.
SUMMARY : For improvement in toughness of epoxy casting materials, hybrid particle-filledcomposites have been reported. Since toughening mechanisms of hard and soft particles areeffective at the same time, large improvement can be expected. In this study, an effect ofhybrid filler on thermal shock resistance using silica particulate as hard filler and MBS rubberas soft filler is examined. The thermal shock test which we have been proposed wasconducted on mono-filler and hybrid-filler composites. The results were concluded that, hardand soft hybrid filler effect on thermal shock was smaller than that on fracture toughness.This tendency is due to the debonding of silica filler and matrix interface.
KEYWORDS : thermal shock, epoxy resin, hybrid filler, fracture toughness, particulate-filledresin, thermal shock test, silica filler, MBS rubber.
INTRODUCTION
The epoxy resin has many good properties as insulating materials, such as high insulationresistance, adhesive property, moldability, etc.. Unfortunately, the epoxy casting materialsusually show low cracking resistance. Therefore, the second phase materials are added to theresin for improvement in toughness. The second phase materials often consist of either a hardinorganic filler [1] or a soft rubbery material [2]. The hard particulate branches off the crackpropagation and makes it zigzag way, that is crack pinning effect which improves fracturetoughness. On the other hand, soft particulate locally deforms matrix resin and by thisenergy consumption the fracture toughness also increases. Since these tougheningmechanisms are effective at the same time, recently new composites i.e., hybrid particulate-filled epoxy resins have been reported as highly toughened insulating materials [3, 4]. Forthese composites, in which both hard and soft particles are filled, large improvement intoughness can be expected.
In application of these epoxy resins or epoxy based composites in electric and electronicfields, high resistance to thermal shock is required to guarantee the high reliability. Failure bythermal shock is a complex phenomena because it is greatly affected by many factors, such asthe geometry of the testing sample, the thermal and mechanical properties, and so forth.

Proceedings of ICCM–11, Gold Coast, Australia, 14th-18th July 1997
V - 735
We had already proposed a new test method to evaluate the thermal shock resistance of theepoxy resins and particulate filled resins [5~8]. The thermal shock test is easily conducted inlaboratory, and the thermal shock resistance is evaluated analytically based on linear fracturemechanics. In our previous studies, the thermal shock resistance of hard particulate filledresin and soft second phase filled resin are reported. Both types of toughened resins showedimprovement in thermal shock resistance.
In this study, effect of hybrid filler on thermal shock resistance using silica particulate as ahard filler and MBS rubber particulate as a soft filler was examined.
EXPERIMENTAL
Materials
The thermal shock test was conducted for neat resin, silica filled composite, rubber filledcomposite and silica & rubber hybrid type composite. The neat resin or the matrix resin ofthe other composites was bisphenol-type epoxy (epoxy equivalent weight = 5.1 - 5.6equiv./kg) cured with acid anhydride hardener. The silica filler was angular-shapedparticulate without surface treatment and the average diameter of the filler was about 13 µm.The Metacryl-Butadiene-Styrene (MBS) rubber was used as rubber filler material. This fillerconsisted of under micron particle, which made about 100 µm size cluster.
Two series of mono-filler composites and two series of hybrid-filler composites were used.The silica filler content was varied from neat resin to 300 phr (per hundred resin), and theMBS filler content was varied from neat resin to 15 phr respectively. Hybrid fillercomposites content of hard filler and soft filler were also changed as shown in Table 1. TheMBS content was fixed 10 phr for one of the hybrid composites series, and the silica contentwas fixed 200 phr for the other series.
Table 1 Composition of tested materials.
silica filler (phr) MBS rubber filler (phr)hard particulate filled composites 100, 200, 300 0soft particulate filled composites 0 5, 10, 15hybrid particulate filled composites100, 200, 250, 300, 320 10
200 5, 10, 15
Thermal Shock Test Method
In this test, pre-notched disk shaped specimen was checked whether crack was propagated ornot from the tip of notch after thermal shock. The test specimen of 60 mm diameter and 10mm thickness disk has a radial direction pre-notch as shown in Fig.1. The notch length (c inFig.1) was kept 6 mm. The specimen held between two heat insulators was put into thecooling bath which consisted of dry ice / pentane coolant system. Then, since the disk wascooled from the cylindrical surface to the center along the radius, thermal stress for mode-Ifracture was created at the tip of the pre-notch. The temperature difference was controlled bychanging the initial temperature of the specimen. The thermal shock resistance was evaluatedquantitatively as the minimum temperature difference at which initial notch propagated.
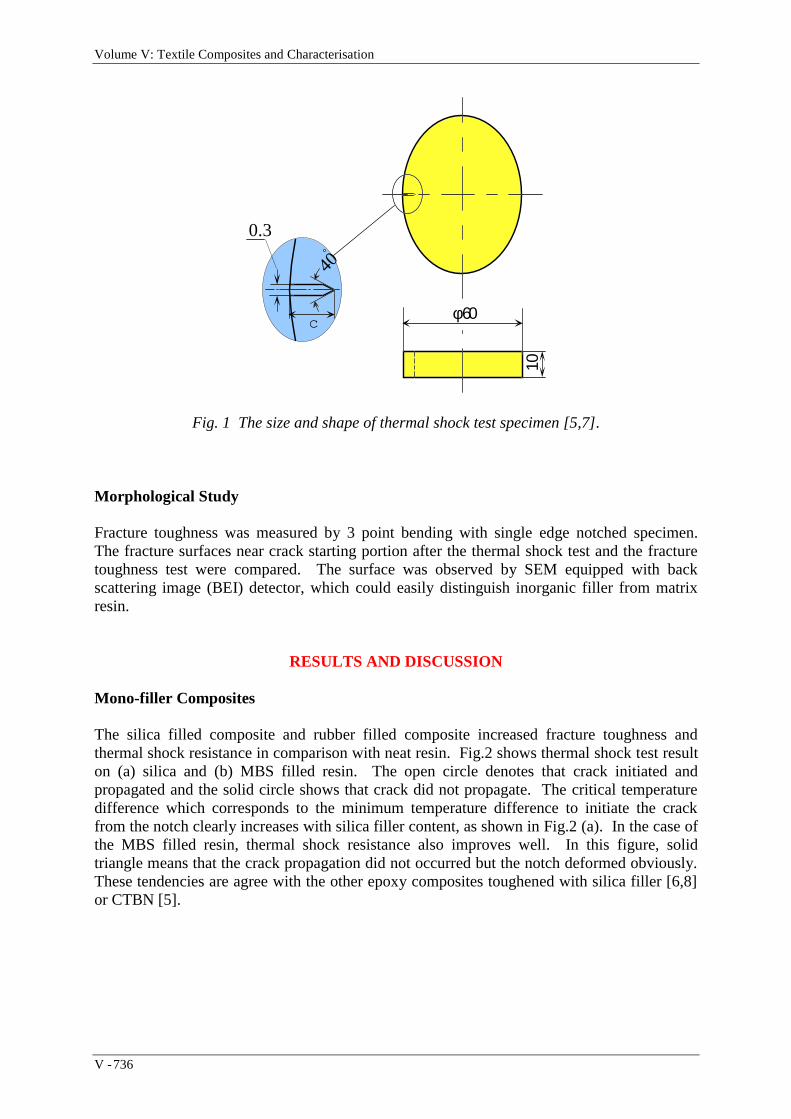
Volume V: Textile Composites and Characterisation
V - 736
c
0.3
φ 60
10
40
Fig. 1 The size and shape of thermal shock test specimen [5,7].
Morphological Study
Fracture toughness was measured by 3 point bending with single edge notched specimen.The fracture surfaces near crack starting portion after the thermal shock test and the fracturetoughness test were compared. The surface was observed by SEM equipped with backscattering image (BEI) detector, which could easily distinguish inorganic filler from matrixresin.
RESULTS AND DISCUSSION
Mono-filler Composites
The silica filled composite and rubber filled composite increased fracture toughness andthermal shock resistance in comparison with neat resin. Fig.2 shows thermal shock test resulton (a) silica and (b) MBS filled resin. The open circle denotes that crack initiated andpropagated and the solid circle shows that crack did not propagate. The critical temperaturedifference which corresponds to the minimum temperature difference to initiate the crackfrom the notch clearly increases with silica filler content, as shown in Fig.2 (a). In the case ofthe MBS filled resin, thermal shock resistance also improves well. In this figure, solidtriangle means that the crack propagation did not occurred but the notch deformed obviously.These tendencies are agree with the other epoxy composites toughened with silica filler [6,8]or CTBN [5].
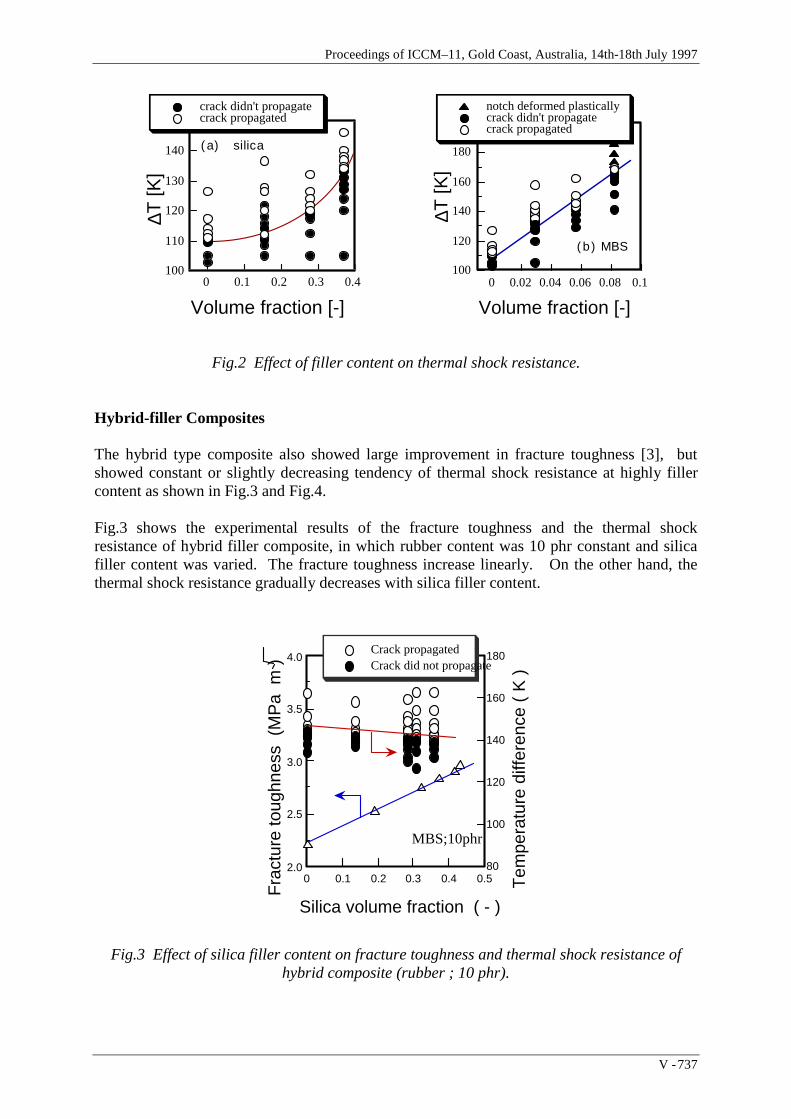
Proceedings of ICCM–11, Gold Coast, Australia, 14th-18th July 1997
V - 737
100
110
120
130
140
150
0 0.1 0.2 0.3 0.4
crack didn't propagatecrack propagated
Volume fraction [-]
∆T [K
]( a) silica
100
120
140
160
180
200
0 0.02 0.04 0.06 0.08 0.1
notch deformed plasticallycrack didn't propagatecrack propagated
∆T [K
]
Volume fraction [-]
( b) MBS
Fig.2 Effect of filler content on thermal shock resistance.
Hybrid-filler Composites
The hybrid type composite also showed large improvement in fracture toughness [3], butshowed constant or slightly decreasing tendency of thermal shock resistance at highly fillercontent as shown in Fig.3 and Fig.4.
Fig.3 shows the experimental results of the fracture toughness and the thermal shockresistance of hybrid filler composite, in which rubber content was 10 phr constant and silicafiller content was varied. The fracture toughness increase linearly. On the other hand, thethermal shock resistance gradually decreases with silica filler content.
2.0
2.5
3.0
3.5
4.0
80
100
120
140
160
180
0 0.1 0.2 0.3 0.4 0.5
Crack propagatedCrack did not propagate
Fra
ctur
e to
ughn
ess
(M
Pa
m )
Tem
pera
ture
diff
eren
ce (
K )
Silica volume fraction ( - )
MBS;10phr
Fig.3 Effect of silica filler content on fracture toughness and thermal shock resistance ofhybrid composite (rubber ; 10 phr).

Volume V: Textile Composites and Characterisation
V - 738
The test result of hybrid filler composite in which silica filler content was kept at 200 phr andrubber content was varied is also shown in Fig.4. Same as Fig.3, the fracture toughnessincreases linearly. On the other hand, in the contrast with the effect of silica filler on thethermal shock resistance shown in Fig.3, the rubber content effect is positive. However, athigh rubber content the effect is very small, so that a tendency that the thermal shockresistance of the mono MBS filler composite surpass the hybrid MBS / silica composite over0.06 volume fraction (cf. Fig.2) is recognized.
2.0
2.5
3.0
3.5
4.0
80
100
120
140
160
180
0 0.01 0.02 0.03 0.04 0.05 0.06
Silica; 200 phr
îjâÛêxê´Crack didn't propagate
Crack propagatedF
ract
ure
toug
hnes
s (
MP
a m
)
Tem
pera
ture
diff
eren
ce (
K )
MBS volume fraction ( - )
Fig.4 Effect of rubber filler content on fracture toughness and thermal shock resistance ofhybrid composite (silica ; 200 phr).
Thermal Shock Resistance Evaluation Based on Fracture Mechanics and Fractography
To discuss the effect of filler content on thermal shock resistance, thermal stress intensityfactor was evaluated with some thermal and mechanical properties. Based on our previousstudy, the thermal shock resistance ∆Tc is expressed as;
∆Tc =1 –ν ⋅KIc
α ⋅ E⋅
C1
R+
k ⋅ 1 –ν ⋅KIc
α ⋅ E⋅
C2
h ⋅ R3
where α is coefficient of thermal expansion, E is elastic modulus, KIc is fracture toughness, νis Poisson’s ratio, k is thermal conductivity, h is heat transfer coefficient, R is the radius of thedisk specimen and C1, C2 are constants determined by the condition of thermal shock test,respectively. The coefficients of thermal shock resistance i.e., the fraction (1-ν)KIc/αE in thefirst term and the fraction k(1-ν)KIc/αE in the second term are measured experimentally andthey are shown in Fig.5. Because h and R are constant, the evaluated values showed thetendency of increasing thermal shock resistance. These tendencies differed form that of Fig.3.Then, some factors should be considered to evaluate the thermal shock resistance of hybridfiller composites.
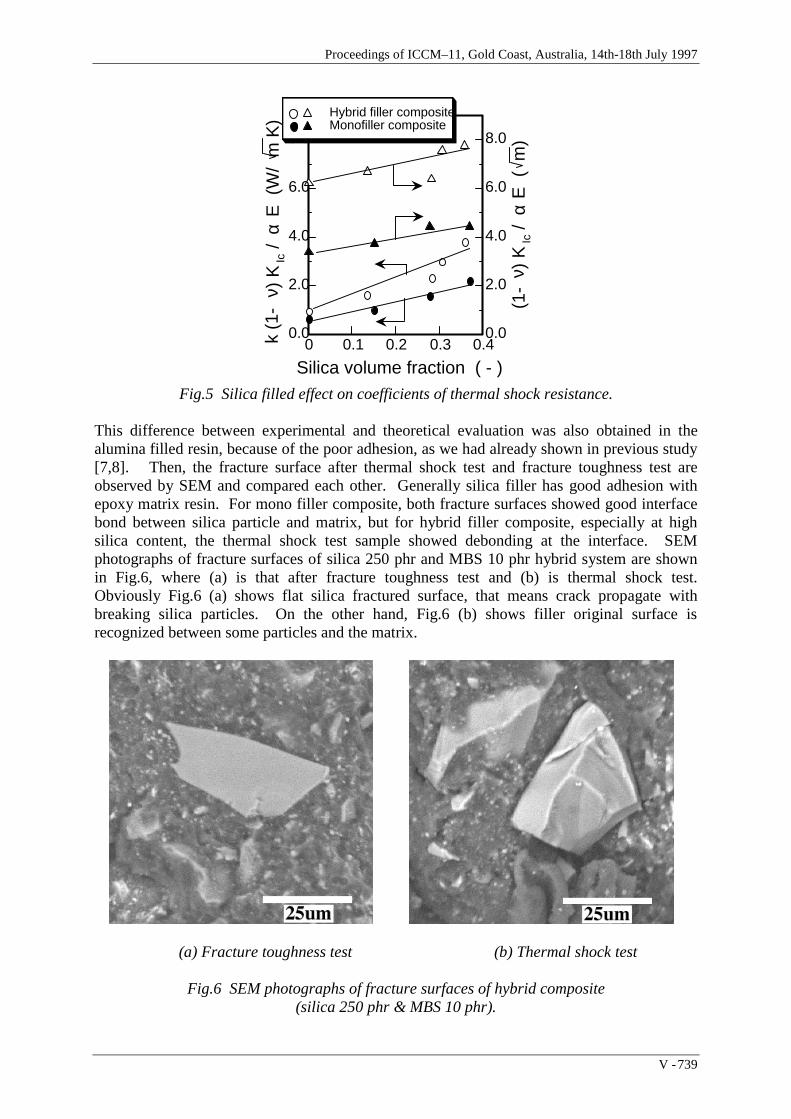
Proceedings of ICCM–11, Gold Coast, Australia, 14th-18th July 1997
V - 739
0.0
2.0
4.0
6.0
8.0
0.0
2.0
4.0
6.0
8.0
0 0.1 0.2 0.3 0.4
Hybrid filler compositeMonofiller composite
k (1
-ν )
KIc /
α E
(W
/ m
K)
(1-
ν ) K
Ic /
α E
( m
)
Silica volume fraction ( - )Fig.5 Silica filled effect on coefficients of thermal shock resistance.
This difference between experimental and theoretical evaluation was also obtained in thealumina filled resin, because of the poor adhesion, as we had already shown in previous study[7,8]. Then, the fracture surface after thermal shock test and fracture toughness test areobserved by SEM and compared each other. Generally silica filler has good adhesion withepoxy matrix resin. For mono filler composite, both fracture surfaces showed good interfacebond between silica particle and matrix, but for hybrid filler composite, especially at highsilica content, the thermal shock test sample showed debonding at the interface. SEMphotographs of fracture surfaces of silica 250 phr and MBS 10 phr hybrid system are shownin Fig.6, where (a) is that after fracture toughness test and (b) is thermal shock test.Obviously Fig.6 (a) shows flat silica fractured surface, that means crack propagate withbreaking silica particles. On the other hand, Fig.6 (b) shows filler original surface isrecognized between some particles and the matrix.
(a) Fracture toughness test (b) Thermal shock test
Fig.6 SEM photographs of fracture surfaces of hybrid composite(silica 250 phr & MBS 10 phr).

Volume V: Textile Composites and Characterisation
V - 740
Then the difference of fracture mechanisms in fracture toughness test and thermal shock testis expected. This weakened interface caused low thermal shock resistance of hybrid fillercomposites.
CONCLUSION
In this study, thermal shock resistance of hybrid particulate filled composites were examined.The fracture toughness and the thermal shock resistance evaluated is summarized in Fig.7. Asshown in Fig.7, hard and soft hybrid filler effect on thermal shock is smaller than that onfracture toughness. This tendency is due to the debonding of silica filler / matrix interface.For this reason, hybrid filler composite should be taken care not to crack if the material usedunder thermal shock condition.
(a)
E
Fig.7 Silica & MBS hybrid filler effect on(a) thermal shock resistance and (b) fracture toughness.
REFERENCES
1. Y.Nakamura, M.Yamaguchi, A.Kitayama, M.Okubo & T.Matsumoto, “Effect ofParticle Size on Fracture Toughness of Epoxy Resin Filled with Angular-shaped Silica”,Polymer, Vol. 32, No. 12 (1991) pp.2221-2229.
2. A.C.Moloney, H.H.Kausch, T.Kaiser & H.R.Beer, “Review: Parameters Determiningthe Strength and Toughness of Particulate Filled Epoxide Resins”, Journal of MaterialScience, Vol. 22, No. 2 (1987) pp.381-393
3. T.Shimizu, Y.Hirano, M.Kamino & A.J.Kinloch, “Improvement in Toughness of EpoxyCasting Materials by Filling Secondary Particles”, Journal of Thermosetting Plastics,Japan, Vol. 15, No. 4 (1994) pp.175-184.
Proceedings of ICCM–11, Gold Coast, Australia, 14th-18th July 1997
V - 741
4. F.Martinatti & T.Ricco, “High-rate Fracture Toughness of Polypropylene-based,Hybrid, Particulate Composites”, Journal of Material Science, Vol. 29, No. 2 (1994)pp.442-448.
5. M.Kubouchi & H.Hojo, “Thermal Shock Resistance of Toughened Epoxy Resins”,Toughened Plastics I; Science and Engineering, ACS Advanced in Chemistry Series,Vol. 233, C.Keith Riew & Anthony J.Kinloch Eds, (1992) pp.365-379.
6. M.Kubouchi, K.Tsuda, T.Nakagaki, K.Arai & H.Hojo, “Evaluation of Thermal ShockFracture Toughness of Ceramic Particulate-filled Epoxy Resin”, Proceedings TenthInternational Conference on Composite Materials, Whistler, British Columbia, Canada,August 14-18, Vol. I: Fatigue and Fracture, Anoush Poursartip & Ken Street Eds,(1995) pp.479-486.
7. M.Kubouchi, “Thermal Shock Test and Evaluation Method of Epoxy Resin forElectrical Insulation”, Journal of Network Polymer, Japan, Vol. 17, No. 2 (1996)pp.89-97.
8. M.Kubouchi, K.Tsuda & H.Hojo, “Thermal Shock Behavior and Evaluation of EpoxyResins Toughened with Ceramic Particulate”, Toughened Plastics II; Novel Approachesin Science and Engineering, ACS Advanced in Chemistry Series, Vol. 252, C.KeithRiew & Anthony J.Kinloch Eds, (1996) pp.119-132.

Volume V: Textile Composites and Characterisation
V - 742
STIFFNESS PROPERTIES OF THREEDIMENSIONALLY (3-D) REINFORCED GLASSFABRICS PRODUCED BY NEEDLE-FELTING
M. Veidt
Department of Mechanical Engineering, The University of Queensland,Brisbane, Australia
SUMMARY: This paper describes the influence of a needle-felting textile process on the in-plane and through thickness stiffness properties of glass fibre-reinforced fabrics. It was shownin [1] that the 3-D reinforcement considerably improves the fracture and delaminationresistance of the material. In the current investigation the changes in the tensile stiffness in theplane of the laminate and the tensile and shear properties in the thickness direction arequantified in-situ by applying non-destructive evaluation techniques. The results show that thefast and cost effective needle-felting process which results in toughness-optimised, glassfibre-reinforced fabrics does not noticeably affect the in-plane stiffness properties of thelaminate.
KEYWORDS: glass fibre-reinforced laminated composite, three dimensional, needle-felting,elastic properties, non-destructive evaluation, ultrasonics
INTRODUCTION
The number of applications of advanced composite materials being employed inmanufacturing constantly increases. But there still remain several obstacles which must beovercome before fibre-reinforced composites will be used exclusively in highly loadedprimary structures. Foremost amongst these are: damage tolerance, delamination resistanceand labor intensive manufacturing procedures. Many investigations have shown that the mosteffective way to improve the toughness and delamination characteristics of traditional twodimensional (2-D) laminates is through thickness reinforcement, eg. [1-5]. Applying costeffective textile processing technologies such as conventional stitching or needle-felting, thedamage tolerance, delamination resistance and compression strength can be significantlyimproved. In general, the textile technologies used in the additional production step neededare very cost effective and do not dramatically increase the total manufacturing costs.Compared to the extensive data available describing the influence of these reinforcementtechniques on the strength, fracture and fatigue behaviour of a large variety of materials, onlylimited data can be found in the open literature describing their influence on the stiffnessproperties of the final product, although they are equally essential for a material to findoptimum application in design and production.
In this paper the influence of needle-felting on the in-plane and through thickness stiffnessproperties of fibre-reinforced laminates comprised of plain weave glass fabrics is studied. Itwas shown in [1] that the extremely fast and cost effective textile process significantly

Proceedings of ICCM–11, Gold Coast, Australia, 14th-18th July 1997
V - 743
improves the fracture and delamination characteristics of the material. The tensile stiffnessesin the plane of the laminate and the tensile and shear properties in the thickness direction ofthe material are determined in-situ by applying non-destructive evaluation techniques whichwere introduced earlier, eg. [6-8].
SPECIMENS
3-D Reinforcement by Needle-Felting
Needle-felting is a fast and cost effective process that can convert stacks of unidirectionalprepreg laminates or woven fabrics into 3-D reinforced preforms in a single operation. Thetechnique is considerably more economical than other methods of three dimensionalreinforcement such as transverse stitching, weaving or braiding. In the needle-felting processa large number of individual, shaped needles are penetrating an aligned lay-up. The punchingdensity in a one step operation may exceed 80 stitches/cm2. The punching process forcesfibres to bend out of the laminate plane which results in a 3-D fibre network. Themanufacturing process is finished by infiltration of the preforms with matrix material andsubsequent curing.
In the current investigation two square plates were tested. Both plates were comprised of fourlayers of glass fabric. The individual plies were woven from 3 mm thick fibre bundles in aplain weave pattern (Eifatex 19). The preform of plate B2 was punched with 80 stitches/cm2
using a conventional needle-felting textile machine. Hot press curing using vacuuminfiltration of the matrix material (Ciba Geigy LY556 Epoxy raisin, HY917 hardener, DY070accelerator) was used to manufacture the final laminates. The characteristic properties of thetwo sample plates are summarised in Table 1.
Improved Delamination Resistance
The influences of the needle-punching process on the mechanical properties of the materialsand their microstructures have been reported earlier, [1]. The major results of theseinvestigations are included in Table 1 and briefly summarised below.
Table 1: Characteristic properties of the glass fibre-reinforced square plates.
Specimen Notation B1 B2Material four layers of
roving fabric,unpunched
four layers ofroving fabric,
punched(80 stitches/cm2)
Lateral Length L [mm] 190 190Mean Thickness 2H [mm] 1.88 2.15
Fibre Volume Fraction [%] 62 51Density ρ [g/cm3] 2.10 1.92
In-plane Tensile Strength Rm [N/mm2] 480 370Delamination Resistance GIc [kN/m] 1.0 5.0Delamination Resistance GIIc [kN/m] 0.8 3.9

Volume V: Textile Composites and Characterisation
V - 744
Obviously, the needle-felting process changes the microstructure of the material. The 3-Dreinforcement increases the volume of the preform. As a result, the thickness of the punchedlaminate is approximately 15% larger than the one of the unprocessed laminate, and the fibrevolume fraction and the density of the punched material are smaller. An additional effectwhich contributes to these reductions is that air or gas is likely been trapped in the 3-D fibrenetwork. Microscopical investigations have shown that the unpunched stacks of specimen B1mainly feature individual, longitudinal gas inclusions which are located primarily between thelaminate layers. In specimen B2 the total volume of the trapped gas is approximately twice ashigh. The inclusions are mainly round, their average diameter is approximately(0.5 ± 0.1) mm, and they are evenly distributed over the entire thickness of the laminate.
The results show that the mode I and mode II crack resistance of the 3-D reinforced laminatesare approximately 5 times the ones of the unpunched material. As expected, the in-planestrength is slightly reduced due to the needle-felting process but an ultimate strength of370 N/mm2 is still sufficient for most technical applications using glass fibre-reinforcedcomposites. The results for the needle-felting processed preforms are in good agreement withresults for other, more expensive through thickness reinforcement techniques such asstitching, weaving or braiding.
EXPERIMENTAL TECHNIQUES
Owing to the symmetry of the individual layers with respect to the laminate plane, sixindependent stiffness values are needed to describe the linear-elastic behaviour of thespecimens. In the Cartesian coordinate system introduced in Fig. 1, these are: E = E11,E’ = E22 = E33, G’ = G12 = G13, G = G23, ν’ = ν 21 = ν 31 and ν = ν 23.
There exist many static and dynamic measurement techniques to determine the elastic moduliof fibre-reinforced materials. In the current investigation the emphasis was on finding thetensile stiffness E in the laminate plane and the tensile and shear stiffnesses E’ and G’ in thedirection of the thickness of the laminate. Therefore, two non-destructive, dynamic measuringtechniques which have proven to allow for the accurate, in-situ determination of thesestiffness components are used to quantify the influence of the needle-felting process, eg.[6 - 8]. The two techniques are briefly recapitulated below.
Flexural Waves
The tensile stiffness E in the plane of the laminate and the shear modulus G’ in the thicknessdirection are determined by analysing the propagation behaviour of centrally excited flexuralwaves. The detailed derivation of the second order solution describing the propagation offlexural waves in an orthotropic material which is needed to analyse the experimental data, anextensive description of the measuring setup as well as an error propagation analysis can befound in [6]. Fig. 1 schematically outlines the measuring concept.
A piezoceramic transducer is used to excite a narrow band, ultrasonic pulse. From thedisplacement signals captured at distinct points along rays using a heterodyne Doppler laserinterferometer, the phase velocity c as a function of frequency f or wavenumber k, ie. thedispersion curve, can be determined. Fig. 2 shows a measured dispersion curve for specimenB1 and B2, respectively.
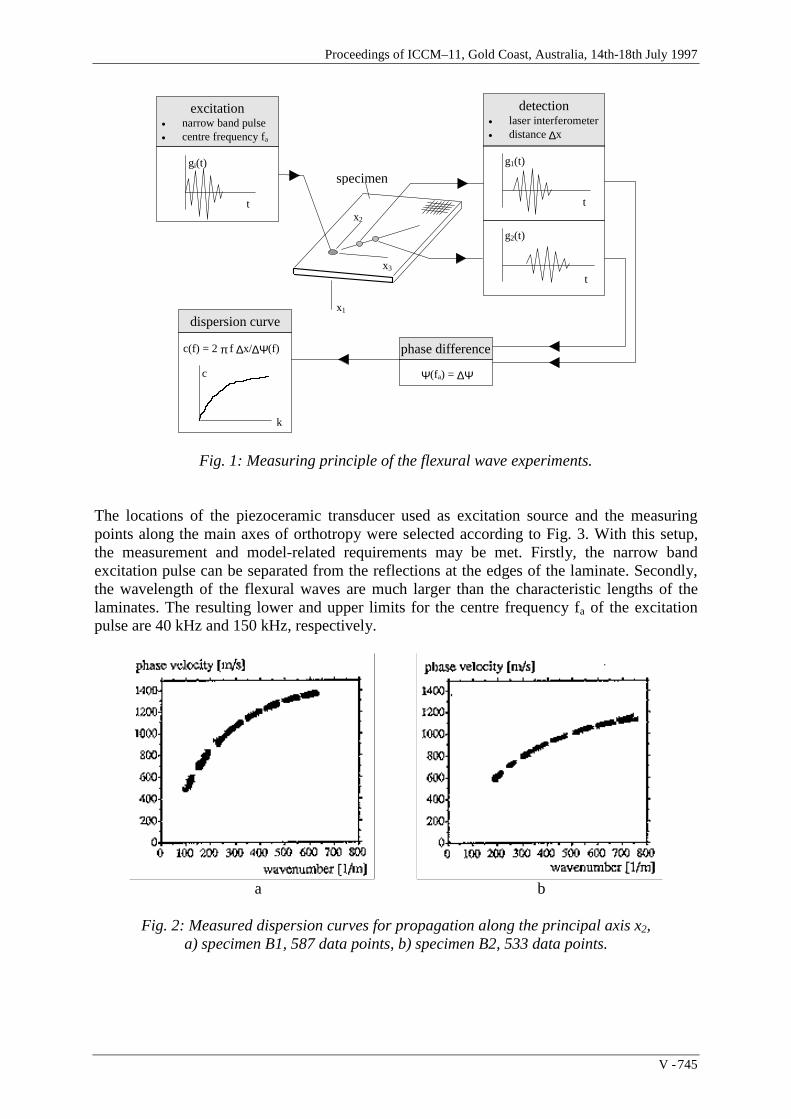
Proceedings of ICCM–11, Gold Coast, Australia, 14th-18th July 1997
V - 745
excitation• narrow band pulse• centre frequency fa
t
gi(t)
detection• laser interferometer• distance ∆x
t
g1(t)
t
g2(t)
specimen
phase difference
Ψ(fa) = ∆Ψ
dispersion curve
c(f) = 2 π f ∆x/∆Ψ(f)
k
c
x2
x3
x1
Fig. 1: Measuring principle of the flexural wave experiments.
The locations of the piezoceramic transducer used as excitation source and the measuringpoints along the main axes of orthotropy were selected according to Fig. 3. With this setup,the measurement and model-related requirements may be met. Firstly, the narrow bandexcitation pulse can be separated from the reflections at the edges of the laminate. Secondly,the wavelength of the flexural waves are much larger than the characteristic lengths of thelaminates. The resulting lower and upper limits for the centre frequency fa of the excitationpulse are 40 kHz and 150 kHz, respectively.
a b
Fig. 2: Measured dispersion curves for propagation along the principal axis x2,a) specimen B1, 587 data points, b) specimen B2, 533 data points.

Volume V: Textile Composites and Characterisation
V - 746
x3
x2
3565
190
4x10
1
2
Fig. 3: Selection of excitation location and measuring points (dimensions in [mm]),1: excitation point, 2: measuring points, ∆x = 10 mm.
Evaluation of the measured dispersion curves is based on the theoretical analysis of thepropagation behaviour of flexural waves in an orthotropic plate, [6]. A perturbation methodwas used to derive the general, second order dispersion relation. For propagation along theprincipal directions x2 and x3, we may write:
c HkE
HkE
G≅ +
−
31
2
52
12
ρ( )
' (1)
Point Source/Point Receiver Technique
The stiffness E’ in the thickness direction was determined using a point source/point receiver(PS/PR) ultrasonic measurement technique, eg. [7, 8]. The setup is schematically outlined inFig. 4.
*
1
2 3
4
5
6
1
2
36
5
4specimen
trigger generatorPVDF piezofilm (Keynar),thickness 9 µm
broadband excitationfracture of glass capillary
piezoceramic point detectorpinducer (Valpey Fisher), aperature1.3 mm
ultrasonic preamplifier(Panametrics, 5660C)
transient recorder(Tektronix, AD390)
Fig. 4: Schematic of the setup used in the PS/PR experiments.
Calculation of the stiffness is based on measuring the arrival time of a broad band excitationpulse. The group velocity cp of the primary wave is calculated from the measured time offlight ∆t and the distance between the excitation point and the receiver location. If the spring-

Proceedings of ICCM–11, Gold Coast, Australia, 14th-18th July 1997
V - 747
loaded receiver is mounted at the so-called epicentral location, ie. directly below theexcitation point, the stiffness E’ in the thickness direction can be determined using:
E cH
tp'≅ =
ρ ρ22
2
∆(2)
RESULTS AND DISCUSSION
In the case of the flexural waves the dispersion curves were determined using eight differentcentre frequencies fa between 40 kHz and 140 kHz. Owing to the possibility of determiningthe phase velocity by analysing the signals captured at randomly selected measuring pointsalong the principal directions x2 and x3, twelve dispersion curves with respectively about 100data points were determined for each laminate. The characteristic stiffness values E and G’are determined from these data points by non-linear regression using equation (1). Evaluationof the twelve dispersion curves for the specimens B1 and B2 affords the following values forthe desired stiffness components.
Specimen B1 E = (36 ± 3) GPa G’ = (6.0 ± 0.5) GPaSpecimen B2 E = (31 ± 3) GPa G’ = (5.7 ± 0.5) GPa
The standard deviations greatly exceed the inherent accuracy of the measuring technique itselfwhich was determined from an error propagation analysis, [6]. The reason is that themicrostructure of the specimens produced by hot press curing using vacuum infiltration,considerably varies from point to point and consequently, the standard deviation of thedetermined stiffness values is large. Nevertheless, the mean values represent reliablequantities describing the global stiffness behaviour of the structures.
The needle-felting process has only a slight effect on the two stiffness components. Althoughthe delamination resistance of the needle-punched laminate is a multiple of the conventionalmaterial, the stiffness values in the plane of the laminate are of the same order of magnitude.The considerable improvements in terms of crack resistance do not have an noticeable adverseeffect on the in-plane tensile properties.
The test setup for the PS/PR experiments outlined in Fig. 4 makes it possible to easily collectdata at various locations. Finding the average of all measurements thus affords values for thetensile stiffness E’.
Specimen B1 E’ = (8.5 ± 2) GPaSpecimen B2 E’ = (15 ± 3) GPa
As expected, the above mentioned inhomogenities turn out to have a considerable influencewhich results in large standard deviations. The mean values, however, definitely show thatdue to the additional reinforcement in the thickness direction, the tensile stiffness E’ increasesby about 70%.

Volume V: Textile Composites and Characterisation
V - 748
CONCLUSIONS
Needle-felting of stacks of conventional glass textiles considerably improves the interlaminarproperties of the laminates without having an appreciable adverse effect on the elasticproperties. The tensile stiffness in the plane of the plate decreases by less than 10% while thetensile stiffness in the thickness direction increases by about 70%. The shear modulus G’ inthe direction of the thickness of the plate remains approximately constant. The needle-feltingprocess seems to be an extremely cost effective method to produce toughness-optimised, glassfibre-reinforced fabrics whose in-plane elastic properties are not noticeably affected.
It remains to be elucidated whether this promising manufacturing process affords the samefavourable results for aramide and also for carbon fibre-reinforced materials.
ACKNOWLEDGMENTS
This investigation was initiated by Dr C. Wuethrich (ABB, Switzerland) and the companyMicafil AG (Zuerich). The author acknowledges the support of Prof. M.B. Sayir, Institute ofMechanics, ETHZ and Prof. W. Sachse, Theoretical and Applied Mechanics, Cornell. DrK.Y. Kim is thanked for valuable help in setting up the point source/point receiver measuringsystem and Mr A. Hochuli for collecting some of the flexural wave propagation data.
REFERENCES
1. Wuethrich, C. and Keser, G., “Better mechanical properties of composites through needling”,Kunststoffe/German Plastics, Vol. 82, 1992, pp. 127 - 131.
2. Dransfield, K., Baillie, C. and Mai, Y.W., “Improving the delamination resistance of CFRPby stitching - a review”, Composites Science and Technology, Vol. 50, 1994, pp. 305 - 317.
3. Evans, D.A. and Boyce, J.S., “Transverse reinforcement methods for improved delaminationresistance”, 34th International SAMPE Symposium and Exhibition - Tomorrow’s Materials,Book 1, SAMPE, Covina, USA, 1989, pp. 271 - 282.
4. Bannister, M.K. and Herszberg, I., “Textile preforms for composite structures”, 5thAustralian Aeronautical Conference, Part 2, IE Aust, Crows Nest, AU, 1993, pp. 357 - 362.
5. Burnett, E.J. and Harris, J.A., “High performance needled structures in composites”, 35thInternational SAMPE Symposium and Exhibition - Advanced Materials, Part 2, SAMPE,Covina, USA, 1990, pp. 1533 - 1543.
6. Veidt, M. and Sayir, M.B., “Experimental evaluation of global composite laminate stiffnessesusing flexural waves”, Journal of Composite Materials, Vol. 24, 1990, pp. 688 - 706.
7. Sachse, W. and Kim, K.Y., “Point source/point receiver materials testing”, UltrasonicMaterials Characterization, Vol. 2, J. Boussiere, Ed., Plenum Press, New York, USA, 1987,pp. 707 - 715.
8. Every, A.G., Sachse, W., Kim, K.Y. and Niu, L., “Determination of elastic constants ofanisotropic solids from group velocity data”, Review of Progress in Quantitative Non-Destructive Evaluation, Vol. 10B, D.O. Thompson and D.E. Chimenti, Eds, Plenum Press,New York, 1991, pp. 1663 - 1668.

Proceedings of ICCM–11, Gold Coast, Australia, 14th-18th July 1997
V - 749
MECHANICAL RESPONSE OF PARTICLE-FILLEDPOLYETHYLENE ON ELECTRICALLY GENERATED
THERMAL SHOCK PULSE
Joachim Glatz-Reichenbach, Jørgen Skindhøj and Ralf Strümpler
ABB Corporate Research, CH-5405 Baden-Dättwil, Switzerland
SUMMARY: Highly conducting metal-filled polyethylene with positive temperaturecoefficient (PTC) of resistivity have been prepared and exposed to strong transient currentpulses. Caused by the strong non-linear change of resistivity with temperature, a narrow hot-zone is formed in the center part of the test samples. The resistivity switches by eight ordersof magnitude and interrupts the current flow. The thermally stimulated mechanical shockpulse is monitored with a laser distance sensor system and the surface temperature develop-ment by an infrared camera. The combined results of electrical, mechanical and temperaturemeasurement are used to determine extension and Young’s Modulus of the hot-zone.
KEYWORDS: positive temperature coefficient of resistivity, electrical conductivity, thermalexpansion, thermal imaging, mechanical response, polymer composite
INTRODUCTION
In order to meet the needs of industry for materials with new and suitable electrical,mechanical and thermal properties, the interest in composites is more and more increasing.One class of functional composites are polymers which are filled with particles havingtailored properties. Such kind of materials can combine flexibility, lightweight, low cost andsimple processability of polymeric materials with an additionally desired functionality of thefiller material as, e.g., high electrical [1] or thermal conductivity [2], polarizability [3],magnetic [4] or non-linear dielectric properties [5,6].
Carbon black or metal filled polymers show, for example, a positive temperature coefficient(PTC) of the electrical resistivity. Therefore, they are widely used as self-regulating heatingtapes [7] or circuit protecting devices [8,9]. Such polymer based composites with PTCbehavior are also interesting systems in order to study the correlation between thermal,mechanical and electrical properties of composites in general. The thermal energy isgenerated mainly close to the contact points of the conducting filler particles. Due to the highthermal conductivity of the filler particles, they heat up first. Then the surrounding polymer isheated too and expands due to its relatively large thermal expansion coefficient. The thermalexpansion works against internal mechanical stresses, which have been built up during thepreparation of the sample, until a certain expansion has been achieved. Then a strong changein resistivity is observed caused by changes in gap distance of the particle-particle contacts inthe expanded matrix. This view is supported by measurements on metal particles in epoxy[10] and holds for a thermoplastic matrix as well. A similar explanation has been given byCarmona et al. for carbon fibers in epoxy [11].

Volume V: Textile Composites and Characterisation
V - 750
For applications under severe conditions (i.e. high current or electrical field, elevatedtemperature and mechanical shock), it is important to understand the dynamic correlationbetween electrical, thermal and mechanical properties of such composites in order to findtheir physical limits. It has been shown recently, that the filler particle size has a stronginfluence on the tripping dynamic under high current load. The PTC material trips faster, thesmaller the particles are [12].
In the present paper, the strong nonlinearity of the resistivity with temperature is utilized togenerate a thermo-mechanical shock wave. When a strong current is applied to the PTCmaterial, it is heated very fast by Joule's losses. Due to the nonlinearity of the resistivity, itbecomes even faster and concentrates on hot-spots. The temperature increase gives rise to arapid thermal expansion of the polymer and results in a thermo-mechanical shock wave. Thisis accompanied by a resistance increases of several orders of magnitude, which interrupts thecurrent flow. The motion of the sample, detected by a laser interferometer system, and thecurrent are measured simultaneously. The amplitude of the expansion is related to theextension of the hot-zone and the thermal expansion coefficient of the composite. Thefrequency of the oscillation can be correlated to the Young‘s Modulus of the hot compositeand the total accelerated mass of the test samples.
MATERIAL PREPARATION AND CHARACTERIZATION
The active body of the PTC-samples is a polymer-metal composite consisting of 50 vol.-% ofhighly conducting TiB2 particles in different polyethylene matrixes (see Table 1). In order toachieve a homogeneous dispersion, filler and matrix material were compounded for severalminutes by using a Brabender Plasticorder at temperatures around 180°C. After compoundingthe composites were hot-pressed at 145°C and 11 MPa to form several mm thick plates. Thedependence of the electrical resistivity of the composite material on the temperature wasdetermined by using an HP 4247 A Impedance Analyzer. The small test samples had sizes of20mm⋅10mm⋅2mm and were measured in four-probe geometry.
Fig. 1 shows the behavior of the resistivity ρ as a function of temperature for a heating and asucceeding cooling run of the composite with high-density polyethylene (HDPE5261Z) asmatrix material. The resistivity increases by eight orders of magnitude from about 10-2Ωcm atambient room temperature to more than 106Ωcm at 140°C. After cooling, the resistivity comesback to almost the same value as before heating, i.e. the PTC effect is repetitive.
The temperature dependence of ρ between 30 and 120°C is weak. Around 135°C, however, astrong increase of seven orders of magnitude in ρ occurs within a narrow temperature range ofonly 15°C. The strong step in resistivity is observed close to the melting temperature Tm =134°C, as expected [1], and can be associated with the strong non-linear temperaturedependent thermal expansion of the polyethylene matrix near its melting temperature [13].The strong nonlinearity of ρ(T) can be expected as the driving force for the creation of onlyone localized hot-zone in one composite PTC element. The thermal expansion of e.g. high-density polyethylene HDPE5231, filled with 50 vol.-% TiB2, was measured by dilatometry asshown in Fig. 2. The thermal expansion coefficient α is defined by the slope of the curve andexhibits a strong increase when approaching the melting temperature of the matrix material.The composite material looses mechanical strength at elevated temperatures which restrictsthe measurement of α(T) by dilatometry to temperatures below the melting temperature.

Proceedings of ICCM–11, Gold Coast, Australia, 14th-18th July 1997
V - 751
Table 1: Important material parameters at T = 25°C are listed for two high densitypolyethylene materials; Melting temperature (Tmelt), specific heat (c), specific melting enthalpy
(cmelt), thermal conductivity (λ), mass density (ρ), Young’s Modulus (E), tensile strength(Etensile) and thermal expansion coefficient (α) between 20 and 80°C.
⇓ property ; material ⇒ HDPE5231 HDPE5261Z
Tmelt (°C) 133 134
c (J/gK) 1.9 1.7
cmelt (J/g) 165 200
λ (W/Km) 0.37 0.41
ρ (g/cm3) 0.952 0.954
E (GPa) 1.1 1.3
Etensile (MPa) 25 27
α (20-80°C) (10-6/K) 150-180 130-160
Fig. 1. The specific resistivity ρ of 50vol.-% TiB2 filled high density
polyethylene HDPE5261Z as a functionof temperature for one heating/cooling
cycle, which was done within threehours.
Fig. 2: The relative thermal expansion • l/l of50 vol.-% TiB2 filled high density polyethylene
of type HDPE5231 as a function of tem-perature.
TEST SAMPLES
A side-view sketch of the used sample arrangement is shown in Fig. 3a. The sample consistsof an about 2 mm thick plate of the composite material with aluminum contacts, which arepressed onto the composite. The press contacts are mounted by flexible brass plates. Aceramic varistor disc is fixed and pressed between the two brass plates together to form agood electrical connection to the PTC element.

Volume V: Textile Composites and Characterisation
V - 752
In order to make sure that the sample trips in the center part of the PTC element, the cross-section of the PTC-body is simply reduced by holes. This technique to define a tripping zoneby reduced cross-section, is well known and already industrially used [14,15]. A top view ofthe composite body with the aluminum contacts is seen in Fig. 3b.
The total resistance RcoldPTC of the sample comprises the resistance of the composite plate
between the contacts Rcold, plus the contact resistance Rcontact between the composite materialand the metal contacts but without the negligible resistance of the brass terminals themselves.
RcoldPTC = Rcold + Rcontact = 1.0832⋅
ρ ⋅ lA
+ Rcontact (1)
where A is the cross-section of the PTC plate, l is the length of the PTC plate between theelectrodes, Rcontact is the contact resistance between the PTC-body and the press contacts, and ρis the specific resistivity of the PTC composite well below Tc. The factor 1.0832 results fromthe particular sample geometry.
Fig. 3: (a) The sample set-up of the PTC composite resistor (very left), connected in parallelto a spacer, which provides mechanical stability and a ceramic varistor disc (top right in (a)).The incident and reflection direction of the laser beam and the direction of the motion of theexpansion (∆z) are also indicated. (b) Sketch of PTC-body and the contacts as seen from top.
ELECTRICAL MEASUREMENTS
The electrical arrangement to generate the high and fast increasing current through the PTCcomposite sample is realized with a low impedance capacitor bank. The circuit lay-out isgiven in Fig. 4. The varistor limits over-voltages in the circuit which are generated during theresistance change of the PTC composite. The relevant circuit parameters are: C = 14.6mF,L = 54µH, which give rise to Imax = 4.9kA at a frequency of 179 Hz for a loadingvoltage U = 300V.

Proceedings of ICCM–11, Gold Coast, Australia, 14th-18th July 1997
V - 753
Fig. 4: Sketch of the used electricalcircuit for generating the high currentpulse through the composite material.
The circuit parameters are: Capacitor C= 14.6mF, Inductance L = 54µH.
Fig. 5: Thermal image of 50 vol.-% TiB2 filledHDPE5261Z material 100ms after tripping. Theinsert in the upper part shows the temperaturedistribution along the line perpendicular to the
current flow direction.
EXPANSION MEASUREMENT
A commercially available laser distance sensor, Type: Keyence LC-2400A, is used for thedetection of the dynamic expansion of the PTC resistor during the high current flow and itslimitation. The principle of measurement bases on optical triangulation and is describedelsewhere [16,17]. The distance signal is calibrated and directly available as an analogueoutput signal (for example: 1V for 10µm). For the described experiments a resolution of 0.5µm and a sampling rate of 50 kHz is obtained with the optical sensor. In order to avoiddisturbing mechanical resonance oscillations, the expansion is measured in some cases withone fixed contact. The expansion of the entire composite plate is detected at the polishedsurface of one flexible contact about 3 mm apart from the sample’s axis. Therefore a multiplecorrection factor of 1.12 has to be taken into account to get the right ∆z-amplitude.
With the simultaneous measurement of dynamic expansion and current flow through the PTCcomposite it is possible to demonstrate on a µs-timescale how the current limitation iscorrelated to the thermal expansion.
THERMAL IMAGING
During the experiments thermal images of the sample surface are recorded at video frequency(i.e. 30 pictures/s) by an infrared detection system (Nippon Avionics Co. Ltd., TVS-2200ST).With this method the surface temperature of the PTC sample can be monitored and providesadditional information to estimate approximately the size and the shape of the region wherethe PTC trips. In Fig. 5 a typical image of an infrared picture is shown, which was taken 90to 120 ms after the current flow through the PTC element was started.

Volume V: Textile Composites and Characterisation
V - 754
RESULTS AND DISCUSSION
In Fig. 6 measurements of the current and voltage response (top part) and the energy inputinto the PTC element and the parallel varistor (bottom part) are given. Current flow starts att0 = 1.45ms and heats up the PTC sample. The PTC sample warms up, increases its resistancewhich is accompanied by a voltage drop across the sample. At t = 2.1ms the maximumresistance is reached, the current is commuted to the parallel varistor according to its voltage-current characteristic, and the current through the PTC element is suppressed nearly to zero.At tend = 2.8ms, i.e. approximately 1.35ms after the start of experiment, no current can bedetected anymore.
The energy input into the PTC element (EPTC) and the varistor (EVAR), as plotted in Fig. 6, arecalculated by Eqn 2
E = E PTC + E VAR = I PTC
t 0
t end
∫ ⋅ U ⋅ dt + I VAR
t 0
t end
∫ ⋅ U ⋅ dt (2)
where IPTC and IVAR are the currents through PTC element and varistor, U is the voltage acrossthem, and t0 and tend are the times when current flow starts and ends, respectively. The inputenergies are typically 150J for the PTC element and 250J for the parallel varistor.
The particular sample geometry with reduced cross-section in the center part of the PTC-bodygives rise to a well defined tripping region. The temperature distribution at the PTC samplesurface, as recorded just 100 ms after current flow start, is displayed in Fig. 5. Only a narrowzone of the PTC-body with an extension of few mm in current flow direction seems to beheated up sufficiently high for the PTC effect to take place. Therefore, three different regionsof energy input during current flow can be localized. The contact region close at and alsounder the aluminum contacts, the PTC-body with constant cross-section, and the center part ofthe PTC-body with reduced cross-section. When a current is applied to the PTC sample, it isheated by Joule’s losses with the power
P(t) = U(t) ⋅ I PTC = RPTC(t) ⋅(I PTC(t))2 (3)
and the total energy input into the PTC sample can be calculated with Eqn 4
E PTC = R ( t ) PTC ⋅t 0
t end
∫ ( I ( t ) PTC ) 2 ⋅ dt (4)
where RPTC(t) and IPTC (t) are the time dependent total resistance and current of the compositesample. With respect to the sample geometry, Eqn 4 can be split into three singlecontributions, i.e. the contribution of the contact (Econtact), of constant cross-section (Eside) andof reduced cross-section (Ecenter) as formulated in Eqns 5 and 6
EPTC = Econtact + Eside + Ecenter (5)
E PTC = [( Rcontact + Rcold
t0
t end
∫ + ( ρ nn = 1
k
∑ (T ( t )) − ρ ) ⋅l n
A n
) ⋅ ( I PTC ) 2 ] ⋅ dt (6)

Proceedings of ICCM–11, Gold Coast, Australia, 14th-18th July 1997
V - 755
where Rcontact is the contact resistance, Rcold is the resistance of the entire PTC-body at roomtemperature (25°C), ρ is the specific resistance at room temperature, ρn(T(t)) is the time andtemperature dependent specific resistivity of a volume element (ln⋅An) inside the hot-zone, Anis the cross-section of a nth volume element of the length ln in current flow direction andfinally IPTC is the current through the PTC element.
Fig. 6: Upper part: Voltage across PTC element (Voltage), varistor current (VAR-Current),current through the PTC element (PTC-Current) and total current (TOT-Current), as
mentioned in the foot line, are displayed in the relevant time window. The current flow startsat to = 1.45ms. Bottom part: The energy input into the PTC element (PTC-Energy), thevaristor (VAR-Energy) and the total input energy (TOT-Energy) as calculated from the
measured voltage and currents of the upper part.
Eqns 5 and 6 determine the energy input into the three regions separately. The result for aPTC element with HDPE5261Z matrix is seen in Table 2, with k = 20 and all ln of samelength, Rcontact = 11.1 mΩ and Rcold = 27 mΩ, with the ρ(T)-characteristic from Fig. 1 and acurrent response as seen in Fig. 6 (top part). It is observed that a major part of the energy isdeposited in the region of constant cross-section. A rough estimation of the temperaturedevelopment of the parts of constant and reduced cross-section can be done by assumingadiabatic conditions during heating up within few ms, i.e. there is no energy exchange withthe surrounding. The entire electrical energy (Einput) is used to heat the parts of the PTC from astarting temperature Tstart to an end temperature Tend homogeneously. Eqn 7 is applied for bothregions separately with different m and Tend and a specific heat c(T) of weak temperaturedependence.

Volume V: Textile Composites and Characterisation
V - 756
Einput = m⋅ c(T) ⋅ dT with ∆Tmax
Tstart
Tend
∫ = Tend − Tstart (7)
The PTC part of reduced cross-section is heated above melting temperature, thus an additionalmelting enthalpy of about 200J/g for the polyethylene has to be taken into account. Theresulting average temperature increase is listed in Table 2. Although the temperature increaseof the part of constant cross-section is only 45°C, the major part of the energy is deposited inthis region. A smaller energy input of 41J into the middle part is sufficient to bring the PTCelement into the high-resistive state.
The results are in good agreement with the measured input energy into the PTC element asseen in Fig. 6 and the surface temperature development as seen from Fig. 5.
Table 2: For the three different regions of the PTC sample the resulting input energies andthe maximum average temperature increase ∆Tmax are listed.
part of the PTC sample Input-Energy (J) ∆Tmax (°C)contact region 26 -
constant cross-section 73 45reduced cross-section 41 125
entire PTC sample 140 > 45
In Fig. 7 the dynamic expansion of a test sample (full line) and the current through it (dashedline) are shown within a time window of 10ms. The current starts to increase with a slope ofabout 5kA/ms at to = 1.45ms, reaches the maximum value of 2.3kA about 0.6ms later and issuppressed nearly to zero at tend = 2.3ms. Of course, even after this time, there is still a residualcurrent in the mA-range, which is high enough to keep the sample in the high-resistive state.This current is mainly determined by the external cooling conditions and the ρ(T)-characteristic.
It is interesting to note that the short-circuit current is limited long before the element reachesits final expansion. The expansion starts at t = 1.75ms and reaches at t = 2.9ms a maximumelongation of 65µm. After reaching the maximum expansion, mechanical oscillations areobserved around the new stable position of the sample at about 50µm elongation.
The thermal energy is supposed to be generated mainly close to the contact points of theconducting filler particles. Due to the low thermal conductivity of the polymer, a time delayof about one ms between the maximum of the current and the thermal expansion of thecomposite is observed. The resistivity increase by the mechanical separation of the conductingfiller particles is obviously high enough to suppress the current to about zero long before thefull expansion is achieved.
The thermal images, which were taken 100ms later, show a hot-zone which expands over theentire sample cross-section perpendicular to current flow direction. In current flow direction,the hot-zone is strongly localized to a narrow region of only a few mm. Thus, as alreadyconfirmed in the previous section, the tripped PTC-body can be divided into a cold part withTlow << Tc and a hot part with Thigh Tc.

Proceedings of ICCM–11, Gold Coast, Australia, 14th-18th July 1997
V - 757
The extension of the hot-zone can be determined by analyzing the thermal images and thethermal expansion into the new stabile ∆z-position of the PTC sample. The linear onedimensional thermal expansion in current flow direction can be approximated by Eqns 8 and 9
∆z = ∆zhotzone+ ∆zcold = α(T) ⋅ zhotzzone⋅ dT + α(T) ⋅ (l − zhotzone) ⋅ dTTstart
Tlow
∫Tstart
Thigh
∫ (8)
∆z = α(T) ⋅ zhotzone⋅Tlow
Thigh
∫ dT + α(T)⋅ l ⋅ dTTstart
Tlow
∫ (9)
The extension of the hot-zone can be estimated by integrating Eqn 9, using a measured∆z = 60µm, T0 = 25°C, Tlow = 55°C, Thigh = 120°C, l = 15mm, and α(T) from Fig.2. This resultsin an extension of the hot-zone zhotzone 1.5mm, which is about 10% of the total length of thePTC element.
Fig. 7: The current (dashed line) and the expansion of a test sample (full line) of HDPE5261Zcomposite material, are shown within a time window of 10ms. After reaching the maximumexpansion of 65µm, mechanical oscillations are observed around the new stable position of
the sample at about 50µm elongation.
The temperature induced expansion reaches a maximum elongation and oscillates little laterwith a small amplitude around a stable extended position. The center part of the PTC-bodydevelops the highest temperature. Due to the strong decrease of Young’s Modulus ofpolyethylene when approaching the melting point, the center part of the PTC (the hot-zone)may be the region of largest mechanical deformations during the oscillations.
From the mechanical oscillations around the stable ∆z-position of the expanded PTC samplethe calculation of the Young’s Modulus of the hot-zone is possible. The oscillation around thenew stabile position can be approximated by a harmonic oscillator with frequency f andamplitude ∆x. In Eqn 10, m denotes the total accelerated mass, a is the acceleration, D thespring constant of the used brass terminal and Yhotzone is the mean Young’s Modulus of thecomposite material inside the hot-zone. The cross-section of the hot-zone is assumed to beconstant Ahotzone 0.5 cm2 for simplification.
F = m ⋅ a = m⋅ 4π 2 ⋅ f 2 ⋅ ∆x =Yhotzone⋅ Ahotzone
zhotzone
− D
⋅ ∆x (10)

Volume V: Textile Composites and Characterisation
V - 758
A mean Young’s Modulus of the hot-zone can be determined by using the measuredfrequency f = 460Hz, m = 0.014kg, D = 11kN/m and zhotzone = 1.5mm. Eqn 10 yieldsEhotzone = 3.84MPa, which is less than 0.5 % of the value of the pure polyethylene at roomtemperature.
CONCLUSION
The combined on-line measurement of electrical current and mechanical motion, combinedwith the monitoring of the surface temperature by an infrared detecting system is a powerfultool to investigate the impact of locally generated thermal shock waves in structuredcomposite materials. The technique correlates the thermally stimulated mechanical expansionof the composite to the heat generation and transport in the electrically conducting compositematerial. The combined measurement gives an interesting insight to the interaction of theelectrical, mechanical and thermal properties of electro-composites.
The calculations yield a length of about 1.5mm for the hot-zone with an average Young’sModulus of about 4MPa.
REFERENCES
Proceedings of ICCM–11, Gold Coast, Australia, 14th-18th July 1997
V - 759
MICROMECHANICS FOR CONTINUOUS FIBERREINFORCED COMPOSITES VIA FIBER SUB -
STRUCTURING
Subodh K. Mital1, Theo G. Keith, Jr.1 and Pappu L. N. Murthy2
1Department of Mechanical, Industrial and Manufacturing EngineeringThe University of Toledo, Toledo, Ohio 43606, U.S.A.
2Structures Division, Lewis Research Center,National Aeronautics and Space Administration, Cleveland, Ohio 44135, U.S.A.
SUMMARY: A methodology combining composite micromechanics with a unique fibersubstructuring concept is described. In this new concept, the conventional unit cell (thesmallest representative volume element) of the composite is modified by substructuring it intoseveral slices and developing the micromechanics-based equations at the slice level. Thismethodology has several advantages and allows for a more accurate micromechanicalrepresentation of the various constituents of the composite. Although, applicable to differenttypes of composite materials, it is particularly well-suited to simulate the ceramic matrixcomposites (CMC’s) behavior. Important features of this approach and its effectiveness aredescribed by using select examples for a SiC/RBSN composite system. Comparison ofpredictions and limited experimental data are also provided.
KEYWORDS: micromechanics, unit cell, interphase, interface, progressive fracture,progressive debonding, partial interphase bond, stress redistribution
INTRODUCTION
Recently, there has been growing interest in the use of fiber reinforced composite materials inwidely varying applications such as aerospace, civil infrastructure, sporting goods, marineapplications, automobiles etc. Fiber reinforced composites offer many advantages overtraditional materials in higher stiffness/weight ratio, flexibility in design capabilities, excellentcorrosion/wear/impact resistance and fatigue strength. The characterization of these materialsis fundamental to their reliable use. The analysis of fiber reinforced composites presentsmany modeling challenges due to heterogeneity of these materials. Unlike their homogeneousisotropic counterparts, the anisotropic construction of laminated composites results in manyunique phenomena that occur at different geometrical scales - at the global (laminate) level,the lamina (ply) level as well as at the fiber-matrix (constituent) level. To account for thesephenomenon in a more accurate manner, a unique micromechanics based fiber sub-structuringtechnique has been developed. Although, the technique is applicable to any kind ofcomposite material behavior simulation, it is particularly well suited for simulating aspectsunique to ceramic matrix composite behavior. The design of interphase/coating plays a keyrole in ceramic matrix composites to enhance their fracture toughness. It is well known thatceramic matrix composites are reinforced primarily to enhance their fracture toughness. Aweak fiber/matrix interface allows the toughening mechanisms such as fiber bridging, crack

Volume V: Textile Composites and Characterisation
V - 760
deflection, matrix microcracking, fiber debonding, and fiber pullout to be combined to reduceresidual stresses and eliminate catastrophic failures. The methodology is based onmicromechanics models in which customarily a representative volume element or unit cell isarranged in a square array pattern. However, the present approach employs a uniquemultilevel substructuring : from laminate to ply, to subply and then to fiber (figs. 1 and 2).The fiber is substructured into several slices and the micromechanics equations are applied atthe slice level. The laminate theory is used recursively to obtain the laminate level properties.This technique has several advantages - it can model partial interphase bond, provides moreaccurate damage tracking and shows greater detail in stress distribution at a highcomputational efficiency.
The objective of this report is to describe the methodology and shows its capabilities andversatility by demonstrating several example cases for a select composite material system.The computationally predicted results are compared with experimental data, where such datais available.
FIBER-SUBSTRUCTURING AND MICROMECHANICS
The primary objective of the composite micromechanics is to determine equivalent elasticproperties of a composite material in terms of the elastic properties of the constituentmaterials. The fiber sub-structuring technique divides the customary unit cell or therepresentative volume element (RVE) into several slices. The micromechanics equations aredeveloped at the slice level, i.e. the slice equivalent properties are computed based on theproperties of the fiber, matrix and the interphase. The micromechanics equations are based onmechanics of materials approach and use certain simplifying assumptions. They are notmathematically rigorous in that, although they do ensure the force equilibrium in alldirections, but they do not impose the continuity of displacements, strains and stresses acrossvarious constituents. Such a rigorous solution can only be obtained through the use of three-dimensional theory of elasticity. However, such a solution is quite tedious for compositematerials. The micromechanics predictions are routinely compared with those of detailedthree-dimensional finite element analyses and with measured data to ensure adequacy ofmechanics formulation and inclusion of all physical phenomena. The micromechanicsequations are not shown here because of page limitations, but are available elsewhere (ref. 1).The laminate theory equations are available in any standard textbook on composite mechanicssuch as ref. 2.
The fiber substructuring approach is general , versatile and applicable to any kind ofcomposite material. By controlling the number of slices in a unit cell, one can easilyincorporate various degrees of bond around the fiber circumference. The fiber breaks, matrixmicrocracking etc. can be easily modeled and their effects on the ply thermal and mechanicalproperties/response can be easily evaluated.

Proceedings of ICCM–11, Gold Coast, Australia, 14th-18th July 1997
V - 761

Volume V: Textile Composites and Characterisation
V - 762
MATERIAL NON-LINEAR BEHAVIOR
The authors during their past research have developed a unified law to describe the materialdegradation behavior applicable to composite materials. The law referred to as multi-factorinteraction relationship (MFIR) accounts for the degradation effects of environment,fabrication, and loads on the constituent material behavior. However, in the present workdealing with the ceramic matrix composites, the constituent properties, namely the modulusand the coefficient of thermal expansion, are considered a function of temperature only. Asan example, the modulus is assumed to have the following functional relationship with thetemperature:
E
ET TT T
f
f
n
0 0= −
−
(1)
where E is the modulus at temperature T, E0 is the reference modulus at temperature T0, andthe Tf is the final temperature where the modulus is zero. Based on the available experimentaldata, the exponent n and the final temperature Tf must be calibrated separately for fiber andmatrix materials.
MICROSTRESSES AND STRESS REDISTRIBUTION DUE TO PROGRESSIVEFRACTURE
The thermal and mechanical loads are specified or obtained at the laminate level. Throughthe successive use of lamination theory, the stresses and strains at the mid-plane of the slicesare obtained. The constituent microstresses are then computed from microstress equationsthat relate the equivalent slice stress to the constituent stresses. These equations are alsobased on the principles of micromechanics.
Non-linearities in the stress-strain behavior occur due to the dependence of constituentproperties on temperature etc. (material non-linearity) as well as due to matrix microcrackingthat leads to stress redistribution. Both of these are accounted for in the present work. In thepresent work, the failure is based on maximum stress criterion. Once, the stress in aconstituent exceeds the allowable value, that constituent is assumed to have failed and thecorresponding modulus of that constituent is assigned an almost negligible value. A slice isassumed to have failed in the normal direction if the fiber portion of the slice indicated astress value higher than the fiber fracture strength in the longitudinal direction. Similarly, aslice is assumed to have failed in the transverse direction if the matrix region stresses indicatefailure in the transverse normal or shear direction. Once, a slice fails, all the stresses that arecarried by that slice up to that point are redistributed to the regions that have not failed. Theload that was carried by that slice is added to the laminate load and a laminate analysis iscarried out again (fig. 3). This process is continued for a given load step until an equilibrium(convergence) is reached between the applied load and a damage state. Presently, theconvergence is checked for laminate mid-plane strains, ply and slice strains. When all thestrains are within 5 percent of the values from the previous iteration, convergence is assumedto have been reached. This mechanism is mainly responsible for the overall non-linearbehavior in the laminate stress-strain curve at the room temperature.

Proceedings of ICCM–11, Gold Coast, Australia, 14th-18th July 1997
V - 763

Volume V: Textile Composites and Characterisation
V - 764
The associated micromechanics equations, fiber sub-structuring technique andmacromechanics/laminate theory equations are programmed into a computer code -CEMCAN (Ceramic Matrix Composites Analyzer, ref. 3). A resident databank of constituentproperties of commonly available materials is also included in the computer program.
RESULTS AND DISCUSSION
To demonstrate the methodology and its capabilities, a SiC/RBSN composite system (SCS-6fibers in a reaction bonded silicon nitride matrix) was chosen because of vast amount ofreadily available experimental data. These data are documented in ref. 4, which forms thebasis for the computed properties that are used in the present work. The use of such acalibration procedure is mandatory for any new material system in order to arrive at a set ofconstituent properties.
Prediction of Mechanical Properties
The interphase (usually a combination of outer carbon layer and the “reaction zone”) istreated as a separate constituent, the properties of which are not explicitly and readilyavailable. Since the interphase modulus has little effect on longitudinal modulus of theunidirectional composite, fiber volume ratio (fvr) of the composite is calibrated from themeasured longitudinal modulus of the unidirectional SiC/RBSN composite. Once, thenominal fvr is known, the interphase modulus is computed by comparing the measured andpredicted values of the in-plane transverse modulus of the unidirectional composite. Thesevalues are shown in Table I. Once calibrated, these values are used to predict certainmechanical properties of a cross-ply and an angle-ply laminate and compared with measuredvalues as shown in Tables II and III. The comparison is very good within the scatter of themeasured values. To account for this scatter, one has to systematically account for thevariabilities in various material and fabrication properties and perform a probabilistic micro-and macromechanics analysis. Such a analysis, predicts the mean value and a scatter boundon predicted values. Such an effort is well underway by the authors.
Prediction of Tensile Stress/Strain Behavior Under Uniaxial Loading
This section presents comparisons of experimental data and the predictions of compositestress/strain behavior under uniaxial tensile loading at room-temperature for various layups.The fabrication induced thermal residual stresses are accounted for in these simulations, i.e.composites are cooled down to room-temperature from an assumed stress-free temperature(little less than the actual fabrication temperature), prior to application of any mechanicalloading. The material non-linearity as a function of temperature is accounted for in a formshown by equation 1 (fig. 4). The stress-strain curves for [0]8 and [90]8 composites are shownin figure 5. Based on the observed tensile strengths of these composites, the matrix in-situtensile strength was calibrated to be 100 MPa (14.5 ksi) by comparing the knee in the stress-strain curve for [0]8 composite and the average fiber bundle strength to be 2 GPa (285 ksi) bycomparing the ultimate tensile strength of the same composite. The knee represents theinitiation and subsequent saturation of matrix microcracking. These value agree well with thefiber and matrix tensile strengths reported in ref. 4. Once calibrated, the same strength valueswere used in subsequent simulations. The stress strain behavior of [0]8 composite is a bi-

Proceedings of ICCM–11, Gold Coast, Australia, 14th-18th July 1997
V - 765
linear behavior, the knee of which represents matrix microcracking to saturation. During thesecond part of that curve, the load is entirely carried by the fibers only until fibers fracture.The behavior of [90]8 laminate is linear until failure, at which point the matrix failed intransverse tension at a relatively low stress level of 45 MPa (6.5 ksi).
In contrast, the off-axis laminates [10]8 and [45]8 stress-strain behavior is largely linear up tofailure as shown in figure 6. Such behavior is characteristic of a brittle failure. The finalfracture in these laminates is controlled by a combination of matrix and interphase normal andshear failure modes. The room-temperature stress-strain curve to failure for a [±452]s
laminate is shown in figure 7. The shear strength of the matrix is estimated to be half thematrix tensile strength to match the ultimate tensile strength of these laminates. This laminatealso fails in a combination of matrix normal and shear failure modes and shows a gracefulfailure. Although, the optical micrographs in ref. 4 confirmed the aforementioned failuremodes, the unloading portion of the stress-strain curve for the laminate was not predicted.The experimental data shown in these figures was also taken from ref. 4.

Volume V: Textile Composites and Characterisation
V - 766
Influence of Partial Interphase Bond
The concept of fiber substructuring allows one to specify a partial bond around the fibercircumference and integrate its effect up to the composite properties and response. Thevariation of some composite mechanical and thermal properties as a function of fibercircumference debonded is shown in figure 8. Longitudinal or fiber-controlled propertiesshow little degradation whereas the transverse properties reveal greater degradation as afunction of debonding. The properties plotted have been normalized with respect to theproperty for a composite with no debonding.

Proceedings of ICCM–11, Gold Coast, Australia, 14th-18th July 1997
V - 767
CONCLUSIONS
A unique and novel fiber sub-structuring technique has been presented here. Although,general in nature, the technique is especially well-suited for the simulation of ceramic matrixcomposites behavior. Its features are illustrated with select examples. Experimentalvalidation is provided where such data is available. This concept enables one to study ingreater local detail ceramic matrix composites behavior pertaining to varying degree ofinterfacial bond. The matrix microcracking at relatively low stress levels and the resultingredistribution of stress is also taken into account. Based on the results shown for theSiC/RBSN composite system, the following specific conclusions can be drawn:
1. Fiber substructuring captures and represents greater local detail than other unit-cell based micromechanics theories.
2. The predictions from the simulations have been successfully verified for this particular composite system for available data.
3. The material non-linear behavior model and stress redistribution with progressive damage have enabled the prediction of stress-strain behavior up to failure. The agreement with experimentally observed behavior is excellent for this particular composite system.
REFERENCES
1. Murthy, P.L.N. and Chamis, C.C. : Towards the Development of Micromechanics Equations for Ceramic Matrix Composites via Fiber Substructuring. NASA TM-105246, 1992.
2. Agarwal, B.D. and Broutman, L.J.: Analysis and Performance of Fiber Composites. Second Ed., Wiley and Sons, New York, 1990.
3. Mital, S.K. and Murthy, P.L.N. : CEMCAN - Ceramic Matrix Composites Analyzer User’sGuide - Version 2.0 NASA TM-107187, 1996.
4. Bhatt R.T. and Phillips, R.E. : Laminate Behavior of SiC Fiber-Reinforced Reaction-Bonded Silicon Nitride Matrix Composites. NASA TM-101350, 1988.

Volume V: Textile Composites and Characterisation
V - 768
THE EFFECT OF FIBRE-BUNDLING ON THEMECHANICAL PROPERTIES OF A SHORT-FIBRE
COMPOSITE
David R. Mulligan1, Stephen L. Ogin1, Paul A. Smith1,Garry M. Wells 2 and Christopher M. Worrall 2
1Department of Materials Science and Engineering,University of Surrey, Guildford, Surrey, GU2 5XH, UK
2 Kobe Steel Europe Ltd. Research Laboratory, 10 Nugent Rd., Surrey Research Park, Guildford, Surrey GU2 5AF, UK.
SUMMARY : The effect of fibre-bundling on the tensile modulus and tensile strength of shortcarbon fibre reinforced polypropylene composite materials has been investigated. The fibre waseither filamentised or in bundles of 6000 fibres. Materials containing 0 %, 25 %, 50 %, 75 %and 100 % of the fibres in bundles were produced. It was found that fibre-bundling leads to asignificant reduction in both the tensile modulus and tensile strength compared with the fullyfilamentised composite. The reduced reinforcing efficiency of fibre bundles compared toindividual fibres has been estimated using the Cox model. This approach gives reasonableagreement with the experimental modulus of laminates containing only filamentised fibres oronly fibre bundles, but overestimates the modulus of laminates containing a mixture of fibres andbundles.
KEYWORDS : fibre-bundling, mesostructure, short-fibre composite
INTRODUCTION
The longitudinal Young’s modulus of a continuous aligned composite material can be predictedsatisfactorily from the constituent moduli and the fibre volume fraction using a simple rule-of-mixtures expression. Such an expression may be modified for a short-fibre composite byintroducing factors which account for the reduced reinforcing efficiency of short-fibres [1] andthe orientation of the fibres [2]. In calculating the reduced reinforcing efficiency, it is usuallyassumed that individual fibres are the basic unit of reinforcement and that they are straight,aligned and regularly spaced. However it is generally the case that at least some of the fibres arein clusters, or even bundles, reflecting the tow structure from which they were cut originally.The behaviour of fibres contained in bundles will differ from that of an equivalent number offibres dispersed more uniformly. This type of structure, on a scale between that of the individualfibre and that of the material as a whole, has been described as mesostructure [3], and is notusually a feature of models for composite materials.
A number of workers have studied the effect of fibre-bundling, with the objective of improvingthe toughness of composite materials. The most frequently used method to manufacture acomposite with the fibres in bundles is to impregnate a fibre tow with a resin, which is thencured, and the resulting rod is subsequently manufactured into a laminate. The first study to usethis technique was by Fila, Bredin and Piggott [4] who constructed continuous, aligned laminatesof glass or carbon fibre in a copolymer of styrene and polyester. A similar approach was taken

Proceedings of ICCM–11, Gold Coast, Australia, 14th-18th July 1997
V - 769
by Kim and Mai [5] who manufactured random and aligned discontinuous fibre composites ofcarbon fibre bundles impregnated with epoxy resin or polycarbonate, in an epoxy resin matrix.Both of these studies recommended this as a method to achieve tougher composite materials.While this approach has yielded some valuable results there are obvious difficulties if the aim isto examine the mechanisms associated with fibre bundling, the most significant being the extrainterface that is created between the polymer used to impregnate the bundle and the polymermatrix.
Ericson and Berglund [6] compared two types of glass-mat-reinforced polypropylene; thesecontained either short individual fibres or looped (continuous) fibre bundles. They found that thematerial containing individual short-fibres had a higher modulus and a slightly higher strength.They accounted for the reduced modulus of the bundled material in terms of the reducedreinforcing efficiency of the bundles, which was estimated using the Cox model applied to thebundles. This work is important since it considers commercially manufactured materials andultimately the findings of this area of work should be used to produce composite materials whichachieve the required properties in the most efficient manner.
There is a limited amount of theoretical work on fibre-bundling. The most relevant treatment isby Kataoka, Taya and Saito [7], who analysed the case of a composite material containing fibresand fibre clusters, using the Eshelby method. They found that with regard to the Young’smodulus the most significant variable was the volume fraction of bundles in the material. Thefibre volume fraction in the bundle, the fibre aspect ratio and bundle aspect ratio all hadrelatively minor effects on the Young’s modulus. Trapeznikov, Toropov, and Loskutov[8]modelled the effect of fibre-bundling on the strength of a carbon-carbon composite and foundthat the strength of the material decreased when the number of fibres in the tow forming thebundle was increased.
Methods for quantifying the degree of fibre-bundling in a random short-fibre composite arecurrently under development. For example Worrall and Wells [9] have described a “fractal-variance characterisation method”, which they used successfully to analyse the size of bundles ina material. However it is not possible, at present, to find the volume fraction of bundles of agiven size using this technique.
The present work is aimed at characterising the effect of fibre-bundling on the mechanicalproperties of a carefully controlled range of short-fibre composite materials in which the volumefraction of the fibre in bundles has been varied. The mass of the individual fibre mats used toproduce the composites varied, resulting in differences in the overall volume fraction and anormalisation procedure has been carried out to enable the results to be compared. Data arepresented for the moduli and strength of the materials.
EXPERIMENTAL
The carbon fibre tow (Torayca T300), consisting of 6000 fibres, was coated with molten wax,which solidified before the tow was chopped into 5 mm lengths by a chopping machine. Thefibre could be incorporated in the mats in this form, resulting in bundles in the mat, or the waxcould be burnt off, resulting in filamentised fibres in the mat. The appropriate proportions ofwax-coated and uncoated fibre were dispersed in a glycerine solution and the mixture was pouredover a stainless steel mesh to produce a random mat. The mats were washed and then dried at100 °C, and the wax was burnt off the wax-coated bundles in the mat to produce mats which hadvarying proportions of bundled and filamentised fibres. Mats with the following compositions

Volume V: Textile Composites and Characterisation
V - 770
were produced; 0 % bundles (i.e completely filamentised), 25 % bundles, 50 % bundles, 75 %bundles and 100 % bundles
The mats were impregnated with the polypropylene matrix using a film stacking technique.Layers of carbon fibre were interleaved with polypropylene film to give a laminateapproximately 1 mm thick and an overall volume fraction of about 0.15. This stack was heatedto 250 oC for three minutes with contact pressure, then full pressure was applied for one minute.During this time the pressure was released three times to "pump" the stack, which allowedentrapped air to escape and aided the infiltration of the fibre bundles by the polymer melt. Toverify that infiltration was satisfactory, samples from the laminates were mounted in epoxy resinand sectioned using a Jung microtome with a glass knife. Sections 20 µm thick were viewed intransmission on an Axiophot microscope and showed no evidence of porosity.
Tensile test coupons, 150 mm long by 20 mm wide, were cut from the composite plates using awater-lubricated diamond saw. The coupons were tensile tested on an Instron 1175 with 30 mmlong friction tabs made from emery cloth. A crosshead speed of 0.5 mm / min was used and thestrain on the sample was measured using a 50 mm gauge length extensometer, which wasattached to the specimen surface with rubber bands. Five specimens were tested for eachlaminate type.
The volume fraction of the laminates was found using a burn-off method. From each laminatefour samples of about 0.5 g were accurately weighed and then heated to 420 °C in a crucible forfive hours. After cooling, the mass of the residue was determined. The volume fractions werecalculated based on density values of 1.76 g/cm3 for the carbon fibre and 0.90 g/cm3 for thepolypropylene.
RESULTS & DISCUSSION
Tensile Modulus
The tensile modulus was calculated by applying a linear regression fit to the stress-strain curvebetween 0 % and 0.5 % strain. The results are shown in Fig. 1 and the values for the overallfibre volume fractions are indicated. The results show a large reduction in the modulus of thelaminates with an increase in the percentage of fibres in bundles. Previous work by Ericson andBerglund [6] accounted for a lower than expected modulus for a bundled material by consideringthe bundle as a large fibre and calculating the length efficiency factor accordingly. In the presentstudy such an approach is developed to allow for the presence of filamentised fibres in the matrixsurrounding the bundle.
The usual expression for a randomly oriented short fibre composite is :
c o l f f m mE = E V + E Vη η (1)
where Ec, Ef and Em are the modulus of the composite, fibre and matrix respectively; ηo is theKrenchel orientation factor [2], which is taken as 0.375 for a planar random fibre architecture; ηl
is the length efficiency factor; Vf and Vm are the volume fractions of fibre and matrixrespectively.

Proceedings of ICCM–11, Gold Coast, Australia, 14th-18th July 1997
V - 771
Fig. 1: Graph showing the variation of tensile modulus with percentage of fibresin bundles (the data points are labelled with the volume fraction of the laminate)
Vf = 0.122
Vf = 0.094
Vf = 0.153
Vf = 0.170
Vf = 0.201
0
2
4
6
8
10
12
14
0 25 50 75 100
Percentage of fibres in bundles
Ten
sile
mod
ulus
/ G
Pa.
Eqn 1 may be modified to include a third term that represents the contribution of the fibrebundles i.e.
c o lo f fo o lb b fb m b m m oE = E V + E ( V + V ) + E Vη η η η (2)
In this modified expression Vfo, Vfb, Vmo and Vmb are volume fractions, where the first subscript,“f” or “m”, describes whether the volume fraction is of fibre or matrix, while the secondsubscript, “b” or “o”, indicates whether a component is inside a fibre bundle, “b”, or outside afibre bundle, “o”. These definitions result in :
V V Vf fo fb= + (3)
m mo mbV = V + V (4)
Table 1 shows the value of these quantities for composites with an overall fibre volume fraction(Vf) of 0.15 and a volume fraction of fibres in the bundled region of 0.6 i.e.
Vfb / (Vfb + Vmb) = 0.6 (5)

Volume V: Textile Composites and Characterisation
V - 772
Table 1 : The values of the four volume fraction terms for the laminateslaminate/ % bundles Vf Vfo Vfb Vm Vmo Vmb
0 0.150 0.150 0.000 0.850 0.850 0.00025 0.150 0.113 0.038 0.850 0.825 0.02550 0.150 0.075 0.750 0.850 0.800 0.05075 0.150 0.038 0.113 0.850 0.775 0.075100 0.150 0.000 0.150 0.850 0.750 0.100
Eb, the modulus of the bundle, is calculated using the Voigt model for a continuous alignedcomposite applied to the fibre bundle:
E E V E Vb f fb m mb= + (6)
Table 2 shows the values of the three moduli, together with other values used in the calculation.
Table 2 : Values used in the modulus calculationTensile modulus of fibre Ef 230 GPa
Tensile modulus of bundle Eb 139 GPaTensile modulus of matrix Em 1.40 GPaShear modulus of matrix Gm 0.54 GPa
Radius of fibre r (for ηlo) 3.95x10⁻⁶ mRadius of bundle r (for ηlb) 3.95x10⁻⁴ m
The length efficiency factors in Eqn 2 account for the reduced reinforcing efficiency of adiscontinuous reinforcement compared to continuous reinforcement and were calculated usingthe expressions from Cox[1] i.e.
( )
( )ηβ
βl
l
l= −1
2
2
tanh (7)
where
( )β =
22
G
E r R r
m
f ln (8)
The length efficiency factor for the filamentised fibres (ηlo) is derived by considering only thematerial outside the fibre bundles. The length efficiency factor for the filamentised fibres (ηlb) iscalculated by considering the bundles as reinforcing fibres within a “matrix” that consists ofpolypropylene and filamentised fibres. The resulting values of the efficiency factors are shownin table 3.
Table 3 : The resulting values of ηlo and ηlb .Laminate ηηlo ηηlb
0% bundles 0.978 -25% bundles 0.976 0.35250% bundles 0.974 0.35175% bundles 0.971 0.297100% bundles - 0.127

Proceedings of ICCM–11, Gold Coast, Australia, 14th-18th July 1997
V - 773
Based on the steps outlined above the moduli of the composites can be calculated from Eqn 2.Further, it is possible to normalise the experimental results for the fibre volume fraction, usingthe relation shown in Eqn 9.
N o rm a lise d e x p er im e n ta l m o d u lu s =P red ic t io n fo r V = 0 .1 5
P red ic t io n fo r a c tu a l Ve x p er im e n ta l v a lu e
f
f× (9)
The normalised experimental results and the predictions from the model are shown in Fig. 2,based on a fibre volume fraction of 0.15. A comparison of the two curves in Fig. 2 shows thatwhile there is good agreement for the 0 % and 100 % materials, the model overestimatessignificantly the modulus of the laminates when there is a mixture of fibres and bundles present.It seems that this is because the presence of fibre bundles reduces the efficiency of thefilamentised fibres; it is unlikely that the filamentised fibres are distributed evenly in thepresence of bundles. In particular it seems likely that there will be matrix-rich regions in thevicinity of the bundles and these may contribute to the observed moduli.
Fig. 2 : Graph showing the tensile modulus predictions from the modified Cox model and the normalised experimental data.
0
2
4
6
8
10
12
14
16
18
0 25 50 75 100
Percentage of fibres in bundles
Ten
sile
mod
ulus
/ G
Pa
Values from modified Cox model
Normalised experimental data
Tensile Strength
The values for the tensile strength were taken from the maximum stress on the stress-straincurve. The results are shown in Fig. 3. The results show that the strength for the 25% to 100%materials is reasonably constant and about a quarter of the strength of the filamentised material.

Volume V: Textile Composites and Characterisation
V - 774
This suggests that the reduction in strength is due to the presence of bundles, rather than thevolume fraction of bundles. It seems reasonable to suggest that the failure is initiated either atbundles oriented transverse to the applied stress, or at bundle ends when they are aligned with thetensile load. The same sites are likely to be preferred for the propagation of the crack, althoughin this case the transversely oriented bundles are likely to be more significant. This interpretationsupports the shape of the graph in Fig. 3, since even in the 25% bundle material there will beregions where there are a number of bundles spaced closely together.
Fig. 3 : Graph showing the variation of tensile strength with percentage of fibres in bundles
0
10
20
30
40
50
60
70
80
90
100
0 25 50 75 100
Percentage of fibres in bundles
Ten
sile
str
engt
h / M
Pa
CONCLUSIONS
Fibre-bundling was found to have a substantial effect on both the tensile modulus and tensilestrength of a short-fibre composite. An analysis using the Cox model gives reasonableagreement for both the filamentised and the completely bundled material, but overestimates themoduli of the materials containing a mixture of fibres and bundles. The tensile strength datashow that the strength of laminates containing 25% to 100% of the fibres within bundles is aboutone quarter of the strength of a filamentised material.

Proceedings of ICCM–11, Gold Coast, Australia, 14th-18th July 1997
V - 775
ACKNOWLEDGEMENTS
The authors would like to thank Mr. R. Whattingham of the University of Surrey for his helpwith the manufacture of fibre mats, Mr. P. Ives of Kobe Steel Europe Ltd. for his invaluableassistance with the film-stacking technique and Kobe Steel Europe Ltd. and the EPSRC forfunding a CASE studentship for D. Mulligan
REFERENCES
1. Cox, H. L., "The elasticity and strength of paper and other fibrous materials", British Journalof Applied Physics, Vol. 3, 1952, pp. 72-75.
2. Krenchel, H., "Fibre Reinforcement", Akademisk Forlag, Copenhagen, 1964.
3. Piggott, M. R., "Preface: Realistic models for fibre composites", Composites Science &Technology, Vol. 53, 1995, pp. 121-122.
4. Fila, M., Bredin, C. and Piggott, M., "Work of fracture of fibre-reinforced polymers",Journal of Materials Science, Vol. 7, 1972, pp. 983-988.
5. Kim, J. K. and Mai, Y. W., "Fracture of CFRP containing impregnated fibre bundles",Composites Science and Technology, Vol. 49, 1993, pp. 51-60.
6. Ericson, M. and Berglund, L., "Deformation and fracture of glass-mat-reinforcedpolypropylene", Composites Science & Technology, Vol. 43, 1992, pp. 269-281.
7. Kataoka, Y., Taya, M. and Saito, M., "Effect of fibre clustering on the stiffness and strengthof a short fibre composite", Proceedings of the seventh Japan/U.S. Conference on CompositeMaterials, Kyoto, Japan, June 19-22 1995, Ch. 93, pp. 505-514.
8. Trapeznikov, D. A., Toropov, A. I., and Loskutov, O. D., "Modelling approach tooptimization of mechanical properties of discontinuous fibre-reinforced C/C composites",Composites, Vol. 23, No. 3, 1992, pp. 174-182.
9. Worrall, C. M. and Wells, G. M., "Fibre distribution in discontinuous fibre reinforcedplastics: Characterisation and effect on material performance", Proceedings of the seventhEuropean Conference on Composite Materials, London, U. K., May 14-16 1996, Vol. 1. pp.247-252.
Volume V: Textile Composites and Characterisation
V - 776
COMPRESSIVE BEHAVIORS OF MULTIPLYDELAMINATED RECTANGULAR COMPOSITE
PLATES
Hiroshi Suemasu and Tatsuya Kumagai
Department of Mechanical Engineering, Sophia University7-1 Kioicho Chiyoda-ky Tokyo 102 Japan
KEYWORDS: composite plate, buckling, postbuckling, multiple delaminations, energy release rate, finite element analysis

Proceedings of ICCM–11, Gold Coast, Australia, 14th-18th July 1997
V - 777

Volume V: Textile Composites and Characterisation
V - 778

Proceedings of ICCM–11, Gold Coast, Australia, 14th-18th July 1997
V - 779
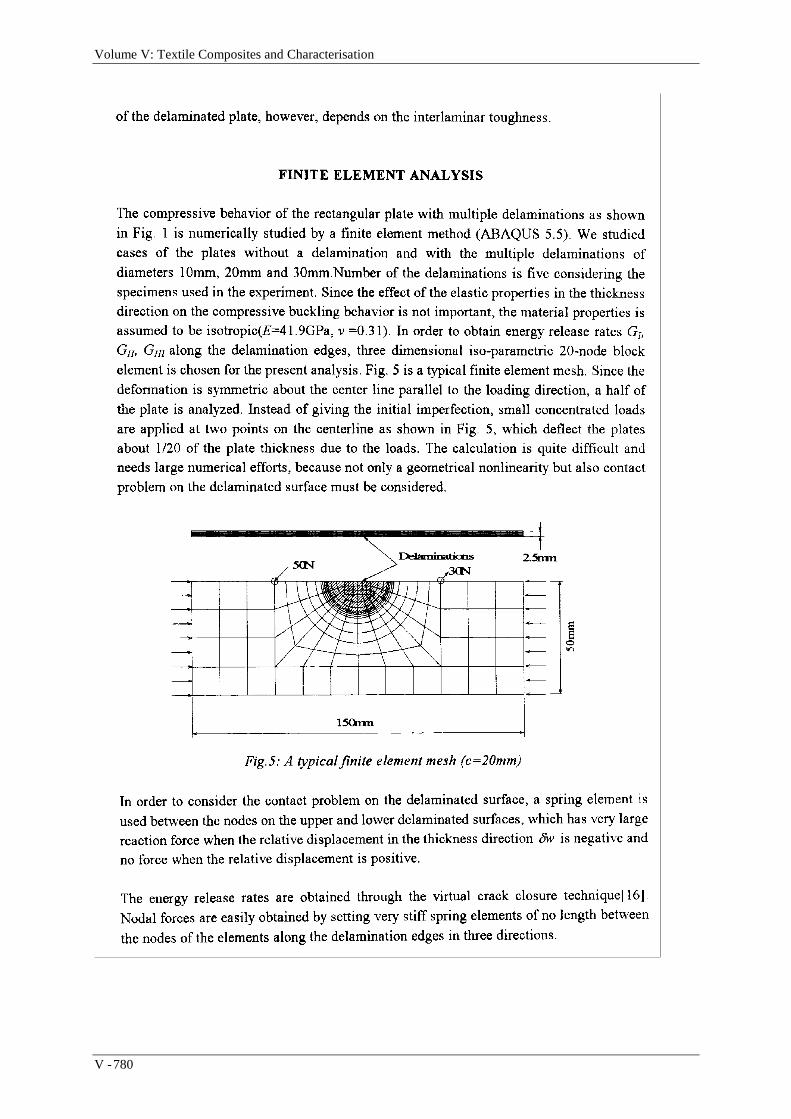
Volume V: Textile Composites and Characterisation
V - 780
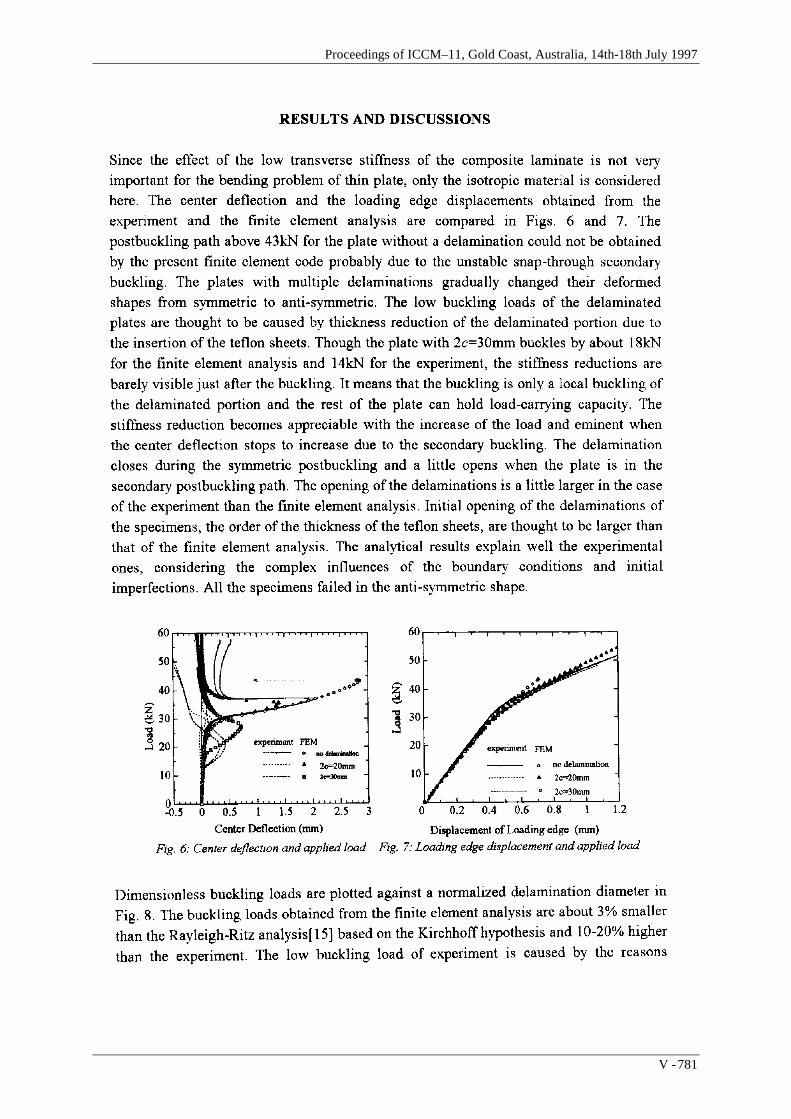
Proceedings of ICCM–11, Gold Coast, Australia, 14th-18th July 1997
V - 781

Volume V: Textile Composites and Characterisation
V - 782
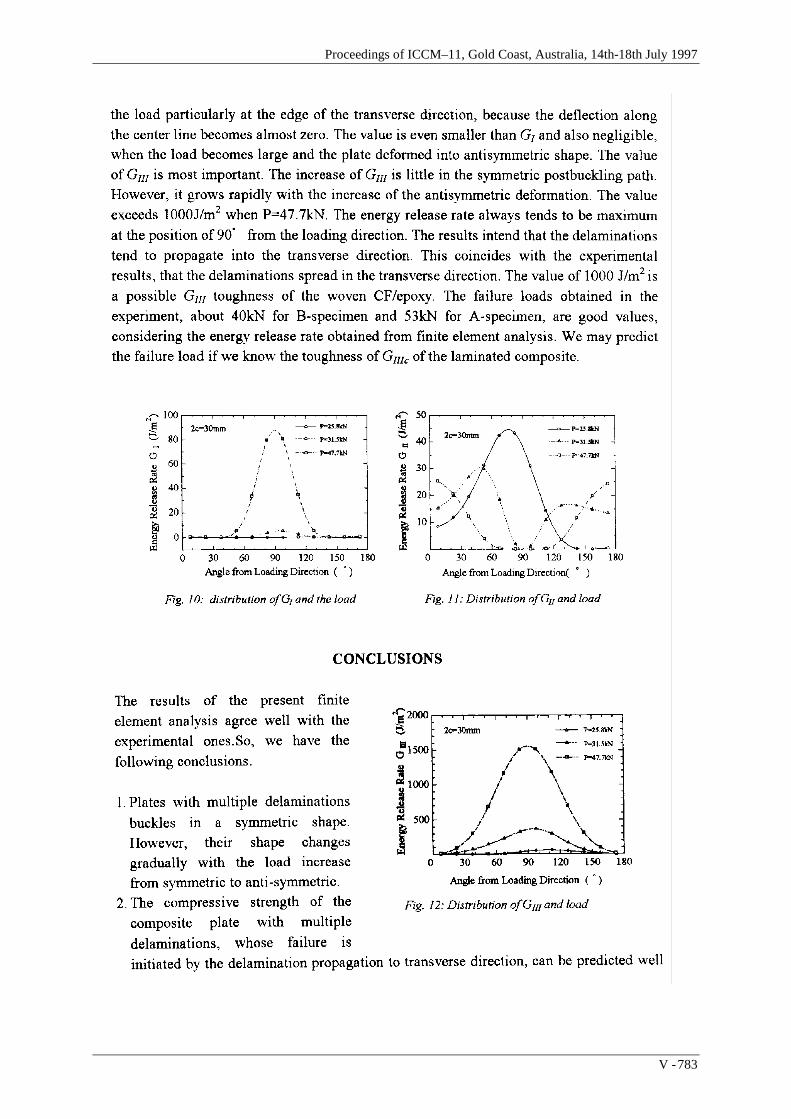
Proceedings of ICCM–11, Gold Coast, Australia, 14th-18th July 1997
V - 783

Volume V: Textile Composites and Characterisation
V - 784

Proceedings of ICCM–11, Gold Coast, Australia, 14th-18th July 1997
V - 785

Volume V: Textile Composites and Characterisation
V - 786
BEHAVIOUR OF +55/-55° ANGLE PLY LAMINATESUNDER EXTERNAL PRESSURE AND AXIAL
COMPRESSION
A. S. Kaddour1, P. D. Soden1 and M. J. Hinton2
1Applied Mechanics Division, UMIST, Sackville street, Manchester, M60 1QD, UK.2 Structural Materials Centre, DRA, Fort Halstead, Sevenoaks, Kent, TN14 7BP, UK.
SUMMARY: This paper is concerned with the strength of 55( filament wound E-Glass/epoxytubes subjected to external pressure with and without axial compression. A few tests are reportedon buckling behaviour of thin tubes. Thicker walled tubes were tested to determine crushingstrength. Finite element analysis was carried out to determine the form of end reinforcement andend closures in order to avoid end failure and minimise stress concentration at the edges of thetubes. Tubes with radius to thickness ratio Ri/h down to 2.5 were tested to fracture under a largerange combination of external pressure and axial compression. The biaxial crushing strength iscompared with theoretical predictions obtained using simple two dimensional laminate andfailure theory.
KEYWORDS: crushing strength, biaxial failure, buckling, 55( angle ply tubes, compression,external pressure
INTRODUCTION
Tests on tubular specimens are often used to investigate the strength of fibre reinforcedcomposites under biaxial loads, see for example Refs [1-3]. The behaviour and strength of 55(angle ply laminates is of particular interest. Tubes of such construction are frequently employedas pipes and pressure vessels because 55 degrees is considered to be the optimal angle for closedended cylindrical vessels which are subjected to internal pressure where the ratio ofcircumferential to axial stress (SR) is 2:1 or to external pressure where SR is -2:-1. Furthermore,in practice, pipes and vessels may encounter a variety of biaxial loads. Thin walled tubes of lowstiffness, glass fibre reinforced composite materials are liable to buckle when subjected tocompressive loads and buckling rather than crushing has tended to dominate in someexperimental studies [3-7] of the compressive strength of composite tubes. The objective of thispaper is to present experimental results on the response of 55 laminates to external pressurewith and without axial compression and to compare the results with theoretical predictions. Theexperimental results describe both crushing and some buckling strengths of 55( filamentwound tubes. The experimental methods are first outlined and numerical results are presentedfrom the finite element analysis that was used to design a suitable test specimen and endattachments to avoid end failures.

Proceedings of ICCM–11, Gold Coast, Australia, 14th-18th July 1997
V - 787
EXPERIMENTAL DETAILS
Specimens
The specimens tested were filament wound glass/epoxy tubes produced by the StructuralMaterials Centre, Defence Research Agency (DRA), Fort Halstead. The E-glass fibrereinforcement was Silenka 051L, 1200 tex and the epoxy resin system was Ciba-GeigyMY750/HY917/DY063. A simple 55 helical winding pattern was employed. (The windingangle is measured between the fibre direction and axial direction of the tube). Tubes of 100mmand 51mm inner diameter were employed, in a variety of wall thicknesses (h). In most of thetests, specimens with inner radius to thickness ratios Ri/h of 5 were used but to investigate theeffects of buckling some tests were conducted on thicker specimens with (Ri/h) ranging from 5 to2.5 . The results of a few tests on thinner tubes with R/h of 25 and 15 are also reported. Themean thicknesses were determined from measurements taken at 40 positions around the surfaceof each specimen. The fibre volume fraction was approximately 68%, measured using burn-offtests. The basic form and dimensions of the 100mm and 51mm diameter specimens used forbiaxial crushing tests are shown in Fig 1. The Ri/h ratio of 5 for the gauge length portion, wasselected on the basis of simple shell buckling calculations.
Figure 1: Schematic diagrams of test specimens used in the biaxial compression. (a) 100mm IDand (b) 2 inch ID.
The ends of the thicker specimens had additional reinforcement which was designed to introducethe load smoothly into the gauge length whilst avoiding premature end failure and excessivestress concentrations. End fittings were carefully designed in order to minimise stressconcentration near the tube ends. The end reinforcement and attachments were designed with theaid of finite element analysis, see below.

Volume V: Textile Composites and Characterisation
V - 788
Figure 2: Test rig used for biaxial compression of composite tubes.
Material Properties
The end reinforcement was made of circumferentially wound unidirectional Eglass/epoxymaterial having the 3-D elastic constants shown in Table(1). The elastic constant of 55laminates were computed on the basis of that the filament wound cylinder was treated asorthotropic monolithic material whose axes of symmetry coincide with the hoop (θ), axial (x) andradial (r) directions. The 3-D elastic properties of the cylinder material are listed in Table 2.
Table 1: Mechanical properties of E-glass/epoxy unidirectional lamina
a) Elastic constants:E1 (GPa)=50.74, E2=E3 (GPa)=19.39, G12 =G13 (GPa)=7.06, υ12= 0.268, υ23= 0.4,α1 (µε/(C)=20.4, α2=α3 (µε/(C)= 7.0.
(b) Strength values:X1T =1280MPa, X1C =-950 MPa, Y2T =40 MPa, Y2C =-145 MPa, Z3T =40 MPa,Z3C = -153 MPa, S12 = 73 MPa.
Table 2: Mechanical properties of 55( angle ply E-glass/epoxy tube calculated using 3-Danalysis, Ref[10]
Eθ=27.325 (GPa), Ex=18.53 (GPa), Er= 20.312 (GPa), Gθx=14.382 (GPa),Gxr=6.969(GPa), Gθr= 7.015(GPa), υ xθ= 0.37, υ θr=0.128, υ θx= 0.298

Proceedings of ICCM–11, Gold Coast, Australia, 14th-18th July 1997
V - 789
Test Rigs and Methods
The high pressure (200MPa) test rig is shown in Fig 2. Pressure was applied directly to the outersurface of the specimens and axial load was applied via the tension/compression bar. The testtechniques have been described in detail in Ref[11]. Fig 3 shows a low pressure test rig (20MPa)together with a buckling wave measuring device, Ref[5]. External pressure was applied via ports(3) and (8) to give SR = -2:-1 and via port (8) only with port (3) closed and with axial clearancebetween the tube and the end fitting (5) to allow the tube to move freely and obtain SR = -1:0.Deformations of the specimens were measured using electrical strain gauges (TechniMeasurement type YFLA-5 and FLA-3-23) bonded to the inner and outer surfaces of theworking section of the specimen. Failure was detected by an abrupt drop of pressure (or load)accompanied frequently by a loud bang.
FINITE ELEMENT ANALYSIS OF END REINFORCEMENT AND FITTINGS
Details of the Structure
The basic form of the specimen analyzed was as shown in Fig 1. The .55( angle ply filamentwound Eglass/epoxy tubes were 100mm inner diameter, 10mm thick and 370mm long. Solidplugs of different forms are used as end closures. These include (1) cylindrical plugs and (2)plugs with constant nose radius of 2000mm. The reinforcement was made of circumferentiallywound E-glass/ epoxy material and consisted of (a) a portion of a constant thickness of 10mmand (b) another portion of a varying thickness, see Fig 1. Various plug and reinforcementgeometries were analyzed [12].
Figure 3: (top) Test vessel used for buckling of thin tubes under external pressure, Ref[5]Figure 4: (bottom) Stress distribution along a 55° GRP tube with end reinforcement using
cylindrical plug

Volume V: Textile Composites and Characterisation
V - 790
Finite Element Model
The material of the cylinder and the reinforcement was assumed to behave in a linear elasticorthotropic manner. The ABAQUS general purpose finite element code [8] was used. Anaxisymmetric model was employed and thus only a quarter of the structure is analyzed. Theelements used were axisymmetric, quadrilateral eight node elements CAX8. The number ofelements was 500. Contact elements were used between the solid plug and the cylinder.Geometric non linearity was considered..
Figure 5: Stress distribution along a 55o GRP tube with end reinforcement using end plug ofradius of 2000mm.
Finite Element Results
The ABAQUS results are shown in Figs 4 and 5 for a plain cylindrical plug and a shaped plugwith a nose radius of 2000mm. The distributions of hoop, axial and radial stresses along thespecimen length are shown for an external pressure load of 80MPa with SR=-2/-1. It can seenthat the usage of shaped plugs minimises the stress concentration near the end of the plug. Theend reinforcement results in lowered stresses in that region, the gradual thickness transitionavoids excessive stress concentrations at the end of the reinforcement and the stresses away fromend reinforcement are uniform.
THEORETICAL CONSIDERATIONS
Thick Cylinder Theory
Due to the anisotropic nature of the composites considered here, the variation in stressesthroughout the thickness of the tubes is greater than predicted by the classical thick cylindertheory used for metals and isotropic cylinders. Equations describing the variation of stresses andstrains through the thickness, derived by treating the tube wall as consisting of a singlemonolithic, orthotropic material, are given in Ref [10]
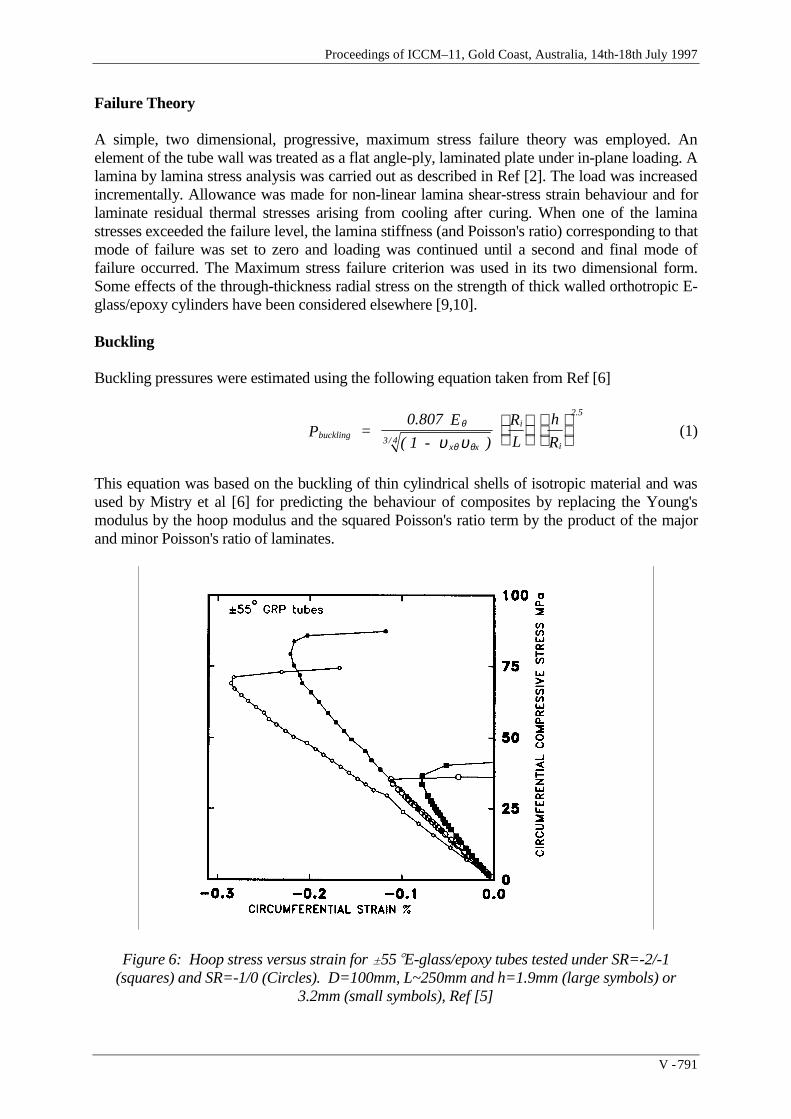
Proceedings of ICCM–11, Gold Coast, Australia, 14th-18th July 1997
V - 791
Failure Theory
A simple, two dimensional, progressive, maximum stress failure theory was employed. Anelement of the tube wall was treated as a flat angle-ply, laminated plate under in-plane loading. Alamina by lamina stress analysis was carried out as described in Ref [2]. The load was increasedincrementally. Allowance was made for non-linear lamina shear-stress strain behaviour and forlaminate residual thermal stresses arising from cooling after curing. When one of the laminastresses exceeded the failure level, the lamina stiffness (and Poisson's ratio) corresponding to thatmode of failure was set to zero and loading was continued until a second and final mode offailure occurred. The Maximum stress failure criterion was used in its two dimensional form.Some effects of the through-thickness radial stress on the strength of thick walled orthotropic E-glass/epoxy cylinders have been considered elsewhere [9,10].
Buckling
Buckling pressures were estimated using the following equation taken from Ref [6]
bucklingx x
3/ 4
i2.5
iP =
0.807 E
( 1 - )
R
L
h
Rθ
θ θυ υ
(1)
This equation was based on the buckling of thin cylindrical shells of isotropic material and wasused by Mistry et al [6] for predicting the behaviour of composites by replacing the Young'smodulus by the hoop modulus and the squared Poisson's ratio term by the product of the majorand minor Poisson's ratio of laminates.
Figure 6: Hoop stress versus strain for 55(E-glass/epoxy tubes tested under SR=-2/-1(squares) and SR=-1/0 (Circles). D=100mm, L~250mm and h=1.9mm (large symbols) or
3.2mm (small symbols), Ref [5]
Volume V: Textile Composites and Characterisation
V - 792
EXPERIMENTAL RESULTS
Pressure-Strain and Stress-Strain Curves
Fig 6 shows experimental hoop stress versus strain curves for two 100mm inner diameter 55(GRP tubes of thickness of 1.94mm and 3.2mm, each subjected to two types of loading;hydrostatic pressure (SR=-2/-1) and radial pressure (S=-1/0). The length between end fittings oftubes tested under SR=-2/-1 (240mm) was marginally smaller than the length of specimenstested under radial pressure only (265mm). As expected the tinner tube buckles at much lowerstress. For each thickness, the final buckling pressures are almost identical for both loadingcases.
Fig 7 shows the results of a thicker (h~9.5mm) and shorter tube(parallel test section length150mm, length between end fittings 250mm) tested under SR=-2/-1. This tube startedbuckling at a pressure of 67MPa and finally fractured at 80MPa. The compressive strainsmeasured at the inside surface were greater than those at the outside surface and are of similarmagnitude to those calculated using the linear elastic thick orthotropic cylinder theory [10].
Fig 8 shows the pressure- strain curves for an even thicker specimen (h=14.5mm, diameter=100mm). This specimen failed by crushing and there is no pronounced deviation of the pressure-strain curves as failure is approached, Ref [11]
Effect of Thickness on Strength
It is well known that thinner walled tubes fail by shell buckling at relatively lower stresses, asdemonstrated in Figs 6-8. The strength of the tubes is plotted against wall thickness (h/Ri) in Fig9. Included in this Figure are the results taken form Fig 6 and also results from Mistry et al[6]. Itshould be pointed out the mechanical properties and lengths of the tubes of Ref [6] are slightlylower than those from Fig.6. Nevertheless, both sets of results seem to indicate the same trend.
In order to obtain a true value of crushing strength, tests were carried out on thicker specimensranging from h/Ri=0.19 to h/Ri=0.4, at a fixed stress ratio of -2/-1 [10]. The results (see Fig. 9)show that, at this stress ratio, as the ratio of h/Ri increases the hoop strength increases andapproaches a limiting average value of approximately -820MPa at h/Ri >0.30.
Fig 6 showed that thin tubes tested in uniaxial circumferential compression (SR=-1:0) buckled atalmost the same pressure as tubes of the same thickness and similar length tested at SR=-2:-1 butthick walled tubes tested at SR=-1:0 failed at lower pressures than in SR=-2:-1 tests so thetransition from buckling to crushing occurred at a lower value of h/Ri. As will be shown in Figs 9and 10, the hoop strength for tests carried out at SR=-1/0 is much lower than that for tests carriedout at -2/-1, using tubes of identical geometry.
For the case of axial compression (i.e. for SR=0:-1), the transition from buckling to crushingagain occurred at a lower thickness that for the SR= -2;-1 loading case. The strength reaches alimiting value of approximately 152MPa at h/Ri>0.07 above which there is no increase in thefailure stress [10].

Proceedings of ICCM–11, Gold Coast, Australia, 14th-18th July 1997
V - 793
Figure 7: Pressure versus hoop strains for a 55 E-glass/epoxy tube tested under SR=-2/-1.(D=100mm, L=150mm, h=9.5mm)
Figure 8: Pressure versus hoop strains for a 55 GRP tube tested under SR=-2/-1. (D=100mm, h=14.5mm)
Biaxial Compression Strength
The results from the biaxial compression tests on 55( filament wound tubes are plotted in Fig10. The data cover almost all of the compression-compression quadrant. Since the test specimensare thick walled, the quoted 'experimental failure stress' values are actually derived from themeasured failure pressure and load using thick orthotropic cylinder theory. They represent thefailure stresses at the inner surface of the cylinder (the position of maximum stress) . Thecorresponding hoop stresses at the outside of the tubes are expected, according to thickorthotropic cylinder theory, to be lower than those at the outside surface while the outside surfaceaxial stresses are close to the inside surface ones. All the specimens for which the results are

Volume V: Textile Composites and Characterisation
V - 794
presented in Fig 10 failed by crushing rather than buckling and none of them leaked before finalfailure.
The highest failure stresses were recorded for the thickest specimens at the SR= -2/-1 loadingcondition. The strength at this loading ratio was significantly greater than the uniaxialcompressive strengths in the circumferential or axial directions.
Figure 9: Hoop stress versus h/Ri ratio for 55 GRP tubes tested under SR= -2/-1.
Figure 10: Biaxial compression-compression failure envelope for 55o GRP tubes.

Proceedings of ICCM–11, Gold Coast, Australia, 14th-18th July 1997
V - 795
COMPARISON OF THEORETICAL AND EXPERIMENTAL RESULTS
Buckling
A few test results are presented in Fig 9 showing the buckling pressure versus diameter tothickness ratio of 55 GRP tubes. The lines drawn in Fig 9 were obtained from Eq(1) withL/Ri=4.8 and the hoop stress was calculated from the buckling pressure using thin shell equation(σ=Pbuckling *Rm/h) . They agree reasonably well with the experimental results.
Biaxial Compression
The experimental results for the 55° tubes are shown in Fig 10, along with the predicted finalfailure envelopes using the simple 2-D laminate analysis with the progressive Maximum Stresscriterion. According to the 2-D progressive model, the predicted biaxial strength values for stressratios between -2.7:-1 and -3:-2 depend strongly on the lamina longitudinal compressivestrength. The experimental results tend to be higher than the theoretical results in that region ofthe failure envelope. Otherwise, the agreement between the experimental and theoretical resultsis reasonably good.
CONCLUSIONS
• Only a few experimental buckling pressure results were obtained for thin walled 55°E-glass/epoxy tubes subjected to external pressure with and without pressure end load butthose pressures were in reasonable agreement with classical buckling theory.
• In experiments on thicker walled tubes the failures were by crushing rather than buckling.• The end reinforcement and fittings designed with the aid of finite element analysis were
successful in avoiding end failures and minimising stress concentrations at the end of the testsection.
• Tests were conducted over a wide range of combinations of external pressure and axialcompressive load. The strength of 55( GRP tubes under the application of biaxialcompressive loading was shown to be substantially greater than either the axial orcircumferential uniaxial compressive strengths.
• The simple progressive Maximum Stress laminate failure theory was reasonably successfulin predicting the strength of the tubes under a range of biaxial compressive loads. Itunderestimated the final failure strength at some stress ratios where the predictions aresensitive to the assumed strength of the composite in compression parallel to the fibres.
ACKNOWLEDGEMENTS
The work reported here was sponsored by the Defence Research Agency (DRA) in Great Britainunder a contract No MoD/DRA 2044/191. The authors would like to thank the sponsors for theirsupport.

Volume V: Textile Composites and Characterisation
V - 796
REFERENCES
1 Soden P D, Kitching R, Tse P C, Tsavalas Y and Hinton M J, "Influence of winding angleon the strength and deformation of filament wound composite tubes subjected to uniaxialand biaxial loads", Composites Science and Technology, V46, 1993, pp 363-378.
2 Hinton M J, Soden P D and A S Kaddour,"Biaxial failure of composite laminates undercombined loads", Applied Composite Materials, V3, 1996, pp151-162.
3 Swanson S R and Colvin G E,"Compressive strength of carbon/epoxy laminates undermultiaxial stress", Final Annual Report to the Lawrence Livemore National Laboratory,UCRL-21235, 1989.
4 Garala H J," Experimental evaluation of graphite/epoxy composite cylinders subjected toexternal hydrostatic compressive loading", Proc 1987 SEM Spring Conf on ExperimentalMechanics, Houston, Texas, 14-19 June, 1987. pp 948-951.
5 Al-Khalil M F S, Soden P D and Kaddour A S," Buckling of thin angle ply GRP tubesunder external pressure loading", submitted to International Journal of Solids andStructures, 1997
6 Mistry J, Gibson A G and Wu Y S, "Failure of composite cylinders under combinedexternal pressure and axial loading", Composite Structures, V22, 1992, pp 193-200.
7 Graham D, "Composite pressure hulls for deep ocean submersibles", CompositeStructures, V32, 1995, pp331-343.
8 Hibbit, Karlsson and Sorensen Inc., ABAQUS User Manual, VERSION 5.5, 1995,Providence, RI, 1996.
9 Al-Khalil M F S, Soden P D, Kitching R, and Hinton M J," The effects of radial stresseson the strength of thin walled filament wound GRP composite pressure cylinders",Intenational Journal of Mechanical Sciences, V38, 1995, pp 97-120.
10 Kaddour A S, Soden P D and Hinton M J (1997),"Failure of 55( filament woundglass/epoxy tubes under biaxial compression", sent to Journal of Composite Materials.
11 Kaddour A S and Soden P D, "Design of high pressure rig for biaxial and triaxialcompression testing of composite tubes", Science and Engineering of CompositeMaterials, V5, 1996, pp 27-38.
12 Liu W, Soden P D and Kaddour A S," Design of end plugs for biaxial compression loadingof thick composite tubes", in preparation.

Proceedings of ICCM–11, Gold Coast, Australia, 14th-18th July 1997
V - 797
OFF-AXIS FIBER ORIENTATION HIGH-STRAINRATE COMPRESSION TESTING OF K-49/3501-6
KEVLAR /EPOXY COMPOSITES
Eric Preissner, Eyassu Woldesenbet, Jack R. Vinson
Department of Mechanical Engineering, University of Delaware, Newark, DE 19716, USA
SUMMARY: The Split-Hopkinson Pressure Bar (SHPB) was used to study the dynamiccompressive properties of K-49/3501-6 KEVLAR/Epoxy laminates. Both a unidirectional(UD) and a cross-ply (XP) laminate were examined. Each laminate was a 30.5 cm (12 in)square flat panel composed of 75 plies; the test specimens were approximately 0.95 cm (3/8in) cubes. The tested fiber orientation angles were 0, 15, 30, 45, 60, 75, and 90 degrees.Quasi-static tests were also conducted for comparison purposes. The strain rate values variedfrom 200 - 1100 /s. The data for the KEVLAR/Epoxy composites were obtained from 120tests for the UD laminate and 90 tests for the XP laminate. The ultimate stress of bothmaterials shows some strain rate sensitivity in the 1-direction, with significant reductions instress, but no rate sensitivity for other angles. The ultimate strains for both materials increasewith increasing angle, but show no rate sensitivity.
KEYWORDS: dynamic material properties, high-strain-rate, Split-Hopkinson Pressure Bar,KEVLAR 49, 3501-6 Epoxy, off-axis, unidirectional, cross-ply
INTRODUCTION
At present, a program is underway at the University of Delaware under the Office of NavalResearch sponsorship (Dr. Y.D.S. Rajapakse) that involves three tasks:
1. The high-strain-rate testing in compression and tension of various polymer matrixcomposite (and other) materials using the existing SHPB facility, and correlation andstatistical analysis of the dynamic material properties obtained.
2. Examination of the samples tested, using optical and scanning electron microscopy tocharacterize the deformation and fracture processes.
3. The evaluation of the suitability of current models, such as Johnson-Cook, Ferilli-Armstrong, Steinberg-Guinan-Lund, and Bodner-Partom, to describe the strength,deformation, and failure of these materials at high-strain-rates and the modification ofthese models, or whenever necessary, the development of new models.
The present paper concentrates on Task 1.
The SHPB facility at the University of Delaware has been described previously in [1-6].Kolsky [7] introduced a method for determining mechanical properties of materials at high-strain-rates using the SHPB in 1949. The method was developed based on wave propagation
Volume V: Textile Composites and Characterisation
V - 798
theory in elastic bars and the interaction between a stress wave and a short specimen. Tobegin a test, a specimen is placed between two long, 1.9 cm (3/4 in) diameter Inconel bars, the“incident bar” and the “transmitted bar”, which are supported by Teflon bearings. Impact isinitiated by releasing nitrogen gas from a pressurized chamber. The gas propels a striker bar(supported by and riding on Teflon rings) through a guiding barrel, at the end of which itstrikes the incident bar. The velocity of the striker bar just prior to impact is measured usingtwo infrared beams at the end of the barrel. At impact, the incident bar receives an elasticcompressive stress wave with a specific wave velocity and a wave shape that is a function oftime. When the wave reaches the incident bar/specimen interface, a portion of the incidentwave is reflected back into the incident bar as a tensile wave. The remaining portion of thewave is transmitted into the specimen as a compressive wave. The wave transmitted into thespecimen travels through the specimen and reaches the specimen/transmitted bar interface,where a portion of the wave is reflected back into the specimen. The rest is transmitted intothe transmitted bar as a compressive wave.
Because the specimen length is short, the initial stress wave in the specimen undergoesnumerous internal reflections during the test. The stress distribution in the specimen isassumed to be uniform due to these numerous reflections. In addition it is assumed that thestress waves undergo minimal dispersion, that the bars remain elastic, and that the ends ofboth the incident and transmitted bars in contact with the specimen remain flat. Based on thelength of the striker bar, there is a characteristic time window corresponding to the duration ofthe stress wave. The wave pulse time window of the University of Delaware SHPB isapproximately 290 microseconds. This means that the specimen must fail within 290microseconds after the start of the tests for failure to be accurately characterized. This has notbeen a problem with the relatively brittle composites tested to date.
Strain gages, connected to a Fluke PM3394A recording oscilloscope, are mounted on theincident and transmitted bars, equidistant from the specimen interfaces. The oscilloscoperecords the strain gage's output as a voltage versus time graph. Using this data, along with thespeed of the striker bar and the physical dimensions of the bars and specimens, stress versusstrain curves can be generated for different strain rates. Zukas [8] has shown that for manymetals, mechanical properties vary significantly with strain rate. This new data will add towhat is now available for other materials. At the University of Delaware, material systemstested to date include glass/epoxy, glass/polyester, graphite/epoxy, carbon/metal matrix, andcarbon/ceramic matrix, and the most recent papers regarding these materials are given in [1-6].
SAMPLE PREPARATION
The KEVLAR/Epoxy composite discussed herein is a DuPont KEVLAR 49 fiber with aHercules 3501-6 epoxy matrix. The basic UD 30.5 cm (12 in) wide prepreg tape wasoriginally manufactured by the "hi-E" Company, and stored in the freezer at the Center forComposite Materials (CCM) at the University of Delaware. Two 30.5 cm (12 in) square flatpanels, each made up of 75 plies were fabricated. The nominal thickness of each panel aftercuring was approximately 0.95 cm (3/8 in). One panel was laid up as a UD laminate, whilethe other was a mid-plane symmetric, XP laminate. All specimens were then fabricated out ofthese panels by using a water-cooled surface grinder equipped with a thin-kerf diamond gritsaw blade. All UD and XP specimens were produced from the same respective panel byorienting the primary fiber direction at the proper angle to the saw travel. Two sets ofperpendicular cuts resulted in cubic samples with approximately 0.95 cm (3/8 in) sides. The

Proceedings of ICCM–11, Gold Coast, Australia, 14th-18th July 1997
V - 799
wet diamond saw produced very little delamination and smooth cut surfaces. Furtherimprovement of the cut surfaces was accomplished by wet polishing with 600 grit SiC paper.
Previous research, [1-6], performed using the University of Delaware SHPB facility involvedright circular cylinders with a length-to-diameter (L/D) ratio of approximately 1.5. Recently,a study using a graphite/epoxy composite was conducted [9] that examined both various L/Dratios from 0.5 to 2.0 as well as a comparison between square/rectangular and cylindricalspecimen geometries. Within the range of variables examined in [9], no statisticallysignificant differences could be found in the material properties determined by the testing.These results are fortuitous, as the properties of KEVLAR which make it a desirablematerial also make it difficult to machine, particularly smooth, cylindrical, core-drilledspecimens. Consequently, square/rectangular specimens were produced and used for the testsdiscussed herein. The decision to use a cubic geometry also made preparation of the off-anglespecimens considerably easier than if they had been core drilled.
RESULTS AND DISCUSSION
In this paper, the typical notation convention for fibrous composite materials is followed. The1-, 2-, and 3-directions are three mutually orthogonal axes, with the 1-direction parallel to theprimary fiber direction, the 2-direction perpendicular to the primary fiber direction in thetransverse dimension, and the 3-direction also perpendicular to the primary fiber direction butin the thickness dimension. Theoretically, the 2- and the 3-directions are identical in a UDmaterial, while the 1- and the 2- directions are identical in a XP material. This theoreticalorthotropic symmetry has been demonstrated for the panels in this paper in [9, 10]. The off-axis angle, Θ, for this paper is defined as the angle between the axis of the SHPB and the 1-direction of the samples; therefore Θ = 0 is equivalent to the 1-direction, and Θ = 90 isequivalent to the 2-direction. Because of the symmetry of the XP material it was tested onlyat Θ = 0, 15, 30, and 45 degrees.
The fiber volume fraction (Vf) of the KEVLAR used for this testing was estimated to be41%. This calculation was based on the measured weight and volume of a selected number ofsamples (average density 1.324 g/cm3), the published density of KEVLAR 49 (1.44 g/cm3,[11]), and an unconfirmed density for the 3501-6 epoxy (1.26 g/cm3). The Vf of thecomposite that was used in [11] to provide the published ultimate stress and strain data was60% and used an unidentified epoxy matrix.
The dynamic results from the SHPB are also compared with quasi-static compression testsperformed at the CCM. The quasi-static tests were performed on an Instron 1125 screw-typemachine in the constant speed mode for all Θ angles. These tests used specimens withgeometry identical to that for the SHPB tests, with the samples simply placed between twoflat platens and compressed to failure, and the results recorded on a strip chart. The results forthe UD quasi-static tests are shown in Table 1, while those for the XP are shown in Table 2.These results are the averages of three tests for each Θ. The published quasi-static ultimatestresses in [11] for a KEVLAR 49/Epoxy laminate (unspecified epoxy) with Vf = 0.60 are276 MPa for the 1-direction and 137.9 MPa for the 2-direction. The published quasi-staticultimate strains in [11] for the same material are approximately 1.33% for the 1-direction and3.11% for the 2-direction. Additionally, quasi-static compression data for the 3501-6 epoxyusing an IITRI fixture has been given in [12]. The values given in [12] for ultimate stress andstrain are approximately 81 MPa and 2.05% respectively. The stress-strain relation for the

Volume V: Textile Composites and Characterisation
V - 800
3501-6 epoxy was found to be non-linear. The published comparison data from [11] and [12]are also included in Figs. 2 and 3.
Table 1: UD Quasi-Static Test Results Table 2: XP Quasi-Static Test Results
Θ (deg. from 1-dir)
Strain Rate at Failure (/sec)
Ultimate Strain (%)
Ultimate Stress (MPa)
Average 0.0496 240.290 Std. Dev. Quasi-static 0.0009 10.35
Coeff. of Var. 1.90% 4.31%Average 0.0530 224.23
15 Std. Dev. Quasi-static 0.0027 3.79Coeff. of Var. 5.04% 1.69%
Average 0.0563 157.0230 Std. Dev. Quasi-static 0.0004 1.97
Coeff. of Var. 0.66% 1.25%Average 0.0627 130.25
45 Std. Dev. Quasi-static 0.0023 1.24Coeff. of Var. 3.61% 0.95%
Average 0.0604 109.5860 Std. Dev. Quasi-static 0.0026 3.22
Coeff. of Var. 4.29% 2.94%Average 0.0521 100.94
75 Std. Dev. Quasi-static 0.0003 1.35Coeff. of Var. 0.65% 1.34%
Average 0.0493 90.5590 Std. Dev. Quasi-static 0.0000 2.59
Coeff. of Var. 0.05% 2.86%
Θ (deg.
from 1-dir)Strain Rate at Failure (/sec)
Ultimate Strain (%)
Ultimate Stress (MPa)
Average 0.0985 191.050 Std. Dev. Quasi-static 0.0017 0.49
Coeff. of Var. 1.74% 0.26%Average 0.0884 167.53
15 Std. Dev. Quasi-static 0.0049 9.47Coeff. of Var. 5.56% 5.66%
Average 0.1014 150.8530 Std. Dev. Quasi-static 0.0156 2.33
Coeff. of Var. 15.35% 1.55%Average 0.1521 142.00
45 Std. Dev. Quasi-static 0.0036 3.25Coeff. of Var. 2.39% 2.29%
The averaged dynamic test results are given in Tables 3-13. Each average value representsfrom three to five repeated tests at each test condition. A single test condition consisted of aspecific combination of: UD or XP lay-up; fiber orientation angle, Θ (0 - 90 in 15 degincrements); and applied SHPB pressure. The applied pressure was held approximatelyconstant for each test series (denoted by each average value) in an attempt to control the strainrate achieved in the specimen to a specific level. Within each test series, fluctuations didoccur for various reasons in the applied pressure and/or the achieved strain rate. Because ofthis, standard deviations and coefficients of variation are given in these tables for each testseries. An example of a typical stress-strain plot, developed from the recorded strain gagedata, for the UD material at Θ = 15 degrees and an average strain rate of 436 /sec is given inFig. 1.
Stress and Strain Rate vs. StrainUni-Directional KEVLAR 49/3501-6
15 Degrees Off-Axis, SHPB Pressure ~30 psi
0
50
100
150
200
250
0.000 0.002 0.004 0.006 0.008 0.010 0.012 0.014 0.016 0.018 0.020Strain (%)
Str
ess
(MP
a)
0
100
200
300
400
500
600
700
Str
ain
Rat
e (/
sec)
Stress - u15301Stress - u15302Stress - u15303Strain Rate - u15301Strain Rate - u15302Strain Rate - u15303
Figure 2: Example Stress-Strain Plot for the UD Material

Proceedings of ICCM–11, Gold Coast, Australia, 14th-18th July 1997
V - 801
Table 3: UD SHPB Results for Θ = 0 Table 4: UD SHPB Results for Θ = 15Θ = 0 deg. (from
1-dir)Strain Rate at Failure (/sec)
Ultimate Strain (%)
Ultimate Stress (MPa)
Average 187.82 0.01633 294.23Std. Dev. 28.05 0.00179 15.31
Coeff. of Var. 14.93% 10.98% 5.20%Average 379.74 0.0071 238.48Std. Dev. 17.05 0.0005 29.69
Coeff. of Var. 4.49% 7.05% 12.45%Average 433.36 0.01199 315.12Std. Dev. 15.00 0.00023 8.01
Coeff. of Var. 3.46% 1.92% 2.54%Average 489.25 0.0128 306.97Std. Dev. 21.63 0.0003 3.82
Coeff. of Var. 4.42% 2.15% 1.25%Average 553.02 0.0137 314.68Std. Dev. 43.29 0.0012 3.97
Coeff. of Var. 7.83% 8.41% 1.26%
Average 549.02 0.0142 294.34Std. Dev. 24.00 0.0013 10.52
Coeff. of Var. 4.37% 9.13% 3.57%
Θ = 15 deg. (from 1-dir)
Strain Rate at Failure (/sec)
Ultimate Strain (%)
Ultimate Stress (MPa)
Average 318.06 0.0121 186.72Std. Dev. 23.84 0.0007 11.04
Coeff. of Var. 7.50% 5.46% 5.91%
Average 436.40 0.0120 204.22Std. Dev. 14.13 0.0002 1.93
Coeff. of Var. 3.24% 1.61% 0.95%Average 517.83 0.0124 190.60Std. Dev. 10.83 0.0004 10.50
Coeff. of Var. 2.09% 3.53% 5.51%Average 550.15 0.0129 189.05Std. Dev. 64.26 0.0002 7.85
Coeff. of Var. 11.68% 1.73% 4.15%Average 578.25 0.0133 163.01Std. Dev. 19.25 0.0004 31.46
Coeff. of Var. 3.33% 2.85% 19.30%
Table 5: UD SHPB Results for Θ = 30 Table 6: UD SHPB Results for Θ = 45Θ = 30 deg. (from
1-dir)Strain Rate at Failure (/sec)
Ultimate Strain (%)
Ultimate Stress (MPa)
Average 392.50 0.0191 121.39Std. Dev. 13.75 0.0009 6.60
Coeff. of Var. 3.50% 4.72% 5.44%Average 592.10 0.0181 108.00Std. Dev. 72.92 0.0009 39.14
Coeff. of Var. 12.32% 4.92% 36.24%Average 674.95 0.0181 118.90Std. Dev. 33.91 0.0004 10.52
Coeff. of Var. 5.02% 2.13% 8.85%Average 716.33 0.0182 124.58Std. Dev. 38.61 0.0007 7.33
Coeff. of Var. 5.39% 3.68% 5.88%Average 769.60 0.0189 133.30Std. Dev. 81.10 0.0005 5.61
Coeff. of Var. 10.54% 2.42% 4.21%
Θ = 45 deg. (from 1-dir)
Strain Rate at Failure (/sec)
Ultimate Strain (%)
Ultimate Stress (MPa)
Average 424.8618 0.0260 109.60Std. Dev. 42.9467 0.0007 24.14
Coeff. of Var. 10.11% 2.75% 22.02%Average 622.87 0.0249 116.57Std. Dev. 40.36 0.0004 11.30
Coeff. of Var. 6.48% 1.50% 9.69%Average 646.56 0.0266 123.73Std. Dev. 65.85 0.0018 2.86
Coeff. of Var. 10.18% 6.88% 2.31%Average 791.64 0.0253 126.37Std. Dev. 51.23 0.0014 7.21
Coeff. of Var. 6.47% 5.43% 5.70%Average 907.52 0.0250 121.31Std. Dev. 63.54 0.0013 5.51
Coeff. of Var. 7.00% 5.20% 4.54%
Table 7: UD SHPB Results for Θ = 60 Table 8: UD SHPB Results for Θ = 75Θ = 60 deg. (from
1-dir)Strain Rate atFailure (/sec)
Ultimate Strain(%)
Ultimate Stress(MPa)
Average 425.47 0.0263 109.88Std. Dev. 17.80 0.0020 15.66
Coeff. of Var. 4.18% 7.72% 14.25%Average 635.93 0.0276 117.06Std. Dev. 8.36 0.0011 3.71
Coeff. of Var. 1.31% 4.15% 3.17%Average 720.63 0.0279 114.72Std. Dev. 30.86 0.0011 3.00
Coeff. of Var. 4.28% 4.07% 2.61%Average 876.58 0.0286 119.20Std. Dev. 12.22 0.0011 5.48
Coeff. of Var. 1.39% 4.00% 4.59%Average 929.67 0.0273 119.49Std. Dev. 43.46 0.0010 2.23
Coeff. of Var. 4.68% 3.78% 1.87%
Θ = 75 deg. (from 1-dir)
Strain Rate at Failure (/sec)
Ultimate Strain (%)
Ultimate Stress (MPa)
Average 460.34 0.0258 90.64Std. Dev. 8.26 0.0012 5.16
Coeff. of Var. 1.79% 4.57% 5.70%Average 652.28 0.0274 113.86Std. Dev. 6.70 0.0003 5.37
Coeff. of Var. 1.03% 1.07% 4.71%Average 769.33 0.0262 100.11Std. Dev. 23.98 0.0006 7.18
Coeff. of Var. 3.12% 2.33% 7.17%Average 821.08 0.0277 117.52Std. Dev. 10.56 0.0006 0.11
Coeff. of Var. 1.29% 2.08% 0.09%Average 930.68 0.0264 114.18Std. Dev. 21.09 0.0005 4.94
Coeff. of Var. 2.27% 1.91% 4.33%

Volume V: Textile Composites and Characterisation
V - 802
Table 9: UD SHPB Results for Θ = 90Θ = 90 deg. (from
1-dir)Strain Rate at Failure (/sec)
Ultimate Strain (%)
Ultimate Stress (MPa)
Average 468.13 0.0282 105.75Std. Dev. 17.00 0.0022 13.29
Coeff. of Var. 3.63% 7.69% 12.56%Average 683.25 0.0275 103.51Std. Dev. 38.99 0.0003 1.17
Coeff. of Var. 5.71% 1.26% 1.13%Average 848.49 0.0263 101.59Std. Dev. 9.69 0.0013 2.03
Coeff. of Var. 1.14% 4.78% 2.00%Average 876.62 0.0262 109.79Std. Dev. 34.22 0.0012 5.75
Coeff. of Var. 3.90% 4.45% 5.23%Average 993.78 0.0249 110.75Std. Dev. 30.95 0.0007 5.42
Coeff. of Var. 3.11% 2.79% 4.89%Average 1058.05 0.0259 98.21Std. Dev. 18.14 0.0004 2.70
Coeff. of Var. 1.71% 1.71% 2.75%
Table 10: XP SHPB Results for Θ = 0 Table 11: XP SHPB Results for Θ = 15Θ = 0 deg. (from
1-dir)Strain Rate at Failure (/sec)
Ultimate Strain (%)
Ultimate Stress (MPa)
Average 209.10 0.0254 222.06Std. Dev. 15.48 0.0013 2.78
Coeff. of Var. 7.40% 4.97% 1.25%Average 412.20 0.0282 237.30Std. Dev. 23.54 0.0022 5.57
Coeff. of Var. 5.71% 7.64% 2.35%Average 582.40 0.0299 233.42Std. Dev. 36.20 0.0008 6.09
Coeff. of Var. 6.22% 2.51% 2.61%Average 729.20 0.0176 216.06Std. Dev. 38.45 0.0061 12.62
Coeff. of Var. 5.27% 34.68% 5.84%Average 878.60 0.0275 219.48Std. Dev. 87.13 0.0048 13.06
Coeff. of Var. 9.92% 17.27% 5.95%
Θ = 15 deg. (from 1-dir)
Strain Rate at Failure (/sec)
Ultimate Strain (%)
Ultimate Stress (MPa)
Average 385.40 0.0239 173.40Std. Dev. 41.26 0.0038 12.97
Coeff. of Var. 10.71% 15.84% 7.48%
Average 641.20 0.0265 176.20Std. Dev. 44.49 0.0045 12.11
Coeff. of Var. 6.94% 16.95% 6.87%Average 846.80 0.0246 186.60Std. Dev. 36.36 0.0063 8.79
Coeff. of Var. 4.29% 25.50% 4.71%Average 1053.80 0.0215 226.20Std. Dev. 74.74 0.0002 49.73
Coeff. of Var. 7.09% 0.78% 21.99%
Table 12: XP SHPB Results for Θ = 30 Table 13: XP SHPB Results for Θ = 45Θ = 30 deg. (from 1-dir)
Strain Rate at Failure (/sec)
Ultimate Strain (%)
Ultimate Stress (MPa)
Average 378.40 0.0373 154.40Std. Dev. 28.18 0.0018 21.94
Coeff. of Var. 7.45% 4.95% 14.21%Average 687.20 0.0340 156.40Std. Dev. 41.47 0.0056 9.32
Coeff. of Var. 6.03% 16.42% 5.96%Average 969.40 0.0330 155.60Std. Dev. 39.42 0.0050 36.99
Coeff. of Var. 4.07% 15.11% 23.77%Average 1140.20 0.0272 156.00Std. Dev. 54.98 0.0023 12.21
Coeff. of Var. 4.82% 8.38% 7.82%
Θ = 45 deg. (from 1-dir)
Strain Rate at Failure (/sec)
Ultimate Strain (%)
Ultimate Stress (MPa)
Average 407.20 0.0366 136.00Std. Dev. 24.84 0.0020 7.97
Coeff. of Var. 6.10% 5.37% 5.86%Average 731.00 0.0421 132.80Std. Dev. 27.18 0.0012 12.38
Coeff. of Var. 3.72% 2.77% 9.32%Average 961.00 0.0293 141.00Std. Dev. 58.56 0.0106 14.75
Coeff. of Var. 6.09% 36.17% 10.46%Average 1139.40 0.0266 139.40Std. Dev. 72.90 0.0024 9.18
Coeff. of Var. 6.40% 9.02% 6.59%
For the UD material, the above data are plotted in Figs. 2 and 3. Fig. 2 plots the averageultimate stress versus Θ for several groupings of strain rates. It is seen that the quasi-staticresults for this paper are significantly lower (14% and 35% lower for the 1- and 2-directionsrespectively) than the published values. All of the data does show the typical and expectedreduction in ultimate stress with increasing off-axis angle. The dynamic data also shows anincrease in ultimate stress with increasing strain rate for the 1-direction (except for the group

Proceedings of ICCM–11, Gold Coast, Australia, 14th-18th July 1997
V - 803
at approximately 550 /sec), but with a larger fall-off in stress with increasing off-axis angle.For Θ > 45 degrees, all data tends to similar values.
Average Ultimate Stress vs. Fiber Direction and Strain RateUni-Directional KEVLAR 49/3501-6
0
50
100
150
200
250
300
350
0 10 20 30 40 50 60 70 80 90
Fiber Direction, Θ (Degrees Away From 1-dir.)
Ave
rage
Ulti
mat
e S
tres
s (M
Pa)
Quasi-static~400 /sec~550 /sec~650 /sec~750 /sec~800 /secDuPont Q.S. Laminate Data [12]DuPont Q.S. Laminate Data [12]Neat Resin Data [13]
Figure 2: UD Average Ultimate Stress vs. Fiber Direction and Strain Rate
Fig. 3 plots the average ultimate strain versus Θ for several groupings of strain rates for theUD material. Except for the 1-direction results for the 400 /sec and 550 /sec groups, theredoes not seem to be a significant influence of strain rate on ultimate strain. Due to therelatively small number of samples at each test condition, it is difficult to determine whetherthe differences shown in the 400 /sec and 550 /sec groups are real effects or just statisticalvariances. Overall, this format for presentation of both the stress and strain results is notcompletely satisfactory as, within each of the strain rate “groups”, there is a significantvariation in strain rate with Θ. However, due to limitations in the plotting program, plottingthe stress and strain versus both off-axis angle and the distinct strain rate for each point wasnot possible.
For the XP material, Figs. 4 and 5 show that the ultimate stresses and strains of this compositeare also sensitive to Θ. The ultimate stress is shown to decrease as the off-axis angle isincreased to Θ = 45. Fig. 4 also shows that the ultimate stress of the material becomes strainrate insensitive as the off-axis testing angle is increased. Fig. 5 shows that the ultimate strainvalues tend to increase for 15 < Θ < 45 for all strain rates. The ultimate strain of the materialin the XP composite tends to be more strain sensitive at the larger off-axis testing angles, butno clear trend is evident. In both Figs. 4 and 5, the data plotted for Θ > 45 is just a reflectionof that for Θ < 45 due to the symmetry of the material.

Volume V: Textile Composites and Characterisation
V - 804
Average Ultimate Strain vs. Fiber Direction and Strain RateUni-Directional KEVLAR 49/3501-6
0.000
0.005
0.010
0.015
0.020
0.025
0.030
0.035
0 10 20 30 40 50 60 70 80 90
Fiber Direction, Θ (Degrees Away From 1-dir.)
Ave
rage
Ulti
mat
e S
trai
n (%
)
~400 /sec~550 /sec~650 /sec~750 /sec~800 /secDuPont Q.S. Laminate Data [12]DuPont Q.S. Laminate Data [12]Neat Resin Data [13]
Figure 3: UD Average Ultimate Strain vs. Fiber Direction and Strain Rate
Average Ultimate Stress vs. Fiber Direction and Strain RateCross-ply KEVLAR 49/3501-6
100
120
140
160
180
200
220
240
0 10 20 30 40 50 60 70 80 90
Fiber Direction, Θ (Degrees Away From 1-dir.)
Ave
rage
Ulti
mat
e S
tres
s (M
Pa)
Quasi-static~400 /s~600 /s~900 /s
Figure 4: XP Average Ultimate Stress vs. Fiber Direction and Strain Rate

Proceedings of ICCM–11, Gold Coast, Australia, 14th-18th July 1997
V - 805
Average Ultimate Strain vs. Fiber Direction and Strain RateCross-ply KEVLAR 49/3501-6
0.000
0.005
0.010
0.015
0.020
0.025
0.030
0.035
0.040
0.045
0 10 20 30 40 50 60 70 80 90
Fiber Direction, Θ (Degrees Away From 1-dir.)
Ave
rage
Ulti
mat
e S
trai
n (%
)
~400 /s
~600 /s
~900 /s
Figure 5: XP Average Ultimate Strain vs. Fiber Direction and Strain Rate
CONCLUSIONS
As expected, changing the fiber orientation angle with respect to the test direction changes thevalues of the ultimate stress and strain of the K-49/3501-6 KEVLAR/Epoxy composites.Increasing the off-axis angle reduces the reinforcing effectiveness of the fiber, decreasing thecomposite’s ultimate stress and increasing the failure strain. This effect is mitigatedsomewhat in the XP laminate due to more isotropic nature inherent in an XP lay-up.
The lay-up of the material influences the resulting material properties. While the UD materialis stronger in the 1-direction than the XP material (~300 MPa compared to ~220 MPa), theXP material’s ultimate stress suffers less of a reduction as the off-axis angle is increased. TheUD material decreases from a stress of ~300 MPa at Θ = 0 degrees to a stress of ~120 MPa atΘ = 45 degrees, a reduction of 60%. The XP material decreases from a stress of ~220 MPa atΘ = 0 degrees to a stress of ~135 MPa at Θ = 45 degrees, a reduction of only 40%.Additionally, while the UD ultimate stress remains essentially constant for Θ > 45 degrees,the XP ultimate stress returns to the higher values for Θ > 45 degrees.
The results seem to indicate that, in compression, the KEVLAR fiber is possibly strain ratesensitive, but that the 3501-6 epoxy matrix is not. This is supported by the result that, forboth the UD and XP material, tests for the 1-direction show a noticeable increase in ultimatestress with increasing strain rate, but with a rapid return to the nominal quasi-static values forΘ ≥ 15 degrees.
The ultimate failure strain for both the UD and the XP material seem to be strain rateinsensitive. At Θ = 45 degrees, the XP material does show a significant amount of variationin the data, but the small statistical database makes it difficult to determine whether this is justdata scatter or a material effect.
The statistical correlation of the data is very good, despite the small number of individual testswithin each test series. This is shown by the fact that for ultimate stress, in a total of 65 testseries performed for this research, 34 have coefficients of variation under 5%, 24 have

Volume V: Textile Composites and Characterisation
V - 806
coefficients of variation between 5% and 10%, three have coefficients of variation between10% and 20%, and only four have coefficients of variation greater than 20%
REFERENCES
1. Powers, B.M. and J.R. Vinson, “High-strain-rate Effects in Materials in SandwichConstruction”, Sandwich Construction, 3rd Ed., Allen, H.G., Ed., Engineering MaterialsAdvisory Services, Ltd., England, 1996, pp. 769-778.
2. Powers, B.M., J.R. Vinson, I.W. Hall, and V. Nardone, "High-strain-rate MechanicalProperties of Silicon Carbide Reinforced 2080 Aluminum Metal Matrix Composites",Proceedings of the 10th International Conference on Composite Materials, 1995, pp.317-322.
3. Powers, B.M. and J.R. Vinson, "High-strain-rate Mechanical Properties of IM7/8551-7Graphite Epoxy", Proceedings of the 10th Technical Conference of the AmericanSociety for Composites, 1995, pp. 227-238.
4. Powers, B.M., J.R. Vinson, M. Wardle, and B. Scott, "High-strain-rate Effects on TwoAS4 Graphite Fiber Polymer Matrix Composites", ASME Aerospace Division BoundVolume AD-48, High-strain-rate Effects on Polymer, Metal, and Ceramic MatrixComposites and Other Advanced Materials, 1995, pp. 179-189.
5. Powers, B.M., J.R. Vinson, I.W. Hall and R.F. Hubbard, "High-strain-rate MechanicalProperties of Cycom 5920/1583", 36th AIAA/ASME/ASCE/AHS/ASC Structures,Structural Dynamics, and Materials Conference Collection of Technical Papers, v4,1995, AIAA, New York, NY, pp. 2386-2392.
6. Powers, B.M., J.R. Vinson, M. Wardle, and B. Scott, "High-strain-rate Effects on TwoGraphite Fiber K3B Polyimide Matrix Composites", Proceedings of the 37thAIAA/ASME/ASCE/AHS/ASC Structures, Structural Dynamics, and MaterialsConference, 1996, pp. 30-38.
7. Kolsky, H., "An investigation of the Mechanical Properties of Materials at Very HighRates of Loading", Proc. Phys. Soc. B., No. 62, 1949, pp. 676-701.
8. Zukas, J. (ed.), Impact Dynamics, John Wiley and Sons, New York, N.Y., 1982.
9. Woldesenbet, E. and J.R. Vinson, "Effect of Specimen Geometry in High-strain-rateTesting of Graphite/Epoxy Composites", to be presented at the 38thAIAA/ASME/ASCE/AHS/ASC Structures, Structural Dynamics, and MaterialsConference, 1997.
10. Preissner, E., Woldesenbet, E., and Vinson, J.R., “High-strain-rate Compression Testingof K-49/3501-6 KEVLAR/Epoxy Composites”, to be presented at the 38thAIAA/ASME/ASCE/AHS/ASC Structures, Structural Dynamics, and MaterialsConference, 1997.
11. Anonymous, Data Manual for KEVLAR 49 Aramid, DuPont Technical Information,1986, pp. 29-32.
12. Crasto, A.S., Kim, R.Y., and Whitney, J.M., “Advanced Laminate CompressionStrengths From a Novel Sandwich Test Specimen”, Proceedings of the 32ndAIAA/ASME/ASCE/AHS/ASC Structures, Structural Dynamics, and MaterialsConference, 1991, pg. 14.

Proceedings of ICCM–11, Gold Coast, Australia, 14th-18th July 1997
V - 807
ANALYTICAL MODEL FOR PREDICTION OFMICROBUCKLING INITIATION IN COMPOSITE
LAMINATES
Pierre J. Berbinau and Ernest G. Wolff
Department of Mechanical Engineering, Oregon State University, Corvallis, OR 97331, USA
SUMMARY: In order to model the initiation of failure modes arising from staticcompression loading of multidirectional composites, namely kinking and free-edgedelamination, we have developed a theory that predicts analytically the interlaminar shearstresses τzx and τzy. We then incorporate these shear stresses into a model of the influence of
adjacent angled plies on the microbuckling and kinking of fibers in 0° plies. This leads to ageneral prediction of the compressive failure strains of multidirectional composite laminates.Experimental verification is described, which uses an AS4/PPS thermoplastic composite withthe generic layup [θ/-θ/02/θ/-θ/0]s with θ varying between 10° and 90°. The theory is in good
qualitative and quantitative agreement with experimental results, and explains the order ofoccurrence of the various failure modes.
KEYWORDS: microbuckling, kinking, interlaminar stresses, free-edge stresses,compression, laminates, modeling
INTRODUCTION
It is well-known that in-plane kinking, starting at the sample edges, is the primary failuremode of unidirectional high fiber volume fraction composites, and the initial failure mode ofmultidirectional composites [1-10]. To our knowledge, only five attempts have been made tomodel the compression behavior of non-unidirectional composites: cross-ply [11], angle-ply[12], and multidirectional composites [13-15]. None of these consider free-edge stresses. Wecontend that these stresses play a major role in the in-plane kinking of 0° fibers sinceexperiments show that in-plane kinking starts at the edges [8], [16-18]. (Out-of-planemicrobuckling can also occur depending on lateral constrains [19] and in cross-ply laminates[20]). We assume that for unnotched laminates, the failure of a 0° ply triggers failure in theremaining plies, especially for laminates containing significant percentages of 0° plies (note43% of 0° plies in our experiments). Previous work [17] suggested an influence of the angleθ if plies adjacent to the 0° plies on the microbuckling strain of the latter. Among theinterlaminar stresses σz, τzx and τzy, only the shear stresses could have an influence on the
in-plane movement of the 0° fibers. This is a reasonable assumption because σz is normal to
the movement of the 0° fibers when they buckle in-plane and should not affect their in-planemotion. FEA studies on composites show that interlaminar stresses are zero in the centralportion of the specimen and become significant only in a thin boundary layer near the edgeswhere they display exponential behavior [21-24]. Calculation of these interlaminar stressesfor any layup is required. We shall then incorporate these stresses into a generalmicrobuckling equation for a 0° fiber located at the edge of a 0° ply. A criterion governing

Volume V: Textile Composites and Characterisation
V - 808
fiber failure is described and compared to other possible failure mechanisms, such as matrixor interlaminar failures. This enables the observed failure strains to be related to the predictedfailure modes.
THEORY
Interlaminar Edge Stresses
It is seen that we need to calculate analytically the interlaminar stresses, especially theirmagnitude at the free edges. This is not readily done with FEA due to mesh sensitivity [24].The work of Puppo and Evensen [25] suggests a useful approach, although their originaltheory applied only to a 4-layer symmetrical laminate in tension. Extension to an arbitrarynumber of layers requires modification of the equilibrium equations. We adopt the equivalentply construction of [25]. A ply is replaced by a central anisotropic layer surrounded by layersof the matrix material. The thickness e of the latter is estimated from microscopy to be on theorder of a fiber diameter. These matrix layers carry the interlaminar stresses. We consider asymmetrical laminate of 2N plies. A given ply k (1 <= k < N) has a thickness hk and its fibers
make an angle θk with the loading direction x. The width direction is y and the thickness
direction is z. The plate has a width Wi and a length L. Modification of the equilibriumequations of [25] is described in detail in [27]. The initial solution is made for the case of aninfinitely wide laminate under uniform compression. We then superimpose the solution for alaminate under no compression but subjected to normal (pk) and shear stresses (tk) at the
edges (based on stresses at y = ±Wi/2 and the new boundary conditions). Displacementsolutions of the form uk(y) = A·ery are chosen since the solution is independent of x. The
final expressions for the interlaminar shear stresses have the form [27]:
τzxk( ) y, ua( )= Gm
2eA i
1( ) ⋅ FacAik( ) − FacAi
k +1( )( )sinh ρ i y( )i =1
2N −2
∑
τzyk( ) y, ua( )= Gm
2eA i
1( ) ⋅ FacBik( ) − FacAi
k+1( )( )sinh ρ i y( )i =1
2N −2
∑
for 1 k N-1 (1)
where Gm is the matrix shear modulus, at an interface (k) between plies (k) and (k+1). The
coefficients A i1( )
1≤ i≤ 2N− 2 are a linear function of the applied displacement ua. Laminates that
contain only 0° and 90° plies have to be treated separately due to the decoupling of theequilibrium equations. In this case [27]:
τzxk( )
y, ua( )≡ 0
τzyk( ) y, ua( )= Gm
2eBi
1( ) ⋅ FacBik( ) − FacBi
k +1( )( )sinh ρ i+ N −1 y( )i =1
N −1
∑
for 1 k N-1 (2)
The coefficients Bi1( )
1≤i ≤ N−1 are a linear function of the applied displacement ua.

Proceedings of ICCM–11, Gold Coast, Australia, 14th-18th July 1997
V - 809
Microbuckling of 0° Fibers
The next step is to incorporate the action of the adjacent angled plies (by means ofinterlaminar shear stresses) on the 0° plies and derive a general microbuckling equation forthe 0° fibers. We consider general buckling for a beam on foundation. Both the fiber and thefoundation are modeled as linear elastic isotropic materials. The medium surrounding thefiber may act on it in three ways: ① through a distributed couple m, ② through a distributedaxial force p in the fiber direction, ③ through a distributed transverse force q normal to thefiber. It is assumed that the fiber has (before loading) the shape of a sine function v0(x) of
amplitude V0 and wavelength λ0. Assuming small deflections v(x), we obtain the fiber
equilibrium equation:
Ef Id4 v − v0( )
dx4 + q +dm
dx+ P
d2v
dx2 = 0 (3)
where P is the loading force, Ef the fiber stiffness and I its moment of inertia. The next step
consists in assessing the quantities m and q. Since fibers deform in the shear mode, we have:
m = −Af Gd v − v0( )
dx= −Af
Gm
1− V f
d v − v0( )dx
(4)
where Af is the fiber cross-section area and Vf the fiber volume fraction. Now interlaminar
shear stresses τzy will develop at the interface between a 0° ply and an adjacent angled-ply, in
the interlaminar matrix region of thickness 2e. They will tend to push the fiber along the ydirection. Because τzy varies with y, the half of the fibers closest to the edge will be
submitted to a distributed force different from the one experienced by the half of the fiberfurther away from the edge. The normal force q on the fiber has therefore a magnitude:
2rf τzy y =Wi
2
− τzy y =
Wi
2− 2v
≈ 2rf
dτzy
dy
Wi
2
⋅2v (5)
The microbuckling equation (3) becomes therefore:
Ef Id4 v − v0( )
dx4 − 2 2rf( ) dτzy
dy
Wi
2
v − A f
Gm
1− Vf
d2 v − v0( )dx2 +
Af
Vf
σ0°ply
d2v
dx2 = 0 (6)
As a first approximation, we may consider that the shear stress τzx has no significant effect onthe microbuckling of 0° fibers. Indeed, this stress is uniformly distributed on the fiber but inthe loading direction, so its effect cancels out globally.
The solution to the homogeneous differential equation (6) is sinusoidal. Solving for theamplitude V and taking into account the edge position of the fibers, we obtain:

Volume V: Textile Composites and Characterisation
V - 810
V ua,θk( )=V 0
1−
A f
V f
σ0° ply ua( )+ 2 2rf( )⋅dτzy ua,θk( )
dy
Wi
2
λ 0
π
2
EfIπλ0
2
+ 0.6( ) Af
Gm
1− V f
(7)
Fiber failure
Failure will occur when the tensile strain in the fiber εf reaches the fiber failure strain in
tension εtf. The maximum tensile strain in the fiber occurs at the fiber surface. The criterion
for fiber failure is:
ε f = −σ0° ply
Vf Ef
+ r f
πλ0
2
V( ) = ε tf (8)
where V is given by (7). Eqn 8 will yield a value for the critical applied displacement ua.
Dividing ua by L will then give us the failure strain εfailure.
Matrix Failure
Failure of the matrix may occur in two modes: interlaminar failure due to the interlaminarstresses, and failure within a 0° ply due to shear stresses that develop in-between 0° fibers as aresult of their in-phase buckling. For interlaminar shear failure, we choose a quadraticcriterion:
τzy
Wi
2,ua
2
+ τzx
Wi
2,ua
2
= τ f (9)
where τf is the shear failure strain of the matrix. Eqn 9 will yield a value for the critical
applied displacement ua. Dividing ua by L will then give us the failure strain εfailure. This
failure criterion is not conservative because it does not include the interlaminar normal stressσz which could play a role if the layup sequence is such that σz is positive, that is, if it tends
to peel off 0° plies from their neighboring plies. For in-ply shear failure, the acting stress isτxy, given by the relation:
max τxy = Gm ⋅ max γ xy = Gm ⋅ maxd v− v0( )
dx
(10)
The failure criterion will

Proceedings of ICCM–11, Gold Coast, Australia, 14th-18th July 1997
V - 811
Eqn 11 will yield a value for the critical applied displacement ua. Dividing ua by L will then
give us the failure strain εfailure. We are now able to investigate analytically the failure in
compression of a laminate [θ/-θ/02/θ/-θ/0]s as a function of the angle θ.
EXPERIMENTAL RESULTS
Composite plates with generic layups [θ/-θ/02/θ/-θ/0]s were compression molded at 320 °C at
0.85 MPa for 15 min from a roll of AS4 fiber/polyphenylene sulfide (PPS) prepregs.Untabbed samples (80 mm x 12.7 mm x 1.7 mm) were diamond machined from these platesfor uniaxial compression testing in a Boeing modified ASTM D695 compression fixture.Specially manufactured jigs (similar to [20]) were used to clamp the top and bottom of thespecimens to prevent crushing and brooming of the ends. Bolt torque of the compressionfixture was close to zero and maintained at a uniform level to allow accurate comparisonsbetween samples (see [28]). Strain gages were mounted on both sides of each specimen in thecentral gage region. The chosen gage length was calculated to prevent gross Euler bucklingof the specimens and allow for positioning of the strain gages. An Instron 4505 compressiontester was used to obtain load/deflection curves. Tests were performed at a loading speed of0.05 mm/min. Specimens final failure was considered to coincide with the fibersmicrobuckling failure strain. This was justified by the fact that fully straight samples failedcatastrophically.
The failure strains for all samples as a function of the angle θ are plotted in Figure 1 togetherwith a fourth degree polynomial fitting curve as shown. The coefficient of determination R2
is 0.88, thus confirming the existence of a minimum strain around θ = 20° and a maximumstrain around θ = 60°.
Angle theta
0100020003000400050006000700080009000
0 10 20 30 40 50 60 70 80 90
Fig. 1: Curve fit of experimental data

Volume V: Textile Composites and Characterisation
V - 812
ANALYSIS
Parameter values used for analysis are summarized in Table 1.
Table 1: Parameter values
Ef (GPa) Em (GPa) Gm (GPa) τf (GPa) ν12 εtf (m/m) rf (µm) e (µm) Vf
214 3.4 1.3 80 0.3 0.014 3.5 12.3 0.6
The interlaminar stresses were calculated using the symbolic software package "Maple V"(Release 3). The shear stresses τzx and τzy were maximum at the edges. Figure 2 shows the
variation of the amplitude of these stresses at the edge at the three (θ/0) interfaces. These areinterfaces (2), (3) and (5), numbered from the top surface ply downward. The numbers inparentheses on Fig. 2 refer to the interface. Eqn 7 indicates that τzy promotes the
microbuckling of all 0° fibers for all θ below 60°, while above 60° τzy hinders
microbuckling. Figure 3 superimposes theoretical predictions on the data. Predictions aremade for interface 2 in the [θ/-θ/02/θ/-θ/0]s layup, since interlaminar stresses are maximum
there. The separate curves, numbered 1 to 5, refer to the following failure mechanisms: ①In-plane kinking (Eqn. 7), ② Out-of-plane kinking with full matrix support (Eqn. 15), ③ Out-of-plane kinking with reduced matrix support (Eqn. 16), ④ Interlaminar shear (Eqn. 9), and ⑤In-ply matrix shear (Eqn. 11). Experimental results are indicated by cross-hairs. Thepredicted curve for in-plane kinking shows good agreement with experiment up to θ = 60°,while the out-of-plane kinking with reduced matrix support predicts the failure strains at θgreater than 60° (see paragraph below on out-of-plane microbuckling). The minimum strainat θ around 25° is a strong indication that shear stresses are the central mechanisms involvedin the in-plane kinking of the edge fibers below 60°. The study of the curves showing matrixfailure give some additional insight into the failure mechanisms taking place. We note thatthe curve predicting interlaminar failure is well above both the curve predicting fibermicrobuckling and the test results. This implies that the microbuckling of the 0° fiberslocated at the edge, and consequently of the other 0° fibers, precedes interlaminar failure. Werecall that interlaminar normal stresses σz were not taken into account in the failure criterion
(Eqn 9), and consequently the strain for interlaminar failure predicted by our theory would ingeneral be conservative. However the interlaminar failure strain must still be higher than themicrobuckling failure strain because curves on Fig. 3 are in agreement with experiments witha similar layup [17] which showed that microbuckling was the initial failure mode.

Proceedings of ICCM–11, Gold Coast, Australia, 14th-18th July 1997
V - 813
Angle theta
-120
-100
-80
-60
-40
-20
0
20
40
60
80
0 10 20 30 40 50 60 70 80 90
Tau zx
(2)
Tau zy
(2)
Tau zx
(3)
Tau zy
(3)
Tau zx
(5)
Tau zy
(5)
Fig. 2: Amplitude of interlaminar shear stresses at (θ/0) interfaces (2), (3) and (5)
The curve predicting shear failure of the matrix between fibers inside a 0° ply is, on thecontrary, below the curve predicting fiber microbuckling and the tests results (except possiblyabove θ = 80° for the tests). This indicates that the matrix fails in shear in between the 0°fibers before these fail in bending. This is in agreement with previous experimental resultswhich showed matrix cracking in between 0° fibers [19]. In fact, the fiber rotation that occursin the

Volume V: Textile Composites and Characterisation
V - 814
Angle theta
0
5000
1000
1500
2000
2500
3000
3500
4000
4500
5000
5500
6000
0 10 20 30 40 50 60 70 80 90
1
2
3
4
5
Fig. 3: Theoretical curves for failure strain vs. θ in [θ/-θ/02/θ/-θ/0]s

Proceedings of ICCM–11, Gold Coast, Australia, 14th-18th July 1997
V - 815
later stage of microbuckling and during kinking [7] will cause plastic yielding of the matrix.Plasticity and non-linear shear behavior were not considered in this work because the matrixwas modeled as linear elastic.
Out-of-Plane Buckling
There remains a discrepancy between the in-plane kinking prediction curves and experimentalresults at high angles, θ > 60°. While the theory predicts a failure strain that keeps onincreasing with θ, tests show a decrease in failure strain beyond θ = 60°. Study of the signof the interlaminar stress τzy [27] shows that above θ = 60° τzy and its derivative with respect
to y are negative. The stress τzy thus tends to push the fibers toward the center of the
specimen, and consequently to hinder the microbuckling of 0° fibers over the whole specimenwidth, the effect being more severe at the edges. We may therefore assume that the 0° fiberswill then buckle out-of-plane, that is through the thickness (z direction). The intuitiveargument behind this assumption is the following: the out-of-plane movement of the 0° fiberswill cause bending of the surface (θ/-θ) plies. The resistance to the movement of the 0° fiberswill thus be proportional to the bending stiffness of the surface (θ/-θ) plies. Because thebending stiffness of (θ/-θ) plies is minimum at θ=90° and increases as θ decreases to 0°, theout-of-plane buckling amplitude of a 0° fiber should decrease with θ and consequently thestrain to failure εfailure should increase as θ decreases from 90°. Physically, we will also
recall that out-of-plane kinking of 0° fibers had been observed in cross-ply composites [20],which is a clue that out-of-plane buckling could occur at angles θ close to 90°. In order togive a quantitative aspect to this analysis and prove that out-of-plane buckling is the favoredfailure mode at high angles θ, an estimation of the strain to failure due to out-of-planebuckling of the 0° fibers may be done as detailed below.
We model the surface plies (θ/-θ) as a cantilever beam of thickness (2·h), width Wi, andmoment of inertia Ib that is subjected to a distributed lateral load q'. From the geometry of the
loading and the top and bottom clamps, we consider that this beam has a length equal to g,where g is the distance between the clamps. The force q' is then [26]:
Using Eqn 6 but substituting the out-of-plane amplitudes w and w0 for v and v0, and
replacing q by q' as given by Eqn 12, we obtain the following out-of-plane microbucklingequation:
We then derive the following relation between W, ua, and θ, in the same way Eqn 7 for
V(ua,θ) had been obtained:

Volume V: Textile Composites and Characterisation
V - 816
Now the actual distributed force q' on one 0° fiber is actually less than q' given by Eqn 12.Indeed, we may expect that several and possibly all fibers along the width will buckle out-of-plane. The distributed force q' should therefore be divided by the number of rows of fibersbuckling out-of-plane. On the other hand, we have not taken into account the additionalresistance to buckling that arises from the fact that the (θ/-θ) surface plies are not isolated, butbound to the remaining plies by the matrix interlayers. This would contribute to an increasein the value of q'. We therefore introduce a correction coefficient Ccorr in the expression for
q', with 0 < Ccorr < 1. Eqn 14 becomes then:
For a correction coefficient equal to 0.25, Eqn 15 yields predictions for the buckling strainwhich are well above experimental values in the angle range θ > 60°, as shown on Fig. 3.This indicates that the matrix offers actually a less than ideal support to the buckling fibers.In any case the actual support from the matrix depends on the three dimensional stress fieldaround the fibers, which cannot reasonably be computed, as well as on possible matrixyielding and cracking. We may therefore model the reduced matrix support by introducing acoefficient of reduction Cred and modifying Eqn 15 as follows:
Choosing Cred equal to 1/3 yields results in agreement with experimental values, as shown on
Fig. 3.
CONCLUSIONS
The present work proposes a new theory for the prediction of compressive failure strains formultidirectional GFRP laminates. The theory (and its associated failure criterion) hinges onthe in-plane microbuckling of the 0° fibers, but unlike previous attempts, it incorporates theinfluence of interlaminar shear stresses upon 0° fibers microbuckling. Such a modeling
Proceedings of ICCM–11, Gold Coast, Australia, 14th-18th July 1997
V - 817
approach is physically more sound as it takes into account experimental observation of criticalmicrobuckling initiation at specimens edges. Good agreement between theoretical predictionsand experimental results is obtained at low and intermediate angles (below 60°), andconsequently it establishes the critical role played by interlaminar edge shear stresses in thefailure process of multidirectional laminates. Modification of the theory to cover out-of-planemicrobuckling of the 0° fibers reveals that out-of-plane microbuckling becomes the preferredfailure mode at high angles (above 70°). The theory also predicts correctly that kinkingoccurs before interlaminar shear failure, and that the matrix in between the 0° fibers within a0° ply would yield or crack before fiber failure in bending.
REFERENCES
[1] Soutis C., Composites Science & Technology 42, p.373 (1991)
[2] Bazhenov S., Kozey V., J. Materials Science 26 p.2677 (1991)
[3] Fleck N., Budiansky B., Proceedings of the IUTAM Symposium on InelasticDeformation of Composite Materials , p.235 (1990).
[4] Evans A., Adler W., Acta Metallurgica 26, p.725 (1978)
[5] Hahn T., Williams J., ASTM STP 893, p.115 (1986)
[6] Weaver C., Williams J., J. Materials Science 10, p.1323 (1975)
[7] Moran P., Shih C., Soc. Engineering Science 32nd Meeting, p.383 (1995)
[8] Waas A.et al., Int. J. Solids & Structures 26, n°9, p.1071 (1990)
[9] Effendi R., Barrau J., Guedra D., Composite Structures 31, n°2, p.87 (1995)
[10] Curtis P., Gates J., Molyneux C., Composites 22, n°5, p.363 (1991)
[11] Tadjbakhsh I., Wang Y., Int. J. Solids & Structures 29, n°24, p.3169 (1992)
[12] Shuart M., AIAA J. 27, n°9, p.1274 (1989)
[13] Swanson S., J. Engineering Materials & Technology 114, p.8 (1992)
[14] Shuart M., NASA Technical Memorandum 87640 (1985)
[15] Drapier S. et al., J. Composites Science & Technology 56, p.861 (1996)
[16] Sohi M., Hahn H., Williams J., ASTM STP 937, p.37 (1987)
[17] Guynn E., Bradley W., Ochoa O., J. Composite Materials 26, p.1617 (1992)
[18] Wung E., Chaterjee S., J. Composite Materials 26, n°13, p.1885 (1992)
[19] Sutcliffe M., Fleck L., Acta Metallurgica et Materialia 42, n°7, p.2219 (1994)
[20] Kominar V. et al., J. Materials Science 30, p.2620 (1995)
[21] Jones R., Mechanics of Composite Materials, p.210, Ed.Taylor & Francis (1975)
[22] Gu Q., Reddy J., Int. J. Non-linear Mechanics 27, n°1, p.27 (1992)
[23] Schellekens J., De Borst R., Composite Structures 28, p.357 (1994)
[24] Lessard L. et al, Int. J. Solids & Structures 33, n°15, p.2243 (1996)
[25] Puppo A., Evensen H., J. Composite Materials 4, p.204 (1970)
[26] Timoshenko S., Gere J., Theory of Elastic Stability, p.9-16, Ed. McGraw-Hill (1961)
[27] Berbinau P.J., Wolff E.G., submitted to J. Composite Materials (1997)
[28] Welsh J., Adams O., SAMPE J. 33, n°1, p.35 (1997)
Volume V: Textile Composites and Characterisation
V - 818
FINITE ELEMENT MODELING OF THE HIGHSTRAIN RATE BEHAVIOR OF S-2 GLASS/VINYL
ESTER COMPOSITES UNDER COMPRESSIVELOADING
Hassan Mahfuz, Bazle A. Gama, Roshan P. Raines and Shaik Jeelani
Tuskegee University’s Center for Advanced Materials (T-CAM), Tuskegee University,Tuskegee, Alabama 36088, USA
SUMMARY: Transient dynamic Finite Element Analysis (FEA) of the high strain ratebehavior of S-2 Glass/Vinyl Ester composites under compressive loading is performed at amaximum strain rate of 1700 s-1. The stress propagation and distribution through thespecimen with respect to time are presented. The stress contours show the distribution ofstress through the specimen and also identify the location of maximum stresses. In the initialstage of loading, in the thickness direction, the FEA prediction of the stress-strain behaviorcorrelates well with the experiment. However, for the fill direction loading the correlation isnot as good. For both cases, the normal stresses in the thickness direction are found to bealternately compressive and tensile with respect to time. The interlaminer shear stresses alsochange their sign with time. This alternating nature of stresses with respect to time occursmuch earlier in the case of fill direction loading. Experimental observation and FEA in thecase of thickness direction loading show that compressive failure initiates at the transmissionface of the specimen in the initial stage, which is followed by delamination in the later stage.During fill direction loading, however, fiber buckling, edge cracks and disintegration of thespecimen have been observed to be the dominant failure modes.
KEYWORDS: finite element, high strain rate, S-2 glass, vinyl ester, compressive loading
INTRODUCTION
In recent years, composite structures subjected to high strain rate dynamic loading havebecome a subject of great interest to various defense and commercial industries. High strainloading may arise in different ways. High speed automotive crash, a flying bird’s impact toan airplane wing, ballistic penetration and explosive shock impact to static and movingstructures are a few examples. Due to the higher strength to weight ratio over metals,composite materials are being used more as structural materials, both in aerospace anddefense industries. One such application is the Composite Armored Vehicle (CAV), which isbeing developed by the U.S. Army. The main load bearing component of the upper hull is thethick section S-2 Glass/Vinyl Ester which experiences shock loading in the event of a ballisticimpact at the external ceramic layers. It is imperative that the procedures to test thesematerials at high strain rate be fully developed and their response be completely understoodthrough analytical and experimental approaches.

Proceedings of ICCM–11, Gold Coast, Australia, 14th-18th July 1997
V - 819
Sufficient work has been done on high strain rate testing of metals [1, 2 and 3]; however, alimited amount of work has been done on high strain rate testing of composite materials [4, 5,6, 7 and 8]. One of the pioneers of this field, Nemat-Nasser [9, 10 and 11], has developedseveral Hopkinson bar experimental techniques. The stress-reversal momentum trap versionof the compression split Hopkinson bar allows dynamic recovery experiments. Thedevelopment of the tension split Hopkinson bar, copper pulse shaping, and several gas gunsystems for plate impact and penetration experiments are some of the achievements, alongwith analytical and numerical modeling. Staab and Gilat [6] have used a tensile version of theHopkinson bar to measure the rate dependent response of angle ply S-2 Glass composites.Dandekar, Green and Beaulieu [8] studied the effect of S-2 Glass/Polyester compositesspecimen geometry in quasi-static and medium strain rates. They found failure strains of S-2Glass reinforced plastics to be much higher in the thickness direction than in the fill direction.Leber and Lifshitz [12] designed a new type of specimen for the static and high strain rateinterlaminer shear behavior of plain-weave fiber reinforced laminates. They used the torsionsplit Hopkinson bar for experiment and modeled the experiment with Finite ElementMethods. They found that the E-Glass/Epoxy material exhibits high sensitivity to the loadingrate in respect to shear modulus, fracture strength and strain. Other researchers [13 and 14]used DYNA3D to model the composite material subjected to impact and/or high strain rateloading and used their material model to analyze the failure.
HOPKINSON BAR EXPERIMENTS
The FEA is based on Hopkinson bar experiments performed at Tuskegee University’s Centerfor Advanced Materials (T-CAM). The material used for the experiments is plain weave S-2Glass/Vinyl Ester composite, fabricated using the SCRIMP process. Test specimens are 8.89mm (0.35 inch) square in cross-section, 8.23 mm (0.324 inch) in thickness and have 12 layersalong the thickness. The test apparatus is a compression split Hopkinson bar with amomentum trap. Its incident and transmitter bars are each 1.524 meters (5 feet) long, with adiameter of 19.05 mm (0.75 inch), used in conjunction with a 228.6 mm (9 inch) striker bar.
Two different loading conditions are used, one in the thickness direction and the other in thefill direction of the composite specimens. The average strain rate in the thickness directionwas 850 s-1, and that in the fill direction was 1280 s-1. Figure 1 shows examples ofexperimental stress vs. strain curves for both loading conditions (two specimens for eachcondition). The initial moduli of elasticity shown in the figure are the average values from thetwo test specimens for the corresponding loading condition. For the fill direction loadingthese values are much higher than the through thickness loading. This can be attributed to thefact that the material response is matrix dominated through the thickness and fiber dominatedin the fill direction. The through thickness direction loaded specimens sustained higherstresses (as much as 640 MPa) and failure strains (approximately 10%) compared tospecimens loaded in the fill direction, with maximum stresses of approximately 345 MPa andfailure strains of about 1%. Figure 2 shows corresponding stress vs. time curves for the samespecimens. Here, the time span from initial loading to failure is much greater through thethickness than in the fill direction. Both figures show that the responses for the two loadingconditions are distinctively different from each other, and specimens loaded under the sameconditions follow the same basic pattern, showing good repeatability.

Volume V: Textile Composites and Characterisation
V - 820
0
0.2x10⁵
0.4x10⁵
0.6x10⁵
0.8x10⁵
1.0x10⁵
0 0.05 0.10 0.15 0.200
100
200
300
400
500
600
Fill DirectionE = 67.49 GPa.
Thickness DirectionE = 11.24 GPa.
Strain, mm/mm.
Str
ess,
psi
.
Str
ess,
MP
a.
Fig. 1: Stress-Strain behavior of S-2 Glass/Vinyl Ester Composites
0
0.2x10⁵
0.4x10⁵
0.6x10⁵
0.8x10⁵
1.0x10⁵
0.0002 0.0003 0.0004 0.00050
100
200
300
400
500
600Thickness Direction
Fill Direction
Time, Sec.
Stress,psi.
Stress,MPa.
Fig. 2: Stress-Time curves for S-2 Glass/VinylEster Composite
Several specimens were tested to establish the baseline data for FEA. Figures 3 and 4 are theScanning Electron Microscopy (SEM) micrographs for specimens loaded through thethickness and in the fill direction, respectively. These figures show that delamination due tointerlaminar tension, and matrix cracks are the dominating failure modes in the throughthickness loading. However, failure in the form of fiber buckling, edge cracks, matrix cracksand fiber breakage are dominant modes in the fill direction loading.
Fig. 3: SEM Micrographs for Loading in the Thickness Direction a) Matrix Crack b) & c)Delamination due to Interlaminaer Tension d) Matrix Crack

Proceedings of ICCM–11, Gold Coast, Australia, 14th-18th July 1997
V - 821
FINITE ELEMENT MODELING
In the current investigation, transient dynamic FEA is performed to model the high strain ratebehavior of S-2 Glass/Vinyl Ester composites under compressive loading. Layered 3D solidelements (SOLID46) have been used to model the composite specimens. The elementSOLID46 is based on the lamination theory, which considers the strain distribution in thethickness direction to be constant. Several elements through the thickness direction areemployed in the FEA model to compensate for the non-linearity of strain along the thickness.Quasi-static properties of the laminate are used in the finite element program. The propertiesof the specimens, geometry, and FEA model are presented in Figure 5.
Fig. 4: SEM Micrographs for Loading in the Fill Direction a) Edge Crack b) & c) MatrixCrack d) Fiber Breakage
SpecimenDimensionsL = 8.23 mm.W1 = 8.89 mm.W2 = 8.89 mm.
L
W1W2/2
Half SymmetricFEA Modeland Elements10 x 5 x 3 = 150Elements
W 1 W 2
L
X
Y
Z Quasi-Static Propertiesof S-2 Glass/Vinyl EsterEx = 20.2 GPa.Ey = 20.2 GPa.Ez = 8.62 GPa.νxy = 0.273νyz = 0.273νxz = 0.273Gxy = 7.93 GPa.ρ = 1.75 gm/cc.
Fig. 5: Specimen Geometry, FEA model and Properties.
Time dependent loading similar to experiments is applied on the model as a distributed forceon the loading surfaces. To simulate the experiment, the nodes on the surface of loading arecoupled together to enforce equal displacement of all nodes on that surface. The displacementof the nodes opposite to the surface of loading is constrained in the direction of loading

Volume V: Textile Composites and Characterisation
V - 822
RESULTS AND DISCUSSIONS
Loading in the Thickness Direction
Figure 6 shows the loading in the thickness direction. The comparison of the stress-strainresponse between experiment and FEA is presented in Figure 7. The FEA prediction of initialmodulus is about 17% less than the experimental modulus. The correlation betweenexperiment and FEA is good in the initial stage of loading. The FEA is unable to predict thepost-yielding behavior of the material, because the stress calculation is based on linearelasticity.
0
0.2x10⁵
0.4x10⁵
0.6x10⁵
0.8x10⁵
1.0x10⁵
0 0.00005 0.00010 0.00015 0.00020 0.000250
200
400
600
Load from ExperimentApplied Load
Time, Sec.
Loa
d, p
si.
Loa
d, M
Pa
Fig. 6: Loading and Boundary Conditions, Thickness Direction.
0
0.2x10⁵
0.4x10⁵
0.6x10⁵
0.8x10⁵
1.0x10⁵
0 0.05 0.10 0.15 0.200
200
400
600
FEM BOTTOM FACE, E = 8.34 GPa.FEM TOP FACE, E = 8.62 GPaEXPERIMENT, E = 10.2 GPa
Strain, ε z , mm/mm.
Str
ess
, σ Z
, p
si.
Str
ess
, σ Z
, M
Pa
.
Fig. 7: Comparison of Stress-Strain Behavior between Experiment and FEA
The stress contours of the FEA model with respect to time have been analyzed to determinethe location of maximum stresses. Contour plots of σ
z and τ xz are presented in Figure 8,
which show that the maximum σz occurs at X/W1 = 0.5 and the maximum τ xz occurs at
X/W1 = 0.3 and at 0.7 along the thickness. These locations are used to see the variation ofdifferent stresses with respect to time. The variation of σ
z (interlaminar normal stress) and
τ xz (interlaminar shear stress) with time are shown in figures 9 and 10 (at X/W1 = 0.5). Thevariation of σ
z is fluctuating in nature and becomes tensile at times 175.0x10⁻⁶ second and
230.0x10⁻⁶ second. Though the applied load was compressive, these interlaminar tensilestresses are tensile and may cause delamination in the specimen. Also, τ xz changes its signwith time and becomes considerably high at times 175.0x10⁻⁶, 205.0x10⁻⁶ and 230.0x10⁻⁶

Proceedings of ICCM–11, Gold Coast, Australia, 14th-18th July 1997
V - 823
second. The interlaminar shear strength obtained through short beam shear test (ASTM D:2344-84 (89)) is 27.66 MPa (4012 psi), which is more than twice the maximum τ xz of 12.4MPa. However, together with the interlaminar tensile stress, interlaminar shear stress cancause delamination and matrix crack opening.
The through thickness distributions of σz and τ xz are plotted in Figures 11 and 12 at
different time steps in the location of maximum interlaminar shear. In the initial stage ofloading (at time 50.0x10⁻⁶ second), σ
z is compressive in nature, and the value is about 640
MPa at the bottom face of the specimen. From the experimental stress-time curve (Fig. 2), wecan see that the failure stress is about 640 MPa at time 130.0x10⁻⁶ second. It is evident thatthe failure at the transmission (bottom) face initiates at 50.0x10⁻⁶ second and continues till130.0x10-6 second. At time 175.0x10⁻⁶ second σ
z is tensile and is minimum (11.7 MPa) on
the loading face and maximum (317 MPa) on the opposite face of the specimen. The tensilestrength of the Vinyl Ester matrix is 69-82 MPa (10000-12000 psi). Therefore, matrix cracksand delamination will occur in the range of 0 < Z/L < 0.68 along the thickness.
The τ xz distribution shows two different peak locations, at Z/L = 0.33 and 0.67, which
suggests that delamination is likely to occur at these locations. The maximum value of τ xz
(15.85 MPa) is much less than the interlaminar shear strength (27.66 MPa) of the specimen.However, τ xz alone can not cause delamination. From this observation we conclude thatcompressive failure initiates at the bottom face of the specimen in the initial stage, followedby delamination in the later stages of loading
(a) (b)
Fig. 8: Contours of (a) Normal Stress ( )σz , (b) Interlaminar Shear Stress ( )τxz

Volume V: Textile Composites and Characterisation
V - 824
-1.5x10⁵
-1.0x10⁵
-0.5x10⁵
0
0.5x10⁵
1.0x10⁵
0 0.00005 0.00010 0.00015 0.00020 0.00025
-1000
-500
0
500
FEM LOAD ON TOP FACETOP FACEBOTTOM FACE
Time, Sec.
No
rma
l Str
ess
(σ
z), A
pp
plie
d L
oad
, p
si.
No
rma
l Str
ess
(σ z),
Ap
pp
lied
Lo
ad
, M
Pa
.
Fig. 9: Variation of Normal Stress ( )σ z with Time
-2000
-1000
0
1000
2000
0 0.00005 0.00010 0.00015 0.00020 0.00025
-10
-5
0
5
10
TOP FACEBOTTOM FACE
Time, Sec.
She
ar S
tre
ss (
τ xz),
psi
.
Sh
ear
Str
ess
( τxz
), M
Pa.
Fig. 10: Variation of Shear Stress ( )τ xz with Time
-1.0x10⁵
-0.5x10⁵
0
0.5x10⁵
12000
0 0.1 0.2 0.30.22
0 1 2 3 4 5 6 7 8
-500
-300
-100
100
300
t = 22.0x10-05
Sec.t = 21.0x10
-05 Sec.
t = 20.5x10-05
Sec.t = 17.5x10
-05 Sec.
t = 9.0x10-05
Sec.t = 5.0x10
-05 Sec.
Along Thickness, inch.
Str
ess
( σz),
psi
.
Str
ess
( σz),
MP
a.
Along Thickness, mm.
Fig. 11: Normal Stress ( )σ z Distribution Along Thickness in Different Time Step

Proceedings of ICCM–11, Gold Coast, Australia, 14th-18th July 1997
V - 825
-3000
-1500
0
1500
3000
0 0.1 0.2 0.3
0 1 2 3 4 5 6 7 8
-20
-15
-10
-5
0
5
10
15
20
t = 22.0x10-05
Sec.t = 21.0x10
-05 Sec.
t = 20.5x10-05
Sec.t = 17.5x10
-05 Sec.
t = 9.0x10-05
Sec.t = 5.0x10
-05 Sec.
Along Thickness, inch.
She
ar
Str
ess
(τ xz
), p
si.
She
ar
Str
ess
(τ xz
), M
Pa.
Along Thickness, mm.
Fig. 12: Shear Stress ( )τxz Distribution Along Thickness in Different Time Step
Loading in the Fill Direction
Figure 13 shows the loading in the fill direction. The comparison of the stress-strain responsebetween experiment and FEA is presented in Figure 14. The FEA prediction of initialmodulus is about 64% less than the experimental modulus. The correlation betweenexperiment and FEA is not as good as in the case of the thickness direction loading. Thereason for such discrepancy can be attributed to the fact that the constitutive equations used inthe present investigation was limited to linear elasticity. During the pressure pulse loadingone has to consider the separation of the thermodynamic response from the ability of thematerials to convey shear loads. This calls for the modification of the constitutive equationand the equation of state. These modifications will be incorporated in future work.
0
10000
20000
30000
40000
50000
0 0.00005 0.00010 0.00015 0.00020 0.000250
100
200
300
Load from ExperimentApplied Load
Time, Sec.
Loa
d, p
si.
Loa
d, M
Pa
.
Fig. 13: Loading and Boundary Conditions, Fill Direction
0
20000
40000
60000
0 0.02 0.04 0.06 0.080
100
200
300
400
EXPERIMENT, E = 75.83 GPa.FEM, E = 27.57 GPa.
Strain (εx), mm/mm.
Str
ess
(σ x),
psi
.
Str
ess
( σx),
MP
a.
Fig. 14: Comparison of Stress-Strain Behavior between Experiment and FEA
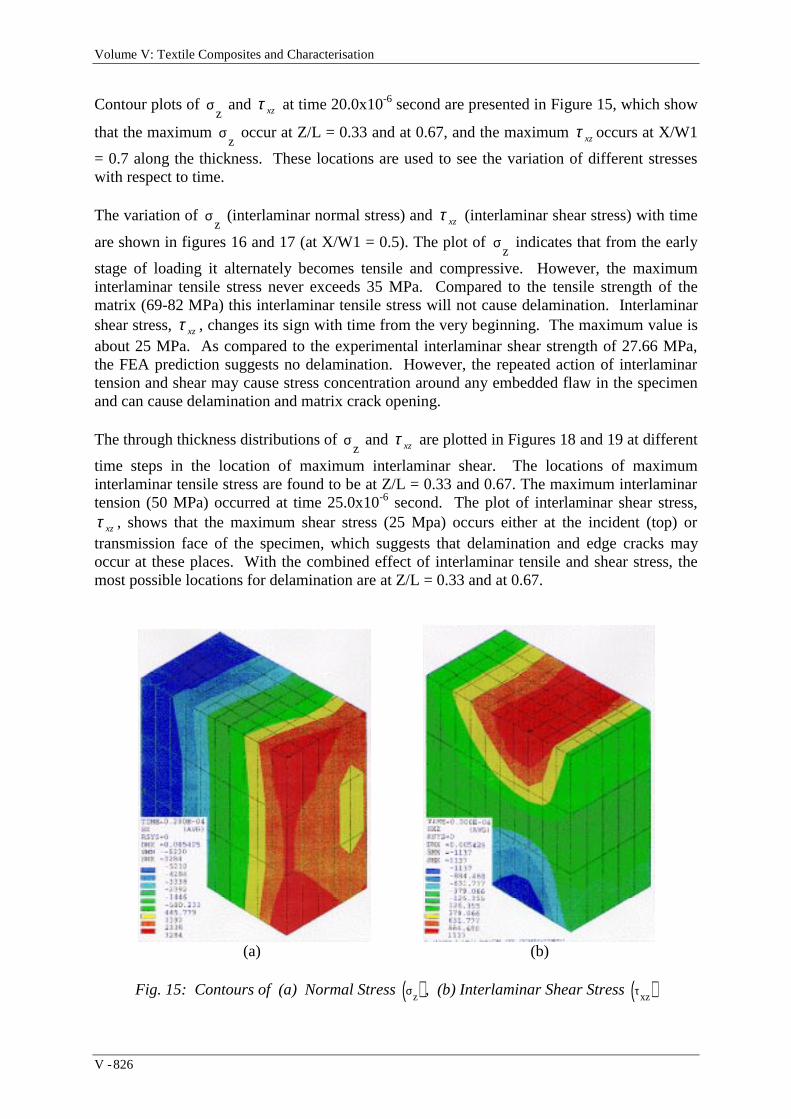
Volume V: Textile Composites and Characterisation
V - 826
Contour plots of σz and τ xz at time 20.0x10⁻⁶ second are presented in Figure 15, which show
that the maximum σz occur at Z/L = 0.33 and at 0.67, and the maximum τ xz occurs at X/W1
= 0.7 along the thickness. These locations are used to see the variation of different stresseswith respect to time.
The variation of σz (interlaminar normal stress) and τ xz (interlaminar shear stress) with time
are shown in figures 16 and 17 (at X/W1 = 0.5). The plot of σz indicates that from the early
stage of loading it alternately becomes tensile and compressive. However, the maximuminterlaminar tensile stress never exceeds 35 MPa. Compared to the tensile strength of thematrix (69-82 MPa) this interlaminar tensile stress will not cause delamination. Interlaminarshear stress, τ xz , changes its sign with time from the very beginning. The maximum value isabout 25 MPa. As compared to the experimental interlaminar shear strength of 27.66 MPa,the FEA prediction suggests no delamination. However, the repeated action of interlaminartension and shear may cause stress concentration around any embedded flaw in the specimenand can cause delamination and matrix crack opening.
The through thickness distributions of σz and τ xz are plotted in Figures 18 and 19 at different
time steps in the location of maximum interlaminar shear. The locations of maximuminterlaminar tensile stress are found to be at Z/L = 0.33 and 0.67. The maximum interlaminartension (50 MPa) occurred at time 25.0x10⁻⁶ second. The plot of interlaminar shear stress,τ xz , shows that the maximum shear stress (25 Mpa) occurs either at the incident (top) ortransmission face of the specimen, which suggests that delamination and edge cracks mayoccur at these places. With the combined effect of interlaminar tensile and shear stress, themost possible locations for delamination are at Z/L = 0.33 and at 0.67.
(a) (b)
Fig. 15: Contours of (a) Normal Stress ( )σz , (b) Interlaminar Shear Stress ( )τxz

Proceedings of ICCM–11, Gold Coast, Australia, 14th-18th July 1997
V - 827
-7500
-5000
-2500
0
2500
5000
0 0.00005 0.00010 0.00015 0.00020 0.00025
-50
-40
-30
-20
-10
0
10
20
30
TOP FACEBOTTOM FACE
Time, Sec.
No
rma
l Str
ess
( σz),
psi
.
Nor
mal
Str
ess
(σ z),
MP
a.
Fig. 16: Variation of Normal Stress ( )σ z with Time
-4000
-2000
0
2000
4000
0 0.00005 0.00010 0.00015 0.00020 0.00025
-20
-10
0
10
20
TOP FACEBOTTOM FACE
Time, Sec.
Sh
ear
Str
ess
(τ xz
), p
si.
She
ar S
tres
s ( τ
xz),
MP
a.Fig. 17: Variation of Shear Stress ( )τ xz with Time
-10000
-5000
0
5000
10000
0 0.1 0.2 0.3
0 2 4 6 8
-60
-40
-20
0
20
40
60
t = 22.0x10-05 Sec.t = 15.0x10-05 Sec.t = 12.0x10-05 Sec.t = 2.5x10-05 Sec.t = 0.5x10-05 Sec.
Along Thickness, inch.
Str
ess
(σ z),
psi
.
Str
ess
(σ z),
MP
a.
Along Thickness, mm.
Fig. 18: Normal Stress ( )σ z Distribution Along Thickness in Different Time Step

Volume V: Textile Composites and Characterisation
V - 828
-4000
-2000
0
2000
4000
0 0.1 0.2 0.3
0 2 4 6 8
-20
-10
0
10
20
t = 15.0x10-05 Sec.t = 10.0x10-05 Sec.t = 7.0x10-05 Sec.t = 3.5x10-05 Sec.t = 2.5x10-05 Sec.t = 0.5x10-05 Sec.
Along Thickness, inch.
Str
ess
( τxz
), p
si.
Str
ess
(τ xz
), M
Pa
.
Along Thickness, mm.
Fig. 19: Shear Stress ( )τ xz Distribution Along Thickness in Different Time Step
CONCLUSIONS
The following conclusions are made from the high strain rate experiment and modeling of S-2Glass/Vinyl Ester composites.
• FEA can only predict the initial stage of high strain rate deformation of composites.
• The FEA stress-strain behavior correlates well with experiment in the case of thicknessdirection loading.
• Compressive failure initiates at the transmission face of the specimen in the initial stage,followed by delamination in the later stage of loading in the thickness direction.
• Delamination occurs due to interlaminar tension and repeated interlaminar shear in theinitial stage of loading in the fill direction.
• Fiber buckling, edge cracks and disintegration of the specimen along the thickness areobserved in the case of fill direction loading.
ACKNOWLEDGMENT
The financial support for this work provided by the Army Research Office (ARO), USA, isgratefully acknowledged
REFERENCES
1. Lankford, J., Conque, A., Bose, A. and Anderson, C.E., “Microstructure Dependence ofHigh-Strain-Rate Deformation and Damage Development in Tungsten Heavy Alloys”,Shock-Wave and High-Strain-Rate Phenomena in Materials, edited by M. Meyers, L.Murr, K. Staudhammer, Marcel Dekker, Inc., New York, 1992, pp. 137-145.
2. Gabelotaud, S., Nguy, C., Bensussan, P., Berveiller, M., and Lipinski P., “High-Strain-Rate Titanium Compression Experimental Results and Modelization”, Shock-Wave and

Proceedings of ICCM–11, Gold Coast, Australia, 14th-18th July 1997
V - 829
High-Strain-Rate Phenomena in Materials, edited by M. Meyers, L. Murr, K.Staudhammer, , Marcel Dekker, Inc., New York, 1992, pp. 161-170.
3. Coates, R., Ramesh, K., “The Deformation of Tungsten Alloys at High Strain Rates”,Shock-Wave and High-Strain-Rate Phenomena in Materials, edited by M. Meyers, L.Murr, K. Staudhammer, Marcel Dekker, Inc., New York, 1992, pp. 203-212.
4. Harding, J., “Mechanical Behavior of Composite Materials Under Impact Loading”,Shock-Wave and High-Strain-Rate Phenomena in Materials, edited by M. Meyers, L.Murr, K. Staudhammer, Marcel Dekker, Inc., New York, 1992, pp. 21-34.
5. Newill, J. F. and Vinson, J. R., “Some High Strain Rate Effects on Composite Materials”,Proceedings of the Ninth International Conference on Composite Materials (ICCM9),Madrid, 12-16 July, 1993, pp. 269-277.
6. Staab, H. G. and Gilat, A., “High Strain Rate Characterization of Angle-Ply Glass/EpoxyLaminates”, Proceedings of the Ninth International Conference on Composite Materials(ICCM9), Volume V, 1993, pp. 278-285.
7. Harding, J. and Li, Y. L., “Determination of Interlaminar Shear Strength for Glass/Epoxyand Carbon/Epoxy at Impact Rates of Strain”, Composites Science and Technology, 45,1992, pp. 161-171.
8. Dandekar, D. P., Green, J. L. And Beaulieu, P., “Dynamic Characterization”, in DynamicResponse of S-2 Glass Reinforced Plastic Structural Armor, A Progress Report, ARL-SR-5, Army Research Laboratory, December 1993, pp. 39-62.
9. Nemat-Nasser, S., Isaacs, J. B. And Starrett, J. E., “Hopkinson Techniques for DynamicRecovery Experiments”, Proc. R. Soc. Lond., A, 1991, 435, pp. 371-391.
10. Nemat-Nasser, S., “New Frontiers in Dynamic Recovery Testing of AdvancedComposites: Tailoring Microstructure for Optimal Performance”, JSME InternationalJournal, Series I, Vol. 34, No. 2, 1991, pp. 111-122.
11. Nemat-Nasser, S., “ Dynamic Deformation and Failure”, High Strain Rate Effects onPolymer, Metals and Ceramic Matrix Composites and Other Advanced Materials, Editedby Y. Rajapakse, J. Vinson, ASME, U.S.A, 1995, pp. 371-391.
12. Leber, H. and Lifshitz, J. M., “Interlaminar Shear Behavior of Plain-Weave GRP at Staticand High Rates of Strain”, Composites Science and Technology, 56, 1996, pp. 391-405.
13. Kerth, S. and Maier., “Numerical Simulation of the Crashing of Composite Tubes”,Computer Aided Design in Composite Material Technology IV, Editors: Blain, W. R. andDeWilde, W. P., 1994, pp. 141-148.
14. Vinckier, D. and Thoma K., “Numerical Simulations High Velocity Impact Phenomenain Composite Structures”, Computer Aided Design in Composite Material Technology IV,Editors: Blain, W. R. and DeWilde, W. P., 1994, pp. 183-190

Volume V: Textile Composites and Characterisation
V - 830
DAMAGE DEVELOPMENT IN FILLEDVISCOELASTIC MATRIX COMPOSITES
A. Meddad and B. Fisa
École Polytechnique de Montréal, Center for Applied Research on Polymers (CRASP)Department of Mechanical Engineering, C.P. 6079, Montreal, Quebec, Canada, H3C 3A7
SUMMARY: This paper deals with the stress-strain behavior of two viscoelastic polymers,polypropylene and polyamide 6, filled with rigid particles in the range of axial strain of 0 to8%. These materials, when subjected to a constant strain rate test lose stiffness via twomechanisms: filler-matrix debonding and the viscoelastic softening of the matrix. A modelwhich combines the concepts of damage mechanics and the time dependence of the interfacialstrength is described and compared to the experimental results of polypropylene andpolyamide 6 filled with up to 50 vol.% of untreated and silane treated glass beads. The matrixbehavior is described in terms of an empirical equation selected to fit the stress-strainbehavior of neat polymers in the range of strain rates between 0.12 and 0.5% s-1 and strainsbetween 0 and 8%. The stiffness of the damaged, partially debonded composite is calculatedusing the Kerner-Lewis equation assuming that debonded particles do not bear any load. Themodel is able to generate stress-strain curves which are in good agreement with theexperimental data. The void volume attributable to debonding calculated using the model ismuch smaller than the experimental total determined void volume (which is a sum of severaldeformation mechanisms).
KEYWORDS: damage, interface, debonding, viscoelastic matrix
INTRODUCTION
When a second, rigid phase is dispersed in a polymer the most obvious effect is thesubstantial increase of the elastic (short term, small strain) stiffness. The effect on otherproperties is more complex to analyze. This is because, as a result of straining, the materialproperties change because of damage related to factors such as filler/matrix debonding butalso due to the viscoelastic nature of the matrix. A number of attempts to model thedebonding resulting from the tensile loading have been published (1). However, since onlythe rigid phase (the filler) is excluded from the load bearing as the debonding progresses, thematerial loses its stiffness not only from the reduction of the effective section but also from areduction of the effective filler concentration in the remaining material [2,3].
This paper presents the model that can be used to calculate the stress-strain behavior of filledpolymers, and to evaluate the debonding during the straining. The predicted results arecompared to stress strain behavior of filled polypropylene and polyamide 6.

Proceedings of ICCM–11, Gold Coast, Australia, 14th-18th July 1997
V - 831
EXPERIMENTAL RESULTS
The materials investigated are polypropylene (PP) and polyamide 6 (PA6) filled with rigidparticles (glass beads-GB, talc and calcium carbonate (CaCO3). All the experimental detailsconcerning the used, sample preparation and mechanical testing can be found in the previouspaper [3].
Stress Versus Axial Strain Curves
Figure 1 shows the stress-strain curves of polypropylene and polypropylene filled with glassbeads, talc and CaCO3. In Table 1, the average values of several properties determined fromthe σ vs ε curves are listed: the initial modulus, E0; the stress σ0 and strain ε0 at which thestress strain curve deviates from linearity; the stress and the strain at yield, (σy and εy).
The principal points of the experimental results are:
• All materials exhibit an elastic zone; the initial modulus Eo increases with the filleraddition but is independent of the surface treatment for glass beads.
• The yield stress σy decreases with the filler addition: σ vs ε curves of all compositesexcept those containing talc fall below that of neat PP well before yield.
• Both the stress and the strain at which the material ceases to be elastic (σ0 and ε0) decreasewith filler addition. The values of σo and of εo are higher with treated beads.
• The platy irregular shape of talc particles leads to a definite reinforcing effect in PP, asevidenced by the high initial modulus and yield stress.
• Although the transition between the linear (elastic) stage and the constant stress plateaustarts at a higher strain with treated beads the yield stress is independent of the surfacetreatment.
• The composite with talc (20 vol.%) broke at a relatively low axial strain of about 5%.
Filled polyamide 6 also has a linear zone at small strains and the initial modulus is unaffectedby the surface treatment. Besides these similarities, there are significant differences betweenfilled polypropylene and polyamide 6 filled with untreated beads, on the one hand, andpolyamide 6 filled with treated beads (Fig. 2 and Table 1). With untreated beads, the curvesfall below that of neat polyamide 6 but at higher strains than in filled polypropylene. Thedeparture from linearity in untreated glass-polyamide 6 composites follows a similar patternas in filled polypropylene i.e., the strain ε0 decreases with increasing glass concentration.However, the stress σ0 increases slowly with filler content. With treated glass, the strain ε0
appears to be independent of the filler content. In fact, it is very close to the ε0 value of theneat polyamide 6. The stress σ0 increases substantially with the treated glass content. Thestress-strain curves of polyamide 6 composites containing treated beads remain above the neatpolyamide 6 curve.

Volume V: Textile Composites and Characterisation
V - 832
Table 1:Summary of tensile properties of filled polypropylene GB: glass beads (T: treatedbeads)
Polymer-filler-vol.% E0 (GPa) ε0 (%) σ0 (MPa) εy (%) σy
(MPa)
PP 1.57 0.75 11.9 7 32
PP-GB-20 2.4 0.30 7.3 4 22
PP-GB-20T 2.4 0.37 9.0 4 22
PP-Talc-20 4.96 0.24 11.9 2.4 30.7
PP-CaCO3-20 3.1 0.20 6.2 2.9 22.7
PA6 0.92 0.73 6.8 2.7 18
PA6-GB-25 1.9 0.40 7.3 2.3 21
PA6-GB-25T 1.9 0.71 13.6 1.20 18
Fig. 1: Stress σ vs axial strain ε curves of PP filled with 20 vol.% of: silane treated glassbeads(1-T), untreated glass(NT), talc and CaCO3. . PP:unfilled polypropylene.

Proceedings of ICCM–11, Gold Coast, Australia, 14th-18th July 1997
V - 833
Fig. 2: PA6 filled with 25 vol.% glass beads. Stress σ and volume strain ζ vs axial strainε(%). T- treated beads, dotted lines indicate dilational behavior( i.e. calculated using the
initial Poisson ratio).
Tensile dilatometry
Figure 3 shows the volume strain versus axial strain (ζ vs ε) curves of polypropylenecontaining 0 and 20 vol.% of glass beads , talc and CaCO3 respectively. The neat ζ vs εpolypropylene curve starts to deviate from linearity at about the same strain as the tensilestress-axial strain curve. The curves of filled polypropylene exhibit two linear parts, the firstone being determined by the initial Poisson ratio, ν0c. Beyond the first stage the increasingvolume is an indication of the onset of debonding. As shown by curve 2 The talc fillerbehaves differently: the perpendicular to stress oriented platelets in the sample core start todebond at very low strain. The volume strain vs axial strain curves of neat and filledpolyamide 6 (φ = 0.25) are shown in Figure 2. The behavior of neat polyamide 6 is similar tothat of polypropylene. At small strains, the ζ vs ε curves of polyamide 6, filled with treated oruntreated glass coincide up to ε 1.5% (for φ = 0.25). The curves then diverge, the volumeof untreated glass composite increases at a much higher rate than that of treated glass. Itindicates that the fully debonded state is not reached treated beads.
Fig. 3 Volume strain ζ vs axial strain ε of PP filled with 20 vol.% of : 1- glass beads, 2- talcand 3- CaCO3. T: treated glass beads, dotted lines indicate dilational behavior
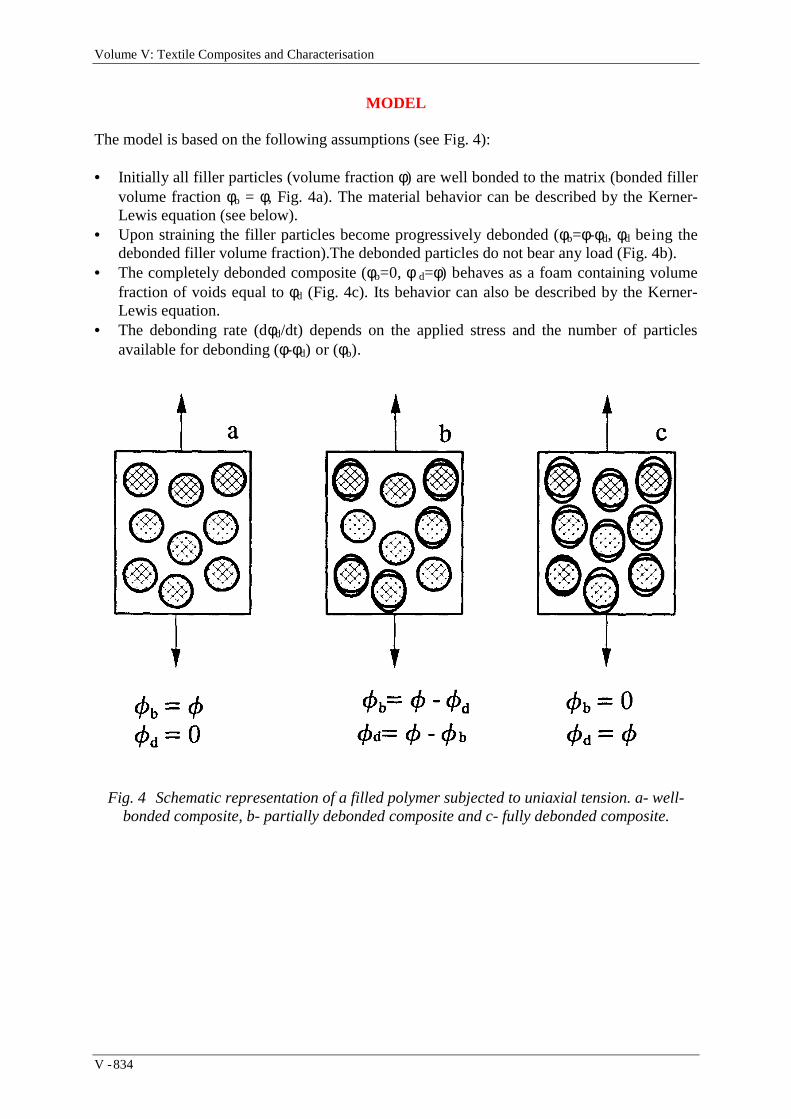
Volume V: Textile Composites and Characterisation
V - 834
MODEL
The model is based on the following assumptions (see Fig. 4):
• Initially all filler particles (volume fraction φ) are well bonded to the matrix (bonded fillervolume fraction φb = φ, Fig. 4a). The material behavior can be described by the Kerner-Lewis equation (see below).
• Upon straining the filler particles become progressively debonded (φb=φ-φd, φd being thedebonded filler volume fraction).The debonded particles do not bear any load (Fig. 4b).
• The completely debonded composite (φb=0, φ d=φ) behaves as a foam containing volumefraction of voids equal to φd (Fig. 4c). Its behavior can also be described by the Kerner-Lewis equation.
• The debonding rate (dφd/dt) depends on the applied stress and the number of particlesavailable for debonding (φ-φd) or (φb).
Fig. 4 Schematic representation of a filled polymer subjected to uniaxial tension. a- well-bonded composite, b- partially debonded composite and c- fully debonded composite.

Proceedings of ICCM–11, Gold Coast, Australia, 14th-18th July 1997
V - 835

Volume V: Textile Composites and Characterisation
V - 836

Proceedings of ICCM–11, Gold Coast, Australia, 14th-18th July 1997
V - 837
RESULTS AND DISCUSSION
Having examined a number of more complex models for matrix behavior [4], we have finallyadapted the following relation for the inelastic strain rate:
n0m
= a (b ) +c +d = - E
exp
ε σ σ εσ
with optimized constants a, b, c, d and E0m.
The debonding process modeled with the help of equations 1, 2 and 6 using the materialsconstants of neat and filled polypropylene (Table 2) and several arbitrarily selected values ofK and B leads to stress strain curves shown in Fig. 5. Two extreme cases are considered:
Table 2: Parameters used to calculate the initialcomposite modulus E0c from equation 3. GB: glass beads.
Parameters PP/GB PP/Talc PP/CaCO3 PA6/GB
E0m (GPa) 1.62 1.71 1.71 0.88
A1 1.68 5.62 2.60 1.90
B1 0.85 1.48 1.21 1.03
ψ 0.60 0.33 0.58 1.04
Fig. 5: Stress-strain curves calculated using equations 4.9 and 4.14 (see text): m: matrix, b:fully bonded composite, d: fully debonded composite. Curves 1 to 5 were calculatedusing following values of constants K and B, 1: K=3.04 10-2 MPa-1 s-1, B= 0, 2: K=
2.03 10-3 MPa-1 s-1,B= 0,3: K= 6.80 10-4 MPa-1 s-1, B= 0, 4: K= 1.2 10-4 MPa-1 s-1, B=0 and 5: K=2.03 10-14 MPa-1 s-1, B= 1 MPa-1.

Volume V: Textile Composites and Characterisation
V - 838
When the value of the exponential term constant B is set to 0, the debonding rate is
proportional to the effective stress σ- . The measured stress σ vs ε function deviates from thatof the fully bonded composite at a relatively low strain and moves to the completely debondedstate over a broad range of strains (see also Fig. 5 for the corresponding φd vs ε curves). Witha high value of K (curve 1) the σ vs ε curve of the composite will cross that of the matrixwhen the matrix is still elastic and join that of the debonded composite at a strain well belowthe yield. The value of K used to draw curve 2 in Fig. 5 was selected so that the debondingprocess would be complete in the range of strains studied experimentally (0 to 8%). In thiscase the stress strain curve reaches a maximum at about 1.5% strain when about a third of allfiller particles have debonded.
With a very high value of B the debonding will occur at nearly constant effective stress ( σ- ).Curve 5 corresponds to this case. The stress strain curve (σ vs ε) follows that of a well bonded
composite until the onset of debonding (with the combination of K and B used at σ = σ- ³ 32MPa). With the reduction of the load bearing section the applied (measured) stress (σ)
decreases (while σ- = const) until the fully debonded state is reached at σ = 18 MPa and ε =6%). The apparent “yield” of the composite (maximum of the value σ vs ε curve) correspondsto the onset of debonding rather than to the inherent yield of the matrix material. Thecorresponding φd vs ε curves are shown in Fig. 6.
The shapes of these curves suggest that the Bartenev type equation can cover the range ofsituations likely to occur in glass bead filled viscoelastic materials. The extreme case of thedebonding occurring at constant effective stress (curves 5, Figs. 5-6) will certainly not befound in real materials where the dispersed phase distribution is at best uniformly random,particles are of different sizes, local stress fluctuations are caused not only by the materialinherent heterogeneities but also by residual stresses which vary throughout the thickness, andwhere the debonding will therefore occur over a broader range of stress and strain.
Fig. 6 Debonded filler fraction φd calculated using equations 1 and 6 as a function of strainε. The curves are numbered as in Fig. 5.
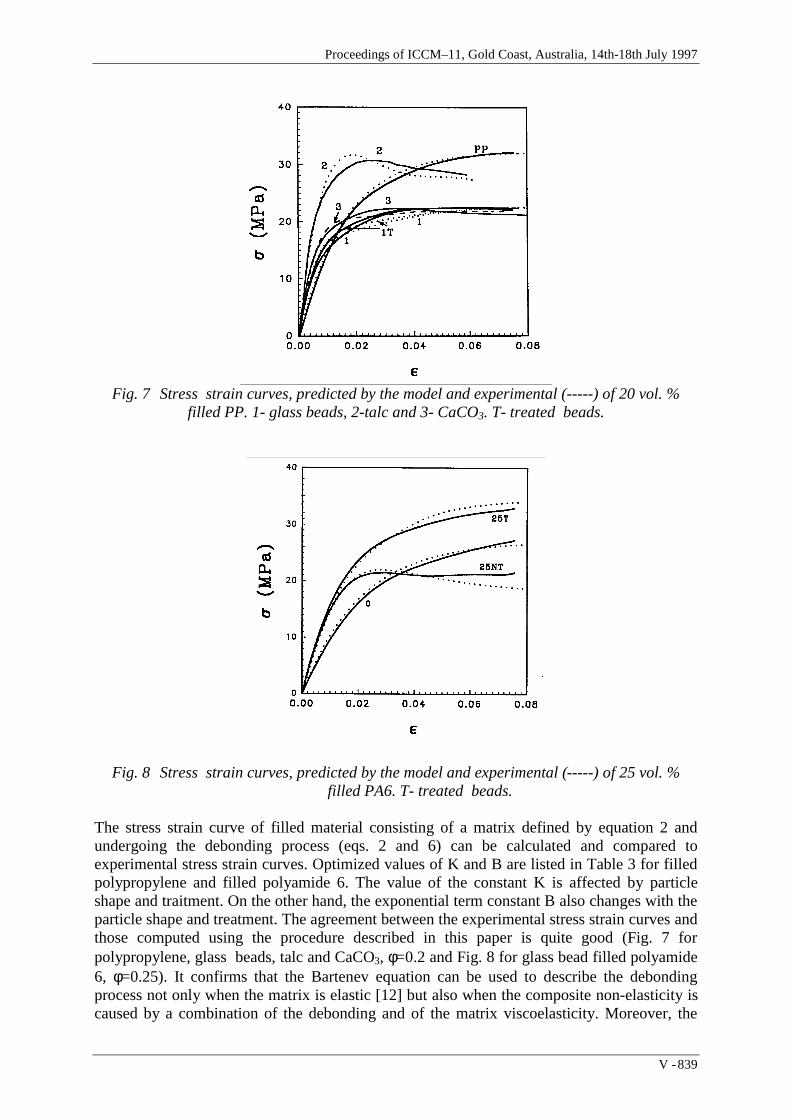
Proceedings of ICCM–11, Gold Coast, Australia, 14th-18th July 1997
V - 839
Fig. 7 Stress strain curves, predicted by the model and experimental (-----) of 20 vol. %filled PP. 1- glass beads, 2-talc and 3- CaCO3. T- treated beads.
Fig. 8 Stress strain curves, predicted by the model and experimental (-----) of 25 vol. %filled PA6. T- treated beads.
The stress strain curve of filled material consisting of a matrix defined by equation 2 andundergoing the debonding process (eqs. 2 and 6) can be calculated and compared toexperimental stress strain curves. Optimized values of K and B are listed in Table 3 for filledpolypropylene and filled polyamide 6. The value of the constant K is affected by particleshape and traitment. On the other hand, the exponential term constant B also changes with theparticle shape and treatment. The agreement between the experimental stress strain curves andthose computed using the procedure described in this paper is quite good (Fig. 7 forpolypropylene, glass beads, talc and CaCO3, φ=0.2 and Fig. 8 for glass bead filled polyamide6, φ=0.25). It confirms that the Bartenev equation can be used to describe the debondingprocess not only when the matrix is elastic [12] but also when the composite non-elasticity iscaused by a combination of the debonding and of the matrix viscoelasticity. Moreover, the

Volume V: Textile Composites and Characterisation
V - 840
Bartenev equation appears to be able to cover the cases of both complete and partialdebonding (polypropylene and polyamide 6 respectively).
Table 3 : K and B values of 20vol. % filled polypropylene (PP) and25vol. % filled polyamide 6 (PA6) .T-treated beads.
CONCLUSION
The stress-strain behavior of filled polymer is modeled by using a Bartenev type relation forthe time dependence of the filler matrix interface strength and by considering the gradualtransformation of the initially well-bonded composite into foam which take account thematrix viscoelasticity. A good agreement was achieved between calculated and experimentaldata.
REFERENCES
1 Anderson L.L. and Farris R.J., “A Predictive Model the Mechanical Behavior ofParticulate Composites”, Polymer Engineering and Science, Vol. 38, 1993, pp 1458-1465.
2 Zezin Yu P., “Damage Accumulation and Strength of Adhesion Bonds in Filled PolymericSystems”, Mechanics of Composite Materials, Vol. 30, 1994, pp. 131-135.
3 Meddad A. and Fisa B., “Stress-Strain Behavior and Tensile Dilatometry of Glass Bead-Filled Polypropylene and Polyamide 6”, Journal of Applied Polymer Science, in press1997.
4 Meddad A. and Fisa B., “ A Model for Filler-Matrix Debonding in Glass Bead filledViscoelastic Polymers”, Journal of Applied Polymer Science., in press 1997
5 Nielsen L.E. and Landel R.F, Mechanical Properties of Polymers and Composites, 2nd
Ed., Marcel Dekker Inc. New York, 1994. 6 Jancar J. and DiBenedetto A.T., “The Mechanical Properties of Ternary Composites of
Polyropylene with Inorganic Fillers and Elastomer Inclusions”, Journal of MaterialsScience, Vol. 29, 1994, pp. 4651-4658
7 Collias I. and Baird D.G., “Tensile Toughness of Microcellular Foam of PS, SAN andPC”, Polymer Engineering and Science, Vol. 35, 1995, pp. 1167-1177
8 Bartenev M.M. and Zuyev Yu. Z., Strength and Failure of Viscoelastic Materials,Pergamon Press, London, 1968.
9 Perepechko I.I., An Introduction to Polymer Physics, 1th Ed. Mir Publishers, Moscow(1981)
10 R.J. Crawford, Plastics Engineering, 2nd Ed. Pergamon Press London, 1987.11 Lemaitre J. and Chaboche J.L., Mécanique des matériaux solides, 2nd Ed. Dunod Paris
(1988)12 Meddad A. and Fisa B., Journal of Materials Science, in press 1997
Proceedings of ICCM–11, Gold Coast, Australia, 14th-18th July 1997
V - 841
MODELLING OF THE PUSHING INSTALLATIONOF OPTICAL FIBER CABLE IN URBAN AREA
Habiba Boulharts1, 2, Jean-Louis Billoet1, Jean Le Rouzic2,Olivier Polit 1, Alain Pecot2 and Jean-Luc Campion2
1 LM2S /URA CNRS 1776, ENSAM Paris ,
151, boulevard de l'Hôpital, 75013 Paris, France2 FRANCE TELECOM - CNET Lannion , DTD/CAI ,
BP 40 , 22307 Lannion Cedex , France
SUMMARY : The spreading of whole optical access networks for the customers (FTTH ,FFTB,...) connecting necessitates to master some mechanical parameters like optical fibercable structure. The studied cable presents a multilayer cylindrical structure. The analyticalconstitutive equations have been obtained with homogenization techniques on multilayercylindrical beam. A Timoshenko’s approach is used without transverse shear correction.Some mechanical tests have been performed such as simple tensile tests , bending coupledwith tension test and buckling tests. The cable buckling behavior is the first global approachstudied in this paper. The buckling test results are provided by a bench test for pushinginstallation fully manufactured by the CNET. A modelling with finite elements using explicitmethod of ABAQUS software simulate the cable installation by pushing process. Thestiffness matrix terms are validated by those experimental tests. The experimental bucklingresults are close to theoretical buckling results and 2-D numerical results.
KEYWORDS : linear elasticity, isotropic transverse beam, oriented composite layer, cableinstallation, pipe buckling, cable pushing bench test, finite element modelling.
INTRODUCTION
The fiber optical expansion is more and more important in access networks. The developmentof new cable structures must integrate the cable installation process constraints. In the urbanarea, the choice between a pulling and a pushing installation or a mixture of both depends onthe length to install, the course dependent constraints, the nature of the ducts and the opticalfiber cable mechanical characteristics. The pushing technique consists in applying a pushingeffort on cable at the beginning of the duct. The optical cable flexional mode is the majormode occurring in this process. Our study is about the cable mechanical characteristicsidentification and its pushing installation process.
The studied optical fiber cable is considered like a composite material by its multilayercylindrical structure and by its different components like hdPE, PCV, kelvar, glass-resin. ThehdPE and PCV layers are transversely isotropic and the kevlar layer is anisotropic due to itshelical twisted yarns (Fig. 1). The analytical constitutive equations are given for a multilayercylindrical beam. The Hashin’s model [1] is used to calculate the equivalent elastic constants

Volume V: Textile Composites and Characterisation
V - 842
of kevlar and glass-resin layers. After writing the local behavior law for each layer inconsecutive three-dimensional basis and reducing it in one dimension, the generalisedbehavior law is established with the help of integration techniques. The obtained stiffnessmatrix terms are compared with the stiffness moduli provided by tensile tests, bending andbuckling tests.
A cable installation bench test is manufactured to understand the cable global behavior and topredict the cable buckling. The cable is introduced under a compressive axial load, insidetranslucent ducts. The buckling theories of pipes installed for the petrol drilling permit us toanalyse the phenomena observed during the cable pushing process. The cable helix pitches inthe helical configuration and the axial loads at the end-up of the duct are studied. Then afinite element modelling of cable pushing process is compared to the experimental data.
STRUCTURE CABLE STUDY
Homogenization techniques
The multilayer cable is supposed transversely isotropic in the axial direction. The localbehavior law (Eqn 1) under transversely isotropic assumptions is expressed in the principalfiber direction (L,T,R) of each layer [2]. The Fig. 2 represents the three different basis(L,T,R), (X,R,θ ),(X,Y,Z) used to express the constitutive equations. We have stress-strainrelations in the (L,T,R) coordinate system :
σσσσσσ
εεεεεε
LL
RR
R
LR
LT
TT
RR
R
LR
LT
ΤΤ
Τ
ΤΤ
Τ=
+ −− +
ψ ν ννν
E 2 2 0 0 0
2 0 0 0
2 0 0 0
0 0 0 G 0 0
0 0 0 0 G 0
0 0 0 0 0 G
L LT LT
LT
LT
LT
LT
LLK K
K K G K G
K K G K G
T T
T T TT T TT
T T TT T TT
(1)
hdPEkevlar
PCV glass-resin
αθ
Fig.1 : Multilayer cable. Fig. 2 : The three coordinate systems used.
This law is written in a common reference to the layers set, the local cylindrical (X,R,θ )coordinate system . The C16, C26, C36 et C45 coupling terms appear in the stiffness matrix(Eqn 2). The Cij terms depend on the cosines direction (cosα , sinα ) from the first coordinatetransformation and the five independent elastic constants EL, E , G , G , , KT LT TT LT Tν of eachhomogenised layer. The twist angle of the kevlar yarn is α . We notice that the C16, C26, C36

Proceedings of ICCM–11, Gold Coast, Australia, 14th-18th July 1997
V - 843
et C45 coupling terms are null for the PCV, hdPE transversely isotropic layers and the glass-resin layer because there is no twist angle for those layers.
σσσσσσ
εεεεεε
θθ
θ
θ
θθ
θ
θ
XX
RR
R
RX
X
RR
R
RX
X
=
C11 C12 C13 0 0 C16
C12 22 23 0 0 C26
C13 C23 C33 0 0 C36
0 0 0 C44 C45 0
0 0 0 C45 C55 0
16 26 36 0 0 C66
XX
C C
C C C
with (2)
C C E K S C S S G C S G
C S C E K S C C S S G C S G
C C S K S G
C S E K C C S C G S C G
C K C S
L T LT TT LT
L T LT TT LT
LT T TT
L T LT TT LT
T LT
11 4 4
12 2 4
13 2
22 4 4
23 2
2 2 4 4 2 2
2 2 4 4 2 2 2 2 2 2
2 2 2
4 4 2 2 4 2 2
2 2
= + + + +
= + + + + −
= + −
= + + + +
= + −
ψ ν
ψ ν
ν
ψ ν
ν
( )
( ( ) )
( )
( )
( )
C
C G
C K G
C C G S G
C G G SC
C S G C G
C S C E K S C C S C S G C S G
C C S E K C S CS CS S C G C S C S G
C S
TT
T TT
TT LT
TT LT
TT LT
L T LT TT LT
L T LT TT LT
2
2 2
2 2
2 2 2 2 2 2 2 2 2 2
3 3 3 3 3 2 2
3
33
44
45
55
66 4
16 2 2
= +
= += − −
= +
= + − + + + + −
= − − − − − −
( )
( ( ) ) ( )
( ( ( ) ) ( ) )
(
ψ ν
ψ ν
C26 = ψ ν
να α
E K C S C S) CS S C G C S C S GL T LT TT LT− − − − + −( ( ) ( ) )
)
2 3 23 3 3 2 2
C36 = -C S (K (1- 2 ) - G
with C = cos ; S = sinT LT TT
The beam theory with Timoshenko’s hypothesis including transverse shear is applied. Theconsequence on the constitutive equations is the neglecting of the following stressescomponents,σ σ σθθ θRR R, , in comparison with the other stresses components. The reducedlocal constitutive equations (Eqn 3) in the (X,R,θ ) coordinate system are obtained with theC ij terms depending linearly on the preceding Cij terms.
σ
σσ
εεεεεε
σσσ
εεε
θ
θθ
θ
θ
θ θ
XX
RX
X
RR
R
RX
X
XX
X
RX
X
RX
0
0
0
22 23
16 26 36 0
16 16 0
16 16 0
0 0 16
= ⇔ =
C11 C12 C13 0 0 C16
C12 C C 0 0 C26
C13 C23 C33 0 0 C36
0 0 0 C44 C45 0
0 0 0 C45 C55 0
C C C 0 C66
(3)
XX
XXC C
C C
C
The Eqn 3 are now expressed in the Cartesian (X ,Y ,Z) coordinate system. The new reducedlocal stiffness matrix is a function of the cosines direction (cosθ , sinθ ) from the secondcoordinate transformation. The stress-strain relations in the Cartesian (X ,Y ,Z) coordinatesystem are defined by the Eqn 4:

Volume V: Textile Composites and Characterisation
V - 844
σσσ
εεε
θθ
XX
XY
XZ
XX
XY
XZ
=−
+ − +− − + +
cC11 sC16 cC16
sC16 c C55 s2C66 c s( C66 C55)
cC16 c s( C66 C55) s C55 c C66
2
2 2 with
c = cos
s = sin (4)
The generalised efforts components (N,Ty,Tz) and generalised moments components(Mx,My,Mz) are obtained by the integration of the Eqn 4 in the circular cross section. We
have the global reduced behavior law expressed by the relation (5). The Ckl' terms of the
stiffness matrix is the summation of the ( )R Rkx
kx− −1 thickness and Cij terms multiplication of
each layer denoted by k. One can notice that the transverse shear correction obtained by theHellinger-Reissner’s functional mixed approach is not presented here. The matrix diagonalterms of the Eqn 5 are used to be compared to the experimental and numerical results.
N
Ty
Tz
C11 0 0 C14 0 0
0 C22 0 0 C25 0
0 0 C22 0 0 C36
C14 0 0 C44 0 0
0 C25 0 0 C55 0
0 0 C36 0 0 C55
' '
' '
' '
' '
' '
' '
Mx
My
Mz
X
XY
XZ
X
Y
Z
=
εεεχχχ
0
0
02
2
with (5)
C11'
C11 p (R R
C22'
(C66 C55 )p (R R )/2
C14'
C16 2p (R R
k
kk2
k 12
k kk2
k 12
k
' k k
kk4
k 14
'
k
kk4
k 14
k
kk3
k 13
'
k
kk3
k 13
'
)
C44 (C66 C55 ) p (R R ) / 4
C55 C11 p (R R ) / 4
) / 3
C25 C16 ( p) (R R ) / 3
C36
= ∑ −
= + −∑
= ∑ −
−
−
−
−
−
−
= +∑ −
= ∑ −
= ∑ − −
= C16 p (R R ) / 3k
kk3
k 13∑ − −
Global stiffness matrix validation
During the cable installation in the urban area, the stiffness moduli of traction C11', bending
C55' and twist C44
' are mainly involved. The validation of these terms in the global stiffness
matrix (Eqn 5) is made in comparison with the same moduli obtained by numericalsimulations, characterisation tests. At another level, those terms are also compared to the
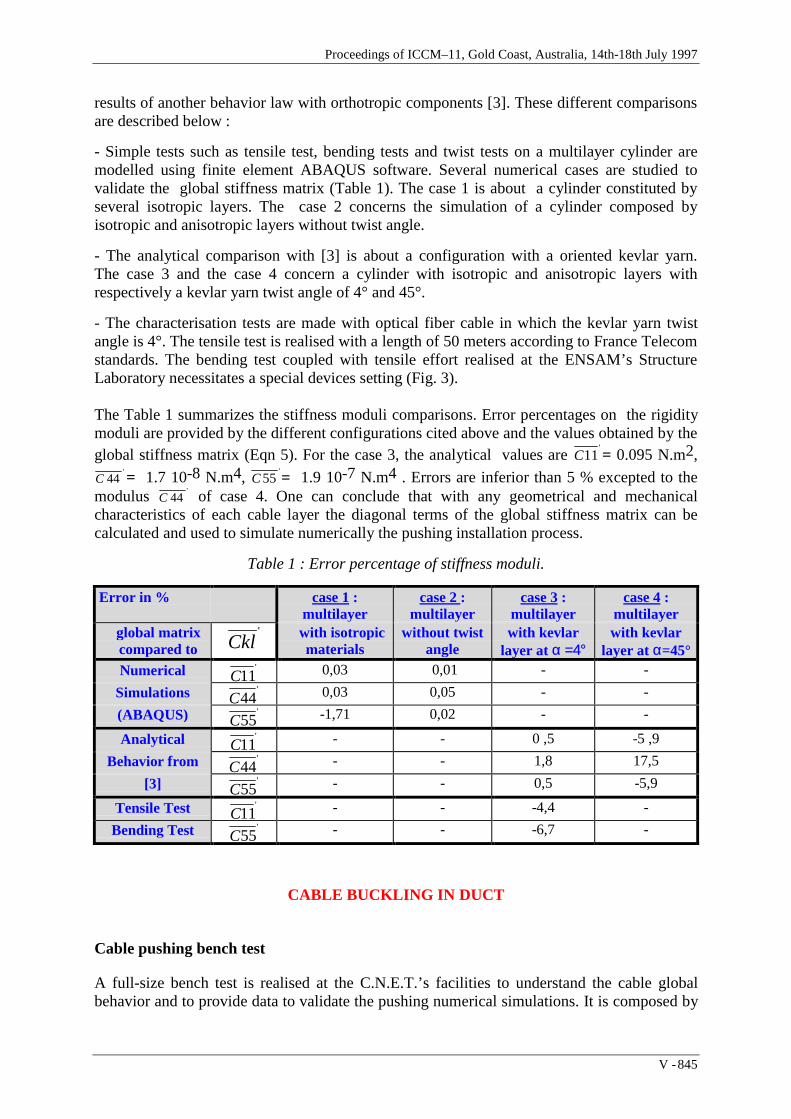
Proceedings of ICCM–11, Gold Coast, Australia, 14th-18th July 1997
V - 845
results of another behavior law with orthotropic components [3]. These different comparisonsare described below :
- Simple tests such as tensile test, bending tests and twist tests on a multilayer cylinder aremodelled using finite element ABAQUS software. Several numerical cases are studied tovalidate the global stiffness matrix (Table 1). The case 1 is about a cylinder constituted byseveral isotropic layers. The case 2 concerns the simulation of a cylinder composed byisotropic and anisotropic layers without twist angle.
- The analytical comparison with [3] is about a configuration with a oriented kevlar yarn.The case 3 and the case 4 concern a cylinder with isotropic and anisotropic layers withrespectively a kevlar yarn twist angle of 4° and 45°.
- The characterisation tests are made with optical fiber cable in which the kevlar yarn twistangle is 4°. The tensile test is realised with a length of 50 meters according to France Telecomstandards. The bending test coupled with tensile effort realised at the ENSAM’s StructureLaboratory necessitates a special devices setting (Fig. 3).
The Table 1 summarizes the stiffness moduli comparisons. Error percentages on the rigiditymoduli are provided by the different configurations cited above and the values obtained by theglobal stiffness matrix (Eqn 5). For the case 3, the analytical values are C11
'= 0.095 N.m2,
C 44' = 1.7 10-8 N.m4, C55
'= 1.9 10-7 N.m4 . Errors are inferior than 5 % excepted to the
modulus C 44' of case 4. One can conclude that with any geometrical and mechanical
characteristics of each cable layer the diagonal terms of the global stiffness matrix can becalculated and used to simulate numerically the pushing installation process.
Table 1 : Error percentage of stiffness moduli.
Error in % case 1 :multilayer
case 2 :multilayer
case 3 :multilayer
case 4 :multilayer
global matrixcompared to Ckl
' with isotropicmaterials
without twistangle
with kevlarlayer at α =4°
with kevlarlayer at α=45°
Numerical C11' 0,03 0,01 - -
Simulations C44' 0,03 0,05 - -
(ABAQUS) C55' -1,71 0,02 - -
Analytical C11' - - 0 ,5 -5 ,9
Behavior from C44' - - 1,8 17,5
[3] C55' - - 0,5 -5,9
Tensile Test C11' - - -4,4 -
Bending Test C55' - - -6,7 -
CABLE BUCKLING IN DUCT
Cable pushing bench test
A full-size bench test is realised at the C.N.E.T.’s facilities to understand the cable globalbehavior and to provide data to validate the pushing numerical simulations. It is composed by

Volume V: Textile Composites and Characterisation
V - 846
a pusher engine, a motorised reel, translucent ducts and a computer (Fig. 4). Two effortsensors installed on either side of the pusher engine give the pushing effort Fpush, a countingwheel provides the introduced length, a third sensor placed at the up-end of the duct informsus on the stop effort, Fstop. This stop points out the up-end of the course. All data arerecorded on the computer which pilots the test.
Fig. 3 : The bending test. Fig. 4 : The pushing bench test.
The studied multilayer fiber optic cable is pushed on a length of 45 meters. During thepushing test, one can observe that first the cable keeps its pre-stressed configuration and liesinside the duct. Then lateral displacements in sinusoidal shape appear under a highercompressive load Fpush. If the compressive axial load Fpush gets more and more important,the cable buckles into a new helical shape. The Fig. 5 shows the buckled cable in a horizontaltranslucent PCV duct at the end of the test. The more the cable undulations increase, the morethe contact force increases. The created frictional force provoked by this contact force alsoprevents the cable introduction. It’s interesting to know how to predict this helicalconfiguration. This study of the cable buckling is about the axial load influency on the helixpitch and the axial load distribution along the duct.
Fig. 5 : A buckled cable in a translucent PCV duct.

Proceedings of ICCM–11, Gold Coast, Australia, 14th-18th July 1997
V - 847
Theoretical study
Two formula express the compressive axial force Fpush as a function of the cable helix pitchP and its bending stiffness modulus EI. [4] discussed about their meaning. They differ by afactor of two .
( )Fpush = 8 *
E I
P
P
2 = 2
E I
Fpush2
2π π⇔ (6)
( )Fpush = 4 *
E I
P
P
2 =
E I
Fpush2
2π π⇔ (7)
According to [5], when the compressive axial load Fpush reaches a limiting value Fcr, thecable buckles into a sinusoidal shape. This first buckling load Fcr is given in the Eqn 8. If theaxial load is greater than the critical load, the helical shape will be developed in a helixaround the duct wall. The helical buckling load expression (Eqn 9) for a long cable inhorizontal duct is a function of the cable bending modulus EI , the weight w and the clearanceradius r in the duct.
Fcr = 2 E I
r
w (8)
Fhel = 2 2 E I
r
w (9)
The following differential equation for the axial load of a helically buckled weighty cable in ainclined duct is given in [4] and expresses in the Eqn 10 :
dF
dX= ( sin + ) - cos where =
r Fpush
4 EI
2
µ β βw w w wn n (10)
which is a function of the weight w, the friction coefficient µ, the contact force wn, the
incline angle β and the helical length X measured from down-up. The axial load F distributionfor helically buckled cable in a horizontal duct under is written in the Eqn 11 :
( )F X = 4 EI
r tan X
4 EI arctan Fpush
r
4 EI
w w
wµ r +
(11)
Experimental helical configuration study
A cable is pushed in a duct of 45 meters. When the test is finished, the helix pitches arecollected. The cable helix pitches vary along the translucent duct. The Fig. 6 shows us severalsets of helix pitches with the same value. There are 83 half periods. The graph can be dividedby two parts or maybe more : the (1-39) set collection corresponds to a half helix pitchaverage of 36 cm, and the (40-83) set collection corresponds to a half helix pitch average of68 cm. The whole half helix pitches average is about 53 cm. One can notice that thecompressive axial load influences more the cable buckling on the down-up of the duct.

Volume V: Textile Composites and Characterisation
V - 848
down-up end-up
PP
FpushFstop
undul ation num ber
pe
rio
dic
ity (
P /
2)
0
10
20
30
40
50
60
70
80
90
100
110
120
1 5 9 13 17 21 25 29 33 37 41 45 49 53 57 61 65 69 73 77 81
average(1:83)=53,62 cm
average(1:39)= 36,68 cm ecarty=13,84 cm
ecarty=23,28 cm
ecartyp=19,29 cmaverage(40:83) = 68,68 cm
duct up-end duct down-end
compressive axial force
Fig. 6 : The cable periods collection in a duct of 45 meters.
It is interesting to extract the helix pitch P from the Eqns 6 and 7, and to compare it to the Pexperimental values. It is also an original way to validate the bending stiffness modulus fromthe Eqn 5.
Compressive axial load evolution
The Fig. 7 shows us the efforts Fpush and Fstop recordings during the test on 45 meters. Thisfigure can be divided into three parts from the viewpoint of the Fpush increasing. In the partA, as the up-end cable extremity is free, the stop force Fstop remains stationary, also thecompressive axial load Fpush does. In the part B, the cable reaches the stop. It’s why theFstop increases and remains stationary to 10 daN. The Fpush increases equally until themaximum cable length introduced in the duct is reached. There is a sharp peak at 140 daNwhich delimits the part C. In this last part, the dow-up cable extremity fords inside the ductunder the excessive axial load. The Fpush decreasing corresponds to a new introduction of thefolded cable. At the down-up of the duct, the cable forms a buckle in 8 shape. The pushingforce limit is overflow. The cable is damaged after this test. Normally, we have to stop thecable introduction before reaching the helix configuration to conserve the cable opticalfunctions.
We substitute these recorded Fpush data into Eqns 6 and 7 and obtain the curves P/2(6) andP/2(7) (Fig.7). These former inform us on the values before and after the cable reaches thestop at 44,8 meters. The helix pitch is inversely proportional to the compressive axial load.The smaller the axial load Fpush is, the higher the helix pitch P is as the curves P/2(6) andP/2(7) show us.

Proceedings of ICCM–11, Gold Coast, Australia, 14th-18th July 1997
V - 849
cable introduced length in m
Effo
rts
F in
daN
and
P/2
in c
m
0102030405060708090
100110120130140150160
44,40 44,60 44,80 45,00 45,20 45,40
Fpush daN P/2 (7) P/2 (6) Fstop daN
A
B C
helical buckling load: Fhel
Fig. 7 : Efforts Fpush and Fstop recordings and P/2 deduced from Eqns 6 and 7.
According to Eqn 9, the helical buckling configuration appears for a Fpush minimum value of25 daN :
Fhel = 2 2 E I
r 25 daN
w ≅
We can compare the P/2 values in the Figs. 6 and 7. We study the helix pitches when thecable starts buckling and when the test is stopped :
- The experimental P/2 values observed at the end-up of the duct are in relation with thebeginning of the cable buckling (i.e. when the axial load Fpush reaches the buckling load,Fhel). For a buckling load value of 25 daN, the half helix pitches corresponding values areabout 50 cm and 80 cm respectively for the P/2(7) and P/2(6) curves (Fig. 7). Theexperimental P/2 average is about 68 cm and is framed by the preceding values.
- The experimental P/2 values at the down-up of the duct correspond to the final helicalconfiguration. For a Fpush value of 80 daN, the half helix pitches corresponding valuesare about 35 cm and 50 cm respectively for P/2(7) and P/2(6) curves. The experimentalP/2 average is about 36 cm and is equally coherent with the theoretical values.
End-up axial load calculation
For a configuration of the bench test described below, we calculate the axial load distributionat the X=45 m from the Eqn 11. The cable/duct friction coefficient is 0.2. The effective
weight is 0.12 kg/m. The cable Young modulus is 8. 109 N/m2. The clearance radius is 0.038m. We find a Fpush equal to 50 daN for a load F(X) given to 10 daN. According to the part Bof the Fig. 7, the Fpush value is coherent. The stationary stage of the end -up load Fstop at 10daN begins at a Fpush value of 40 daN.

Volume V: Textile Composites and Characterisation
V - 850
Numerical simulations
A 2-D finite element modelling is used to simulate the cable pushing in a duct. Beam finiteelements with two nodes at 3 degrees of freedom a node, using the Timoshenko’s approachsimulate the cable. Rigid elements simulate the duct. The simulation size is 12671 degrees offreedom. The explicit version on the ABAQUS software allows us to treat this non linearcontact problem. The results of a cable pushing on a 5 meters long duct are compared to thenumerical results for three duct diameters : 0.025 m, 0.040 m, 0.060 m (Fig. 8). The Table 2represents the up-end force Fstop and the sinus and helix pitches comparisons. The numericalresults are coherent for the pitch. But further they will have to be more improved as comparedto the experimental compressive stop load.
Table 2 : Experimental and numerical comparisons on a 5meters duct.
Duct Numerical results Experimental resultsdiameter m Fstop N sinus pitch m Fstop N helix pitch m
0.025 1015 0 ,50 670 0,57
0.040 646 0,72 450 0,73
0.060 357 0,85 210 0,89
Fig 8 : Sinusoidal buckling configuration with 2D numerical simulation.
CONCLUSIONS
1. The analytical global stiffness matrix established for an oriented multilayer cylindercorresponds to the characteristic mechanics of the studied optical fiber cable. This stiffnessmatrix can be used for any isotropic transverse oriented multilayer cylinder. Thesecalculated stiffness moduli are injected in the pushing numerical modelling.

Proceedings of ICCM–11, Gold Coast, Australia, 14th-18th July 1997
V - 851
2. The pushing experimental study permits us to understand the cable global behavior. Thebuckling theoretical relations applied to the pipes for petrol drilling afford us tounderstand the different configurations of cable buckling.
3. The 2-D finite element modelling of the cable pushing process is relatively close to the experimental values. Further this modelling will have to be more improved. A length representative of urban area configuration will be studied. The 3-D numerical approach using beam elements at 9 degrees of freedom a node for the cable and pipe elements for theduct will be studied. The numerical simulation will be a reliable tool to simulate the cable installation by pushing. This tool could be used to anticipate the conception of a new cable structure.
NOTATIONS
σIJ : stress component, KT : lateral shrinking modulus,GTT : Coulomb’s transverse modulus, GLT : Coulomb’s axial modulus,
νLT : Poisson’s coefficient, EL : axial stiffness modulus,
εIJ : strain component, Cij : stiffness matrix component,
N : axial force, Ti : transverse force in direction i,Mi : moment in the direction i, k : cylinder layer index,α : twist angle, θ : transformation angle,Fpush : compressive axial load, Fstop : axial effort in the up-end of the duct,w : cable weight per unit length, P : helix pitch,µ : cable/duct friction coefficient, r : clearance radius between cable and duct,E I : cable bending modulus, Fcr : sinusoidal buckling load,Fhel: helical buckling load, F(X) : up-end axial load at the distance X,X : helically bucked length of a duct wn :contact force resulting from helical buckling
measured from down-up, of weightless cable,1 cm = 0.01 m . 1 daN = 10 N.
REFERENCES
1. Hashin, ‘‘Analysis of properties of fiber composites with anisotropic constituents’’,Journal of Applied Mechanics, sept 79, vol. 46, pp. 543-550.
2. Berthelot, J.M. , ‘‘Composite materials ’’, Masson, Paris, 1992.
3. Noury T., ‘‘ Homogenization of composite beams with orthotropic components’’, Thesis,Toulouse, France, dec. 1993.
4. Cheatham, J.B., ‘‘Helical post-buckling configuration of a weightless column under theaction of an axial load’’, Society of Petroleum Engineers Journal, august 84, pp 467-472.
5. Wu, J., ‘‘Helical buckling of pipe in extended reach and horizontal wells- Part2 : Frictionaldrag analysis’’, Transactions of ASME, vol. 115, sept.1993, pp. 196-201.
Volume V: Textile Composites and Characterisation
V - 852
SIMULATION OF FLEXURE IN OFF-AXIS THREE-POINT BENDING TEST BY A FINITE-ELEMENT
CODE
A. D. Resnyansky
School of Mechanical and Manufacturing Engineering, UNSW, Sydney 2052, Australia
SUMMARY: The present paper is devoted to an application of a hierarchical model ofunidirectional composite [1] to the finite element calculation of the three-point bending test inthe quasi-static statement for a fibrous unidirectional composite. The finite element method(FEM) in use is based on the Hellinger-Reissner variational principle with assumed stress anddisplacement fields. Internal (structural) variables are calculated by the time increments wheretime is a load parameter. The arrangement of fibres and the component’s debonding are notconsidered in the model. However, employing the structural parameters, the chances of thedebonding between the constituents can be estimated. Numerical results confirm theconclusion of the beam theory that at the symmetrical loadings (the fibre direction iscoincident with the load axis) and low span-to-depth ratio the shear failure prevails. At thesame time, in the range of low span-to-depth ratios the influence of the fibre orientation isessential and provokes the mixed mode of fracture at the off-axis loading. Large span-to-depth ratio induces tensile fracture. However, again the off-axis loading destroys clearlydefined boundaries of localised deformation and induces the peculiarities typical for themixed mode of failure.
KEYWORDS: hierarchical model, homogenization approach, finite-element computation,three-point bending test, off-axis loading, fibrous unidirectional composite.
INTRODUCTION
The three-point bending test is one of the very popular tools for the study of the strengthproperties of material. The wide use of the method for composites faces peculiar features dueto the non-isotropic and microstructural behaviour of composite beam, especially under theconditions of the off-axis loading. The complex stress state in the beam was understood for along time. However, due to the convenience and availability of the test for mechanicalassessment of the material properties, simple solutions of the beam theory [2] are widely usedfor acquisition of the shear and tensile stresses at failure in the three-point bending test.
In the case of the off-axis loading of composites the sample orientation is an essentialparameter of the test. It is extremely important in this situation to understand which of theparameters, including the sample orientation and the span-to-depth ratio, are related tomechanical properties of the material and which ones are associated with the problemstatement. Mathematical simulation is an invaluable tool in this situation.
The present paper is devoted to the numerical simulation of the problem in the quasi-staticplane statement. A hierarchical model of unidirectional composite developed earlier [1,3] is

Proceedings of ICCM–11, Gold Coast, Australia, 14th-18th July 1997
V - 853
used for the development of a finite-element program and for numerical simulation. TheOnzager principle is valid for the model and it enables us to construct the FEM algorithm withsymmetrical stiffness matrix.
Numerical results for the graphite-epoxy composite at the variety of the off-axis angles (theangle between fibre and the load axis) and the span-to-depth ratios are compared with theexperiment [4] in the critical load at failure. It is shown that the transition from the shear tothe flexure depends not only on the span-to-depth ratio but on the off-axis angle as well.
MODEL OF THE COMPOSITE
The system of the constitutive equations of the model [1,3] contains evolutional relations for arotation tensor determining the fibre orientation, a tensor of structural parameters ∆ , which isresponsible for the internal microstresses along fibres, and equations for elastic deformations(the tensor of elastic distortions aij ). In the two-dimensional case the equations take the form:
da
dta
v
xa
ij
ikk
jik kj+ = −
∂∂
ψ , d
dt
~~ ,
∆= −λ (1)
( ) ( )d
dt
a a a a
a a a a
ϕ ψ ψ ψ=
− + −−
21 22 11 22 222
212
12
11 22 12 21
,
here fibres lie in the ( )x x1 2, - plane, ϕ is the angle between fibre and the x1 - axis in theunloaded state, the tensor of structural parameters reduces to a sole parameter ~∆ - thedifference between elastic strains in the constituents, which determines the internal stressesalong the fibre, vi - components of the velocity vector. Variables under tilde are associatedwith the local coordinate system connected with fibre. The tensor of elastic distortion A withcomponents aij is linked with the standard tensor of elastic deformations ε e by the rule:
( )ε e TI A A= − / ,2 the superscript T denotes transposition. Combination of aij resulting in
ε e gives the following approximation of the constitutive equation for ε e in the rectangularcoordinate system associated with fibre:
d
dt
d
dtije
ij
ij
~ ~,
ε εψ= − (2)
here the rate of total deformation in the right side results from the components of the strainrate tensor ∂ ∂v xi j , ψ ij are combinations of the state functions of constituents, which are
responsible for the irreversible (plastic) deformation of composite and will be detailed later.Internal potential is expressed (for the isoentropic case) by the formula derived in details with
the help of homogenization procedure in [3]: ( )E qij ije= +σ ε ~~
,∆ 2 here ~ .~q E= ∆ In the
coordinate system associated with fibre the stress tensor ~σ is related to the elastic strain ~ε e
by the Hooke's law:

Volume V: Textile Composites and Characterisation
V - 854
~ ~ ~ ~ ,σ ε ε ε11 11 11 12 22 12 33= + +C C Ce e e ~ ~ ~ ~ ,σ ε ε ε22 12 11 22 22 23 33= + +C C Ce e e
~ ~ ~ ~ , ~ ~ .σ ε ε ε σ ε33 12 11 23 22 22 33 12 66 12= + + =C C C Ce e e e (3)
Effective elastic moduli Cij result from the elastic moduli of composite constituents according
to the homogenization procedure described in [1,3]. Differential consequences of theconservation laws are the governing equations of the model (the momentum and energyequations) for the fibrous composite and they have the standard form.
We reduce the model to the quasi-static case by the following simplifications. Firstly weconsider t as a loading parameter similar to the loading parameter in the incremental theoriesof plasticity. The linkage of the load with t can be established from the given rate of loadingp. The given loading is reached in `time' by increments proportional to a step ∆t . The inertialterms and the time derivative terms in the momentum equation are dropped.
We restrict ourselves by the isoentropic approximation. Therefore, the standard equations ofequilibrium are valid. The stress-strain relations are obtained from the Hooke's law (3) and the`kinetic' laws (2) relating the elastic strain to the total deformation.
DESCRIPTION OF THE ALGORITHM
We consider the 2D-statement in the ( )x x1 2, - plane, where fibres are lying in the plane and
( )ϕ x x1 2, is the angle between fibre and x1. In the paper we assume the plane strain state,that is ε 33 0= , where ε - the tensor of total strain.
A method of study employed in the paper is two-dimensional finite element analysis based ona mixed stress-displacement formulation through the Hellinger-Reissner variational principle[5]. The formulation uses the four-node isoparametric quadrilateral element with assumedstress σ and displacement u linear distributions over the element.
The basic problem for the method design is the construction of the stress-strain linkage thatcan be expressed in increments by the general formula:
∆ ∆′ = ′ +σ εD G , (4)
here ′σ and ′ε are 3-pseudovectors with components σ σ σ11 22 12, , , etc. When the relation(4) is derived, the finite element theory for the Hellinger-Reissner principle gives the standardsystem of linear equations [5]:
H Ru M R LTσ σ+ = =, , (5)
here σ and u are assumed stresses and displacements for the given increment, H R M L, , ,are assembled matrices. If D in (4) is a symmetrical matrix, then H in (5) is symmetricalalong with the corresponding stiffness matrix K R H RT= −1 . This fact is extremelyimportant for the design of efficient and economic FEM algorithm.

Proceedings of ICCM–11, Gold Coast, Australia, 14th-18th July 1997
V - 855
In order to derive (4) we use constitutive equations of the model (1)-(3). Let us note that thefirst term in the equation for elastic strain is easy found from both the given displacements(they are connected with velocities by obvious formula u v t= ∆ ) and coordinates. The secondterm is responsible for the inelastic behaviour of constituents and, as a consequence, of thecomposite. In the coordinate system related to fibre it takes the form [3]:
~ ~ ~ ~ ~,ψ α σ α σ α σ β11 11 11 12 22 12 33 1= + + + q
~ ~ ~ ~ ~,ψ α σ α σ α σ β22 12 11 22 22 23 33 2= + + + q (6)
~ ~ ~ ~ ~,ψ α σ α σ α σ β33 12 11 23 22 22 33 2= + + + q
~ ~ , ~ ~ ~ ~ ~ ,ψ α σ λ β σ β σ β σ γ12 66 12 1 11 2 22 2 33= = + + + q
The symmetry properties of the coefficients α β γij i, , in (6) follow from the Onzager
principle proved for the model in [3]. Here ~~q E= ∆ , the coefficients in (6) are combinations of
functions written out in [3] which describe the inelastic behaviour of constituents.
The initial step is the calculation of the rotation matrix B from the angle ϕ obtained on theprevious increment step. The matrix connects a tensor F in the Cartesian system and that inthe local coordinate system associated with fibre by the transformation rule:
( ) ( )( ) ( )
~,
cos si n
si n cos.F B FB BT= =
−
ϕ ϕϕ ϕ
(7)
The system of constitutive equations (1) is used in increments, with the given time step ∆ t ,which may be changed subject to the stability condition:
∆∆
∆a au
xa tij i k
k
jik kj= − −
∂∂
ψ ,
∆ ∆ϕ ω= t , (8)
∆ ∆ ∆~ ~ ,= −λ t
here ω is the right-hand side in the third equation of the system (1).
Because the microstrains and, as a consequence, ~∆ are associated with internal processes inthe composite so we consider this parameter separately from the set of the strain variables. Itshould be noted that from the point of view of the mathematical statement the variables σ andq , as well as ε and ∆ are equivalent and they may be involved in the variational principle onthe same rights. This becomes essential for the dynamic problem. In the present case wecalculate ε and ~∆ separately.
For a given step equation (6) is written in increments as the following (in the matrix form):

Volume V: Textile Composites and Characterisation
V - 856
∆ Ψ ∆ Ψ~ ~ ~ ,= +F σ 0 (9)
F is composed of the coefficients of (6), ~Ψ0 is a value of the ~Ψ-dependence on the previousincremental step. From the Onzager principle F is a symmetrical matrix. The constitutiveequation (2) for ε e in the local system associated with fibre gives
∆ ∆ ∆Ψ~ ~ ~ .ε εe = −
Then the Hooke's law (3) is rewritten as
( )∆ ∆ ∆ ∆Ψ~ ~ ~ ~ .σ ε ε= = −C Ce
Invoking (9), we have
( )C I C F C∆ ∆ Ψ~ ~ ~ε σ= + + 0 or ( )∆ ∆ Ψ~ ~ ~ .ε σ= + +−C F C1 0 (10)
Multiplying (10) on B from the left and on BT from the right, we have one of the forms of(4).
It should be noted that due to both the symmetry of C (it means the material symmetriy of thetransversally isotropic material) and the symmetry of F (it means the fulfillment of theOnzager principle) we have the symmetry of D in (4).
Thus, the finite element algorithm can be designed with the symmetrical matrix H in thebasic system of linear equations (5) and, as a consequence, with the symmetrical stiffnessmatrix. It can be straightforward varified that the condition of the plane strain state ε 33 0=leads to modifications of matrices C and F in (10) in such manner that their symmetrysurvives.
MATHEMATICAL STATEMENT OF THE PROBLEM
The three-point bending problem is approximated by the plane bending of the plate initiallylocated in the following region of the space:
− < < − < < − ∞ < < ∞S x S h x x2 2 01 2 3, , .
Hereafter, we will refer to the crosssection x3 0= of the plate. "Ends" (x S1 2= ± ) of theplate are clamped, i.e. u = 0 at x S h x1 22 0= ± − < <, .
The rest of the plate's boundary (except for the point of application of load) is free of normalstresses: σ σ τnn n= = 0 , where n, τ are the normal and targent vectors to the boundary. Atthe point of loading (initially x x1 2 0= = ) a constant rate of the load is applied:
u tn = ⋅ ,ε 0 (11)

Proceedings of ICCM–11, Gold Coast, Australia, 14th-18th July 1997
V - 857
t is a parameter of loading (time), ε 0 is a given constant.
In the model, the composite elastic properties are determined by the properties of constituents:graphite fibres and epoxy matrix are assumed to have the following Young's moduli E f , E m ,
the shear moduli G f , Gm and the Poisson's ratio ν f ,νm:
E G Pa G G Paf f f= = =300 125 02, , . ,ν E G Pa G G Pam m m= = =656 252 03. , . , . .ν
The fracture properties of the constituents are expressed in the work by the stress limit. In theviscoelastic model the number of constants in a relevant dependence must correspond to thenumber of experimental points. As a dependence responsible for inelastic behabiour wechoose the two-constant “thermal activation” function of the relaxation time τT on the shear
sress in the following form: ( )τ γT U J= −exp 0 0 , here U 0 0, γ are the material constants ofconstituents, the invariant of the stress tensor J :
( ) ( ) ( )[ ]J = − + − + − +σ σ σ σ σ σ σ11 22
2
11 22
2
11 22
2
122
1 2
6 .
In order to construct this two-constant dependence for each constituent we must give twostress limits (σ σf f
1 2, for fibres and σ σm m1 2, for matrix) at two strain rates ( , ε ε1 2 ). A method
of the construction of the τT -dependence with the use of these data is described in [6]. As anexample, the following data has been selected:
σ f G Pa1 23= . at m in ,ε 111= − σ f G Pa2 21= . at . m i n ,ε 2
1001= −
σ m G Pa1 013= . at m in ,ε 111= − σ m G Pa2 01= . at . m i n ,ε 2
1001= −
ANALYSIS OF RESULTS
On calculations the rate of loading in (11) has been chosen in accordance with the experiment[4] . m i nε o = −01 1 at h m m= 5 , the fibre content c = 0538. .
Our primary attention will be paid to the fulfilment of failure criterion. As the criterion wetake the approaching of the stress limit. In the figures we draw the cross-section of the beamwith dashed zones. They correspond to an excess in the stress limit for composite.Simultaneously we analyse the following parameters: the tensile stress along the plate surface(initially σ11 ), the fibre stress in the coordinate system associated with fibre, the internalparameter ~∆ along the fibre, which is responsible for microstress (internal microstress may bethe cause of debonding).
We approximate the constituents by isotropic materials so we restrict ourselves at themicrostructural consideration by the stress along the fibres, although the graphite fibres maypossess strong anisotropic properties. The limit in ~∆ can be assessed from the followingreason: invoking the interlaminar shear stress for the composite [4] 006. G Pa as a basic point

Volume V: Textile Composites and Characterisation
V - 858
for ~q (see description of the model) we can find a critical value of ~∆ for the givenconstituents ~ .∆ ≈ 002 . Keeping in mind that the debonding may be caused either thedeformation of fibre or matrix this value can vary up to five times (according to the ratio ofthe Young's modulus of fibre to the matrix’s one).
Fig. 1: The reduced load versus the span-to-depth ratio at the variety of the off-axis angles(curve 1- 0 deg , 2 - 15 deg , 3 - 30 deg , 4 - 45 deg), points are the corresponding experiment
[4].
The simple beam theory [2] gives the following formulae for calculation of tensile σττ andshear σ τn stresses:
σ σ α σ σττ τ= =3
2
3
4r n r, , (14)
here σ r is a parameter associated with the real load in the experiment, the beam width and thebeam depth. We reduce the applied load to the variable σ r with the dimension of stress forconvenience. α = S h is the span-to-depth ratio. Analyses in the literature operate with thetensile and shear stress. In reality, an experiment gives only the value associated with the loadat the failure. Therefore, using data from [4] we will employ only the values recalculated backfrom the reported tensile and shear stresses to the reduced load σ r .
Fig. 1 shows the dependence of the load parameter on the span-to-depth ratio α for thevariety of angles ϕ 0 between fibre and the the load axis from 0 up to 45 degress. Evenkeeping in mind the distinction in the simulated and experimental structures (the experiment[4] uses the fabric reinforced specimens, we calculate the unidirectional fibrous composite),the correlation is obvious.
The shear failure
Firstly we analyse the case of `short beam' with S h = 3. Figure 2 shows the failure picturethat exactly corresponds to the presentation about the shear mode [7]. The detachment of thefailure zone from the outer layers of the beam (opposite to the point of application of theload) is clear seen. The concentration of the stress at the point of loading is natural. Due to the

Proceedings of ICCM–11, Gold Coast, Australia, 14th-18th July 1997
V - 859
crosswise compression with respect to the fibre direction in the failure zone, the debondingzone is not coincident with the fracture zone. The influence of the clamping effect on thedebonding zone at periphery of the beam is out of our interest in the present paper.
Fig. 2: The stress limit zones (a) and the possible debonding zone (the excess in themicrostress - b) for the symmetrical loading; the span-to-depth ratio is 3.
In the case of the off-axis loading the picture is almost the same for the failure zones, but thezones, which are suspectied to be debonded, have some overlapping of the zones in thevicinity of the applied load and over the outer surface of the beam (Fig. 3, ϕ0 30= $, the angleis countered in the counterclockwise direction from the vertical axis directed downward).
Fig. 3: The stress limit zones (a) and the possible debonding zone (b) for the off-axis loading(the angle is 30 deg); the span-to-depth ratio is 3.
Thus, in the case of α = 3 the shear fracture occurs in the studied range of the angles. For thecases considered the tensile stress is low both in the composite as a whole and in fibres alongthe fibre direction.
It should be noted that even in the case of low span-to-depth ratio some influence of the fibredirection on the failure zone is noticeable in the outer (tensile) region opposite to the point ofthe load application.
Mixed mode of failure
Fig. 4: The stress limit zones (a) and the possible debonding zone (b) for the symmetricalloading; the span-to-depth ratio is 5.
In the middle range of the span-to depth-ratio S h = 5 for the symmetrical loadings (ϕ 0 0= $)the failure mode is still the shear one (Fig. 4). The widening of the tensile zone at the oppositesurface to the load point becomes quite noticeable.

Volume V: Textile Composites and Characterisation
V - 860
At ϕ 0030= (Fig. 5) and more angles the mode can be considered to be changed to the mixed
mode (in classification [7]) . In the failure zone the debonding is quite probable.
Fig. 5: The stress limit zones (a) and the possible debonding zone (b) for the off-axis loading(the angle is 30 deg); the span-to-depth ratio is 5.
The tensile failure
At large span-to-depth ratios (α = 10 and 20 in this subsection) the influence of tension onthe failure is obvious in the variety of angles. At the same time, some peculiarities take place.
Fig. 6: The stress limit zones (a,d), the tensile stress limit zone (b), the possible debondingzone (c) for the symmetrical loading; the span-to-depth ratios are 10 (a,b,c) and 20 (d).
The case of symmetrical loading is drawn in Fig. 6, the failure starts on the opposite surface tothe load point, the tensile stress and the debonding indicator are significant too. Theappearence of the zones of localised deformation is seen especially clear at S h = 20 (Fig.6,d).
At these ratios the off-axis case is also characterised by the tensile failure. However, thefeatures of the mixed failure mode are appeared, too. This is especially noticeable at the largeoff-axis angle (Fig. 7 a,b,c at ϕ 0
045= ).
Due to the specific fibre orientation in the given sample configurations, σ f becomes
significant at the large span-to-depth ratios and at the load with ϕ 0 more than 30$ (in that partof the beam where orientation is in agreement with the load direction), the tensile stresses andthe debonding zone are concentrated at the outer surface.

Proceedings of ICCM–11, Gold Coast, Australia, 14th-18th July 1997
V - 861
Fig. 7: The stress limit zones (a), the tensile failure zone (b), the possible debonding zone (c)and the fibre fracture zone (d) for the off-axis loading (the angle is 45 deg); the span-to-depth
ratios are 10 (a,b,c) and 20(d).
CONCLUSION
The direct numerical simulation of the three-point bending test has shown that the loadparameter correlates experiments quite adequately for the variety of the off-axis angles andspan-to-depth ratios. At low span-to-depth ratios (α = 3 for the given set of constituents) theshear failure mode is realised at the variety of the off-axis angles. However, even in the lowrange of span-to-depth ratios the influence of fibre orientation is essential. At α = 5 the mixedfailure mode takes place for the off-axis loading. At the large span-to-depth ratios (α = 10and 20 for the given composite) a steady tensile fracture takes place. Under these conditions,the fibre fracture is more probable at the off-axis test. At the symmetrical loading the areas oflocalised deformation are appeared clearly.
REFERENCES
1. Resnyansky, A.D. and Romensky, E.I., “Using a Homogenization Procedure for thePrediction of Material Properties and the Impact Response of Unidirectional Composite”,The Present Proceedings.
2. Timoshenko, S., Strength of Materials. Part I, Van Nostrand, New York, 1955.
3. Resnyansky, A.D. and Romensky, E.I., "Model of Dynamic Deformation of a FibrousThermoviscoelastic Composite", Combustion, Explosion, and Shock Waves (FizikaGorenia i Vzryva), Vol. 28, No. 4, 1992, pp. 430-436.
4. Birger, S., Moshonov, A. and Kenig S., "Failure Mechanisms of Graphite-Fabric EpoxyComposites Subjected to Flexural Loading", Composites, Vol. 20, No. 2, 1989, pp. 136-144.
5. Pian, T.H. and Tong, P., "Basis of Finite Element Methods for Solid Continua", Int.Journal of Numerical Methods in Eng., Vol. 1, 1969, pp. 3-28.

Volume V: Textile Composites and Characterisation
V - 862
6. Resnyansky, A.D. and Merzhievsky, L.A. "On Determination of Parametres ofDependence of The Shear-Stress-Relaxation Time", [In Russian], Fizika Gorenia iVzryva, Vol. 28, No. 3, 1992, pp. 123-124.
7. Hanna, G.L. and Steingiser, S., "Defining the Adhesion Characteristics in AdvancedComposites", Composite Materials: Testing and Design, ASTM STP 460, AmericanSociety for Testing and Materials, 1969, pp. 182-191.

Proceedings of ICCM–11, Gold Coast, Australia, 14th-18th July 1997
V - 863
FRACTURE MECHANICAL ANALYSIS OFPULL-OUT AND FRAGMENTATION TESTS
Christian Marotzke, Andreas Hampe
Federal Institute for Materials Research and Testing (BAM), Dept. VIUnter den Eichen 87, 12205 Berlin, Germany
6800$5<: The aim of this paper is a clarification of the failure process taking place inpull-out and fragmentation tests as well as a critical assessment of the common techniques forthe evaluation of the experimental data. The fracture process is analysed by means of thefinite element method. In the pull-out test, the mode ratio changes dramatically during thefirst phase of the crack from dominating mode I to mode II. The mixed mode energy releaserate is calculated for glass fibers embedded in a thermoplastic matrix. It turns out that thestrain energy stored during the cooling process, significantly increases the energy release ratein the pull-out test and has to be taken into account in the evaluation of the test data. In thefragmentation test, a mode II failure arises. Due to the existence of high radial compressivestresses in the interface, frictional shear stresses develop, which result in a strong decrease ofthe energy release rate and must not be neglected in the evaluation of the test data.
.(<:25'6: pull-out test, fragmentation test, energy release rate, finite element analysis
INTRODUCTION
For a long time, the micromechanical tests were used for the determination of the strength ofthe interface between fiber and matrix. However, for the determination of the strength, thestress state must be well defined. In the micromechanical tests, a complex, threedimensionalstress state is encountered around the interface [1-3]. Severe stress concentrations arise at thefiber break in the fragmentation test and at the fiber end as well as at the fiber entry in thepull-out test. Within the linear theory of elasticity, singularities are found at these points,similar to a crack tip. Under those circumstances, it is not reasonable to conduct a stressanalysis in order to calculate an interfacial strength, because the stresses at the critical pointsdepend on the local geometry and on the local material properties, which may differsignificantly from that of the bulk material. Moreover, not only one isolated stress componentis found at these points but a superposition of radial and shear stresses. The ratio of the twocomponents strongly depends on the material properties of fiber and matrix. In the past,ssubstantial simplifications concerning the stress field around the interface were used for theevaluation of the test data. One model, based on a plastic behaviour of the matrix [4],presumes an unbounded yielding of the matrix near the interface, leading to constantinterfacial shear stresses (Kelly-Tyson formula). The two main inconsistencies inherent in thisapproach are the neglection of the other stress components and the unrealistic strains resultingfrom the unbounded yielding of the matrix. The other model simplifies the elastic stress fieldusing the shear lag hypothesis [5,6]. This model is inconsistent in that it results in constantaxial stresses in the matrix, violating the boundary conditions in the interface and,furthermore, underestimates the stress concentrations at the critical points [7]. A further

Volume V: Textile Composites and Characterisation
V - 864
problem of the measurement of the strength with pull-out tests is the definition of the momentof failure initiation. Several studies have shown that the failure initiation arises long beforethe force maximum is reached [8,9].
In recent years, the characterisation of the interface by a fracture mechanical analysis leadingto a fracture toughness or an energy release rate, becomes more and more accepted [1,10-15].A fracture mechanical analysis is more adequate to the stress state arising in the interface withstress singularities at the critical points. However, not all problems encountered in the stressanalysis are overcome. As a result of the superposition of radial and shear stresses, only amixed mode fracture toughness can be measured directly. The discrimination of the modesrequires a theoretical analysis [16]. In general, the fracture toughness can be determinedexperimentally, if the material behaves perfect linear elastically and if the variation of thecompliance with the crack length can be measured with high precision. However, thedetermination of the crack length is not possible for all matrices and it is a rather complicatedprocedure [9]. Furthermore, polymeric matrices exhibit a more or less nonlinear behaviour.The linear elastic analysis, which is commonly utilised in the literature, gives a first approachand offers some insight into the main mechanisms of the fracture process, if the matrices arenot too nonlinear.
FINITE ELEMENT MODEL
The pull-out test model consists of a fiber of ten microns in diameter embedded perpendicularinto a halfsphere of matrix up to a length of 150 microns. The fragmentation test model of 400microns in length corresponds to one half of a fragment, applying symmetry conditions at theedges. For both specimens, axisymmetrical finite element meshes are used (figs. 1a, 1b). Themeshes are strongly refined around the interface with respect to the high stress gradientsarising
there. In the interface, contact elements are defined together with links between the twoanticipated crack faces, which can be removed in order to simulate the crack propagation. Theaim of the present analysis is to study of the variation of the interfacial stresses and of theenergy release rate during interfacial failure. To this end, the propagation of an interface crackis simulated, however, not controlled by a failure criterion but prescribed externally.

Proceedings of ICCM–11, Gold Coast, Australia, 14th-18th July 1997
V - 865
FAILURE PROCESS IN PULL-OUT AND FRAGMENTATION TESTS
The process of interfacial failure is totally different in the pull-out and in the fragmentationtest. If the initial stresses due to the thermal mismatch of fiber and matrix or due to curing arenot taken into account, the interfacial stresses in the pull-out test build up continuously withthe increase of the external force up to the initiation of the interface crack. In thefragmentation test, on the other hand, the loading of the interface starts abruptly with thebreakage of the fiber. This is, the interface is loaded rather statically in the pull-out test whiledynamically in the fragmentation test. A further essential difference between the respectivetests is the correlation between the prescribed external load and the loading of the interface.While the load at failure initiation is correlated to the strength of the interface in the pull-outtest, it is correlated to the fiber strength in the fragmentation test. This means that the onset ofinterfacial failure cannot be controlled by the external force in the fragmentation test.Therefore, the crack propagates unstably after the breakage of the fiber. Furthermore, the typeof crack is different. In the pull-out test, a pure interface crack arises while in thefragmentation test it is often observed that the interface crack is preceded by short matrixcracks, both, in 90° and 45° direction [14].
STRESS FIELD AROUND THE INTERFACE
The stress field around the interface arising in the pull-out and fragmentation test is analysedfor a glass fiber embedded in a polycarbonate matrix with a stiffness ratio of 32. Thespecimen is cooled down by 120°C, frictional stresses are not included at this stage. In thepull-out specimen, the thermal mismatch leads to an inhomogeneous stress field around theinterface. The fiber is under axial compressive stresses reaching a maximum in the middlepart (fig. 2).
The fiber stresses are accompanied by interfacial shear stresses which change their directionalong the fiber. Two maxima occur, one at the fiber entry and a second one at the fiber end. Inaddition, compressive radial stresses arise in the interface except of the fiber entry, where ahigh tensile stress maximum is encountered. If the pull-out force is applied, the compressive

Volume V: Textile Composites and Characterisation
V - 866
stress state is changed to tensile one, starting from the fiber entry (fig. 2, fig.3). However,during the first phase of the crack, still compressive stresses arise near the fiber end. With thefurther propagation of the crack, this zone decreases until the fiber is completely under tensilestresses.
By the application of the pull-out load, the shear stresses at the fiber entry are increased whilethey are decreased at the fiber end (fig. 2, fig. 4). With the initiation of the interface crack, themaximum at the fiber entry is further increased remaining almost constant during furthercrack propagation, while the average of the shear stresses grows due to the reduction of thestress transfer length. The radial tensile stress maximum at the fiber entry is also enhanced bythe application of the external force (fig. 5). However, it drops by an order of magnitude bythe initiation of the crack, again, remaining almost constant during further crack propagation.This is, while the radial tensile stresses are dominating before the onset of failure and are,accordingly, responsible for the crack initiation, the shear stresses are dominating during thefurther crack propagation. This is, the ratio of the failure modes changes with crack initiation.

Proceedings of ICCM–11, Gold Coast, Australia, 14th-18th July 1997
V - 867
In the fragmentation specimen, the effect of the thermal mismatch on the stresses around thefiber is rather small. If the specimen is loaded, the fiber is under constant axial tensile stressesexcept of the ends of the specimen. After fiber breakage, the fiber stresses decrease veryrapidly in the vicinity of the fiber break or, after crack initiation, at the crack tip, respectively(fig. 6). The maximum fiber stresses remain nearly unchanged by the crack extension.
Additionally, very high shear and radial compressive stresses arise in the interface near thebreak point (fig.7, fig.8). Both stress components are significantly decreased due to theinitiation of the interface crack. Contrary to the pull-out specimen, the interfacial failure isgoverned by shear stresses in the fragmentation test since the radial stresses are compressive.These give rise to frictional shear stresses in the debonded zone, consuming a lot of releasedstrain energy.

Volume V: Textile Composites and Characterisation
V - 868
ENERGY RELEASE RATE
In case of a perfect linear elastic material behaviour, the critical energy release rate does notdepend on the crack length. If the course of the energy released during crack propagation, forexample under fixed loads or fixed grips conditions, is known, the fracture process can becharacterised, i. e. stable or unstable phases can be discriminated. To this end, the energyrelease rate arising in the pull-out and fragmentation test is calculated. In the pull-out test,fixed load conditions are prescribed, corresponding to the level at failure initiation asobserved in the experiments. In the fragmentation test, fixed grips conditions are prescribed,corresponding to the strain to failure of the fiber. However, the unloading of the totalspecimen due to the propagation of the interface crack is very low, likewise resulting in analmost constant load. The force in the middle of the fiber decreases by only 0.7 % due to thefiber break and by 0.5% by a crack of two fiber diameters. This means, on the other hand, thatthe compliance of the fragmentation test specimen is rather insensitive against the cracklength.

Proceedings of ICCM–11, Gold Coast, Australia, 14th-18th July 1997
V - 869
Pull-out Test
The energy release rate arising in a pull-out test increases very slowly over a large range ofthe crack in case of a frictionless interface, if thermal stresses not taken into account [17]. Incase of a thermoplastic matrix, a large portion of energy is stored in the specimen as a resultof the cooling process. The fiber is compressed while the matrix around the fiber is undertensile stresses. If the interface crack propagates, this energy is released. Furthermore, theexternal work done by the pull-out force acting at the fiber tip is increased by the additionaldisplacement of the fiber tip as a result of the initial stresses. The energy release rate withoutthermal stresses increases slowly, until the crack approaches the fiber end, where the increasebecomes very steep (fig. 9). Due to the thermal stresses, the energy release rate is enhancedsignificantly. This is, the initial stresses have to be taken into account, if pull-out experimentsare evaluated. However, this part of stored energy is often neglected in the literature.
Fragmentation Test
The course of the energy release rate of a fragmentation test is totally different from that of apull-out test. With the breakage of the fiber, a large amount of stored energy is released,which is much higher than that dissipated by the fiber break. The unused energy causes anunstable interface or matrix crack. In general, both cracks may develop simultaneously. Theprocess occurring directly after fiber break is very complex and requires an analysis includingdynamical effects. However, no reliable local material data are given at present for therespective matrices under high speed conditions. The present analysis, therefore, is confinedto static conditions, which are valid for the second phase of stable crack propagation.
First, the released strain energy as a result of the fiber fracture and the interface crack isinspected. The total amount of released energy as well as the contributions of fiber andmatrix are shown in figure 10. By the fracture of the fiber, the fiber is unloaded, releasing alarge amount of strain energy. This value is represented by the starting point. At the sametime, the matrix is stressed additionally, consuming energy. This process continues during theextension of the interface crack. The accumulated released energy increases due to crackpropagation, however, with decreasing slope. Beyond a crack length of about one fiber radius,

Volume V: Textile Composites and Characterisation
V - 870
the released energy grows rather linearly, resulting in an almost constant energy release rate,as shown below.
The energy release rate of an interface crack is plotted in fig. 11 with and without interfacialfriction. The first point represents the energy released by the fiber break per cross-section ofthe fiber. In the first phase of the interface crack, the energy release rate is extremely high. Itdrops, however, to about 20% of the maximum value within a crack length of only 20% of thefiber diameter. Beyond this region, the energy release rate slightly decreases, leading to astable crack propagation. In order to get an estimation of the upper limit of the influence offriction, the same system is analysed allowing frictional stresses with a friction coefficient of1.0 As a result of friction, the energy release rate decreases significantly to about one quarterof the original value. This shows that the evaluation of test data requires the knowledge of thework of friction.

Proceedings of ICCM–11, Gold Coast, Australia, 14th-18th July 1997
V - 871
CONCLUSIONS
In general, the interfacial fracture toughness can be determined using pull-out andfragmentation tests. However, while in pull-out tests the compliance is sensitive against thecrack length, this is not true in case of the fragmentation test. This means, the fracturetoughness can be measured with an acceptable accuracy directly in the pull-out test, if thematrix is transparent and behaves rather brittle. In the fragmentation test, on the other hand,an additional theoretical analysis is needed. For such an analysis, the external force necessaryto cause a stable crack propagation must be measured. This may be complicated due to thefact that multiple fiber fractures and, accordingly, multiple interface cracks usually are presentin a fragmentation test. A further problem arising in the fracture mechanical evaluation is theexistence of radial cracks.
REFERENCES
1. Atkinson, C., Avila, J., Betz, E. & Smelser, R. E., "The rod pull out problem, theory andexperiment", Journal of the Mechanics and Physics of Solids, Vol. 30, 1982, pp. 97-120
2. Desarmot, G., Favre, J. P., "Advances in pull-out Testing", Composites Science andTechnology, Vol. 42, 1991, pp. 151-187
3. Marotzke, C., "The elastic stress field arising in the single fiber pull-out test",Composite Science and Technology, Vol. 50, 1994, pp. 393-405
4. Kelly, A., Tyson, W. R., "Tensile properties of fibre reinforced metals: copper/tungstenand copper/molybdenium,", Journal of the Mechanics and Physics of Solids, Vol. 13,1965, pp. 329-350
5. Piggott, M. R., Load bearing fibre composites, Pergamon Press, Oxford, 1980
6. Hsueh, C. H., "Elastic load transfer from partially embedded axially loaded fibre tomatrix", Journal of Materials Science Letters, Vol. 7, 1988, pp. 487-500
7. Marotzke, C., "Influence of the fiber length on the stress transfer from glass and carbonfibers into a thermoplastic matrix in the pull-out test", Composite Interfaces, Vol. 1,1993, pp. 153-166
8. Piggott, M. R., Xiong, Y. J., "Visualisation of debonding of fully and partiallyembedded glass fibres in epoxy resins", Composite Science and Technology, Vol. 52,1995, pp. 535- 540
9. Hampe, A., Marotzke, C., "The fracture toughness of glass fibre/polymer matrixinterfaces: measurement and theoretical analysis", Proceedings of the thirdInternational Conference on Deformation and Fracture of Composites, Surrey, 1995
10. Y. C. Gao, Y. W. Mai and B. Cotterell, "Fracture of fiber reinforced materials", Journalof Applied Mathematics and Physics (ZAMP), Vol. 39, 1988, pp. 550-572

Volume V: Textile Composites and Characterisation
V - 872
11. Liu, H.-Y., Mai, Y.-W., Zhou, L.-M., Ye, L., "Simulation of the fibre fragmentationprocess by a fracture mechanics analysis", Composites Science and Technology, Vol.52, 1994, pp. 253-260
12. Beckert, W., Lauke, B., "Fracture mechanics finite element analysis of debonding crackextension for a single-fibre pull-out specimen", Journal of Materials Science Letters,Vol. 14, 1995, pp. 333-336
13. Kerans, T. A. Parthasarathy, "Theoretical analysis of the fiber pullout and pushouttests", Journal of the American Ceramic Society, Vol. 74, 1991, pp. 1585-1596
14. Pegoretti, A., Accorsi, M. L., DiBenedetto, A.T., "Fracture toughness of fiber-matrixinterface in glass-epoxy composites, Journal of Materials Science, Vol. 31, 1996,pp.6145-6153
15. Wagner, H. D., Nairn, J. A., Detassis, M., "Toughness of interfaces from initial fiber-matrix debonding in a single fiber composite fragmentation test", Applied CompositeMaterials, Vol. 2, 1995, pp. 107-117
16. Charalambides, M., Kinloch, A. J., Wang, Y., Williams, J. G., "On the analysis ofmixed-mode failure", International Journal of Fracture, Vol. 54, 1992, pp. 269-291
17. Marotzke, C., Qiao, L., "Determination of the interfacial fracture toughness usingmicromechanical tests", Proceedings of the seventh European Conference on CompositeMaterials, London, 1996, Vol. 2, Woodhead Publishing Limited, Cambridge, pp. 17-22crack was propagated fifty millimetres before the test specimen was unloaded. Thefoam-based systems E and F were not evaluated in this part of the study.
Proceedings of ICCM–11, Gold Coast, Australia, 14th-18th July 1997
V - 873
FINITE ELEMENT ANALYSIS OF TEST METHODSFOR THE DETERMINATION OF THROUGH-
THICKNESS PROPERTIES INTENSION,COMPRESSION AND SHEAR OF LONG FIBRE
REINFORCED COMPOSITES
S. Mespoulet1, J.M. Hodgkinson1, F.L. Matthews1, D. Hitchings2, P. Robinson2
1 Centre for Composite Materials, 2 Department of AeronauticsImperial College of Science, Technology and Medicine
Prince Consort Road, London SW7 2BY, United Kingdom
SUMMARY: The detailed design of 3D laminated structures has shown the need for reliablemethods for measuring the through-thickness mechanical properties of composite materials.In this work, finite element studies have been conducted in order to develop suitable testmethods for the determination of the through-thickness strengths and elastic constants intension, compression and shear. For these three loading cases, the specimens are loadeddirectly either normally or in shear. In both cases of direct normal and shear loading, twospecimen designs are proposed: a parallel-sided block for the determination of the elasticconstants only and an elliptically-waisted specimen for the determination of both the elasticconstants and strength.
KEYWORDS: through-thickness, mechanical properties, test method, finite element, shear,tension, compression
INTRODUCTION
The structural design of laminated components is largely dependent on the accurate input ofthe material mechanical properties in tension, compression and shear. Standardised testmethods exist for the evaluation of most of the in-plane elastic constants and strengthparameters. As long as the design approach remains two-dimensional, this is sufficient.However, structures have become more complex 3D arrangements for the design of which thethrough-thickness (TT) material mechanical properties are also required. No recognisedstandards exist for TT tension or compression testing. So far as shear is concerned, theIosipescu test technique [1] has out-of-plane possibilities [2,3] but, in that case, thedetermination of the shear strength is erroneous since failure is more due to transverse tensionthan to shear [4].
Numerous attempts at developing suitable TT test methods have been undertaken and thesehave been reviewed elsewhere [5-7]. A suitable TT test method should make use of simplespecimens cut from laminates which are not too thick (thick laminates being difficult tomanufacture), ensure a pure and uniform stress state in the gauge section which leads to theexpected failure mode, rely on a direct and simple analysis and enable the determination of

Volume V: Textile Composites and Characterisation
V - 874
both elastic and strength parameters. Based on an extensive literature search [5], the mostpromising methods have been short listed. These have been studied with finite element (FE)methods for optimisation and tested experimentally for complete validation. The experimentalresults from tensile [8] and compressive [9] testing have already been reported. The presentarticle reports the results of the FE study for the investigated test methods. These are thedirect normal test method which has tensile and compressive possibilities and the direct sheartest method.
PRELIMINARY CONSIDERATIONS
Material Properties
The material properties used for the FE analysis are reported in table 1. They are those ofHexcel carbon/epoxy T300/914. The in-plane properties were determined by in-plane testingand, for these, the coefficients of variation are given in brackets in the table. Thedetermination of the other properties is based on the assumption of material transverseisotropy. All the FE analyses were conducted on unidirectional (UD) material.
Table 1: Mechanical properties data for FE input (UD Carbon/Epoxy T300/914)
Elastic Properties Strength Properties (MPa)E1 (GPa) 129 (3.3%) σ1tu 1434 (7.6%)
E2 (GPa) 9.5 (1.6%) σ1cu 1318 (7%)
E3 (GPa) 9.5 σ2tu 48 (8.3%)
G12 (GPa) 4.7 (1.3%) σ2cu 215 (9.1%)
G23 (GPa) 3.2 σ3tu 48
G31 (GPa) 4.7 σ3cu 215
ν12 0.34 (6.4%) τ12u 79 (8%)
ν23 0.5+ τ23u 79
ν13 0.34 τ31u 79
+ Data from references [11,12]
Finite Element Study
The FE package used for this study is FE77, the in-house system of the Department ofAeronautics at Imperial College. All the analyses were performed in the linear elastic region.The 2D and 3D meshes were built up with 8-noded and 20-noded brick elements respectivelywith parabolic-shaped interpolation functions. Output average stresses were interpolated fromthe stresses at the Gauss points. The 3D Hill failure criterion was introduced into the code inorder to locate the failure initiation.

Proceedings of ICCM–11, Gold Coast, Australia, 14th-18th July 1997
V - 875
DIRECT NORMAL TEST METHOD
Several authors have investigated this technique for TT parameters determination [2,10-13].In this method, a normal (tensile or compressive) load is applied in the TT direction of thelaminated specimen. There are several advantages to this method: simplicity of analysis,potential application to multi-directional laminates, determination of both elastic constantsand strength parameters. Its main drawback though is the use of fairly long specimens whichmeans that thick laminates have to be manufactured. The main objective of the FE analysishas therefore been to reduce as much as possible the specimen length while keeping a pureand uniform tensile or compressive stress state in the gauge section. Two specimen shapeshave been investigated: the parallel-sided block and the waisted specimen.
Parallel-Sided Block
The 3D FE model used is represented in figure 1. Since there are 3 planes of symmetry, only1/8 of the set-up needs to be meshed. The top surface of the model is completely constrainedin the (xy) plane and a displacement of 0.1mm is applied in the TT z-direction. The end blockmaterial properties are those of aluminium (E=72.4GPa, ν=0.3). The influence of thespecimen length to width ratio (L/W) on the stress state purity and uniformity has beeninvestigated.
Fig. 1: Parallel-sided block 3D FE model for normal testing

Volume V: Textile Composites and Characterisation
V - 876
The TT normal stress σ33 (equivalent to σzz) is highest at the interface between the specimenand the jig. Failure will therefore always occur at this location but the geometry may still besuitable for elastic constants determination, provided a sufficiently uniform σ33 can beachieved over an appropriate gauge length. The results also showed, that although secondarystresses (σ11, σ22, σ31 and σ23) are high at the interface, they decrease very rapidly awayfrom it and become significantly lower than σ33. The stress state can therefore be consideredpure at a short distance from the interface.
The uniformity of the stress state can be quantified by the parameter Cu(d) defined as follows:
Cu(d) = σ33min
σ33max on the (xy) plane at a distance d from the interface (see fig. 1)
with σ33min and σ33max being the minimum and maximum σ33 values respectively.
Figure 2 shows the curves Cu(d) for different specimen dimensions. As can be seen in thisfigure, a good uniformity (i.e. Cu>0.9) is obtained for specimen length to width ratios (L/W)of at least 2. In that case, Cu=0.9 at d=1/3 of L.
Further study for a laminated specimen attached to an epoxy end block (E=3GPa and ν=0.3)showed that the specimen length can be reduced to one specimen width and still achieve a Cuvalue of 0.9 at a distance d=1/3 of L from the interface.
Waisted Specimen
As noted in the previous section, parallel-sided blocks fail at the bond line due to stressconcentrations at this location. In order to avoid this problem, the specimen has to be waistedbut the shape of the waisted section must be designed carefully so as to avoid significantstress concentrations at the transition to the gauge section (see location M in fig. 3). Thedesign which proved the most successful for that purpose is an elliptically waisted specimen.The model is shown in figure 3. The parameter values are a=6mm, b=2mm, c=1mm, s=4mmand W=4mm.
d/L
Cu
(d)
0.5
0.6
0.7
0.8
0.9
1
0 0.1 0.2 0.3 0.4 0.5
L=W
L=1.5W
L=2W
L=3W
Fig. 2: Stress uniformity in parallel-sided blocks attached to aluminium end block

Proceedings of ICCM–11, Gold Coast, Australia, 14th-18th July 1997
V - 877
Waisted specimen for direct normal testing
Fig. 3 (left and centre): 3D FE Model Fig. 4 (right): Normalised σ33 contour plot
Figure 4 shows the normalised σ33 contour plot for this waisted specimen design ( is carried
out with regard to the average stress, σ33av, defined as the ratio of the reaction forcesresultant to the cross-sectional area in the gauge section). The maximum occurs at M with
σ33 at this location being 6% higher than σ33av. The Hill failure criterion is highest at the
location of maximum σ33 with σ33/σ33u, being the dominant term by far (σ33u is thecomposite tensile or compressive strength). This implies an essentially pure TT normal stressfailure, i.e. the other stresses do not contribute to failure. The value of σ33 at the interface isapproximately half the value in the gauge section. Provided the bond strength between theloading bar and the specimen is high enough, the failure will therefore occur within thespecimen in pure tension or compression.
The influence of variations in the semi-major axis, a, of the elliptical waisting on the stressconcentration at location M and at the interface has been investigated (leaving all the otherparameters constant at the values given above). For that purpose, the stress concentrationparameter Cc is introduced:
Cc=σ33max
σ33av with σ33max the maximum TT normal stress at M or at the interface
Figure 5 shows the results of this study.
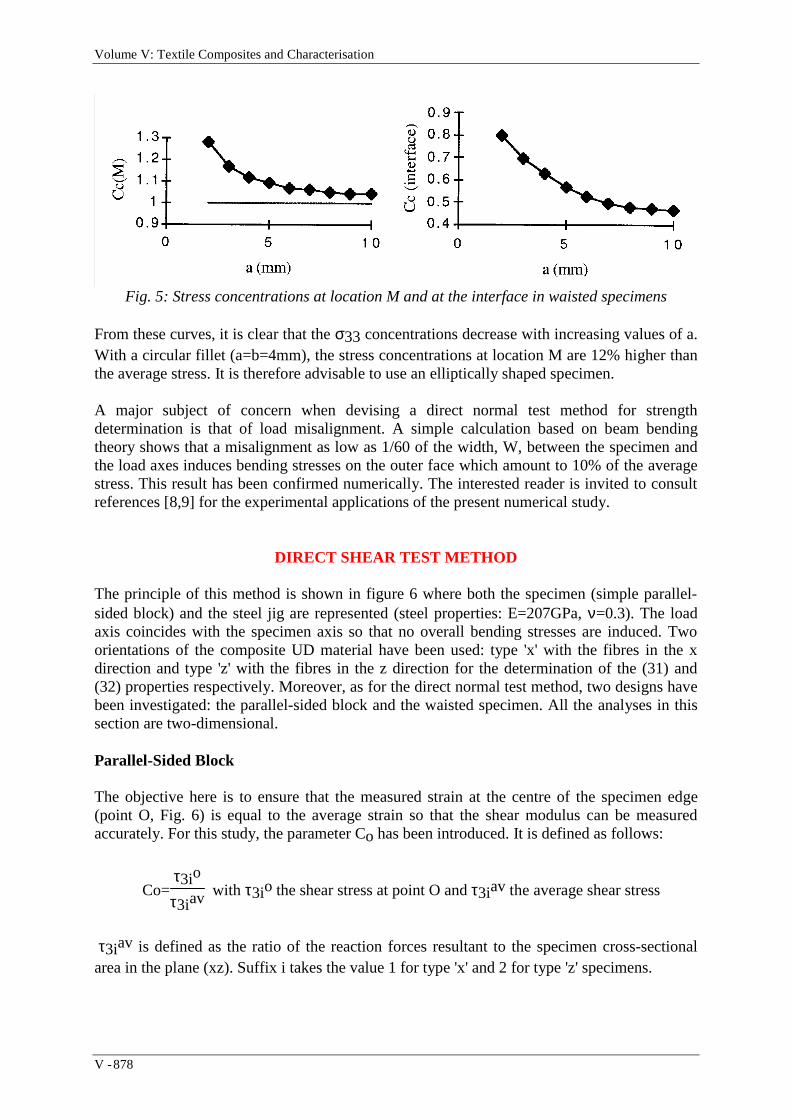
Volume V: Textile Composites and Characterisation
V - 878
Fig. 5: Stress concentrations at location M and at the interface in waisted specimens
From these curves, it is clear that the σ33 concentrations decrease with increasing values of a.With a circular fillet (a=b=4mm), the stress concentrations at location M are 12% higher thanthe average stress. It is therefore advisable to use an elliptically shaped specimen.
A major subject of concern when devising a direct normal test method for strengthdetermination is that of load misalignment. A simple calculation based on beam bendingtheory shows that a misalignment as low as 1/60 of the width, W, between the specimen andthe load axes induces bending stresses on the outer face which amount to 10% of the averagestress. This result has been confirmed numerically. The interested reader is invited to consultreferences [8,9] for the experimental applications of the present numerical study.
DIRECT SHEAR TEST METHOD
The principle of this method is shown in figure 6 where both the specimen (simple parallel-sided block) and the steel jig are represented (steel properties: E=207GPa, ν=0.3). The loadaxis coincides with the specimen axis so that no overall bending stresses are induced. Twoorientations of the composite UD material have been used: type 'x' with the fibres in the xdirection and type 'z' with the fibres in the z direction for the determination of the (31) and(32) properties respectively. Moreover, as for the direct normal test method, two designs havebeen investigated: the parallel-sided block and the waisted specimen. All the analyses in thissection are two-dimensional.
Parallel-Sided Block
The objective here is to ensure that the measured strain at the centre of the specimen edge(point O, Fig. 6) is equal to the average strain so that the shear modulus can be measuredaccurately. For this study, the parameter Co has been introduced. It is defined as follows:
Co=τ3io
τ3iav with τ3io the shear stress at point O and τ3iav the average shear stress
τ3iav is defined as the ratio of the reaction forces resultant to the specimen cross-sectionalarea in the plane (xz). Suffix i takes the value 1 for type 'x' and 2 for type 'z' specimens.

Proceedings of ICCM–11, Gold Coast, Australia, 14th-18th July 1997
V - 879
First, let us take the simple case of a block, made of type (x) material, at the top surface ofwhich a uniform displacement of 0.1 mm is applied in the x-direction, as shown on the left offigure 7. In the same figure, the curve on the right shows the variation of the parameter Cowith the ratio L/H. When this ratio is higher than 10, Co is close to 1 and the shear moduluscould therefore be determined accurately.
Fig. 6: Parallel-sided block 2D FE model for direct shear testing
Fig. 7: Co in type 'x' specimens of varying length subjected to uniform displacement
In practice however, the specimen will not be attached to an infinitely rigid material but to anelastic material. The edges will therefore be subjected to higher stresses than the middle.Figure 6 showed the model which accounts for this real situation. In this case, the specimenlength, L, and height, H, and the jig thickness, T, all influence the shear stress distribution inthe specimen. When L and T are kept constant, the shear stress uniformity along [AB] (seefigure 6) increases with increasing values of H and Co converges towards 1. For practicalpurposes, H was taken to be 8mm. This thickness enables strain gauges to be bonded at thecentre of the specimen edge while keeping the laminate thickness from which the specimenwill be cut relatively low. In this case, the influence of T and L on Co was investigated. Theresults of this study are shown in figure 8. As clearly seen on this graph, the higher the L/Tratio, the closer Co is to its converging value which is itself very close to the value calculated

Volume V: Textile Composites and Characterisation
V - 880
in the simple case of figure 7. For relatively long specimens (80mm and over), an acceptablelevel of stress uniformity (i.e. Co=0.95) is reached for high values of T (50mm and over).Practically, the steel jig thickness, T, should not be higher than 20mm for handling purposes.Therefore, shorter specimens have to be used.
Fig. 8: Left, C0 in type 'x' specimens attached to jig; and right, normalised shear stressdistribution along the horizontal mid line [AB] of the specimen
On the right of figure 8, two characteristic shear stress distribution curves are shown forL=20mm. When T=20mm (top curve), the shear stress curve is a plateau whereas whenT=2mm (bottom curve), the maximum shear stress occurs at a short distance from the edgesand then decreases to a minimum at point O. For the measurement of the shear modulus, thetop curve shape is more satisfactory. However, in this case, the value of the shear stress in the
plateau region is higher than the average stress, τ31av. This is due to the fact that the stressincreases progressively from 0 at the edge to its maximum value over a distance, l, which isnot negligible compared to L. After, the detailed analysis of 'plateau shaped' stress distributioncurves for L varying from 20 to 30mm and T=20mm, it has been found that l is constant andcan be approximated to 4mm (when L<20mm, the curve has got a maximum at O but no
plateau region). The modified average shear stress, τ31av(mod) can now be defined as F/(L-l) for an out-of-plane width equal to unity. Table 2 compares the values of Co, calculated
using τ31av and Co(mod), calculated using τ31av(mod) for 3 different specimen length. From
these results, it is clear that the use of l in the calculation of τ31av(mod) to account for thestress gradient at the edges enables the use of the simple type 'x' parallel-sided specimens forG31 measurement.

Proceedings of ICCM–11, Gold Coast, Australia, 14th-18th July 1997
V - 881
Table 2: Co and Co(mod) for parallel-sided specimens attached to jig (T=20mm, H=8mm)
Type 'x' Specimens Type 'z' SpecimensCo Co(mod) Co Co(mod)
L=20mm 1.21 0.97 1.35 1.02L=25mm 1.16 0.98 L=16mm 1.23 1.00L=30mm 1.12 0.97
The results for type 'z' material are similar. However, being less stiff in the loading direction,the 'plateau-shaped' shear stress distribution occurs only for specimens with a length lowerthan 16mm (and higher than 12mm) and the length l is equal to 3mm. The values of Co andCo(mod) are given in table 2. Here again, Co(mod) gives better results. Provided l can beestimated, the parallel-sided specimen provides therefore with an accurate measurement ofG23.
Waisted Specimen
The previous parallel-sided specimens fail at the corners where very high stressconcentrations occur. It is necessary to reduce the specimen cross-section in the middle so asto avoid this phenomenon and achieve failure within the specimen. This will occur if thespecimen is waisted as shown in figure 9. However, two other problems have to be tackled.Firstly, the shear stress concentrations in the region of high curvature are high. Secondly, thetransverse tensile stress is still significant. The ratio of transverse tensile to shear stress isindeed close to unity for this type of geometry. As the transverse tensile strength is lower thanthe shear strength (see table 1), the specimen is more likely to fail in tension than in shear.
In order to lower the shear stress concentrations and reduce the transverse tensile stress, epoxyend blocks have been added to the composite specimen as shown in figure 9. However, this isnot sufficient to reduce the tensile stresses to an acceptable level. Therefore, a TTcompressive load has been applied together with the longitudinal load in order to "close" thespecimen and this has been achieved by applying a force F inclined to the axis of thespecimen as shown in figure 9.
For the study of this model, a shear stress concentration coefficient, C3i, and a transversetensile stress coefficient, C33, are introduced. They are defined as follows:
C3i = τ3imax
τ3iav and C33 = σ33max
τ3iav
with τ3imax and τ3iav, the maximum and average shear stress respectively, σ33max, themaximum TT tensile stress and suffix i takes the value 1 for type 'x' and 2 for type 'z'
specimens. τ3iav is derived as follows:
τ3iav = Fx
WLeff with Leff = L+2e
GepG3i

Volume V: Textile Composites and Characterisation
V - 882
where Fx is the applied longitudinal force, W, the out-of-plane specimen width, Leff, theeffective length along x and Gep, the epoxy shear modulus.
After a thorough investigation of the geometrical and loading parameters, an acceptabledesign was found to be as follows: L=30mm, a=30mm, b=5mm, e=9mm, T=20mm andα=0.2. In this case, C31=1.013 and C33=0.401. Figure 10 shows the normalised shear stress
contour plot. τ31max occurs in the region labelled 'MAX', at the interface between thecomposite and the epoxy (after a convergence study was carried out, it was found that thevalue was not singular). σ33max also occurs at the interface between the composite and theepoxy.
The sensitivity of the model to the different parameters has been studied. Table 3 shows theeffect of increasing separately parameters L, a, e and α by 10% on the stress coefficients C31and C33. The maximum variation of C31 and C33 is 2%. Clearly, the maximum shear andtransverse tensile stresses are not too sensitive to minor changes in the geometry and loadingconditions. The determination of τ31u should therefore be accurate provided the bond of theepoxy to the composite is stronger than the composite and this strength will not be toosensitive to experimental imprecision.
For the measurement of the shear strength τ32u, the reference model has been run with type(z) material. The output of the FE analysis is: C32=1.016 and C33=0.279. Compared to thetype (x) specimen, the determination of the shear strength is as accurate (less than 2% error)and the maximum transverse tensile stress in the composite is 30% lower. This specimen istherefore suitable for the determination of τ32u.
Fig. 9: Waisted specimen 2D FE model for direct shear testing

Proceedings of ICCM–11, Gold Coast, Australia, 14th-18th July 1997
V - 883
Fig. 10: Normalised τ31 contour plot in the shear waisted specimen
Table 3: Sensitivity study of the waisted specimen under direct shear loading
L a e α C31 C33Reference 30 30 9 0.2 1.013 0.401Increase L (+10%) 33 30 9 0.2 1.031 (+1.8%) 0.405 (+1%)Increase a (+10%) 30 33 9 0.2 1.012 (-0.1%) 0.396 (-1.2%)Increase e (+10%) 30 30 9.9 0.2 1.015 (+2%) 0.409 (+2%)Increase α (+10%) 30 30 9 0.22 1.013 (±0%) 0.393 (-2%)
CONCLUSIONS
FE analysis has been used to design suitably shaped specimens for through-thicknesscompression, tension and shear testing for the determination of elastic constants and strengthof unidirectional laminated carbon fibre reinforced epoxy (Hexcel T300/914). Thecompression and tension test method, called the "direct normal test method", involves aspecimen under direct normal loading. Two specimen designs are proposed. Firstly, a parallel-sided block with a square cross-section which allows only the determination of the elasticconstants. Its length to width ratio depends on the material to which it is attached. If attachedto a stiff material (e.g. aluminium), this ratio is 2. If attached to a soft material (e.g. epoxy),the ratio can be reduced to 1. Secondly, a waisted specimen design is proposed, allowing themeasurement of both the elastic constants and the strength. It has a central gauge section of4mm square cross-section widening to 8mm square at the ends via elliptically shaped fillets.Its total length is 16mm.
The shear test method, called the "direct shear test method", involves a specimen under directshear loading. Only a 2D FE analysis has been carried out. Two specimen designs are againproposed. Firstly, as for the direct normal test method, a parallel-sided block specimen hasbeen developed. It allows the determination of the shear moduli, provided the area understress is corrected to account for stress gradients occurring at the specimen edges. Thespecimen thickness is 8mm while its length depends on the laminate orientation. Forspecimens with fibres in the loading direction, the length is between 20 and 30mm whereasfor specimens with fibres normal to the loading direction, it is comprised between 12 and16mm. Secondly, a waisted specimen is proposed for the determination of the shear strength
(τ31u and τ32u). In order to minimise the shear stress concentrations and the transversetensile stress, the design makes use of epoxy end blocks. Moreover, the loading involves aclosing force, normal to the specimen longitudinal axis.

Volume V: Textile Composites and Characterisation
V - 884
ACKNOWLEDGEMENTS
The authors wish to acknowledge the financial support of the EPSRC under grant numberGR/K33705. Prepregs and autoclave consumables were gratefully received from HexcelComposites and Westland Helicopters. The authors would also like to acknowledge usefuldiscussions with Dr WR Broughton of the National Physical Laboratory, Dr K Sagoo ofWestland Helicopters, Mr PE Brooks and Mr P Allen of Hexcel Composites and Dr J Lockettof the Polymer Engineering Group.
REFERENCES
1. "Standard Test Method for Shear Properties of Composite Materials by the V-NotchedBeam Method", Annual Book of ASTM Standards, Section 15, Vol.15.03, 1993, ASTMD5379-93, ASTM, Philadelphia, PA, USA
2. Hodgkinson, J.M., Ayache, S., Matthews, F.L., "In-Plane and Out-of Plane PropertyMeasurements on Thick Woven Glass/Polyester Laminates", Proc. ECCM, Amsterdam,European Association for Composite Materials, 1992
3. Hodgkinson, J.M., Bertholet, H., "Out-of-Plane Shear Property Measurements on CFRPLaminates", Proc. 2nd Int. Conf. on Deformation and Fracture of Composites,Manchester, UK, Institute of Materials, 1993
4. Morton, J., Ho, H., Tsai, M.Y., Farley, G.L., "An Evaluation of the Iosipescu Specimenfor Composite Materials Shear Property Measurement", J. Comp. Mat., Vol.26, No.51992, pp.708-750
5. Mespoulet, S., "Design, Development and Implementation of Through-Thickness TestMethods for Laminated Composite Materials", MPhil/PhD Transfer Report, Centre forComposite Materials, Imperial College, London, UK, 1995
6. Broughton, W.R., Sims, G.D., "An Overview of Through-Thickness Test Methods forPolymer Matrix Composites", Report DMM(A)148, National Physical Laboratory,Teddington, UK, 1994
7. Curtis, P.T., Broadley, B.P., "A Review of Test Methodology for the Measurement ofthe Through-Thickness Properties of Polymeric Composites", ReportDRA/MAT.STR/TR93065/1, Defence Research Agency, Farnborough, UK, 1993
8. Mespoulet, S., Hodgkinson, J.M., Matthews, F.L., Hitchings, D., Robinson, P., "A NovelTest Method to Determine the TT Tensile Properties of Long Fibre ReinforcedComposites", Proc. ECCM-7, Woodhead Publishing Ltd., London, UK, Vol.2, 1995,pp.131-137
9. Mespoulet, S., Hodgkinson, J.M., Matthews, F.L., Hitchings, D., Robinson, P., "TheDevelopment of a Through-Thickness Compression Test for Laminated CFRP", Proc. 4thInt. Conf. on Deformation and Fracture of Composites, Manchester, UK, Institute ofMaterials, 1997

Proceedings of ICCM–11, Gold Coast, Australia, 14th-18th July 1997
V - 885
10. Roy, A.K., Ran, Y.K., "Interlaminar Normal Stiffness and Strength of Thick OrthotropicLaminates: an Experimental Study", J. Reinf. Plast. Comp., Vol. 13, 1994, pp.880-894
11. Kim, R.Y., Abrams, F., Knight, M., "Mechanical Characterization of a Thick CompositeLaminate", Integrated Comp.., 3rd Inter. Technical Conf., Seattle, 1988
12. Daniel, I.M., Hsiao, H.M., Wooh, S.C., "Processing and Compressive Behavior of ThickComposites", Mechanics of Thick Composites, Symposium, ASME, Vol.162, 1993, pp.107-126
13. Lagace, P.A., Weems, D.B., "A Through-the-Thickness Strength Specimen forComposites", ASTM STP, No.1003, CC Chamis, Ed., ASTM, Philadelphia, PA, USA,1989, pp.197-207
Volume V: Textile Composites and Characterisation
V - 886
LOOP TEST FOR THE STRENGTH OFMONOFILAMENTS
Horishi Fukuda Masayuki Yakushiji and Atsushi Wada
Department of Materials Science and Technology, Science University of Tokyo, Yamazaki,Noda, Chiba 278, Japan
KEYWORDS: strength of monofilaments, loop test combined with elastica theory, opticalfiber, carbon fiber

Proceedings of ICCM–11, Gold Coast, Australia, 14th-18th July 1997
V - 887

Volume V: Textile Composites and Characterisation
V - 888

Proceedings of ICCM–11, Gold Coast, Australia, 14th-18th July 1997
V - 889

Volume V: Textile Composites and Characterisation
V - 890

Proceedings of ICCM–11, Gold Coast, Australia, 14th-18th July 1997
V - 891
Fig. 8: Shape of carbon monofilament during the test
10 µm

Volume V: Textile Composites and Characterisation
V - 892
Proceedings of ICCM–11, Gold Coast, Australia, 14th-18th July 1997
V - 893

Volume V: Textile Composites and Characterisation
V - 894
A CRITICAL EVALUATION OF THROUGH-THICKNESS TEST METHODS
William R. Broughton
Composites and Polymers Properties BranchCentre for Materials Measurement and Technology, National Physical Laboratory
Queens Road, Teddington, Middlesex, TW11 0LW, United Kingdom
SUMMARY: This paper critically evaluates a number of through-thickness test methods interms of key factors relating to fibre format or architecture, matrix type, load introduction,specimen preparation and the potential for standardisation. Consideration is given to both thepracticality of using a test method in an industrial environment, in terms of ensuring "fitness forpurpose" and to the degree of uniformity of stress distributions throughout the test geometry.The evaluation is based on a comprehensive database obtained from tests conducted on a rangefibre-reinforced plastic composites, including continuous and discontinuous, aligned, randomand woven fabric fibre formats in thermoset and thermoplastic matrices. In order to meet thechallenge, a number of new test geometries have been developed and experimentally evaluated.
KEYWORDS: polymer composites, through-thickness, test methods, tension, compression,elastic constants, strength, failure modes.
INTRODUCTION
An increasing demand for intrinsic through-thickness (T-T) strength and stiffness properties foruse as input data for design and analysis of polymer matrix composite (PMC) structures hasstimulated the development of T-T test methods. T-T tensile, compressive and shear propertiesare frequently required for both "thick" section applications and for "thin" sections where there isa concern that two-dimensional analysis is inadequate. There is a tendency to associateinterlaminar stresses with "thick" sections, however, interlaminar stresses and strains may beinduced in "thin" laminates through the application of membrane (ie in-plane) loads. In anattempt to generate this data, it has become apparent that methods applicable to conventionalmetallic materials are not suitable for testing PMCs. The unique and diverse nature of PMCs,introduces additional problems relating to anisotropy, low T-T tensile and shear properties,coupling effects and the relative difficulties of producing laminates of adequate thickness. Theseproblems have provided a major challenge to researchers in finding solutions in order to generatereliable engineering data.
This paper critically evaluates a number of test methods for measuring T-T properties undertensile, compressive and shear loads. Each method is examined in terms of the level ofstandardisation, elastic and strength properties obtained, material suitability, material thicknessrequirements, specimen fabrication, test apparatus, methods of data measurement and datareduction procedures. The evaluation is based on a comprehensive database obtained from testsconducted on a range PMCs, including continuous and discontinuous, aligned, random and

Proceedings of ICCM–11, Gold Coast, Australia, 14th-18th July 1997
V - 895
woven fabric fibre formats in thermoset and thermoplastic matrices. In order to meet thechallenge a number of new test geometries have been developed and experimentally evaluated.
The experimental results clearly demonstrate that many of the mechanical test methods evaluatedproduce reliable engineering data required for quality assessment and design. A number of thesetest methods are suitable for development into ISO standards. The paper containsrecommendations and guidance as to the use of the remaining test methods.
THROUGH-THICKNESS TENSION AND COMPRESSION
This section provides a brief description of three directly loaded configurations that can be usedto evaluate T-T tension and/or compression properties of PMCs:
• Rectangular (unwaisted) block• Short waisted rectangular block with a plain radius gauge-section• I-section
Waisted (Fig. 1) and unwaisted rectangular (ie parallel-sided) specimens can be loaded in eithertension or compression, along the T-T axis. In tension, the load is introduced via reusablestainless steel or aluminium loading bars, adhesively bonded to the specimen. Compressive loadis applied by placing the specimen between two hardened steel parallel platens with the specimenlocated at the centre of the platens in closely fitting recesses. A four pillar die set is often used toensure uniform loading to the ends of the specimen. Commercial units are available at areasonable price. The two geometries are complementary, with waisted and parallel-sidedblocks providing strength and elastic property data, respectively.
Fig. 1: Waisted block specimens: (left) plain radius; and (right) DERA.
Bonding loading bars to fibre-reinforced thermoplastics (eg glass-fibre reinforcedpolypropylene) is an extremely difficult task. Commercial grade adhesives proved ineffective.Although, surface treatments, such as corona discharge and flame treatment may enhanceadhesion, these techniques require expensive equipment, an economic option unavailable to mostmechanical test laboratories. An alternative approach, developed at the National PhysicalLaboratory (NPL), uses an I-section, where the load is applied to the specimen via the top andbottom flanges by two sets of hardened stainless steel stirrups (Fig. 2). The I-section is onlysuitable for measuring T-T tensile strengths.

Volume V: Textile Composites and Characterisation
V - 896
Fig. 2: I-section tensile specimen
Tables 1 and 2 compare T-T tensile and compressive data obtained from a diverse range ofPMCs that have been tested by the three methods. Note that default values given in Tables 1 and2 are bracketed (ie elastic properties assumed to be symmetric in the X-Z and Y-Z planes).Elastic and strength property measurements were in reasonable agreement with correspondingdata [1] obtained from tests carried out by the Defence Evaluation Research Agency (DERA),using a waisted block specimen, developed at Fort Halstead. The DERA waisted blockspecimen (Fig. 1), which has a nominal T-T dimension of 38 mm, can be used to measure T-Telastic and strength properties in both tension and compression.
Rectangular Block
Square cross-section specimens, 15 mm square, with T-T dimensions (ie thickness) ranging from18 to 40 mm were machined from a range of PMCs (see Tables 1 and 2). This test geometryprovides consistent and reliable elastic property data for both monolithic and layered (iesandwich constructions) materials, and is amenable to standardisation for this purpose. The testgeometry is unsuitable for generating strength data. According to stress analysis [2], a length-to-width ratio of 2:1 should be sufficient to guarantee a relatively uniform stress state at thespecimen mid-section (ie negligible end-effects), and prevent the possibility of buckling whenloaded in compression. Elastic properties were approximately the same; independent of laminatethickness, test method or loading mode. The coefficient of variation (CV) for Ezz was generallyless than 5.
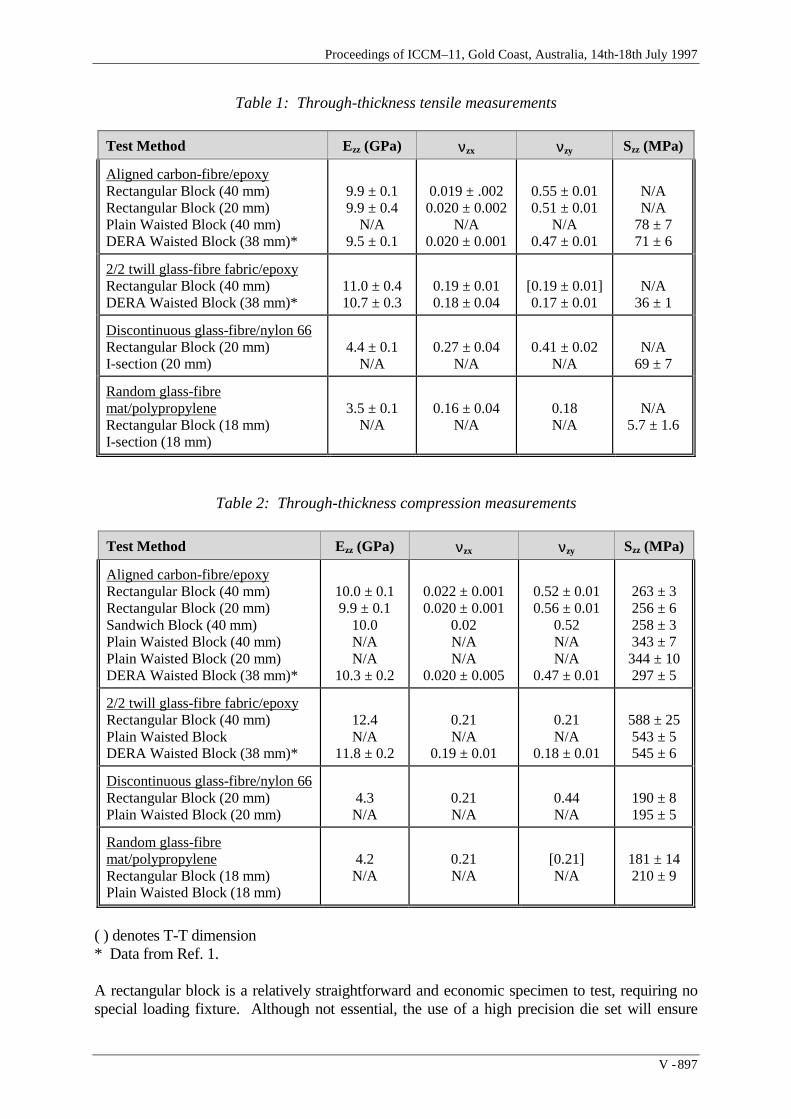
Proceedings of ICCM–11, Gold Coast, Australia, 14th-18th July 1997
V - 897
Table 1: Through-thickness tensile measurements
Test Method Ezz (GPa) νzx νzy Szz (MPa)
Aligned carbon-fibre/epoxyRectangular Block (40 mm)Rectangular Block (20 mm)Plain Waisted Block (40 mm)DERA Waisted Block (38 mm)*
9.9 ± 0.19.9 ± 0.4
N/A9.5 ± 0.1
0.019 ± .0020.020 ± 0.002
N/A0.020 ± 0.001
0.55 ± 0.010.51 ± 0.01
N/A0.47 ± 0.01
N/AN/A
78 ± 771 ± 6
2/2 twill glass-fibre fabric/epoxyRectangular Block (40 mm)DERA Waisted Block (38 mm)*
11.0 ± 0.410.7 ± 0.3
0.19 ± 0.010.18 ± 0.04
[0.19 ± 0.01]0.17 ± 0.01
N/A36 ± 1
Discontinuous glass-fibre/nylon 66Rectangular Block (20 mm)I-section (20 mm)
4.4 ± 0.1N/A
0.27 ± 0.04N/A
0.41 ± 0.02N/A
N/A69 ± 7
Random glass-fibremat/polypropyleneRectangular Block (18 mm)I-section (18 mm)
3.5 ± 0.1N/A
0.16 ± 0.04N/A
0.18N/A
N/A5.7 ± 1.6
Table 2: Through-thickness compression measurements
Test Method Ezz (GPa) νzx νzy Szz (MPa)
Aligned carbon-fibre/epoxyRectangular Block (40 mm)Rectangular Block (20 mm)Sandwich Block (40 mm)Plain Waisted Block (40 mm)Plain Waisted Block (20 mm)DERA Waisted Block (38 mm)*
10.0 ± 0.19.9 ± 0.1
10.0N/AN/A
10.3 ± 0.2
0.022 ± 0.0010.020 ± 0.001
0.02N/AN/A
0.020 ± 0.005
0.52 ± 0.010.56 ± 0.01
0.52N/AN/A
0.47 ± 0.01
263 ± 3256 ± 6258 ± 3343 ± 7344 ± 10297 ± 5
2/2 twill glass-fibre fabric/epoxyRectangular Block (40 mm)Plain Waisted BlockDERA Waisted Block (38 mm)*
12.4N/A
11.8 ± 0.2
0.21N/A
0.19 ± 0.01
0.21N/A
0.18 ± 0.01
588 ± 25543 ± 5545 ± 6
Discontinuous glass-fibre/nylon 66Rectangular Block (20 mm)Plain Waisted Block (20 mm)
4.3N/A
0.21N/A
0.44N/A
190 ± 8195 ± 5
Random glass-fibremat/polypropyleneRectangular Block (18 mm)Plain Waisted Block (18 mm)
4.2N/A
0.21N/A
[0.21]N/A
181 ± 14210 ± 9
( ) denotes T-T dimension* Data from Ref. 1.
A rectangular block is a relatively straightforward and economic specimen to test, requiring nospecial loading fixture. Although not essential, the use of a high precision die set will ensure

Volume V: Textile Composites and Characterisation
V - 898
uniform axial compressive loading. Specimen fabrication is uncomplicated and economical.Caution needs to be exercised to ensure that misalignment, at both the fabrication and testingstages is minimised. Small misalignments will induce bending, resulting in differential strains onopposing faces of the specimen. Specimens were machined to the required profile by wetgrinding.
Tensile specimens were adhesively bonded to the loading bars using a high strength, two partepoxy adhesive. For good alignment, it was essential that all faces were flat and parallel with theopposite surface, and perpendicular with adjacent surfaces. A room temperature curing adhesivewas used to avoid residual stresses at the adherend interface. During the curing process,specimens were held in a gluing fixture to ensure accurate alignment between the loading blocksand the loading axis.
A major disadvantage is in the number of strain gauges (4 biaxial rosettes) required for thehighest accuracy measurement of axial and transverse strain. A biaxial strain gauge with anactive length of 2 mm was bonded on each face of the specimen at the mid-section, with gaugesaligned parallel to and perpendicular to the loading direction. Strain averaging was used toaccount for possible bending strains. Strain gauge numbers could possibly be reduced if therewas sufficient confidence in the quality and alignment of the specimen. Axial and transverseextensometers can also be used to measure the T-T elastic properties of 40 mm thick materialloaded in tension (eg 2/2 twill fabric shown in Table 1). Extensometers are not particularlysuitable for use with thin tensile specimens or compression specimens. Data reduction isstraightforward with the applied stress, σ, given by:
(1)
where P is the applied force and A is the specimen cross-sectional area.
As expected, rectangular tensile specimens failed consistently at the adhesive joints between thespecimen and the metallic loading bars for all but the weakest materials, thus invalidating thestrength data obtained. Strength values obtained from compression tests were consistent towithin • 10%, and in reasonable agreement with the strength data obtained using the waistedblock geometries. In compression, failure invariably initiates at the specimen ends, independentof material anisotropy and degree of homogeneity. The presence of stress concentrations inthese regions causes premature failure, hence the lower strength value. This method is relativelyinsensitive to material flaws (eg porosity). A major problem with measuring T-T properties ofrelatively thin laminates (ie 10 mm thick) was surmounted, by adhesively bonding three layers ofmaterial together, to form a sandwich construction. A high strength, two part epoxy adhesivewas used to bond the layers together. Compression data obtained from tests on aligned carbon-fibre/epoxy, demonstrated the effectiveness of this approach.
Waisted Block (Plain Radius)
As previously mentioned, short rectangular columns of uniform cross-section are unsuitable forgenerating T-T strength data, as failure invariably occurs at the specimen ends. An alternativeapproach, is to use waisted specimens with either a circular or elliptical profile extending along

Proceedings of ICCM–11, Gold Coast, Australia, 14th-18th July 1997
V - 899
the entire gauge-length of the specimen [2-4]. The reduction in cross-sectional area, promotesfailure at the specimen mid-thickness. This relatively straightforward approach can be used tomeasure both T-T tensile and compressive strengths of monolithic and sandwich constructions.Compared to rectangular blocks, specimen fabrication is expensive and labour intensive.
A waisted specimen_with a plain radius along the entire gauge-length has been developed at theNPL (Fig. 1). This specimen has a nominal thickness of 40 mm, a fillet radius of 30 mm and 25mm square ends. The gauge-section is 32 mm long, with a cross-section approximately 16 mmsquare at the specimen mid-thickness. The large fillet radius (ie 30 mm) reduces the stressconcentration in the vicinity of the fillet root, although the stress state within the gauge-length isless uniform than an equivalent sized rectangular prism. This test geometry may be scaled downby a factor of 2, with minimal effect on compressive strength (Table 2). End effects increaseslightly with a reduction of thickness (ie height).
Fig. 3: Plain waisted block specimen
Specimen preparation, bonding procedure, loading configuration and test conditions are similarto those employed for rectangular block specimens. Alignment is critical for low-failure strainsystems, as bending stresses produced through eccentric loading can result in premature failure.The applied stress, σ, is determined using Equation (1), where A in this case is the mid-thicknesscross-sectional area of the specimen.
T-T tensile failure occurred in a plane orthogonal to the loading direction at the specimen mid-thickness. Shear is the predominant cause of failure in all fibre-reinforced plastic compositestested in compression; independent of the material microstructure. Failure is often instantaneousand catastrophic resulting in diagonal and interlaminar cracking, with failure modes generallyremaining unaffected by a reduction in specimen size. For woven fabrics, two orthogonalfracture plains can be observed at 45o to the T-T axis (Fig. 4).
Provided the adhesive joints have superior strength and fatigue performance than the compositematerial, waisted tensile specimens could be used under cyclic loading conditions.Environmental testing could also be performed with the same provision that the adhesive jointscan withstand the environmental conditions. In compression, this test geometry is compatible
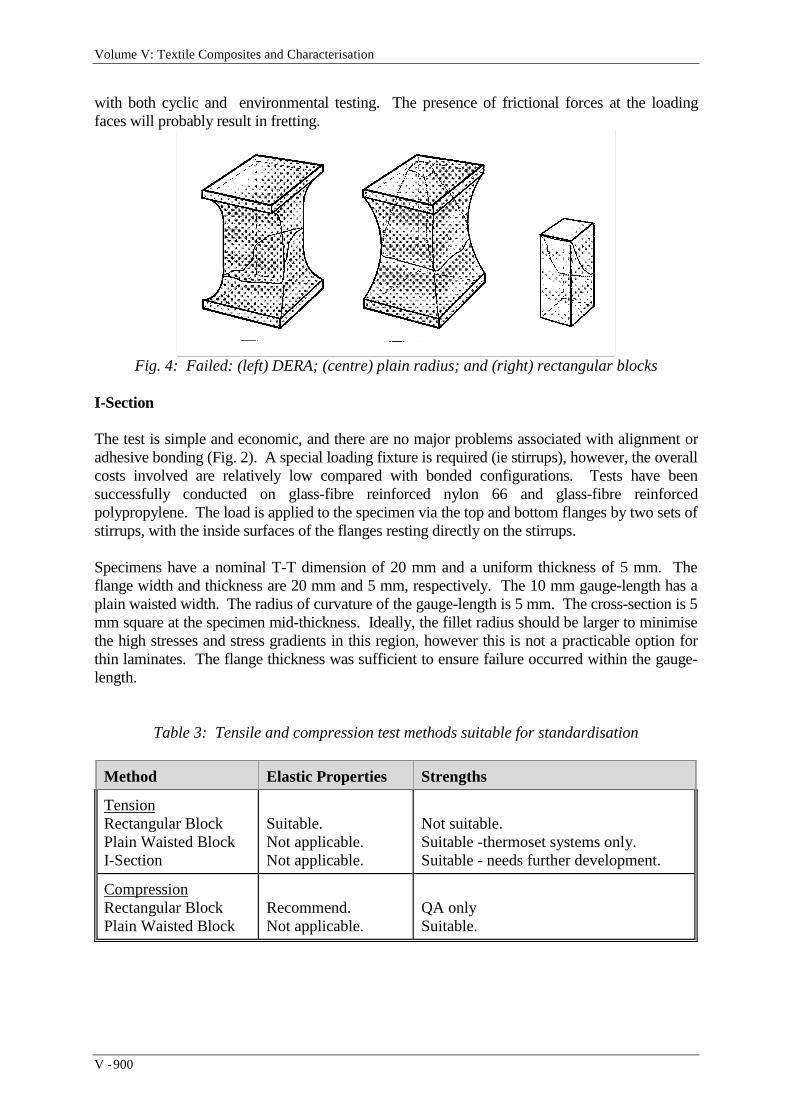
Volume V: Textile Composites and Characterisation
V - 900
with both cyclic and environmental testing. The presence of frictional forces at the loadingfaces will probably result in fretting.
Fig. 4: Failed: (left) DERA; (centre) plain radius; and (right) rectangular blocks
I-Section
The test is simple and economic, and there are no major problems associated with alignment oradhesive bonding (Fig. 2). A special loading fixture is required (ie stirrups), however, the overallcosts involved are relatively low compared with bonded configurations. Tests have beensuccessfully conducted on glass-fibre reinforced nylon 66 and glass-fibre reinforcedpolypropylene. The load is applied to the specimen via the top and bottom flanges by two sets ofstirrups, with the inside surfaces of the flanges resting directly on the stirrups.
Specimens have a nominal T-T dimension of 20 mm and a uniform thickness of 5 mm. Theflange width and thickness are 20 mm and 5 mm, respectively. The 10 mm gauge-length has aplain waisted width. The radius of curvature of the gauge-length is 5 mm. The cross-section is 5mm square at the specimen mid-thickness. Ideally, the fillet radius should be larger to minimisethe high stresses and stress gradients in this region, however this is not a practicable option forthin laminates. The flange thickness was sufficient to ensure failure occurred within the gauge-length.
Table 3: Tensile and compression test methods suitable for standardisation
Method Elastic Properties Strengths
TensionRectangular BlockPlain Waisted BlockI-Section
Suitable.Not applicable.Not applicable.
Not suitable.Suitable -thermoset systems only.Suitable - needs further development.
CompressionRectangular BlockPlain Waisted Block
Recommend.Not applicable.
QA onlySuitable.

Proceedings of ICCM–11, Gold Coast, Australia, 14th-18th July 1997
V - 901
THROUGH-THICKNESS SHEAR
The number of test methods that can be used for T-T shear characterisation is limited, with alltechniques demonstrating deficiencies. This section evaluates two methods that have beenwidely adopted for characterising T-T shear properties of PMCs, the double-notch and V-notched beam (Iosipescu) test methods. The V-notched beam method (ASTM D 5379 [5]) canprovide in-plane and T-T shear moduli for all isotropic and anisotropic materials, and in manycases the shear strength. The double-notch method, which consists of loading a non-symmetrically notched coupon in uniaxial tension or compression is used to measureinterlaminar shear strength. This method is available as ASTM D 3846 [6], and is quoted as anappendix to BS 4994 [7] and BS 6464 [8]. ASTM D 3846 specifies compressive loading, andthe two BSI standards tensile loading. Typical T-T shear data obtained using these methods isshown in Table 4. Default values are bracketed (ie assumed material symmetry in the X-Z andY-Z planes). Tests were conducted according ASTM specifications. Shear strengths obtainedusing the two test geometries were generally in good agreement [9].
Table 4: Through-thickness shear measurements (* = non-shear failure)
Test Method Gxz (GPa) Gyz (GPa) Sxz (MPa) Syz (MPa)
Aligned carbon-fibre/epoxyV-Notched BeamV-Notched Beam (sandwich)Double-Notch
5.30 ± 0.315.37N/A
2.93 ± 0.253.18N/A
111 ± 2105
75 ± 12
64 ± 9*52*N/A
2/2 twill glass-fibre fabric/epoxyV-Notched BeamDouble-Notch
4.12 ± 0.14N/A
[4.12 ± 0.14]N/A
68.4 ± 0.964.9 ± 1.8
[68.4 ± 0.9][64.9 ± 1.8]
Discontinuous glass-fibre/nylon 66V-Notched BeamDouble-Notch
1.68 ± 0.06N/A
-N/A
56.9 ± 3.6*66.4 ± 4.8
58.4 ± 4.8*[66.4 ± 4.8]
Random glass-fibremat/polypropyleneV-Notched BeamDouble-Notch
1.04 ± 0.04N/A
[1.04 ± 0.04]N/A
22.7 ± 0.818.1 ± 3.3
[22.7 ± 0.8][18.1 ± 3.3]
Double-Notch
Due to their simplicity, test geometries incorporating a double-notch have been widely employedin the measurement of interlaminar shear strength. The most reliable approach is to load adouble-notch specimen in compression, with the specimen supported along its entire length tominimise out-of-plane deformation, as specified in ASTM D 3846 (Fig. 5). Tests wereconducted using specimens 79.5 mm long and 10.0 mm wide (NB. ASTM D 3846 recommends12.7 mm). Two parallel notches, one on each opposite face of the specimen and 6.4 mm (0.25in) apart, were cut across the entire width of the specimen and centrally located along its length.The notch width was ± 1.5 mm and extended to the specimen mid-plane.

Volume V: Textile Composites and Characterisation
V - 902
Linear-elastic stress analysis has shown that the shear stress distribution along the mid-planebetween the notches is non-uniform with high shear stresses in the vicinity of the notches. Non-linear finite element analysis, conducted at the NPL, has indicated that the stress concentration atthe notches is close to unity for an isotropic specimen loaded according to ASTM 3846. Datareduction is simple, with the applied stress determined using Equation (1), where A is the cross-sectional area between the notches.
The method specified in ASTM 3846 is relatively straightforward to perform, requiring a supportfixture of moderate cost. This loading configuration provides consistent strength data withinterlaminar failure regularly occurring along the mid-plane joining the two notches. T-T shearstrength data is generally consistent with results obtained using the V-notched beam method,implying the shear stress concentration at the notches is close to unity (Table 3). Specimenpreparation and testing is relatively straightforward, although the quality of machining thenotches has a significant effect on strength data. Notch depth must be accurately machined to therequired depth of half the specimen thickness (ie mid-plane). Fractographic examination of thefailure surfaces reveals shear dominated mixed-mode failure. This method is particularly suitedto testing thin laminates (ie 2.5 to 10 mm thick).
Fig. 5: Double-notch and V-notched beam tests
V-Notched Beam Shear
This test employs a double edge-notched, flat, rectangular specimen. Tests were carried out onmonolithic materials, and a three-layered sandwich construction, according to ASTM D 5379using the loading configuration shown in Fig. 5. Specimens were 76 mm in length, 20 mm wide(ie T-T dimension) and 5 mm thick (nominal). Two 90o angle notches with a notch root radiusof 1.3 mm were machined at the edge mid-length with faces oriented at ± 45o to the longitudinalaxis, to a depth of 20% of the specimen width (ie 4 mm). Shear strain was measured by bondingtwo biaxial strain gauges, one on each opposite face of the specimen at its centre in the area

Proceedings of ICCM–11, Gold Coast, Australia, 14th-18th July 1997
V - 903
between the notches. The strain gauges had an active gauge-length of 1 mm and were aligned at± 45o to the longitudinal axis of the specimen. Applied stress is determined from Equation (1),where A is the cross-sectional area between the notches.
Providing adequate material thickness is available (ie 10 mm), this method can be used tomeasure in-plane and T-T shear modulus and shear strength (Table 3) for a diverse range ofcomposite materials. Differences between shear moduli, due to out-of-plane deformation, can beas high as 10% for a batch of nominally identical specimens. To ensure maximum accuracy,shear modulus is determined from the average response of back-to-back biaxial rosettes. Atpresent the standard requires only one specimen from a batch to be tested in this mannerprovided the amount of twist for this test piece is no greater than 3%.
Table 5: Shear test methods suitable for standardisation
Method Elastic Properties Strengths
Double-NotchV-Notched Beam
Not applicable.Strongly recommend.
Strongly recommend.Strongly recommend - caution on failuremode.
ACKNOWLEDGEMENTS
The research reported in this paper was carried out as part of the "Materials MeasurementProgramme", a programme of underpinning research financed by the United KingdomDepartment of Trade and Industry. The author acknowledges the contributions his colleagues DrGraham Sims and Miss Maria Lodeiro at the National Physical Laboratory, and Mr RobertFerguson, Defence Research Agency at Fort Halstead.
REFERENCES
1. Ferguson, R.F., Hinton, M.J. and Wilson, C.J., private communication 1996.
2. Mespoulet, S., "Through-Thickness Test Methods for Laminated Composites", Centre forComposite Materials, Imperial College, London, United Kingdom, February 1995.
3. Mespoulet, S., Hodgkinson, J.M., Matthews, F.L., Hitchings, D. and Robinson, P., "ANovel Test Method to Determine the Through-Thickness Tensile Properties of Long FibreReinforced Composites", Proceedings of ECCM-7, Volume 2, London, 1996, pp 131-137.
4. Broughton, W.R. and Sims, G.D., "An Overview of Through-Thickness Test Methods for Polymer Matrix Composites", NPL Report DMM(A)148, October 1994.
5. ASTM D 5379/D 5379M - 93: "Standard test method for shear properties of composite materials by the V-notched beam method", Volume 15.03, Annual Book of ASTM Standards, Philadelphia, Pennsylvania, USA, 1996, 235-247.
6. ASTM D 3846: "Standard Test Method for In-Plane Shear of Reinforced Plastics",Volume 8.02, ASTM Standards, 1995, pp 435-439.

Volume V: Textile Composites and Characterisation
V - 904
7. BS 4994: "Design and Construction Vessels and Tanks in Reinforced Plastics", 1987.
8. BS 6464: "Reinforced Plastics Pipes, Fittings and Joints for Process Plants", 1984.
9. Broughton, W.R., Lodeiro, M. and Sims, G.D., "Experimental Validation of Shear TestMethods for Through-Thickness Properties", Proceedings of ECCM-7, Volume 2, 1996,pp 125-130.
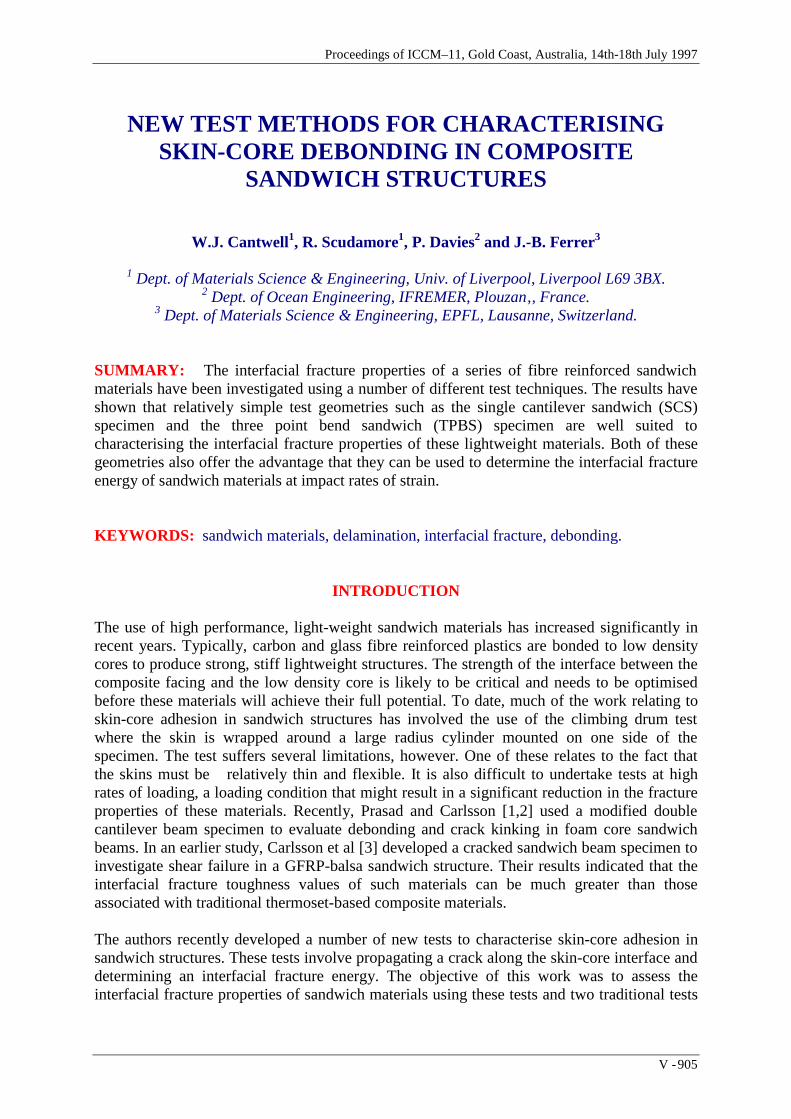
Proceedings of ICCM–11, Gold Coast, Australia, 14th-18th July 1997
V - 905
NEW TEST METHODS FOR CHARACTERISINGSKIN-CORE DEBONDING IN COMPOSITE
SANDWICH STRUCTURES
W.J. Cantwell1, R. Scudamore1, P. Davies2 and J.-B. Ferrer3
1 Dept. of Materials Science & Engineering, Univ. of Liverpool, Liverpool L69 3BX.2 Dept. of Ocean Engineering, IFREMER, Plouzan‚, France.
3 Dept. of Materials Science & Engineering, EPFL, Lausanne, Switzerland.
SUMMARY: The interfacial fracture properties of a series of fibre reinforced sandwichmaterials have been investigated using a number of different test techniques. The results haveshown that relatively simple test geometries such as the single cantilever sandwich (SCS)specimen and the three point bend sandwich (TPBS) specimen are well suited tocharacterising the interfacial fracture properties of these lightweight materials. Both of thesegeometries also offer the advantage that they can be used to determine the interfacial fractureenergy of sandwich materials at impact rates of strain.
KEYWORDS: sandwich materials, delamination, interfacial fracture, debonding.
INTRODUCTION
The use of high performance, light-weight sandwich materials has increased significantly inrecent years. Typically, carbon and glass fibre reinforced plastics are bonded to low densitycores to produce strong, stiff lightweight structures. The strength of the interface between thecomposite facing and the low density core is likely to be critical and needs to be optimisedbefore these materials will achieve their full potential. To date, much of the work relating toskin-core adhesion in sandwich structures has involved the use of the climbing drum testwhere the skin is wrapped around a large radius cylinder mounted on one side of thespecimen. The test suffers several limitations, however. One of these relates to the fact thatthe skins must be relatively thin and flexible. It is also difficult to undertake tests at highrates of loading, a loading condition that might result in a significant reduction in the fractureproperties of these materials. Recently, Prasad and Carlsson [1,2] used a modified doublecantilever beam specimen to evaluate debonding and crack kinking in foam core sandwichbeams. In an earlier study, Carlsson et al [3] developed a cracked sandwich beam specimen toinvestigate shear failure in a GFRP-balsa sandwich structure. Their results indicated that theinterfacial fracture toughness values of such materials can be much greater than thoseassociated with traditional thermoset-based composite materials.
The authors recently developed a number of new tests to characterise skin-core adhesion insandwich structures. These tests involve propagating a crack along the skin-core interface anddetermining an interfacial fracture energy. The objective of this work was to assess theinterfacial fracture properties of sandwich materials using these tests and two traditional tests

Volume V: Textile Composites and Characterisation
V - 906
used widely in industry. The advantages and limitations of the test procedures will behighlighted and discussed.
EXPERIMENTAL PROCEDUREMaterials
Four glass/polyester balsa systems (referred to as materials A to D) manufactured via a handlay-up process were considered in this study. The skins in all materials were based oncomposites containing two layers of stitched quadriaxial E-glass fibre fabric in an isophthalicpolyester resin and the core was an end-grain balsa having a density of 175 kg/m3 and anominal thickness of 15 mm. Material A represents a standard system in which the skins werecured directly onto the balsa core. Prior to applying the composite skins, the cores in materialsB to D were first sealed using a polyester resin. Material C contained a layer of choppedstrand mat (CSM) at the skin-core interface and material D a layer of fabric based on athermoplastic polyester fibre. Further details regarding the materials and manufacturingprocedures can be found in refs 4 and 5.
Test Methods
Single Cantilever Sandwich Specimen
The interfacial fracture toughness of the sandwich materials was investigated using the singlecantilever sandwich (SCS) geometry test shown in Fig. 1a. Here, one end of the beam wasmachined away leaving a tongue approximately 50 mm long. Prior to testing, the specimenswere pre-cracked by loading the specimen in a vice and applying load to the end of the beamforcing a crack to propagate along the skin-core interface. Testing was carried out at acrosshead displacement rate of 5 mm/minute. In all tests, the crack was propagated 50 mmbefore the specimen was unloaded. Four specimens of each type were tested. The interfacialfracture energy was calculated using a compliance calibration procedure.
A finite element analysis was undertaken in order to determine the mode-mixity at the cracktip in the SCS geometry. Here, a 9000 node mesh based on eight-noded quadratic elementswas used to model the specimen. Figure 2 shows the variation of GI/GII with crack length formaterial A. From the figure it is apparent that the degree of mode-mixity in this specimendoes not vary with crack length, remaining constant over the range of crack lengthsconsidered.
End-Loaded Sandwich Structure
The end-loaded sandwich structure (ELSS) is shown schematically in Fig. 1b. Here, a 200 x20 mm pre-cracked sandwich beam was fixed to a movable chariot. Testing was again carriedout on at a crosshead displacement rate of 5 mm/minute and a pre-crack length ofapproximately 50 mm was used throughout. Load was applied through a hinge bonded to theend of the pre-cracked region and crack advance monitored using a calibrated scale paintedalong the interfacial region. Typically, the crack was propagated fifty millimetres before thetest specimen was unloaded.

Proceedings of ICCM–11, Gold Coast, Australia, 14th-18th July 1997
V - 907
Fig. 1: Schematic showing the test geometries evaluated in this programme.

Volume V: Textile Composites and Characterisation
V - 908
Three Point Bend Sandwich Specimen
The three point bend sandwich (TPBS) specimen, Fig. 1c, is a simple flexural specimensimilar in configuration to the mixed mode flexure (MMF) geometry used to characterise theinterlaminar fracture toughness of high performance composites. The specimen consists of asimple beam from which the core and lower skin have been removed at one end. Thespecimen is then positioned on rollers (one of which is raised in order ensure than thespecimen remains horizontal) and loaded at its mid-point. In this programme, specimens withdimensions 140 x 20 mm were supported on rollers positioned 120 mm apart. Once again,crack propagation is monitored optically using a calibrated scale and the fracture energydetermined using a compliance calibration technique.
Crack length (mm)
Fig. 2 The mode-mixity as a function of crack length for the SCS specimen geometry
Short Beam Shear Tests
A series of short beam shear tests based on the French standard NF T54-606 were undertakenon the four balsa materials in order to characterise their apparent shear strengths. In this partof the study, 50 mm wide beams were supported on cylindrical rollers positioned 200 mmapart. Load was applied by two central rollers rather than one, to avoid indentation, Fig. 1d.The crosshead displacement rate was 5 mm/min. The shear stress at rupture was determinedfrom the expression:
with P the maximum force, h the total sandwich thickness and hc the core thickness, B thebeam width. Six beams of each type were tested.

Proceedings of ICCM–11, Gold Coast, Australia, 14th-18th July 1997
V - 909
Climbing Drum Peel Tests
A series of climbing drum tests were conducted according to the DIN 53 295. Here, 300 x 20mm specimens were machined leaving 25 mm tongues at each end. One end of the specimenwas held in steel grip and the other end fixed to the surface of a 100 mm external diameterdrum. The subsequent movement of the drum relative to the lower end of the specimenresulted in the separation of the skin and core materials. The tests were undertaken at acrosshead speed of 25 mm/min.
RESULTS AND DISCUSSION
The following sections will consider the findings of each of the five test techniquesindividually.
Single Cantilever Sandwich Specimen
Crack propagation in all materials was found to be stable and the resulting load-displacementtraces relatively smooth. The interfacial propagation fracture energies for the four materialsare shown in Fig. 3. It is clear that all of the materials exhibit similar values of fractureenergy. The standard system, material A, shows an average fracture energy of approximately900 J/m2. Pretreating the balsa, material B, resulted in a small increase in the average fractureenergy, however, it is probably not statistically significant. Material C containing a layer ofchopped strand mat fibres at the skin-core interface exhibited an average fracture energy ofapproximately 800 J/m2. The interface between the polyester fibre interlayer and the balsacore in material D proved to be so strong that the crack propagated up through thethermoplastic fibre interlayer and then along the composite/interlayer interface. The fractureenergy associated with the interlayer-balsa interfacial region is therefore likely to be greaterthan the value shown in the figure.
Fig. 3 Fracture data obtained using the single cantilever sandwich geometry.

Volume V: Textile Composites and Characterisation
V - 910
End-Loaded Sandwich Structure
The modes of crack propagation observed in the balsa specimens were similar to thoseobserved in the SCS geometry reported above. Figure 4 contains a summary of the meaninterfacial fracture energies measured on the four materials examined in this study. From thefigure, it is apparent that of the four sandwich structures, material A exhibited the highestvalue of interfacial fracture toughness. Here, a significant amount of fibre bridging occurringbetween the skin and core materials was observed.
Fig. 4: Fracture data obtained using the end-loaded sandwich structure geometry.
Three Point Bend Sandwich Specimen
The load-displacement curves for the TPBS specimens were similar in appearance to thoserecorded during the SCS and ELSS tests with the exception that crack-propagation in materialB occurred in a stick-slip mode. A subsequent optical examination of the failed sampleindicated that fibre bridging was significant in materials A, C and D but limited in material B.This evidence suggests that fibre bridging has a significant influence on the stability of apropagating crack. The average fracture energies for the four balsa materials are presented inFig. 5. From the figure it is clear that the fracture energies for materials A, C and D aresimilar to those determined using the SCS and ELSS geometries. Once again, material Bproves to be the exception to this rule with the fracture energy being roughly fifty percent ofthe values measured using the other geometries. It is believed that this low value does notresult from different loading conditions at the crack tip but is simply due to local variations inthe quality of the skin-core interfacial region.
Short Beam Shear Tests
In all materials, initial failure occurred between the balsa blocks within the core materialextending up to the skin-core interface at higher applied loads. Crack propagation in materialsA, B and D occurred in an unstable manner whereas failure in system C containing a layer ofchopped glass fibres was stable. The short beam shear shear strength data are summarised in
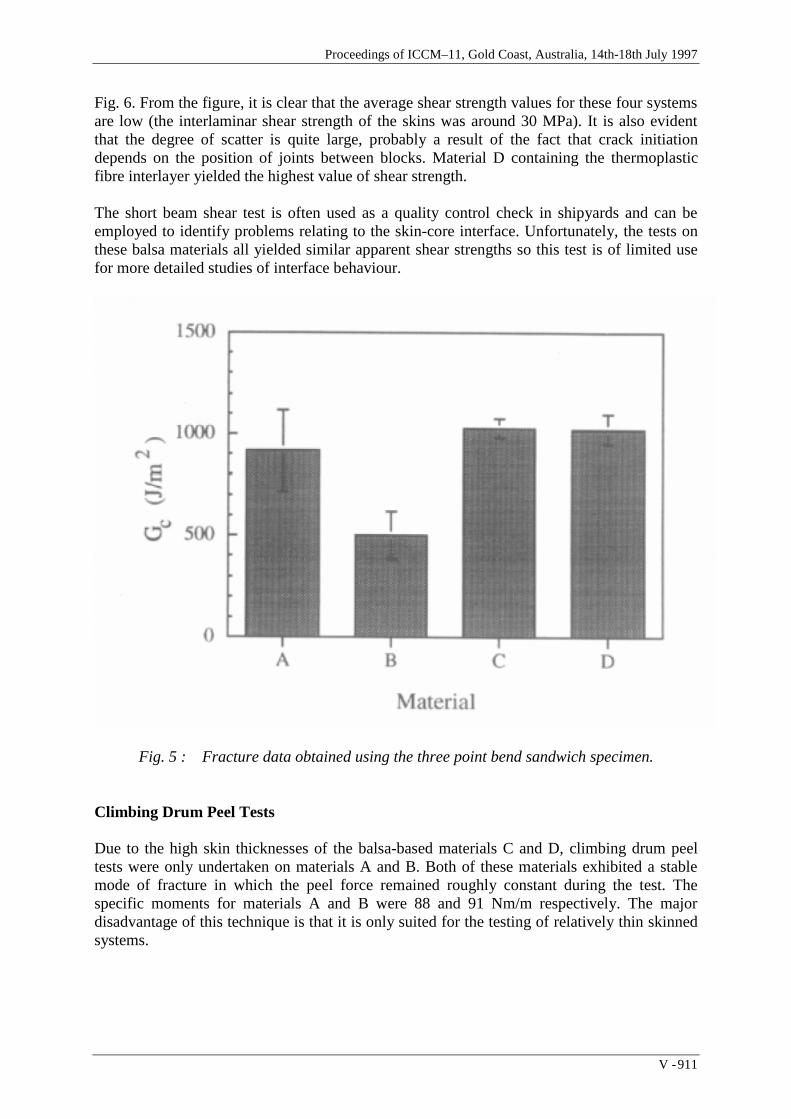
Proceedings of ICCM–11, Gold Coast, Australia, 14th-18th July 1997
V - 911
Fig. 6. From the figure, it is clear that the average shear strength values for these four systemsare low (the interlaminar shear strength of the skins was around 30 MPa). It is also evidentthat the degree of scatter is quite large, probably a result of the fact that crack initiationdepends on the position of joints between blocks. Material D containing the thermoplasticfibre interlayer yielded the highest value of shear strength.
The short beam shear test is often used as a quality control check in shipyards and can beemployed to identify problems relating to the skin-core interface. Unfortunately, the tests onthese balsa materials all yielded similar apparent shear strengths so this test is of limited usefor more detailed studies of interface behaviour.
Fig. 5 : Fracture data obtained using the three point bend sandwich specimen.
Climbing Drum Peel Tests
Due to the high skin thicknesses of the balsa-based materials C and D, climbing drum peeltests were only undertaken on materials A and B. Both of these materials exhibited a stablemode of fracture in which the peel force remained roughly constant during the test. Thespecific moments for materials A and B were 88 and 91 Nm/m respectively. The majordisadvantage of this technique is that it is only suited for the testing of relatively thin skinnedsystems.

Volume V: Textile Composites and Characterisation
V - 912
Comparison of the Test Techniques
Comparing the experimental data yielded by the five test techniques enables severalconclusions to be drawn. The short-beam shear test, although simple to use, is very sensitiveto the quality of the balsa core and the measured shear strength depends on the position of thejoints between the balsa blocks. The climbing drum peel test is a useful technique forcharacterising the interfacial fracture properties of sandwich materials but it is limited to thetesting of thin-skinned materials. The end-loaded sandwich structure, the single cantileversandwich and the three point bend sandwich specimen proved to be well suited to the testingof all four materials. For a given material system, different fracture energies were obtainedusing the specimens, Fig. 7. It is likely that the mode I/II mixity is different between the threetests and this is will result in different values of G. The ELSS test involves the use of a slidingchariot and is therefore slightly more cumbersome. The SCS and TPBS geometries offerseveral advantages including their ease of use and the possibility of undertaking tests at veryhigh rates of strain. Problems do arise when testing very thin-skinned sandwich structures butthese can be overcome by bonding a thicker substrate to the loading arm.
Fig. 6: Fracture data from the short beam shear tests
CONCLUSIONS
Five different test geometries have been used to characterise skin-core failure in a variety ofbalsa-based sandwich materials. The climbing drum peel test was found to be unsuitable fortests on thick-skinned structures such as the balsa-based materials C and D. The short-beamshear test, a technique frequently used as a quality control test in shipyards, failed to

Proceedings of ICCM–11, Gold Coast, Australia, 14th-18th July 1997
V - 913
differentiate between the various balsa systems and is deemed to be unsuitable forcharacterising materials of this nature. The end-loaded sandwich structure, the singlecantilever sandwich specimen and the three point bend sandwich specimen were well suitedfor testing the range of systems examined in this study.
Fig.7: Comparison of the fracture energies determined using the SCS, ELSS and the TPBSgeometries
REFERENCES
1. Prasad, S. and Carlsson, L.A., "Debonding and crack kinking in foam core sandwichbeams - I. Analysis of fracture specimens", Engineering Fracture Mechanics, Vol. 47,1994, pp. 813-824.
2. Prasad, S. and Carlsson, L.A., "Debonding and crack kinking in foam core sandwichbeams - II. Experimental investigation", Engineering Fracture Mechanics, Vol. 47,1994, pp. 825-841.
3. Carlsson, L.A., Sendlein, L.S. and Merry, S.L., "Characterization of face/core shearfracture of composite materials", Journal of Composite Materials, Vol. 25, 1991, pp.101-116.
4. Cantwell, W.J., Broster, G., and Davies, P., "Skin-core-adhesion in GFRP-balsasandwich structures", Journal of Reinforced Plastics and Composites, Vol. 15, 1996, pp.1161-1172.
5. Cantwell, W.J. and Davies, P., "A study of skin-core adhesion in glass fibre reinforcedsandwich materials", Applied Composite Materials, Vol. 3, 1996, pp. 407-420.

Volume V: Textile Composites and Characterisation
V - 914
THE MEASUREMENT OF MODE III FRACTURETOUGHNESS IN THICK COMPOSITE LAMINATES
USING STRAIN GAGES
W. C. Liao and R. L. Tu
Department of Civil Engineering, Feng Chia University, Taichung Taiwan
KEYWORDS: edge crack torsion(ECT) specimen, mode III fracture toughness, boundary collocation method, strain energy release rates.
INTRODUCTION

Proceedings of ICCM–11, Gold Coast, Australia, 14th-18th July 1997
V - 915

Volume V: Textile Composites and Characterisation
V - 916

Proceedings of ICCM–11, Gold Coast, Australia, 14th-18th July 1997
V - 917

Volume V: Textile Composites and Characterisation
V - 918

Proceedings of ICCM–11, Gold Coast, Australia, 14th-18th July 1997
V - 919

Volume V: Textile Composites and Characterisation
V - 920

Proceedings of ICCM–11, Gold Coast, Australia, 14th-18th July 1997
V - 921

Volume V: Textile Composites and Characterisation
V - 922

Proceedings of ICCM–11, Gold Coast, Australia, 14th-18th July 1997
V - 923

Volume V: Textile Composites and Characterisation
V - 924
COMPARISON OF TENSILE PROPERTIES BETWEENSPLIT DISK TEST AND TENSILE COUPON TEST
Sung-Ho Yoon1 and Chun-Gon Kim2
1 Department of Mechanical Engineering, Kumoh National University of Technology188 Shinpyung-Dong, Kumi, Kyungbuk, 730-701, Korea
2 Department of Aerospace Engineering, Korea Advanced Institute of Scienceand Technology, 373-1 Kusung-Dong, Yusong-Ku, Taejon, Korea
KEYWORDS: tensile propeties, filament wound structures, split disk test, tensile coupontest, ring specimen, conventional coupon specimen, modified coupon specimen

Proceedings of ICCM–11, Gold Coast, Australia, 14th-18th July 1997
V - 925

Volume V: Textile Composites and Characterisation
V - 926

Proceedings of ICCM–11, Gold Coast, Australia, 14th-18th July 1997
V - 927

Volume V: Textile Composites and Characterisation
V - 928
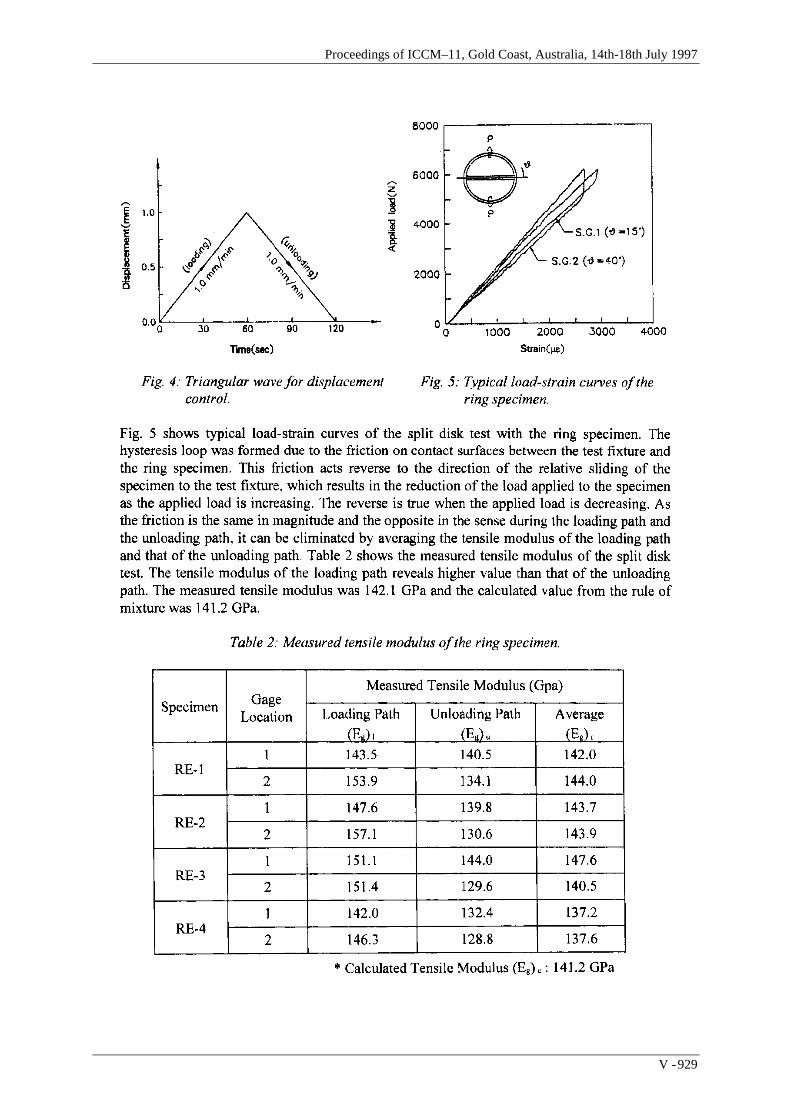
Proceedings of ICCM–11, Gold Coast, Australia, 14th-18th July 1997
V - 929

Volume V: Textile Composites and Characterisation
V - 930
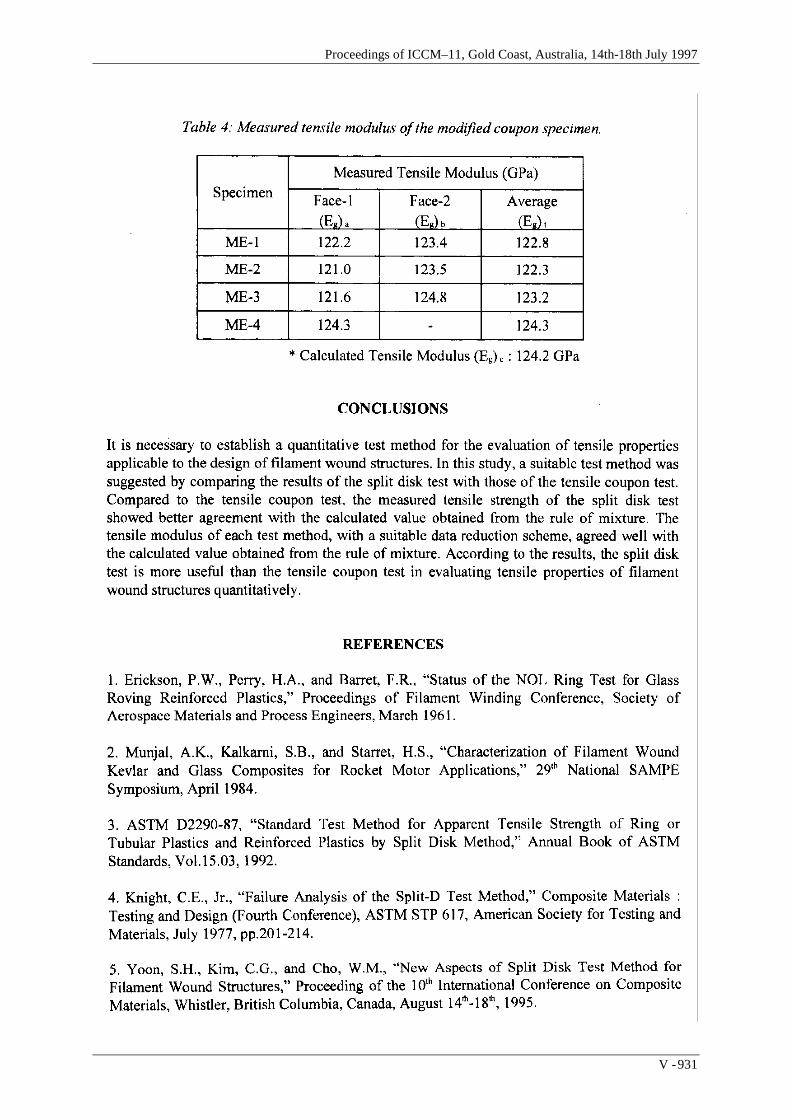
Proceedings of ICCM–11, Gold Coast, Australia, 14th-18th July 1997
V - 931

Volume V: Textile Composites and Characterisation
V - 932
APPROXIMATE STRESS ANALYSIS OF THEIOSIPESCU SHEAR SPECIMEN
James M. Whitney
Department of Civil & Environmental Engineering and Engineering Mechanics,University of Dayton, 300 College Park, Dayton, Ohio, 45469-0243,USA
SUMMARY: Use of higher order beam theories is investigated in conjunction with stressanalysis of the Iosipescu (v-notch) shear test for composite materials. Higher orderdisplacements are utilized which lead to a third order polynomial in the thickness coordinatefor the inplane normal stress. Through-the-thickness shear and normal stresses are obtainedby integrating the equilibrium equations from classical theory of elasticity. This procedureleads to a fourth order polynomial in the thickness coordinate for the transverse shear stress.The shear stress distribution at the notch cross-section as obtained from the higher order beamtheory in conjunction with a graphite/epoxy unidirectional composite is compared to anavailable finite element solution. Discrepancies between these solutions are discussed. Inaddition, numerical results indicate that the transverse normal strain can have a significantinfluence on the shear stress distribution at the notch cross-section.
KEYWORDS: inplane shear, interlaminar shear, Iosipescu shear test, shear tests, higherorder beam theory, stress analysis.
INTRODUCTION
The V-Notched beam (Iosipescu) shear test is now a standard test method under ASTMD5379. In addition to being widely accepted by the aerospace industry this test method isbeing utilized by other organizations, such as the Automotive Composites Consortium, as astandard for determining shear strength and modulus. The genesis of this test method can befound in a paper published by Iosipescu [1]. In this paper he proposed the test specimenshown in Fig. 1 for determining the shear properties of metals. Iosipescu argued that a 90° v-notch in the presence of a cross-section with zero moment would produce a state of pure shearwhich is uniformly distributed across the width, w, between the notches. Because the sides ofthe notches are parallel to the normal stress direction, Iosipescu also concluded that no stressconcentration, at least for isotropic materials, existed at the bottom of the notch.
A considerable amount of work has been done in analyzing the shear stress distribution at thenotch cross-section of the Iosipescu shear specimen. Most of these have been accomplishedutilizing the finite element method. However, the geometry of the Iosipescu specimenpresents a particular challenge to the finite element method. For example, it can be shownthat stress distributions in the notch section of the specimen are very much influenced by thestress-free boundary conditions along the notch surface. Conventional finite elementformulations, which are usually based on displacements, cannot directly satisfy traction-freeboundary conditions, as these are natural conditions to be satisfied in the limit. Otherdifficulties can be encountered with the finite element method. Further complications arisewith regard to stress analysis by the existence of a singularity at the notch tip for certain

Proceedings of ICCM–11, Gold Coast, Australia, 14th-18th July 1997
V - 933
material properties and laminate geometries [2]. In addition, load placement and distributioncan have an effect on the shear stress at the notch cross-section [3-5].
b
L
SHEAR
MOMENT
Pb(L − b)
Pb(L − b)
Pb(L − b)
Pb(L − b)
-P
PL(L − b)
PL(L − b)
Pb2
− Pb2
h
Fig. 1 : Iosipescu (v-notch) shear specimen
In the present paper two higher order plane stress models are presented for evaluating thestresses in the vicinity of the v-notches in the Iosipescu specimen, including the transversenormal stress. The models are based on an expansion of the displacements in the through-the-thickness coordinate, z, in the same fashion as higher order plate theories are often developed.Governing equations and boundary conditions are obtained from minimizing potential energy.Both approaches yield a third order polynomial in z for the through-the-thickness distributionof the inplane normal stress. Through-the-thickness shear and normal stresses are obtained byintegrating the equilibrium equations from classical theory of elasticity.
b
Pb(L − b)
Pb(L − b)
PL(L − b)
PL(L − b)
L
Fig. 2: Idealized loading with St. Venant effect dissipated

Volume V: Textile Composites and Characterisation
V - 934
HIGHER ORDER BEAM ANALYSIS
In performing a higher order beam analysis we must assume that there is sufficient distancebetween the interior loads so that St. Venant's principle applies. In such a case the loading isidealized as shown in Figure 2. Under this condition we can consider a simplified analysisusing the free-body diagrams shown in Figure 3. Using the free-body diagram on the left-hand side of Figure 3, we denote the beam depth by H(x). Thus,
H(x) = (h-2x) (1)
In developing a higher order beam theory applicable to the Iosipescu shear test, we retain theusual assumptions associated with bending loads. In particular, the inplane normal stress, σx,
x
y y
-P
(h-w)
2
(h-w)
2
P(h-w)
2
- P(h-w)
2
P
P- PH H
Fig. 3 : Free-body diagram for analytical model
is assumed to be anti-symmetric with respect to the through-the-thickness coordinate. For thepresent work we choose a displacement based theory which produces a third order polynomialfor σx relative to the thickness coordinate, y. If a displacement based formulation is utilized,
two approaches can be implemented in obtaining the desired distribution of σx . In the first
case the effect of the thickness normal strain, εy, is neglected, which leads to the displacementfield:
u = yψ(x) + y3
3φ(x), v = v
o(x) (2)
These displacements lead to the following normal stress, moment, and shear force resultants

Proceedings of ICCM–11, Gold Coast, Australia, 14th-18th July 1997
V - 935
σx = yE1 ψ,x +y2
3φ,x
M = t σxydy = E1tH3
12(ψ,x +
H2
20φ,x )
−H/2
H/2∫
Q = t τxydy = G12tH−H/2
H/2∫ ψ + v,x
o +H2
12φ
(3)
where a comma denotes partial differentiation, t denotes the beam thickness in the z direction,E1 is the beam modulus in the x-direction, and G12 denotes the shear modulus relative to thex-y plane.
If we include the effect of the transverse normal strain, εy, the displacements in eq. (2) takethe form
u = yψ x(x) +y3
3φx(x), v = v0(x) +
y2
2ψy(x) +
y4
4φy(x) (4)
which leads to the following normal stress, moment, and shear force resultant
σx = y Q11ψ x,x + Q12ψ y( )+ y3 Q113
φx,x + Q12φy
M = Q11tH3
12ψ x,x + Q12
Q11ψ y + H2
12φx,x + Q12
Q11φy
(5)
Q = G12ht ψx + v,x0 +
H2
12φx +
ψy,x
2
+
H4
320φy,x
where Qij are the reduced stiffnesses for plane stress.
Equation (4) contains all of the polynomial terms in the y coordinate which contribute to botha third order inplane stress, σx , and a fourth order transverse shear stress, τxy. Integration ofthe first of eqs. (5) in conjunction with the first equilibrium equation from classical theory ofelasticity also produces a fourth order polynomial in y for the transverse shear stress, τxy.
However, the expression for τxy obtained from assumed kinematic relations does not satisfyappropriate boundary conditions. This can only be accomplished by integrating the firstequilibrium equation from classical theory of elasticity with the result
τxy = − σx,xdζ + τxy (x,−H / 2)−H/2
y
∫ (6)
The second term in this relationship represents the value of τxy at the top of the cross-section,which in general does not vanish. Stresses relative to the x-y coordinate system along the
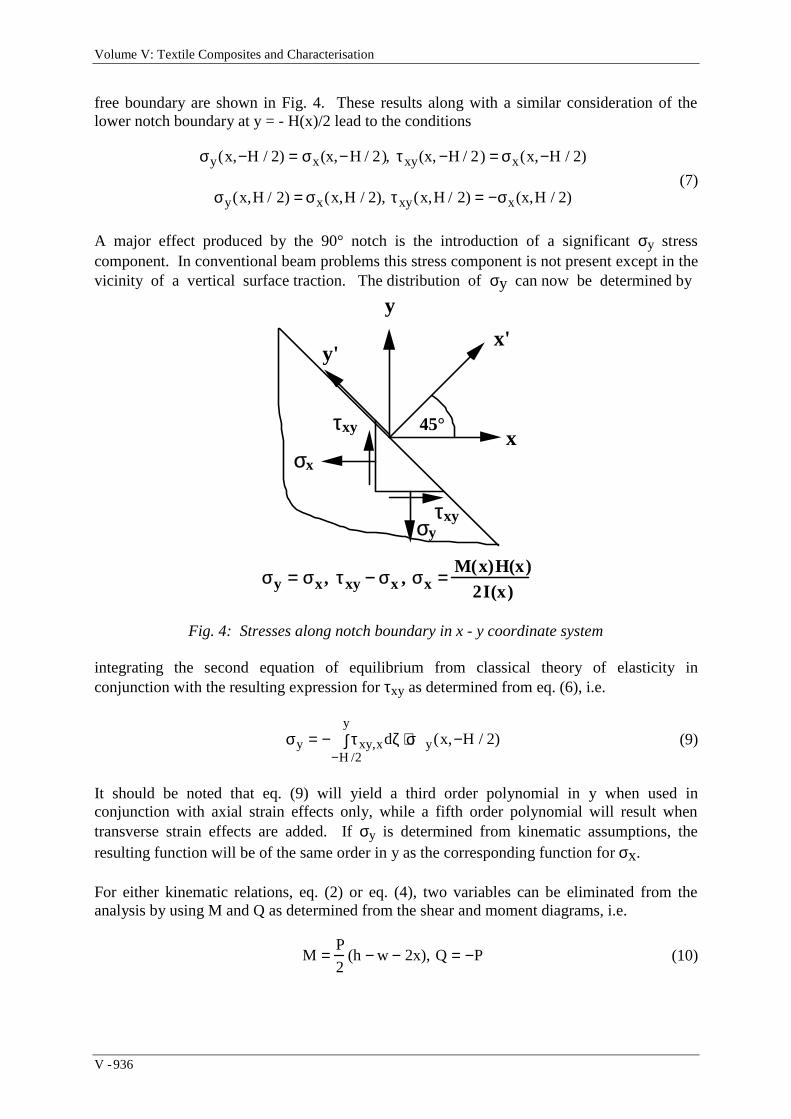
Volume V: Textile Composites and Characterisation
V - 936
free boundary are shown in Fig. 4. These results along with a similar consideration of thelower notch boundary at y = - H(x)/2 lead to the conditions
σy(x,−H / 2) = σx(x,−H / 2), τxy(x, −H / 2) = σx(x,−H / 2)
(7)σy(x,H / 2) = σx(x,H / 2), τxy(x,H / 2) = −σx(x,H / 2)
A major effect produced by the 90° notch is the introduction of a significant σy stresscomponent. In conventional beam problems this stress component is not present except in thevicinity of a vertical surface traction. The distribution of σy can now be determined by
45°
σx
σyτxy
τxyx
x'
y
y'
σy = σx, τxy − σx , σx = M(x)H(x)2I(x)
Fig. 4: Stresses along notch boundary in x - y coordinate system
integrating the second equation of equilibrium from classical theory of elasticity inconjunction with the resulting expression for τxy as determined from eq. (6), i.e.
σy = − τxy,xdζ + σy(x,−H / 2)−H /2
y
∫ (9)
It should be noted that eq. (9) will yield a third order polynomial in y when used inconjunction with axial strain effects only, while a fifth order polynomial will result whentransverse strain effects are added. If σy is determined from kinematic assumptions, theresulting function will be of the same order in y as the corresponding function for σx.
For either kinematic relations, eq. (2) or eq. (4), two variables can be eliminated from theanalysis by using M and Q as determined from the shear and moment diagrams, i.e.
M =P
2(h − w − 2x), Q= −P (10)

Proceedings of ICCM–11, Gold Coast, Australia, 14th-18th July 1997
V - 937
The remaining equilibrium equations in terms of displacement variables are determined fromthe principle of minimum potential energy. In order to conserve space the governingequations will not be presented here.
For the case of axial strain only, the governing equations can be reduced to a single non-homogeneous differential equation in the variable φ. The resulting solution is of the form
φ = − 420wh2
(9 + 35G12 / E1)H3 + 630w2h3
(9+ 35G12 / E1)H4 + A
Hλ + BHλ (11)
where ± λ are the roots of a quadratic equation involving geometric parameters and materialproperties. The undetermined coefficients A and B are determined from the followingboundary conditions
At x =0, h - w( )
2: φ,x = 0 (12)
The variables ψ and v0 are determined from the moment and shear force in conjunction witheq. (11).
When transverse strain is also included, three non-homogeneous, coupled, differentialequations in the variables φx, ψ y, and φy are obtained. In this case the solution is of the
form
φx = A iHλi + L1
wh2
H3 + i=1
6∑ L2
wh3
H4
ψ y = F1iAiHλ i + L3
wh
H2 + i=1
6∑ L4
wh2
H3 (13)
φy = F2iA iHλ i + L5
wh3
H4 +
i=1
6∑ L6
wh4
H5
where Li are coefficients of a particular solution, while Ai are undetermined coefficients of
the homogeneous solution. In addition λi are roots of a sixth order polynomial involvinggeometric parameters and material properties. The coefficients fij are eigenvector ratios. Inthis case the boundary conditions are of the form
At x = 0: φx = φx,x = φy = 0
(14)
At x = h - w( )
2: φx,x = ψy = φy = 0
Conditions at the notch cross-section lead to vanishing of σx for both cases underconsideration and continuity of v for the second case. Symmetry (or anti-symmetry) asdictated by Figs. 2 and 3 assure continuity of u and τxy at the notch cross-section. The

Volume V: Textile Composites and Characterisation
V - 938
boundary conditions at the beginning of the notch region (x = 0 in Fig. 3) lead to lineardistributions with respect to y for σx in both cases and for u in the second case.
NUMERICAL RESULTS
We now consider two examples, a unidirectional composite with the fibers oriented along thex-axis, [0°] composite, and a unidirctional composite with the fibers perpendicular to the x-axis, [90°] composite. Assumed material properties will be those typical of currentgraphite/epoxy composites. Before displaying the solutions, however, some discussion is inorder relative to differences in behavior between these two cases. In particular, solutions forthe [0°] case tend to be unstable for two reasons. First, there is a definite effect of assumedload placement and distribution on the stresses at the notch cross-section [3-5]. But evenmore importantly is the existence of a stress singularity at the notch tip [2]. In the case of[90°] graphite/epoxy unidirectional composites, the notch tip stresses are very insensitive toload placement and distribution [3, 5], and no singularity exists at the notch tip [2].
For the [0°] composite the following material properties are assumed:
E1E2
= 15. 4, G12E2
= 0.615, ν12 = 0.3 (15)
where E2 is the modulus in the y-direction. Here ν12 denotes the major Poisson's ratio asdetermined from a uniaxial tensile test in the x-direction while measuring contraction in the y-direction. When transverse strain effects are included in the kinematic relations, eq. (4), thereduced stiffnesses can be determined from the relationships
Q11 =E1
1− ν122 E2 / E1( ), Q12 =
ν12E2
1− ν122 E2 / E1( ) (16)
A comparison of shear stress distributions at the notch-tip for the two kinematic assumptions,eqs. (2) and (4), and classical beam theory are shown in Fig. 5. The notch depth is given byw/h = 0.5 and shear stress values are normalized by the average shear stress at the notchcross-section, i.e.
τxy* =wtτxy
P(17)
The shear stress distribution is determined from equilibrium consideration, i.e. eq. (6). Forthe case of a classical beam,
σx =M(x)y
I(x)=
6Py(h− w − 2x)
t(h − 2x)3(18)
where I(x) is the moment of inertia of the cross-section with respect to the z-axis.Substituting this relationship into eq. (6) and performing the integration, we obtain thefollowing expression for transverse shear stress

Proceedings of ICCM–11, Gold Coast, Australia, 14th-18th July 1997
V - 939
τxy = −3P
2t(h − 2x)2[w + 4(2h− 3w − 4x)(
y
h− 2x)2] (19)
At the notch cross-section this relationship yields the following normalized shear stress:
τxy* = −
3
2[1 − 4(
y
w)2] (20)
Thus, the beam solution yields a classical parabolic shear stress distribution which isindependent of material properties.
Results in Fig. 5 indicate a large effect of transverse normal strain as well as a significantdeparture from elementary beam theory. In fact these results indicate the type of instabilityalluded to at the beginning of this section and leaves serious doubt that any of the three casesrepresents an accurate solution.
For the [90°] composite the material properties relative to the x-y coordinates are as follows:
E1
E2= 0.065,
G12
E2= 0.04, ν12 = 0.0195 (21)
A comparison of models for the shear stress distribution at the notch cross-section is shown inFig. 6 for w/h = 0.5. As in the case of the [0°] composite considerable departure fromelementary beam theory is displayed by the higher order theories. However, in this casesimilar results are obtained with and without transverse strain included. Thus, the solutionappears to be more stable than for the case of the [0°] unidirectional composite. In addition,plane stress finite element results from Ref. [4] are included. The ABAQUS and PATRANcodes were used for calculations and pre-, post-processing, respectively.
A large discrepancy is quite evident between the shape of the shear stress distribution in Fig.6 as obtained from the higher order beam theories and the finite element solution. It isdifficult at this point to conclude which one of these two solutions is more accurate. Aspreviously pointed out there are difficulties with the finite element procedure. In particular, acursory examination of eq. (6) reveals that the boundary condition has a very important role toplay in the shear stress distribution. Again, the exact boundary conditions are obtained onlyin the limit in conjunction with displacement based finite elements. It can be shown that inthe absence of a singularity and load effects, which is the situation with the case displayed inFig. 6, the shear stress at the notch tip must vanish. The finite element solution does not quitevanish at the notch tips. Some discrepancy between these finite element results and moirédata can be found in Ref. [5]. However the shape of the shear stress distribution as obtainedfrom the moiré data is much closer to the finite element results than the higher order beamtheory. It should also be noted that moiré data is difficult to interpret in the presence of highstrain gradients.

Volume V: Textile Composites and Characterisation
V - 940
-0.5
-0.25
0
0.25
0.5
-3.6 -2.7 -1.8 -0.9 0 0.9
x Strain OnlyBeam Theory
y/w
τxy /τAVE
x and y Strain
w/h = 0.5
[0°]
Fig. 5: Shear stress distribution at notch cross-section, [0°] composite
-0.5
-0.25
0
0.25
0.5
-1.6 -1.2 -0.8 -0.4 0
x and y Strainx Strain OnlyFinite Elements [3]Beam Theory
y/w
τxy/τAVG
w/h = 0.5
[90°]
Fig. 6: Shear stress distribution at notch cross-section, [90°] composite

Proceedings of ICCM–11, Gold Coast, Australia, 14th-18th July 1997
V - 941
CONCLUSIONS
Results of the present study are inconclusive concerning the applicability of higher orderbeam theories to the stress analysis of the Iosipescu shear specimen. Because of the absenceof a singularity, and insensitivity to load placement and distribution, the [90°] unidirectionalgraphite/epoxy specimen is ideal for this study.
To aid in resolving the discrepancies observed in Fig. 6, solutions from additional higherorder beam theories need to be considered. Displacement based solutions of the followingform are appropriate.
u = zi ψx(i) (x)
i =odd
N∑ , v = v0(x) + zi ψx
(i) (x)i=even
N+1∑ (22)
This will lead to an Nth order antisymmetric through-the-thickness distribution of σx and anN+1 even ordered distribution of τxy.
It would also seem appropriate that additional finite element approaches, utilizing other thanconstant strain elements, need to be explored.
ACKNOWLEDGMENT
The author wishes to acknowledge the Air Force Office of Scientific Research, Washington,D.C., and RDL, Culver City, California, for supporting part of this work under the SummerFaculty Program with Wright Laboratory, Wright-Patterson Air Force, Base, Ohio, USA.Additional support was provided by Wright Laboratory under an on-site contract with theUniversity of Dayton Research Institute, Dayton, Ohio, USA.
REFERENCES
1. Iosipescu, N., "New Accurate Procedure for Single Shear Testing of Metals, "Journal ofMaterials, Vol. 2, No. 3, September, 1967, pp. 537-566.
2. Whitney, J. M., "Singularity Analysis of the Iosipescu Shear Specimen", Proceedings ofthe Tenth International Conference on Composite Materials (ICCM X), Vol. IV,Characterization and Ceramic Matrix Composites, Poursartip, A. and Street, K., Eds.,Woodhead Publishing Ltd., Cambridge, England, 1995, pp. 219-226.
3. Ho, H., Tsai, M. Y., and Morton, J., "Numerical Analysis of the Iosipescu Specimen forComposite Materials," Composite Science and Technology, Vol. 46, No. 2, 1993, pp.157-128.
4. Ho, H. and Morton, J., "Non-Linear Numerical Analysis of the Iosipescu Specimen forComposite Materials," Composite Science and Technology, Vol. 50, No. 4, 1994, pp.355-365.
5. Whitney, J. M., "St. Venant Effect in the Iosipescu Shear Specimen," Proceedings of theAmerican Society for Composites, Eleventh Technical Conference, Johnson, W. S., Ed.,Technomic Publishing, Co., Lancaster, Pa., 1996, pp. 845-852.

Volume V: Textile Composites and Characterisation
V - 942
SUBJECT INDEX
3501-6 444, 7973-D composite 6143-D finite-element analysis 3913-D orthogonal interlocked fabric composite 473D-braided composites 297
4-point bending 297
8-step braiding 356
accelerated aging 507accelerated test methodology 474accelerated testing 456adhesive 444analysis 432anisotropy 328, 571application 17automotive 227average stiffness 356axial tensile 540
bending 662bending modulus of elasticity 527bias 86biaxial envelopes 672biaxial failure 786binder locking length 260biomaterial 277bismaleimide composites 474blade stiffened panel 391bonding 444boundary 914box-beam preform 270braided composites 9, 307, 317, 391braided-fabric 277bridged crack 107bridging traction 107buckling 604, 635, 776, 786
cable installation 841cable pushing bench test 841CAI strength 307, 614carbon 483carbon fiber 886carbon fiber reinforced modified bismaleimide
composites 466carbon fibre composites 421carbon/bismaleimide composite 614carbon/epoxy composites 42, 136, 137, 138, 150
277, 672carbon/polyimide composite material 402centre-weft-stitching 270characteristic length 307coefficient of thermal expansion 189collocation method 914combined load 604
co-mingled 366comparative study 672comparison with experiment 704compliance 356composite durability 507composite filament-wound tube 540composite laminate 604composite plate 776compression 786, 807, 873, 894compression after impact 456compression strength 9compression test 614compressive failure 683compressive loading 818consolidation 366constitutive equations 160continuous fibres 721continuum mechanics 377conventiuonal coupon specimen 924cooling rate 645coordinate transformation 356course 328crack distribution 36crack opening displacement 562creep 97creep rupture 97creep testing 97crimp ratio 179cross-laying 86cross-ply 797cross-ply laminate 562crushing strength 786crystallinity 645cutouts 635cyclic 432
damage 432, 540, 830damage development 58damage entities 377damage modes and mechanisms 297damage progression 36debonding 830, 905deep drawing 338deflection 77deformation 201deformation response 377degradation 432delamination 107, 540, 552, 604, 905delamination progression 138design principle 270differential warp tension 260discontinuity 652DNS test 47double lap joint 444drape modelling 238drapeability 249

Proceedings of ICCM–11, Gold Coast, Australia, 14th-18th July 1997
V - 943
durability 493dynamic 171dynamic material properties 797
edge crack torsion(ECT) specimen 914effective moduli 595E-glass 483E-glass woven fabric reinforced vinylester
composites 28elastic constants 356, 894elastic modulus 189elastic properties 219, 571, 742electrical conductivity 749elevated temperature 466energy 377, 776energy absorption 171energy release rate 552, 863environmental conditioning 456environmental effects 432environmental testing 411epoxy 483epoxy resin 421, 734experiments 189exposure 432external pressure 786
fabric deformation 366fabric shear 238fabric specifications 270failure 171, 711failure analysis 277failure modes 444, 894failure theories 672fast heating and cooling 249fast processing 227fiber bridging 47fiber bundle pull-out test 179fiber crossing part 179fiber reinforced plastics 625fibre preforming 17fibre waviness 683fibre-bundling 768fibres 97fibrous unidirectional composite. 852filament wound structures 924finite element 107, 652, 818, 873finite element analysis 67, 776, 863finite element method 160, 179finite element modelling 841finite strains 160finite-element computation 852flexural loading 683flexural modulus 662flow behaviour 227FM-300 444formability 338fracture mechanisms 201fracture mode 402fracture toughness 466, 734fragmentation test 863
free-edge stresses 807FRP 411FRP I-beam 287
GF/PA6 645GFRP 58, 116, 411, 493glass 672glass fibre-reinforced laminated composite 742glass fibres 227global-local analysis 585
heat resistant materials 614heat transfer 366heterogeneous polymers 585hierarchical model 852high strain rate 818higher order beam theory 932high-strain-rate 693, 797homogenisation 585, 595homogenisation approach 852homogenisation finite element 189hot/wet compressive strength 402hybrid filler 734hybrid woven composite 171hygral stresses 432
IM7/E7T1-2 693impact 307implant rod 277impregnation quality 227in-plane 77inplane shear 932interface 28, 759, 830interface property 179interfacial fracture 905interfacial strength 483, 645interlaminar fracture toughness 116, 384interlaminar layer 552interlaminar shear 466, 932interlaminar shear deformation 562interlaminar shear strength 28interlaminar stresses 652, 807internal pressure and combined loading 540international exercise 672interphase 759interply and intraply porosity 540inter-ply shear viscosity 721Iosipescu shear test 932isotropic transverse beam 841
KESF testing 338Kevlar 49 797kinking 807knit 328knitted fabric composites 219knitted preforms 201knittings 211
lamina shift 58laminates 107, 662, 807

Volume V: Textile Composites and Characterisation
V - 944
lappet 86laying-up 160linear elasticity 841loading rate 277local and global analyses 297long term aging 507long tubular members 527loop density 328loop length 328loop test combined with elastica theory 886
machine settings 128macro-cell 356marine environment 411matrix rivetting 384MBS rubber 734measurement 128mechanical behaviour 466, 527mechanical modeling 189mechanical performance 287mechanical properties 67, 873mechanical properties of GRP 493mechanical response 749memory effects 595mesostructure 768microbuckling 9, 683, 807microindention 483micro-line/grid methods 562micromechanical modelling 540micromechanics 759microscopic failure process 552microstructure 317, 466microstructure mechanical properties 1milano 328minimal binder length 260mode I interlaminar fracture toughness 28mode I strain energy release rate 47mode III fracture toughness 914modelling 116, 249, 366, 807modified coupon specimen 924modulus 36, 645moisture 432moisture absorption 402, 421moisture content 499molding process 277monolayer model composites 219Monte Carlo simulation 704multiaxial 86multilayer weave 36multilayer weaving 287multi-level finite elements 585multiple delaminations 776
needle-felting 742nominal binder length 260non-crimp fabrics 238non-destructive evaluation 742non-infiltrated fibres 517non-linear deformation 517normal distribution 499
notched strengths 474
off-axis 797off-axis loading 852offshore environment 411open hole fatigue 138, 139, 147open hole tension 219optical fiber 886oriented composite layer 841oxidation resistant treatments 474oxidation/diffusion 507
parametric study 704partial interphase bond 759particulate-filled resin 734pipe buckling 841plain weave 58plates 635ply cracking 662ply drop 652polyether sulphone 421polymer composites 483, 749, 894polymer matrix composite 107polynomial interpolation 652porosity correction 571positive temperature coefficient of resistivity749postbuckling 635, 776prediction methodology 507preferred orientation 571preforms 211, 238prepreg 160pressurised pipes 517progressive debonding 759progressive fracture 759pull-out test 863pultruded rod 9
quasi-isotropic laminates 552QUIKTEMP mold 249
random fiber composite 711reinforced thermoplastics 517reinforcing tape 517release rate 776representative volume element (RVE) 377residual strength 507resin film infusion 614resin transfer molding 391resonant ultrasound spectroscopy 571rib328ring specimen 924Rosen model 704RTM 238
S-2 glass 818sandwich 211sandwich materials 905satin weave 77seawater 411, 483self-consistent methods 571

Proceedings of ICCM–11, Gold Coast, Australia, 14th-18th July 1997
V - 945
serial and parallel linkage 189shaping 249shear 873shear deformation 249shear instability 683shear modulus 625shear strength 645shear tests 932short beam shear strength 474short-fibre composite 768silane coupling agents 28silica filler 734simulation 160single fiber fragmentation test 483size effects 683softening 36specimen thickness 402split disk test, 924split-film 249Split-Hopkinson Pressure Bar 693, 797SRIM 238statistical analysis 499statistical features 402statistics 1stiffness 711stitch 107stitched composites97, 99, 103, 105, 108, 138, 139stitching 116stitching of reinforcing textiles 128stitching parameters 128stitching place 270strain energy release rates 914strain gage 1strain gradient 683strain to failure 36strength 552, 714, 894strength of monofilaments 886strength properties 219stress analysis 932stress concentration 391stress concentration factor 704stress redistribution 759stress transfer 662structural integrity 391super sonic transport 474surface preparation 444
tabbed DCB test 47tailored fibre placement 17taper 652temperature creep 97temperature effect 562tensile coupon test 924tensile modulus 625tensile properties 201tensile propeties 924tensile strength 36, 411, 527, 645tensile testing 97, 411tensile Young’s modulus of elasticity 527tension 873, 894
tension load 391tension test 614test methods 625, 873, 894textile 614textile composites 1, 9, 12, 15, 16, 138, 150, 159
179, 201textile preform 227, 249thermal aging 474thermal expansion 749thermal imaging 749thermal load 604thermal residual stress 562thermal shock 734thermal shock test 734thermal spiking 421thermal stresses 432thermodynamics 377thermoplastic 227, 366thermoplastic composite sheets 721thermoplastic polyimide composite 474thread damages 128thread-linked 270three-dimensional 86, 742three-dimensional braids 317three-point bending test 852through-the-thickness shear modulus 625through-thickness 873, 894torsion test 277tow collapse model 9transcrystallinity 645transmitted light photography 36transversal cracking 540transverse crack 552, 562traveler coupon 402triaxial 86
ultrasonics 742unidirectional 797unidirectional composites 704unit cell 356, 759
vacuum assisted resin injection 287varying-span method 625vinyl ester 818viscoelastic 595viscoelastic matrix 830
wale 328warp knitting 249water absorption 499weathering 493weave structure 28weaving 86weaving technique 270weft binder 260weft inserts 249weft-knitted preforms 338woven 270woven composite 9, 67, 97, 377, 391woven fabric 77, 160

Volume V: Textile Composites and Characterisation
V - 946
woven fabric hole 384
X-ray radiography 552
yarn-matrix interface 297Young's modulus reduction 562
Zweben model 704
55( angle ply tubes 786
α and γ phases 645

Proceedings of ICCM-11, Gold Coast, Australia, 14th-18th July 1997
V - 947
AUTHOR INDEX
ADALI, S. 77ADDESSIO, Frank L. 571ANDERSSON, Carl-Håkan 227ANWAR, K.O. 328AOKI, Takahira 604AVVA, Vishnu S. 391BAETEN, Sofie 227BAI, Jinbo 540BAI, Y.L. 27BAILLIE, Caroline A. 645BAKER, Alan A. 149BANHEGYL, G. 27BANNISTER, M.K. 36, 138, 149
260, 287, 377BANSAKU, Kazuhiro 189BATHGATE, Robert G. 97BATHIAS, C. 27BERBINAU, Pierre J. 807BEQUIGNAT, R. 27BIBO, G.A. 456BILLÖET, Jean Louis 841BLAGDON, M. 238BLANLOT, Roger 160BOMPARD, Philippe 540BOULHARTS, Habiba 841BRADLEY, W.L. 483BREKELMANS, W.A.M. 585BROOKS, R. 366BROUGHTON, W.R. 27, 894BYUN, Joon-Hyung 356CAIN, T.A. 366CAIYUN, Yang 270CALLUS, P.J. 36, 328CAMPION, Jean-Luc 841CANTWELL, W.J. 27, 905CARTLEDGE, Helen C.Y. 645CASTIGLIONI, Carlo A. 527CHAPMAN, B.J. 517CHATAWANICH, C.S. 483CHEN, L. 317CHOU, Tsu-Wei 1CHOY, C.L. 317, 466COLLINS, I.F. 721COMAN, F. 36, 377COX, Brian N. 107CURISKIS, J.I. 86, 260, 328
338DAGBA, Louis 171DAVIES, P. 905DE HAAN, J. 219DEE, Alexander T. 693DONALDSON, Steven L. 444DONG, Y.J. 27DRZAL, L.T. 27DURIE, A. 86
ENG, Kjell 227EVANS, J.T. 517FALZON, Paul J. 307FELTIN, D. 17FERRER, J.-B. 905FISA, B. 830FOCH, Bethany J. 432FROST, S.R. 517FRULLA, Giacomo 635FUJIHARA, K. 27FUJITA, A. 219FUKUDA, Hiroshi 704, 886GAMA, Bazle A. 818GAO, F. 384GIBSON, A.G. 411, 517GLATZ-REICHENBACH, J. 749GLIESCHE, K. 17GONG, X.J. 499GREAVES, R.P. 58HALE, J.M. 411HAMADA, Hiroyuki 27, 179, 219
348HAMAGUCHI, Yasumasa 402, 474HAMPE, Andreas 863HANDA, Tetsuya 734HARMON, David 507HAYAKAWA, Kosuke 604HE, Ming Y. 107HERSZBERG, I. 36, 86, 138
149, 201, 260287, 307, 328
377HIERMER, T. 277HINTON, M.J. 672, 786HIRAI, Y. 27HITCHINGS, D. 873HOA, S.V. 27HODGKINSON, J.M. 873HOGG, P.J. 456, 493HOUGH, James A. 421HU, B. 499HU, Gengkai 540ISHIKAWA, Takashi 47, 189JAIN, L.K. 116JALALI, S. Javad 625JEELANI, Shaik 818JOHN, S. 377JOHNSON, M.S. 238JONES, Frank R. 421KADDOUR, A.S. 672, 786KAKUTA, Yoshiaki 474KAMEO, K. 219KAMP, G.P. 287KARGER-KOCSIS, J.K. 27KATOH, Hisaya 402, 474

Volume V: Textile Composites and Characterisation
V - 948
KAY, M.L. 456KEDWARD, Keith T. 107KEITH, Theo G. 759KIM, Chun-Gon 924KIM, J.K. 27KNEIP, J.C. 499KOBAYASHI, Akira 552KOBAYASHI, Satoshi 552KOYAMA, Mitsuhiko 734KRAWCZAK, P. 27KUBOUCHI, Masatoshi 734KUMAGAI, Tatsuya 776KUMAR, Amrita 297LANG, Eric J. 1LEE, B. 260LEON, George 693LEONG, K.H. 36, 201, 328LESKO, J.J. 27LIAO, W.C. 914LOH, A. 138LONG, A.C. 238, 366LOWE, A. 27MÄDER, Edith 227MAHFUZ, Hassan 818MAI, Y.-W. 645MANGER, C.I.C. 58MAO, T.X. 27MAROTZKE, Christian 863MARTIN, T.A. 721MASUI, Mikio 348MATTHEWS, F.L. 873MAYER, J. 219MCCARTNEY, L.N. 662MCMANUS, Hugh L. 432MEDDAD, A. 830MEIJER, H.E.H. 585MESPOULET, S. 873MITAL, Subodh K. 759MIZUNO, Hiroshi 474MOLL, K-U. 128MOURITZ, A.P. 116MULLIGAN, David R. 768MURTHY, Pappu L. N. 759NAKAI, Asami 179, 219, 348NICOLAIDIS, A. 86, 287NYUGEN, M. 201OGIHARA, Shinji 552, 562OGIN, S.L. 58, 768ONO, Yoshinobu 189OTTO, T. 249PABIOT, J. 27PADMANABHAN, K. 27PANG, Feiyi 97PARK, Sang-Hoon 595PECOT, Alain 841PHILIPS, Dirk 211PIERSE, C. 662PINTER, S. 27PISANIKOVSKI, Toni 227
POLIT, Olivier 841PRATT, B.A. 483PREISSNER, Eric 797QI, B. 149RAINES, Roshan P. 818RAMANUJAPURAM, Vivek 391RESNYANSKY, A.D. 852RHIM, Jaewook 652ROBINSON, P. 873ROMEO, Giulio 635ROUZIC, Jean Le 841ROY, Ajit K. 444RUDD, C.D. 238, 366SAIDPOUR, H. 27SANDA, Tomio 474SAVCI, S. 338SCHMITT-THOMAS, Kh. G. 277SCHULTE, Karl 27, 227, 249SCUDAMORE, R. 905SEZEN, M. 27SHAM, M.L. 27SHIMIZU, Toshio 734SHIMOKAWA, Toshiyuki 402, 474SHIN, Franklin G. 466SHINYA, Masahiro 614SHIVAKUMAR, Kunigal N. 9, 391SHYPRYKEVICH, Peter 391SIKARSKIE, D.L. 711SKINDHØJ, Jørgen 749SMIRNOV, V.V. 27SMIT, R.J.M. 585SMITH, P.A. 58SMITH, Paul A. 768SODEN, P.D. 672, 786SPESSA, Andrea 527STEVEN, G.P. 67STEWART, R.W. 77STRÜMPLER, Ralf 749STUMPF, Hauke 227, 249SUEMASU, Hiroshi 776SUNDARESAN, Mannur 391SUSUKI, Ippei 614SUZUKI, Y. 27TAHERI, Farid 625TAKEDA, Nobuo 171, 552, 562TAN, P. 67TANIMOTO, T. 27TANZAWA, Yasuyo 47TAO, X.M. 317THISSELL, W. Richards 571THUIS, H.G.S.J. 138TOI, Yasuhiro 474TONG, L. 67TSUDA, Ken 734TU, R. L. 914VAN RAEMDONCK, Joris 211VEIDT, M. 742VERCHERY, G. 499VERIJENKO, V.E. 77
Proceedings of ICCM-11, Gold Coast, Australia, 14th-18th July 1997
V - 949
VERPOEST, Ignaas 27, 211, 227VINSON, Jack R. 693, 797VIZZINI, Anthony J. 652WADA, Atsushi 704, 886WAKEMAN, M.D. 366WANG, A.S.D. 297WANG, C.H. 97WATANABE, Naoyuki 47, 189WELLS, Gary M. 768WENPING, Guo 270WENZHANG, Li 270WHITNEY, James M. 932WIELGOSZ, Christian 171WINTERMANTEL, E. 219WISNOM, M.R. 683WOLDESENBET, Eyassu 797WOLFF, Ernest G. 807WOOD, C.A. 483
WORRALL, Christopher M. 768WULFHORST, Burkhard 128XIAN, X.J. 446YAKUSHIJI, Masayuki 886YANG, H.S. 27YANG, Zhen-Guo 277YAO, M. 384YASUI, Yosiharu 614YE, L. 27YI, Yeong-Moo 595YOON, Sung-Ho 924YOOSEFINEJAD, A. 493YOUN, Sung-Kie 595YUE, C.Y. 27ZÄH, Walter 227ZHANG, Yi 711ZULKIFLI, R. 27ZUREK, Anna K. 571