Issued September 2021
72
Issued September 2021 Center for Economic Studies Research Report: 2020 Research and Methodology Directorate
Transcript of Issued September 2021

Issued September 2021
Center for Economic Studies Research Report: 2020Research and Methodology Directorate

MISSION The Center for Economic Studies partners with stakeholders within and outside the U.S. Census Bureau to improve measures of the economy and people of the United States through research and the development of innovative data products.
HISTORY The Center for Economic Studies (CES) was established in 1982 on a foundation laid by a generation of visionaries both inside and outside the Census Bureau. CES’s early mission was to house data-bases on businesses, link them cross-sectionally and longitudinally, conduct economic research with them, and make them available to researchers.
Pioneering CES staff and visiting academic researchers began fulfill-ing that vision. Using these new data, their analyses sparked a revo-lution of empirical work in the economics of industrial organization.
Researcher access to these restricted-access data grew with the establishment of secure research data centers, the first of which was opened by CES in Boston in 1994. Today, there are such facilities located at dozens of universities and research organizations across the country.
In time, CES expanded its focus from data and research on busi-nesses to also include workers and households. Today, CES staff carry out empirical research on a wide array of subjects, leading to important discoveries in economics and other social sciences, improvements in existing Census Bureau surveys and data products, enhanced research databases, and new statistics and information products for public use.
ACKNOWLEDGMENTS Randy Becker coordinated the production of this report and wrote, compiled, or edited its various parts. Nathan Goldschlag and Martha Stinson authored Chapter 2. Adela Luque, Michaela Dillon, James Noon, and Kevin Rinz authored Chapter 3. Other CES staff contributed updates used throughout.
Faye E. Brock and Linda Chen provided publication manage-ment, graphic design and composition, and editorial review for the print and electronic media under the direction of Christine Geter, acting chief of the Graphic and Editorial Services Branch, Public Information Office.
DISCLAIMER Research summaries in this report have not undergone the review accorded Census Bureau publications, and no endorsement should be inferred. Any opinions and conclusions expressed herein are those of the author(s) and do not necessarily represent the views of the Census Bureau or other organizations. All results have been reviewed to ensure that no confidential information is disclosed.

Center for Economic Studies Research Report: 2020
U.S. Department of Commerce Gina M. Raimondo,
Secretary
Don Graves, Deputy Secretary
U.S. CENSUS BUREAU Ron S. Jarmin,
Acting Director
Issued September 2021
Research and Methodology Directorate

SUGGESTED CITATION U.S. Census Bureau,
Center for Economic Studies Research Report: 2020,
U.S. Government Publishing Office, Washington, DC, September 2021.
U.S. CENSUS BUREAU
Ron S. Jarmin, Acting Director
Ron S. Jarmin, Deputy Director and Chief Operating OfficerJohn M. Abowd, Associate Director for Research and Methodology
John L. Eltinge, Assistant Director for Research and Methodology
Lucia S. Foster, Chief, Center for Economic Studies

A Message From the Chief Economist. . . . . . . . . . . . . . . . . . . . . . . . . . . 1
Chapters
1. 2020 News . . . . . . . . . . . . . . . . . . . . . . . . . . . . . . . . . . . . . . . . . . . . . . . 3
2. Reintroducing the Longitudinal Business Database (LBD) and Business Dynamics Statistics (BDS) . . . . . . . . . . . . . . . . . . . . . . . 13
3. Introducing the Nonemployer Statistics by Demographics (NES-D) . . . . . . . . . . . . . . . . . . . . . . . . . . . . . . . . . . . . . . . . . . . . . . . . 23
Appendixes
1. Overview of the Center for Economic Studies. . . . . . . . . . . . . . . . 33
2. Publications and Working Papers by Center for Economic Studies Staff: 2020 . . . . . . . . . . . . . . . . . . . . . . . . . . . . . . . . . . . . . . . 35
3. Abstracts of Center for Economic Studies Working Papers by Census Bureau Staff: 2020. . . . . . . . . . . . . . . . . . . . . . . . . . . . . . . . 41
4. Center for Economic Studies Working Papers: 2020 . . . . . . . . . . 55
5. Longitudinal Employer-Household Dynamics (LEHD) Partners . . . . . . . . . . . . . . . . . . . . . . . . . . . . . . . . . . . . . . . . . . . . . . . . 59
6. Center for Economic Studies Organizational Chart (January 2021) . . . . . . . . . . . . . . . . . . . . . . . . . . . . . . . . . . . . . . . . . . 63
CONTENTS

This page is intentionally blank.

U.S. Census Bureau Center for Economic Studies Research Report: 2020 1
These Center for Economic Studies (CES) annual reports provide an opportunity to celebrate our accomplishments over the last year, offer in-depth looks at our major initiatives, and highlight our vision for future research and development activities. However, 2020 will be forever most remembered for the impacts that the COVID-19 pandemic had on the lives of all Americans.
How and where CES did its work changed in mid-March, as it did for so many, but the focus of some of our work also shifted in 2020—while continuing to carry out our previously planned research and development activities. Chapter 1 opens with a discussion of CES staff providing emergent technical support to the 2020 Census; develop-ing content and analytic tools for the Small Business Pulse Survey, which was quickly estab-lished to measure the pandemic’s impact; and helping to launch supplemental weekly Business Formation Statistics to provide timely, high-frequency data at an especially critical time.
Chapters 2 and 3 focus on two multiyear efforts that CES staff brought to successful comple-tions in 2020. One way to categorize business activity is by employer and nonemployer status. CES conducts research and development activities on both types of businesses, as is evi-denced in the work described in Chapters 2 (employers) and 3 (nonemployers).
Chapter 2 describes CES staff intensive efforts that led to improvements in two of CES’ flagship data products: the Longitudinal Business Database (LBD) and Business Dynamics Statistics (BDS). The LBD is a confidential database of private, nonfarm employer businesses developed by CES economists more than 20 years ago. Since then, it has become one of the most requested databases by qualified researchers on approved projects in the Federal Statistical Research Data Centers. The LBD is also the data infrastructure that supports the BDS public-use data product, which provides annual measures of job creation and job destruc-tion, firm startups and shutdowns, and establishment entry and exit. These statistics are available for the entire economy and for subsets of businesses classified by size, age, industry, and/or geography. The BDS are continually cited in the press, by policymakers, and are used by academics to help understand the U.S. economy.
Chapter 3 provides an introduction to the new annual data product Nonemployer Statistics by Demographics (NES-D). As its name suggests, the NES-D focuses on nonemployers, which are businesses with no paid employees. Nonemployers account for a large share of U.S. businesses but are relatively small, so they account for only about three percent of total revenue. The NES-D produces annual statistics on the number of nonemployer businesses and their receipts by owner sex, ethnicity, race, and veteran status, with additional detail available by industry, geography, receipt-size class, and legal form of organization. Some additional demographic characteristics on owners are also available, including age, foreign-born status, and citizenship
A MESSAGE FROM THE CHIEF ECONOMIST
(Continued)

2 Center for Economic Studies Research Report: 2020 U.S. Census Bureau
status. The authors of Chapter 3 provide details about the motivation for the development of the NES-D, a discussion of some of the challenges that the team faced, and a sample of some interesting statistics from the series.
Looking towards the future, CES researchers are working on projects that cover many areas of the U.S. economy and population. As some examples, CES staff have created a community of practice spanning all areas of the U.S. Census Bureau concerning research related to the envi-ronment, natural disasters, and energy. The aptly named Environment, Natural disasters, and Energy Research Group (ENERG) serves as a coordination and collaboration body for climate- and environment-related research across the Census Bureau. CES staff are also focusing atten-tion on the measurement of business deaths, which became especially important during the pandemic. Finally, CES staff are working on greater integration of business and demographic data over a variety of areas.
Thank you to everyone who contributed to our annual report. Randy Becker compiled and edited all of the material. Editorial review was performed by Faye Brock, and design services and cover art production by Linda Chen, both of the Public Information Office. Other contribu-tors are acknowledged on the inside cover.
Lucia S. Foster, Ph.D. Chief Economist and Chief of the Center for Economic Studies
A MESSAGE FROM THE CHIEF ECONOMIST—Con.

U.S. Census Bureau Center for Economic Studies Research Report: 2020 3
MEETING CHALLENGES AND PRODUCING CRITICAL INFORMATION
Pivoting to remote work posed some challenges for Center for Economic Studies (CES) staff, but pulling together, we met these challenges. In addition to providing research support for 2020 Census operations, CES staff lent their expertise toward two U.S. Census Bureau products supplying critical information during the COVID-19 pandemic, while our regular research and development activities continued apace.
Throughout 2020, CES staff contributed timely expertise to several 2020 Census efforts in response to challenges includ-ing the pandemic. Our staff provided analyses and sup-port in several areas, including group quarters enumeration, self-response quality assurance, and measuring citizenship in the population.
In response to the COVID-19 pandemic, the Census Bureau introduced a number of new data products including the Household Pulse Survey, the Small Business Pulse Survey (SBPS), Community Resilience Estimates, and weekly Business Formation Statistics (BFS). CES staff contributed to the SBPS in a number of capacities: devel-oping content, creating indices, providing weekly analysis, and documenting the survey and results via CES working papers.
In response to the need for more timely data, CES research-ers worked with the Economic Directorate to produce a weekly version of the BFS—an experi-mental product developed in CES and released on a quarterly basis beginning in 2018. The SBPS and the weekly BFS both started publishing results in spring of 2020 and continue to provide critical information.
While it’s hard to recreate a col-legial research office virtually, our talented staff (Appendix 6) nonetheless had a produc-tive year. CES research staff released 28 new papers in the CES Working Paper Series (Appendix 3 for abstracts) and had another 56 papers
published (or forthcoming) as journal articles or book chapters (Appendix 2). Some recently published journal articles are highlighted in the “Notable 2020 Publications by Center for Economic Studies Staff” text box. The “Publications by Center for Economic Studies Staff by Journal Rank: 2020 and Forthcoming” figure shows that CES staff research is being published in many of the top peer-reviewed journals in eco-nomics including the Quarterly Journal of Economics, Journal of Political Economy, Journal of Public Economics, European Economic Review, and Journal of Labor Economics.
Chapter 1. 2020 News
Figure 1-1. Publications by Center for Economic Studies Staff by Journal Rank: 2020 and Forthcoming
Note: Ranking of journals in economics is taken from Combes and Linnemer (2010), where categories (ranks) are: AAA (1–5), AA (6–20), A (21–102), B (103–258), C (259–562), and D (563–1,202). Source: U.S. Census Bureau.
Book chapters
Journals outside of economics
DCBAAAAAA
23
2
11
5
18
0
15

4 Center for Economic Studies Research Report: 2020 U.S. Census Bureau
NOTABLE 2020 PUBLICATIONS BY CENTER FOR ECONOMIC STUDIES STAFF
“Race and Economic Opportunity in the United States: An Intergenerational Perspective”
Raj Chetty, Nathaniel Hendren, Maggie R. Jones, and Sonya R. Porter Quarterly Journal of Economics Volume 135, Issue 2, May 2020, pp. 711–783
We study the sources of racial disparities in income using anonymized longitudinal data covering nearly the entire U.S. population from 1989 to 2015. We document three results. First, Black Americans and American Indians have much lower rates of upward mobility and higher rates of downward mobility than Whites, leading to persistent disparities across generations. Conditional on parent income, the Black-White income gap is driven by differences in wages and employment rates between Black and White men; there are no such differences between Black and White women. Hispanic Americans have rates of intergenerational mobility more similar to Whites than Blacks, leading the Hispanic-White income gap to shrink across generations. Second, differences in parental marital sta-tus, education, and wealth explain little of the
Black-White income gap conditional on parent income. Third, the Black-White gap persists even among boys who grow up in the same neighborhood. Controlling for parental income, Black boys have lower incomes in adulthood than White boys in 99 percent of census tracts. The few areas with small Black-White gaps tend to be low-poverty neighborhoods with low levels of racial bias among Whites and high rates of father presence among Blacks. Black males who move to such neighbor hoods ear-lier in childhood have significantly better out-comes. However, less than 5 percent of Black children grow up in such areas. Our findings suggest that reducing the Black-White income gap will require efforts whose impacts cross neighborhood and class lines and increase upward mobility specifically for Black men.
“Business Dynamics Statistics of High-Tech industries”
Nathan Goldschlag and Javier Miranda Journal of Economics & Management Strategy Volume 29, Issue 1, Spring 2020, pp. 3–30
Modern market economies are characterized by the reallocation of resources from less productive, less valuable activities to more productive, more valuable ones. Businesses in the high-tech sector play a particularly impor-tant role in this reallocation by introducing new products and services that impact the entire economy. In this paper, we describe an extension to the U.S. Census Bureau's Business
Dynamics Statistics, which tracks job creation, job destruction, startups, and exits by firm and establishment characteristics including sector, firm age, and firm size in the high-tech sector. We preview the resulting statistics, showing the structural shifts in the high-tech sector over the past 30 years including the surge of entry and young firm activity in the 1990s that reversed abruptly in the early-2000s.

U.S. Census Bureau Center for Economic Studies Research Report: 2020 5
More information is available about our researchers and our research, including access to papers in our working paper series (which also continues to include working papers by researchers active in the federal statistical research data cen-ters), on our Web site <www.census.gov/programs -surveys/ces.html>. Our Web site also includes links to our public-use data products and our various analysis and visu-alization tools which are dis-cussed next.
RELEASES OF PUBLIC-USE DATA
CES continued to maintain and update its public-use data prod-ucts in 2020, including Business Dynamics Statistics, Business Formation Statistics, Dispersion Statistics on Productivity, Quarterly Workforce Indicators, LEHD Origin-Destination Employment Statistics, OnTheMap, OnTheMap for Emergency Management, Job-to-Job Flows, Post-Secondary Employment Outcomes, and the Opportunity Atlas. In addition, 2020 saw the launch of a new,
experimental statistical product: Veteran Employment Outcomes.
In September 2020, the U.S. Census Bureau released the 2018 Business Dynamics Statistics (BDS), which provides annual statistics from 1978 to 2018 on establishment openings and closings, firm startups and shutdowns, employment, job creation, and job destruction by firm (or establishment) size, age, industry, state, metropoli-tan area, and county.
With this release, the BDS has been fully redesigned, with improvements and enhance-ments on several dimensions. This includes a substantial expansion of the set of charac-teristics over which statistics are released. The most notable are statistics using a consistent NAICS industry classification for the entire time series, at the sector, 3-digit, and 4-digit NAICS levels. In addition, available geography now also includes metropolitan statisti-cal area (MSA) and county. Several new multiway interac-tions permit analyses at levels of detail not previously possible, including county by firm size
and firm age as well as MSA by NAICS sector by firm size and firm age groups. These more disaggregated BDS statistics are possible in part because of the use of noise infusion as the disclosure avoidance meth-odology. The redesigned BDS also reflects improvements in source data (especially in early years), an integration with the Statistics of U.S. Businesses data program, greater align-ment with County Business Patterns data, improvements to the linking methodology, and standardization of the produc-tion processing.
More information about the BDS is available at <www.census.gov /programs-surveys/bds.html>. Chapter 2 of this annual report provides a further introduc-tion to the BDS and its recent redesign.
In 2018, the Census Bureau launched the Business Formation Statistics (BFS)—an experimental public-use data series on business startups. In particular, the BFS provides timely, quarterly measures of new business applications and business formations. Business
THE CENTER FOR ECONOMIC STUDIES DISSERTATION MENTORSHIP PROGRAM
Many graduate students use restricted-use U.S. Census Bureau microdata in the federal statistical research data centers for their Ph.D. dissertation research, and many of these doctoral candidates are eligible to apply to the Center for Economic Studies (CES) Dissertation Mentorship Program. Program participants are assigned one or more CES researchers as mentors, who advise students
on the use of Census Bureau microdata. Students are also given the opportunity to visit CES to meet with our research staff and present research in progress. This year, CES accepted six new participants into the pro-gram and, at the close of 2020, mentored 52 students from 25 different universities and a variety of different disciplines since the pro-gram began in 2008.

6 Center for Economic Studies Research Report: 2020 U.S. Census Bureau
applications are indicated by applications for an Employer Identification Number (EIN), while business formations (actual and projected) originat-ing from such business appli-cations are based on the first recorded payroll tax liability for an EIN. Delays in business formation are measured by the average duration between busi-ness application and business formation. All BFS series are available for the United States, the 50 states, and Washington, DC, beginning with the third quarter of 2004.
In 2020, a number of changes to the BFS were introduced. Research into producing higher frequency statistics were well underway when the pandemic struck. In April, the Census Bureau quickly reacted and began releasing state-level weekly BFS on business appli-cations, in order to provide data users with more timely data on the rapidly changing busi-ness environment. To satisfy an interest in industry-specific weekly data, a one-time release of business applications data by industry was released for all of 2019 through week 40 of 2020. In November, the first publica-tion of annual business applica-tions by county was released for 2005–2019 and will be updated and released annually.
Beginning in 2021, the quar-terly series will be replaced by monthly series, retroactive to July 2004, which will be released on a monthly schedule going forward. BFS data will also be available by NAICS sector.
Further details on the BFS and access to the latest data are available at <www.census.gov /econ/bfs/>. Chapter 3 of our 2018 annual report also offers an introduction to the BFS.
The BFS is a product of CES, developed in research col-laboration with economists from the Board of Governors of the Federal Reserve System, Federal Reserve Bank of Atlanta, University of Maryland, and University of Notre Dame.
In 2019, the Census Bureau and the Bureau of Labor Statistics (BLS) launched Dispersion Statistics on Productivity (DiSP), an experimental data series that sheds new light on the U.S. manu facturing sec-tor. The DiSP includes annual measures of within-industry dispersion in productivity (i.e., output per hour and multifactor productivity) for each 4-digit NAICS manufacturing industry. The measures of dispersion include standard deviation, interquartile range (75–25), and interdecile range (90–10). With an update in September, the DiSP now covers 1997 through 2016. More details on the DiSP and access to the data are available at <www.census.gov /disp/>.
The Quarterly Workforce Indicators (QWI) is a set of economic indicators—including employment, job creation, earn-ings, worker turnover, and hires/separations—available by differ-ent levels of geography, industry, business characteristics (firm age and size), and worker demo-graphics (age, sex, educational
attainment, race, and ethnic-ity). In 2015, the Census Bureau first introduced the National Quarterly Workforce Indicators, which provide a consistent reference point for users of the state-level QWI. These data are available via the LED Extraction Tool at <https://ledextract.ces .census.gov>.
These data are also available through QWI Explorer, a Web-based analysis tool that enables comprehensive access to the full depth and breadth of the QWI dataset. Through an easy-to-use dashboard interface, users can construct tables and charts to compare, rank, and aggregate indicators across time, geography, and/or firm and worker characteristics. Users can download their analy-ses to an Excel spreadsheet, a PNG/SVG chart image, or a PDF report, or they can share data tables and visualizations via URLs and through social media. Access to QWI Explorer is available at <https://qwiexplorer .ces.census.gov>.
This year’s releases incorpo-rated the latest available data from states and updated the base geography to TIGER 2019.
CES staff continue to main-tain and improve the LEHD Origin-Destination Employment Statistics (LODES) and the OnTheMap application. LODES is a partially synthetic data-set that describes the geo-graphic patterns of jobs by their employment locations and residential locations and the connections between the two locations, and OnTheMap is the

U.S. Census Bureau Center for Economic Studies Research Report: 2020 7
award-winning online mapping and reporting application that utilizes LODES data to show where people work and where workers live. The easy-to-use interface allows the creation, viewing, printing, and down-loading of workforce-related maps, profiles, and underlying data. An interactive map viewer displays workplace and resi-dential distributions by user-defined geographies at census block-level detail. The applica-tion also provides companion reports on worker character-istics and firm characteristics, employment and residential area comparisons, worker flows, and commuting patterns. In OnTheMap, statistics can be generated for specific segments of the workforce, including age, earnings, sex, race, ethnic-ity, educational attainment, or industry groupings. One can also find firm age and firm size, allowing analysis of the impacts of young/old firms or small/large firms in relation to com-muting patterns and worker characteristics. Both LODES and OnTheMap can be used to answer a variety of questions on the spatial, economic, and demographic aspects of work-places and home-to-work flows.
In December, version 6.8 of OnTheMap was released, adding an additional year of LODES data, extending availability from 2002 through 2018, and back-filling data on federal workers for 2016 and 2017. This release also updates the base geogra-phy to TIGER 2019.
OnTheMap can be accessed at <https://onthemap.ces.census .gov>, and LODES data can
be directly downloaded at <https://lehd.ces.census.gov /data/#lodes>.
This year, two new versions of OnTheMap for Emergency Management (OTMEM) were released. First introduced in 2010, OTMEM is an online data tool that provides unique, real-time information on the population and workforce for areas affected by hurricanes, floods, wildfires, and winter storms, and for federal disaster declaration areas. Through an intuitive interface, users can easily view the location and extent of current and fore-casted emergency events on a map and retrieve detailed reports containing population and labor market characteristics
for these areas. These reports provide the number of affected residents by age, race, ethnicity, sex, and housing characteristics. The reports also provide the number and location of jobs by industry, worker age, earnings, and other worker characteris-tics. To provide users with the latest information on rapidly changing events, OTMEM automatically incorporates real-time data updates from the National Weather Service, U.S. Department of Interior and U.S. Department of Agriculture, and the Federal Emergency Management Agency. Chapter 2 of our 2013 annual report offers a more detailed overview of OTMEM.
LONGITUDINAL EMPLOYER-HOUSEHOLD DYNAMICS TURNS 20
Twenty years ago, the U.S. Census Bureau set out to create a secure database of all jobs in the United States and to provide new data and tools to policymakers to help them track the vitality of the U.S. workforce.
What began as a pilot—to combine the wage records from one state, Maryland, with data on individuals and businesses already collected by the Census Bureau—became Longitudinal Employer-Household Dynamics (LEHD), a source of a number of innovative data products, including Quarterly Workforce Indicators, OnTheMap, Job-to-Job Flows, and Post-Secondary Employment Outcomes. All of these data have been made easy-to-access using interactive tools that require little training.
Among the enduring features of LEHD data products are that they impose no additional data collection burden on workers or their employers and are created at relatively minimal expense. The Center for Economic Studies continues to explore new ways to use this same data infrastructure to create data and tools that will shed even greater light on the U.S. labor market.

8 Center for Economic Studies Research Report: 2020 U.S. Census Bureau
In February, version 4.4.3 was released, which updated the American Community Survey data to the 2014–2018 5-year estimates and updated the underlying LODES data to 2017. In August, version 4.4.4 updated the map display to show sepa-rately the COVID-19 Emergency and Disaster Declaration areas that have been declared. OTMEM can be accessed at <https://onthemap.ces.census .gov/em/>.
Both OnTheMap and OTMEM are supported by the state partners under the Local Employment Dynamics (LED) partnership with the Census Bureau, as well as the Employment and Training Administration of the U.S. Department of Labor.
CES staff continue to update Job-to-Job Flows (J2J), a set of statistics on the movements of workers between jobs includ-ing information on the job-to-job transition rate, hires and separations from and to non-employment, earnings changes due to job change, and charac-teristics of origin and destination jobs for workers changing jobs. These statistics are available at the national, state, and metro-politan area levels and by (origin and destination) NAICS sector, firm age and size, and worker demographic characteristics including sex, age, education, race, and ethnicity.
In June, four new measures of average earnings were added to the core J2J tables, namely average earnings prior to (following) stable job-to-job separations (hires) for both con-tinuous employment and brief
nonemployment. In addition, many additional series now have seasonally adjusted equivalents.
These J2J data files and asso-ciated documentation are available for download at <https://lehd.ces.census.gov /data/#j2j>.
First released in 2017, Job-to-Job Flows Explorer is an interac-tive, Web-based analysis and visual ization tool that allows users to construct tables, maps, and charts to compare, aggre-gate, and analyze J2J statistics by worker and firm characteris-tics. In September, version 1.01 was released, providing access to the most recent J2J data, introducing new earnings indica-tors for comparisons, and fixing various bugs.
Access to J2J Explorer is available at <https://j2jexplorer .ces.census.gov>. Documentation is available at <https://lehd.ces .census.gov/applications/help /j2j_explorer.html>.
This year also saw the further expansion and development of the experimental Post-Secondary Employment Outcomes (PSEO) statistics and visualization tool. First intro-duced in 2018, PSEO provides earnings and employment outcomes of post-secondary graduates by institution, degree field, and degree level for 1, 5, and 10 years after graduation. Tabulations also include the destination industry and geog-raphy of employed graduates. This year, numerous institutions in New York, Pennsylvania, and Texas were added. Tabulations now also use 2020 Classification of Instructional
Program (CIP) codes, and new earnings aggregations at the 2-digit CIP level are now included. The PSEO Explorer provides users with an easy way to visualize graduates’ earnings outcomes and employment flows. For more information about PSEO and examples of its use, refer to Chapter 3 of our 2019 annual report.
PSEO data and documentation are available at <https://lehd.ces .census.gov/data/pseo _experimental.html>. Access to PSEO Explorer is available at <https://lehd.ces.census.gov /data/pseo_explorer.html>.
In May, Veteran Employment Outcomes (VEO), our latest experimental data product, was launched. VEO provides earn-ings and employment outcomes in the civilian labor market for U.S. Army veterans by military occupation, rank, years of ser-vice, demographic characteristics (age, sex, race, ethnicity, educa-tion), industry, and geography of employment for 1, 5, and 10 years after they completed their initial term of active-duty service. VEO statistics can also be accessed using VEO Explorer, an easy-to-use, interactive, visualization tool that allows comparisons of veter-ans’ outcomes with line and bar charts. More information about VEO and examples of its use are available in Chapter 3 of our 2019 annual report.
VEO data and documentation are available at <https://lehd.ces .census.gov/data/veo _experimental.html>. Access to VEO Explorer is available at <https://lehd.ces.census.gov /applications/veo>.

U.S. Census Bureau Center for Economic Studies Research Report: 2020 9
A list of partners who make our QWI, LODES, OnTheMap, OTMEM, J2J, PSEO, and VEO products possible is in Appendix 5.
In 2018, in collaboration with researchers at Harvard University and Brown University, the Census Bureau launched the Opportunity Atlas, a new interactive tool providing access to highly localized data on social mobility. Using ano-nymized data covering nearly the entire U.S. population, the Opportunity Atlas contains tract-level information on chil-dren’s outcomes in adulthood including income and incarcera-tion rates by parental income, race, and gender. Visitors to <https://opportunityatlas.org> can explore the data through the online visualization tool, overlay their own data of inter-est, and download the result-ing measures into a dataset for their own analyses. Chapter 2 of our 2018 annual report contains a more in-depth discussion of the Opportunity Atlas and its potential for policymakers and researchers interested in inter-generational mobility.
RESEARCH WORKSHOPS
The workshops that CES had planned for 2020 were all can-celled or postponed, including what would have been the tenth annual BLS-Census Research Workshop and the twenty-first LED Partnership Workshop. Workshops will return in an online-only format in 2021, with the second IRS-Census Income Measurement Workshop in March, the first Census Bureau Mortality Studies Workshop in March, and the LED Workshop in April.
THE LOCAL EMPLOYMENT DYNAMICS WEBINAR SERIES
The U.S. Census Bureau and the Local Employment Dynamics (LED) Partnership, in collaboration with the Council for Community and Economic Research, hosts an ongoing Webinar series focusing on uses of Longitudinal Employer-Household Dynamics (LEHD) data. In 2020, the following Webinars were held:
• Using National Jobs Data to Measure Graduate Impact (Andrew Foote, CES).
• Combining Census Data with OpenStreetMap Data to Develop Highway Access Measures (Colby Brown, Manhan Group).
• Statistics of Army Veterans Transitioning into the Civilian Labor Market (Erika McEntarfer, CES).
• COVID-19 Demographic and Economic Resources Using Census Data (Andrew Hait and Earlene Dowell, Census Bureau).
• Analyzing Job-to-Job Flows in the Houston Metropolitan Area Using LEHD J2J Data (Pramod Sambidi, Houston-Galveston Area Council).
• Providing Perspective During COVID-19 Using Census Data (Cameron Macht, Minnesota Department of Employment and Economic Development).
• Connecticut's Manufacturing Workers Age Profile and Implications for Earnings (Patrick Flaherty, Connecticut Department of Labor).
• A Preliminary Investigation Into the Metro Area Job-to-Job Flows and Earnings Data in the Manufacturing Sector (Dylan Schafer, Michigan Bureau of Labor Market Information).
• Job-to-Job Flows and the Consequences of Job Separations (Matthew Staiger, CES).
Recordings of these and earlier Webinars are available at <https://lehd.ces.census.gov/learning/#webinars>.

10 Center for Economic Studies Research Report: 2020 U.S. Census Bureau
CES STAFF RECEIVE RECOGNITION
In November, Emin Dinlersoz and eight other team members were presented the Department of Commerce’s Silver Medal Award for their successful develop-ment and launch of the Census Bureau’s Business Formation Statistics, which offers near real-time measures of entrepre-neurial activity at the state and national levels. (Chapter 3 of our 2018 annual report contains
The Citizenship Data Quality and Legal Support Team provided urgent technical support for the 2020 Census.
an overview of the BFS.) The Silver Medal, the second-highest honorary award given by the department, is granted by the Secretary of Commerce for exceptional performance charac-terized by noteworthy or super-lative contributions that have a direct and lasting impact within the department.
In a February ceremony, the Census Bureau recognized the achievements of nine CES staff members with the Bronze Medal
Award for Superior Federal Service. Established in 1965, the Bronze Medal is the highest hon-orary recognition given by the Census Bureau.
At that ceremony, Maggie Jones and Sonya Porter were recog-nized for their work with their academic partners in creating the Opportunity Atlas, an innova-tive data tool that maps inter-generational mobility at a highly localized level. Chapter 2 of our 2018 annual report provides an overview of Opportunity Atlas.
In the same ceremony, David Brown, Suzanne Dorinski, Lawrence Warren, Moises Yi, and others were awarded a Bronze Medal for their 18 months of work on the citizenship data quality and legal support team. The request to add a citizenship question to the 2020 Census, the Secretary of Commerce's instruction to do so in combina-tion with administrative records, and lawsuits seeking to enjoin the Census Bureau from asking the question, required the urgent technical research and support that this team provided.

U.S. Census Bureau Center for Economic Studies Research Report: 2020 11
The Global Market Finder Team developed an interactive tool for companies to identify promising export opportunities.
The successful migration of projects to the IRE benefited one thousand researchers internal and external to the Census Bureau.
C.J. Krizan and the four other members of the Global Market Finder Team were recognized for their efforts to develop an interactive tool for companies to identify the most promising overseas export markets for their product, utilizing the most up-to-date international trade statistics.
Cheryl Grim and Danielle Sandler, along with other team members, received a Bronze Medal for successfully migrat-ing research by Census Bureau staff and external researchers in the federal statistical research data centers to the Integrated Research Environment (IRE), allowing researchers access to a single repository for data sharing and collaboration.
We applaud all these award recipients for their dedication and effort.

This page is intentionally blank.

U.S. Census Bureau Center for Economic Studies Research Report: 2020 13
Introduction
In this chapter, we describe recent improvements to the U.S. Census Bureau’s Longitudinal Business Database (LBD) and Business Dynamics Statistics (BDS) products. The LBD is a confidential histori-cal listing of private, nonfarm business establishments with employees that operated in the United States starting in 1976. First developed by the Center for Economic Studies (CES) economists in the late 1990s (Jarmin and Miranda, 2002), this database links establishment records over time, enabling researchers to calculate year-to-year employment changes and observe the birth, death, expan-sion, and contraction of firms and their establishments.1 The BDS is a public-use data prod-uct tabulated from the LBD. First published in 2009, the BDS provides measures of job cre-ation, job destruction, and firm and establishment entry and exit, as well as measures of total employment and establishment counts. These statistics are cre-ated for the entire economy and for subsets of businesses classi-fied by size, age, industry, geog-raphy, or combinations of these characteristics. Over time, the LBD and the BDS have become important tools for measuring
¹ For more history of the development of the LBD and BDS, refer to Chow et al. (2021).
the composition of economic activity across geographic loca-tions, industries, and firm and establishment characteristics. In particular, researchers have relied on the BDS to provide information about the contri-bution of entrepreneurship to job creation, long-run trends in start-up activity, and the chang-ing size and age composition of firms in the economy.
To ensure the continuation and quality of these data prod-ucts, CES staff led a multiyear effort to develop a formal production system for the LBD and BDS that was fully docu-mented, efficient, and repli-cable. Working together with analysts and programmers in the Census Bureau’s Economic Directorate, CES staff devel-oped a system that is flexible enough to process annual data in many different historical for-mats, fast enough to create the 43-year time series (1976–2018) in one-half the time previ-ously required, and capable of producing more detailed BDS statistics at the county-level and within 4-digit NAICS industry categories. The team reached a major milestone in September 2020, when the new produc-tion system was used for the first time to produce the 2018 vintage of the LBD and pub-lish the 2018 BDS. Users can explore these new BDS statistics through BDS Explorer, a data
visualization tool available at <www.census.gov/data/data -tools/bds-explorer.html>, and researchers with approved projects are now able to use the new restricted-use LBD microdata files in the federal statistical research data centers (FSRDCs).
We begin this chapter with a review of the contents and uses of the LBD and BDS and describe patterns in start-up activity using the BDS tabu-lations. We then give a brief overview of the reengineered production process. Finally, we conclude with ideas for future development of the LBD and BDS.
Contents and Uses of the LBD and BDS
The LBD is created using the Business Register (BR), the Census Bureau’s sampling frame for economic surveys and censuses, which contains the universe of nonfarm employer business establishments. (Data on nonemployer businesses are the subject of Chapter 3 of this annual report.) The main contribution of the LBD is to link annual snap shots of the BR over time to measure changes in business activity. The basic building block of the BR, and in turn the LBD, is the establishment, which repre-sents a physical place of busi-ness. Each establishment has
Chapter 2. Reintroducing the Longitudinal Business Database (LBD) and Business Dynamics Statistics (BDS)Nathan Goldschlag and Martha Stinson, Center for Economic Studies

14 Center for Economic Studies Research Report: 2020 U.S. Census Bureau
geographic identifiers (street address, county, metropolitan statistical area [MSA], state), an industry code, payroll, and employment. Using the longitu-dinal linking of the LBD, we also track establishments over time and calculate the age of each establishment in every year of operation. In addition to estab-lishment characteristics, the LBD also contains information about firms. A firm in the LBD is an entity that holds one or more establishments in common own-ership. The firm-establishment link allows characteristics of firms, such as size and age, to be assigned to establishments.2
The LBD is one of the most frequently requested data-sets within the FSRDC system. Researchers have used the LBD to study many different topics including entrepreneurship and innovation, the impacts of trade, firm financing, and policies such as the minimum wage, to name a few. The LBD is also key in link-ing establishments longitudinally and grouping establishments by firm. For a complete codebook and instructions on how to link the LBD to other data sources, refer to Section 3 and Appendix A of Chow et al. (2021).
2 Firm size of an establishment is calculated as the average of the sum of employment of all establishments owned by the establishment’s associated firm in year t and the sum of employment of all establishments owned by the establish-ment’s associated firm in year t-1. An establishment may change ownership between year t-1 and t and, therefore, its firm size may change as well. Firm age is calculated as the age of the oldest establishment in the firm’s first year with positive employment after which the firm age increments each year. Firms born at age zero are start-ups or new firms. Firms born at older ages are either reac-tivations or reorganizations of existing establishments.
The BDS tables, tabulated from the LBD, contain stock and flow measures of establishments and employment. Establishment flows include establishment entry and exit, and employment flows include job creation and job destruction. Establishments enter employment-active status when they change from hav-ing no workers to having paid employees. Exit is the oppo-site—an establishment exits when it sheds all its workers from one year to the next. Examining patterns in estab-lishment exit and entry helps policymakers answer questions about the extensive margins of economic activity, provid-ing information about where and in what industries busi-nesses are beginning or ending operations. Job creation and destruction focus on changes in employment within establish-ments. Job creation captures increases in employment from one year to the next, provid-ing the number of jobs added each year. Job destruction, on the other hand, measures year to year decreases in employ-ment, allowing us to total the number of jobs that ended each year.3 The BDS ties these two measures of business dynamics together by report-ing job creation and destruc-tion for all establishments but also separately for continuing, entering, and exiting establish-ments. This distinction enables
3 It is important to note that the BDS calculates job creation and destruction as net year-over-year differences in the level of establishment-level employment rather than the sum of flows of individual workers. The later concept is used in the Quarterly Workforce Indicators published by the Longitudinal Employer Household Dynamics (LEHD) program.
policymakers and researchers to determine the relative contri-butions of existing, entering, and exiting businesses to job creation and destruction.
The BDS is particularly useful for studying entrepreneur-ship and the formation of new firms. The BDS differentiates between new, start-up firms and existing firms by classify-ing entering establishments into firm age categories. If all the establishments at a new firm are in their first year of positive employment, the firm is labeled as a start-up, or age zero firm. In contrast, older firms may expand by opening new establishments, which is useful for understanding what types of firms survive and grow. Comparing job creation at entering establishments, stratified by firm age, provides information on the relative mag-nitude of both types of growth.
The BDS also provides informa-tion about firm death, identi-fied when all establishments at a firm cease to have positive employment in a year (i.e., exit) and never reenter economic activity for the remainder of the time series. Firm death is dis-tinct from the closing of estab-lishments by continuing firms that may be winding down or reorganizing their activities. The BDS reports the total number of firm deaths in each year, as well as the associated number of establishments that died and the total employment lost as a result.
A final type of employment change is captured by counts of entering establishments

U.S. Census Bureau Center for Economic Studies Research Report: 2020 15
classified by establishment age. If an establishment exits from a positive employment state but returns to employment activity in a later year, the business will be labeled as an entrant but will not be age zero. Establishment entrants at older ages repre-sent reactivations and are more common among small firms that operate at a single loca-tion. Measures of the number of reactivations in a geographic area, and the corresponding job creation, can be particularly useful following shocks to local economies by providing infor-mation on the number of previ-ously existing businesses that were able to return to economic activity.
New BDS users are encouraged to begin their investigation of the data with the Economy-Wide Table (bds2018.csv) in order to familiarize themselves with the structure of the BDS. Many users will subsequently be interested in statistics at finer levels of granularity. The BDS includes an additional 77 tables that report establishment and job dynamics by both firm characteristics (firm size, firm age) and establishment charac-teristics (size, age, geography, and industry) and cross tabula-tions thereof. A complete list of all tables, as well as further details on BDS methodology, definitions, and source data, is available on the BDS home
page at <www.census.gov /programs-surveys/bds.html> and in Chow et al. (2021) Section 11.
Trends in Business Dynamism
The BDS tables can be used to investigate long-run trends in employment flows, reallocation, and start-up activity. Job cre-ation and job destruction rates capture the total share of jobs created and destroyed in the economy each year. Figure 2-1 displays these measures from 1980 through 2018, showing a significant decline in employ-ment flows over the past 4 decades. In the late 1980s, the job creation rate was roughly 19 percent and the job destruction
Job creation rate
Job destruction rate
10
12
14
16
18
20
20152010200520001995199019851980
Note: The job creation rate is 100 times the sum of all positive employment changes at establishments that expanded their employment, divided by the sum of average establishment-level employment between year t and t-1. Job destruc-tion rate is calculated similarly by dividing the sum of all negative employment changes by the same denominator. Source: U.S. Census Bureau, 2018 Business Dynamics Statistics.
Figure 2-1.Job Creation and Job Destruction Rates(Percent)

16 Center for Economic Studies Research Report: 2020 U.S. Census Bureau
rate averaged about 15 percent. In contrast, after 2010, the job creation rate averages about 13 percent, falling by nearly a third. In similar fashion, the job destruction rate declined by nearly a quarter to about 11 percent after 2010.
Another key insight made pos-sible by the BDS is that start-up activity has declined precipi-tously over the same period (Figure 2-2). In the late 1980s, about 12 percent of firms in a year were start-ups. After 2010, the start-up rate stabilized at about 8 percent, falling by a third. The share of employment at start-ups shows a similar pattern, falling from about 1.9
percent of all employment being at start-ups in the late 1980s to about 0.9 percent after 2010. These patterns are important because of the role young firms play in job creation. Young firms on average experience an up-or-out dynamic, in which many fail but a few survive and grow quickly, contributing dispro-portionately to net job creation (Decker et al., 2014). Research using the LBD microdata has also shown that young firms tend to be more innovative (Acemoglu et al., 2018).
A significant improvement to the BDS made possible by the LBD redesign is the release of detailed geographic tabulations.
Using counts of firms by county and firm age categories, we can explore heterogeneity in the decline of start-up activity across geographies. Figure 2-3 shows the change in the start-up rate between the late 1980s and post-2010 by county. The darkest red counties experi-ence the largest declines in their start-up rate, while the darkest green counties saw an increase in the start-up rate. The decline in start-up activity is very widespread. Over 94 per-cent of counties saw a decline in their start-up rate over this period—only 43 of over 3000 counties saw an increase in the share of start-ups. The five
Start-up rate Start-up employment share
3
5
7
9
11
13
15
20152010200520001995199019851980
Start-up rate (left)
Start-up employment share (right)
0.5
1.0
1.5
2.0
2.5
Note: The start-up rate is 100 times the count of all aged zero firms in a given year divided by the total number of active firms that year. The start-up employment share is 100 times the total employment at aged zero firms divided by the sum of average establishment-level employment between year t and t-1. Source: U.S. Census Bureau, 2018 Business Dynamics Statistics.
Figure 2-2.Start-Up Rate and Start-Up Employment Share(Percent)

U.S. Census Bureau Center for Economic Studies Research Report: 2020 17
counties that saw the largest increase in start-up activity are all in North Dakota. Using the state-sector-firm age table, we can see that this was driven by a significant increase in the average number of new firms in the Mining, Quarrying, and Oil and Gas Extraction (NAICS 21), Construction (NAICS 23), and Transportation and Warehousing (NAICS 48-49) sectors.
To understand the change in the start-up rate across geographies, it is helpful to keep in mind where most start-ups originate. Figure 2-4 shows each county’s share of all start-ups averaged between 2016 and 2018, with the darkest purple counties
accounting for the greatest share of start-ups. Start-up activity tends to be greatest on the Northeast and Pacific coasts as well as city centers in the Midwest and South. Los Angeles County alone accounts for 4.3 percent of all start-ups. The 20 counties with the largest number of start-ups account for nearly a one-quarter of all start-ups in this time period.
The map in Figure 2-4 suggests that start-up activity is cur-rently relatively concentrated in population centers. In addition, Figure 2-5 shows that this con-centration has been rising over the last 20 years. After declining in the 1980s and early 1990s, the percentage of all start-ups
located in the 20 counties with the most employment rose steadily from approximately 19 percent in 1995 to about 23 percent after 2015. This trend is not solely driven by increased concentration of employment and population in large coun-ties. While the share of overall employment in the 20 largest counties also declined after the early 1980s, it did not begin to increase again until the 2010s and even then only rose by less than a percentage point. These trends indicate that large employment centers experi-enced growth in their share of start-up activity beyond what might have been predicted by a general rise in economic activity in these areas.
Figure 2-3.Change in Start-Up Rate by County
Note: The start-up rate is 100 times the count of all aged zero firms in a given year divided by the total number of active firms that year. Map shows the difference in the average county-level start-up rate between 1985 and 1989 and the average county-level start-up rate between 2010 and 2018. Grey cells have at least one suppression in at least 1 year, which prevented the calculation of an average start-up rate.Source: U.S. Census Bureau, 2018 Business Dynamics Statistics.

18 Center for Economic Studies Research Report: 2020 U.S. Census Bureau
Figure 2-4.Share of All Start-Ups by County
Note: The start-up share is the count of all aged zero firms in a given county divided by the total number of start-ups nation-wide in that year, averaged across 2016–2018. Source: U.S. Census Bureau, 2018 Business Dynamics Statistics.
18
19
20
21
22
23
24
20152010200520001995199019851980
Note: Figure shows the percentage of all start-ups each year located in the 20 counties with the most employment. The set of counties with the most employment changes over time. Source: U.S. Census Bureau, 2018 Business Dynamics Statistics.
Figure 2-5.Share of All Start-Ups in the 20 Largest Counties by Employment(Percent)

U.S. Census Bureau Center for Economic Studies Research Report: 2020 19
The sectoral composition of start-ups has also changed significantly over time (Figure 2-6). The percentage of start-ups in retail trade has fallen from 17.8 percent in 1980 to 10 percent in 2018. Manufacturing’s share of all start-ups over the same period fell by about one-half, from 5.6 percent to 2.7 percent. Other sectors that increased their share of start-ups included Information and
Professional Services (NAICS 51 and 45), Education and Health Services (NAICS 61 and 62), and Accommodation and Food Services (NAICS 72). This relatively simple exercise, of measuring the changing indus-try composition of start-ups, relies on complex longitudinal industry linking and concor-dances built into the redesigned LBD. These algorithms produce a vintage-consistent industry
classification that account for the changing industrial classifi-cation systems used in the data over this long time period.
Users can construct their own BDS graphics using BDS Explorer, a data visualization tool intended to make the BDS easily accessible for people with all levels of data experience. With this tool, users can choose years, industry groups, type of
Note: Figure shows the percentage of all start-ups by 10 groupings of 2-digit sectors each year. Source: U.S. Census Bureau, 2018 Business Dynamics Statistics.
20152010200520001995199019851980
Wholesale and transportation
Retail trade
Other services
Mining and utilities Manufacturing
Information and professional services
Financial activities
Education andhealth services
Construction
Accommodation and food services
Percentage of start-ups
7.9
10.0
11.8
0.32.7
22.2
9.9
11.2
13.0
10.9
8.9
17.8
11.1
0.85.6
15.6
8.6
8.1
14.0
9.4
Figure 2-6.Start-Up Sectoral Composition Over Time

20 Center for Economic Studies Research Report: 2020 U.S. Census Bureau
geography, firm age category, and firm size category and then produce graphs, maps, or tables that display statistics. The data can also be downloaded in tabular format. BDS Explorer is available at <www.census.gov /data/data-tools/bds-explorer .html>.
Reengineering and Redesigning the LBD
We now turn to a more detailed description of the LBD production process with a particular focus on the improvements made during the transition to a formal produc-tion system. For additional details on how the LBD is produced, we refer interested readers to Chow et al. (2021).
One of the most significant challenges in creating a longi-tudinal database spanning over 40 years is consistency of data elements over time. In addition to changing geographic identi-fiers, industry codes, payroll units, and processing flags to have standard definitions over time, the new production sys-tem also improved scope and data quality by combining and reconciling microdata from both the BR and the County Business Patterns (CBP) throughout the entire time series. The CBP, another derivative product of the BR, makes important and economically meaningful edits during its production process that now feed into the LBD and BDS production process. As part of the BR-CBP reconciliation process, the LBD team located many years of additional CBP data not stored in the main CBP repository. These efforts
included recovering 1976–1984 CBP microdata files from legacy Census Bureau tapes and trans-lating the files into a modern storage format, allowing them to be incorporated into the pro-duction system. These efforts helped to attenuate large, spuri-ous changes in job creation and destruction in the early years of the data.
Even with consistent data ele-ments, tracking establishments over time remains challenging. For example, businesses some-times change the employer iden-tification number (EIN) they use to file payroll taxes. These types of changes make it difficult for Census Bureau staff who main-tain the BR to know whether a business continues to operate from one year to the next. When a tax record for a new EIN that has not previously existed in the BR appears, the BR staff cannot be sure whether it is a new busi-ness or an old business that has simply changed its EIN. Similarly, if a tax report for an already existing EIN is not received, it is difficult to know whether the business has died or filed under a new EIN. This problem is especially pronounced for small, single-establishment firms that are only surveyed once every 5 years as part of the quinquen-nial economic census. Without additional linking to identify such reorganizations, the BDS would overstate the number of businesses that are born and die each year. LBD process-ing addresses these issues with several matching methods, including name and address matching, that identify business reorganizations.
Another challenge to produc-ing measures of dynamism arises from firms reorganizing and changing their associ-ated establishments. Those changes can take the form of acquisitions, divestitures, or opening or closing establish-ments. To track changes in firm structure, the Census Bureau conducts the annual Company Organization Survey (COS), supplementing the organiza-tion information collected in the economic census. Importantly, only relatively large firms are surveyed in the COS. Hence, for many firms, the organizational structure recorded in the BR is only updated every 5 years. Without additional processing, the BR will show large spikes in the number of establishments that are born and die in eco-nomic census years. The LBD addresses this challenge with algorithms that retime eco-nomic census year births and deaths associated with small- and medium-size firms not covered by the COS. In particu-lar, a formal statistical model is used to impute first or last year of operation for establishments that appear to be entrants or exits at those firms.
As described above, industry classification systems have changed substantially over time, making it hard to compare the composition of industry activ-ity in the 1980s to that in the 2010s. The new LBD production system incorporates algorithms that assign vintage-consistent industry codes that produce comparable measures at the industry-level across all years covered by the LBD. Currently,

U.S. Census Bureau Center for Economic Studies Research Report: 2020 21
this process generates 2012 NAICS codes for every establish-ment, with 2017 NAICS codes planned for the near future.
Using the links created between each consecutive pair of years, we assign each establishment a unique longitudinal identifier, lbdnum, that allows us to fol-low an establishment over time. We create annual establishment and firm files by combining the longitudinal linkages and cross-sectional attributes drawn from the BR and CBP files. These annual LBD files are used by Census Bureau staff to create the BDS and by internal and exter-nal researchers in myriad ways. Census Bureau staff also add lbdnum to other research-use business datasets to allow even more data to be combined and utilized.
Following CBP data products, the new BDS tables use multi plicative noise to avoid the disclosure of sensitive information (Massell and Funk, 2007). Utilizing more modern disclosure protection methods allows the BDS to pro-duce more detailed tables and be consistent with methodologies used in other establishment-level statistics published by the Census Bureau. Although noise is the primary method for protecting the data, we continue to suppress cells that do not meet minimum count requirements.
A final consequential change to the LBD is the improved docu-mentation and transparency that resulted from its transition to formal production processing. The underlying code and code specifications for the LBD are available to researchers with
approved projects via the FSRDC network, allowing microdata users to better understand and help improve the processing of the LBD. A new CES work-ing paper (Chow et al., 2021) describes both the production process and resulting LBD and BDS files in varying levels of detail that should be useful to users of both public-use tabula-tions and confidential microdata.
Future Improvements
After almost 3 decades of research on business dynam-ics using the LBD, a great deal has been learned about link-ing establishments over time. Census Bureau staff continue to investigate ways to improve the LBD and BDS through better linkages, additional data, and newer modeling tools. Here we highlight a few of our current research topics and invite the assistance of researchers inter-ested in collaborating to improve the LBD and BDS data. A more complete discussion of these and other issues is contained in Chow et al. (2021).
One area of particular focus in CES is the measurement of firm death. Firm death is difficult to measure for small business enti-ties because we cannot always distinguish between an exit from economic activity and missing data due to late or unfiled tax returns. Future reactivations also make initial counts of firm deaths in the latest years of the data inaccurate until subse-quent years of data are added to the time series. Given the economic impact of the COVID-19 pandemic, more accurately
measuring firm deaths in the LBD and BDS will be an essential task.
Another area in which the LBD-BDS team hopes to improve measurement is through the use of person-level W-2 tax filings. These person-level records can be linked to the BR and could be used to impute/confirm miss-ing employment, to identify firm reorganizations by tracing large groups of workers who move from one EIN to another, and to create additional worker-level detail for inclusion in the BDS such as the age/sex distribution of workers or the average 90-10 percentile earnings differential. Currently, CES has W-2 records for more recent years but is pur-suing additional data to facilitate this research.
Finally, the LBD-BDS team is adding information about firms to the LBD in order to produce BDS tables with more detail. Plans are underway to add a goods-trader designation (importer, exporter, or both), patenting firm designation, and a high-tech industry designa-tion (Kamal and Ouyang, 2020; Graham et al., 2018; Dreisigmeyer et al., 2018; Goldschlag and Miranda, 2020). These addi-tional firm and establishment characteristics will allow us to produce BDS tables of establish-ment and employment flows for globally-engaged, patenting, and high-tech businesses. By build-ing a formal production process, the Census Bureau has created a system that will be able to provide meaningful information about business dynamics for many years to come.

22 Center for Economic Studies Research Report: 2020 U.S. Census Bureau
REFERENCES
Acemoglu, Daron, Ufuk Akcigit, Harun Alp, Nicholas Bloom, and William Kerr, “Innovation, Reallocation, and Growth,” American Economic Review, Volume 108, 2018, pp. 3450–3491.
Chow, Melissa, Teresa C. Fort, Christopher Goetz, Nathan Goldschlag, James Lawrence, Elisabeth Ruth Perlman, Martha Stinson, and T. Kirk White, “Redesigning the Longitudinal Business Database,” Center for Economic Studies Working Paper 21-08, 2021.
Decker, Ryan, John Haltiwanger, Ron Jarmin, and Javier Miranda, “The Role of Entrepreneurship in U.S. Job Creation and Economic Dynamism,” Journal of Economic Perspectives, Volume 28, 2014, pp. 3–24.
Dreisigmeyer, David, Nathan Goldschlag, Marina Krylova, Wei Ouyang, and Elisabeth Perlman, “Building a Better Bridge: Improving Patent Assignee-Firm Links,” Center for Economic Studies Technical Note 18-01, 2018.
Graham, Stuart J. H., Cheryl Grim, Tariqul Islam, Alan Marco, and Javier Miranda, “Business Dynamics of Innovating Firms: Linking U.S. Patents With Administrative Data on Workers and Firms,” Journal of Economics and Management Strategy, Volume 27, 2018, pp. 372–402.
Goldschlag, Nathan, and Javier Miranda, “Business Dynamics Statistics of High Tech Industries,” Journal of Economics & Management Strategy, Volume 29, 2020, pp. 3–30.
Jarmin, Ron S., and Javier Miranda, “The Longitudinal Business Database,” Center for Economic Studies Working Paper 02-17, 2002.
Kamal, Fariha, and Wei Ouyang, “Identifying U.S. Merchandise Traders: Integrating Customs Transactions With Business Administrative Data,” Center for Economic Studies Working Paper 20-28, 2020.
Massell, Paul B., and Jeremy M. Funk, “Recent Developments in the Use of Noise for Protecting Magnitude Data Tables: Balancing to Improve Data Quality and Rounding That Preserves Protection,” in Proceedings of the 2007 FCSM Research Conference, 2007.
U.S. Census Bureau Center for Economic Studies Research Report: 2020 23
Nonemployer Statistics by Demographics (NES-D) is a new annual statistical series that leverages existing administra-tive records and U.S. Census Bureau data to provide non-employers’ demographics estimates by geographic and industry detail, receipt-size class, and legal form of organi-zation. Nonemployers (i.e., busi-nesses with no paid employees) account for the vast majority of all businesses in the United States, and close to 90 percent of them are sole proprietor-ships—businesses with just one owner that we usually think of as the “self-employed.” In 2017, there were approximately 25.7 million nonemployer firms, rep-resenting about 81.7 percent of all U.S. businesses, though just 3.3 percent of total receipts.
While employer firms have tra-ditionally captured the attention of researchers and policymakers, non employers have gained their interest in recent years. In the last decade, nonemployer business growth has outpaced that of employer firms, and there has been a surge in the number of nonemployer “gig workers” in particular (i.e., those engaged in flexible, temporary, or freelance jobs). Recently, applications for an employer identification number (EIN) have seen a sharp increase dur-ing the pandemic, and studies suggest that a large share of those applications may become nonemployers (Dinlersoz et al.,
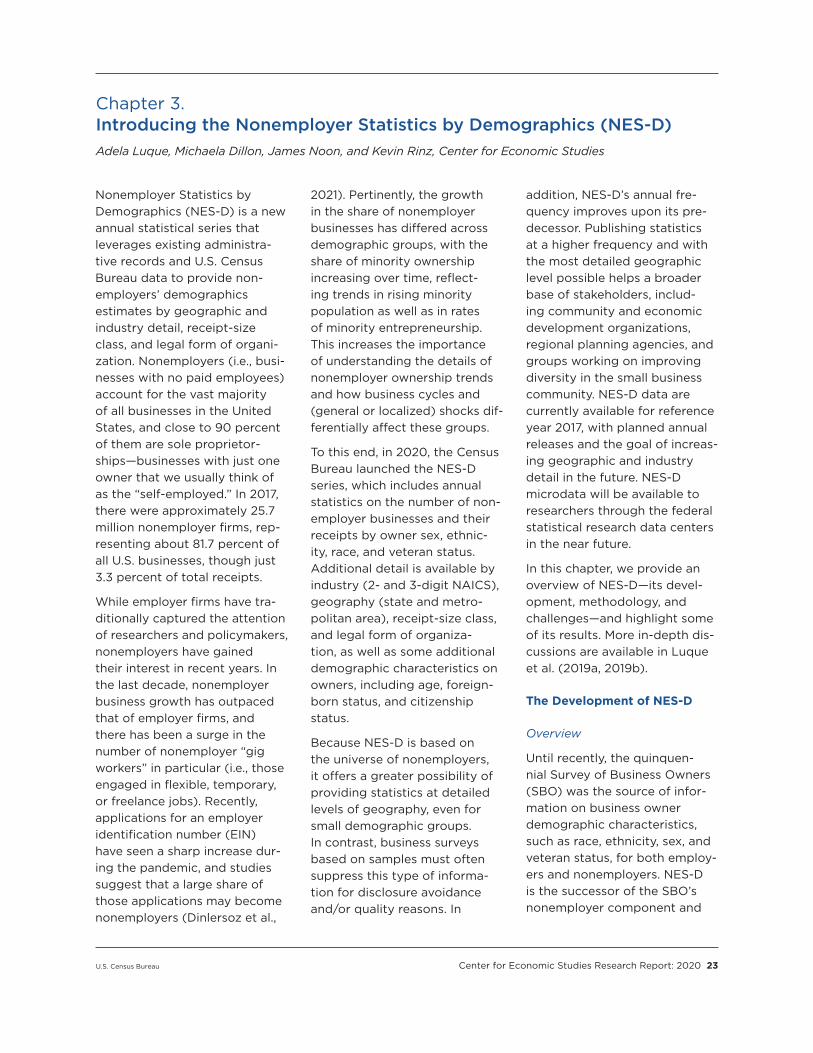
2021). Pertinently, the growth in the share of nonemployer businesses has differed across demographic groups, with the share of minority ownership increasing over time, reflect-ing trends in rising minority population as well as in rates of minority entrepreneurship. This increases the importance of understanding the details of nonemployer ownership trends and how business cycles and (general or localized) shocks dif-ferentially affect these groups.
To this end, in 2020, the Census Bureau launched the NES-D series, which includes annual statistics on the number of non-employer businesses and their receipts by owner sex, ethnic-ity, race, and veteran status. Additional detail is available by industry (2- and 3-digit NAICS), geography (state and metro-politan area), receipt-size class, and legal form of organiza-tion, as well as some additional demographic characteristics on owners, including age, foreign-born status, and citizenship status.
Because NES-D is based on the universe of non employers, it offers a greater possibility of providing statistics at detailed levels of geography, even for small demographic groups. In contrast, business surveys based on samples must often suppress this type of informa-tion for disclosure avoidance and/or quality reasons. In
addition, NES-D’s annual fre-quency improves upon its pre-decessor. Publishing statistics at a higher frequency and with the most detailed geographic level possible helps a broader base of stakeholders, includ-ing community and economic development organizations, regional planning agencies, and groups working on improving diversity in the small business community. NES-D data are currently available for reference year 2017, with planned annual releases and the goal of increas-ing geographic and industry detail in the future. NES-D microdata will be available to researchers through the federal statistical research data centers in the near future.
In this chapter, we provide an overview of NES-D—its devel-opment, methodology, and challenges—and highlight some of its results. More in-depth dis-cussions are available in Luque et al. (2019a, 2019b).
The Development of NES-D
Overview
Until recently, the quinquen-nial Survey of Business Owners (SBO) was the source of infor-mation on business owner demographic characteristics, such as race, ethnicity, sex, and veteran status, for both employ-ers and non employers. NES-D is the successor of the SBO’s nonemployer component and
Chapter 3. Introducing the Nonemployer Statistics by Demographics (NES-D)Adela Luque, Michaela Dillon, James Noon, and Kevin Rinz, Center for Economic Studies

24 Center for Economic Studies Research Report: 2020 U.S. Census Bureau
provides high-quality demo-graphic estimates that are more frequent and timely, with fewer imputations, no additional respondent burden, and lower costs.
NES-D is not a survey. Rather, it is an example of the Census Bureau leveraging existing administrative records (AR) and Census Bureau data to create an innovative product that addresses the challenges of survey-based data while producing statistics that are of equal or better quality. NES-D links demographic characteris-tics from AR and Census Bureau sources to the vast majority of the nonemployer universe, from federal tax records, to produce annual series of nonemployer counts and receipts by owner demographics, geography, industry, receipt-size class, and legal form of organization (LFO). Coupled with the new Annual Business Survey (ABS), which supplies demographic characteristics for employer firms, the Census Bureau now produces annual business owner demographics for all U.S. firms through a blended-data approach that combines AR-derived estimates for non-employer businesses (NES-D) and survey-derived estimates for employer businesses (ABS).
NES-D was initiated by the Census Bureau’s Economic Reimbursable Surveys Division and involved collaboration between multiple divisions within the agency. This work also benefited from the feed-back and support of various stakeholders, including the Small Business Administration
Office of Advocacy (who also provided financial support), the National Women’s Business Council, the Minority Business Development Agency, and veterans’ groups. The research phase began in April 2018 at the Center for Economic Studies and culminated with the first official release in December 2020, when the 2017 SBO estimates would normally have been released.
The first step in development was to assess the viability of linking and estimating non-employer demographics exclu-sively with AR and Census Bureau data. This work was grounded in previous research showing the quality and suit-ability of these data sources in replacing demographic informa-tion in other contexts (Luque and Bhaskar, 2014; Rastogi and O’Hara, 2012). We first evaluated coverage rates for a single year (2015), identified methodological and data chal-lenges and limitations, provided evidence and results based on alternative methodologies and data sources, and produced preliminary tabulations.
Once a preferred methodology consistent with that used in the employer-only ABS was identi-fied, we evaluated additional coverage from secondary and tertiary data sources, examined the longitudinal consistency of data coverage as well as of our AR-based demographics esti-mates, and explored estimates at the subnational level and by industrial sector. We also tabu-lated demographics estimates of business receipts and counts, and implemented imputation
of missing demographic val-ues. The imputation methodol-ogy followed the one used for employer firms in the ABS by the Economic Directorate.
Our coverage and longitudinal consistency evaluation showed that AR coverage rates are high and stable over time. We are able to identify owners for approximately 99 percent of nonemployer businesses (not including C-corporations), 92 percent to 93 percent of identi-fied nonemployer owners have no missing demographics, and only about 1 percent were miss-ing three or more demographic characteristics. For all demo-graphic characteristics, our estimates also showed stability and no sharp fluctuations over time at the national, state, and sector levels, while displaying some variation over time consis-tent with underlying population trends. These results provided the necessary evidence to move forward and produce official nonemployer business demo-graphics statistics by blending AR and Census Bureau data sources.
How Is NES-D Created?
NES-D’s creation relies on administrative records obtained by agreement from other gov-ernment agencies, including the Internal Revenue Service (IRS), the Social Security Administration (SSA), and the U.S. Department of Veteran Affairs (VA), as well as Census Bureau data. In particular, relying on our colleagues in the Economic Directorate, the nonemployer universe is extracted from the Census

U.S. Census Bureau Center for Economic Studies Research Report: 2020 25
Bureau’s Business Register (BR), which contains information on receipts, industry, geography, and LFO of each business. Nonemployers are businesses with no paid employment or payroll, with annual receipts of $1,000 or more ($1 or more in construction industries), and filing tax forms for sole propri-etorships (Form 1040, Schedule C), partnerships (Form 1065), or corporations (the Form 1120 series).
The primary source of data for race and Hispanic origin infor-mation is the decennial census and the American Community Survey (ACS), with the SSA Numident serving as a second-ary source. The Numident is also the primary source for the sex, age, place of birth, and citi-zenship status of the business owner, with Census Bureau data serving as a secondary source. Finally, the VA’s USVETS data provides information on veteran status.
To link demographic character-istics to the business owners, we use the Census Bureau’s Protected Identification Key (PIK). PIKs are anonymized unique individual identifiers used for linkage across data sources. Depending on the LFO of the business, two IRS forms are used to obtain PIKs. In the case of sole proprietorships, the business identifier coincides with that of its owner—it is sim-ply the owner’s PIK or anony-mized Social Security Number (SSN) from IRS Form 1040. In the case of partnerships and S-corporations, we obtain owner PIKs from Schedule K-1 data since these data contain
the EIN identifying the partner-ship or corporation itself, as well as the PIKs of the owners of that business. The K-1 record also includes the share of the business owned by each owner. This information is critical in assigning demographic charac-teristics at the firm level since there can be more than one owner and not all owners are necessarily individuals.
In particular, NES-D assigns firms to demographic groups by first determining the total share of firm ownership held by indi-vidual members of each group. Firm ownership is assigned to a given group if the owners in that group collectively own a majority stake (more than 50 percent). Those characteristics with only two categories at the individual level (e.g., sex, Hispanic origin, and veteran status) have a third category at the firm level: equally-owned. So, for example, a firm can be female-owned, male-owned, or equally-owned by men and women. Finally, following the methodology used in the ABS and the SBO before it, only firms where the person with the largest ownership share owns at least 10 percent are eligible for demographic assignment, up to four of the largest owners are considered in the assignment, and only person owners are used in the estimation.
Ongoing Challenges
The challenges we encountered along the way range from those related to methodology and data limitations to administra-tive issues such as data agree-ments and delivery schedules. A
number of ongoing challenges remain.
First, veteran status presents a challenge since the ABS (and the SBO before it) uses a broader definition than the one reflected in the VA’s data. Specifically, the questions in the ABS ask whether the busi-ness owner is or has been on active duty in the U.S. military or National Guards or Reserves, while the VA defines a veteran as someone who has served on active military duty in the past. To address this issue, we are currently exploring Department of Defense data to better align NES-D with the ABS.
Another AR data limitation that we are currently address-ing is whether and how to impute demographics for non-employer C-corporations. In the United States, there is no tax form or business registry that unequivocally identifies owners of C-corporations. Currently, NES-D does not include these entities. Fortunately, they account for only 1.5 percent of nonemployer businesses and 3.8 percent of nonemployer receipts.
Previous studies (Liebler et al., 2017) have also found that survey race and ethnicity responses and AR data have lower agreement rates for small size populations (i.e., American Indian and Alaska Native [AIAN], Native Hawaiian and Other Pacific Islander [NHOPI], and multiracial) relative to other race groups, and for Hispanics relative to non-Hispanics. One of our goals is to pursue addi-tional AR sources that can

26 Center for Economic Studies Research Report: 2020 U.S. Census Bureau
provide better coverage of these populations.
NES-D in Action
NES-D’s business demo graphics estimates are used by a variety of stakeholders, from advo-cacy groups and local gov-ernments to researchers and business owners themselves. For instance, the Small Business Administration and the Minority Business Development Agency use them to assess business assistance needs. Federal, state, and local government agencies can use them for planning and evaluating programs targeting disadvantaged groups. They also help individual business owners examine their growth in comparison to similar firms. Below, we take a look at
some illustrations of NES-D’s statistics.
The 2017 NES-D publication consists of four tables. Three tables provide counts and receipts of nonemployer firms by race, Hispanic origin, sex, veteran status, LFO, receipt-size class, geography, and industry. The fourth table provides counts of nonemployer business own-ers by demographics (i.e., race, Hispanic origin, sex, veteran status, age, foreign-born, and U.S. citizenship status), geogra-phy, and industry. Geographic detail includes MSA, state, and national estimates, while indus-try detail includes 2- and 3-digit NAICS.
The share of nonemployer business ownership of some
race groups and veterans are similar to or higher than their shares in the U.S. population. For instance, in 2017, Black or African Americans were about 12 percent of nonemployers and about 13 percent of the U.S. population, Asians were approximately 8 percent of non-employers and about 6 percent of the U.S. population, Whites represented about 80 percent of nonemployers and 73 per-cent of the U.S. population, and veterans were about 6 percent of both. In contrast, women represented about 51 percent of the U.S. population but only 42 percent of nonemployer business ownership. In terms of trends, the nonemployer popu-lation generally follows that of the underlying U.S. population,
Nonemployer firms
Employer firms
Minority nonemployer firms
0.90
0.95
1.00
1.05
1.10
1.15
1.20
2017201620152014
Sources: U.S. Census Bureau, 2017 Nonemployer Statistics by Demographics (NES-D), Luque et al. (2019b), 2014–2017 Nonemployer Statistics, and 2014–2017 Statistics of U.S. Businesses.
Figure 3-1.Trends in Employer, Nonemployer, and Nonemployer Minority Firms: Indexed Number of Firms (2014 Base Year)

U.S. Census Bureau Center for Economic Studies Research Report: 2020 27
with the shares of minority-owned nonemployer businesses increasing slightly over the period of 2014–2017 (Figure 3-1), women-owned businesses remaining stable (not shown), and veteran-owned businesses decreasing slightly (not shown). In NES-D, the minority category is comprised of individuals clas-sified as any race and ethnicity combination other than non-Hispanic and White.
Meanwhile, differences in firm receipts are pervasive across minority, women, and veteran-owned nonemployer
businesses. The average nonemployer (excluding C-corporations) had receipts of $47,000 in 2017, but the average receipts for women ($27,000), veteran ($42,000), African American ($22,000), AIAN ($32,000), NHOPI ($33,000), and Hispanic ($36,000) nonemployers were below that average. Both Asian and White nonemployers aver-aged approximately $48,000 in receipts. As an illustration, Figure 3-2 depicts the share of nonemployer ownership by sex in 2014 and 2017, in terms of
the number of such firms and receipts.
Nonemployer demographics by state also generally reflect underlying state populations and their growth. For instance, the five states with the larg-est percentages of minority-owned nonemployer firms were Hawaii (54.6 percent), DC (50.4 percent), Texas (49.3 percent), Florida (49.2 percent), and California (47.9 percent), which are also the states with the largest shares of minority population with the excep-tion of Florida. As might be
Equally ownedMaleFemale
41.9
55.7 55.5
2.45.6
2.45.6
69.170.0
42.1
24.3 25.2
2014 firms 2014 receipts 2017 firms 2017 receipts
Sources: U.S. Census Bureau, 2017 Nonemployer Statistics by Demographics (NES-D) and Luque et al. (2019b).
Figure 3-2.Share of Nonemployer Firms and Receipts by Owners’ Sex: 2014 and 2017(In percent)

28 Center for Economic Studies Research Report: 2020 U.S. Census Bureau
NONEMPLOYER STATISTICS BY DEMOGRAPHICS (NES-D) FOR LOCAL AND REGIONAL ANALYSIS
Exploring demographics at the local level can help local and state governments tailor regula-tions and policies, and also help community and economic development organizations, regional planning agencies, and groups work-ing on improving diversity in the small business community. The accompanying figure illustrates nonemployer ownership in the Washington, DC Metropolitan Statistical Area (MSA) in 2017. We see that minority nonemployer business ownership is considerably higher than their
nationwide share and slightly lower than their adult population share. Female and veteran nonemployer ownership shares are also larger in the DC region relative to their national aver-age, although female ownership is lower than the female adult population. Interestingly, aver-age nonemployer receipts (not shown here) are higher in the Washington, DC MSA than the national average for female, Hispanic, veteran, and all race groups except Asian.
VeteranFemaleHispanicMinority
32.3
13.7
42.1
51.0
5.7 6.1 7.8
44.1
14.0
52.551.4
14.5
U.S. nonemployer firms DC MSA nonemployer firms DC MSA adult population
Shares of Nonemployer Firms and Adult Population in the Washington, DC Metropolitan Statistical Area (MSA): 2017(In percent)
Note: Adult population refers to those aged 18 or older.Source: U.S. Census Bureau, 2017 Nonemployer Statistics by Demographics (NES-D) and 2017 American Community Survey, 1-year estimates.

U.S. Census Bureau Center for Economic Studies Research Report: 2020 29
expected, we see wide varia-tion across states in the share of firm ownership by race, Hispanic origin, and minor-ity, and much less variation in ownership by sex, which ranges from approximately 38 per-cent in New Jersey, Maine, and
Delaware to about 48 percent in Washington, DC.
NES-D can also help us iden-tify states where nonemployer firm ownership by a particular demographic group might be higher or lower relative to their share of the state’s population,
or more pertinently, adult popu-lation (those 18 years of age or older). For instance, Figure 3-3 compares a state’s nonemployer minority ownership share to its minority adult population share. A low value of this ratio indicates that the share of non-employer minority ownership
Source: U.S. Census Bureau, 2017 Nonemployer Statistics by Demographics (NES-D) and American Community Survey, 1-year estimates.
MI
MT
NE
KS
OK
WI
INIL
KY
TN
GA
OH
WV
NC
SC
RI
SD
VA
AR
DC
MS
NDMN
DE
LA
MO
IA
AL
ME
HI
PA
WY
IDOR
WA
AK
NV
AZNM
UTCO MD
NJCT
MA
VTNH
FL
CA
NY
TX
Figure 3-3.Ratio of Nonemployer Minority Ownership Share to Minority Adult Population Share
1.00 or more0.80–0.990.60–0.790.00–0.59
Ratio
30 Center for Economic Studies Research Report: 2020 U.S. Census Bureau
is lower relative to the state’s adult minority population share. Values of (or above) 1 indicate that minority ownership among nonemployers is the same as (or higher than) the underlying minority population in the state. Figure 3-4 shows the growth of minority-owned nonemployer firms from 2014 to 2017 by state.
One can also use NES-D to examine nonemployer owner-ship by industry. In 2017, non-employer minority ownership
was highest in Transportation and Warehousing (56.1 per-cent), Accommodation and Food Services (46.7 percent), and Health Care and Social Assistance (43.9 percent), and smallest in Mining (7.1 percent). The higher shares were driven by the Transit and Ground Passenger Transportation (NAICS 485), Food Services and Drinking Places (NAICS 722), Ambulatory Health Care Services (NAICS 621), and Social Assistance (NAICS 624) indus-tries. The Transit and Ground
Passenger Transportation industry (which includes taxi and limousine services, as well as ridesharing) also experienced the largest nonemployer growth from 2016 to 2017. In this indus-try, the share of nonemployer firms and receipts that are minority-owned (62.6 percent and 67.3 percent, respectively) is considerably higher than the minority-owned national average (32.6 percent and 24.6 percent, respectively).
Source: U.S. Census Bureau, 2017 Nonemployer Statistics by Demographics (NES-D).
MI
MT
NE
KS
OK
WI
INIL
KY
TN
GA
OH
WV
NC
SC
RI
SD
VA
AR
DC
MS
NDMN
DE
LA
MO
IA
AL
ME
HI
PA
WY
IDOR
WA
AK
NV
AZNM
UTCO MD
NJCT
MA
VTNH
FL
CA
NY
TX
Figure 3-4.Percentage-Point Di�erence in Minority-Owned Nonemployer Firms From 2014 to 2017
3.6–4.03.1–3.52.6–3.02.1–2.51.6–2.01.0–1.50.6–1.00.0–0.5

U.S. Census Bureau Center for Economic Studies Research Report: 2020 31
A NEW DIMENSION: LEGAL FORM OF ORGANIZATION
Nonemployer Statistics by Demographics (NES-D) provides nonemployer demographics by legal form of organization, a dimension that the legacy Survey of Business Owners did not offer. Legal form of organization (LFO) can be an important piece of information about a firm since it may signal the expected strategy, behav-ior, and “complexity” of a business, along with the different barriers and limitations it may face. Most nonemployers are sole proprietors (about 86 percent as of 2017) followed by partnerships, S-corporations, and C-corporations (approxi-mately 7 percent, 5 percent, and 2 percent, respectively, as of 2017). Nonemployers vary considerably by LFO. Compare, for instance, the average receipt of about $35,000 for sole pro-prietorships versus approximately $142,000 for partnerships, $121,000 for S-corporations, and $119,000 for C-corporations.
Thanks to NES-D, we can now explore the demographic composition of nonemployer firms across LFOs. For example, as depicted here in 2017, partnerships and S-corporations had higher White ownership shares (approxi-mately 89 percent and 85 percent, respec-tively) relative to sole proprietorships (approximately 79 percent). In results not shown here, Hispanic ownership of partner-ships is very low, only about 4 percent, relative to the approximately 16 percent and 11 percent of sole proprietorships and S-corporations, respectively. Also, the shares of female and female-male ownership make up about 45 percent of the ownership in partnership firms. Male-only ownership accounts for about 55 percent in both partnerships and sole propri-etorships, and 64 percent in S-corporations.
0.1
0.0
89.1
Partnerships
1.96.8
WhiteBlack or African AmericanAsianAmerican Indian and
Alaska NativeNative Hawaiian or
Other Pacific Islander
0.2
0.1
85.3
S-Corporations
4.7
9.0
0.4
0.2
78.7
Sole Proprietorships
12.9
7.8
Race Ownership Shares of Nonemployer Firms Across Legal Form of Organization: 2017(In percent)
Source: U.S. Census Bureau, 2017 Nonemployer Statistics by Demographics (NES-D).

32 Center for Economic Studies Research Report: 2020 U.S. Census Bureau
Nonemployer female owner-ship also showed wide sector variation. It was highest in Health (75.3 percent), Education (61.5 percent), Retail Trade (57.0 per-cent), and lowest in Construction (10.4 percent). Both minority and female ownership was rela-tively low in some of the other-wise large nonemployer sectors such as Real Estate.
Conclusion and Next Steps
NES-D embodies an innovative approach to producing business statistics, but also and impor-tantly, it is well-grounded in a body of administrative records research that has demonstrated the quality and suitability of the data sources employed in NES-D. NES-D also exemplifies the results that can be accom-plished through a sustained and focused team effort involving staff from the Census Bureau’s Research and Methodology and Economic Directorates, strong collaborations with stake-holders, and the application of sound methodologies.
Moving forward, NES-D’s goals will continue to be driven by the needs of stakeholders, research-ers, communities, policymakers, and the public as a whole. On the production front, we hope to shorten the dissemination lag from 3 years to 2 years, increase the level of both geo-graphic and industrial detail in future releases, as much as the data and disclosure avoidance
rules allow, and produce tables of demographics for all busi-nesses by summing together these AR-based nonemployer statistics and the survey-based employer demographic sta-tistics from the ABS. We also plan to augment the set of nonemployer characteristics in NES-D, including ones related to the gig economy (e.g., does the nonemployer also work for wages? does the nonemployer use contractors?), transitions from nonemployer to employer status, household characteris-tics obtainable through IRS data (e.g., marital status, number of dependents, home ownership), firm age, exporter/importer sta-tus, and patenting activity.
REFERENCES
Dinlersoz, Emin, Timothy Dunne, John Haltiwanger, and Veronika Penciakova, “Business Formation: A Tale of Two Recessions,” Center for Economic Studies Working Paper 21-01, 2021.
Liebler, Carolyn A., Sonya R. Porter, Leticia E. Fernandez, James M. Noon, and Sharon R. Ennis, “America’s Churning Races: Race and Ethnicity Response Changes Between Census 2000 and the 2010 Census,” Demography, Volume 54, 2017, pp. 259–284.
Luque, Adela, Renuka Bhaskar, James Noon, Kevin Rinz,
and Victoria Udalova, “Nonemployer Statistics by Demographics (NES-D): Using Administrative and Census Records Data in Business Statistics,” Center for Economic Studies Working Paper 19-01, 2019a.
Luque, Adela, Michaela Dillon, Julia Manzella, James Noon, Kevin Rinz, and Victoria Udalova, “Nonemployer Statistics by Demographics (NES-D): Exploring Longitudinal Consistency and Sub-national Estimates,” Center for Economic Studies Working Paper 19-34, 2019b.
Luque, Adela, and Renuka Bhaskar, “2010 American Community Survey Match Study,” CARRA Working Paper 2014-03, 2014.
Rastogi, Sonya, and Amy O’Hara, “2010 Census Match Study,” 2010 Census Program for Evaluations and Experiments, 2010 Planning Memoranda Series No. 247, 2012.

U.S. Census Bureau Center for Economic Studies Research Report: 2020 33
Appendix 1. OVERVIEW OF THE CENTER FOR ECONOMIC STUDIES
The Center for Economic Studies (CES) partners with stakeholders within and out-side the U.S. Census Bureau to improve measures of the economy and people of the United States through research and the development of innova-tive data products.
RESEARCH
CES research staff use confi-dential microdata from Census Bureau censuses and surveys of businesses and households, linked employer-employee data, and administrative records from federal and state agencies and other sources to carry out empirical research that leads to:
• Discoveries in economics and other social sciences not pos-sible using publicly available data.
• Improvements in existing Census Bureau surveys and data products.
• Enhancements to micro-level datasets for researcher-use in the Federal statisti-cal research data center (FSRDC) network.
• New statistics and informa-tion products for public use.
Research findings are dis-seminated through publications (Appendix 2), CES working papers (Appendixes 3 and 4), conferences, seminars, work-shops, and this annual report.
PRODUCTS
CES uses microdata from exist-ing censuses and surveys, and from administrative sources, to create innovative public-use data products, including:
• Business Dynamics Statistics (BDS). Tabulations of estab-lishment openings and closings, firm startups and shutdowns, and job creation and destruction with unique information on firm age and firm size.
• Business Formation Statistics (BFS). Quarterly statistics on business applications and for-mations including projections for recent and future quarters.
• Dispersion Statistics on Productivity (DiSP). Annual statistics on within-industry dispersion of productivity for the manufacturing sector.
• Job-to-Job Flows (J2J). Statistics on worker realloca-tion, including job change, hires and separations from and to nonemployment, and characteristics of origin and destination jobs.
• National Longitudinal Mortality Study (NLMS). Database for studying the effects of demo-graphic and socioeconomic characteristics on differential in mortality rates.
• OnTheMap. Online mapping and reporting application showing where people work and workers live, with infor-mation on worker and busi-ness characteristics.
• OnTheMap for Emergency Management. Intuitive Web-based interface for accessing U.S. population and work-force statistics, in real time, for areas being affected by natural disasters.
• Opportunity Atlas. Interactive mapping tool showing measures of social mobility for every census tract in the United States.
• Post-Secondary Employment Outcomes (PSEO). Statistics on the earnings and employ-ment outcomes for college graduates by institution, degree field, and degree level.
• Quarterly Workforce Indicators (QWI). Workforce statistics, including employ-ment, earnings, job creation, and turnover, by demogra-phy, geography, and industry for each state.
• Synthetic Longitudinal Business Database (SynLBD). Experimental synthetic microdata on all U.S. estab-lishments including employ-ment, payroll, and age.
• Veteran Employment Outcomes (VEO). Statistics on the earnings and employment outcomes of U.S. Army veter-ans, by demographic, service, and employer characteristics.
HISTORY
CES was established in 1982 to house databases on businesses, link them cross-sectionally and longitudinally, conduct economic research with them, and make

34 Center for Economic Studies Research Report: 2020 U.S. Census Bureau
them available to researchers. In his 1991 Nobel Prize lecture, economist Ronald Coase noted, “We can also hope to learn much more in the future from the studies of the activities of firms which have recently been initi-ated by the Center for Economic Studies of the Bureau of the Census of the United States.”
Elaborating on these thoughts in a letter sent to CES following a visit there in June 1993, Coase states:
“It must be a matter of pride for all in the Bureau of the Census to have a unit which, through its research activities, is play-ing such a valuable role in increasing our understanding of the working of our economic system. Of course, no individual or institution can do everything. The Center will have to depend on research conducted else-where (particularly in universi-ties) . . . to develop a more com-plete and more accurate picture of the structure of the economy. For this reason I greatly wel-come the initiative of the Bureau of the Census in establishing an office of the Center in Boston . . . and I hope, after assessing your experience in Boston, that it will be found desirable to establish similar offices in other places.”
Indeed, CES opened the first research data center in Boston in 1994 and continued to grow the network over the next quarter century. Today, there are FSRDCs located at dozens of universities and research orga-nizations across the country. In addition to restricted-use data on businesses and households
from the Census Bureau, the FSRDCs now also provide secure access to restricted-use data from other federal statisti-cal agencies. As of 2018, the FSRDCs are administered by the newly established Center for Enterprise Dissemination.
With time, CES’ focus evolved from a near-exclusive focus on the manufacturing sector to include nonmanufactur-ing sectors and data on work-ers and households. In 2008, the Longitudinal Employer-Household Dynamics (LEHD) program joined CES from the Census Bureau’s Demographic Directorate, and in 2018, researchers from the former Center for Administrative Records Research and Applications (CARRA) joined CES.
Today, CES is comprised of several dozen researchers with doctorates in economics, sociology, demography, public policy, statistics, and history and with research that is even more diverse.
PARTNERSHIPS
CES relies on many partners within and outside the Census Bureau, including:
• Census Bureau divisions that collect, process, and produce the business and household microdata at the heart of our research and that provide us their expert knowledge of the methodologies underlying those surveys and censuses.
• Our colleagues in other cen-ters within the Research and Methodology Directorate.
• Those with whom we are col-laborating on joint research and development, including: ◦ Fellow statistical agencies
including the Bureau of Economic Analysis, Bureau of Justice Statistics, Bureau of Labor Statistics, Economic Research Service, National Center for Health Statistics, and National Center for Science and Engineering Statistics.
◦ Other federal agencies including the Agency for Healthcare Research and Quality, Food and Nutrition Service, National Institutes of Health (National Cancer Institute; National Heart, Lung, and Blood Institute; National Institute on Aging), and the Small Business Administration.
◦ Academic institu-tions including Brown University, Harvard University, University of California—Irvine, University of Maryland, and University of North Carolina at Chapel Hill.
◦ Other research organiza-tions including the Institute for Research on Innovation and Science, NORC at the University of Chicago, and the RAND Corporation.
• The members of the Local Employment Dynamics Partnership and other LEHD partners (Appendix 5), who provide data critical to a number of our public-use data products, including J2J, OnTheMap, PSEO, VEO, and the QWI.

U.S. Census Bureau Center for Economic Studies Research Report: 2020 35
Appendix 2. PUBLICATIONS AND WORKING PAPERS BY CENTER FOR ECONOMIC STUDIES STAFF: 2020
PUBLICATIONS
Abraham, Katharine G., John C. Haltiwanger, Claire Hou, Kristin Sandusky, and James R. Spletzer, “Reconciling Survey and Administrative Measures of Self-Employment,” Journal of Labor Economics, forthcoming.
Abraham, Katharine, John Haltiwanger, Kristin Sandusky, and James Spletzer, “Measuring the Gig Economy: Current Knowledge and Open Issues,” In Measuring and Accounting for Innovation in the Twenty-First Century, edited by Carol Corrado, Jonathan Haskel, Javier Miranda, and Daniel Sichel, University of Chicago Press, 2021.
Akee, Randall, Maggie R. Jones, and Emilia Simeonova, “The EITC and Linking Data for Examining Multi-Generational Effects,” In Measuring and Understanding the Distribution and Intra/Inter-Generational Mobility of Income and Wealth, edited by Raj Chetty, John N. Friedman, Janet C. Gornick, Barry Johnson, and Arthur Kennickell, University of Chicago Press, forthcoming.
Akee, Randall, Maggie R. Jones, Sonya R. Porter, and Emilia Simeonova, “Hispanic and Asian Earnings Inequality and the Role of Labor Market Entrants and Immigrants,” AEA Papers and Proceedings, 2020, 110:442–446.
Altekruse, Sean F., Candace M. Cosgrove, William C. Altekruse, Richard A. Jenkins, and Carlos Blanco, “Socioeconomic Risk Factors for Fatal Opioid Overdoses in the United States: Findings from the Mortality Disparities in American Communities Study (MDAC),” PLoS One, 2020, 15(1):e0227966.
Aram, Jonathan, Norman J. Johnson, Mei-Ling Ting Lee, and Natalie Slopen, “Drug Overdose Mortality is Associated with Employment Status and Occupation in the National Longitudinal Mortality Study,” American Journal of Drug and Alcohol Abuse, 2020, 46:769–776.
Arias, Elizabeth, Norman J. Johnson, and Betzaida Tejada Vera, “Racial Disparities in Mortality in the Adult Hispanic Population,” SSM - Population Health, 2020, 11:100583.
Azoulay, Pierre, Benjamin Jones, J. Daniel Kim, and Javier Miranda, “Age and High-Growth Entrepreneurship,” American Economic Review: Insights, 2020, 2:65–82.
Basker, Emek, “Comment on ‘The Recent Evolution of Physical Retail Markets: Online Retailing, Big Box Stores, and the Rise of Restaurants’ by Lafontaine and Sivadasan,” In The Role of Innovation and Entrepreneurship in Economic Growth, edited by Aaron Chatterji, Josh Lerner, Scott Stern, and Michael J. Andrews, University of Chicago Press, forthcoming.
Basker, Emek, and Timothy Simcoe, “Upstream, Downstream: Diffusion and Impacts of the Universal Product Code,” Journal of Political Economy, 2021, 129:1252–1286.
Bastian, Jacob, and Maggie R. Jones, “Do EITC Expansions Pay for Themselves? Effects on Tax Revenue and Public Assistance Spending,” Journal of Public Economics, forthcoming.
Binder, Ariel J., “Rising Inequality in Mothers’ Employment Statuses: The Role of Intergenerational Transmission,” Demography, forthcoming.
Binder, Ariel J., and David Lam, “Is There a Male Breadwinner Norm? The Hazards of Inferring Preferences from Marriage Market Outcomes,” Journal of Human Resources, forthcoming.

36 Center for Economic Studies Research Report: 2020 U.S. Census Bureau
Blackwood, G. Jacob, Lucia S. Foster, Cheryl A. Grim, John Haltiwanger, and Zoltan Wolf, “Macro and Micro Dynamics of Productivity: From Devilish Details to Insights,” American Economic Journal: Macroeconomics, forthcoming.
Brooks, Leah, and Genevieve Denoeux, “What If You Build It and They Don’t Come? How the Ghost of Transit Past Haunts Transit Present,” Regional Science and Urban Economics, forthcoming.
Brown, J. David, John S. Earle, Mee Jung Kim, and Kyung Min Lee, “Immigrant Entrepreneurs and Innovation in the U.S. High-Tech Sector,” In The Roles of Immigrants and Foreign Students in U.S. Science, Innovation, and Entrepreneurship, edited by Ina Ganguli, Shulamit Kahn, and Megan MacGarvie, University of Chicago Press, 2020.
Chetty, Raj, Nathaniel Hendren, Maggie R. Jones, and Sonya R. Porter, “Race and Economic Opportunity in the United States: An Intergenerational Perspective,” Quarterly Journal of Economics, 2020, 135:711–783.
Christensen, Garret, and Edward Miguel, “Transparency and Reproducibility: Conceptualizing the Problem,” In The Production of Knowledge: Enhancing Progress in Social Science, edited by Colin Elman, John Gerring, and James Mahoney, Cambridge University Press, 2020.
Christensen, Garret, and Edward Miguel, “Transparency and Reproducibility: Potential Solutions,” In The Production of Knowledge: Enhancing Progress in Social Science, edited by Colin Elman, John Gerring, and James Mahoney, Cambridge University Press, 2020.
Christensen, Garret, and Edward Miguel, “Improving Research Transparency in the Social Sciences: Registration, Pre-registration, and Multiple Testing Adjustments,” In Research Integrity in the Behavioral Sciences, edited by Lee Jussim, Sean T. Stevens, and Jon A. Krosnick, Oxford University Press, forthcoming.
Colmer, Jonathan, Ian Hardman, Jay Shimshack, and John Voorheis, “Disparities in PM2.5 Air Pollution in the United States,” Science, 2020, 369:575–578.
Cougle, Jesse R., Katherine A. McDermott, Jahn K. Hakes, and Keanan J. Joyner, “Personality Disorders and Social Support in Cannabis Dependence: A Comparison with Alcohol Dependence,” Journal of Affected Disorders, 2020, 265:26–31.
Delgado, Mercedes, J. Daniel Kim, and Karen Mills, “The Servicification of the U.S. Economy: The Role of Startups versus Incumbent Firms,” In The Role of Innovation and Entrepreneurship in Economic Growth, edited by Aaron Chatterji, Josh Lerner, Scott Stern, and Michael J. Andrews, University of Chicago Press, forthcoming.
Dinlersoz, Emin, Timothy Dunne, John Haltiwanger, and Veronika Penciakova, “Business Formation: A Tale of Two Recessions,” AEA Papers and Proceedings, forthcoming.
Dinlersoz, Emin, Nathan Goldschlag, Amanda Myers, and Nikolas Zolas, “An Anatomy of U.S. Firms Seeking Trademark Registration,” In Measuring and Accounting for Innovation in the Twenty-First Century, edited by Carol Corrado, Jonathan Haskel, Javier Miranda, and Daniel Sichel, University of Chicago Press, 2021.
Fernandez, Leticia E., and Norman J. Johnson, “Demographics and the Epidemiological Risk Factors for Dementia in Hispanic/Latino Populations,” in Caring for Latinxs with Dementia in a Globalized World: Behavioral and Psychosocial Treatments, edited by Hector Y. Adames and Yvette N. Tazeau, Springer, 2020.

U.S. Census Bureau Center for Economic Studies Research Report: 2020 37
Foote, Andrew, and Michel Grosz, “The Effect of Local Labor Market Downturns on Postsecondary Enrollment and Program Choice,” Education Finance and Policy, 2020, 15:593–622.
Foote, Andrew, Mark J. Kutzbach, and Lars Vilhuber, “Recalculating . . . : How Uncertainty in Local Labour Market Definitions Affects Empirical Findings,” Applied Economics, forthcoming.
Foster, Lucia, Cheryl Grim, John Haltiwanger, and Zoltan Wolf, “Innovation, Productivity Dispersion, and Productivity Growth,” In Measuring and Accounting for Innovation in the Twenty-First Century, edited by Carol Corrado, Jonathan Haskel, Javier Miranda, and Daniel Sichel, University of Chicago Press, 2021.
Foster, Lucia, Cheryl Grim, and Nikolas Zolas, “A Portrait of U.S. Firms that Invest in R&D,” Economics of Innovation and New Technology, 2020, 29:89–111.
Foster, Lucia, Julia Manzella, Erika McEntarfer, and Danielle H. Sandler, “Employment and Earnings for Federal Government Economists: Empirical Evidence by Gender and Race,” AEA Papers and Proceedings, 2020, 11:210–214.
Fraser, Gary E., Candace M. Cosgrove, Andrew D. Mashchak, Michael J. Orlich, and Sean F. Altekruse, “Lower Rates of Cancer and All-Cause Mortality in an Adventist Cohort Compared with a U.S. Census Population,” Cancer, 2020, 126:1102–1111.
Goldschlag, Nathan, Ron Jarmin, Julia Lane, and Nikolas Zolas, “Research Experience as Human Capital in New Business Outcomes,” In Measuring and Accounting for Innovation in the Twenty-First Century, edited by Carol Corrado, Jonathan Haskel, Javier Miranda, and Daniel Sichel, University of Chicago Press, 2021.
Goldschlag, Nathan, Travis J. Lybbert, and Nikolas J. Zolas, “Tracking the Technological Composition of Industries with Algorithmic Patent Concordances,” Economics of Innovation and New Technology, 2020, 29:582–602.
Goldschlag, Nathan, and Javier Miranda. “Business Dynamics Statistics of High Tech Industries,” Journal of Economics & Management Strategy, 2020, 29:3–30.
Hahn, Joyce K., Henry R. Hyatt, and Hubert P. Janicki, “Job Ladders and Growth in Earnings, Hours, and Wages,’’ European Economic Review, 2021, 133:103654.
Hawks, Laura, Candace Cosgrove, Mathew Neiman, Brita Roy, Christopher Wildeman, Sean Cody, and Emily A. Wang, “Five-Year Mortality among Americans Incarcerated in Privatized Versus Public Prisons: The Mortality Disparities in American Communities Project,” Journal of General Internal Medicine, forthcoming.
Hosgood III, H. Dean, Candace Cosgrove, Madelyn Klugman, Thomas Rohan, and Sean Altekruse, “Lung Cancer Mortality among Smokers and Never-Smokers in the United States,” Epidemiology, 2020, 31:e24–e25.
Inoue-Choi, Maki, Carol H. Christensen, Brian L. Rostron, Candace M. Cosgrove, Carolyn Reyes-Guzman, Benjamin Apelberg, and Neal D. Freedman, “Dose-Response Association of Low-Intensity and Nondaily Smoking With Mortality in the United States,” JAMA Network Open, 2020, 3:e206436.
Johnson-Jennings, Michelle, Bonnie Duran, Jahn Hakes, Alexandra Paffrath, and Meg M. Little, “The Influence of Undertreated Chronic Pain in a National Survey: Prescription Medication Misuse among American Indians, Asian Pacific Islanders, Blacks, Hispanics and Whites,” SSM - Population Health, 2020, 11:100563.
38 Center for Economic Studies Research Report: 2020 U.S. Census Bureau
Kim, Byung-Cheol, and Mishal Ahmed, “Price-match Guarantees and Investment Incentives,” Information Economics and Policy, 2020, 53:100891.
McKinney, Kevin L., John M. Abowd, and John Sabelhaus, “United States Earnings Dynamics: Inequality, Mobility, and Volatility,” In The Role of Innovation and Entrepreneurship in Economic Growth, edited by Aaron Chatterji, Josh Lerner, Scott Stern, and Michael J. Andrews, University of Chicago Press, forthcoming.
McKinney, Kevin L., Andrew S. Green, Lars Vilhuber, and John M. Abowd, “Total Error and Variability Measures for the Quarterly Workforce Indicators and LEHD Origin-Destination Employment Statistics in OnTheMap,” Journal of Survey Statistics and Methodology, forthcoming.
Moss, Jennifer L., Norman J. Johnson, Mandi Yu, Sean F. Altekruse, and Kathleen A. Cronin, “Comparisons of Individual- and Area-level Socioeconomic Status as Proxies for Individual-level Measures: Evidence from the Mortality Disparities in American Communities Study,” Population Health Metrics, 2021, 19:1.
Muennig, Peter, Daniel Vail, and Jahn K. Hakes, “Can Antipoverty Programmes Save Lives? Quasi-experimental Evidence from the Earned Income Tax Credit in the USA,” BMJ Open, 2020, 10:e037051.
Miranda, Javier, and Nikolas Zolas, “Measuring the Impact of Household Innovation Using Administrative Data,” In Measuring and Accounting for Innovation in the Twenty-First Century, edited by Carol Corrado, Jonathan Haskel, Javier Miranda, and Daniel Sichel, University of Chicago Press, 2021.
Monti, Holly, Martha Stinson, and Lori Zehr, “How Long Do Early Career Decisions Follow Women? The Impact of Employer History on the Gender Wage Gap,” Journal of Labor Research, 2020, 41:189–232.
Olfson, Mark, Candace M. Cosgrove, Sean F. Altekruse, Melanie M. Wall, and Carlos Blanco, “Deaths Of Despair: Adults at High Risk for Death by Suicide, Poisoning, or Chronic Liver Disease in the U.S.” Health Affairs, 2021, 40:505–512.
Olfson, Mark, Candace M. Cosgrove, Melanie M. Wall, and Carlos Blanco, “Sociodemographic Factors Associated With High Risk for Firearm Suicide among U.S. Adults,” JAMA Internal Medicine, 2020, 180:1014–1019.
Sanzenbacher, Geoffrey T., Anthony Webb, Candace M. Cosgrove, and Natalia Orlova, “Rising Inequality in Life Expectancy by Socioeconomic Status,” North American Actuarial Journal, forthcoming.
Schuster, Steven Sprick, Matthew Jaremski, and Elisabeth Ruth Perlman, “An Empirical History of the U.S. Postal Savings System,” Social Science History, 2020, 44:667–696.
Simeonova, Emilia, Randall Akee, and Maggie R. Jones, “American Indian Casinos, Cash Transfers, and Their Effect on Income Rank,” AEA Papers and Proceedings, forthcoming.
Staudt, Joseph, “Mandating Accesss: Assessing the NIH’s Public Access Policy,” Economic Policy, 2020, 35:269–304.
Staudt, Joseph, Yifang Wei, Lisa Singh, Shawn D. Klimek, J. Bradford Jensen, and Andrew L. Baer, “Automating Response Evaluation for Franchising Questions on the 2017 Economic Census,” In Big Data for 21st Century Economic Statistics, edited by Katharine G. Abraham, Ron S. Jarmin, Brian Moyer, and Matthew D. Shapiro, University of Chicago Press, forthcoming.
Swanson, Nicholas, Garret Christensen, Rebecca Littman, David Birke, Edward Miguel, Elizabeth Levy Paluck, and Zenan Wang, “Research Transparency is on the Rise in Economics,” AEA Papers and Proceedings, 2020, 110:61–65.

U.S. Census Bureau Center for Economic Studies Research Report: 2020 39
Yoon, Gihyun, Katie Thompson, Jahn K. Hakes, Joseph Westermeyer, Irmene L. Petrakis, and Suck Won Kim, “Alcohol Craving and Psychiatric Disorders Among Current Drinkers,” American Journal on Addictions, 2021, 30:34–42.
WORKING PAPERS
Abowd, John M., William R. Bell, J. David Brown, Michael B. Hawes, Misty L. Heggeness, Andrew D. Keller, Vincent T. Mule Jr., Joseph L. Schafer, Matthew Spence, Lawrence Warren, and Moises Yi, “Determination of the 2020 U.S. Citizen Voting Age Population (CVAP) Using Administrative Records and Statistical Methodology Technical Report,” Center for Economic Studies Discussion Paper 20-33, 2020.
Babina, Tania, Alex Xi He, Sabrina T. Howell, Elisabeth Ruth Perlman, and Joseph Staudt, “The Color of Money: Federal vs. Industry Funding of University Research,” NBER Working Paper No. 28160, 2020.
Bailey, Keith A., and James R. Spletzer, “A New Measure of Multiple Jobholding in the U.S. Economy,” Center for Economic Studies Discussion Paper 20-26, 2020.
Basker, Emek, and Fariha Kamal, “Recall and Response: Relationship Adjustments to Adverse Information Shocks,” Center for Economic Studies Discussion Paper 20-13, 2020.
Bloom, Nicholas, Steven J. Davis, Lucia Foster, Brian Lucking, Scott Ohlmacher, and Itay Saporta-Eksten, “Business-Level Expectations and Uncertainty,” Center for Economic Studies Discussion Paper 20-41; NBER Working Paper No. 28259, 2020.
Buffington, Catherine, Carrie Dennis, Emin Dinlersoz, Lucia Foster, and Shawn Klimek, “Measuring the Effect of COVID-19 on U.S. Small Businesses: The Small Business Pulse Survey,” Center for Economic Studies Discussion Paper 20-16, 2020.
Calkins, Avery, Ariel J. Binder, Dana Shaat, and Brenden Timpe, “When Sarah Meets Lawrence: The Effect of Coeducation on Women’s Major Choices,” RAND Education and Labor Working Paper Series 1060-1, 2020.
Chow, Melissa, and Jordan Stanley, “A Shore Thing: Post-Hurricane Outcomes for Businesses in Coastal Areas,” Center for Economic Studies Discussion Paper 20-27, 2020.
Colmer, Jonathan, and John Voorheis, “The Grandkids Aren’t Alright: The Intergenerational Effects of Prenatal Pollution Exposure,” Center for Economic Studies Discussion Paper 20-36, 2020.
Currie, Janet, John Voorheis, and Reed Walker, “What Caused Racial Disparities in Particulate Exposure to Fall? New Evidence from the Clean Air Act and Satellite-Based Measures of Air Quality,” Center for Economic Studies Discussion Paper 20-02, 2020.
Eggleston, Jonathan, Mark Klee, Kristin McCue, Kristin Sandusky, and Jim Spletzer, “The Impact of 2010 Decennial Census Hiring on the Unemployment Rate,” Center for Economic Studies Discussion Paper 20-19, 2020.
Foster, Thomas B., Marta Murray-Close, Liana Christin Landivar, and Mark deWolf, “An Evaluation of the Gender Wage Gap Using Linked Survey and Administrative Data,” Center for Economic Studies Discussion Paper 20-34, 2020.
Gottlieb, Joshua D., Maria Polyakova, Kevin Rinz, Hugh Shiplett, and Victoria Udalova, “Who Values Human Capitalists’ Human Capital? Healthcare Spending and Physician Earnings,” Center for Economic Studies Discussion Paper 20-23, 2020.
Haltiwanger, John, and James R. Spletzer, “Between Firm Changes in Earnings Inequality: The Dominant Role of Industry Effects,” Center for Economic Studies Discussion Paper 20-08, 2020.
Handley, Kyle, Fariha Kamal, and Ryan Monarch, “Rising Import Tariffs, Falling Export Growth: When Modern Supply Chains Meet Old-Style Protectionism,” Center for Economic Studies Discussion Paper 20-01, 2020.

40 Center for Economic Studies Research Report: 2020 U.S. Census Bureau
Howell, Sabrina T., and J. David Brown, “Do Cash Windfalls Affect Wages? Evidence from R&D Grants to Small Firms,” Center for Economic Studies Discussion Paper 20-06; NBER Working Paper No. 26717, 2020.
Jones, Maggie R., Emilia Simeonova, and Randall Akee, “The EITC and Intergenerational Mobility,” Center for Economic Studies Discussion Paper 20-35, 2020.
Kamal, Fariha, and Wei Ouyang, “Identifying U.S. Merchandise Traders: Integrating Customs Transactions with Business Administrative Data,” Center for Economic Studies Discussion Paper 20-28, 2020.
Kamal, Fariha, Asha Sundaram, and Cristina J. Tello-Trillo, “Family-Leave Mandates and Female Labor at U.S. Firms: Evidence from a Trade Shock,” Center for Economic Studies Discussion Paper 20-25, 2020.
Kim, J. Daniel, and Kristin McCue, “Matching State Business Registration Records to Census Business Data,” Center for Economic Studies Discussion Paper 20-03, 2020.
Krizan, C. J., James Tybout, Zi Wang, and Yingyan Zhao, “Are Customs Records Consistent Across Countries? Evidence from the U.S. and Colombia,” Center for Economic Studies Discussion Paper 20-11, 2020.
McKinney, Kevin L., and John M. Abowd, “Male Earnings Volatility in LEHD before, during, and after the Great Recession,” Center for Economic Studies Discussion Paper 20-31, 2020.
McKinney, Kevin L., John M. Abowd, and John Sabelhaus, “United States Earnings Dynamics: Inequality, Mobility, and Volatility,” Center for Economic Studies Discussion Paper 20-29, 2020.
McKinney, Kevin L., Andrew S. Green, Lars Vilhuber, and John M. Abowd, “Total Error and Variability Measures for the Quarterly Workforce Indicators and LEHD Origin Destination Employment Statistics in OnTheMap,” Center for Economic Studies Discussion Paper 20-30, 2020.
Tanaka, Satoshi, Lawrence Warren, and David Wiczer, “Earnings Growth, Job Flows and Churn,” Center for Economic Studies Discussion Paper 20-15, 2020.
Thompson, Katherine Jenny, Hang Kim, Noah Bassel, Kevin Bembridge, Charles Coleman, Michael Freiman, Maria Garcia, Stephen Kaputa, Steven Riesz, Phyllis Singer, Eric Valentine, Thomas Kirk White, and Daniel Whitehead, “Final Report: Economic Census Synthetic Data Project Research Team,” Associate Directorate for Economic Programs Working Paper 2020-05, 2020.
Ziliak, James P., Charles Hokayem, and Christopher R. Bollinger, “Trends in Earnings Volatility using Linked Administrative and Survey Data,” Center for Economic Studies Discussion Paper 20-24, 2020.
Zolas, Nikolas, Zachary Kroff, Erik Brynjolfsson, Kristina McElheran, David Beede, Catherine Buffington, Nathan Goldschlag, Lucia Foster, and Emin Dinlersoz, “Advanced Technologies Adoption and Use by U.S. Firms: Evidence from the Annual Business Survey,” Center for Economic Studies Discussion Paper 20-40, 2020.

U.S. Census Bureau Center for Economic Studies Research Report: 2020 41
Appendix 3. ABSTRACTS OF CENTER FOR ECONOMIC STUDIES WORKING PAPERS BY CENSUS BUREAU STAFF: 2020
Center for Economic Studies Working Paper 20-01
RISING IMPORT TARIFFS, FALLING EXPORT GROWTH: WHEN MODERN SUPPLY CHAINS MEET OLD-STYLE PROTECTIONISM
Kyle Handley Fariha Kamal
Ryan Monarch
January 2020
We examine the impacts of the 2018–2019 U.S. import tariff increases on U.S. export growth through the lens of supply chain linkages. Using 2016 confidential firm-trade linked data, we docu-ment the implied incidence and scope of new import tariffs. Firms that eventually faced tariff increases on their imports accounted for 84 per-cent of all exports and represented 65 percent of manufacturing employment. For all affected firms, the implied cost is $900 per worker in new duties.
To estimate the effect on U.S. export growth, we construct product-level measures of import tariff exposure of U.S. exports from the underlying firm micro data. More exposed products experienced 2 percentage points lower growth relative to prod-ucts with no exposure. The decline in exports is equivalent to an ad valorem tariff on U.S. exports of almost 2 percent for the typical product and almost 4 percent for products with higher than average exposure.
Center for Economic Studies Working Paper 20-02
WHAT CAUSED RACIAL DISPARITIES IN PARTICULATE EXPOSURE TO FALL? NEW EVIDENCE FROM THE CLEAN AIR ACT AND SATELLITE-BASED MEASURES OF AIR
QUALITY
Janet Currie John Voorheis Reed Walker
January 2020
Racial differences in exposure to ambient air pollu-tion have declined significantly in the United States over the past 20 years. This project links restricted-access U.S. Census Bureau microdata to newly available, spatially continuous, high-resolution mea-sures of ambient particulate pollution (PM2.5) to examine the underlying causes and consequences of differences in Black-White pollution exposures. We begin by decomposing differences in pollution exposure into components explained by observable population characteristics (e.g., income) versus
those that remain unexplained. We then use quan-tile regression methods to show that a significant portion of the “unexplained” convergence in Black-White pollution exposure can be attributed to dif-ferential impacts of the Clean Air Act (CAA) in non-Hispanic African American and non-Hispanic White communities. Areas with larger Black populations saw greater CAA-related declines in PM2.5 expo-sure. We show that the CAA has been the single largest contributor to racial convergence in PM2.5 pollution exposure in the United States since 2000, accounting for over 60 percent of the reduction.

42 Center for Economic Studies Research Report: 2020 U.S. Census Bureau
Center for Economic Studies Working Paper 20-03
MATCHING STATE BUSINESS REGISTRATION RECORDS TO CENSUS BUSINESS DATA
J. Daniel Kim Kristin McCue
January 2020
We describe our methodology and results from matching state Business Registration Records (BRR) to Census business data. We use data from Massachusetts and California to develop meth-ods and preliminary results that could be used to guide matching data for additional states. We obtain matches to Census business records for 45 percent of the Massachusetts BRR records and 40 percent of the California BRR records. We find higher match rates for incorporated businesses and businesses with higher startup-quality scores as assigned in Guzman and Stern (2018). Clerical reviews show that using relatively strict matching on address is important for match accuracy, while
results are less sensitive to name matching strict-ness. Among matched BRR records, the modal timing of the first match to the Business Register (BR) is in the year in which the BRR record was filed. We use two sets of software to identify matches: SAS DQ Match and a machine-learning (ML) algorithm described in Cuffe and Goldschlag (2018). We find preliminary evidence that while the ML-based method yields more match results, SAS DQ tends to result in higher accuracy rates. To conclude, we provide suggestions on how to proceed with matching other states’ data in light of our findings using these two states.
Center for Economic Studies Working Paper 20-06
DO CASH WINDFALLS AFFECT WAGES? EVIDENCE FROM R&D GRANTS TO SMALL FIRMS
Sabrina T. Howell J. David Brown
February 2020
This paper examines how employee earnings at small firms respond to a cash flow shock in the form of a government R&D grant. We use ranking data on applicant firms, which we link to IRS W-2 earnings and other U.S. Census Bureau datasets. In a regression discontinuity design, we find that the grant increases average earnings with a rent-sharing elasticity of 0.07 (0.21) at the employee (firm) level. The beneficiaries are incumbent employees who were present at the firm before
the award. Among incumbent employees, the effect increases with worker tenure. The grant also leads to higher employment and revenue, but productivity growth cannot fully explain the immediate effect on earnings. Instead, the data and a grantee survey are consistent with a back-loaded wage contract channel, in which employ-ees of financially constrained firms initially accept relatively low wages and are paid more when cash is available.

U.S. Census Bureau Center for Economic Studies Research Report: 2020 43
Center for Economic Studies Working Paper 20-08
BETWEEN FIRM CHANGES IN EARNINGS INEQUALITY: THE DOMINANT ROLE OF INDUSTRY EFFECTS
John Haltiwanger James R. Spletzer
February 2020
We find that most of the rising between firm earn-ings inequality that dominates the overall increase in inequality in the United States is accounted for by industry effects. These industry effects stem from rising interindustry earnings differentials and not from changing distribution of employ-ment across industries. We also find the rising
interindustry earnings differentials are almost completely accounted for by occupation effects. These results link together the key findings from separate components of the recent literature: one focuses on firm effects and the other on occupa-tion effects. The link via industry effects challenges conventional wisdom.
Center for Economic Studies Working Paper 20-11
ARE CUSTOMS RECORDS CONSISTENT ACROSS COUNTRIES? EVIDENCE FROM THE U.S. AND COLOMBIA
C.J. Krizan James Tybout
Zi Wang Yingyan Zhao
March 2020
In many countries, official customs records include identifying information on the exporting and importing firms involved in each shipment. This information allows researchers to study international business networks, offshoring pat-terns, and the microfoundations of aggregate trade flows. It also provides the government with a basis for tariff assessments at the bor-der. However, there are no mechanisms in place to ensure that the shipment-level information
recorded by the exporting country is consistent with the shipment-level information recorded by the importing country. And to the extent that there are discrepancies, it is not clear how prevalent they are or what form they take. In this paper, we explore these issues, both to enhance our understanding of the limitations of customs records and to inform future discussions of pos-sible revisions in the way they are collected.

44 Center for Economic Studies Research Report: 2020 U.S. Census Bureau
Center for Economic Studies Working Paper 20-13
RECALL AND RESPONSE: RELATIONSHIP ADJUSTMENTS TO ADVERSE INFORMATION SHOCKS
Emek Basker Fariha Kamal
March 2020
How resilient are buyer-supplier relationships to new information about product defects? We con-struct a novel dataset of U.S. consumer product recalls sourced from foreign suppliers between 1995 and 2013. Using an event-study approach, we find that compared to control relationships, buyers that experience recalls temporarily reduce their probability of trading with the suppliers of the
recalled products by 25 percent. A milder decrease persists, accompanied by increased reliance on other foreign suppliers. Buyers that are affiliated with their suppliers decrease trade several quar-ters earlier than unaffiliated buyers, consistent with decision-making and information flowing faster within than across firm boundaries.
Center for Economic Studies Working Paper 20-15
EARNINGS GROWTH, JOB FLOWS AND CHURN
Satoshi Tanaka Lawrence Warren
David Wiczer
April 2020
How much do workers making job-to-job transi-tions benefit from moving away from a shrinking and towards a growing firm? We show that earn-ings growth in the transition increases with net employment growth at the destination firm and, to a lesser extent, decreases if the origin firm is shrinking. So, we sum the effect of leaving a shrinking and entering a growing firm and remove
the excess turnover-related hires because gross hiring has a much smaller association with earn-ings growth than net employment growth. We find that job-to-job transitions with the cross-firm job flow have 23 percent more earnings growth than average.

U.S. Census Bureau Center for Economic Studies Research Report: 2020 45
Center for Economic Studies Working Paper 20-16
MEASURING THE EFFECT OF COVID-19 ON U.S. SMALL BUSINESSES: THE SMALL BUSINESS PULSE SURVEY
Catherine Buffington Carrie Dennis
Emin Dinlersoz Lucia Foster
Shawn Klimek
May 2020
In response to the novel coronavirus (COVID-19) pandemic, the U.S. Census Bureau developed and fielded an entirely new survey intended to measure the effect on small businesses. The Small Business Pulse Survey (SBPS) will run weekly from April 26 to June 27, 2020. Results from the SBPS will be published weekly through a visualization tool with downloadable data. We describe the motivation for SBPS, summarize how the content for the sur-vey was developed, and discuss some of the initial results from the survey. We also describe
future plans for the SBPS collections and for our research using the SBPS data. Estimates from the first week of the SBPS indicate large to moderate negative effects of COVID-19 on small businesses, and yet the majority expect to return to usual level of operations within the next 6 months. Reflecting the Census Bureau’s commitment to scientific inquiry and transparency, the micro data from the SBPS will be available to qualified research-ers on approved projects in the federal statistical research data center network.
Center for Economic Studies Working Paper 20-19
THE IMPACT OF 2010 DECENNIAL CENSUS HIRING ON THE UNEMPLOYMENT RATE
Jonathan Eggleston Mark Klee
Kristin McCue Kristin Sandusky
Jim Spletzer
June 2020
The decennial census is the largest peacetime operation of the U.S. federal government. The U.S. Census Bureau hires hundreds of thousands of temporary workers to conduct the decennial census. The magnitude of this temporary work-force influences the national employment situa-tion when enumeration efforts ramp up and when they recede. The impact of decennial census hiring on the headline number of payroll jobs added each month is well established, but previous work has not established how decennial census hiring affects the headline unemployment rate. We link the 2010 Decennial Applicant Personnel and Payroll System data to the 2010 American Community Survey to answer this question. We find that the large hiring surge in May 2010 came
mostly from people already employed (40 per-cent) or from people who were unemployed (33 percent). We estimate that the workers hired for the 2010 Census lowered the May 2010 unemploy-ment rate by one-tenth of a percentage point relative to the counterfactual. This one-tenth of a percentage point is within the standard error for the official unemployment rate, and Bureau of Labor Statistics press releases would denote a change in the unemployment rate of 0.1 percent or less as “unchanged.” We also estimate that relative to the counterfactual, the more gradual changes in decennial census employment influenced the unemployment rate by less than one-tenth of a percentage point in every other month during 2010.

46 Center for Economic Studies Research Report: 2020 U.S. Census Bureau
Center for Economic Studies Working Paper 20-22
ESTIMATING THE IMMEDIATE IMPACT OF THE COVID-19 SHOCK ON PARENTAL ATTACHMENT TO THE LABOR MARKET AND THE DOUBLE BIND OF MOTHERS
Misty L. Heggeness
July 2020
I examine the impact of the COVID-19 shock on parents’ labor supply during the initial stages of the pandemic. Using difference-in-difference esti-mation and monthly panel data from the Current Population Survey (CPS), I compare labor mar-ket attachment, nonwork activity, hours worked, and earnings and wages of those in areas with early school closures and stay-in-place orders with those in areas with delayed or no pandemic closures. While there was no immediate impact on detachment or unemployment, mothers with jobs in early closure states were 68.8 percent more likely than mothers in late closure states to have a job but not be working as a result of early shutdowns. There was no effect on working
fathers or working women without school-age chil-dren. Mothers who continued working increased their work hours relative to comparable fathers; this effect, however, appears entirely driven by a reduction in fathers’ hours worked. Overall, the pandemic appears to have induced a unique immediate juggling act for working parents of school-age children. Mothers took a week of leave from formal work; fathers working full-time, for example, reduced their hours worked by 0.53 hours over the week. While experiences were dif-ferent for mothers and fathers, each are vulnerable to scarring and stunted opportunities for career growth and advancement due to the pandemic.
Center for Economic Studies Working Paper 20-23
WHO VALUES HUMAN CAPITALISTS’ HUMAN CAPITAL? HEALTHCARE SPENDING AND PHYSICIAN EARNINGS
Joshua D. Gottlieb Maria Polyakova
Kevin Rinz Hugh Shiplett
Victoria Udalova
July 2020
Is government guiding the invisible hand at the top of the labor market? We study this question among physicians, the most common occupation among the top one percent of income earners, and whose billings comprise one-fifth of healthcare spending. We use a novel linkage of population-wide tax records with the administrative registry of all physicians in the United States to study the characteristics of these high earnings and the influ-ence of government payments in particular. We find a major role for government on the margin, with half of direct changes to government reim-bursement rates owing directly into physicians’
incomes. These policies move physicians’ relative and absolute incomes more than any reasonable changes to marginal tax rates. At the same time, the overall level of physician earnings can largely be explained by labor market fundamentals of long work and training hours. Competing occupations also pay well and provide a natural lower bound for physician earnings. We conclude that govern-ment plays a major role in determining the value of physicians’ human capital, but it is unrealistic to use this power to reduce healthcare spending substantially.

U.S. Census Bureau Center for Economic Studies Research Report: 2020 47
Center for Economic Studies Working Paper 20-24
TRENDS IN EARNINGS VOLATILITY USING LINKED ADMINISTRATIVE AND SURVEY DATA
James P. Ziliak Charles Hokayem
Christopher R. Bollinger
August 2020
We document trends in earnings volatility sepa-rately by gender in combination with other char-acteristics, such as race, educational attainment, and employment status, using unique linked survey and administrative data for the tax years span-ning 1995–2015. We also decompose the variance of trend volatility into within- and between-group contributions, as well as transitory and perma-nent shocks. Our results for continuously working men suggest that trend earnings volatility was stable over our period in both survey and tax data, though with a substantial countercyclical business-cycle component. Trend earnings volatility among
women declined over the period in both survey and administrative data, but unlike for men, there was no change over the Great Recession. The vari-ance decompositions indicate that nonresponders, low-educated, racial minorities, and part-year workers have the greatest group specific earnings volatility, but with the exception of part-year work-ers, they contribute least to the level and trend of volatility owing to their small share of the popula-tion. There is evidence of stable transitory volatil-ity, but rising permanent volatility over the past two decades in male and female earnings.
Center for Economic Studies Working Paper 20-25
FAMILY-LEAVE MANDATES AND FEMALE LABOR AT U.S. FIRMS: EVIDENCE FROM A TRADE SHOCK
Fariha Kamal Asha Sundaram
Cristina J. Tello-Trillo
September 2020
We study the role of family-leave mandates in shaping the gender composition at U.S. firms that experience a negative demand shock. In a regres-sion discontinuity framework, we compare firms mandated to provide job-protected leave under the Family and Medical Leave Act (FMLA) and firms that are exempt from the law (non-FMLA) following the post-2001 surge in Chinese imports. Using confidential microdata on matched employ-ers and employees in the U.S. nonfarm private sector, we find that between 2000 and 2003,
an increase in import competition decreases the share of female workers at FMLA compared to non-FMLA firms. The negative differential effect is driven by female workers in prime child bearing years, with less than college education and is strongest at firms with all male managers. We find similar patterns in changes in the female share of earnings and promotions. These results are consis-tent with the presence of traditional gender norms that assign primary caregiving responsibilities at home to women.

48 Center for Economic Studies Research Report: 2020 U.S. Census Bureau
Center for Economic Studies Working Paper 20-26
A NEW MEASURE OF MULTIPLE JOBHOLDING IN THE U.S. ECONOMY
Keith A. Bailey James R. Spletzer
September 2020
We create a measure of multiple jobholding from the U.S. Census Bureau’s Longitudinal Employer-Household Dynamics data. This new series shows that 7.8 percent of persons in the United States are multiple jobholders, this percentage is procy-clical, and has been trending upward during the past 20 years. The data also show that earnings from secondary jobs are, on average, 27.8 percent
of a multiple jobholder’s total quarterly earnings. Multiple jobholding occurs at all levels of earnings, with both higher- and lower-earnings multiple job-holders earning more than 25 percent of their total earnings from multiple jobs. These new statistics tell us that multiple jobholding is more important in the U.S. economy than we knew.
Center for Economic Studies Working Paper 20-27
A SHORE THING: POST-HURRICANE OUTCOMES FOR BUSINESSES IN COASTAL AREAS
Melissa Chow Jordan Stanley
September 2020
During the twenty-first century, hurricanes, heavy storms, and flooding have affected many areas in the United States. Natural disasters and climate change can cause property damage and could have an impact on a variety of business outcomes. This paper builds upon existing research and litera-ture that analyzes the impact of natural disasters on businesses. Specifically, we look at the differ-ential effect of eight hurricanes during the period
2000–2009 on establishments in coastal counties relative to establishments in coastal-adjacent or inland counties. Our outcomes of interest include establishment employment and death. We find that following a hurricane event, establishments located in a coastal county have lower employ-ment and increased probability of death relative to establishments in noncoastal counties.

U.S. Census Bureau Center for Economic Studies Research Report: 2020 49
Center for Economic Studies Working Paper 20-28
IDENTIFYING U.S. MERCHANDISE TRADERS: INTEGRATING CUSTOMS TRANSACTIONS WITH BUSINESS ADMINISTRATIVE DATA
Fariha Kamal Wei Ouyang
September 2020
This paper describes the construction of the Longitudinal Firm Trade Transactions Database (LFTTD) enabling the identification of merchan-dise traders—exporters and importers—in the U.S. Census Bureau’s Business Register (BR). The LFTTD links merchandise export and import trans-actions from customs declaration forms to the BR beginning in 1992 through the present. We employ a combination of deterministic and probabilistic matching algorithms to assign a unique firm identi-fier in the BR to a merchandise export or import
transaction record. On average, we match 89 per-cent of export and import values to a firm identi-fier. In 1992, we match 79 (88) percent of export (import) value; in 2017, we match 92 (96) percent of export (import) value. Trade transactions in year t are matched to years between 1976 and t+1 of the BR. On average, 94 percent of the trade value matches to a firm in year t of the BR. The LFTTD provides the most comprehensive identification of and the foundation for the analysis of goods trad-ing firms in the U.S. economy.
Center for Economic Studies Working Paper 20-29
UNITED STATES EARNINGS DYNAMICS: INEQUALITY, MOBILITY, AND VOLATILITY
Kevin L. McKinney John M. Abowd John Sabelhaus
September 2020
Using data from the U.S. Census Bureau’s Longitudinal Employer-Household Dynamics (LEHD) infrastructure files, we study changes over time and across subnational populations in the distribution of real labor earnings. We con-sider four large metropolitan statistical areas (MSAs) (Detroit, Los Angeles, New York, and San Francisco) for the period 1998 to 2017, with particular attention paid to the subperiods before, during, and after the Great Recession. For the four large MSAs we analyze, there are clear national trends represented in each of the local areas, the most prominent of which is the increase in the share of earnings accruing to workers at the top
of the earnings distribution in 2017 compared with 1998. However, the magnitude of these trends var-ies across MSAs, with New York and San Francisco showing relatively large increases and Los Angeles somewhere in the middle relative to Detroit whose total real earnings distribution is relatively stable over the period. Our results contribute to the emerging literature on differences between national and regional economic outcomes, exem-plifying what will be possible with a new data exploration tool—the Earnings and Mobility Statistics (EAMS) Web application—currently under development at the Census Bureau.

50 Center for Economic Studies Research Report: 2020 U.S. Census Bureau
Center for Economic Studies Working Paper 20-30
TOTAL ERROR AND VARIABILITY MEASURES FOR THE QUARTERLY WORKFORCE INDICATORS AND LEHD ORIGIN DESTINATION EMPLOYMENT STATISTICS IN ONTHEMAP
Kevin L. McKinney Andrew S. Green
Lars Vilhuber John M. Abowd
September 2020
We report results from the first comprehensive total quality evaluation of five major indica-tors in the U.S. Census Bureau’s Longitudinal Employer-Household Dynamics (LEHD) Program Quarterly Workforce Indicators (QWI): total flow-employment, beginning-of-quarter employment, full-quarter employment, average monthly earn-ings of full-quarter employees, and total quarterly payroll. Beginning-of-quarter employment is also the main tabulation variable in the LEHD Origin-Destination Employment Statistics (LODES) work-place reports as displayed in OnTheMap (OTM), including OnTheMap for Emergency Management. We account for errors due to coverage; record-level
nonresponse; edit and imputation of item missing data; and statistical disclosure limitation. The analy-sis reveals that the five publication variables under study are estimated very accurately for tabulations involving at least 10 jobs. Tabulations involving three to nine jobs are a transition zone, where cells may be fit for use with caution. Tabulations involv-ing one or two jobs, which are generally suppressed on fitness-for-use criteria in the QWI and synthe-sized in LODES, have substantial total variability but can still be used to estimate statistics for untabu-lated aggregates as long as the job count in the aggregate is more than 10.
Center for Economic Studies Working Paper 20-31
MALE EARNINGS VOLATILITY IN LEHD BEFORE, DURING, AND AFTER THE GREAT RECESSION
Kevin L. McKinney John M. Abowd
September 2020
This paper is part of a coordinated collection of papers on prime-age male earnings volatility. Each paper produces a similar set of statistics for the same reference population using a different primary data source. Our primary data source is the U.S. Census Bureau’s Longitudinal Employer Household Dynamics (LEHD) infrastructure files. Using LEHD data from 1998 to 2016, we create a well-defined population frame to facilitate accurate estimation of temporal changes comparable to designed longitudinal samples of people. We show that earnings volatility, excluding increases during recessions, has declined over the analysis period, a finding robust to various sensitivity analyses. Although we find volatility is declining, the effect is not homogeneous, particularly for workers with
tenuous labor force attachment for whom volatil-ity is increasing. These “not stable” workers have earnings volatility approximately 30 times larger than stable workers, but more important for earn-ings volatility trends we observe a large increase in the share of stable employment from 60 percent in 1998 to 67 percent in 2016, which we show to largely be responsible for the decline in overall earnings volatility. To further emphasize the impor-tance of not stable and/or low earning workers we also conduct comparisons with the Panel Study of Income Dynamics (PSID) and show how changes over time in the share of workers at the bottom tail of the cross-sectional earnings distributions can produce either declining or increasing earnings volatility trends.

U.S. Census Bureau Center for Economic Studies Research Report: 2020 51
Center for Economic Studies Working Paper 20-33
DETERMINATION OF THE 2020 U.S. CITIZEN VOTING-AGE POPULATION (CVAP) USING ADMINISTRATIVE RECORDS AND STATISTICAL METHODOLOGY TECHNICAL REPORT
John M. Abowd William R. Bell J. David Brown
Michael B. Hawes Misty L. Heggeness
Andrew D. Keller Vincent T. Mule, Jr. Joseph L. Schafer Matthew Spence Lawrence Warren
Moises Yi
October 2020
This report documents the efforts of the U.S. Census Bureau’s Citizen Voting-Age Population (CVAP) Internal Expert Panel (IEP) and Technical Working Group (TWG) toward the use of multiple data sources to produce block-level statistics on the citi-zen voting-age population for use in enforcing the Voting Rights Act. It describes the administrative,
survey, and census data sources used, and the four approaches developed for combining these data to produce CVAP estimates. It also discusses other aspects of the estimation process, including how records were linked across the multiple data sources and the measures taken to protect the confidential-ity of the data.
Center for Economic Studies Working Paper 20-34
AN EVALUATION OF THE GENDER WAGE GAP USING LINKED SURVEY AND ADMINISTRATIVE DATA
Thomas B. Foster Marta Murray-Close
Liana Christin Landivar Mark deWolf
November 2020
The narrowing of the gender wage gap has slowed in recent decades. However, current estimates show that, among full-time, year-round workers, women earn approximately 18 to 20 percent less than men at the median. Women’s human capital and labor force characteristics that drive wages increasingly resemble men’s, so remaining differ-ences in these characteristics explain less of the gender wage gap now than in the past. As these factors wane in importance, studies show that others like occupational and industrial segrega-tion explain larger portions of the gender wage gap. However, a major limitation of these stud-ies is that the large datasets required to analyze occupation and industry effectively lack measures of labor force experience. This study combines survey and administrative data to analyze and improve estimates of the gender wage gap within
detailed occupations, while also accounting for gender differences in work experience. We find a gender wage gap of 18 percent among full-time, year-round workers across 316 detailed occupation categories. We show the wage gap varies signifi-cantly by occupation: while wages are at parity in some occupations, gaps are as large as 45 percent in others. More competitive and hazardous occu-pations, occupations that reward longer hours of work, and those that have a larger propor-tion of women workers have larger gender wage gaps. The models explain less of the wage gap in occupations with these attributes. Occupational characteristics shape the conditions under which men and women work and we show these charac-teristics can make for environments that are more or less conducive to gender parity in earnings.

52 Center for Economic Studies Research Report: 2020 U.S. Census Bureau
Center for Economic Studies Working Paper 20-35
THE EITC AND INTERGENERATIONAL MOBILITY
Maggie R. Jones Emilia Simeonova
Randall Akee
November 2020
We study how the largest federal tax-based policy intended to promote work and increase incomes among the poor—the Earned Income Tax Credit (EITC)—affects the socioeconomic standing of children who grew up in households affected by the policy. Using the universe of tax filer records for children linked to their parents, matched with demographic and household information from the decennial census and American Community Survey data, we exploit exogenous differences by chil-dren’s ages in the births and “aging out” of siblings to assess the effect of EITC generosity on child outcomes. We focus on assessing mobility in the child income distribution, conditional on the par-ents’ position in the parental income distribution. Our findings suggest significant and mostly posi-tive effects of more generous EITC refunds on the next generation that vary substantially depend-ing on the child’s household type (single-mother or married family) and by the child’s gender. All
children, except White children from single-mother households, experience increases in cohort-specific income rank, own family income, and the probability of working at the ages of 25–26 in response to greater EITC generosity. Children from married households show a considerably stron-ger response on these measures than do children from single-mother households. Because of the concentration of family types within race groups, the more positive response among children from married households suggests the EITC might lead to higher within-generation racial income inequal-ity. Finally, we examine how the impact of EITC generosity varies by the age at which children are exposed to higher benefits. These results suggest that children who first receive the more generous two-child treatment at later ages have a stron-ger positive response in terms of rank and family income than children exposed at younger ages.
Center for Economic Studies Working Paper 20-36
THE GRANDKIDS AREN’T ALRIGHT: THE INTERGENERATIONAL EFFECTS OF PRENATAL POLLUTION EXPOSURE
Jonathan Colmer John Voorheis
November 2020
Evidence shows that environmental quality shapes human capital at birth with long-run effects on health and welfare. Do these effects, in turn, affect the economic opportunities of future generations? Using newly linked survey and administrative data, providing more than 150 million parent-child links, we show that regula-tion-induced improvements in air quality that an individual experienced in the womb increase the likelihood that their children, the second
generation, attend college 40 to 50 years later. Intergenerational transmission appears to arise from greater parental resources and investments, rather than heritable, biological channels. Our findings suggest that within-generation estimates of marginal damages substantially underestimate the total welfare effects of improving environ-mental quality and point to the empirical rele-vance of environmental quality as a contributor to economic opportunity in the United States.

U.S. Census Bureau Center for Economic Studies Research Report: 2020 53
Center for Economic Studies Working Paper 20-37
TWISTING THE DEMAND CURVE: DIGITALIZATION AND THE OLDER WORKFORCE
Erling Barth James C. Davis
Richard B. Freeman Kristina McElheran
November 2020
This paper uses U.S. Census Bureau panel data that link firm software investment to worker earn-ings. We regress the log of earnings of workers by age group on the software investment by their employing firm. To unpack the potential causal factors for differential software effects by age group, we extend the Abowd-Kramarz-Margolis (AKM) framework by including job-spell fixed effects that allow for a correlation between the worker-firm match and age and by including time-varying firm effects that allow for a correlation between wage-enhancing productivity shocks and software investments. Within job-spell, software
capital raises earnings at a rate that declines post age 50 to about zero after age 65. By contrast, the effects of non-IT equipment investment on earn-ings increase for workers post age 50. The differ-ence between the software and non-IT equipment effects suggests that our results are attributable to the technology rather than to age-related bargain-ing power. Our data further show that software capital increases the earnings of high-wage work-ers relative to low-wage workers and the earnings in high-wage firms relative to low-wage firms and may, thus, widen earnings inequality within and across firms.
Center for Economic Studies Working Paper 20-40
ADVANCED TECHNOLOGIES ADOPTION AND USE BY U.S. FIRMS: EVIDENCE FROM THE ANNUAL BUSINESS SURVEY
Nikolas Zolas Zachary Kroff
Erik Brynjolfsson Kristina McElheran
David Beede Catherine Buffington Nathan Goldschlag
December 2020
We introduce a new survey module intended to complement and expand research on the causes and consequences of advanced technology adop-tion. The 2018 Annual Business Survey (ABS), conducted by the U.S. Census Bureau in partner-ship with the National Center for Science and Engineering Statistics (NCSES), provides com-prehensive and timely information on the diffu-sion among U.S. firms of advanced technologies including artificial intelligence (AI), cloud com-puting, robotics, and the digitization of business information. The 2018 ABS is a large, nationally representative sample of over 850,000 firms cov-ering all private, nonfarm sectors of the economy. We describe the motivation for and development of the technology module in the ABS, as well as
provide a first look at technology adoption and use patterns across firms and sectors. We find that digitization is quite widespread, as is some use of cloud computing. In contrast, advanced technol-ogy adoption is rare and generally skewed towards larger and older firms. Adoption patterns are con-sistent with a hierarchy of increasing technologi-cal sophistication, in which most firms that adopt AI or other advanced business technologies also use the other, more widely diffused technologies. Finally, while few firms are at the technology fron-tier, they tend to be large so technology exposure of the average worker is significantly higher. This new data will be available to qualified research-ers on approved projects in the federal statistical research data center (FSRDC) network.

54 Center for Economic Studies Research Report: 2020 U.S. Census Bureau
Center for Economic Studies Working Paper 20-41
BUSINESS-LEVEL EXPECTATIONS AND UNCERTAINTY
Nicholas Bloom Steven J. Davis
Lucia Foster Brian Lucking
Scott Ohlmacher Itay Saporta-Eksten
December 2020
The U.S. Census Bureau’s 2015 Management and Organizational Practices Survey (MOPS) utilized innovative methodology to collect five-point forecast distributions over own future shipments, employment, and capital and materials expendi-tures for 35,000 U.S. manufacturing plants. First and second moments of these plant-level forecast distributions covary strongly with first and second moments, respectively, of historical outcomes. The first moment of the distribution provides a measure of business’ expectations for future outcomes, while the second moment provides a measure of business’ subjective uncertainty over those outcomes. This subjective uncertainty measure correlates positively with financial risk measures. Drawing on the Annual Survey of Manufactures and the Census of Manufactures
for the corresponding realizations, we find that subjective expectations are highly predictive of actual outcomes and, in fact, more predictive than statistical models fit to historical data. When respondents express greater subjective uncer-tainty about future outcomes at their plants, their forecasts are less accurate. However, managers supply overly precise forecast distributions in that implied confidence intervals for sales growth rates are much narrower than the distribution of actual outcomes. Finally, we develop evidence that greater use of predictive computing and structured management practices at the plant and a more decentralized decision-making process (across plants in the same firm) are associated with better forecast accuracy.
Center for Economic Studies Working Paper 20-44
IMMIGRATION AND ENTREPRENEURSHIP IN THE UNITED STATES
Pierre Azoulay Benjamin F. Jones
J. Daniel Kim Javier Miranda
December 2020
Immigrants can expand labor supply and com-pete for jobs with native-born workers. But immigrants may also start new firms, expanding labor demand. This paper uses U.S. administra-tive data and other data sources to study the role of immigrants in entrepreneurship. We ask how often immigrants start companies, how many jobs these firms create, and how firms founded by
native-born individuals compare. A simple model provides a measurement framework for address-ing the dual roles of immigrants as founders and workers. The findings suggest that immigrants act more as “job creators” than “job takers” and play outsized roles in U.S. high-growth entrepreneurship.

U.S. Census Bureau Center for Economic Studies Research Report: 2020 55
20-01 “Rising Import Tariffs, Falling Export Growth: When Modern Supply Chains Meet Old-Style Protectionism,” by Kyle Handley, Fariha Kamal, and Ryan Monarch, January 2020.
20-02 “What Caused Racial Disparities in Particulate Exposure to Fall? New Evidence From the Clean Air Act and Satellite-Based Measures of Air Quality,” by Janet Currie, John Voorheis, and Reed Walker, January 2020.
20-03 “Matching State Business Registration Records to Census Business Data,” by J. Daniel Kim and Kristin McCue, January 2020.
20-04 “Housing Booms and the U.S. Productivity Puzzle,” by Jose Carreno, January 2020.
20-05 “Validating Abstract Representations of Spatial Population Data While Considering Disclosure Avoidance,” by James Gaboardi, February 2020.
20-06 “Do Cash Windfalls Affect Wages? Evidence From R&D Grants to Small Firms,” by Sabrina T. Howell and J. David Brown, February 2020.
20-07 “Misallocation or Mismeasurement?” by Mark Bils, Peter J. Klenow, and Cian Ruane, February 2020.
20-08 “Between Firm Changes in Earnings Inequality: The Dominant Role of Industry Effects,” by John Haltiwanger and James R. Spletzer, February 2020.
20-09 “Compositional Nature of Firm Growth and Aggregate Fluctuations,” by Vladimir Smirnyagin, March 2020.
Appendix 4. CENTER FOR ECONOMIC STUDIES WORKING PAPERS: 2020CES Working Papers are available at <www.census.gov/programs-surveys/ces/research /ces-discussion-paper-series.html>.
20-10 “Do Short-Term Incentives Affect Long-Term Productivity?” by Heitor Almeida, Nuri Ersahin, Vyacheslav Fos, Rustom M. Irani, and Mathias Kronlund, March 2020.
20-11 “Are Customs Records Consistent Across Countries? Evidence From the U.S. and Colombia,” by C.J. Krizan, James Tybout, Zi Wang, and Yingyan Zhao, March 2020.
20-12 “The Micro-Level Anatomy of the Labor Share Decline,” by Matthias Kehrig and Nicolas Vincent, March 2020.
20-13 “Recall and Response: Relationship Adjustments to Adverse Information Shocks,” by Emek Basker and Fariha Kamal, March 2020.
20-14 “R&D or R vs. D? Firm Innovation Strategy and Equity Ownership,” by James Driver, Adam Kolasinski, and Jared Stanfield, April 2020.
20-15 “Earnings Growth, Job Flows and Churn,” by Satoshi Tanaka, Lawrence Warren, and David Wiczer, April 2020.
20-16 “Measuring the Effect of COVID-19 on U.S. Small Businesses: The Small Business Pulse Survey,” by Catherine Buffington, Carrie Dennis, Emin Dinlersoz, Lucia Foster, and Shawn Klimek, May 2020.
20-17 “Does Goliath Help David? Anchor Firms and Startup Clusters,” by Rahul R. Gupta, May 2020.
20-18 “The Energy Efficiency Gap and Energy Price Responsiveness in Food Processing,” by Gale Boyd and Matt Doolin, June 2020.

56 Center for Economic Studies Research Report: 2020 U.S. Census Bureau
20-27 “A Shore Thing: Post-Hurricane Outcomes for Businesses in Coastal Areas,” by Melissa Chow and Jordan Stanley, September 2020.
20-28 “Identifying U.S. Merchandise Traders: Integrating Customs Transactions With Business Administrative Data,” by Fariha Kamal and Wei Ouyang, September 2020.
20-29 “United States Earnings Dynamics: Inequality, Mobility, and Volatility,” by Kevin L. McKinney, John M. Abowd, and John Sabelhaus, September 2020.
20-30 “Total Error and Variability Measures for the Quarterly Workforce Indicators and LEHD Origin Destination Employment Statistics in OnTheMap,” by Kevin L. McKinney, Andrew S. Green, Lars Vilhuber, and John M. Abowd, September 2020.
20-31 “Male Earnings Volatility in LEHD Before, During, and After the Great Recession,” by Kevin L. McKinney and John M. Abowd, September 2020.
20-32 “Home Equity Lending, Credit Constraints and Small Business in the US,” by William D. Lastrapes, Ian Schmutte, and Thor Watson, October 2020.
20-33 “Determination of the 2020 U.S. Citizen Voting Age Population (CVAP) Using Administrative Records and Statistical Methodology Technical Report,” by John M. Abowd, William R. Bell, J. David Brown, Michael B. Hawes, Misty L. Heggeness, Andrew D. Keller, Vincent T. Mule Jr., Joseph L. Schafer, Matthew Spence, Lawrence Warren, and Moises Yi, October 2020.
20-19 “The Impact of 2010 Decennial Census Hiring on the Unemployment Rate,” by Jonathan Eggleston, Mark Klee, Kristin McCue, Kristin Sandusky, and Jim Spletzer, June 2020.
20-20 “The Disappearing IPO Puzzle: New Insights From Proprietary U.S. Census Data on Private Firms,” by Thomas Chemmanur, Jie (Jack) He, Xiao (Shaun) Ren, and Tao Shu, June 2020.
20-21 “How Does State-Level Carbon Pricing in the United States Affect Industrial Competitiveness?” by Brendan Casey, Wayne B. Gray, Joshua Linn, and Richard D. Morgenstern, June 2020.
20-22 “Estimating the Immediate Impact of the COVID-19 Shock on Parental Attachment to the Labor Market and the Double Bind of Mothers,” by Misty L. Heggeness, July 2020.
20-23 “Who Values Human Capitalists’ Human Capital? Healthcare Spending and Physician Earnings,” by Joshua D. Gottlieb, Maria Polyakova, Kevin Rinz, Hugh Shiplett, and Victoria Udalova, July 2020.
20-24 “Trends in Earnings Volatility Using Linked Administrative and Survey Data,” by James P. Ziliak, Charles Hokayem, and Christopher R. Bollinger, August 2020.
20-25 “Family-Leave Mandates and Female Labor at U.S. Firms: Evidence From a Trade Shock,” by Fariha Kamal, Asha Sundaram, and Cristina J. Tello-Trillo, September 2020.
20-26 “A New Measure of Multiple Jobholding in the U.S. Economy,” by Keith A. Bailey and James R. Spletzer, September 2020.

U.S. Census Bureau Center for Economic Studies Research Report: 2020 57
20-34 “An Evaluation of the Gender Wage Gap Using Linked Survey and Administrative Data,” by Thomas B. Foster, Marta Murray-Close, Liana Christin Landivar, and Mark deWolf, November 2020.
20-35 “The EITC and Intergenerational Mobility,” by Maggie R. Jones, Emilia Simeonova, and Randall Akee, November 2020.
20-36 “The Grandkids Aren’t Alright: The Intergenerational Effects of Prenatal Pollution Exposure,” by Jonathan Colmer and John Voorheis, November 2020.
20-37 “Twisting the Demand Curve: Digitalization and the Older Workforce,” by Erling Barth, James C. Davis, Richard B. Freeman, and Kristina McElheran, November 2020.
20-38 “Business Dynamics on American Indian Reservations: Evidence From Longitudinal Datasets,” by Randall Akee, Elton Mykerezi, and Richard Todd, December 2020.
20-39 “The Children of HOPE VI Demolitions: National Evidence on Labor Market Outcomes,” by John C. Haltiwanger, Mark J. Kutzbach, Giordano Palloni, Henry O. Pollakowski, Matthew Staiger, and Daniel H. Weinberg, December 2020.
20-40 “Advanced Technologies Adoption and Use by U.S. Firms: Evidence From the Annual Business Survey,” by Nikolas Zolas, Zachary Kroff, Erik Brynjolfsson, Kristina McElheran, David Beede, Catherine Buffington, Nathan Goldschlag, Lucia Foster, and Emin Dinlersoz, December 2020.
20-41 “Business-Level Expectations and Uncertainty,” by Nicholas Bloom, Steven J. Davis, Lucia Foster, Brian Lucking, Scott Ohlmacher, and Itay Saporta-Eksten, December 2020.
20-42 “Family Formation and the Great Recession,” by Garrett Anstreicher, December 2020.
20-43 “The Shifting of the Property Tax on Urban Renters: Evidence From New York State’s Homestead Tax Option,” by David J. Scwegman and John Yinger, December 2020.
20-44 “Immigration and Entrepreneurship in the United States,” by Pierre Azoulay, Benjamin F. Jones, J. Daniel Kim, and Javier Miranda, December 2020.
20-45 “Entrepreneurial Teams: Diversity of Skills and Early-Stage Growth,” by Francesco D’Acunto, Geoffrey Tate, and Liu Yang, December 2020.

This page is intentionally blank.

U.S. Census Bureau Center for Economic Studies Research Report: 2020 59
Appendix 5. LONGITUDINAL EMPLOYER–HOUSEHOLD DYNAMICS (LEHD) PARTNERSUnder the Local Employment Dynamics (LED) Partnership, the Longitudinal Employer-Household Dynamics (LEHD) research team at the Center for Economic Studies produces new, cost effective, public-use information combining federal, state, and U.S. Census Bureau data on employers and employees. The LED Partnership works to fill critical data gaps and provide indicators increasingly needed by state and local authorities to make informed decisions affecting their economies and workforces.
LOCAL EMPLOYMENT DYNAMICS (LED)STEERING COMMITTEEAs of January 2021.
New England (Connecticut, Maine, Massachusetts, New Hampshire, Rhode Island, Vermont) Patrick Flaherty, Director Office of Research and Information Connecticut Department of Labor
New York/New Jersey (New York, New Jersey, Puerto Rico, U.S. Virgin Islands) Leonard Preston, Chief Labor Market Information New Jersey Department of Labor and Workforce Development
Mid-Atlantic (Delaware, District of Columbia, Maryland, Pennsylvania, Virginia, West Virginia) Tim Kestner, Director Economic Information and Analytics Division Virginia Employment Commission
Southeast (Alabama, Florida, Georgia, Kentucky, Mississippi, North Carolina, South Carolina, Tennessee) Meihui Bodane, Interim Assistant Secretary of Policy, Research and Strategy Labor and Economic Analysis Division North Carolina Department of Commerce
Midwest (Illinois, Indiana, Iowa, Michigan, Minnesota, Nebraska, North Dakota, Ohio, South Dakota, Wisconsin) Coretta Pettway, Chief Labor Market Information Bureau Ohio Department of Job and Family Services
Mountain-Plains (Colorado, Kansas, Missouri, Utah, Wyoming) Jeffrey Drake, Labor Market Information Manager Missouri Economic Research and Information Center Missouri Department of Higher Education and Workforce
Southwest (Arkansas, Louisiana, New Mexico, Oklahoma, Texas) Rachel Moskowitz, Chief Economic Research and Analysis Bureau New Mexico Department of Workforce Solutions
Western (Alaska, Arizona, California, Guam, Hawaii, Idaho, Nevada, Oregon, Washington) Robert Uhlenkott, Division Director Workforce and Economic Research Oregon Employment Department
FEDERAL PARTNERS
U.S. Department of AgricultureU.S. Department of Commerce, National Oceanic
and Atmospheric Administration, National Hurrican Center
U.S. Department of Homeland Security, Federal Emergency Management Agency
U.S. Department of the InteriorU.S. Office of Personnel ManagementU.S. Bureau of Labor StatisticsU.S. Geological Survey, Geospatial Multi-Agency
CoordinationInternal Revenue Service U.S. Army

60 Center for Economic Studies Research Report: 2020 U.S. Census Bureau
STATE EDUCATION PARTNERSAs of January 2021.
University of Texas SystemColorado Department of Higher EducationInstitute for Research on Innovation and Science,
in partnership with: University of Michigan University of Wisconsin—MadisonCity University of New YorkState University of New YorkTexas Higher Education Coordinating BoardPennsylvania State UniversityConnecticut State Colleges and UniversitiesOhio Department of Higher EducationIndiana Commission for Higher EducationMaine Community College SystemArizona Board of RegentsLouisiana Board of RegentsUniversity of Alabama System
STATE PARTNERSAs of January 2021.
Alabama Michele Tatum, Acting Director Labor Market Information Division Alabama Department of Labor
Alaska Dan Robinson, Director Research and Analysis Section Alaska Department of Labor and Workforce Development
Arizona Doug Walls, Labor Market Information Director Arizona Office of Economic Opportunity
Arkansas Robert S. Marek, Chief Labor Market Information and Employer Tax Credits Division Arkansas Division of Workforce Services
California Amy Faulkner, Chief Labor Market Information Division California Employment Development Department
Colorado Michelle Morelli, Director Office of Labor Market Information Colorado Department of Labor and Employment
Connecticut Patrick Flaherty, Director Office of Research Connecticut Department of Labor
Delaware Thomas Dougherty, Chief Office of Occupational and Labor Market Information Delaware Department of Labor
District of Columbia Jonathan Toye, Interim Director Office of Labor Market Research and Performance District of Columbia Department of Employment Services
Florida Adrienne Johnston, Chief Bureau of Workforce Statistics and Economic Research Florida Department of Economic Opportunity
Georgia Mark Watson, Director Workforce Statistics and Economic Research Georgia Department of Labor
Guam Gary Hiles, Chief Economist Government of Guam Department of Labor
Hawaii Jeri Sato, Acting Co-Director Jeri Arucan, Acting Co-Director Research and Statistics Office Hawaii Department of Labor and Industrial Relations
Idaho Salvador Vazquez, Labor Market Information Director Research and Analysis Bureau Idaho Department of Labor
Illinois Kristin Richards, Director Economic Information and Analysis Division Illinois Department of Employment Security

U.S. Census Bureau Center for Economic Studies Research Report: 2020 61
Indiana Charlie Baer, LMI Director Research and Analysis Indiana Department of Workforce Development
Iowa Christina Steen, Director Labor Market Information Division Iowa Workforce Development
Kansas Angela Berland, Director Labor Market Information Services Kansas Department of Labor
Kentucky Jessica Cunningham, Interim Executive Director Kentucky Center for Statistics
Louisiana Mark Jones, Research and Statistics Director Office of Occupational Information Services Louisiana Workforce Commission
Maine Mark McInerney, Director Center for Workforce Research and Information Maine Department of Labor
Maryland Carolyn Mitchell, Director Office of Workforce Information and Performance Maryland Department of Labor
Massachusetts Ron Maranian, Acting Director Economic Research Department Massachusetts Department of Unemployment Assistance
Michigan Scott Powell, Director Bureau of Labor Market Information and Strategic Initiatives Michigan Department of Technology, Management, and Budget
Minnesota Oriane Casale, Acting Director BLS Cooperative Programs Minnesota Department of Employment and Economic Development
Mississippi Mary Willoughby, Bureau Director Labor Market Information Mississippi Department of Employment Security
Missouri Jeffrey Drake, Labor Market Information Manager Missouri Economic Research and Information Center Missouri Department of Higher Education and Workforce Development
Montana Mike Peery, Director Labor Market Information Montana Department of Labor and Industry
Nebraska Scott Hunzeker, Research Administrator Nebraska Department of Labor
Nevada David Schmidt, Chief Economist Research and Analysis Bureau Nevada Department of Employment, Training, and Rehabilitation
New Hampshire Brian Gottlob, Director Economic and Labor Market Information Bureau New Hampshire Department of Employment Security
New Jersey Chester Chinsky, Director Economic and Demographic Research New Jersey Department of Labor and Workforce Development
New Mexico Rachel Moskowitz, Chief Economic Research and Analysis Bureau New Mexico Department of Workforce Solutions
New York Odo Butler, Director Division of Research and Statistics New York State Department of Labor
North Carolina Meihui Bodane, Interim Assistant Secretary of Policy, Research, and Strategy Labor and Economic Analysis Division North Carolina Department of Commerce

62 Center for Economic Studies Research Report: 2020 U.S. Census Bureau
North Dakota Marcia Havens, Manager Labor Market Information Center Job Service North Dakota
Ohio Coretta Pettway, Chief Labor Market Information Bureau Ohio Department of Job and Family Services
Oklahoma Lynn Gray, Director Economic Research and Analysis Oklahoma Employment Security Commission
Oregon Robert Uhlenkott, Division Director Workforce and Economic Research Oregon Employment Department
Pennsylvania Ed Legge, Director Center for Workforce Information and Analysis Pennsylvania Department of Labor and Industry
Puerto Rico Juan Lopez, Acting Director Bureau of Labor Statistics Department of Labor
Rhode Island Donna Murray, Assistant Director Labor Market Information Rhode Island Department of Labor and Training
South Carolina Brian Nottingham, Director Business Intelligence Department South Carolina Department of Employment and Workforce
South Dakota Melodee Lane, Administrator Labor Market Information Center South Dakota Department of Labor and Regulation
Tennessee Kshitiz Rastogi, Director Workforce Insights and Reporting Engine Division Tennessee Department of Labor and Workforce Development
Texas Mariana Vega, Director Labor Market Information Texas Workforce Commission
Utah Collin Petersen, Director Research and Analysis Utah Department of Workforce Services
Vermont Mathew Barewicz, Director Economic and Labor Market Information Section Vermont Department of Labor
Virgin Islands Gary Halyard, Director Bureau of Labor Statistics U.S. Virgin Islands Department of Labor
Virginia Tim Kestner, Director Economic Information and Analytics Division Virginia Employment Commission
Washington Steven Ross, Director Labor Market and Economic Analysis Washington Employment Security Department
West Virginia Joseph Jarvis, Director Research, Information and Analysis Division Workforce West Virginia
Wisconsin Dennis Winters, Director Bureau of Workforce Information and Technical Support Wisconsin Department of Workforce Development
Wyoming Tony Glover, Manager Research and Planning Wyoming Department of Workforce Services

U.S. Census Bureau Center for Economic Studies Research Report: 2020 63
Appendix 6. CENTER FOR ECONOMIC STUDIES ORGANIZATIONAL CHART (January 2021)