IsPOD DISTRICT REPORT - GUILFORD 11APR10
19
GUILFORD COUNTY REPORT The North Carolina Alliance for Athletics, Health, Physical Education, Recreation,and Dance (NCAAHPERD), launched In-school Prevention of Obesity andDisease (IsPOD) in 2007. The initiative began with a grant from the NC Healthand Wellness Trust Fund and was expanded with grants from the Blue CrossBlue Shield of North Carolina Foundation. The expansion to a state-wide programis supported by a $3.6 million grant from the Kate B. Reynolds Charitable Trust.NCAAHPERD is engaged with a large network of health and physical educationgroups seeking greater opportunities for a healthier and more creative NorthCarolina. IsPOD Data Report Fall 2010
-
Upload
north-carolina-alliance-for-athletics-health-physical-education-recreation-and-dance-ncaahperd -
Category
Documents
-
view
223 -
download
5
description
IsPOD Data Report Fall 2010 % Needy ID School Name Grades 3-5 Grades 1-2 SPARK Trained? Using FG? 2010- 2011 ADM FG Response Rates # Staff Trained 2011 NC IsPOD Evaluation Conducted by NCAAHPERD/NC DPH All rights reserved. a. Average Daily Membership (ADM) for first month of the 2010-2011 school year.
Transcript of IsPOD DISTRICT REPORT - GUILFORD 11APR10
GUILFORD COUNTY
REPORT
The North Carolina Alliance for Athletics, Health, Physical Education, Recreation,and Dance (NCAAHPERD), launched In-school Prevention of Obesity
andDisease (IsPOD) in 2007. The initiative began with a grant from the NC Healthand Wellness Trust Fund and was expanded with grants from the Blue
CrossBlue Shield of North Carolina Foundation. The expansion to a state-wide programis supported by a $3.6 million grant from the Kate B. Reynolds Charitable
Trust.NCAAHPERD is engaged with a large network of health and physical educationgroups seeking greater opportunities for a healthier and more creative
NorthCarolina.
IsPOD Data
Report
Fall 2010

2011 NC IsPOD Evaluation
Conducted by NCAAHPERD/NC DPH All rights reserved.
Guilford County
SPARK Training
Staff from Guilford County began receiving SPARK training in the 2009-10 school
year with the KBR Grant. Guilford County has 92 active K-8 public schools in
2010-2011. Of these 92 schools, 89 schools (or 97%) have received SPARK
training. At these schools, a total of 141 PE teachers and 7 coordinators have
been trained in SPARK. Table 1 shows the Guilford County K-8 schools that
have received SPARKTM training and the number of staff trained. FitnessGramTM
Response Rates are also given for each of the K-8 schools.
Table 1
Guilford County K-8 Schools
Schools with SPARKTM Training and FitnessGramTM Response Rates
a. Average Daily Membership (ADM) for first month of the 2010-2011 school year.
ID School Name
DEMOGRAPHICS SPARK FITNESSGRAM
2010-2011 ADM
% Needy
SPARK Trained?
# Staff Trained
Using FG?
FG Response Rates
Grades 1-2
Grades 3-5
Grades 6-8
304 Alamance Elementary 778 46% YES 2 YES 0% 6% NA
307 Edwin A Alderman Elem 345 81% YES 1 YES 0% 95% NA
310 Allen Jay Elementary 435 97% YES 3 NO 0% 0% NA
313 Southern Middle School 769 70% YES 3 YES NA NA 32%
316 Allen Middle 681 80% NO 0 NO NA NA 0%
322 Archer Elementary 425 90% YES 1 YES 0% 97% NA
325 Aycock Middle 642 69% YES 4 YES NA NA 75%
328 Bessemer Elementary 394 100% YES 1 YES 0% 94% NA
331 Bluford Elementary 331 82% YES 1 YES 0% 99% NA
334 Brightwood Elementary 696 87% YES 2 YES 0% 96% NA
337 Brooks Global Studies 395 24% YES 1 YES 0% 97% NA
340 Monticello-Brown Elem 434 52% YES 1 YES 0% 100% NA

2011 NC IsPOD Evaluation Conducted by NCAAHPERD/NC DPH
All rights reserved.
2
Table 1 (continued)
Guilford County K-8 Schools
Schools with SPARKTM Training and FitnessGramTM Response Rates
a. Average Daily Membership (ADM) for first month of the 2010-2011 school year.
ID School Name
DEMOGRAPHICS SPARK FITNESSGRAM
2010-2011 ADM
% Needy
SPARK Trained?
# Staff Trained
Using FG?
FG Response Rates
Grades 1-2
Grades 3-5
Grades 6-8
341 Brown Summit Middle 240 30% YES 1 NO NA NA 0%
343 Claxton Elementary 631 29% YES 2 YES 0% 91% NA
346 Colfax Elementary 634 37% YES 1 YES 0% 97% NA
349 Ceasar Cone Elementary 385 97% YES 1 YES 0% 103% NA
361 Erwin Montessori 317 40% YES 1 YES 0% 98% NA
364 Fairview Elementary 401 100% YES 1 YES 0% 65% NA
366 Waldo C Falkener Elem 591 95% YES 1 YES 0% 89% NA
367 Ferndale Middle 835 76% YES 4 YES NA NA 41%
370 Florence Elementary 867 36% YES 3 YES 0% 96% NA
373 Julius I Foust Elementary 305 100% YES 1 YES 0% 90% NA
376 Cyrus P Frazier Elem 335 86% YES 1 YES 0% 97% NA
379 Gateway Education Ctr 65 97% YES 2 NO 0% 0% 0%
382 Gibsonville Elementary 449 49% YES 1 YES 0% 100% NA
385 Gillespie Park Elementary 214 94% YES 2 YES 0% 71% NA
388 General Greene Elem 521 34% YES 1 YES 0% 98% NA
391 Penn-Griffin Sch For Arts 593 56% YES 3 NO NA NA 0%
396 High School Ahead Acad 100 81% YES 1 NO NA NA 0%
397 Guilford Middle 731 62% YES 3 YES NA NA 34%
398 Doris Henderson 177 100% YES 1 NO NA 0% 0%
400 Guilford Elementary 560 77% YES 1 YES 0% 12% NA
402 Otis L Hairston Sr Middle 559 94% YES 2 NO NA NA 0%
403 W M Hampton Elem 225 100% YES 1 YES 116% 108% NA
409 Hunter Elementary 407 100% YES 1 YES 0% 100% NA
412 Irving Park Elementary 663 65% YES 2 YES 0% 95% NA
415 Jackson Middle 424 98% YES 2 YES NA NA 101%
418 Jamestown Elementary 496 72% YES 1 YES 0% 99% NA
421 Jamestown Middle 1086 52% YES 1 YES NA NA 25%
423 Jefferson Elementary 737 58% YES 2 YES 0% 96% NA
424 Jesse Wharton Elem 812 42% YES 2 YES 0% 88% NA
427 Johnson Street Global 341 72% YES 1 NO 0% 0% 0%
430 David D Jones Elem 705 60% YES 1 NO 0% 0% NA
436 James Y Joyner Elem 378 72% YES 2 YES 0% 93% NA
437 Kernodle Middle 955 18% YES 3 YES NA NA 97%
439 Kirkman Park Elementary 257 95% YES 1 YES 80% 97% NA
442 Kiser Middle 807 60% YES 3 YES NA NA 39%
448 The Academy At Lincoln 702 41% YES 0 YES NA 17% 21%
451 John Van Lindley Elem 400 64% YES 1 YES 0% 67% NA
454 Madison Elementary 255 54% YES 1 YES 11% 102% NA
457 C D Mciver Education Ctr 128 63% NO 0 NO 0% 0% 0%
460 Eastern Middle 928 64% YES 5 YES NA NA 36%

2011 NC IsPOD Evaluation Conducted by NCAAHPERD/NC DPH
All rights reserved.
3
Table 1 (continued)
Guilford County K-8 Schools
Schools with SPARKTM Training and FitnessGramTM Response Rates
a. Average Daily Membership (ADM) for first month of the 2010-2011 school year.
ID School Name
DEMOGRAPHICS SPARK FITNESSGRAM
2010-2011 ADM
% Needy
SPARK Trained?
# Staff Trained
Using FG?
FG Response Rates
Grades 1-2
Grades 3-5
Grades 6-8
461 Mcleansville Elementary 399 78% YES 1 NO 0% 0% NA
463 Mendenhall Middle 995 48% YES 3 YES NA NA 30%
466 Millis Road Elementary 489 41% YES 1 YES 0% 99% NA
469 Montlieu Math & Sci Acad 411 97% YES 2 YES 0% 101% NA
472 Morehead Elementary 526 47% YES 1 YES 0% 100% NA
478 Murphey Traditional Acad 339 79% YES 2 NO 0% 0% NA
481 Nathanael Greene Elem 362 38% YES 1 YES 0% 100% NA
486 Northern Guilford Elem 831 26% YES 1 YES 0% 90% NA
487 Northeast Guilford Middle 834 62% YES 3 YES NA NA 68%
488 Northern Guilford Middle 988 24% YES 2 YES NA NA 95%
491 Ep Pearce Elementary 727 16% YES 2 YES 0% 99% NA
493 Northwest Guilford Middle 975 12% YES 2 YES NA NA 46%
496 Northwood Elementary 532 91% YES 1 YES 0% 99% NA
499 Oak Hill Elementary 393 100% YES 2 YES 0% 85% NA
502 Oak Ridge Elementary 682 10% YES 1 YES 0% 100% NA
505 Oak View Elementary 488 81% YES 1 NO 0% 0% NA
511 Parkview Village Elem 379 100% YES 1 YES 0% 99% NA
514 Clara J Peck Elementary 358 100% NO 0 NO 0% 0% NA
517 Peeler Open Elementary 361 57% YES 1 YES 8% 44% NA
522 Pilot Elementary 823 41% YES 1 YES 0% 86% NA
523 Pleasant Garden Elem 524 43% YES 1 YES 0% 96% NA
530 Reedy Fork Elementary 513 61% YES 1 YES 7% 99% NA
532 Rankin Elementary 657 100% YES 2 NO 0% 0% NA
535 Sedalia Elementary 448 53% YES 1 YES 0% 99% NA
538 Sedgefield Elementary 450 100% YES 1 YES 0% 96% NA
541 Shadybrook Elementary 612 41% YES 1 YES 0% 79% NA
550 Southeast Guilford Middle 1011 37% YES 3 NO NA NA 0%
553 Southern Elementary 284 58% YES 2 YES 9% 98% NA
559 Southwest Elementary 825 24% YES 3 YES 0% 100% NA
565 Southwest Guilford Mid 1079 41% YES 5 YES NA NA 77%
568 Sternberger Elementary 382 19% YES 1 YES 0% 99% NA
571 Stokesdale Elementary 536 22% YES 2 YES 0% 67% NA
574 Summerfield Elementary 653 14% YES 2 YES 0% 99% NA
577 Sumner Elementary 579 91% YES 1 YES 0% 97% NA
578 Triangle Lake Montessori 411 65% YES 1 YES 0% 85% NA
580 Union Hill Elementary 446 98% YES 1 YES 0% 97% NA
583 Vandalia Elementary 262 98% YES 0 YES 0% 97% NA
586 Washington Montessori 251 100% YES 1 NO 0% 0% NA
592 Welborn Academy 517 81% YES 2 YES NA NA 99%
598 Wiley Elementary 225 100% YES 2 YES 0% 90% NA

2011 NC IsPOD Evaluation Conducted by NCAAHPERD/NC DPH
All rights reserved.
4
Guilford County
FitnessGramTM Response Rates
In fall 2010, 74 of the Guilford County K-8 schools, or 80%, conducted
FitnessGramTM assessments and submitted their data. Table 2 shows the
FitnessGramTM Response Rates by grade for all Guilford County K-8 schools
combined.
Table 2
FitnessGram™ Response Rates
For 74 K-8 Schools in Guilford County
Grade 2010-2011
Average Daily Membershipa.
FitnessGramTM Response Rate
Number of FitnessGramTM
Student Ids
Percent of ADM
1st 4932 76 2%
2nd 5423 116 2%
3rd 5458 4095 75%
4th 5534 4304 78%
5th 5625 4481 80%
6th 5483 2456 45%
7th 5437 2386 44%
8th 5428 2462 45%
Grades 1 - 8 43320 20376 47% a. Average Daily Membership (ADM) for first month of the 2010-2011 school year.
2011 NC IsPOD Evaluation Conducted by NCAAHPERD/NC DPH
All rights reserved.
5
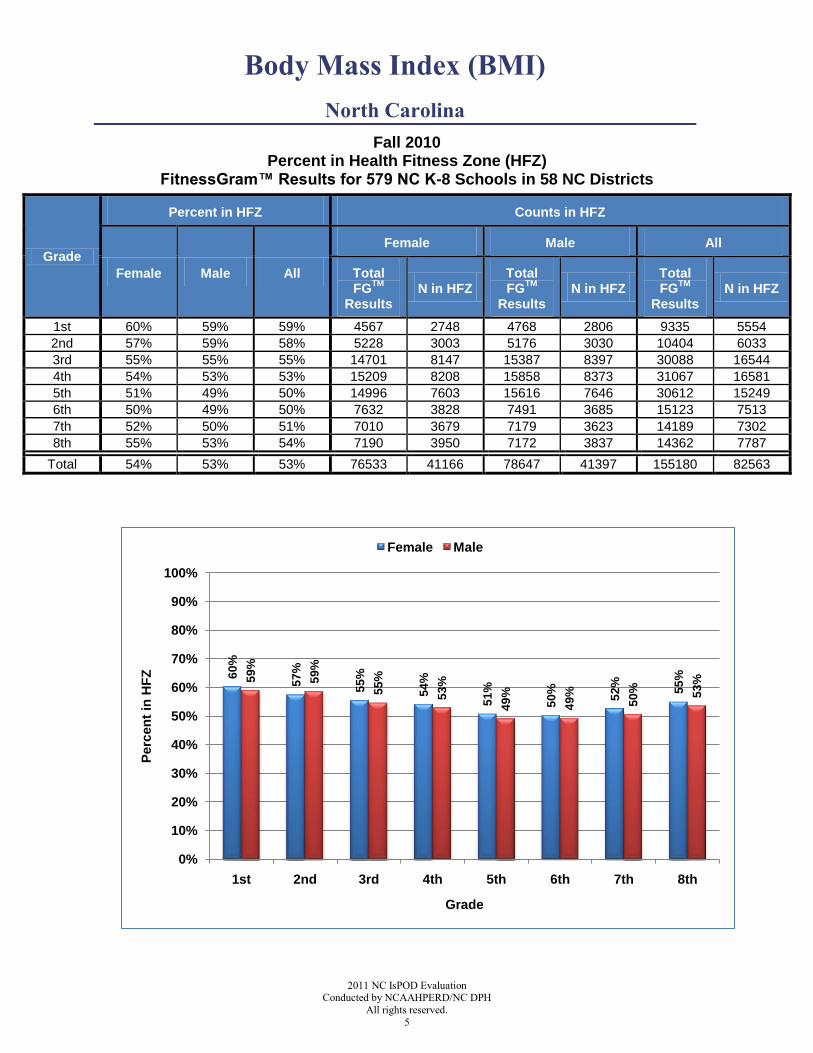
Body Mass Index (BMI)
North Carolina
Fall 2010 Percent in Health Fitness Zone (HFZ)
FitnessGram™ Results for 579 NC K-8 Schools in 58 NC Districts
Grade
Percent in HFZ Counts in HFZ
Female Male All
Female Male All
Total FG
TM
Results N in HFZ
Total FG
TM
Results N in HFZ
Total FG
TM
Results N in HFZ
1st 60% 59% 59% 4567 2748 4768 2806 9335 5554
2nd 57% 59% 58% 5228 3003 5176 3030 10404 6033
3rd 55% 55% 55% 14701 8147 15387 8397 30088 16544
4th 54% 53% 53% 15209 8208 15858 8373 31067 16581
5th 51% 49% 50% 14996 7603 15616 7646 30612 15249
6th 50% 49% 50% 7632 3828 7491 3685 15123 7513
7th 52% 50% 51% 7010 3679 7179 3623 14189 7302
8th 55% 53% 54% 7190 3950 7172 3837 14362 7787
Total 54% 53% 53% 76533 41166 78647 41397 155180 82563
60
%
57
%
55
%
54
%
51
%
50
%
52
%
55
%59
%
59
%
55
%
53
%
49
%
49
%
50
% 53
%
0%
10%
20%
30%
40%
50%
60%
70%
80%
90%
100%
1st 2nd 3rd 4th 5th 6th 7th 8th
Perc
en
t in
HF
Z
Grade
Female Male

2011 NC IsPOD Evaluation Conducted by NCAAHPERD/NC DPH
All rights reserved.
6
Body Mass Index (BMI)
Guilford County
Fall 2010 Percent in Healthy Fitness Zone (HFZ)
FitnessGram™ Results for 74 K-8 Schools in Guilford County
Grade
Percent in HFZ Counts in HFZ
Female Male All
Female Male All
Total FG
TM
Results N in HFZ
Total FG
TM
Results N in HFZ
Total FG
TM
Results N in HFZ
1st 41% 46% 43% 32 13 28 13 60 26
2nd 56% 65% 60% 43 24 37 24 80 48
3rd 56% 54% 55% 1771 995 1875 1018 3646 2013
4th 54% 54% 54% 1788 963 1897 1028 3685 1991
5th 50% 49% 50% 1867 942 1954 958 3821 1900
6th 50% 51% 50% 907 451 603 308 1510 759
7th 52% 52% 52% 816 426 534 280 1350 706
8th 55% 56% 55% 841 464 637 354 1478 818
Total 53% 53% 53% 8065 4278 7565 3983 15630 8261
41
%
56
%
56
%
54
%
50
%
50
%
52
% 55
%
46
%
65
%
54
%
54
%
49
%
51
%
52
% 56
%
0%
10%
20%
30%
40%
50%
60%
70%
80%
90%
100%
1st 2nd 3rd 4th 5th 6th 7th 8th
Perc
en
t in
HF
Z
Grade
Female Male

2011 NC IsPOD Evaluation Conducted by NCAAHPERD/NC DPH
All rights reserved.
7
PACER
North Carolina
Fall 2010 Percent in Health Fitness Zone (HFZ)
FitnessGram™ Results for 579 NC K-8 Schools in 58 NC Districts
Grade
Percent in HFZ Counts in HFZ
Female Male All
Female Male All
Total FG
TM
Results N in HFZ
Total FG
TM
Results N in HFZ
Total FG
TM
Results N in HFZ
4th 96% 45% 70% 8911 8523 9343 4217 18254 12740
5th 91% 53% 72% 9378 8564 9541 5015 18919 13579
6th 71% 50% 60% 4434 3153 4670 2332 9104 5485
7th 64% 41% 52% 4124 2648 4554 1870 8678 4518
8th 43% 37% 40% 4282 1841 4867 1791 9149 3632
Total 79% 46% 62% 31129 24729 32975 15225 64104 39954
96
%
91
%
71
%
64
%
43
%
45
%
53
%
50
%
41
%
37
%
0%
10%
20%
30%
40%
50%
60%
70%
80%
90%
100%
4th 5th 6th 7th 8th
Perc
en
t in
HF
Z
Grade
Female Male
2011 NC IsPOD Evaluation Conducted by NCAAHPERD/NC DPH
All rights reserved.
8
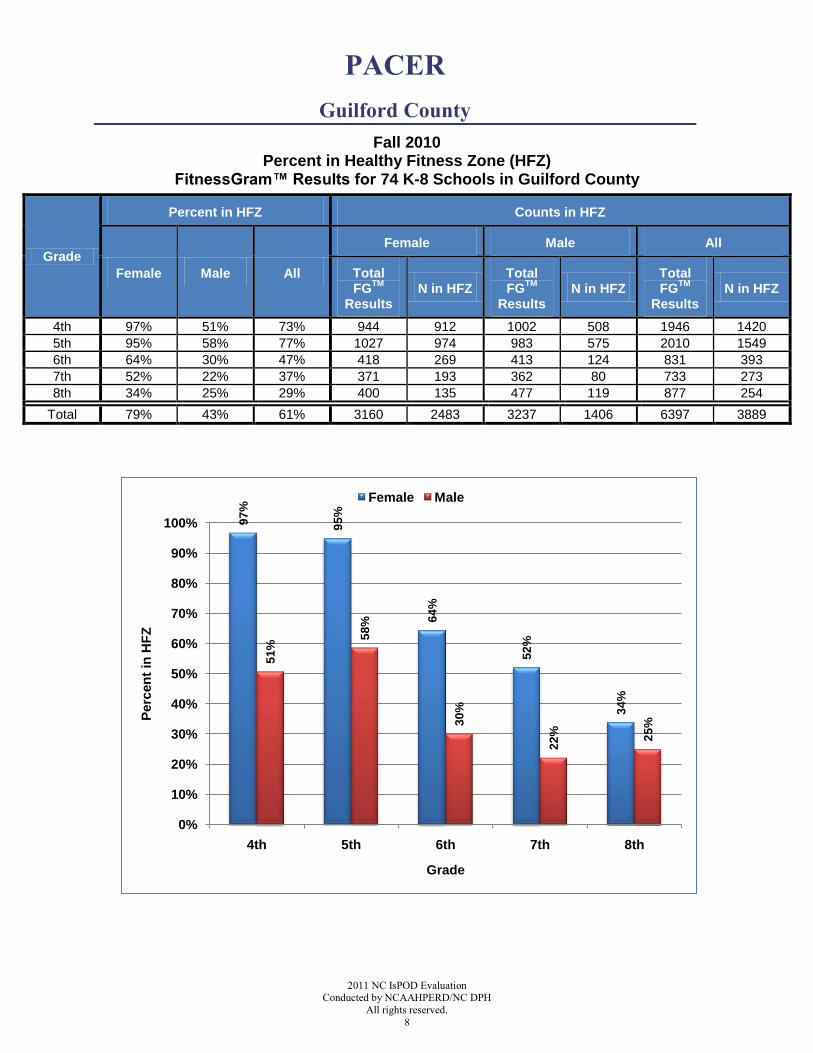
PACER
Guilford County
Fall 2010 Percent in Healthy Fitness Zone (HFZ)
FitnessGram™ Results for 74 K-8 Schools in Guilford County
Grade
Percent in HFZ Counts in HFZ
Female Male All
Female Male All
Total FG
TM
Results N in HFZ
Total FG
TM
Results N in HFZ
Total FG
TM
Results N in HFZ
4th 97% 51% 73% 944 912 1002 508 1946 1420
5th 95% 58% 77% 1027 974 983 575 2010 1549
6th 64% 30% 47% 418 269 413 124 831 393
7th 52% 22% 37% 371 193 362 80 733 273
8th 34% 25% 29% 400 135 477 119 877 254
Total 79% 43% 61% 3160 2483 3237 1406 6397 3889
97
%
95
%
64
%
52
%
34
%
51
%
58
%
30
%
22
% 25
%
0%
10%
20%
30%
40%
50%
60%
70%
80%
90%
100%
4th 5th 6th 7th 8th
Perc
en
t in
HF
Z
Grade
Female Male

2011 NC IsPOD Evaluation Conducted by NCAAHPERD/NC DPH
All rights reserved.
9
AEROBIC CAPACITY (VO2 MAX)
North Carolina
Fall 2010 Percent in Health Fitness Zone (HFZ)
FitnessGram™ Results for 579 NC K-8 Schools in 58 NC Districts
Grade
Percent in HFZ Counts in HFZ
Female Male All
Female Male All
Total FG
TM
Results N in HFZ
Total FG
TM
Results N in HFZ
Total FG
TM
Results N in HFZ
4th 75% 88% 82% 9312 6968 10261 9024 19573 15992
5th 68% 85% 77% 10121 6915 10886 9222 21007 16137
6th 60% 80% 70% 4261 2575 4407 3517 8668 6092
7th 58% 77% 68% 3914 2273 4417 3411 8331 5684
8th 57% 73% 65% 3859 2193 4371 3187 8230 5380
Total 66% 83% 75% 31467 20924 34342 28361 65809 49285
75
%
68
%
60
%
58
%
57
%
88
%
85
%
80
%
77
%
73
%
0%
10%
20%
30%
40%
50%
60%
70%
80%
90%
100%
4th 5th 6th 7th 8th
Perc
en
t in
HF
Z
Grade
Female Male
2011 NC IsPOD Evaluation Conducted by NCAAHPERD/NC DPH
All rights reserved.
10
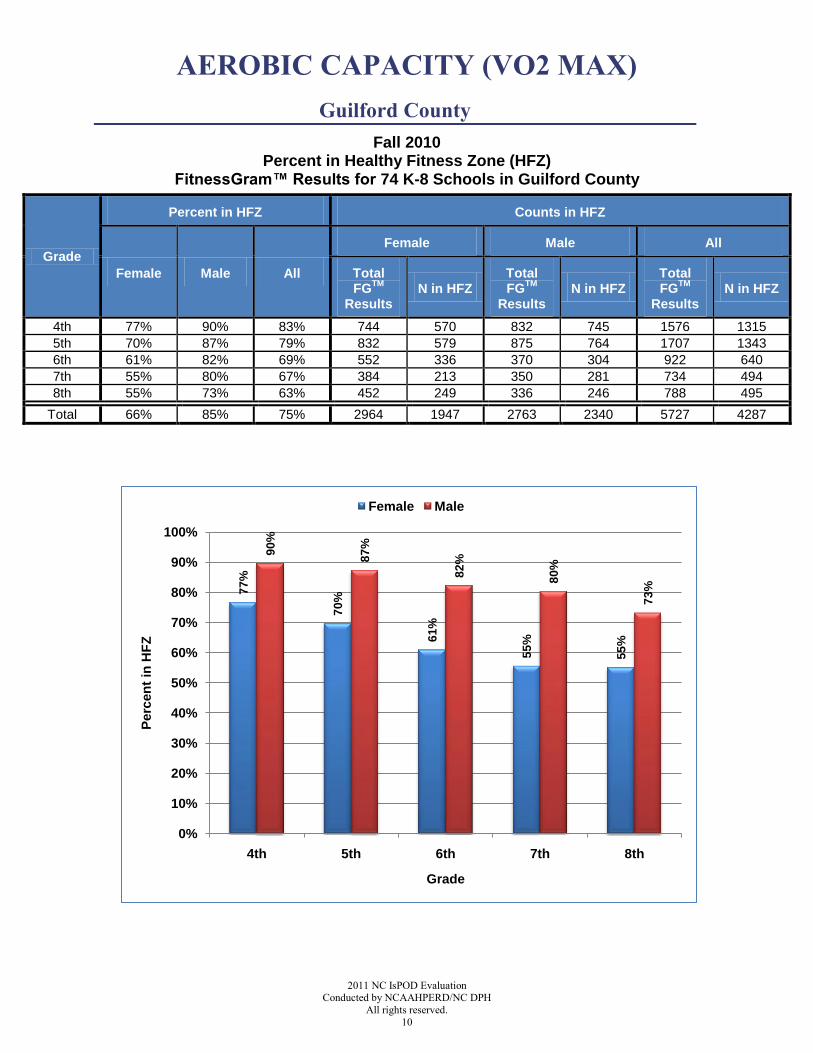
AEROBIC CAPACITY (VO2 MAX)
Guilford County
Fall 2010 Percent in Healthy Fitness Zone (HFZ)
FitnessGram™ Results for 74 K-8 Schools in Guilford County
Grade
Percent in HFZ Counts in HFZ
Female Male All
Female Male All
Total FG
TM
Results N in HFZ
Total FG
TM
Results N in HFZ
Total FG
TM
Results N in HFZ
4th 77% 90% 83% 744 570 832 745 1576 1315
5th 70% 87% 79% 832 579 875 764 1707 1343
6th 61% 82% 69% 552 336 370 304 922 640
7th 55% 80% 67% 384 213 350 281 734 494
8th 55% 73% 63% 452 249 336 246 788 495
Total 66% 85% 75% 2964 1947 2763 2340 5727 4287
77
%
70
%
61
%
55
%
55
%
90
%
87
%
82
%
80
%
73
%
0%
10%
20%
30%
40%
50%
60%
70%
80%
90%
100%
4th 5th 6th 7th 8th
Perc
en
t in
HF
Z
Grade
Female Male

2011 NC IsPOD Evaluation Conducted by NCAAHPERD/NC DPH
All rights reserved.
11
CURL-UP
North Carolina
Fall 2010 Percent in Health Fitness Zone (HFZ)
FitnessGram™ Results for 579 NC K-8 Schools in 58 NC Districts
Grade
Percent in HFZ Counts in HFZ
Female Male All
Female Male All
Total FG
TM
Results N in HFZ
Total FG
TM
Results N in HFZ
Total FG
TM
Results N in HFZ
1st 76% 73% 74% 965 734 1006 734 1971 1468
2nd 77% 79% 78% 1502 1160 1477 1169 2979 2329
3rd 79% 80% 80% 15470 12228 16202 12995 31672 25223
4th 78% 80% 79% 15960 12491 16569 13180 32529 25671
5th 75% 78% 77% 15984 12059 16466 12870 32450 24929
6th 79% 84% 82% 8812 6993 8813 7428 17625 14421
7th 79% 86% 82% 8043 6330 8273 7086 16316 13416
8th 81% 85% 83% 8252 6655 8247 6974 16499 13629
Total 78% 81% 80% 74988 58650 77053 62436 152041 121086
76
%
77
%
79
%
78
%
75
% 79
%
79
%
81
%
73
% 79
%
80
%
80
%
78
% 84
%
86
%
85
%
0%
10%
20%
30%
40%
50%
60%
70%
80%
90%
100%
1st 2nd 3rd 4th 5th 6th 7th 8th
Perc
en
t in
HF
Z
Grade
Female Male

2011 NC IsPOD Evaluation Conducted by NCAAHPERD/NC DPH
All rights reserved.
12
CURL-UP
Guilford County
Fall 2010 Percent in Healthy Fitness Zone (HFZ)
FitnessGram™ Results for 74 K-8 Schools in Guilford County
Grade
Percent in HFZ Counts in HFZ
Female Male All
Female Male All
Total FG
TM
Results N in HFZ
Total FG
TM
Results N in HFZ
Total FG
TM
Results N in HFZ
1st 98% 100% 99% 40 39 36 36 76 75
2nd 73% 87% 79% 62 45 46 40 108 85
3rd 78% 81% 80% 1911 1490 1993 1622 3904 3112
4th 79% 80% 80% 2014 1599 2127 1695 4141 3294
5th 76% 78% 77% 2116 1613 2144 1666 4260 3279
6th 78% 87% 82% 1215 951 1006 875 2221 1826
7th 73% 89% 80% 1132 832 886 789 2018 1621
8th 76% 83% 79% 1195 911 953 793 2148 1704
Total 77% 82% 79% 9685 7480 9191 7516 18876 14996
98
%
73
% 78
%
79
%
76
%
78
%
73
% 76
%
10
0%
87
%
81
%
80
%
78
%
87
%
89
%
83
%
0%
10%
20%
30%
40%
50%
60%
70%
80%
90%
100%
1st 2nd 3rd 4th 5th 6th 7th 8th
Perc
en
t in
HF
Z
Grade
Female Male
2011 NC IsPOD Evaluation Conducted by NCAAHPERD/NC DPH
All rights reserved.
13
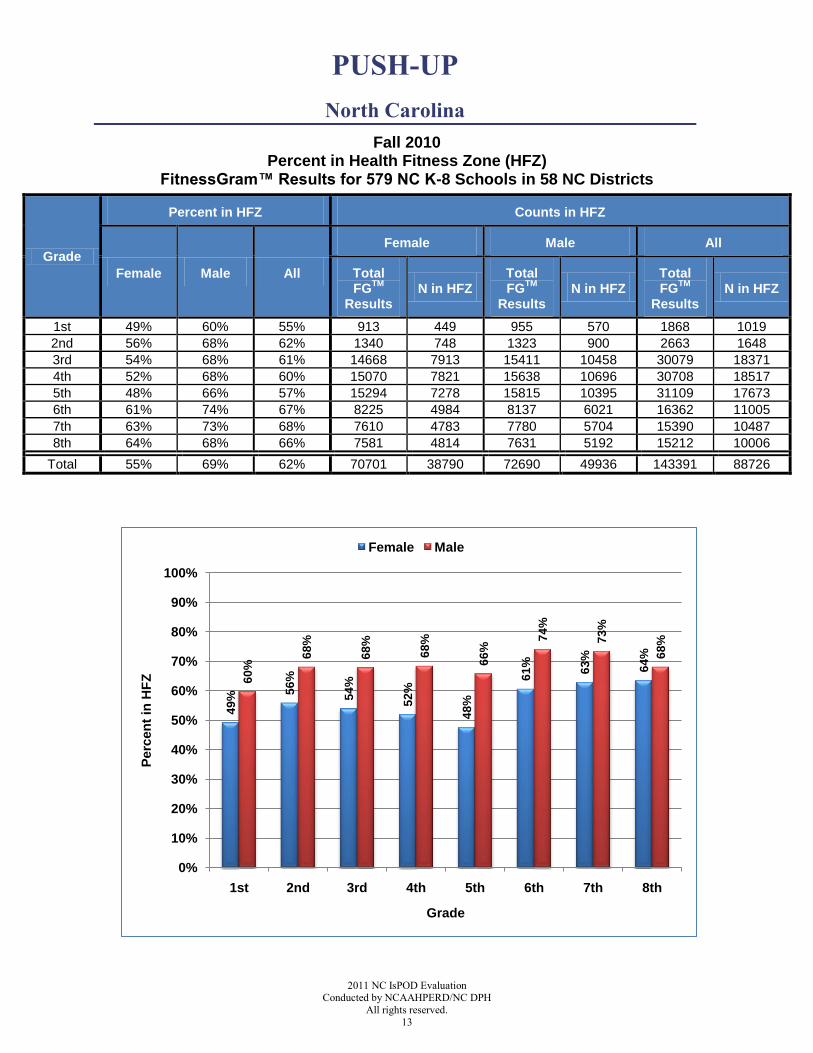
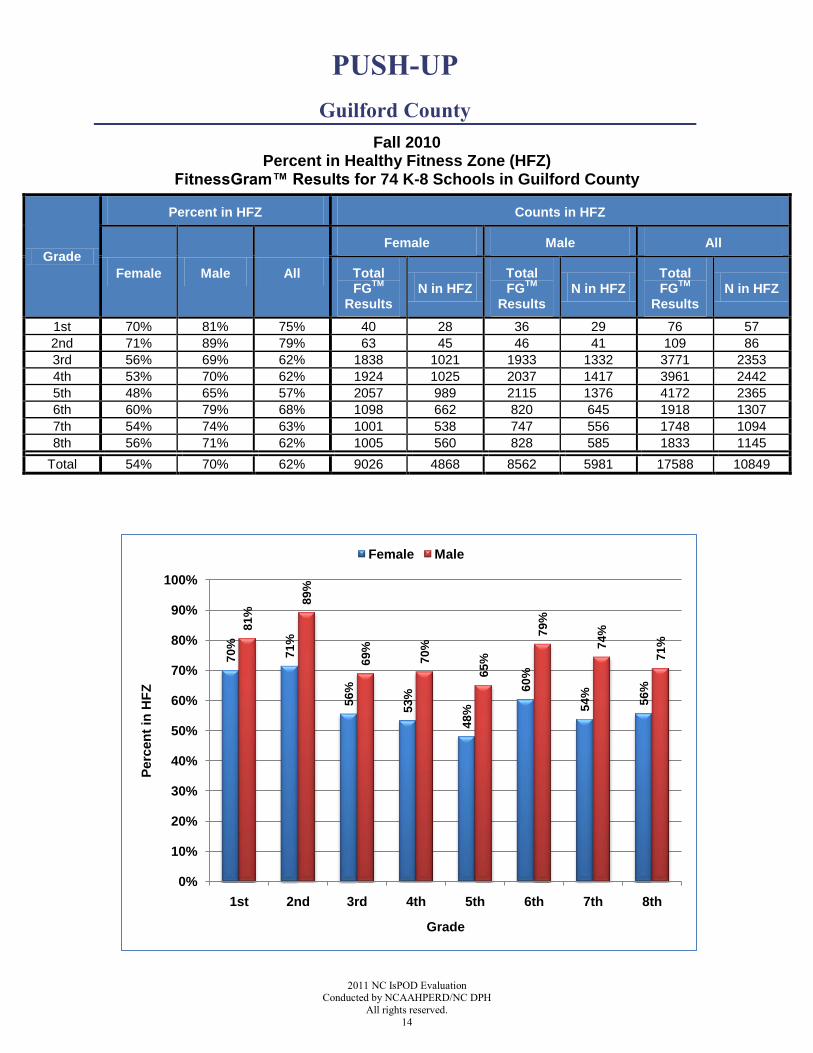
PUSH-UP
North Carolina
Fall 2010 Percent in Health Fitness Zone (HFZ)
FitnessGram™ Results for 579 NC K-8 Schools in 58 NC Districts
Grade
Percent in HFZ Counts in HFZ
Female Male All
Female Male All
Total FG
TM
Results N in HFZ
Total FG
TM
Results N in HFZ
Total FG
TM
Results N in HFZ
1st 49% 60% 55% 913 449 955 570 1868 1019
2nd 56% 68% 62% 1340 748 1323 900 2663 1648
3rd 54% 68% 61% 14668 7913 15411 10458 30079 18371
4th 52% 68% 60% 15070 7821 15638 10696 30708 18517
5th 48% 66% 57% 15294 7278 15815 10395 31109 17673
6th 61% 74% 67% 8225 4984 8137 6021 16362 11005
7th 63% 73% 68% 7610 4783 7780 5704 15390 10487
8th 64% 68% 66% 7581 4814 7631 5192 15212 10006
Total 55% 69% 62% 70701 38790 72690 49936 143391 88726
49
%
56
%
54
%
52
%
48
%
61
%
63
%
64
%
60
%
68
%
68
%
68
%
66
%
74
%
73
%
68
%
0%
10%
20%
30%
40%
50%
60%
70%
80%
90%
100%
1st 2nd 3rd 4th 5th 6th 7th 8th
Perc
en
t in
HF
Z
Grade
Female Male
2011 NC IsPOD Evaluation Conducted by NCAAHPERD/NC DPH
All rights reserved.
14
PUSH-UP
Guilford County
Fall 2010 Percent in Healthy Fitness Zone (HFZ)
FitnessGram™ Results for 74 K-8 Schools in Guilford County
Grade
Percent in HFZ Counts in HFZ
Female Male All
Female Male All
Total FG
TM
Results N in HFZ
Total FG
TM
Results N in HFZ
Total FG
TM
Results N in HFZ
1st 70% 81% 75% 40 28 36 29 76 57
2nd 71% 89% 79% 63 45 46 41 109 86
3rd 56% 69% 62% 1838 1021 1933 1332 3771 2353
4th 53% 70% 62% 1924 1025 2037 1417 3961 2442
5th 48% 65% 57% 2057 989 2115 1376 4172 2365
6th 60% 79% 68% 1098 662 820 645 1918 1307
7th 54% 74% 63% 1001 538 747 556 1748 1094
8th 56% 71% 62% 1005 560 828 585 1833 1145
Total 54% 70% 62% 9026 4868 8562 5981 17588 10849
70
%
71
%
56
%
53
%
48
%
60
%
54
%
56
%
81
%
89
%
69
%
70
%
65
%
79
%
74
%
71
%
0%
10%
20%
30%
40%
50%
60%
70%
80%
90%
100%
1st 2nd 3rd 4th 5th 6th 7th 8th
Perc
en
t in
HF
Z
Grade
Female Male

2011 NC IsPOD Evaluation Conducted by NCAAHPERD/NC DPH
All rights reserved.
15
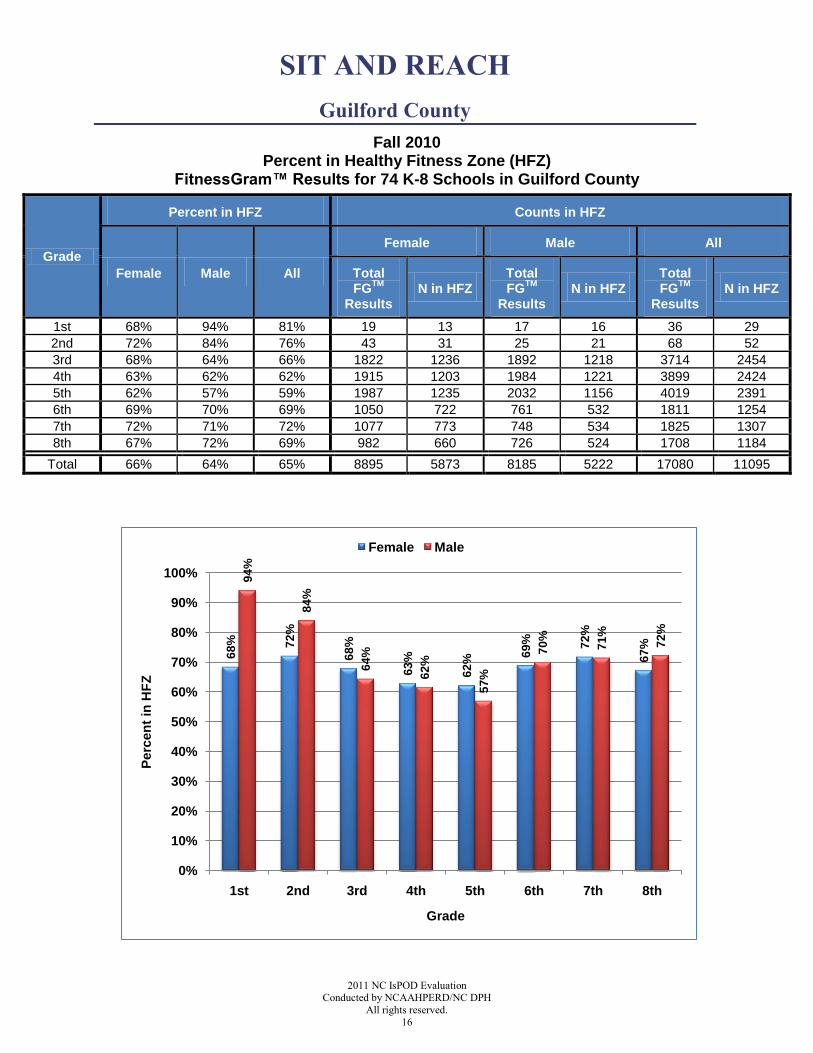
SIT AND REACH
North Carolina
Fall 2010 Percent in Health Fitness Zone (HFZ)
FitnessGram™ Results for 579 NC K-8 Schools in 58 NC Districts
Grade
Percent in HFZ Counts in HFZ
Female Male All
Female Male All
Total FG
TM
Results N in HFZ
Total FG
TM
Results N in HFZ
Total FG
TM
Results N in HFZ
1st 76% 75% 76% 739 565 792 597 1531 1162
2nd 71% 73% 72% 1198 854 1147 834 2345 1688
3rd 65% 65% 65% 13580 8848 14245 9265 27825 18113
4th 64% 61% 62% 14008 8914 14557 8894 28565 17808
5th 63% 61% 62% 14016 8778 14390 8720 28406 17498
6th 58% 60% 59% 7432 4329 7376 4446 14808 8775
7th 62% 58% 60% 6849 4233 6971 4076 13820 8309
8th 66% 61% 63% 6769 4466 6950 4243 13719 8709
Total 63% 62% 63% 64591 40987 66428 41075 131019 82062
76
%
71
%
65
%
64
%
63
%
58
% 62
% 66
%
75
%
73
%
65
%
61
%
61
%
60
%
58
%
61
%
0%
10%
20%
30%
40%
50%
60%
70%
80%
90%
100%
1st 2nd 3rd 4th 5th 6th 7th 8th
Perc
en
t in
HF
Z
Grade
Female Male
2011 NC IsPOD Evaluation Conducted by NCAAHPERD/NC DPH
All rights reserved.
16
SIT AND REACH
Guilford County
Fall 2010 Percent in Healthy Fitness Zone (HFZ)
FitnessGram™ Results for 74 K-8 Schools in Guilford County
Grade
Percent in HFZ Counts in HFZ
Female Male All
Female Male All
Total FG
TM
Results N in HFZ
Total FG
TM
Results N in HFZ
Total FG
TM
Results N in HFZ
1st 68% 94% 81% 19 13 17 16 36 29
2nd 72% 84% 76% 43 31 25 21 68 52
3rd 68% 64% 66% 1822 1236 1892 1218 3714 2454
4th 63% 62% 62% 1915 1203 1984 1221 3899 2424
5th 62% 57% 59% 1987 1235 2032 1156 4019 2391
6th 69% 70% 69% 1050 722 761 532 1811 1254
7th 72% 71% 72% 1077 773 748 534 1825 1307
8th 67% 72% 69% 982 660 726 524 1708 1184
Total 66% 64% 65% 8895 5873 8185 5222 17080 11095
68
% 72
%
68
%
63
%
62
%
69
% 72
%
67
%
94
%
84
%
64
%
62
%
57
%
70
%
71
%
72
%
0%
10%
20%
30%
40%
50%
60%
70%
80%
90%
100%
1st 2nd 3rd 4th 5th 6th 7th 8th
Perc
en
t in
HF
Z
Grade
Female Male

2011 NC IsPOD Evaluation Conducted by NCAAHPERD/NC DPH
All rights reserved.
17
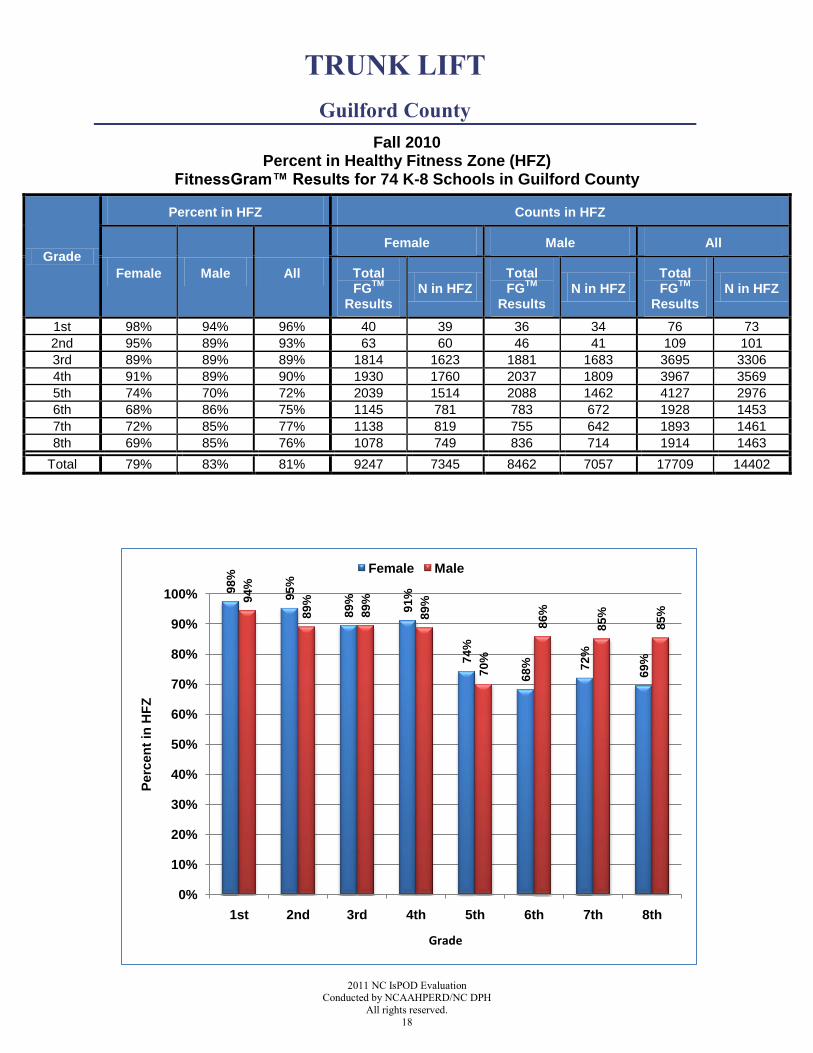
TRUNK LIFT
North Carolina
Fall 2010 Percent in Health Fitness Zone (HFZ)
FitnessGram™ Results for 579 NC K-8 Schools in 58 NC Districts
Grade
Percent in HFZ Counts in HFZ
Female Male All
Female Male All
Total FG
TM
Results N in HFZ
Total FG
TM
Results N in HFZ
Total FG
TM
Results N in HFZ
1st 84% 79% 82% 950 799 960 761 1910 1560
2nd 85% 83% 84% 1398 1184 1349 1113 2747 2297
3rd 88% 87% 87% 14810 13027 15557 13474 30367 26501
4th 89% 86% 87% 15237 13546 15857 13572 31094 27118
5th 74% 70% 72% 15609 11565 16015 11169 31624 22734
6th 80% 78% 79% 8282 6608 8178 6411 16460 13019
7th 79% 79% 79% 7715 6111 7764 6111 15479 12222
8th 81% 79% 80% 7663 6232 7805 6187 15468 12419
Total 82% 80% 81% 71664 59072 73485 58798 145149 117870
84
%
85
% 88
%
89
%
74
% 80
%
79
%
81
%
79
% 83
% 87
%
86
%
70
%
78
%
79
%
79
%
0%
10%
20%
30%
40%
50%
60%
70%
80%
90%
100%
1st 2nd 3rd 4th 5th 6th 7th 8th
Perc
en
t in
HF
Z
Grade
Female Male
2011 NC IsPOD Evaluation Conducted by NCAAHPERD/NC DPH
All rights reserved.
18
TRUNK LIFT
Guilford County
Fall 2010 Percent in Healthy Fitness Zone (HFZ)
FitnessGram™ Results for 74 K-8 Schools in Guilford County
Grade
Percent in HFZ Counts in HFZ
Female Male All
Female Male All
Total FG
TM
Results N in HFZ
Total FG
TM
Results N in HFZ
Total FG
TM
Results N in HFZ
1st 98% 94% 96% 40 39 36 34 76 73
2nd 95% 89% 93% 63 60 46 41 109 101
3rd 89% 89% 89% 1814 1623 1881 1683 3695 3306
4th 91% 89% 90% 1930 1760 2037 1809 3967 3569
5th 74% 70% 72% 2039 1514 2088 1462 4127 2976
6th 68% 86% 75% 1145 781 783 672 1928 1453
7th 72% 85% 77% 1138 819 755 642 1893 1461
8th 69% 85% 76% 1078 749 836 714 1914 1463
Total 79% 83% 81% 9247 7345 8462 7057 17709 14402
98
%
95
%
89
%
91
%
74
%
68
% 72
%
69
%
94
%
89
%
89
%
89
%
70
%
86
%
85
%
85
%
0%
10%
20%
30%
40%
50%
60%
70%
80%
90%
100%
1st 2nd 3rd 4th 5th 6th 7th 8th
Perc
en
t in
HF
Z
Grade
Female Male