Islamic Republic of Afghanistan Ministry of Public Health...
57
ANNUAL REPORT 2012 Islamic Republic of Afghanistan Ministry of Public Health Afghanistan National Public Health Institute Surveillance Directorate
-
Upload
trinhtuong -
Category
Documents
-
view
222 -
download
4
Transcript of Islamic Republic of Afghanistan Ministry of Public Health...
ANNUAL REPORT 2012
1
ANNUAL REPORT 2012
Islamic Republic of Afghanistan
Ministry of Public Health
Afghanistan National Public Health
Institute
Surveillance Directorate

ANNUAL REPORT 2012
2
Acknowledgment
Communicable diseases pose a significant and growing threat on human health at the
local, national, and international level. Local or widespread outbreaks of communicable diseases
are largely unpredictable with great public health, social and economic consequences and impact
on nations. They must be recognized and controlled rapidly in order to minimize their impact.
Public health policies, strategies, and interventions to reduce any impact of these outbreaks rely
heavily on prompting timely individual, community, institutional actions, including early
detection and response to these events.
A failure or inability to detect and response to communicable and vaccine preventable
disease outbreaks on timely bases will lead to higher level of mortality and morbidity. The
Disease Early Warning System (DEWS), an unique entity of public health surveillance on
priority communicable and vaccine preventable disease within MOPH , has attained tremendous
gain in this area; it detects and responses to several disease outbreaks in all over the country on
timely bases. In addition, the system provides weekly and annual surveillance data to all
stakeholders. This annual report is part of surveillance data dissemination at the national level.
We are especially grateful to the surveillance field staff and other DEWS personnel for
their courage and determination in fieldwork and ensuring the early detection and response to
mentioned events. It is our hope that this report will be useful for results-oriented decision-
making, and inform us to control and prevent the communicable and vaccine preventable
disease. Given that the public health challenges particularly on the communicable disease and
new emerging infection are increasing, it is our sincere hope that the system plays a proactive
role to prevent the spread of mentioned health problems at the local, national and international
levels.
Suraya Dalil MD, MPH
Minister of Public Health
Afghanista

ANNUAL REPORT 2012
II
Acknowledgment
On behalf of the Afghan National Public Health Institute (ANPHI), I would like to express
my gratitude to Surveillance Directorate and DEWS team at Ministry of Public Health for their
contribution to this report and to DEWS regional officers who enriched this report by their in-
valuable and helpful comments.
DEWS focal points working in the sentinel sites countrywide and colleagues from Central
Public Health Laboratory are acknowledged for providing of disease and laboratory results on
time that serve the best for this report. We would like to thank all health professionals and
stakeholders at central and provincial levels that helped as a team in timely detection,
investigation and response of outbreak.
Finally, the Communicable Disease Surveillance and Response (CSR) unit of World Health
Organization Afghanistan (WHO) Country-Office is gratefully acknowledged for their
technical supports provided in development and publication for this document and we would like
to thank all donors, particularly USAID for financial support of Disease Early Warning System
(DEWS) in Afghanistan.
With Best Regards,
Dr. Bashir Noormal MD, MPH
Director General, Afghan National Public Health Institute
Ministry of Public Health, Afghanistan

ANNUAL REPORT 2012
III
Contents
1. INTRODUCTION ................................................................................................................................ 1
1.1. DISEASES OF OUTBREAK-POTENTIAL IN AFGHANISTAN ............................................................................... 2
1.2. ABOUT THIS REPORT .................................................................................................................................... 2
1.3. VISION ......................................................................................................................................................... 3
1.4. MISSION ........................................................................................................................................................ 3
1.5. GOAL........................................................................................................................................................... 3
1.6. GUIDING PRINCIPLES ............................................................................................................................ 3
1.7. OBJECTIVES............................................................................................................................................. 3
1.8. SURVEILLANCE METHODS ........................................................................................................................... 4
SENTINEL SITES .............................................................................................................................................................. 4
1.9. EXPANSION AND SELECTION OF SENTINEL SITES ..................................................................................................... 5
1.10. STRENGTHS AND WEAKNESSES OF SENTINEL SITE SURVEILLANCE ............................................................... 6
1.11. DISEASES UNDER SURVEILLANCE ................................................................................................................ 7
1.12. HOW DEWS WORK ..................................................................................................................................... 8
1.13. INFORMATION FLOW .................................................................................................................................... 9
2. MORBIDITY AND MORTALITY .............................................................................................................. 11
1.2. COUGH AND COLD............................................................................................................................................. 13
2.1. PNEUMONIA .............................................................................................................................................. 14
2.2. ACUTE WATERY DIARRHEA (AWD) ......................................................................................................... 15
2.3. ACUTE WATERY DIARRHEA (AWD) WITH DEHYDRATION ....................................................................... 16
2.4. ACUTE BLOODY DIARRHEA ...................................................................................................................... 18
2.5. MALARIA .................................................................................................................................................. 19
2.6. TYPHOID FEVER ........................................................................................................................................ 20
2.7. MENINGITIS/SEVERE ILL CHILD ................................................................................................................ 22
2.8. MEASLES ................................................................................................................................................... 23
2.9. ACUTE VIRAL HEPATITIS .......................................................................................................................... 24
2.10. PERTUSSIS ................................................................................................................................................. 25
2.11. DIPHTHERIA .............................................................................................................................................. 26
2.12. TETANUS/ NEONATAL TETANUS ............................................................................................................... 26
2.13. HEMORRHAGIC FEVER .............................................................................................................................. 28
3. OUTBREAK DETECTION, VERIFICATION, INVESTIGATION AND RESPONSE ......................................... 29
3.1. OUTBREAKS IN 2012 ................................................................................................................................. 29
3.2. MEASLES OUTBREAK ................................................................................................................................. 32
3.3. CCHF OUTBREAKS ................................................................................................................................... 32
3.4. PERTUSSIS OUTBREAK ............................................................................................................................... 33
3.5. SCABIES .................................................................................................................................................... 34
3.6. FOOD POISONING OUTBREAKS .................................................................................................................. 34
4. LABORATORY REPORT ......................................................................................................................... 35
5. DAILY EMERGENCY REPORT ................................................................................................................ 36
6. CAPACITY BUILDING- HEALTH SYSTEM STRENGTHENING .................................................................. 36

ANNUAL REPORT 2012
IV
6.1. INTERNATIONAL TRAININGS...................................................................................................................... 37
6.2. NATIONAL LEVEL TRAININGS .................................................................................................................... 37
6.3. TOOLS, GUIDELINES AND SOPS ................................................................................................................ 37
7. DEWS INDICATORS .............................................................................................................................. 38
ANNEXES ....................................................................................................................................................... 40
ANNEX1: WEEKLY REPORT FORMAT AND CASE DEFINITIONS ...................................................................... 40
ANNEX-2: SUPPLEMENTARY DATA ............................................................................................................... 43
Table 1: Number of sentinel sites by region and type of health facility, end December 2012 ....... 5
Table 2: DEWS targeted diseases and conditions for surveillance ................................................. 7
Table 3: Reported DEWS targeted diseases at national level by age ........................................... 11
Table 4: Cough and cold cases by region ..................................................................................... 13
Table 5: Pneumonia cases by region ............................................................................................. 14
Table 6: cases of AWD by region ................................................................................................. 15
Table 7: AWD with dehydration cases by region ......................................................................... 17
Table 8: Acute bloody diarrhea by region .................................................................................... 18
Table 9: Suspected malaria cases by region ................................................................................. 19
Table 10: Typhoid fever by region ............................................................................................... 21
Table 11: Suspected Meningitis/SIC cases by region, 2012 ......................................................... 22
Table 12: Suspected measles cases by region ............................................................................... 23
Table 13: Suspected acute viral hepatitis cases by region ............................................................ 24
Table 14: Provinces with reported number of suspected pertussis cases...................................... 25
Table 15: Distribution of the probable diphtheria cases by province ........................................... 26
Table 16: Number of Tetanus/ Neonatal Tetanus cases by districts ............................................. 27
Table 17: Number of suspected hemorrhagic fever cases by region ............................................ 28
Table 18: Outbreaks and associated cases by region .................................................................... 30
Table 19: Reported outbreaks by disease...................................................................................... 31
Table 20: Number of measles outbreaks by region ...................................................................... 32
Table 21: Number of CCHF Outbreaks by Region ...................................................................... 33
Table 22: Number of pertussis outbreaks by region ..................................................................... 33
Table 23: Number of Scabies outbreaks and associated cases by region ..................................... 34
Table 24: No. of Food Poisoning outbreaks and associated cases by region ............................... 35
Table 25: Number of investigated and positive specimens by region and disease ....................... 35
Table 26: shows the reported No. of injuries and deaths due to various unpleasant events in 2012.
....................................................................................................................................................... 36
Table 27: DEWS achievements based on the indicators .............................................................. 38
Table 28: Cough and Cold/Pneumonia cases by province............................................................ 43
Table 29: Acute Watery Diarrhea/ AWDWD cases by province ................................................. 44
Table 30: Acute Bloody Diarrhea/Malaria cases by province ...................................................... 45
Table 31: Suspected Meningitis/Severely Ill Child and Measles cases by province, 2012 .......... 46

ANNUAL REPORT 2012
V
Table 32: Provinces with the number of reported Hemorrhagic fever cases ................................ 47
Table 33: Number of outbreaks/ percentage by province ............................................................. 48
Table 34: Number of measles outbreaks by province .................................................................. 49
Table 35: Number of pertussis outbreaks and its Associated Cases by province ........................ 50
Table 36: Emergency Cases reported daily from all provinces through RadioCodan .................. 51
Figure 1: Distribution of sentinel sites in the country..................................................................... 6
Figure 2: Flow of DEWS reports and feedbacks ............................................................................ 9
Figure 3: Top ten DEWS targeted diseases .................................................................................. 12
Figure 4: Seasonal distribution of cough and cold cases, 2008-2012 ........................................... 14
Figure 5: Trend of pneumonia cases and deaths by month ........................................................... 15
Figure 6: Seasonal trend of AWD cases, by month ...................................................................... 16
Figure 7: Seasonal trend of AWD with dehydration cases by month ........................................... 17
Figure 8: Seasonal trend of acute bloody diarrhea by month ....................................................... 18
Figure 9: Percentage of malaria cases out of total consultations by year, 2008-2012 .................. 20
Figure 10: Malaria trend by month ............................................................................................... 20
Figure 11: Suspected Typhoid fever by year, 2008-2012 ............................................................. 21
Figure 12: Seasonal trend of typhoid fever cases by month, 2008- 2012 ..................................... 22
Figure 13: Seasonal distribution of measles cases ........................................................................ 24
Figure 14: Seasonal distribution of suspected pertussis cases ...................................................... 26
Figure 15: Seasonal trend of tetanus/neonatal tetanus cases, by month ....................................... 27
Figure 16: Number of reported hemorrhagic cases, by month ..................................................... 28
Figure 17: Outbreaks by month .................................................................................................... 30
Figure 18: Pertussis outbreaks by month ...................................................................................... 34

ANNUAL REPORT 2012
1
1. Introduction
Afghanistan National Public Health Institute (ANPHI) is a key General Directorate of Ministry
of Public Health (MoPH) consisting of five departments; Surveillance, Health Promotion,
Research, Public Health Training and Central Public Health Laboratories. Surveillance
Directorate is critical department of ANPHI which is mostly involved in routine reporting of
priority diseases and outbreak investigation and response. In Afghanistan, Disease Early
Warning System (DEWS)1 was first established in mid-December 2006, with technical support
of World Health Organization (WHO) and financial support of the United States Agency for
International Development (USAID) as a project under Surveillance Directorate. DEWS is a
sentinel site based surveillance system for weekly reporting of infectious diseases morbidity and
mortality operating in public and private health facilities (so far major private hospitals included)
while with daily reporting system for unusual events and suspected outbreaks reported by
community and Provincial Public Health Directorates (PPHDs) through Codan Radios system
and surveillance focal points of the area. In areas where there is no focal point so far community
report the disease spread and unusual events through, Provincial Council, PPHDs, governors,
parliamentarians and media. Since 2007 sentinel sites expanded from 8 provinces, in 8 regions to
all 34 provinces. In 2012, there were 330 sentinel sites operating in regional, provincial and
district hospitals and in basic and comprehensive health facilities in 34 provinces of the country
and covered 80% of the districts nationwide. The function of this sentinel surveillance system is
to detect not only known targeted diseases with established case definitions but also diseases,
events or hazards that are not specifically included in the formal reporting system. Data on more
than 28 outbreak potential diseases and unexplained events and deaths are also collected with
taking appropriate and on time prevention and control measures.
1 Disease Early Warning System (DEWS) is surveillance and response system for communicable diseases and other
health events having a combined approach of indicator and event based surveillance and outbreak detection and response in Afghanistan.

ANNUAL REPORT 2012
2
1.1. Diseases of outbreak-potential in Afghanistan
According to the DEWS six years data from 2007 to 2012, outbreaks of infectious diseases such
as Measles, Cholera, Acute gastroenteritis, ARIs, Pertussis, Chicken pox, Hepatitis, Typhoid
fever and Malaria are more frequent in Afghanistan. Outbreaks of Meningitis, Crimean-Congo
hemorrhagic fever, Mumps, Scabies, Pandemic Influenza H1N1, Leishmaniasis, Brucellosis, Q-
fever and Food poisoning are reported less frequently. It is evident that most of these outbreaks
are preventable with simple strategies and inexpensive available vaccines. But, poor access and
low utilization of services due to insecurity, repeated population displacement and lack of
sufficient resources outbreak of said diseases are still common in Afghanistan.
1.2. About this report
This report contains the official statistics in textual, tabular and graphic form, for the reported
cases and deaths due to targeted priority diseases (mainly infectious) and outbreaks in
Afghanistan for 2012. Unless otherwise noted, the data included in this report are from January
1, to December 31, 2012.Data collected for 2008, 2009, 2010, and 2011 have been compared
with 2012 in some instances .Information for this report are collected and compiled from weekly
morbidity & mortality reports from 330 sentinel sites and outbreaks reports sent by provincial
and regional DEWS surveillance offices to the national surveillance directorate. DEWS Regional
Coordinators (DEWS-RCs) receive reports from DEWS Provincial Offices (DEWS-POs) and
DEWS-POs receive reports from DEWS Focal Points deployed in the sentinel site1. Information
from RH/PH collected on daily basis by the department of Codan Radio and other sources of
MoPH on emergency events (bomb explosions, road traffic accidents, burns, natural disasters,
etc.) is also included as a part in this report. This report will provide an overview of the situation
of priority diseases under surveillance in Afghanistan. The report will help and enable
epidemiologists, public health experts and policymakers to make better evidence-based decisions
to improve prevention and control programs.
1 Sentinel site for DEWS surveillance is based in Health Facilities in Afghanistan including Regional Hospitals,
Provincial Hospitals, District hospitals, Polyclinics, CHCs and BHCs

ANNUAL REPORT 2012
3
1.3. Vision
Responsive and sustainable Public Health Surveillance System in Afghanistan that provides
timely and reliable information for program managers and policy makers to make informed
decisions for control and prevention of health related problems ensuring healthy society at
national land global level.
1.4. Mission
Surveillance directorate is committed, systematically and continuingly, to collect, analyze,
interpret, integrate and disseminate well-timed information to relevant stakeholders for control
and prevention of diseases. It is also mandated to detect, verify, investigate, respond immediately
and notify outbreaks of health events all over the country.
1.5. Goal
The main goal of Public Health Surveillance System is to contribute to the reduction of the
morbidity, mortality and disability due to various health related problems in Afghanistan.
1.6. GUIDING PRINCIPLES
• Evidence-based decision making
• Participation and partnership
• Quality
• Accountability and Transparency
• Responsiveness
• Simplicity
• Sustainability
• Timeliness
1.7. OBJECTIVES
• To monitor the distribution and seasonal trend of diseases
• To assess public health status and define public health priorities

ANNUAL REPORT 2012
4
• To identify and rapidly respond to outbreaks and emerging events within 24-48 hours of
occurrence
• To identify demographic and geographic populations at high risk
• To assist in developing evidence-based policy and allocate resources appropriately
• To notify World Health Organization regarding Public Health Emergency of International
Concern (PHEIC)
• To evaluate health programs and stimulate researches
• To provide opportunity for capacity building of health workers
1.8. Surveillance methods
Sentinel sites
DEWS is a sentinel site surveillance system operating mainly in public health facilities
countrywide. Initially regional/provincial hospitals in eight different geographical regions of the
country were selected by DEWS team as sentinel sites in December 2006. By the end of 2010,
there were 245 sentinel sites and in 2011 DEWS expanded to 283sites and during 2012DEWS
establishing 47new sentinel sites and the number of sentinel sites reached 330 by December 31,
2012. These sentinel sites are operating in public regional, provincial and district hospitals,
private hospitals, comprehensive and basic health centers and poly clinics in all 34 provinces and
covered 80% of all districts and 18.5% of health facilities in Afghanistan. The distribution of the
sentinel sites by region, province and type of health facility are shown in Table 1 and Figure 1.

ANNUAL REPORT 2012
5
1.9. Expansion and Selection of Sentinel Sites
In 2012, the national target for the number of sentinel sites was 50 new sentinel sites or 18%
increase from the 2011, whereas 47 new sentinel sites have been established in 2012. The
selection of these sites are based on the geographic location, burden of communicable diseases in
the area, history of past outbreaks, availability of communication systems (internet/mobile
phones) and population density. However, the selection is done after the Provincial Health
Coordination Committee (PHCC) approval in the provinces.
Table 1: Number of sentinel sites by region and type of health facility, end December 2012
Type of H.F1
Region
RH/PH DH CHC/BHC Polyclinic Total
Central East 14 12 27 2 55
North 5 10 34 0 49
North East 4 7 32 0 43
South 5 4 32 0 41
East 3 7 31 0 41
West 4 9 23 1 37
South East 4 4 26 0 34
Central West 4 9 17 0 30
Total 43 60 224 3 330
1 RH: Regional hospital
PH: provincial hospital DH: District hospital CHC: Comprehensive Health Center BHC: Basic Health Center

ANNUAL REPORT 2012
6
Figure 1: Distribution of sentinel sites in the country
1.10. Strengths and weaknesses of sentinel site surveillance
The current surveillance system generates evidence for policy and planning in terms of
prevention and control of communicable diseases and conditions under surveillance. Since
routine surveillance alone is not effective for early detection of disease outbreaks hence early
warning component has been strengthened to detect outbreak alerts and respond to that. It is
evident that incidence rate is ideally used for comparing disease frequency in different locations,
at different times, or among different groups of persons with potentially different sized
populations. But the true estimates of the incidence require further information than can be
supplied by the sentinel surveillance system. To adjust for denominators DEWS surveillance
system considers total consultations as denominator for calculations of rates and percentages. It
is important to remember that this sentinel surveillance results are representative and
generalizable for the population who have access to public health facilities while private sector

ANNUAL REPORT 2012
7
and community representation will be enhanced in coming years through inclusion into
surveillance system.
1.11. Diseases under surveillance
Currently DEWS collect weekly morbidity and mortality data by age and sex disaggregation
from sentinel sites on fifteen agreed upon priority diseases and pregnancy related deaths in a
standardized format (Annex 2).These diseases/conditions are recommended for surveillance
because they are;
Main causes of morbidity and mortality in Afghanistan
Diseases with highly epidemic potential to cause serious public health impact due to their
ability to spread rapidly
Ministry of Public Health -Afghanistan priority diseases
Diseases of internationally public health importance
Diseases that can be prevented by public health measures
The list of priority diseases may vary from time to time depending on the epidemiological
situation of diseases, health system needs and capacity. Public health officials at MoPH and
WHO - Afghanistan collaborate in determining which diseases should be added or deleted from
the priority list for DEWS.
Table 2 below shows the list of priority diseases and conditions under surveillance. Each priority
disease is introduced with a case definition, the „HMIS case definition‟. These case definitions
were agreed upon by HMIS department, MoPH to be implemented nationally by all health
workers in the country (Annex 2).
Table 2: DEWS targeted diseases and conditions for surveillance
S.No Disease S.No Disease
1 Cough and Cold 9 Pertussis
2 Pneumonia 10 Diphtheria
3 Acute Watery Diarrhea(AWD) 11 Tetanus/ Neonatal Tetanus
4 Acute Bloody Diarrhea 12 Acute Flaccid Paralysis
5 AWD with Dehydration 13 Malaria
6 Meningitis/Severe Ill Child 14 Typhoid Fever
7 Acute Viral Hepatitis 15 Hemorrhagic Fever
8 Measles 16 Pregnancy-related deaths

ANNUAL REPORT 2012
8
Information on outbreak cases and deaths are also collected and analyzed by DEWS and
specimens from each outbreak of diseases and unusual event are sent to Central Public Health
Laboratory (CPHL) as it is required by the surveillance system for confirmation. Meanwhile,
DEWS is doing case-based surveillance for Measles and collect samples from each individual
case and send to CPHL for confirmation.
1.12. How DEWS work
All levels of Disease Early Warning System, from sentinel-sites to national directorate of
surveillance, are involved in surveillance activities to detect and respond to the recommended
priority diseases or events (although the different levels do not perform identical functions).
These activities include the following core functions in six steps. The steps listed below are
presented in conceptual order; in practice, however, steps may be at different order. For example
taking actions might come quite soon after identification of the cases in a health facility.
Step 1- Identification of cases with priority diseases and events using standard case definitions at
health facility level and early detection of the outbreaks at community level
Step 2 - Reporting morbidity and mortality data on a weekly basis and sharing outbreaks
information at earliest, to the next administrative level through, SMS and phone call, meanwhile
updating the hard and soft copies of data at health facility level and provincial level
Step 3 - Compilation, analyses and interpretation of data for distribution by time, place and
person at multiple levels (sentinel-site, provincial, regional and national)
Step 4 - Investigation and confirmation of alerts and suspected outbreaks and response within 48
hours
Step 5 - Dissemination of the findings from the analyses of morbidity and mortality weekly
reports and outbreak reports to related MoPH departments, Local NGOs, Donors, and other
international organizations
Step 6 - Taking timely actions (immediate and long term) to implement the appropriate public
health preventive and control measures in coordination with stakeholders.

ANNUAL REPORT 2012
9
1.13. Information flow
The illustration below shows a usual flow of surveillance reporting and feedback throughout the
system. The solid arrows show the reporting channel of the system while feedbacks are indicated
by dotted arrows.
Figure 2: Flow of DEWS reports and feedbacks
DEWS focal points share the weekly report with the DEWS Provincial Office through mobile
phones and signed paper report also submitted later on. Sometime reports shared on daily bases.
All DEWS Regional and Provincial offices have access to internet, mobile phone and Codan
Radio to communicate with national surveillance/DEWS department in Kabul. At the early stage,
outbreaks are usually reported by mobile phone or Codan Radio then initial, update and final
reports are submitted by Regional Offices to National Surveillance Directorate. Morbidity &
mortality and outbreaks information are then shared with related MoPH departments, United
Nations agencies working in health and humanitarian affairs, BPHS1 and EPHS
1 implementing
1 BPHS: The Basic Package of Health Services (BPHS) is a health service delivery strategy identifying a set of cost-
effective primary health care interventions with particular attention to vulnerable group (e.g. women and children), and a strong focus on reaching out to the rural population and on ensuring equity
DEWS focal point at Health
Facility/sentinel site
Provincial DEWS Office
Regional DEWS Office
National Surveillance
Directorate, MoPH
UN agencies
International and
national NGOs
Other
stakeholders
Sources: Health
facilities, Community,
Media etc.
MoPH
departments

ANNUAL REPORT 2012
10
NGOs and other stakeholders i.e. the Ministry of Agriculture, Irrigation and Livestock (MAIL)
and FAO2, especially zoonotic diseases outbreaks.
1 EPHS: Essential Package of Hospital Services(EPHS) identifies a standardized package of hospital services at each
level of hospital(district, provincial and regional) 2FAO: Food and Agriculture Organization of the United Nations

ANNUAL REPORT 2012
11
2. Morbidity and Mortality
During 2012, a total of 14,205,433 new cases from all diseases were reported by all sentinel
sites. A total of 4,679,891 patients (32.9 % of total new consultations) were consulted for
diseases targeted for DEWS of which 51% were children less than five years old and 49% five
years and over. Table 3 indicates number of cases and their proportion among total consultations
for each DEWS targeted disease. The percentage of children less than five years with DEWS
targeted diseases as a proportion of total consultations for all ages was 16.76 %.
Table 3: Reported DEWS targeted diseases at national level by age
Disease/Condition <5 years >=5 years All Ages
Number % Number % Number %
Cough and Cold 1130216 25.7877 1441740 14.6776 2571956 18.1053
Pneumonia 328021 7.4852 159101 1.6198 487122 3.4294
Acute Watery Diarrhea 668103 15.2444 395923 4.0307 1064026 7.4904
Acute Bloody Diarrhea 127716 2.9142 141168 1.4373 268884 1.8930
AWD With Dehydration 74135 1.6916 40233 0.4096 114368 0.8051
Meningitis/ SIC 4910 0.1120 3209 0.0327 8119 0.0572
Acute Viral Hepatitis 2584 0.0590 6870 0.0699 9454 0.0665
Measles 7269 0.1659 2825 0.0288 10094 0.0711
Pertussis 293 0.0067 182 0.0019 475 0.0033
Diphtheria 9 0.0002 7 0.0001 16 0.0001
Tetanus/ Neonatal Tetanus 113 0.0026 53 0.0006 166 0.0012
Acute Flaccid Paralysis 492 0.0078 591 0.0024 1083 0.0040
Malaria 23518 0.5361 45762 0.4653 69280 0.4871
Typhoid Fever 14474 0.3293 60091 0.6116 74565 0.5245
Hemorrhagic Fever 55 0.0004 122 0.0011 177 0.0009
Pregnancy-related deaths 103 0.0007 103 0.0005
Total DEWS 2381908 16.766 2297980 23.3899 4679888 32.9397
Total Consultations 4382704 100 9822729 100 14,205,433 100

ANNUAL REPORT 2012
12
Figure 3 depicts the distribution of most common DEWS targeted diseases reported from all
sentinel sites in the country in 2012. Acute Respiratory Infections (Cough and cold and
Pneumonia) remain the most commonly reported illness with an overall proportion of 21.5 %
among total consultations in all ages. The proportion of cases with Cough & Cold among total
consultations was 18.1% (2,571,956 cases) while for pneumonia the proportion was 3.4 %
(487,122 cases). Around 7.5% of children aged less than five years have experienced pneumonia
this year. The percentage of children less than five years old with Cough and Cold and
Pneumonia among the total cases of cough and cold and Pneumonia was 43.8% and
68.6%respectively. Acute Diarrheal Diseases (acute watery diarrhea, acute bloody diarrhea and
AWD with dehydration) are the second most common conditions and accounted for 10.2% of the
reported total consultations in the year 2012. Acute watery diarrhea consisted 7.7 % of total
consultations and 0.8% were with dehydration. The percent of children younger than 5 years
with acute watery diarrhea was 15.2%.
ARIs, acute diarrheal diseases, malaria and typhoid fever are among the major morbidities
followed by measles, meningitis/Sever Ill Child and acute viral hepatitis in all age groups in
2012.Cough and cold, acute bloody diarrhea, acute viral hepatitis, malaria, typhoid and
hemorrhagic fever were mostly reported in age group more than five years while the rest of the
diseases were reported in children less than five years old.
Figure 3: Top ten DEWS targeted diseases
0 2 4 6 8 10 12 14 16 18 20
Meningitis/SIC
Acute Viral Hepatitis
Measles
Typhoid Fever
Malaria
AWD with Dehydration
Bloody Diarrhea
Pneumonia
Acute Watery Diarrhea
Cough & Cold

ANNUAL REPORT 2012
13
A total of 2,966 deaths due to DEWS targeted diseases were reported in 2012 that represent
27.5% of total reported OPD and IPD deaths. ARI-Pneumonia was the primary killer with 1,782
deaths followed by suspected meningitis (552 deaths) and Diarrheal diseases (370 deaths).
1.2. Cough and cold
Cough and cold remains the most commonly reported illness in 2012. Figure 3 illustrates that
greatest proportion of the total consultations is attributable to cough and cold cases (18.1%). In
total, 2,571,956caseshave been reported as cough and cold, of which 1,120,216 (43.9%) were in
children younger than five years old. This year, 25.8% of consultations in children younger than
five years were due to cough and cold, compared with the previous years, there was significant
increase in number of the cases reported countrywide, although this is most likely due to the
expansion and improvements in the DEWS surveillance network.
Table 4: Cough and cold cases by region
Region No. of cough and cold
cases % of cough and cold cases out of
total consultations
East 475256 21.3
South East 224711 20.5
Central West 195406 20.3
North 412791 19.1
North East 245551 17.7
West 251145 16.4
Central 542996 16
South 224177 15.7
Total 2,572,033
The 2012 proportion of the cough and cold cases among total consultations was highest in East
region (21.3%), followed by South East (20.5 %) and Central West (20.3 %) regions (Table 4).
Kapisa (27.1%), Logar (25.9%), Nuristan (25.3%), Khost (24.2%) and Kunar (24.1%) provinces
reported highest proportions for cough and cold at provincial level (Table 28 Cough and
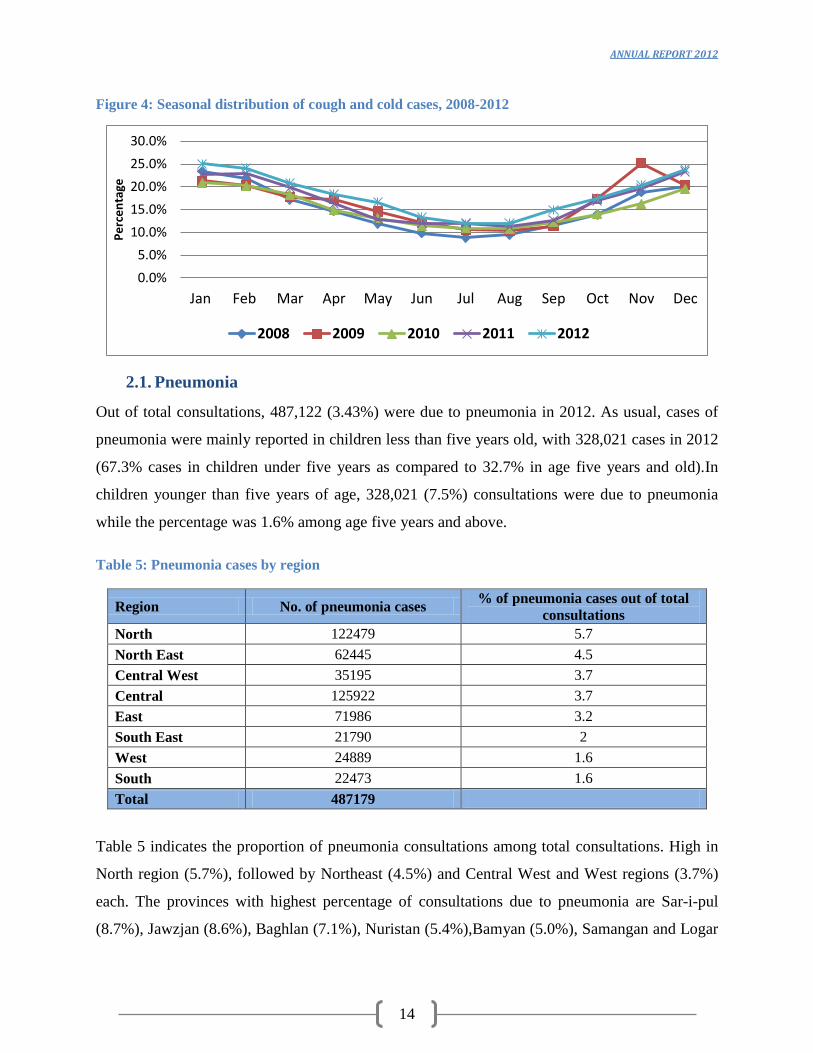
Cold/Pneumonia cases by province). A clear seasonal trend by month for the last five years can
be observed with peak in January, gradual decrease throughout summer months, and then
increase throughout the winter at the end of the year (Figure 4).
ANNUAL REPORT 2012
14
Figure 4: Seasonal distribution of cough and cold cases, 2008-2012
2.1. Pneumonia
Out of total consultations, 487,122 (3.43%) were due to pneumonia in 2012. As usual, cases of
pneumonia were mainly reported in children less than five years old, with 328,021 cases in 2012
(67.3% cases in children under five years as compared to 32.7% in age five years and old).In
children younger than five years of age, 328,021 (7.5%) consultations were due to pneumonia
while the percentage was 1.6% among age five years and above.
Table 5: Pneumonia cases by region
Region No. of pneumonia cases % of pneumonia cases out of total
consultations
North 122479 5.7
North East 62445 4.5
Central West 35195 3.7
Central 125922 3.7
East 71986 3.2
South East 21790 2
West 24889 1.6
South 22473 1.6
Total 487179
Table 5 indicates the proportion of pneumonia consultations among total consultations. High in
North region (5.7%), followed by Northeast (4.5%) and Central West and West regions (3.7%)
each. The provinces with highest percentage of consultations due to pneumonia are Sar-i-pul
(8.7%), Jawzjan (8.6%), Baghlan (7.1%), Nuristan (5.4%),Bamyan (5.0%), Samangan and Logar
0.0%
5.0%
10.0%
15.0%
20.0%
25.0%
30.0%
Jan Feb Mar Apr May Jun Jul Aug Sep Oct Nov Dec
Pe
rce
nta
ge
2008 2009 2010 2011 2012

ANNUAL REPORT 2012
15
(4.8) each, Balkh (4.5%),Wardak(4,3%), and Logar (4.0) (Table 28 Cough and Cold/Pneumonia
cases by province).
The 2012 trend of the pneumonia cases and deaths by month can be observed with peak in
January and February in Figure 5.
Figure 5: Trend of pneumonia cases and deaths by month
Among total reported deaths due to DEWS targeted diseases, 1782(60.2%) were due to
pneumonia. The associated case-fatality rate was 3.65 per 1000. Majority of the deaths (93.6%)
were reported in children under the age of five years.
2.2. Acute Watery Diarrhea (AWD)
Acute diarrheal diseases (ADDs) remain the second most frequent illness (1,447,362 cases)
accounted for 10.2% of total consultations.
Table 6: cases of AWD by region
0
50
100
150
200
250
0
1
2
3
4
5
6
Jan Feb Mar Apr May Jun Jul Aug Sep Oct Nov Dec
Nu
mb
er
of
de
ath
s
Pe
rce
nta
ge
Pneumonia % Deaths
Region No. of AWD cases % of AWD out of
total consultations South East 99723 9.1
South 129188 9
West 126164 8.2 North 174291 8.1 North East 109645 7.9 East 168198 7.5 Central West 62826 6.5 Central 194040 5.7
Total 1,064,075

ANNUAL REPORT 2012
16
Among total ADDs, the number of AWD cases was 1,064,075(7.5% of total consultations).
Most of the cases of acute watery diarrhea have been reported among children less than five
years old (62.8%). The percentage of acute watery diarrhea cases increased significantly from
6.6% in 2009 and 2010to 7.2% in 2011and to 7.5% in 2012. Around 15.2% children aged less
than five years, among total consultations in this age group, consulted for acute watery diarrhea.
The high acute watery diarrhea percentages were reported from South East (9.1%), South
(9.0%), and West (8.2%) regions (Table 6). While lowest percentages for AWD were reported
from Central (5.7%) and Central West regions (6.5%). At provincial level, high percentages for
AWD among total consultations were reported from Paktia and Samangan (11.8%), Baghlan
(11.0%), Nimroz (10.6%), Nuristan (10.1%) provinces (Table 29). However, the number of
AWD cases was highest in Kabul (143,693), Nangarhar (96225) and Herat (67882). The
provinces with lowest percentages were Panjshir (4.6%), Bamyan, Wardak and Kabul (5.3%)
and Kunar (5.6%) (Table 29 Acute Watery Diarrhea/ AWDWD cases by province)
There is a clear seasonal trend for acute watery diarrhea cases (Figure 6), with percentages
increasing over the summer months, peaking in July (13.02%) and then decreasing gradually.
Figure 6: Seasonal trend of AWD cases, by month
2.3. Acute Watery Diarrhea (AWD) with Dehydration
In this year, 114,372 AWD with dehydration cases were reported in all age groups accounted for
0.81% of the total consultations. Among total cases, 64.8% were reported in age less than five
years. Higher percentage of AWD with dehydration was reported in children less than age of five
as compared to age five and above (1.7% among total under five consultations versus
0.0
2.0
4.0
6.0
8.0
10.0
12.0
14.0
Jan Feb Mar Apr May Jun Jul Aug Sep Oct Nov Dec
Pe
rce
nta
ge
M o n t h s

ANNUAL REPORT 2012
17
0.4%among total over five year consultations).The highest percentage (1.5%) for AWD with
dehydration cases out of total consultations was reported from South and East region, followed
by South East (1.0%).region. (Table7).At provincial level, high percentage of cases were
reported from Uruzgan,(2.2%), Helmand and Nangarhar provinces (1.8%) each, followed by
Paktya (1.4%),Kandahar (1.3%) provinces (Table 29 Acute Watery Diarrhea/ AWDWD cases
by province).Figure 7 illustrates a clear seasonal trend similar to AWD with peak in summer
especially in the months from July to August.
Table 7: AWD with dehydration cases by region
Region No. of AWD with Dehydration cases % of AWD w Dehyd cases out of
total consultations
South 21118 1.5
East 33239 1.5
South East 11426 1
North East 7813 0.6
Central West 5713 0.6
Central 20755 0.6
North 9606 0.4
West 4702 0.3
Total 114372
Figure 7: Seasonal trend of AWD with dehydration cases by month
In 2012, a total of 353 deaths due to acute watery diarrheal diseases (with and without
dehydrations) were reported countrywide, of which 323 (91.5%) were reported in children
younger than age of five years.
0
0.2
0.4
0.6
0.8
1
1.2
1.4
1.6
Jan Feb Mar Apr May Jun Jul Aug Sep Oct Nov Dec
Pe
rce
nta
ge
M o n t h s

ANNUAL REPORT 2012
18
2.4. Acute Bloody Diarrhea
In 2012, 268,915 cases (1.9% among total consultations) of acute bloody diarrhea and 17 related
deaths were reported countrywide. The percentage was the same, compared to 1.9% in 2011.In
children under five years of age 2.9% of consultations (among total under five consultations)
were attributed to acute bloody diarrhea while this percentage was 1.4% among age five years
and above (denominator is total over five years consultations).
Table 8: Acute bloody diarrhea by region
Region No. of acute bloody diarrhea cases % out of total consultations
East 63506 2.8
South 34880 2.4
North 47867 2.2
South East 23647 2.2
Central West 18897 2
North East 25850 1.9
West 17733 1.2
Central 36535 1.1
Total 268915
Table 8 indicates that high percentages of cases among total consultations were reported from East
(2.8%), South East (2.4%), North and South East (2.2%) and North East (1.9%).Among all provinces
Kandahr (4%), Nuristan (3.8%), Logar (3.6%), and Wardak (2.9%) are the provinces with highest
percentage of acute bloody diarrhea cases among total provincial new consultations (Table 30).
Figure 8: Seasonal trend of acute bloody diarrhea by month
0
0.5
1
1.5
2
2.5
3
Jan Feb Mar Apr May Jun Jul Aug Sep Oct Nov Dec
Pe
rce
nta
ge
M o n t h s

ANNUAL REPORT 2012
19
Similar to acute watery diarrheal diseases the burden of acute bloody diarrhea is high in summer
months with peak in July (2.6%), (Figure-8).
2.5. Malaria
Out of total consultations percentage for reported malaria cases in Afghanistan declined
substantially from 2008 onwards (Figure9). Bed net distribution program may have contributed
to this reduction. The percentage remained lower at 0.49% (69,203 cases) in 2012. Among the
cases, 45,707 (66%) were in age group five years and above. Malaria cases have been reported as
proportion of total consultations of the relevant age group 0.5% among the age group five year
and five years and above.
Table 9: Suspected malaria cases by region
Region No. of malaria cases % of malaria cases out of total consultations
East 39419 1.8
South East 10204 0.9
South 6782 0.5
North East 2448 0.2
North 5132 0.2
Central West 1135 0.1
West 942 0.1
Central 3141 0.1
Total 69203
East (1.8%), Southeast (0.9%) and South (0.5%) were the regions with highest percentages of
malaria cases among total consultations (Table9). Kunar (2.01%), Nangarhar (1.87%), Paktika
(1.8%), Laghman(1.28%)and Paktya (0.99%) reported high percentages of malaria cases among
total consultations, at provincial level(Table 30 Acute Bloody Diarrhea/Malaria cases by
province).There is a clear seasonal trend with percentages increasing over the summer months,
peaking from June to October and then decreasing gradually (Figure 10). The information on the
species of malaria parasite is not collected by DEWS. A total of 40 malaria deaths were reported
of which 23 were in children under the age of five. The corresponding malaria CFR was 0.58 per
1000 in 2012.

ANNUAL REPORT 2012
20
Figure 9: Percentage of malaria cases out of total consultations by year, 2008-2012
Figure 10: Malaria trend by month
2.6. Typhoid Fever
There were 74,508 cases of suspected typhoid fever notified in 2012 accounted for 0.52% of
total OPD and IPD consultations. The 2012 percentage was similar to the 2011 but was less than
percentage of 2009 (0.8%) and 2008 (1%). Figure 11shows the percentage of suspected typhoid
fever among total consultations by year since 2008.
1
0.8
0.65 0.63
0.49
0
0.2
0.4
0.6
0.8
1
1.2
2008 2009 2010 2011 2012
Pe
rce
nta
ge
Y e a r s
0.2 0.2 0.2
0.4
0.5
0.7
0.8 0.8
0.7
0.5
0.4
0.2
0
0.1
0.2
0.3
0.4
0.5
0.6
0.7
0.8
0.9
Jan Feb Mar Apr May Jun Jul Aug Sep Oct Nov Dec
Pe
rce
nta
ge
M o n t h s

ANNUAL REPORT 2012
21
Figure 11: Suspected Typhoid fever by year, 2008-2012
Table 10: Typhoid fever by region
Region No. of typhoid fever cases % of typhoid fever cases out of total consultations
South 14565 1
South East 10380 0.9
East 17333 0.8
North East 6887 0.5
North 9304 0.4
Central West 4255 0.4
West 4084 0.3
Central 7700 0.2
Total 74508
Age was recorded for all cases. Out of total cases 60,076 (80.6%) were reported in age group
five years and above. Age-specific percentage was higher in the ≥ 5 years age group (0.6%) as
compared to age group <5 years (0.3%).The highest out of total consultations percentages for
typhoid fever were reported from South(1.1%),South East (0.9%), and East (0.8%) regions
(Table 10).At provincial level, the highest percentages were reported from Nangarhar (0.24%),
Khost (0.22%), Nuristan (0.19%) and Wardak (0.14%). The percentage of reported typhoid cases
in 2012 showed a peak in summer with the highest percentage in July. Similar trends were
observed also in 2011 and 2010 (Figure 12).
1
0.8
0.6 0.56 0.52
0
0.2
0.4
0.6
0.8
1
1.2
2008 2009 2010 2011 2012
Pe
rce
nta
ge
Y e a r s

ANNUAL REPORT 2012
22
In total 6 deaths due to typhoid fever were reported, 1 in the age group below five and 5 in age
five and above.
Figure 12: Seasonal trend of typhoid fever cases by month, 2008- 2012
2.7. Meningitis/Severe Ill Child
A total of 8,119 cases of suspected meningitis/severe ill child were notified. Compared with
previous years, there was slight increase in the number and percentage of cases among total
consultations (0.07% in 2010, 0.05% in 2011 and 0.06% in 2012).
Table 11: Suspected Meningitis/SIC cases by region, 2012
Region No. of suspected meningitis/SIC cases % of suspected meningitis/SIC cases out of
total consultations
North 2044 0.09 Central 2278 0.07 North East 862 0.06 West 698 0.05 South 695 0.05 Central West 466 0.05
South East 362 0.03
East 714 0.03
Total 8119
The national level percentage for the cases was 0.06 % (8,119 cases) with the highest
percentages being reported by North (0.09%, 2044 cases), Central (0.07%, 2278 cases),
0
0.2
0.4
0.6
0.8
1
1.2
1.4
Jan Feb Mar Apr May Jun Jul Aug Sep Oct Nov Dec
Pe
rce
nta
ge
2008 2009 2010 2011 2012

ANNUAL REPORT 2012
23
Northeast (0.06%, 862 cases) and West (0.05%, 698 cases) regions (Table 11).Table 31 details
the number of meningitis/SIC cases at provincial level. The most affected age group was the
youngest (under five years) with an overall percentage of 0.11 among total under five OPD
consultations compared to the age group (five years and above) with a percentage of 0.03.The
large number of deaths (552) was reported due to meningitis/SIC corresponding to CFR of 68
per 1000. More deaths (383) were reported in age group less than five years.
2.8. Measles
There were 10,094(0.07%) suspected measles notifications and samples were collected for
laboratory confirmation from 2,902 cases, of which 2,099 (72.3%) were laboratory-confirmed.
There was a significant decrease in the number of cases from 2011 when there were 4,856
(0.04%) suspected cases. Age was recorded for all suspected cases. Majority of the cases 7269
(72.0%) were reported in age group less than five years.
The higher age specific percentage was seen in the under-five age group (0.2%), compared with
age group five years and above (0.07%).
The highest percentages were reported from East (0.17%, 3797 cases), South East (0.1%, 1085
cases) and South (0.06%, 835 cases) regions (Table 12).
Table 12: Suspected measles cases by region
Region No. of measles cases % of measles cases out of total consultations
East 3797 0.17
South East 1085 0.1
Central West 605 0.06
South 832 0.06
North 1056 0.05
Central 1802 0.05
North East 582 0.04
West 335 0.02
Total 10094
At provincial level, highest percentages of measles cases among total OPD consultations were
reported from Nangarhar (0.24%, 3152 cases), Khost (0.22%, 532 cases), Nuristan (0.19 %, 193
cases) and Wardak (0.14%, 355 cases).Nonetheless, the high number of suspected measles cases
was reported from Nangarhar (3152), Kabul (1540) and Balkh (771) provinces (Table 31).For
2012 there is a clear seasonal pattern of measles with a peak in spring/summer (March–July) and

ANNUAL REPORT 2012
24
lower cases in autumn (Figure 13). Overall 40 deaths due to measles were reported in 2012 with
38 deaths being reported in age less than five years (CFR= 5.2 /1000).
Figure 13: Seasonal distribution of measles cases
2.9. Acute Viral Hepatitis
A total of 9,454 cases (0.1%) of suspected acute viral hepatitis were reported, compared with 8,
867 cases (0.07%) in 2011 and 6,711(0.1%) in 2010. The majority of the cases were reported in
the age group five years and above (72.7% of total cases). The age-specific percentage was
slightly higher in age group five years and above (0.07%) than age group below five years
(0.06%).
Table 13: Suspected acute viral hepatitis cases by region
Region No. of acute viral hepatitis
cases
% of acute viral hepatitis cases out of total
consultations
South East 1730 0.16 East 2750 0.12 Central 2672 0.08 North East 65 5 0.05 Central West 343 0.04 West 488 0.03 South 492 0.03 North 324 0.02
Total 9454
0
500
1000
1500
2000
2500
Jan Feb Mar Apr May Jun Jul Aug Sep Oct Nov Dec
Me
asle
s C
ase
s
M o n t h s

ANNUAL REPORT 2012
25
Southeast (0.16%, 1730 cases), East (0.12%, 2750 cases) and Central (0.08%, 2672 cases)
regions had the highest reported cases in 2012(Table 13).Nangarhar reported the highest number
of cases (2,630), followed by Kabul(2,566), Ghazni (549), Khost (484), Paktika (399), and
Takhar (351).However, the highest percentages were reported from Paktika (0.20%), Nangarhar
(0.20%), Khost (0.20%,) Ghazni (0.16%), and Paktia (0.10%) respectively. No seasonal pattern
can be observed for acute viral hepatitis. Data on the types of viral hepatitis is not collected by
DEWS through weekly surveillance system. However, data on the types of hepatitis are collected
during hepatitis outbreaks.
A total of 28 deaths were reported countrywide corresponding to case-fatality rate of 2.96 deaths
per 1000 cases at national level. More deaths (17 deaths, 61%) were reported inage group five
years and old.
2.10. Pertussis
A total of 475 suspected pertussis cases were reported in 2012, compared with 438 cases in 2011.
The slight increase in the number of cases could be explained by the expansion of the sentinel
sites. Among total cases, 293 (61.7%) were reported in age group less than five years.
The highest number for pertussis cases was reported from Central region (127 cases), followed
by North East (112cases), North (90cases), and South (55cases) regions. Table 14 shows the
number of suspected pertussis cases at provincial level. In 2012; out of total OPD percentages for
pertussis were higher during spring and summer (Figure 14). No deaths due to pertussis were
reported in 2012.
Table 14: Provinces with reported number of suspected pertussis cases
S.No Province No. of Suspected pertussis
cases S.No Province
No. of Suspected pertussis
cases 1 Kabul 127 13 Kandahar 6 2 Badakhshan 81 14 Khost 6 3 Balkh 62 15 Bamyan 4 4 Nangarhar 51 16 Ghazni 3 5 Hilmand 39 17 Hirat 3 6 Faryab 28 18 Paktika 3 7 Takhar 12 19 Panjsher 3 8 Kunduz 11 20 Uruzgan 3 9 Paktya 8 21 Parwan 1
10 Baghlan 8 22 Badghis 1 11 Logar 7 23 Kunar 1 12 Zabul 7 Total 475

ANNUAL REPORT 2012
26
Figure 14: Seasonal distribution of suspected pertussis cases
2.11. Diphtheria
A total of 16 probable diphtheria cases were reported countrywide in 2012 through sentinel sites.
The number of this rare disease with epidemic potential is more than that for the last two years
(2011: 15 cases, 2010: 10 cases). More than half of the cases were reported in the age group less
than five years, 9 cases (56.2%).The majority of cases were reported by Northeast (8), Central3),
and South (2) regions. Two cases were reported from East while North reported one diphtheria
case in 2012. Table 15 shows the distribution of the probable diphtheria cases at provincial level.
No seasonal trend can be observed from the small number of cases. No deaths due to diphtheria
have been reported in 2012.
Table 15: Distribution of the probable diphtheria cases by province
Province No. of probable diphtheria cases
Kabul 3
Kandahar 2
Takhar 1
Balkh 1
Nangarhar 1
Kunar 1
Total 9
2.12. Tetanus/ Neonatal Tetanus
In 2012, 166 suspected cases were reported countrywide from the sentinel sites. This is a
significant increase from the 124 cases reported in 2011. The most affected age group was the
children under the age of five with 113 (67.4 %) from the 166 reported cases. Data on
vaccination status are not collected and analyzed by DEWS.
0
0.002
0.004
0.006
0.008
0.01
0.012
Jan Feb Mar Apr May Jun Jul Aug Sep Oct Nov Dec
Per
cen
tage
Months

ANNUAL REPORT 2012
27
Table 16: Number of Tetanus/ Neonatal Tetanus cases by districts
S.No District TT Cases District TT Cases 1 Lashkar Gah 79 13 Balkh 1
2 Jalalabad 20 14 Nahr -i- Sarraj 1 3 Kabul 18 15 Qalat 1 4 Kandahar 17 16 Qarqin 1 5 Mazari Sharif 5 17 Yakawlang 1 6 Hirat 4 18 Puli Khumri 1 7 Khost(Matun) 2 19 Saghar 1 8 Shibirghan 2 20 Teyora 1
9 Taluqan 2 21 Dihrawud 1
10 Kunduz 2 22 Dara-I-Pech 1 11 Mir amor 2 23 Shinwar 1 12 Farah 2 Total 166
The highest number of cases was reported by Lashkargah (79 cases) followed by Jalalabad (20
cases), Kabul (18 cases), Kandahar 17 cases), Mazar-i-sharif 5 cases and Hirat (4 cases). . Table
16 details the locations of the cases and the number of suspected cases. A peak of tetanus cases is
clearly evident in March, June and December (Figure 15).A total of 30 deaths due to tetanus
were reported with corresponding case-fatality rate of 225 per thousand. Among deaths, 29
reported in age group less than five years.
Figure 15: Seasonal trend of tetanus/neonatal tetanus cases, by month
0
5
10
15
20
25
30
Jan Feb Mar Apr May Jun Jul Aug Sep Oct Nov Dec
Nu
mb
er
of
Cas
es
M o n t h s

ANNUAL REPORT 2012
28
2.13. Hemorrhagic Fever
In this year, 128 reports of suspected hemorrhagic fever were received from all over the country
as compared with 357 cases in 2011, 568 cases in 2010.Among total cases in 2012, 109 (85%)
were reported in age group five years and above. High numbers of cases were reported from
Central (28 cases), South (24 cases), South East (23 cases) and West (18 cases) regions (Table
17). Table 32 shows the provincial distribution of the suspected hemorrhagic fever in 2012.The
Majority of cases, 74(58%) were reported in January, March and September (Figure 16). There
were three deaths due to hemorrhagic fever reported in 2012.
Table 17: Number of suspected hemorrhagic fever cases by region
Region No. of Hemorrhagic Fever cases Central 28 South 24 South east 23 West 18 Central west 14 North 11 East 6
North east 4
Total 128
Figure 16: Number of reported hemorrhagic cases, by month
0
5
10
15
20
25
30
35
40
Jan Feb Mar Apr May Jun Jul Aug Sep Oct Nov Dec
Nu
mb
er
of
Cas
es
M o n t h s

ANNUAL REPORT 2012
29
3. Outbreak detection, verification, investigation and response
The outbreaks detection, verification, investigation and responses incorporated and carried out
through Indicator based surveillance and disease & event alert notification mechanism
established. Below both mechanisms are explained.
Indicator based surveillance within the national surveillance system for 15 priority and targeted
diseases that collect data on weekly basis. Based on analysis the surveillance system investigates
the alerts reported by focal points in sentinel sites (selected public health facilities), other public
and private health facilities, community and local government officials. The system investigates
the alerts and provides initial response to the disease outbreaks and shares the preliminary
information at earliest with potential stakeholders. Besides other investigation steps, if necessary,
samples are collected from the suspected cases and send to Central Public Health Laboratory
(CPHL) for laboratory confirmation. The final outbreak report is prepared by investigation and
response team and shared with central DEWS department through regional DEWS coordinators.
All the outbreaks data are collated and analyzed by DEWS department, MoPH.
This report contains an analysis of data on outbreaks reported between 1st January and
31stDecember 2012. The available outbreak data are restricted to the outbreaks reported to
DEWS. Outbreaks are more likely to be reported if they involve unusual event, a large number of
cases and/or deaths, existing of active reporting channels and from area with better security
situations. The differing accessibility to the health care facilities may also impact on outbreak
reporting. For these reasons caution is advised when interpreting the data contained in this report.
3.1. Outbreaks in 2012
There were 325 outbreak alerts reported and investigated and clinically or laboratory confirmed
in 2012. A total of 9,772 cases were associated with outbreaks with an average of almost 30
cases per outbreak. However, the size of the outbreaks ranged from one case to 1316 cases in
Brucellosis outbreak in Bamyan. Samples from the 296 outbreaks were collected for the
laboratory confirmation in 2012. The highest number of outbreaks (66) was reported from South
East region that represents 20.3 % of all outbreaks in 2012.South region reported the second
highest number of outbreaks, 62 (19.1%) followed by East with 48 outbreaks (14.8%), while the
lowest number of outbreaks, 23(7.1%) was reported from North East region.(Table 18).

ANNUAL REPORT 2012
30
At provincial level, highest number of the outbreaks were reported from Hirat province (10.5%,
34 outbreaks) followed by Paktia (8.3%, 27 outbreaks), Nangarhar (8%, 26 outbreaks) and
Kandarhar (7.1%, 23 outbreaks). One outbreak was reported from Panjshir and no outbreak was
reported from Farah province during 2012 (Table 33).
The complete list of outbreaks by province and district can be seen in Annex 2.
Table 18: Outbreaks and associated cases by region
Regions No. of Outbreaks Percentage No. of Cases Percentage
South 62 19.1 1075 11.0 Central 28 8.6 1226 12.5 East 48 14.8 993 10.2 North 26 8.0 256 2.6 North East 23 7.1 991 10.1 South East 66 20.3 1369 14.0 West 46 14.2 1818 18.6 Central West 26 8.0 2044 20.9 Total 325 100 9772 100
In 2012, the number of monthly outbreaks ranged from 9 (in October) to 42 (in May), with an
average of 27outbreaks per month (almost one outbreak per day). And overall, most outbreaks
were reported in summer season (Figure 17).
The increase in number of outbreaks during months of April, May and June is due to a seasonal
effect; as respiratory diseases and water-borne diseases occur during this period. In some parts of
the country cold weather exist hence ARI occurring and in other parts where weather gets
warmer ARI coming to decline and water-borne diseases (especially Cholera) start an overall rise
in occurrence. Measles outbreaks that consists huge proportion of total outbreaks (65.5%)
occurring in spring are also contribute into increased number of total outbreaks in spring.
Figure 17: Outbreaks by month

ANNUAL REPORT 2012
31
The most common causal agent for the outbreaks in 2012 was measles virus, which resulted in
65.5% (213) of total outbreaks. The next most common causal agent associated with outbreaks
was CCHF for 9.2% (30) of all outbreaks. Outbreaks due to Pertussis and Scabies had the third
8.0% (26) and fourth 3.7% (12) highest numbers respectively (Table 19).
Table 19: Reported outbreaks by disease
Disease No. of outbreaks % of outbreaks
Measles 213 65.5 CCHF 30 9.2 Pertussis 26 8.0 Scabies 12 3.7 Food poisoning 10 3.1 Malaria 7 2.2 Pneumonia 4 1.2 Acute Gastroenteritis 4 1.2 Cholera 3 0.9 Acute Viral Hepatitis 3 0.9 ARI 3 0.9 Leishmaniasis 2 0.6 Brucellosis 2 0.6 Chicken Pox 1 0.3 Diphtheria 1 0.3 Influenza A(H1N1) 1 0.3 TineaCapitis 1 0.3 Meningitis 1 0.3 Mumps 1 0.3 Typhoid fever 0 0.0 Rabies 0 0.0 Total 325 100
34 31
35
40 42 41
29
18 20
9 13 13
0
5
10
15
20
25
30
35
40
45
Jan Feb Mar Apr May Jun Jul Aug Sep Oct Nov Dec
Nu
mb
ers

ANNUAL REPORT 2012
32
3.2. Measles outbreak
The most common outbreak in 2012 was due to Measles (213 outbreaks), accounted for65.5 %
of all outbreaks associated with 3,389 measles cases. There was a 45.8% increase in the number
of Measles outbreaks compared to those reported during 2011. Measles cases were confirmed by
laboratory testing. Out of 2902 specimen tests, 72.3% were positive for measles. Cases were
labeled confirmed with positive serologic test for Measles IgM antibody. Samples were not
collected for laboratory testing if outbreaks occurred in insecure and most remote areas.
Southeast region reported 59 Measles outbreaks, (27.7%) of all Measles outbreaks. Table 20
shows the regions with the number of reported Measles outbreaks. At provincial level high
number of Measles outbreaks was reported from Paktika (24 outbreaks), Nangarhar, Paktya
(21outbreaks from each), Takhar (16 outbreaks), Kandahar and Oruzgan (12 outbreaks from
each) and Zabul (13 outbreaks) provinces (Table 34).Most of the Measles outbreaks (65.2%)
were reported in the first five months of the year with peak in April (34 outbreaks) and May (29
outbreaks).
Table 20: Number of measles outbreaks by region
Regions No. of measles outbreaks % of measles outbreaks
South East 59 27.7
South 42 19.7
East 36 16.9
West 20 9.4
North 16 7.5
Central West 15 7.0
Central 13 6.1
North East 12 5.6
Total 213 100
3.3. CCHF Outbreaks
After Measles, CCHF is the second disease with highest number of outbreaks in 2012. From all
regions 30 outbreaks were reported and highest number of outbreaks reported from West region
with 18 outbreaks (60%), South region 6 outbreaks (20%) and followed by North region with 3
outbreaks (10%), whereas no outbreak reports received from three regions namely Central West,
Central and North East regions (Table-21).

ANNUAL REPORT 2012
33
Table 21: Number of CCHF Outbreaks by Region
Regions No. of CCHF Outbreaks Percentage
West 18 60.0
South 6 20.0
North 3 10.0
East 2 6.7
South East 1 3.3
North East 0 0.0
Central 0 0.0
Central West 0 0.0
Total 30 100
3.4. Pertussis outbreak
Pertussis outbreak was the third most common outbreak countrywide in 2012 with 26 outbreaks
and 1280 associated cases. All the outbreaks were clinically confirmed. There was a decrease of
40% in pertussis outbreaks in 2012 as compared to 2011. Most of the outbreaks were reported
from the South (8 outbreaks), North East (6 outbreaks), and West (4 outbreaks) regions (Table
22).Pertussis outbreaks by Province can be read in (Annex-2, Table-35)
Table 22: Number of pertussis outbreaks by region
Regions No. of Pertussis outbreaks % of Pertussis outbreaks
South 8 30.8 North East 6 23.1 West 4 15.4 North 3 11.5 South East 2 7.7 Central 2 7.7 Central West 1 3.8 East 0 0.0 Total 26 100
Most of the outbreaks (60.5%) were notified during March to June with peak in June, 6
outbreaks (Figure 19).

ANNUAL REPORT 2012
34
Figure 18: Pertussis outbreaks by month
3.5. Scabies
In 2012 a total of 12 outbreaks of Scabies with associated 1160 cases were reported from all
DEWS sentinel sites. Table 23 indicates all Scabies outbreaks and associated cases by region.
Table 23: Number of Scabies outbreaks and associated cases by region
Regions No. of
Outbreaks Percentage No. of Cases Percentage
Central 4 33.3 107 9.2
North East 3 25.0 316 27.2
East 2 16.7 28 2.4
South 1 8.3 220 19.0
North 1 8.3 67 5.8
West 1 8.3 422 36.4
South East 0 0.0 0 0.0
Central west 0 0.0 0 0.0
Total 12 100 1160 100
3.6. Food Poisoning Outbreaks
Food poisoning outbreak was the fifth most common outbreaks countrywide in 2012 with 10
outbreaks and 1303 associated cases, Table 24 shows the no, of outbreaks and the associated
cases on food poisoning by region.
2 2
3 3
5
6
1
0 0
1
2
1
0
1
2
3
4
5
6
7
Jan Feb Mar Apr May Jun Jul Aug Sep Oct Nov Dec
No
. of
Pe
rtu
ssis
ou
tbre
aks
M o n t h s

ANNUAL REPORT 2012
35
Table 24: No. of Food Poisoning outbreaks and associated cases by region
Regions No. of Outbreaks Percentage No. of
Cases Percentage
South 4 40.0 109 8.4
South East 3 30.0 389 29.9
Central 2 20.0 682 52.3
East 1 10.0 123 9.4
Total 10 100 1303 100
4. Laboratory Report
Central Public Health Laboratory (CPHL), a national reference laboratory, supports the
surveillance/DEWS program in confirmation of the suspected outbreaks detected countrywide.
In 2012, the laboratory performed a total of 4,940 tests of specimens received from all the
DEWS regions. The number of specimens examined for Measles remained highest at 2,902 or
58.7 % of total specimens. Among all2, 205 positive specimens, 2099 were positive for Measles,
92 for Rota virus, Zero for Cholera and the rest for CCHF, Brucellosis, HBV, Influenza, and
ABD. Table 25 details the number of tested and positive specimens by region and diseases.
Table 25: Number of investigated and positive specimens by region and disease
Region No. of
specimens/positive Measles Rota
virus Cholera CCHF HBV Total
East No. of specimens 614 110 19 1 3 747 No. tested positive 456 40 0 0 2 498
South No. of specimens 192 0 3 0 0 195 No. tested positive 126 0 0 0 0 126
South East No. of specimens 221 0 10 4 12 247 No. tested positive 154 0 0 0 0 154
Central No. of specimens 584 0 7 0 10 601 No. tested positive 423 0 0 0 2 425
West No. of specimens 333 119 0 25 0 477 No. tested positive 253 54 0 9 0 316
North No. of specimens 337 0 3 8 0 348 No. tested positive 273 0 0 1 0 274
Central
West No. of specimens 276 0 4 0 0 280 No. tested positive 171 0 0 0 0 171
North East No. of specimens 345 0 8 2 0 355 No. tested positive 243 0 0 0 0 243
Total No. of specimens 2902 229 54 40 25 3250 No. tested positive 2099 92 0 10 4 2205
ANNUAL REPORT 2012
36
5. Daily Emergency Report
All the country including 34 provinces is under the coverage of Codan Radio System used for
communicating daily emergency health related events. The system was first established and
equipped by WHO inside the ministry of public health and in eight regions in the year 2003.
The system is governed by Central Codan Department located in the ministry of public health
and receives daily reports from all over the country. All the received information is then shared
with the surveillance directorate.
The role of Codan department at a national level includes;
Receiving outbreak reports from the provinces
Receiving seasonal diseases reports from all provinces
Receiving daily reports on natural disasters, explosions, traffic accidents, and other
criminal events
Send and receive the official letters and documents from all provinces
Sharing the information with other relevant directorates of the ministry of public health
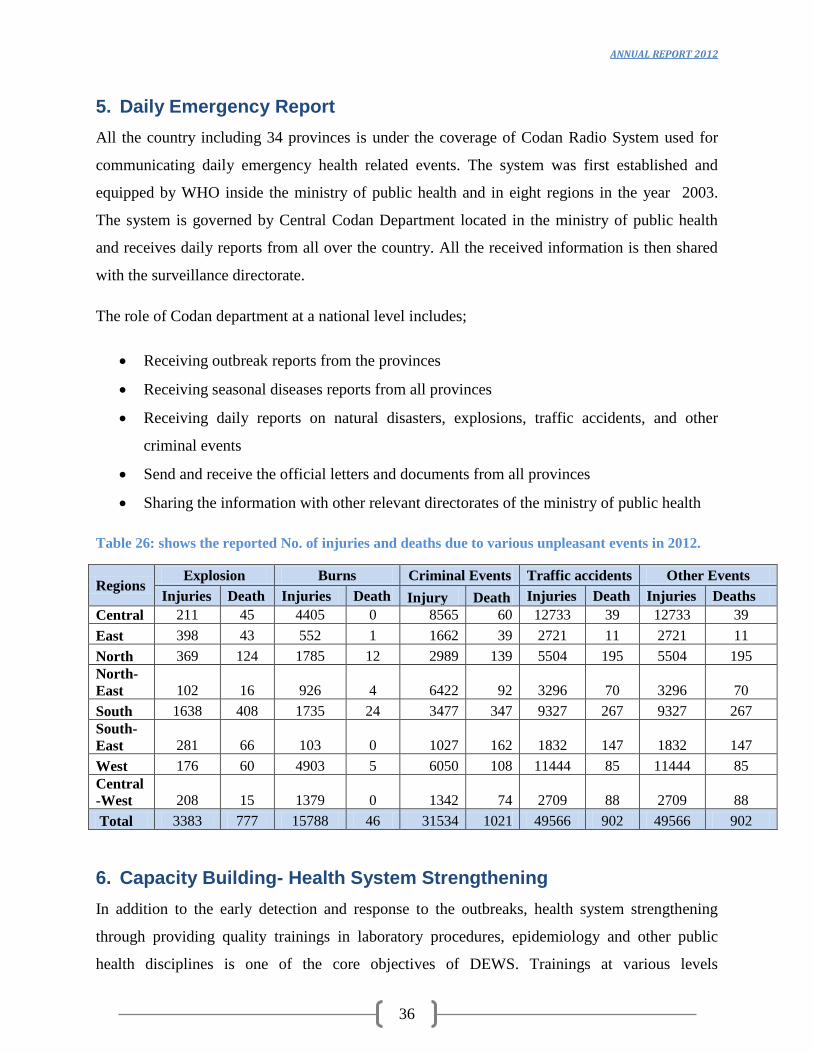
Table 26: shows the reported No. of injuries and deaths due to various unpleasant events in 2012.
Regions Explosion Burns Criminal Events Traffic accidents Other Events
Injuries Death Injuries Death Injury Death Injuries Death Injuries Deaths
Central 211 45 4405 0 8565 60 12733 39 12733 39
East 398 43 552 1 1662 39 2721 11 2721 11
North 369 124 1785 12 2989 139 5504 195 5504 195 North-
East 102 16 926 4 6422 92 3296 70 3296 70
South 1638 408 1735 24 3477 347 9327 267 9327 267 South-
East 281 66 103 0 1027 162 1832 147 1832 147
West 176 60 4903 5 6050 108 11444 85 11444 85 Central
-West 208 15 1379 0 1342 74 2709 88 2709 88
Total 3383 777 15788 46 31534 1021 49566 902 49566 902
6. Capacity Building- Health System Strengthening
In addition to the early detection and response to the outbreaks, health system strengthening
through providing quality trainings in laboratory procedures, epidemiology and other public
health disciplines is one of the core objectives of DEWS. Trainings at various levels

ANNUAL REPORT 2012
37
(international and national) have been provided to the DEWS team in 2011. The details of the all
trainings have been provided below;
6.1. International Trainings
Distance MPH course for 12 MoPH staff in Judah- Pur University (India)
IHR online course for 2 MoPH staff
Participation of DEWS staff in different inter-country meetings.
Environmental sampling course for 60 DEWS staff.
TOT on Measles operational guidelines for EPI, CDC, DEWS and Polio.
Training on Measles operational guidelines for EPI, CDC, DEWS and Polio.
6.2. National level Trainings
Outbreak Investigation and Response Training for provincial DEWS and CDC officers,
WHO polio staff and NGOs
Water Quality Testing Training for DEWS and CDC provincial officers
6 Coordination meetings and DEWS refresher trainings
Rapid response team training for 5 DEWS staff in Amman, Jordan
Advance rapid response team training for 2 DEWS staff in Amman, Jordan
6.3. Tools, Guidelines and SOPs
In 2012, most of the DEWS existing tools were revised, some operational guidelines and first
draft of Policy and Strategy of Surveillance/DEWS were developed. DEWS tools include
outbreak investigation form, DEWS weekly surveillance form, Measles case reporting form,
Codan daily reporting form, outbreak line list form, Lab request form, Influenza Lab request
form and Influenza surveillance forms. Operational guidelines for Cholera and Measles epidemic
response were newly developed.
Existing guidelines include DEWS Manual containing guidelines for 28 diseases on surveillance
and response to outbreaks, fact sheets for health workers, health education material for each
disease, Measles surveillance and response Guideline, influenza surveillance guidelines, toolkit
for early detection and response to outbreaks of Influenza A(H1N1) and toolkit for early
detection and control of human cases of Avian Influenza.

ANNUAL REPORT 2012
38
7. DEWS indicators
Table 27 indicates DEWS achievements based on the seven indicators on quarterly base for the
whole year as well as the average calculation of the indicators, baseline at 2007 and target.
Table 27: DEWS achievements based on the indicators
S.N
o Indicator Q1 Q2 Q3 Q4
Total
/Average
Base
line
2007 Target
1 Percentage of weekly report
arrived from sentinel sites to
national level timely 99.8% 99.7% 99.9% 99.8%
99.8% 100% >90%
2
Percentage of timely
compilation, analysis and
dissemination of weekly
report at the national level
100.0% 100.0% 100.0% 100.0% 100.0%
95% >90%
3 Percentage of outbreaks
investigated within 48 hours
of notification 97.2% 100% 98.5% 97.4%
98.24% 80-
90% >90%
4 Percentage of attendance of
DEWS in monthly PHCC
meetings 95.92% 97.94% 98.95% 98.95%
97.94% NA >90%
5 Number of DEWS
coordination meeting hold at
the national level 1 1 1 1 4 11 6
6
Percentage of serum
specimens collected for
measles/Rubella reached to
CPHL in good condition
(Adequate specimen)
96.5% 97.7% 95.0% 97.5% 96.6% 61% >80%
7 Number of specimen
confirmed by reference
laboratory 20 20 20 40 100 NA >10%

ANNUAL REPORT 2012
39
Conclusion
This report concludes that communicable diseases are still major health threatfor the people of
Afghanistan. Communicable diseases represent the larger portion of the OPD and IPD
consultations that most of them can be easily prevented by cheaply available vaccines. For
certain diseases there has been somere duction in the incidence and number of cases through
concerted prevention and control strategies. The current high numbers of infectious diseases
cases, outbreaks and deaths illustrate the need for research in local perspectives on the
determinants of health and disease in the country. The current high burden of communicable
diseases in Afghanistan may largely be due to the armed conflict, damaged health infrastructure,
insufficient skilled health staff, poverty, illiteracy, inadequate housing and poor environmental
conditions. Malnutrition in children less than five years old also plays an important role in
sufferings from most communicable diseases. Inequity in health along is crucial impendent in
combating the infectious disease. Inaccessibility to the primary health care and weak referral
system also contribute to the persistence of the communicable disease. Children less than five
years old accounted for more than half of the reported cases for the majority of the DEWS
targeted diseases.

ANNUAL REPORT 2012
40
Annexes
Annex1: Weekly Report Format and Case Definitions
Weekly Report Format
Surveillance Reporting Form for Morbidity and Mortality
Province Name/Code: District Name/Code:
Town/Village/Camp: Facility Name/Code: NGO/Donor:
Epidemiological Week___ from Saturday: _____/_____/ to Friday____/____/2011 Submission
Date: ___/____/____ Contact‟s Name & phone #…
Disease/Condition
<5 years ≥5 years
Male Female Male Female
Case Death Case Death Case Death Case Death
1 ARI- Cough and cold
2 ARI- Pneumonia
3 Acute Watery Diarrhea
4 Acute Bloody Diarrhea
5 AWD w Dehydration
6 Susp. Meningitis /SIC
7 Susp. Acute Viral Hepatitis
8 Susp. Measles
9 Susp. Pertussis
10 Probable Diphtheria
11 Tetanus/ Neonatal Tetanus
12 Acute Flaccid Paralysis
13 Susp. Malaria
14 Susp. Typhoid Fever
15 Susp. Hemorrhagic Fever
16 Pregnancy-related deaths
DEWS Disease
TOTAL New Clients/ Deaths
Please include only those cases that were examined / admitted during the surveillance week and deaths that
occurred during the surveillance week. Each case should be counted only once.
Write “0” (zero) if you had no case or death of any of the Health Events listed in the form.
Deaths should be reported only under “Deaths”, NOT under “Cases”, and please fill the following table for each
reported death.
S.N. Name Age Sex Cause Residence/ Address
1 2 3

ANNUAL REPORT 2012
41
Case Definitions
1. Cough and Cold: Acute onset of cough, cold, coryza (runny nose), pharyngitis, laryngitis,
bronchitis, or bronchiolitis with or without fever.
Influenza-Like Illness (ILI): Acute onset of fever >38deg C. with cough and/or sore
throat. Patient should have measurable fever when sample is taken.
Suspected Avian Influenza: Influenza-like illness in person who has had contact with
birds/poultry in previous week, especially living or visiting an area with sickness or death
in poultry.Confirmed case: Throat swab positive for H5 avian influenza.
2. Pneumonia: In adults:fever and crepitation or bronchial sounds on chest auscultation. In
children <5 years old, cough with chest indrawing and/ or fast breathing: More than:
60/min in infants <2 months, 50/min in infants 2-12 months, 40/min in children > 1
year.
3. Acute Watery Diarrhea:Three or more abnormally loose or fluid stools in the past 24
hours with or without fever or mucous, but without dehydration.
4. Acute Bloody Diarrhea (Dysentery): Acute Diarrhea with visible blood in the stool.
Suspected Shigellosis: Bloody diarrhea, fever, stomach cramps in 5 or more connected
cases.Confirmedcase:Isolation of Shigelladysenteriaetype 1 in stool sample.
5. Acute Watery Diarrhea with dehydration: Acute or Bloody Diarrhea with dehydration.
Suspected Cholera:Anyone over 5 years old with severe dehydration or death from
acute watery diarrhea with or without vomiting.Confirmed case: Isolation of Vibrio
cholera O1 Inaba or 01 Ogawa or O139 from diarrheal stool sample.
6. Suspected Meningitis: Sudden onset of fever (>38.5) with stiff neck, and altered
consciousness or other meningeal sign or petechial or purpural rash. See HMIS definition of
Severely Ill Child (SIC). Signs of suspected meningitis in infants are fever and bulging
fontanelle.
7. Suspected Acute Viral Hepatitis: Illness with acute onset of yellow skin and conjunctiva
(jaundice), dark urine, and fatigue. Also anorexia, nausea, malaise, and right upper
quadrant tenderness.
8. Suspected Measles: Maculopapular rash for at least 3 days, with fever and cough, runny
nose or conjunctivitis or any person in whom a clinician suspects measles infection.
Confirmed case: Suspected case with positive serum IgM and no measles vaccination in
prior 28 days.
9. Suspected Pertussis: A person with a cough lasting at least two weeks with one of the
following: Paroxysms (i.e. fits) of coughing; or inspiratory “whoop”; or post-tussive
vomiting (i.e. vomiting immediately after coughing) AND without other apparent cause.
10. Probable Diphtheria: An acute illness characterized by an adherent membrane on the
tonsils, pharynx and/ or nose and any one of the following: laryngitis, pharyngitis or
tonsillitis.
11. Tetanus: One or more of the following signs: Trismus of the facial muscles (masseter)
and neck/ risussardonicus, painful muscular contractions.
Suspected Neonatal Tetanus: Any neonatal death between 3-28 days of age in which
the cause of death is unknown or not investigated.Confirmed: Any neonate with a

ANNUAL REPORT 2012
42
normal ability to suck and cry during the first two days of life, and who between 3 and 28
days of age cannot suck normally and becomes stiff and/or has convulsions.
12. Acute Flaccid Paralysis: Sudden floppy paralysis in a child aged < 15 years, including
GuillainBarré syndrome, or any person with paralytic illness at any age when polio is
suspected.
13. Suspected Malaria: Fever or history of fever >38°C within the last 48 hours with at least
one other symptom: chills, sweats, nausea, vomiting, headache, back pain, or myalgia. In
uncomplicated falciparum malaria, diarrhea and cough are common.
14. Suspected Typhoid Fever: Continuous high fever with any of the following: relative
bradycardia, rose spots, prostration, diarrhea or constipation, abdominal pain, splenomegaly,
or leucopenia and positive Widal test on the 8th
-10th
day.
15. Suspected Acute Hemorrhagic Fever: Acute febrile illness of more than 72 hours and
less than 10 days duration and any two of the following: Thrombocytopenia less than
100,000 / mm3, petechial or purpuric rash, epistaxis, hematemesis, hemoptysis, blood in
stools, ecchymosis, gum bleeding, other hemorrhagic symptom AND no known
predisposing host factors.
16. Pregnancy-related Death: Death of a woman while pregnant or within 42 days of
termination of pregnancy, irrespective of the duration and site of the pregnancy, from any
cause related to or aggravated by the pregnancy or its management but not from accidental
or incidental causes.
Total New Clients: This is taken directly from the HMIS Tally Sheet and is used
as a proxy for the population denominator when calculating rates.

ANNUAL REPORT 2012
43
Annex-2: Supplementary data
Table 28: Cough and Cold/Pneumonia cases by province
No. of cough and cold cases and its percentage of total consultations
No. of Pneumonia cases and its percentage of total consultations
Province
Cases Percentage
Province
Cases Percentage
Kapisa 58787 27.1 Sari Pul 22967 8.7
Logar 82635 25.9 Jawzjan 42897 8.6
Nuristan 25137 25.3 Baghlan 19871 7.0
Khost 59382 24.2 Nuristan 5391 5.4
Kunar 122994 24.1 Bamyan 11554 5.0
Daykundi 55986 22.8 Samangan 12830 4.8
Faryab 109627 22.0 Laghman 15449 4.8
Nangarhar 276908 21.3 Balkh 27989 4.5
Paktya 65157 21.2 Wardak 11096 4.3
Balkh 126148 20.2 Logar 12941 4.0
Wardak 51661 20.2 Badakhshan 16102 4.0
Baghlan 55391 19.5 Takhar 15013 3.9
Hirat 160050 19.5 Kabul 101962 3.8
Bamyan 45100 19.4 Kunduz 11459 3.7
Kunduz 58789 18.9 Daykundi 8449 3.4
Parwan 42659 18.8 Kunar 17470 3.4
Paktika 36533 18.8 Faryab 15796 3.2
Ghazni 63639 18.3 Panjsher 4757 3.0
Panjsher 28408 18.0 Kapisa 6262 2.9
Samangan 47108 17.5 Nangarhar 33676 2.6
Jawzjan 85569 17.1 Ghor 7343 2.5
Sari Pul 44339 16.8 Badghis 5081 2.4
Badakhshan 68007 16.7 Paktika 4599 2.4
Kandahar 72304 16.6 Kandahar 9445 2.2
Takhar 63364 16.3 Paktya 6256 2
Hilmand 56648 16.3 Hilmand 6925 2
Nimroz 26924 15.8 Khost 4813 2
Laghman 50217 15.4 Parwan 4096 2
Uruzgan 43931 14.3 Ghazni 6122 2
Zabul 24370 14.1 Nimroz 2207 1
Badghis 28997 13.9 Hirat 9929 1
Kabul 373166 13.8 Farah 2536 1
Ghor 38995 13.2 Zabul 1466 1
Farah 23103 11.0 Uruzgan 2430 1
Total 2572033 Total 487179

ANNUAL REPORT 2012
44
Table 29: Acute Watery Diarrhea/ AWDWD cases by province
No. of AWD cases and its % of total consultations
No. of AWDwD cases and its % of total consultations
Province Cases Percentages Province Cases Percentages
Paktya 36313 11.8 Uruzgan 6881 2.2
Samangan 31852 11.8 Hilmand 6388 1.8
Baghlan 31308 11.0 Nangarhar 23509 1.8
Nimroz 18118 10.6 Laghman 5504 1.7
Nuristan 10024 10.1 Paktya 4358 1.4
Laghman 32665 10.0 Kandahar 5485 1.3
Ghazni 33780 9.7 Khost 2716 1.1
Kandahar 41678 9.6 Paktika 1738 0.9
Jawzjan 46395 9.3 Kunduz 2772 0.9
Badghis 19012 9.1 Parwan 1954 0.9
Hilmand 31727 9.1 Nimroz 1360 0.8
Zabul 15421 9.0 Ghazni 2614 0.8
Daykundi 20785 8.5 Kunar 3690 0.7
Kapisa 18272 8.4 Baghlan 1998 0.7
Hirat 67882 8.3 Kabul 18827 0.7
Farah 16422 7.8 Bamyan 1599 0.7
Logar 24909 7.8 Sari Pul 1593 0.6
Ghor 22848 7.7 Zabul 1004 0.6
Faryab 37419 7.5 Samangan 1502 0.6
Nangarhar 96225 7.4 Logar 1754 0.5
Takhar 28669 7.4 Nuristan 536 0.5
Uruzgan 22244 7.2 Farah 1061 0.51
Parwan 16213 7.2 Balkh 3146 0.50
Kunduz 21685 7.0 Daykundi 1209 0.49
Sari Pul 18301 6.9 Takhar 1815 0.5
Badakhshan 27983 6.9 Jawzjan 2245 0.4
Paktika 13396 6.9 Wardak 951 0.4
Khost 16234 6.6 Ghor 1005 0.3
Balkh 40324 6.5 Badakhshan 1228 0.3
Kunar 29284 5.7 Hirat 2282 0.3
Kabul 143693 5.3 Faryab 1120 0.2
Wardak 13533 5.3 Badghis 354 0.2
Bamyan 12295 5.3 Panjsher 94 0.1
Panjsher 7166 4.6 Kapisa 80 0.0
Total 1064075 Total 114372

ANNUAL REPORT 2012
45
Table 30: Acute Bloody Diarrhea/Malaria cases by province
No. of Acute Bloody Diarrhea cases and its % of total consultations
No. of Malaria cases and its % of total consultations
Province Cases Percentage Province Cases Percentage
Kandahar 17487 4.0 Kunar 10227 2.01
Nuristan 3762 3.8 Nangarhar 24222 1.87
Laghman 11656 3.6 Paktika 3536 1.82
Wardak 7479 2.9 Laghman 4161 1.28
Jawzjan 14146 2.8 Paktya 3034 0.99
Baghlan 7856 2.8 Hilmand 3372 0.97
Nangarhar 34947 2.7 Khost 2154 0.88
Kunar 13141 2.6 Nuristan 809 0.81
Khost 6083 2.5 Zabul 1336 0.78
Balkh 15224 2.4 Badakhshan 1890 0.47
Ghazni 8400 2.4 Jawzjan 2193 0.44
Sari Pul 5901 2.2 Ghazni 1480 0.43
Kapisa 4281 2.0 Balkh 2636 0.42
Logar 6226 1.9 Badghis 730 0.35
Paktika 3771 1.9 Kandahar 1152 0.26
Zabul 3297 1.9 Uruzgan 779 0.25
Kunduz 5822 1.9 Daykundi 560 0.23
Hilmand 6480 1.9 Logar 526 0.16
Paktya 5393 1.8 Panjsher 230 0.15
Faryab 8544 1.7 Wardak 356 0.14
Bamyan 3956 1.7 Takhar 488 0.13
Badghis 3507 1.7 Kapisa 262 0.12
Nimroz 2850 1.7 Sari Pul 261 0.10
Parwan 3595 1.6 Parwan 191 0.08
Daykundi 3867 1.6 Nimroz 143 0.08
Badakhshan 6352 1.6 Kabul 2123 0.08
Uruzgan 4766 1.6 Kunduz 68 0.02
Samangan 4052 1.5 Hirat 149 0.02
Takhar 5820 1.5 Ghor 40 0.01
Farah 2854 1.4 Bamyan 28 0.01
Ghor 3883 1.3 Farah 23 0.01
Panjsher 1611 1.0 Samangan 28 0.01
Hirat 7489 0.9 Faryab 14 0.00
Kabul 24417 0.9 Baghlan 2 0.00
Total 268915 Total 69203

ANNUAL REPORT 2012
46
Table 31: Suspected Meningitis/Severely Ill Child and Measles cases by province, 2012
No. of Suspected Meningitis/ SIC cases and
its % out of total consultations No. of Suspected Measles cases and its % out
of total consultations
Province Cases Percentage Province Cases Percentage
Bamyan 349 0.15 Nangarhar 3152 0.24
Jawzjan 682 0.14 Khost 532 0.22
Hilmand 446 0.13 Nuristan 193 0.19
Balkh 800 0.13 Wardak 355 0.14
Logar 383 0.12 Paktya 394 0.13
Takhar 324 0.08 Balkh 771 0.12
Kunduz 241 0.08 Hilmand 386 0.11
Ghazni 248 0.07 Kunduz 303 0.10
Kabul 1875 0.07 Laghman 290 0.09
Hirat 535 0.07 Zabul 116 0.07
Badghis 127 0.06 Kabul 1540 0.06
Faryab 300 0.06 Paktika 94 0.05
Baghlan 157 0.06 Logar 153 0.05
Sari Pul 145 0.06 Jawzjan 215 0.04
Kandahar 227 0.05 Daykundi 105 0.04
Samangan 117 0.04 Bamyan 97 0.04
Kunar 205 0.04 Uruzgan 126 0.04
Nangarhar 462 0.04 Kandahar 177 0.04
Badakhshan 140 0.03 Kapisa 88 0.04
Khost 62 0.03 Ghor 117 0.04
Wardak 60 0.02 Takhar 128 0.03
Parwan 32 0.01 Kunar 162 0.03
Laghman 44 0.01 Baghlan 85 0.03
Paktika 22 0.01 Hirat 195 0.02
Daykundi 25 0.01 Parwan 48 0.02
Paktya 30 0.01 Ghazni 65 0.02
Panjsher 15 0.01 Badakhshan 66 0.02
Farah 20 0.01 Nimroz 27 0.02
Ghor 16 0.01 Panjsher 21 0.01
Nimroz 7 0.00 Badghis 21 0.01
Zabul 6 0.00 Samangan 23 0.01
Nuristan 3 0.00 Faryab 33 0.01
Uruzgan 9 0.00 Sari Pul 14 0.01
Kapisa 5 0.00 Farah 2 0.00
Total 8119 Total 10094

ANNUAL REPORT 2012
47
Table 32: Provinces with the number of reported Hemorrhagic fever cases
Sl.
No. Province No. of Hemorrhagic Fever cases 1 Hirat 14 2 Parwan 14 3 Paktika 13 4 Nimroz 12 5 Kapisa 11 6 Logar 8 7 Hilmand 6 8 Faryab 5 9 Paktya 5 10 Kabul 5 11 Zabul 4 12 Badghis 4 13 Panjsher 4 14 Nuristan 4 15 Balkh 3 16 Khost 3 17 Ghazni 2 18 Jawzjan 2 19 Kandahar 2 20 Kunduz 2 21 Nangarhar 2 22 Takhar 2 23 Samangan 1
Total 128

ANNUAL REPORT 2012
48
Table 33: Number of outbreaks/ percentage by province
S.N Province No. of outbreaks % of outbreaks
1 Hirat 34 10.5 2 Paktika 27 8.3 3 Nangarhar 26 8.0 4 Kandahar 23 7.1 5 Paktya 21 6.5 6 Kabul 16 4.9 7 Zabul 15 4.6 8 Khost 13 4.0 9 Balkh 12 3.7 10 Uruzgan 12 3.7 11 Bamyan 11 3.4 12 Badakhshan 11 3.4 13 Nuristan 10 3.1 14 Ghor 10 3.1 15 Kunar 8 2.5 16 Hilmand 7 2.2 17 Kapisa 7 2.2 18 Takhar 7 2.2 19 Daykundi 6 1.8 20 Parwan 6 1.8 21 Jawzjan 5 1.5 22 Ghazni 5 1.5 23 Nimroz 5 1.5 24 Laghman 4 1.2 25 Logar 4 1.2 26 Wardak 3 0.9 27 Kunduz 3 0.9 28 Samangan 3 0.9 29 Faryab 3 0.9 30 Sari Pul 3 0.9 31 Baghlan 2 0.6 32 Badghis 2 0.6 33 Panjsher 1 0.3 34 Farah 0 0.0
Total 325 100

ANNUAL REPORT 2012
49
Table 34: Number of measles outbreaks by province
Province No of Measles
Outbreaks Cases Percentages
No. of Associated
Cases Percentages
Paktika 24 11.3 214 6.3
Nangarhar 21 9.9 312 9.2
Paktya 21 9.9 348 10.3
Zabul 13 6.1 168 5.0
Kandahar 12 5.6 150 4.4
Uruzgan 12 5.6 211 6.2
Hirat 11 5.2 292 8.6
Khost 10 4.7 367 10.8
Balkh 9 4.2 91 2.7
Ghor 9 4.2 344 10.2
Kunar 8 3.8 107 3.2
Kabul 6 2.8 115 3.4
Takhar 6 2.8 88 2.6
Nuristan 5 2.3 50 1.5
Parwan 5 2.3 36 1.1
Jawzjan 5 2.3 42 1.2
Kapisa 4 1.9 42 1.2
Daykundi 4 1.9 42 1.2
Ghazni 4 1.9 64 1.9
Bamyan 3 1.4 30 0.9
Hilmand 3 1.4 17 0.5
Logar 3 1.4 45 1.3
Wardak 3 1.4 59 1.7
Kunduz 3 1.4 48 1.4
Badakhshan 2 0.9 21 0.6
Nimroz 2 0.9 31 0.9
Laghman 2 0.9 22 0.6
Sari Pul 2 0.9 26 0.8
Baghlan 1 0.5 7 0.2
Samangan 0 0 0 0
Faryab 0 0 0 0
Badghis 0 0 0 0
Panjsher 0 0 0 0
Farah 0 0 0 0
Total 213 100 3389 100
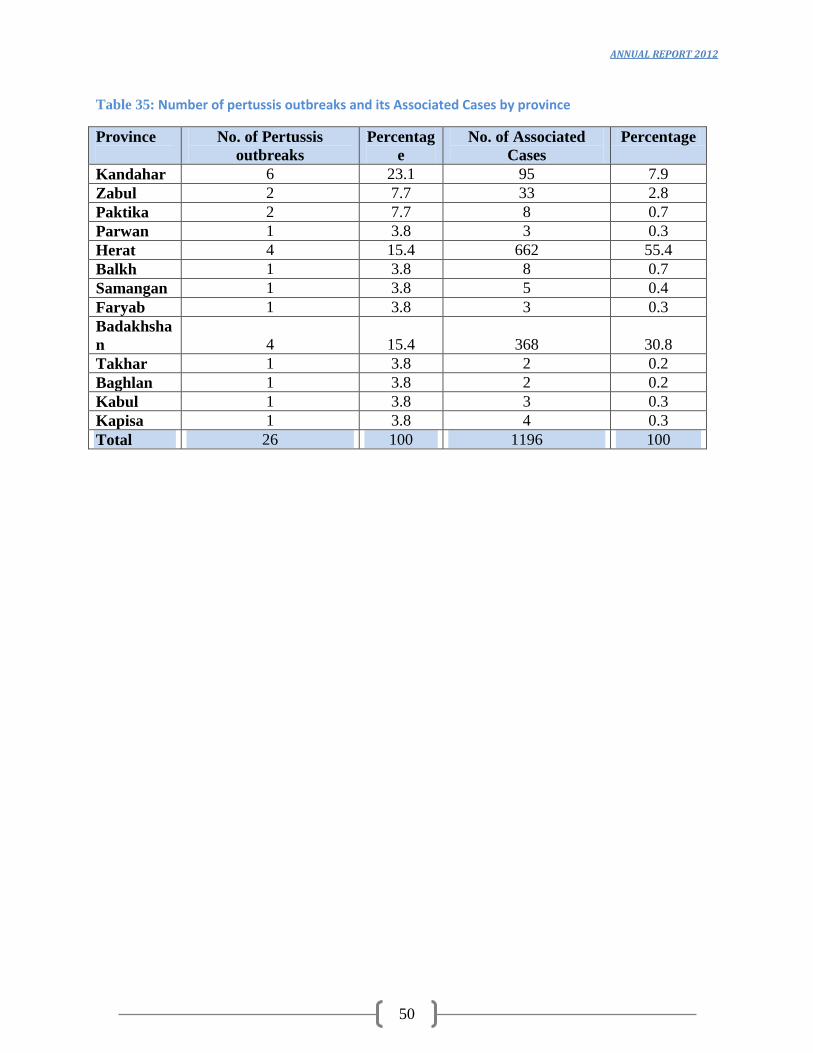
ANNUAL REPORT 2012
50
Table 35: Number of pertussis outbreaks and its Associated Cases by province
Province
No. of Pertussis
outbreaks
Percentag
e
No. of Associated
Cases
Percentage
Kandahar 6 23.1 95 7.9
Zabul 2 7.7 33 2.8
Paktika 2 7.7 8 0.7
Parwan 1 3.8 3 0.3
Herat 4 15.4 662 55.4
Balkh 1 3.8 8 0.7
Samangan 1 3.8 5 0.4
Faryab 1 3.8 3 0.3
Badakhsha
n 4 15.4 368 30.8
Takhar 1 3.8 2 0.2
Baghlan 1 3.8 2 0.2
Kabul 1 3.8 3 0.3
Kapisa 1 3.8 4 0.3
Total 26 100 1196 100

ANNUAL REPORT 2012
51
Table 36: Emergency Cases reported daily from all provinces through RadioCodan
Province Explosion Burn Criminal Traffic Natural
Injury Death Injury Death Injury Death Injury Death Injury Death
Badakhshan 25 1 51 0 471 1 325 4 21 3
Badghis 36 6 413 5 805 10 1165 3 0 0
Baghlan 47 10 153 2 1297 40 1119 42 11 8
Balkh 73 28 20 0 79 24 536 71 0 0
Bamian 0 0 136 0 307 1 187 0 9 3
Daikondy 2 1 44 0 84 1 162 21 12 16
Farah 84 42 303 0 795 25 1448 14 0 0
Faryab 158 74 571 6 1169 73 1476 35 0 0
Ghazni 77 27 73 0 423 108 773 115 0 0
Ghor 13 0 411 0 538 14 1027 4 0 0
Hilmand 56 5 512 0 721 0 1488 1 0 0
Hirat 43 12 3776 0 3912 59 7804 64 0 0
Jawzjan 45 1 868 3 368 7 2043 41 18 2
Kabul 96 7 4136 0 7653 11 10971 22 0 0
Kandahar 1136 253 311 20 1903 261 5386 198 11 6
Kapisa 30 14 155 0 566 9 820 5 6 0
Khost 89 21 17 0 132 28 480 8 0 0
Kunarha 112 7 8 0 113 11 120 4 5 0
Kundoz 30 5 319 1 1168 37 565 19 0 0
Laghman 27 19 39 0 586 23 877 2 0 0
Logar 83 24 76 0 272 40 795 11 0 1
Wardak 189 11 8 0 162 21 290 12 0 0
Neemroz 172 49 709 4 454 25 987 16 0 0
Ningarhar 256 17 505 1 960 2 1723 4 0 0
Nooristan 3 0 0 0 3 3 1 1 0 45
Orozgan 179 73 5 0 297 37 720 7 0 0
Paktia 75 11 2 0 141 16 162 10 0 0
Paktika 40 7 11 0 331 10 417 14 0 0
Panjsheer 2 0 38 0 74 0 147 1 1 2
Parwan 17 3 1191 0 789 51 2070 55 0 1
Samangan 57 14 302 0 582 9 904 39 14 2
Sar-e-pul 36 7 25 3 794 26 553 9 13 52
Takhar 0 0 402 1 3483 14 1279 5 0 0
Zabul 95 28 198 0 102 24 746 45 0 0 Grand
Total 3383 777 15788 46 31534 1021 49566 902 121 141