
Pareto Principle “The Vital Few and Trivial Many Rule” “Predictable Imbalance” “80:20 Rule”

Malaysian Journal of Library & Information Science, Vol. 24, no.2, August 2019: 97-113
Page | 97 https://doi.org/10.22452/mjlis.vol24no2.6
Is there the Pareto principle in public library circulation?
A case study of one public library in Taiwan
Yi-Ting Yang and Jiann-Cherng Shieh*
Graduate Institute of Library and Information Studies,
National Taiwan Normal University,
No.162, Sec. 1, Hoping East Rd., Da-an District, Taipei 10610, TAIWAN
E-mail: [email protected]; *[email protected] (corresponding author)
ABSTRACT
The Pareto Principle, also known as the 80/20 rule is currently an important and popular management
rule applied to marketing and customer relationship management (CRM). The rule indicates that the
vital few causes inputs or efforts bringing the most results, outputs, or rewards. Analyzing circulation
data to understand the usage status of library collections can help libraries comprehend their patrons’
behaviour. However, little research has been done to analyse circulation data of public libraries to
reveal patrons’ usage behaviours. This paper aimed to analyse the circulation data generated by a
municipality public library in Taiwan to gauge if the Pareto Principle manifested in this context.
Subsequently, using bibliomining analysis, this research further identified vital patrons and their
characteristics, as well as book-borrowed distributions to help analyse patrons' book borrowing
behaviour to improve the efficiency of library management and library marketing as well as CRM. The
circulation data of the public library follows the Pareto Principle, approximating to the 80/20 rule.
Findings showed that when the accumulative percentage of patron is 24.7 percent, the accumulative
percentage of borrowed books is 75.3 percent. The vital few patrons borrow the majority of the
collections. This paper is the first study to reveal that the Pareto Principle could be found in circulation
data of a public library in Taiwan. It could help libraries identify vital patrons and major collections,
and improve the efficiency of their management and marketing activities in future. For other types of
libraries, it would be interesting for us to explore the existence of the Pareto Principle further.
Keywords: Pareto Principle; 80/20 Rule; Book loan behaviour; Public Libraries; Bibliomining.

Yang, Y.T. & Shieh, J.C.
Page | 98
INTRODUCTION
In recent years, the concept of the Pareto Principle has become a popular guideline or tool
in multiple business areas and the social context. The 80/20 rule indicates that there is an
unbalanced relationship between causes and results or between efforts and rewards:
specifically, it maintains that 80 percent of rewards usually come from 20 percent of efforts,
and the other 80 percent of efforts only produce 20 percent of the results. Therefore, if one
could recognize, focus on, and control the vital 20 percent of efforts, her or she would obtain
greater profits or efficiency. Similarly, if one could reform the 80 percent of effort exerted in
vain, he or she would decrease losses. Many natural phenomena have been shown
empirically to exhibit such a distribution.
Can the Pareto Principle be applied in the library and information service context? In recent
years, a great deal of research has analysed library data and uncovered a variety of trends,
patterns, and relationships. Bibliomining, or data mining in libraries, is the application of data
mining techniques to data produced from library services (Nicholson 2003; Nicholson 2006;
Shieh 2009). By applying statistics, bibliometrics, or data mining tools, libraries can better
understand usage patterns and rules, enabling library managers to make decisions to meet
user needs based on those mining results (Arsenova 2013; Zhang and Wang 2013; Xiang and
Hao 2014; Hajek and Stejskal 2017). However, quality decisions must be based on quality
data. Data processing is an important step in the knowledge discovery process (Han, Pei and
Kamber 2011; Pandey 2014; Bajpai and Metkewar 2016). Identifying vital data and reducing
the data to be analysed can lead to huge decision-making payoffs. Identifying vital patrons
and core collections would allow library managers to provide better services.
Examining checkout distributions of circulation data helps libraries understand user
behaviours. Previous discussions of data mining applications in academic libraries have
emphasized usage analysis (Siguenza-Guzman et al. 2015). There have been a number of
studies that have investigated usage analysis of academic libraries (Ahmad, Brogan and
Johnstone 2014; Ping 2015; Al-Daihani and Abrahams 2016; Wu, Hu and Wang 2017).
Renaud et al. (2015) analysed data from a university library and revealed the distributions of
check-out activities based on criteria such as user type, academic department, Library of
Congress classification, material type and material life span. They also correlated the findings
with student grade point averages. Goodall and Pattern (2011) analysed the usage data of
electronic resources, book loans, and visits in an academic library and correlated these data
points with academic achievement. However, previous studies have mostly neglected to
analyse circulation data in public libraries. In comparison with academic libraries, public
libraries provide services to a wide range of users. Before data mining and data analytics,

Is there the Pareto Principle in Public Library Circulation?
Page | 99
segmenting these various users and collections would conduct meaningful results. At present
research focusing on this issue is still uncommon.
This study aims to discern if there are vital few patrons who borrow most of the collection,
and to identify the vital patrons and their characteristics and book-borrowed distributions.
Specifically, the objective of this study is to analyse the circulation data of public libraries and
to examine whether the phenomenon of Pareto Principle could be found. If the Pareto
Principle as conceptualized for this study could, in fact, be used to study patron patterns, this
rule can serve as a much needed tool for public libraries to target patrons and effectively
market their services. In view of the objective outlined above, three research questions are
posed:
(a) Does the phenomenon of Pareto Principle manifest in the circulation data of public
libraries? What is the percentage breakdown?
(b) Applying the 80/20 rule, what are the characteristics of the top 20 percent vital
patrons?
(c) Applying the 80/20 rule, what are the characteristics of the collections borrowed by
the top 20 percent vital patrons?
LITERATURE REVIEW
The 80/20 rule originated from the Pareto Principle, named after the Italian economist
Vilfredo Pareto who identified a general imbalance in property allocation: most (80%) wealth
belongs to a few (20%) people. This model of imbalance has been observed repeatedly (Koch
1998; Nash 2016). In 1941, management consultant Joseph M. Juran applied this principle
to quality management issues. He believed the principle of “the vital few and the trivial many”
was universal (Koch 1998). In the late 1940s, Juran named his notion of “the vital few and
the trivial many” as Pareto Principle after the Italian economist. The 80/20 rule is an
extension of the Pareto Principle developed by Richard Koch based on a theoretical view of
Pareto and Juran, which he publicized in “The 80/20 Rule Principle – The Secret of Achieving
More with Less.” Koch (1998) noted that few causes, inputs, or efforts could bring most
results, outputs, or rewards. The 80/20 rule indicates that there is always an imbalance
between causes and results, between inputs and outputs, or between efforts and rewards.
The relationship between 80 percent and 20 percent provides a credible point of this
phenomenon of imbalance: generally, 80 percent of outputs come from 20 percent inputs;
80 percent of results come from 20 percent of causes; and 80 percent of achievements come
from 20 percent of efforts.

Yang, Y.T. & Shieh, J.C.
Page | 100
Koch (1998) pointed out that the 80/20 rule could be applied in either the business or social
context and in various fields. For example In business, 80 percent of a company’s profits
come from 20 percent of its customers, 80 percent of revenues come from 20 percent of the
products, and 80 percent of sales come from 20 percent of the sellers (Koch 1998; Kim, Singh
and Winer 2017). In quality management, 80 percent of the problems come from 20 percent
of the faults (Koch 1998). In computer science, most software takes 80 percent of the time
to run 20 percent of the programs (Koch 1998; Yamashita et al. 2015). In society, 80 percent
of the crimes are 20 percent of the crimes behaviours, and 20 percent of drivers cause 80
percent of traffic accidents (Koch 1998). The unbalanced relationship between efforts and
rewards or causes and results makes delineating the vital few very important. A successful
company uses less effort to achieve high profits. Companies may improve profitability by
reducing outputs or unbalancing employee salaries. To achieve this goal, they must identify
which employees, departments, or units produce the most profits and provide them more
resources, because concentrating on the groups of customers and the specific markets that
are profitable can substantially improve a company’s bottom line, having insight into the vital
few is an important issue. Several studies also have suggested the benefit of applying the
80/20 rule (Yamashita et al. 2015; Kim et al. 2017; Mesbahi, Rahmani and Hosseinzadeh
2017).
The study of the Pareto Principle in libraries was initialized by Trueswell (1969) who applied
the 80/20 rule to address the relationship between library collections and circulation
numbers. Trueswell (1969) noted that about 20 percent of collections bring 80 percent of
circulation numbers (Nash 2016). Hardesty (1981) traced the book acquisitions and
circulations of a university for five years. He found that 30 percent of books accounted for 80
percent of circulation. In recent years, Singson and Hangsing (2013; 2015) analysed usage
patterns of electronic journals academic consortia. They found out that the user downloads
for some publishers follow the 80/20 rule. The few core journals were downloaded the most.
Some research suggested the 80/20 rule could be used to identify the core collections within
libraries. Burrell (1985) investigated the circulation data of university libraries and public
libraries and found between 43 to 58 percent of circulating collections are required to
account for 80 percent of borrowings. He developed a theoretical model of library operations
to help libraries identify their core collections. Nisonger (2008) examined the 80/20 rule in
relation to the use of print serials, downloads from electronic databases, and journal
citations, concluding that the 80/20 rule is a valid method for determining core concepts in
journal collection management. However, few previous studies have explored the
distributions of circulation in public libraries. This study examines a circulation dataset from
a public library in Taiwan and analyses usage patterns to understand the distributions of
patrons and circulations. The purpose is to identify if there are vital patrons in public libraries.

Is there the Pareto Principle in Public Library Circulation?
Page | 101
This study concerns with the marketing of libraries and thus mainly examines the Pareto
Principle based on the patrons’ viewpoint.
MATERIALS AND METHOD
A public library in Taiwan is chosen as the case setting; it is located in a developing city that
has a large area and fast-growing population. There are approximately 30 districts in the city,
each district owns at least one library branch. The main library is located in the same district
with the city government, and there are more than 100 library branches and reading rooms
over the whole city. Reading rooms are small branches with smaller scale, which can serve
in various regions and touch different kinds of people.
There are four types of data used in this study and they come from the following dataset:
(a) Circulation data: This dataset contains more than 18 million transactions conducted
over two years and includes patron ID, item ID, branch library name, and date of
transaction. Transaction types include local-borrow transactions, inter-borrow
transactions and reservations.
(b) Patron data: This dataset contains data about 460,000 patrons, including patron ID,
patron type, name of patron’s branch library, and patron gender and occupation.
(c) Item data: This dataset encompasses all lending items in the public library, including
item ID, title, author, call number, material type, subject code, and the name of the
branch library that houses the item.
(d) Location data: This dataset contains information about each branch library such as
branch name and district.
To preserve data privacy, the data went through pre-processing before they were obtained
and processed by the researchers. The data used for data mining were first processed with
one-way hashing function by the library (the raw data owner) and then the subset data were
provided for the study. Columns that may have identified someone by providing information
such as patron names, addresses, or phone numbers were deleted. Furthermore, patron
corresponding data and branch names had been translated into substituted codes by some
one-way hash functions respectively (Schneier 2015).
This paper analyses public library data to determine if the 80/20 phenomenon of Pareto
Principle manifests in libraries, and then identifies the distributions of the patrons and
circulations. The data processing procedures involve the following:
(a) Integrating circulation data: The local-borrow transactions, inter-borrow
transactions, and reservation data are integtated into one table.

Yang, Y.T. & Shieh, J.C.
Page | 102
(b) Ranking the patrons: The transactions for each patron ID are summed up and then
ranked in the table by the number of transaction.
(c) Calculating the accumulative percentage: The accumulative total of patrons and the
accumulative total of items are calculated; the accumulative percentage are
calculated separately. The accumulative percentage of patrons is the patron
percentage rank divided by the total number of patrons. The accumulative
percentage of items is the percentage of the accumulative total of that item divided
by total number of items.
(d) Examining the circulation data with the Pareto Principle: The datum where the
accumulative percentage of patrons and the accumulative percentage of items is
100% is identified. In addition to the total data from the two years, the data for each
year are examined separately to identify the percentage with the concept of Pareto
Principle in each year.
(e) Analyzing the distributions of circulation data: After identifying the percentage,
the concept of 80/20 rule is used to further analyse the distributions of circulation.
The analysis involves collections borrowed by the top 20 percent of active patrons
and considers the features of these collections such as subject, and material type.
The analysis also takes in the patrons who borrowed 80 percent of items in the
leaderboard and considers the characteristics of these patrons such as gender,
occupation, and districts.
The database system used in this study is Microsoft SQL Server 2014. The data mining and
analysis tools used are Microsoft SQL Server Data Tools (SSDT) and Microsoft Excel 2016
respectively. The researchers adopted a PC workstation with Intel Core i7-7700 CPU, 16G
memory and 1T SSD to support database system operation, data processing and analysis
tasks.
RESULTS AND DISCUSSIONS
The Pareto Principle
The patrons are ranked according to the number of items they borrow and the following are
calculated – the accumulative total of patrons, the accumulative total of items, the
accumulative total percentage of patrons, and the accumulative total percentage of items.
As shown in Table 1, when the accumulative percentage of patrons is 24.69 percent, the
accumulative percentage of items is 75.31 percent. That the accumulative percentage of
patrons and the accumulative percentage of items is 100 percent demonstrates that the
circulation data of the public library follow the Pareto Principle approximating to 80/20 rule.
In other words, the vital few patrons account for most of the borrowings. The data in which

Is there the Pareto Principle in Public Library Circulation?
Page | 103
the accumulative percentage of patrons is 20 percent and the accumulative percentage of
items is 80 percent are also shown in Table 1.
Table 1: Rank of Borrowing and Accumulative Percentage
Borrow Amount Accumulative
patrons Accumulative
items Accumulative
patrons(%) Accumulative
items(%)
3212 1 3212 0.000217507 0.017778698
3159 2 6371 0.000435013 0.035264036
3088 3 9459 0.00065252 0.052356383
3030 4 12489 0.000870027 0.069127695
2990 5 15479 0.001087533 0.085677604
2973 6 18452 0.00130504 0.102133416
≈
56 91950 12534661 19.99973899 69.38043286
56 91951 12534717 19.9999565 69.38074283
56 91952 12534773 20.00017401 69.38105279
56 91953 12534829 20.00039151 69.38136275
≈
44 113496 13606589 24.68613786 75.31364706
44 113497 13606633 24.68635537 75.3138906
44 113498 13606677 24.68657288 75.31413415
44 113499 13606721 24.68679038 75.31437769
≈
35 134910 14453189 29.34382586 79.99965129
35 134911 14453224 29.34404336 79.99984502
35 134912 14453259 29.34426087 80.00003875
35 134913 14453294 29.34447838 80.00023247
≈
This study also analyses the data for each year separately (Table 2). For the first year, when
the accumulative percentage of patrons is 26.76 percent, the accumulative percentage of
items is 73.24 percent, and the sum of these two percentages is 100 percent. For the second
year, when the accumulative percentage of patrons is 26.17 percent, the accumulative
percentage of items is 73.83 percent, and the sum of these two percentages is 100 percent.
Although the percentage is a little different in each year, they can be explained by the 80/20
rule. Overall, the findings indicate that the circulation data of public libraries adhere to the
Pareto Principle.
In summary, the percentage following the 80/20 rule for the two years examined is 75.3/24.7.
For the first year and the second year, the percentages are 73/27 and 74/26 separately. These
findings indicate that a few patrons would borrow the most items in the public library. The
application of 80/20 rule to identify the vital few patrons can significantly improve
organizational efficiency, and the public library managers would certainly benefit from
embracing this approach. In doing so, they could not only improve utilization but also give
vital patrons more proper services.

Yang, Y.T. & Shieh, J.C.
Page | 104
Table 2: Rank of Borrowing and Accumulative Percentage of Each Year
First Year Second Year
Bo
rrow
Am
ou
nt
Accu
mu
lative patro
ns
Accu
mu
lative item
s
Accu
mu
lative patro
ns(%
)
Accu
mu
lative item
s(%)
Bo
rrow
Am
ou
nt
Accu
mu
lative patro
ns
Accu
mu
lative item
s
Accu
mu
lative patro
ns(%
)
Accu
mu
lative item
s(%)
3212 1 3212 0.000302 0.039732 2386 1 2386 0.000295 0.023902
3159 2 6371 0.000605 0.078808 2048 2 4434 0.000591 0.044418
3030 3 9401 0.000907 0.116288 1605 3 6039 0.000886 0.060497
2973 4 12374 0.001209 0.153064 1346 4 7385 0.001182 0.073981
2119 5 14493 0.001511 0.179275 1328 5 8713 0.001477 0.087284
2013 6 16506 0.001814 0.204176 1328 6 10041 0.001773 0.100588
≈ ≈
36 66166 5226147 19.99952 64.64627 43 67681 6588491 19.99953 66.00144
36 66167 5226183 19.99982 64.64672 43 67682 6588534 19.99982 66.00187
36 66168 5226219 20.00012 64.64716 43 67683 6588577 20.00012 66.0023
36 66169 5226255 20.00042 64.64761 43 67684 6588620 20.00041 66.00273
≈ ≈
27 88518 5921206 26.75569 73.244 32 88568 7369750 26.17157 73.82784
27 88519 5921233 26.756 73.24433 32 88569 7369782 26.17187 73.82816
27 88520 5921260 26.7563 73.24467 32 88570 7369814 26.17216 73.82848
27 88521 5921287 26.7566 73.245 32 88571 7369846 26.17246 73.8288
≈ ≈
The Top 24.7 Percent Patrons
(a) Statistical Analysis of Patrons
After establishing that public library data conform to the 80/20 rule, the distributions of
patrons are analysed to determine the characteristics of the top 20 percent active patrons
and the features of the 80 percent collections they borrowed from. The two-year dataset for
the Taiwan public library includes about 460,000 patrons who borrowed at least one item.
Therefore, the top 24.7 percent is composed of about 115,000 patrons who borrowed at
least 44 items. Applying the 80/20 rule, these patrons are active users of the library.
Identifying and understanding these patrons may help the library target users and market
library services to them efficiently.
The characteristics of these top 24.7 percent of patrons are analysed. Table 3 presents the
distributions of the top 24.7 percent of patrons by their birth year and gender. In general,

Is there the Pareto Principle in Public Library Circulation?
Page | 105
most of the patrons were born in the 1970s, followed by the 2000s, and the percentage of
female patrons is higher than that of males. Table 4 shows the results of the distributions of
the top 24.7 percent of patrons by types and occupations. Most of the top patrons are
general patrons, followed by families. By occupation, students borrow the most, followed by
businesses and finance and then children. This is consistent with the findings in the next
stage of analysis: families and children are vital patrons and children’s books are also a
popular material type. For public libraries, categorizing patrons is important because it
enables them to develop collections for specific patrons, and recommend specific collections
to targeted patrons.
Table 3: Distribution of Patrons’ Birth Year and Gender
Year of birth Female Male Not identified
2010s 1156 1126 19
2000s 12690 10544 67
1990s 7693 3713 23
1980s 10693 4254 131
1970s 24498 8749 334
1960s 12083 6748 88
1950s 3769 3424 17
1940s 873 1217 4
1930s 183 327 2
1920s 41 113 1
1910s 10 5 0
Other 82 47 3
Moreover, the top 24.7 percent patrons’ percentage by patron type and gender among all
patrons are analysed (Table 5). Except for general patrons, other types of patrons have
percentages higher than 24.7 percent. Staff has the highest percentage (83%) and VIP
patrons (66%) are also vital patrons. By gender, 25.5 percent female patrons and 24 percent
male are vital patrons. Females have little higher percentage than the males.

Yang, Y.T. & Shieh, J.C.
Page | 106
Table 4: Distribution of Patrons’ Occupation and Type
Occupation VIP General Volunteer Family Group Staff
Agriculture 2 424 1 - - -
Arts - - - 1 - -
Business and Finance 64 18366 66 52 - 11
Children 91 18009 1 1 - -
Education and Training 31 4885 29 7 8 2
Entertainment - 2 - - - -
Fishery - 3 - - - -
Freelance - 16 - 4 - 1
General Services 1 16 - 11 - 16
Government 23 5093 23 15 13 261
Healthcare - 3 - 1 - -
Homemaker - 39 - 34 - -
Industrial 28 7608 14 14 1 1
Military - 87 - 1 - -
Others 164 31263 449 186 20 110
Animal agriculture - 1 - - - -
Religion - 2 - - - -
Student 113 24905 30 10 - 9
Transportation - - - 1 - -
Public Servant - 1 - - - -
Not identified 8 1355 2 710 3 5
Table 5: Percentage of Patrons’ Type and Gender.
Top 24.7% Patrons Percentage (%)
Patron Type
VIP Patron 525 66.28788
General Patron 112078 24.6394
Volunteer 615 50.49261
Family 1048 46.41275
Group 45 39.13043
Staff 416 83.36673
Gender
Female 73771 25.54866
Male 40267 24.03182
Not identified 689 36.63764

Is there the Pareto Principle in Public Library Circulation?
Page | 107
(b) Bibliomining Analysis of Patrons
To know the characteristics of these patrons, clustering of data mining techniques are
applied to these 24.7 percent patrons. They are divided into four groups by K-means
algorithm. Input variables are ages, occupations, and gender. The results are shown in Table
6. Patrons in Cluster 1 are 0-20 years old, they are students or children, comprising 45 percent
males and 55 percent females. Approximately 84 percent patrons in Cluster 2 are from 21-
32 years old; predominantly students and females. Patrons in Cluster 3 are highly females,
mostly from 33-43 years old, and come from business and finance occupation sector. Patrons
in Cluster 4 are mainly from 44-81 years old. They are are mainly from business and finance,
as well as industries.
Table 6: Clusters of Patrons.
Cluster Variable Value Percentage
Cluster 1 Patron Age 0 - 20 98.88% Patron Gender Female 55.02%
Male 44.91%
Patron Occupation Children 64.13%
Student 35.23%
Cluster 2 Patron Age 0 - 20 11.35% 21 - 32 84.47% 33 - 43 4.19%
Patron Gender Female 68.83% Male 30.76%
Patron Occupation Business and Finance 9.00% Children 2.43% Education and Training 2.53% Government 3.88% Industrial 3.32% Others 16.61% Student 61.94%
Cluster 3 Patron Age 21 - 32 15.01% 33 - 43 84.99%
Patron Gender Female 73.46% Male 25.44% Null 1.10%
Patron Occupation Business and Finance 24.12% Education and Training 6.66% Government 5.69% Industrial 8.60% Others 36.11% Student 18.21%
Cluster 4 Patron Age 0 - 20 0.62% 21 - 32 9.33% 33 - 43 37.25% 44 - 81 52.80%
Patron Gender Female 66.33% Male 33.30%
Patron Occupation Agriculture 0.72% Business and Finance 27.19% Education and Training 7.99% Government 8.43% Industrial 10.40% Others 41.75%
Student 3.38%
Yang, Y.T. & Shieh, J.C.
Page | 108
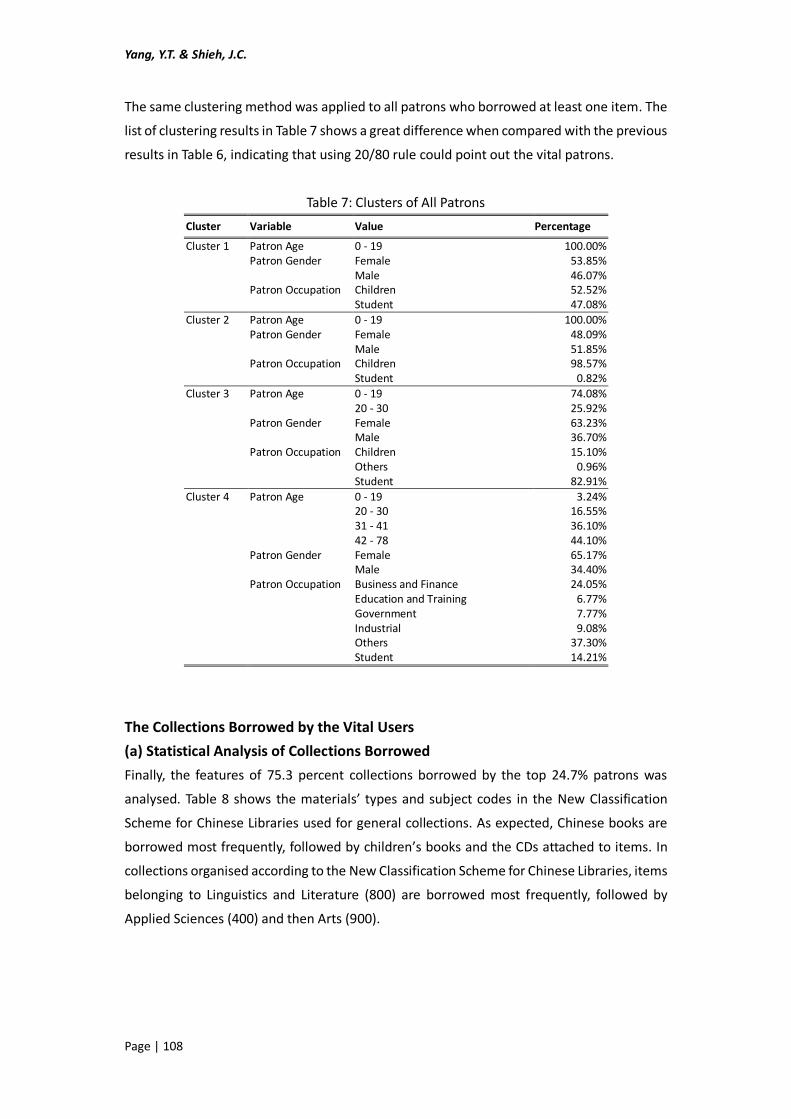
The same clustering method was applied to all patrons who borrowed at least one item. The
list of clustering results in Table 7 shows a great difference when compared with the previous
results in Table 6, indicating that using 20/80 rule could point out the vital patrons.
Table 7: Clusters of All Patrons
Cluster Variable Value Percentage
Cluster 1 Patron Age 0 - 19 100.00% Patron Gender Female 53.85%
Male 46.07% Patron Occupation Children 52.52%
Student 47.08%
Cluster 2 Patron Age 0 - 19 100.00% Patron Gender Female 48.09%
Male 51.85% Patron Occupation Children 98.57%
Student 0.82%
Cluster 3 Patron Age 0 - 19 74.08% 20 - 30 25.92%
Patron Gender Female 63.23% Male 36.70%
Patron Occupation Children 15.10% Others 0.96% Student 82.91%
Cluster 4 Patron Age 0 - 19 3.24% 20 - 30 16.55% 31 - 41 36.10% 42 - 78 44.10%
Patron Gender Female 65.17% Male 34.40%
Patron Occupation Business and Finance 24.05% Education and Training 6.77% Government 7.77% Industrial 9.08% Others 37.30% Student 14.21%
The Collections Borrowed by the Vital Users
(a) Statistical Analysis of Collections Borrowed
Finally, the features of 75.3 percent collections borrowed by the top 24.7% patrons was
analysed. Table 8 shows the materials’ types and subject codes in the New Classification
Scheme for Chinese Libraries used for general collections. As expected, Chinese books are
borrowed most frequently, followed by children’s books and the CDs attached to items. In
collections organised according to the New Classification Scheme for Chinese Libraries, items
belonging to Linguistics and Literature (800) are borrowed most frequently, followed by
Applied Sciences (400) and then Arts (900).

Is there the Pareto Principle in Public Library Circulation?
Page | 109
Table 8. Distribution of Material Types and Subject Code in New Classification Scheme for
Chinese Libraries*
Materials type 000 100 200 300 400 500 600 700 800 900
Chinese Book 43020 353972 140993 242366 1239097 568368 82593 416972 3735515 322321
Foreign Reference - - - - 4 2 2 - 30 - Indonesian Book 1 5 2 - - 1 7 14 31 1 Audio Book 298 4449 686 320 613 1285 - 61 4022 595 English Book 109 376 130 287 68 98 223 791 10929 272 Foreign Child Book 240 256 106 2233 607 5530 714 1079 87368 1109 Infant Book 107 29 - 1605 3291 81781 5 24 32558 295 Child Book 44093 38286 9240 407991 57602 221949 37738 152550 2744094 132242 Child Reference 311 - - 218 15 43 4 23 102 1 Child Picture Book - - - - 7 - - - - - Attachment 16724 5948 3010 65333 50334 43420 5902 12690 335886 35293 Teeanger Book - - - - - - - 1 136 - Goverment Publication - - - 11 116 149 2 43 24 37 Music 4 25 65 - 12 65 - - 2926 4443 Aboriginal Book - - - - - 2 - - - - Book Box - - - - - - - - 95 1 Thai Book - - - - - 1 - - 4 - Malay Book 2 - - - - - 2 - - - Reference Book 31 1 14 220 69 109 13 97 95 53 Periodical 51530 737 535 10324 39142 25130 63 1377 16835 8957 Video 713 995 618 12136 5300 7021 2038 8646 7172 353248 Vietnam Book - 4 - - - - 133 3 47 10 Local Government Literature
3 - - 5 2 6 4 21 1 4
E-resources - - - - - - - - 4 - Comic Book 2 307 225 635 527 538 176 573 4469 449478 Elderly Book - - - - - - - 12 5 - Journal - - 10 - 10 1 - - - - Korean Book - - - 3 1 - - - - 1
*000 Generalities; 100 Philosophy; 200 Religion; 300 Science; 400 Applied Sciences;
500 Social Sciences; 600 History; 700 Geography; 800 Linguistics and Literature; 900 Arts.
In the second layer classification of items that had been borrowed by vital patrons, items
belonging to Various Chinese literature (850) are borrowed most frequently, followed by
Western literature (870) and then Oriental literature (860). Table 9 shows the distributions
of popular items in the second layer classification. In the third layer classification, items
borrowed more than 100,000 times belong to Fiction (857), Chinese Children literature (859),
Japanese literature (861), and American literature (874). Table 10 shows the top 30 in the
third layer classification and the number of items borrowed.

Yang, Y.T. & Shieh, J.C.
Page | 110
Table 9: Distribution of the Second Layer in New Classification Scheme for Chinese Libraries
000 Items 200 Items 400 Items 600 Items 800 Items
000 1034 200 1451 400 4024 600 2155 800 513959
010 24583 210 8002 410 354624 610 39812 810 108177
020 3650 220 52107 420 659441 620 41626 820 7048
030 1558 230 956 430 74932 630 3225 830 24052
040 32984 240 13626 440 59227 640 299 840 7249
050 55580 250 416 450 653 650 240 850 3509721
060 3896 260 758 460 22872 660 1153 860 1079394
070 8153 270 8502 470 14286 670 30293 870 1505767
080 25382 280 6003 480 30237 680 2444 880 167646
090 209 290 63625 490 175927 690 7794 890 1719
100 Items 300 Items 500 Items 700 Items 900 Items
100 2614 300 253520 500 6347 700 - 900 22963
110 587 310 227258 510 3455 710 79355 910 51115
120 26545 320 27959 520 481670 720 1997 920 13699
130 1339 330 13952 530 45362 730 237834 930 2986
140 5762 340 9745 540 100911 740 71948 940 618495
150 1738 350 28825 550 64512 750 15981 950 47354
160 630 360 30272 560 187592 760 14403 960 44995
170 248746 370 14299 570 19393 770 12993 970 29489
180 5619 380 109185 580 26303 780 148697 980 372912
190 111469 390 26779 590 17938 790 10141 990 103609
Table 10: The Top 30 Third Layer in New Classification Scheme for Chinese Libraries
Classification No. Items Classification No. Items Classification No. Items
857 1911334 523 270695 494 108243
859 1276528 855 268203 862 105689
861 921509 312 178680 733 96751
874 677247 563 160722 803 84554
947 577836 177 147883 731 81030
805 370272 528 142726 307 79950
427 337461 411 141158 815 78603
987 332690 876 131703 428 63625
873 313536 308 120121 192 63185
872 288577 426 109827 875 59440

Is there the Pareto Principle in Public Library Circulation?
Page | 111
(b) Bibliomining Analysis of Collections Borrowed
The association rules of data mining techniques were applied to the collections borrowed by
24.7 percent patrons, using the second classification number as bases to see the association
patterns. Taking one association rule for example, “820,690→850” has the highest
confidence, i.e. 0.996. That means, among the vital patrons who had borrowed books of
classification number 820 (Chinese literature) and 690 (Chinese travels), 99.6 percent of
them also borrowed books of classification number 850 (Various Chinese literature).
CONCLUSION
This paper examines the circulation data of a public library through the lens of the Pareto
Principle, finding that the Pareto Principle does manifest in its circulation data. The findings
indicate that, during the two-years covered by the investigation, 24.7 percent of the patrons
borrowed 75.3 percent of all items borrowed. Conforming to the Pareto Principle, the
majority of books-orrowing was done by the vital few patrons. The researchers analysed the
distributions of the vital few patrons and the collections most frequently borrowed from.
Among the vital few patrons, most of them are students, families, and children. Among the
popular collections, the most frequently borrowed items are Chinese books and children’s
books. The most popular subject collection borrowed is Linguistics and Literature. This study
also analysed these patrons and collections by data mining techniques. The findings of
clustering have implications for public libraries to understand their patrons. Libraries could
apply the Pareto Principle to identify vital patrons and collections and use that information
to improve the efficiency of their library service, management and marketing.
Future research should analyse the correlation or connection between the vital few patrons
and popular collections. Further studies exploring Pareto Principle based on the circulation
data to identify popular items in public libraries could be conducted. The results of such an
analysis would enable public librarians to make more effective management and marketing
decisions, subsequently helping libraries improve utilization and patron satisfaction and
develop collections that are more appealing to their patrons.
ACKNOWLEDGEMENT
This research received no specific grant from any funding agency in the public, commercial,
or not-for profit sectors.

Yang, Y.T. & Shieh, J.C.
Page | 112
REFERENCES
Ahmad, P., Brogan, M. and Johnstone, M. N. 2014. The e-book power user in academic and
research libraries: Deep log analysis and user customisation. Australian Academic &
Research Libraries, Vol.45, no.1: 35-47.
Al-Daihani, S. M. and Abrahams, A. 2016. A text mining analysis of academic libraries' tweets.
The Journal of Academic Librarianship, Vol.42, no.2: 135-143.
Arsenova, I. 2013. New application of bibliometrics. Procedia-Social and Behavioral Sciences,
Vol.73: 678-682.
Bajpai, J. and Metkewar, P. S. 2016. Data quality issues and current approaches to data
cleaning process in data warehousing, Global Research and Development Journal for
Engineering, Vol.1, no.10: 14-18.
Burrell, Q. L. 1985. The 80/20 rule: Library lore or statistical law? Journal of
Documentation, Vol.41, no.1: 24-39.
Goodall, D. and Pattern, D. 2011. Academic library non/low use and undergraduate student
achievement: a preliminary report of research in progress, Library Management, Vol.32,
no.3: 159-170.
Hajek, P. and Stejskal, J. 2017. Library usage mining in the context of alternative costs: the
case of the municipal library of Prague. Library Hi Tech, Vol.35, no.4: 565-583.
Han, J., Kamber, M. and Pei, J. 2011. Data mining: Concepts and techniques. Waltham:
Morgan Kaufmann.
Hardesty, L. 1981. Use of library materials at a small liberal arts college, Library Research,
Vol.3, no.3: 261-282.
Kim, B. J., Singh, V. and Winer, R. S. 2017. The Pareto rule for frequently purchased packaged
goods: an empirical generalization. Marketing Letters, Vol.28, no.4: 491-507.
Koch, R. 2011. The 80/20 principle: The secret of achieving more with less. New York:
Currency Doubleday.
Mesbahi, M. R., Rahmani, A. M. and Hosseinzadeh, M. 2017. Highly reliable architecture
using the 80/20 rule in cloud computing datacenters. Future Generation Computer
Systems, Vol.77: 77-86.
Nash, J. L. 2016. Richard Trueswell's Contribution to Collection Evaluation and Management:
A Review, Evidence Based Library and Information Practice, Vol.11, no.3: 118-124.
Nicholson, S. 2003. The bibliomining process: Data warehousing and data mining for library
decision making. Information Technology and Libraries, Vol.22n no.4: 146-151.
Nicholson, S. 2006. The basis for bibliomining: Frameworks for bringing together usage-
based data mining and bibliometrics through data warehousing in digital library
services, Information Processing & Management, Vol. 42, no.3: 785-804.
Nisonger, T. E. 2008. The “80/20 rule” and core journals, The Serials Librarian, Vol.55, no.1-
Is there the Pareto Principle in Public Library Circulation?
Page | 113
2: 62-84.
Pandey, R. K. 2014. Data Quality in Data warehouse: problems and solution. IOSR Journal of
Computer Engineering, Vol.16, no.1: 18-24.
Ping, H. 2015. The Research on Personalized Recommendation Algorithm of Library Based
on Big Data and Association Rules. Open Cybernetics & Systemics Journal, Vol.9, no.1:
2554-2558.
Renaud, J., Britton, S., Wang, D. and Ogihara, M. 2015. Mining library and university data to
understand library use patterns, The Electronic Library, Vol.33, no.3: 355-372.
Schneier B. 2015. Applied cryptography: Protocols, algorithms and source code in C, 20th
Anniversary Edition. New York: John Wiley & Sons.
Shieh, J. C. 2009. Bibliomining. Taipei: Mandarin Library & Information Service.
Siguenza-Guzman, L., Saquicela, V., Avila-Ordóñez, E., Vandewalle, J. and Cattrysse, D. 2015.
Literature review of data mining applications in academic libraries, The Journal of
Academic Librarianship, Vol.41, no.4: 499-510.
Singson, M. and Hangsing, P. 2013. Reaffirming 80/20 rule in Indian Academic Consortia,
Paper presented at the International Conference on Digital Libraries (ICDL) 2013: 464-
474. New Delhi,India.
Singson, M. and Hangsing, P. 2015. Implication of 80/20 rule in electronic journal usage of
UGC-infonet consortia. The Journal of Academic Librarianship, Vol.41, no.2: 207-219.
Trueswell, R. L. 1969. Some Behavioral Patterns of Library Users: The 80/20 Rule. Wilson Libr
Bull, Vol.43, no.5: 458-461.
Wu, F., Hu, Y. H. and Wang, P. R. 2017. Developing a novel recommender network-based
ranking mechanism for library book acquisition. The Electronic Library, Vol.35, no.1: 50-
68.
Xiang, Z. and Hao, Z. 2014. Personalized requirements oriented data mining and
implementation for college libraries. Computer Modelling & New Technologies, Vol.18,
no.2B: 293-300.
Yamashita, K., McIntosh, S., Kamei, Y., Hassan, A. E. and Ubayashi, N. 2015. Revisiting the
applicability of the pareto principle to core development teams in open source software
projects. Proceedings of the 14th International Workshop on Principles of Software
Evolution: 46-55. Bergamo, Italy.
Zhang, Q. S. and Wang, X. Y. 2013. Research of personalized information service based on
association rules. Advanced Materials Research, Vol.760-762: 1800-1803.