IS THERE A FUTURE FOR FOOTBALL? · Rate of Concussion –high school athletes (per 1000...
56
IS THERE A FUTURE FOR FOOTBALL?
Transcript of IS THERE A FUTURE FOR FOOTBALL? · Rate of Concussion –high school athletes (per 1000...

IS THERE A FUTURE FOR FOOTBALL?
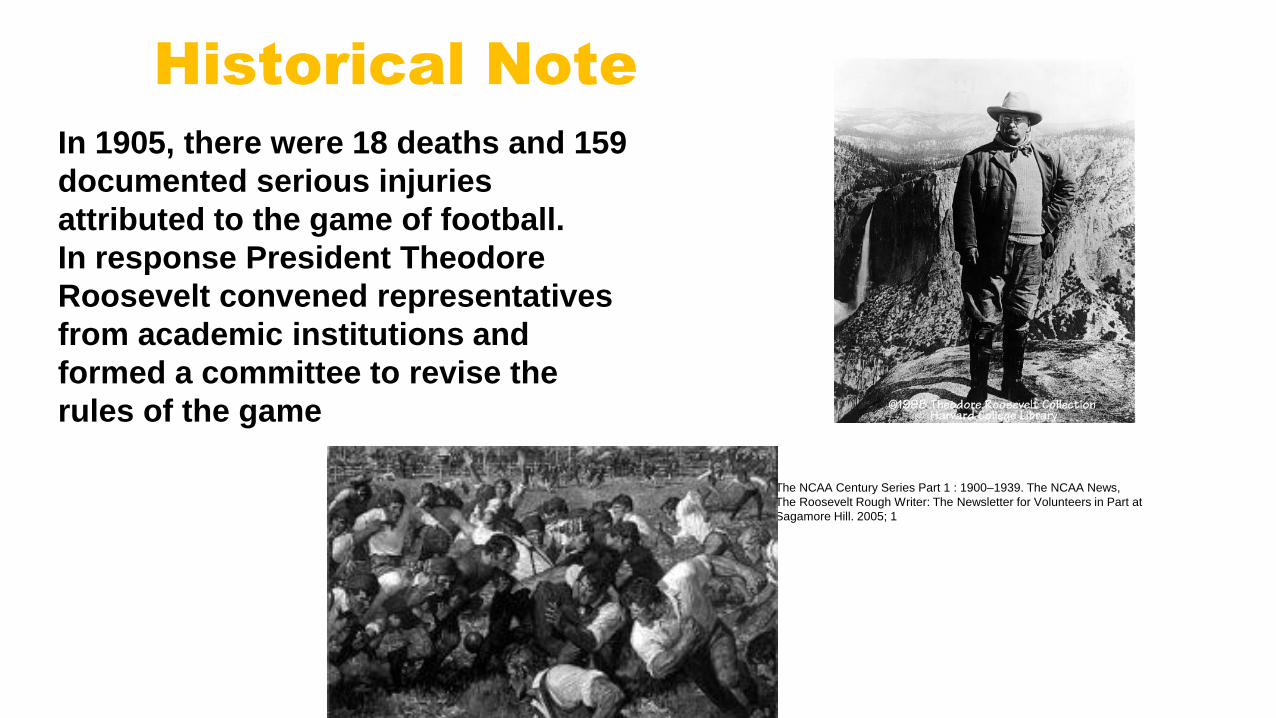
Historical Note
In 1905, there were 18 deaths and 159
documented serious injuries
attributed to the game of football.
In response President Theodore
Roosevelt convened representatives
from academic institutions and
formed a committee to revise the
rules of the game
The NCAA Century Series Part 1 : 1900–1939. The NCAA News,
The Roosevelt Rough Writer: The Newsletter for Volunteers in Part at
Sagamore Hill. 2005; 1

Rate of Concussion – high school athletes (per 1000 athlete-exposures)
Football 0.47Girls soccer 0.36Boys soccer 0.22Girls basketball 0.21Boys lacrosse 0.19Boys wrestling 0.18Boys basketball 0.07Girls softball 0.07Boys baseball 0.05Girls volleyball 0.05
Source: Journal of Athletic Training, December 2007

Football and long term cognitive
outcome
• CTE is a REAL pathologic entity which has been best
characterized in autopsy studies.
• Unfortunately, we still lack significant understanding of
important factors about susceptibility, pathophysiology,
clinical manifestations, modifying factors, and co-morbid
conditions
• “believers” vs. “deniers” is not a helpful construct!!
RESEARCH, RESEARCH, RESEARCH!

5
NFL MEDICAL RESEARCH EXPENDITURES 2013 - 2018
Since 2013 the NFL has directly contributed over $235 million to medical research and education involving all aspects of player health and safety.
• $60 million Head Health Initiative with GE (2013, 4 years)• $40 million for TBI imaging• $20 million for innovation challenges
• $30 million to independent government sponsored research (2013, 4 years)• $17 million through FNIH• $13 million unrestricted gifts to NIH-sponsored projects
• $40 million to independent scientific advisory board (2018)• $60 million to Engineering Roadmap (2016)• $45 million to USA Football “Heads Up” educational program (2015)

• $6 million grant to the University of Pittsburgh and University of Pittsburgh Medical Center (UPMC) for its “Prevalence of Brain Health versus Neurodegeneration in Professional Football Retirees” project.
• $14.5 million for “A Prospective, LONGitudinal and Translational Study for Former National Football League Players” at Boston Children’s Hospital and Harvard Medical School.
• A $9.4 million grant to “Surveillance in High Schools to Reduce Concussions in Youth” led by a group at the University of Calgary.
• $3.4 million for the project “Transforming Research and Clinical Knowledge in Traumatic Brain Injury (TRACK-TBI Longitudinal),” led by researchers at the University of California-San Francisco.
• $1.5 million to “The Spectrum of Concussion: Predictors of Clinical Recovery, Treatment and Rehabilitation, and Possible Long-Term Effects” led by a team at Spaulding Rehabilitation Hospital and Harvard Medical School.
FUNDING ANNOUNCED NOVEMBER 2018 (SAB)

What should we do until the data becomes more settled?

All of us know that the best
treatment is…
PREVENTION!!

Risk modification
Can we reduce the incidence and severity of head impacts in
football?

Risk reduction strategies
• Equipment
• style of play/rules
• training and teaching
• Supervision and medical
support

Injury
Engineering
Gameday
Data Analytics
EMR
UNC ATC
Video Review
Video Recon
Lab testing
GSIS
NGSHelmet Tracker
Schedule
Surface Officiating
Environmental
INJURY EVIDENCE PLATFORM

Confidential and Proprietary
270 263 265
244
212
279
250
291
2010 2011 2012 2013 2014 2015 2016 2017
Number of Concussions
16%
12
All time high of concussions in 2017 seasonFull season; 2010-2017

HOW CAN WE REVERSE THIS TREND?
•How can we IMMEDIATELY begin to
significantly reduce the number of
concussions suffered by NFL
players?
• What are the major causes of these
concussions?
• What steps could prevent these causes?
13

CONCUSSION REDUCTION STRATEGY
14

Injury Reduction Plan - Concussions
G O A L
Education
Reduction in concussion incidence in
the 2018 seasonRemove dangerous style of play
1
2
3
Increase number of players wearing better performing helmets
Decrease pre-season practice concussions
+ Enforcement+ Engineering
15

Video Review Method – Game Concussions
Review Presentation
Review of all available video
Sideline Video
EndzoneVideo
Broadcast Video
Replay #2
Replay #3
Replay #1
“All 22” Video
Live broadcast feed
NFL Films footage Broadcast Melt Reel Footage
Database Entry
(PHL, safety)
Impact Location
Primary Impact Source: Shoulder
Concussed Player:Collision Partner:
(MIN, wide receiver)
Activity: Tackled
Activity: Tackling
Video Review Database

0
5
10
15
20
25
30
35
40
45
50
Top Front Side(upper)
Side(lower)
Rear(upper)
Rear(lower)
Facemask(central)
Facemask(upperedge)
Facemask(sideedge)
Perc
enta
geHelmet Impact Location in All Impact Types (2015-2016 , n = 325)
All (n=325)
H2H (n=116)
H2B (n=92)
H2S (n=56)
H2G (n=61)
Side is the most common impact location

H2H Case: Rate of Rotation


20
STR
IKIN
G P
LAY
ER
NEC
K IN
JUR
Y R
ISK
STR
UC
K P
LAY
ER
CO
NC
USS
ION
RIS
KIncreased Lowering of Head
BaselineFacemask-to-Facemask
> 2 XBaseline
Risk
> 80 XBaseline
Risk

N A T I O N A L F O O T B A L L L E A G U E 2 0 1 8
Helmet Striking Helmet
21

N A T I O N A L F O O T B A L L L E A G U E 2 0 1 8
Helmet Striking Helmet
22

N A T I O N A L F O O T B A L L L E A G U E 2 0 1 8
Helmet Striking Helmet
23

24
Tackling Player Helmet Location
Biomechanics of Lowering the Head
Tackled Player Concussion Risk
Upper Body Alignment with Closing Velocity
Head-Spine-Torso Alignment

25

26

CONCUSSION INCIDENCE AND ANALYSIS
27

2828
INCIDENCE OF CONCUSSION
Number of concussions by year and season; 2012-2018
201 players
concussed in 2018
26% 13%No
change25%29% 29%

29
PRESEASON PRACTICES

30Confidential and Proprietary
Preseason Practice Concussions Did Not Decrease2010-2018
0
20
40
60
80
100
1 2 3 4 5 6 7 8 9
Nu
mb
er
of
Co
ncu
ssio
ns
91
79
PS Practices
PS Overall
45 45
Year Timing in Preseason
Training Camp Rest of Preseason Total
2016 20 (77%) 6 (23%) 26
2017 31 (69%) 14 (31%) 45
2018 31 (69%) 14 (31%) 45
21% of concussions
occur in PS practice

31
• Preseason Practice Blocks ≈ 2/3
Concussions
• OL > 1/4 of Preseason Practice
Concussions
2018 PRESEASON PRACTICE CONCUSSIONS
31
• How can we practice OL in a safer manner?
64%
15%
27%29%
64%
15%
0%
10%
20%
30%
40%
50%
60%
70%
Blocks Tackles OL % All Concussions
Preseason Practice Concussions (Relative to Games)
Preseason Practice Games

32
HELMET CHOICE

33
Helmet Usage
2017 2018 17%
2%
42%
24%
41%
74%
0%
10%
20%
30%
40%
50%
60%
70%
80%
90%
100%
2017 Reg WK17 2018 Reg WK17
Prohibited Not Top Group Top Group
(n=32)

2.45 2.55 2.65 2.75 2.85 2.95 3.05 3.15 3.25 3.35 3.45
2018 Helmet Combined Metric Score
2015 -2018 Helmet PerformanceHelmets with > 30,000 Plays
Bubble Size = Number of Plays
Laboratory PerformanceBetter Worse
On
-fie
ld P
erf
orm
ance
Bet
ter
Wo
rse

0.16
0.19
0.22
0
0.05
0.1
0.15
0.2
0.25
Green Yellow Prohibited
+ Risk 15%
Risk +38%
Helmet Poster Group
2015-2018 GAME CONCUSSIONS/1000 PLAYS
35

36
RULES: USE OF HELMET

• UOH Violations in 2018 confirm significant risk associated with lowering the head behavior
• We saw some positive change in LTH behavior on the field in 2018
• However, biomechanical and medical analysis of concussions (and all plays) reveals high risk LTH behavior still present
• Broader definition of UOH/LTH would capture larger percentage of concussion causing impacts
37
USE OF HELMET (UOH) AND LOWERING THE HEAD (LTH)

• Nearly 40% of H2H concussions result from player lowering the head to initiate contact
• Nearly 60% of player-to-player concussions result from some form of LTH behavior
• Dangerous LTH is a risky behavior that requires ongoing education and enforcement to further decrease injury rates and protect players
38
SUMMARY: USE OF HELMET AND LOWERING THE HEAD

Tackling39%
Tackled25%
Blocking17%
Blocked12%
Diving/Leaping4%
Other3%
Tackling Tackled Blocking Blocked Diving/Leaping Other
TacklingPlayer61%
TackledPlayer 39%
Blocking17%
Blocked12%
ConcussionsFrom Tackles
2018 ConcussionsTackling = 58
2018 ConcussionsTackled = 31
2018 ConcussionsTackles = 89
Tackles responsible for 64% Concussions despite only 17% of helmet impacts
ALL CONCUSSIONSGAMES 2015-2018
CONCUSSIONS FROM TACKLESGAMES 2015-2018
39

0%
2%
4%
6%
8%
10%
12%
14%
16%
18%
20%
0 2 4 6 8 10 12 14
Inju
ry R
ate
Impact Closing Speed (m/s)
Injury Rate by Impact Closing Speed for Tackling Players2017 - 2018 Weighted Exposure (96 games) and BIOCORE Video Review with NGS
Definitive Impacts
Torso
Arm
Helmet
Lower Body
Shoulder
> 5X Injury Risk
Tackled Player Body Regions
TacklingPlayer Injured
TackledPlayer BodyRegions
1X
1X
3.7X
5.3X
5.0X
40

RULES: KICKOFF
41

42Confidential and Proprietary
Kickoffs: Trends in Returns vs. Missed-Time Injury RateRegular season games; 2012-2018
a Kickoff plays include all plays, not only returns; b Missed time injuries are defined differently between 2012-2014 and 2015-2018. In 2012-2014, these include
injuries that met the reportable injury definition. In 2015-2018, these are injuries that resulted in removal from participation and inability take full part in future football
activities following the injury. Missed time information may be updated throughout the season, therefore these data are subject to change; c Game injuries reported
during a fumble and those with unknown or missing play type are not included.
0
20
40
60
80
2012 2013 2014 2015 2016 2017 2018
0
2
4
6
8
10
% o
f To
tal K
icko
ff P
lays
Rate
of
Inju
ry p
er
100 P
lays
a,b
,c
% Returned
Missed Time
Injuries per 100
Kickoff Plays
Restriction of
wedge on KO
Returns
27% decrease in missed
time injuries
Year 2016 2017 2018
Total Kickoff Concussions 20 17 13
Rate on Total Kickoffs 0.76 0.67 0.49
Kickoff Return Concussions 17 13 11
Rate on Kickoff Returns 1.64 1.25 1.13

PUNTS/BLINDSIDE BLOCKS
43

44Confidential and Proprietary
Injury Rate by Play Type: Injuries Resulting in ≥8 Days Misseda
Regular season games; 2012-2018
a Injuries resulting in ≥8 days missed are defined as any injury that resulted in removal from participation for ≥8 days following the initial onset. Open injuries at
the time of this analysis were assumed to have been removed from participation for ≥8 days. b Game injuries reported during a fumble and those with unknown
or missing play type are not included. (For ≥8 days missed: 2018: 93, 2017: 142, 2016: 157, 2015: 106, 2014: 258, 2013: 114, 2012: 38). c All kickoffs, not only
returns, are included in denominator.
0
1
2
3
4
2012 2013 2014 2015 2016 2017 2018
Rate
of
Inju
ries p
er
100 P
lays
Kickoff Punt Run Pass Field Goal Extra Pointc
Punt
Kickoff
Play Typeb
2018 Regular Season
Game Injuries
N % Injuries
Punt 70 10%
Kickoffc 45 7%
Run 246 36%
Pass 320 46%
Field Goal 6 <1%
Extra Point 2 <1%
➢ Average time missed on punt plays is
higher than other plays, including
run/pass
➢ More games loss injuries on punts than
other plays

• 63% of concussions from blocks in punts are caused by Blindside blocks
• 40% of other serious injuries (>8 days lost) from blocks that knocked players out of games on punts were caused by blindside blocks
• Blindside blocks cause concussion and other major injuries on other plays as well –usually on special teams or turnovers
• Removing the blindside block will decrease injuries and concussions, especially on special teams plays
45
BLINDSIDE BLOCKS AND OTHER INJURIES

Preview/Summary:
• Carter (#55) is injured when a blindsided player collides with him.
• A total of four players are involved in a collision resulting from the blindside block.
46
VIDEO EXAMPLE 2: BLINDSIDE BLOCK LEADING TO FIBULA FRACTURE
Video Source: Biocore Video Review Database
Blocker
Christopher Carter #55 (WAS, DL)---(2017-Reg-Week14)--- Fibula Fracture/Distal
Injured Blocked

• The first year of the concussion reduction strategy was a success
• There is more that can be accomplished to decrease concussions in 2019
• Concussion savings in future years will be driven by rules changes, enforcement and education
• Lowering the head behavior increases concussion and injury risk even when the player is not completely parallel to the ground
47
KEY TAKEAWAYS

NFL AND NFLPA MOUTHGUARD SENSOR: DATA → POSITION-SPECIFIC HELMETS
Initial Deployment with 4 NFL Teams 2019 Season
>15,000 Events2130 Game Events56 Player-Games
2018-2019 UVA Pilot Study
48

OVERALL INJURIES AND LOWER EXTREMITY INJURY STRATEGY
49

LOWER EXTREMITY INJURY REDUCTION
50
0
9,000
18,000
ACL Tears(n=193)
LEX Strains(n=2248)
ShoulderInstability
(n=224)
High AnkleSprains(n=406)
AchillesRuptures
(n=56)
Ankle / LegFractures
(n=85)
ShoulderStrains(n=245)
Concussions(n=841)
Isolated MCLTears
(n=406)
IsolatedMeniscusInjuries(n=124)
Lateral AnkleSprains(n=588)
Estimated based on mean*
Reported
a Isolated injuries are those without concomitant ligamentous pathology.
* Return dates are missing for 12-50% of injuries; days missed is estimated by using the mean across all reported injuries. These estimates do not
take into account football-related and other non-injury related factors for return to play.
8 out of the 11 highest burden injuries are to the lower
extremity, leading to more than >57,500 days missed
per season & >3,000 games missed per season (est.)
Nu
mb
er
of
Da
ys
Mis
se
d*

• Similar to our concussion reduction plan, we will present a plan to reduce the highest burden lower extremity injuries:
• Hamstring/adductor strains
• ACL/knee ligament complex tears and sprains
• Ankle sprains and fractures
51
LOWER EXTREMITY (LEX) INJURY REDUCTION PLANS
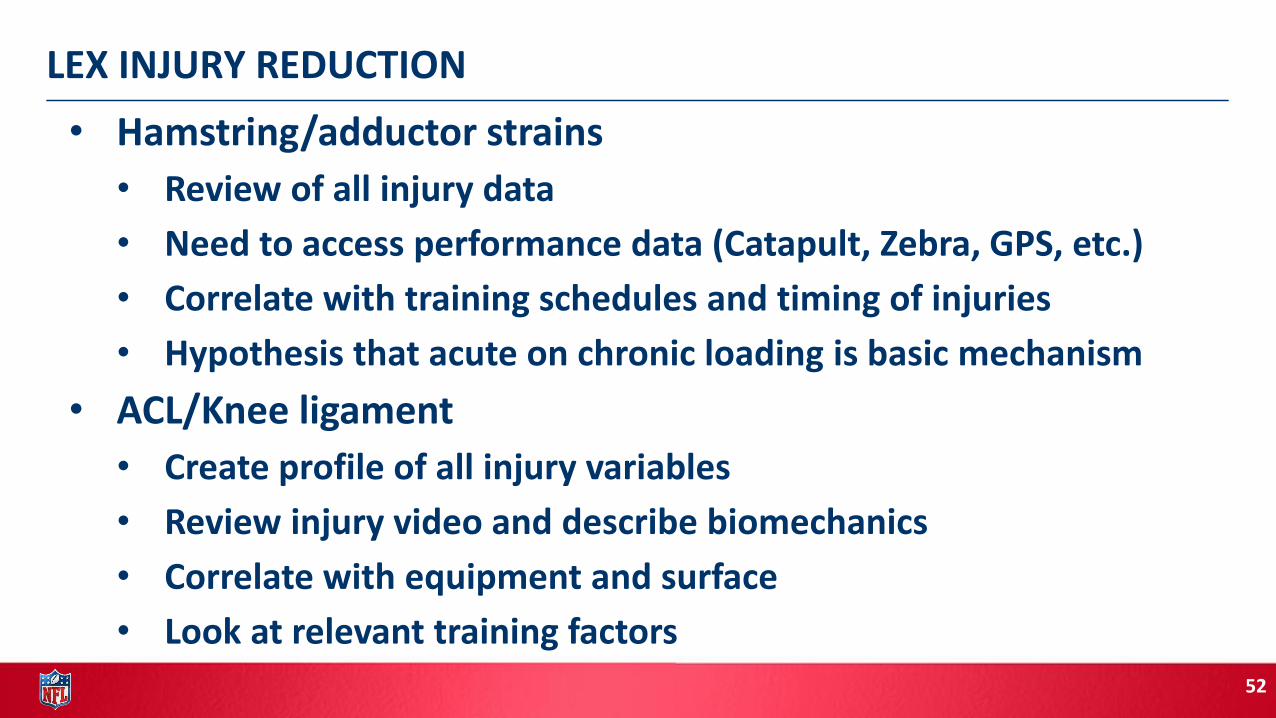
• Hamstring/adductor strains
• Review of all injury data
• Need to access performance data (Catapult, Zebra, GPS, etc.)
• Correlate with training schedules and timing of injuries
• Hypothesis that acute on chronic loading is basic mechanism
• ACL/Knee ligament
• Create profile of all injury variables
• Review injury video and describe biomechanics
• Correlate with equipment and surface
• Look at relevant training factors
52
LEX INJURY REDUCTION

• Ankle sprains and fractures
• Foot scan project
• RFID tags in all cleats
• Allows for correlation of injury rates with each cleat style and pattern (similar to helmets)
• Surface committee
• In depth analysis of injury rates on different surfaces
• Better description and measurement of surface properties
• Interaction with turf manufacturers to improve new designs and maintenance
53
LEX INJURY REDUCTION

SUMMARY
54

Summary
• Sports related injuries can be significantly reduced by:
• Better equipment
• Data-driven changes in rules and style of play
• Teaching and supervision
• Consider benefits and risks of sports participation
• Need for continued well done research on long term
effects of all aspects of sports participation including
brain injury

56


![Welcome [s3.amazonaws.com]...Girls Soccer Meghan McIntyre Girls Soccer Marc Agpoon Boys Tennis Collin Bradley Boys Tennis Aldren Briones Boys Tennis Jonathan Insyxiengmay Boys Tennis](https://static.fdocuments.in/doc/165x107/5f3cc110bca42e68406c81e7/welcome-s3-girls-soccer-meghan-mcintyre-girls-soccer-marc-agpoon-boys-tennis.jpg)