Is There a Diversification Discount in Financial...
58
Is There a Diversification Discount in Financial Conglomerates? Luc Laeven (World Bank and CEPR) Ross Levine* (University of Minnesota and NBER) June 2005 Abstract: This paper investigates whether the diversity of activities conducted by financial institutions influences their market valuations. We find that there is a diversification discount: The market values financial conglomerates that engage in multiple activities, e.g., lending and non- lending financial services, lower than if those financial conglomerates were broken into financial intermediaries that specialize in the individual activities. While difficult to identify a single causal factor, the results are consistent with theories that stress intensified agency problems in financial conglomerates that engage in multiple activities and indicate that economies of scope are not sufficiently large to produce a diversification premium. Keywords: Corporate Diversification; Banking; Economies of Scope; Agency Costs JEL Classification: G2, G3, L2 * We would like to thank an anonymous referee, Raj Aggarwal, Luca Benzoni, Bernard Black, John Boyd, Mike Burkart, Stijn Claessens, Hans Degryse, Sonia Falconieri, Paul Healy, Harry Huizinga, S.P. Kothari, Xiaoji Lin, Vojislav Maksimovic, Hamid Mehran, Steven Ongena, Fabiana Penas, Henri Servaes, Raj Singh, David Smith, Ernst- Ludwig von Thadden, Andrew Winton, and seminar participants at the European Central Bank, HEC Lausanne, Stockholm School of Economics, Tilburg University, University of Mannheim, University of Minnesota, and the Conference on Agency Problems and Conflicts of Interest in Financial Intermediaries at the Dice Center for Research in Financial Economics of the Ohio State University for helpful comments and discussions, and Ying Lin for help with the data. This paper’s findings, interpretations, and conclusions are entirely those of the authors and do not necessarily represent the views of the World Bank, its Executive Directors, or the countries they represent.
Transcript of Is There a Diversification Discount in Financial...

Is There a Diversification Discount in Financial Conglomerates?
Luc Laeven
(World Bank and CEPR)
Ross Levine*
(University of Minnesota and NBER)
June 2005
Abstract: This paper investigates whether the diversity of activities conducted by financial
institutions influences their market valuations. We find that there is a diversification discount: The
market values financial conglomerates that engage in multiple activities, e.g., lending and non-
lending financial services, lower than if those financial conglomerates were broken into financial
intermediaries that specialize in the individual activities. While difficult to identify a single causal
factor, the results are consistent with theories that stress intensified agency problems in financial
conglomerates that engage in multiple activities and indicate that economies of scope are not
sufficiently large to produce a diversification premium.
Keywords: Corporate Diversification; Banking; Economies of Scope; Agency Costs
JEL Classification: G2, G3, L2
* We would like to thank an anonymous referee, Raj Aggarwal, Luca Benzoni, Bernard Black, John Boyd, Mike Burkart, Stijn Claessens, Hans Degryse, Sonia Falconieri, Paul Healy, Harry Huizinga, S.P. Kothari, Xiaoji Lin, Vojislav Maksimovic, Hamid Mehran, Steven Ongena, Fabiana Penas, Henri Servaes, Raj Singh, David Smith, Ernst-Ludwig von Thadden, Andrew Winton, and seminar participants at the European Central Bank, HEC Lausanne, Stockholm School of Economics, Tilburg University, University of Mannheim, University of Minnesota, and the Conference on Agency Problems and Conflicts of Interest in Financial Intermediaries at the Dice Center for Research in Financial Economics of the Ohio State University for helpful comments and discussions, and Ying Lin for help with the data. This paper’s findings, interpretations, and conclusions are entirely those of the authors and do not necessarily represent the views of the World Bank, its Executive Directors, or the countries they represent.

1. Introduction
Theory provides conflicting predictions about the impact of greater diversity of activities on
the performance of financial intermediaries. As suggested by the work of Diamond (1991), Rajan
(1992), Saunders and Walter (1994), and Stein (2002), banks acquire information about clients
during the process of making loans that may facilitate the efficient provision of other financial
services, including the underwriting of securities. Similarly, securities and insurance underwriting,
brokerage and mutual fund services, and other activities may produce information that improves
loan making. Thus, financial conglomerates – banks that engage in a variety of activities – may
enjoy economies of scope that boost performance and market valuations.1 Alternatively,
diversification of activities within a single financial conglomerate may intensify agency problems
between corporate insiders and small shareholders with adverse implications on the market’s
valuation of the conglomerate.2 In particular, insiders may expand the range of financial activities if
this diversification enhances the ability of insiders to extract private benefits from the financial
institution. Thus, even if diversification of activities lowers the market’s valuation of the financial
conglomerate, insiders will still diversify if their extra private benefits exceed the losses that they
incur from the drop in market valuation (Jensen, 1986; Jensen and Meckling, 1986).3
1 Diversification within financial intermediaries can also boost market valuations by reducing the costs of providing incentives for delegated monitoring (Diamond, 1984). Financial conglomeration may also improve relationship lending and thereby improve the efficiency of financial intermediation (Petersen and Rajan, 1994). At a more general level, conglomerates might operate and coordinate distinct activities more efficiently than if those activities were operated as stand-alone firms (Chandler, 1977). Conglomerates may ease informational asymmetries and use internal capital markets to allocate resources efficiently, diversifying income flows and hence avoid inefficient bankruptcies, and exploit economies of scope (Williamson, 1970; Lewellen, 1971; Gertner, Scharfstein, and Stein, 1994). See Houston et al (1997) for evidence of the importance of internal capital markets in banking. 2 Previous research indicates that conglomerates may make it more difficult to design efficient managerial incentive contracts and more difficult to align the incentives of outsiders with insiders (Aron, 1988; Stulz, 1990; Rotemberg and Saloner, 1994). 3 In terms of U.S. banking regulations, the Gramm-Leach-Bliley Act of 1999 expanding the range of permitted bank activities partially reflects (i) a growing belief among policy makers about economies of scope in the provision of financial services and (ii) an amelioration of concerns about conflicts of interest and agency problems within financial
1

Empirically, it is extraordinarily difficult to measure economies of scope in the provision of
financial services or to measure agency problems in financial conglomerates. Berger and Humphrey
(1994) argue that (1) there are severe econometric difficulties in identifying appropriate cost
functions for financial conglomerates providing diverse services and (2) these difficulties help
explain the profession’s inability to confidently reject or accept the presence of economies of scope
in financial activities.4 In related work on conflicts of interest in providing diverse financial
services, an extensive literature examines the impact on the price of a firm’s securities of a bank
that both makes loans to the firm and sells its securities (e.g., Kroszner and Rajan, 1994; Puri, 1996;
Gande et al. 1997, 1999; and Schenone 2004).5 This work tests whether banks that make loans to a
firm and underwrite its securities sell securities to the public at inflated prices to subsidize their
lending operations. Recent evidence from the United States finds the opposite: Financial
conglomerates that combine lending and investment banking activities tend to charge lower fees
(Sufi, 2004; and Drucker and Puri, 2005). This research, however, does not study whether engaging
in diverse activities intensifies agency problems between financial institution insiders and outsiders
with adverse ramifications on the market’s valuation of financial conglomerates. Thus, while
diversification may provide cost savings to some clients, diversification of activities might still
enhance the ability of insiders to expropriate financial institution resources for private gain and
thereby lower the conglomerate’s market value.
Rather than attempting to measure economies of scope and agency problems directly, we
investigate whether the diversity of activities conducted by financial institutions – “banks” – conglomerates, which originally helped produce the Glass-Steagall Act of 1933. See Benston (1994) and Saunders and Walter (1994). 4 For example, the bulk of research provides little evidence of large economies of scope (e.g., Berger, Hanweck, Humphrey, 1987; Berger and Humphrey, 1991; Ferrier et al, 1993; and Pulley and Humphrey, 1993). In Europe, Vander Vennet (2002) finds that universal banks are more cost and profit efficient than specialized banks, but Allen and Rai (1996) find little evidence for complementarities between lending and investment-related services. There is a large, distinct literature on scale economies in banking (Berger, Demsetz, and Strahan, 1999). 5 Also, see Ber, Yafeh, and Yosha (2001), and Benzoni and Schenone (2005).
2

influences their market valuations. More specifically, we examine whether the Tobin’s q of a
financial conglomerate is more or less than the q it would have if the conglomerate were broken into
a portfolio of banks that each specializes in the individual activities of the conglomerate.
Diversification of activities within a single financial conglomerate may yield economies of scope
that boost valuations. Or, diversity of activities may intensify agency problems and induce a
diversification discount in the valuation of financial conglomerates. We examine the net impact of
positive and negative effects of diversification on valuation. As explained below, we use numerous
econometric procedures to control for simultaneity bias and identify the independent impact, if any,
of diversity on the valuation of financial conglomerates.
This paper focuses on diversity per se. Thus, we control for the possibility that the market
values different financial activities differently. For example, if securities underwriting is valued
more highly than loan making, then a bank that does both may have a higher q than a bank that only
makes loans. We abstract from these activity-effects on valuation to identify the independent impact
of diversity on valuations by using a modified version of the Lang and Stulz (1994) and LeBaron
and Speidell’s (1987) ‘chop-shop’ method. Specifically, we compare the q’s of diversified banks to
the estimates of the q’s these banks would have if they were decomposed into a bank specialized in
loan-making activities and a bank specialized in non-lending activities. Using data on 836 banks,
across 43 countries, over the period 1998-2002, we examine the impact of diversity on the valuation
of financial conglomerates.
Our research builds on the non-financial corporate diversification literature, which identifies
key methodological hurdles associated with assessing whether diversification affects stock market
valuations. Lang and Stulz (1994), Berger and Ofek (1995), and Servaes (1996) find a
diversification discount: The Tobin’s q of diversified firms is less than the q’s they would have if
3

separated into portfolios of specialized firms.6 Using plant-level data from U.S. manufacturing
firms, however, Maksimovic and Phillips (2002) find that less productive firms tend to diversify,
but diversity does not cause lower productivity. Campa and Kedia (2002) find that the same traits
that induce firms to diversify also lower firm values. They conclude that researchers have wrongly
attributed the diversification discount to diversification per se rather than to the firm’s underlying
characteristics.7 Graham, Lemmon, and Wolf (2002) argue that conglomerates tend to purchase
already discounted target firms, which produces the diversification discount. Thus, they too argue
that there is no evidence that diversification intensifies agency problems and destroys value. Finally,
Villalonga (2004a) argues that data problems are driving the entire corporate diversification
literature. She identifies flaws with the industrial segment data from Compustat due to the fact that
firms self-report their activities and shows that this self-reporting biases the results toward finding a
diversification discount.8 Thus, a proper examination of the impact of diversification must account
for simultaneity bias, mergers and acquisitions (M&As), and problems associated with self-reported
activity data.
Besides controlling for endogeneity and M&As, this paper contributes to the broader
diversification literature by (i) examining diversity within one industry – the financial services
industry – rather than examining diversity across broad industrial activities and (ii) by reducing
potential biases associated with the common use of self-reported activity data. Instead of examining
the valuation effects of diversification across very distinct businesses, e.g., an oil company
6 Also, see Morck, Shleifer, and Vishny (1990), Comment and Jarrell (1995), John and Ofek (1995), Lins and Servaes (1999), Rajan, Servaes, and Zingales (2000), and Schoar (2002). Denis, Denis, and Sarin (1997) find that agency problems drive the corporate diversification decisions. 7 Other work that emphasizes the endogeneity of the diversification decision includes Fluck and Lynch (1999), Chevalier (2000), Lamont and Polk (2001), Whited (2001), and Villalonga (2004b). 8 In particular, Villalonga (2004a) notes serious problems with comparability across firms since each firm chooses how to aggregate specific activities into the broad segments in Compustat. Indeed, 25 percent of changes in firms’ number of segments over time are due purely to reporting changes, not real changes in diversification. Using data at the establishment level, Villalonga (2004a) finds a diversification premium.
4

diversifying into food processing, we focus on diversification in an industry where economies of
scope are likely to be pronounced: the provision of information intensive financial services.9
Evidence of a diversification discount, therefore, would provide particularly compelling (though not
conclusive) evidence of agency problems associated with financial conglomeration. We use data
that is not biased toward indicating a diversification discount. In particular, our modified chop-shop
approach does not rely on self-reported information on whether a firm participated in an activity or
not. Rather, we directly measure the extent to which each financial conglomerate participates in
each activity.
There are, however, special complexities associated with assessing whether diversification
of bank activities increases or decreases bank valuations. First, deposit insurance creates an
incentive problem that is not found outside of deposit-taking banks. Namely, diversification could
be good for valuations if diversification allows owners to exploit the deposit insurance guarantee
(Boyd, Chang, and Smith, 1998). We attempt to control for this by combining information on (i) the
generosity of government-sponsored deposit insurance and (ii) each bank’s ratio of deposits to total
liabilities. Second, governments typically heavily regulate or own banks. Thus, besides using
country-fixed effects in most specifications, we control for cross-country differences in bank
regulatory and supervisory policies and the degree of government ownership of banks. Indeed, the
potential “specialness” of banks motivates this study of diversity. A third complexity with
examining financial conglomerate diversity is the difficulty associated with measuring distinct
financial activities. Due to data constraints, we primarily differentiate banks by (i) interest income 9 Some research finds that financial intermediaries are more opaque than non-financial corporations, so that financial conglomerates may be much more difficult to monitor than industrial conglomerates or specialized financial intermediaries. Thus, agency problems may be comparatively severe in opaque financial conglomerates. Morgan (2002) finds that bond analysts have greater dispersion of bond ratings for banks as compared to non-financial corporations, which he interprets as suggesting greater opaqueness of banks. Flannery, Kwan, and Nimalendran (2002), however, do not confirm this finding using stock analysts reports, while Adams and Mehran (2003) argue that the boards of directors of banks may find it easier to monitor banks as compared to manufacturing firms because bank boards also have access to the reports of bank regulators.
5
versus non-interest income and by (ii) loans versus other earning assets. Thus, we generally do not
distinguish among securities underwriting, brokerage services, insurance underwriting, etc. We
simply differentiate banks by lending versus non-lending activities. This is a problem of precision
and could therefore produce insignificant results. We do not believe, however, that this biases the
results toward finding a diversification premium or discount. Furthermore, in robustness tests, we
(i) expand the analyses to include insurance companies and insurance activities and (ii) confirm that
our measures are highly correlated with diversity measures from different data sources.
We find a diversification discount. The market values banks that engage in multiple
activities much lower than if those banks were broken-up into financial intermediaries that
specialize in the individual activities. The results are “consistent” with the view that diversification
intensifies agency problems in financial conglomerates with adverse implications on market
valuations and these “costs” to diversification outweigh any benefits accruing from economies of
scope. Nevertheless, although we conduct an array of robustness checks to sharpen the
interpretation of the findings, we do not directly measure agency problems. Thus, we cannot
unequivocally conclude that intensified agency problems in financial conglomerates drive the
results. We can more confidently argue that economies of scope are not sufficiently large to produce
a diversification premium.
The results are robust to controlling for simultaneity bias and some non-agency cost
explanations of the diversification discount. As a preliminary test of whether bank-specific traits
influence both the value of the bank and its decision to diversify, we simply control for many bank-
specific characteristics directly in the valuation regressions and then use bank-fixed effects in other
specifications. Next, we use different sets of instrumental variables to extract the exogenous
component of bank diversity in assessing the influence of diversity on valuations. Third, we use a
6

Heckman (1979) self-selection model to control for potential biases induced by banks choosing to
diversify. Finally, we control for major bank mergers and acquisitions (M&A) since specialized
institutions may be inappropriate benchmarks for valuing target institutions in acquisitions or for
valuing mergers (Graham, Lemmon, and Wolf, 2002). When using these different statistical
methods to account for potential simultaneity bias, self-selection bias, and biases induced by
including M&As, we continue to find a diversification discount.
The diversification discount in financial conglomerates holds after conducting a battery of
additional robustness checks and controlling for additional possible explanations of the discount.
We (i) use different indicators of bank diversity, (ii) employ a variety of methods to control for the
valuation of different activities to identify the pure diversity effect, (iii) analyze the impact of
diversity on operating income as an alternative indicator of bank performance (instead of market
valuation), (iv) assess whether diversification simply involves banks that are comparatively
inefficient at loan-making diversifying into investment banking (and vice-versa), (v) test different
sub-samples of countries (with a particular focus on the United States) and years, and (vi) condition
on country-specific characteristics, including economic growth, inflation, and the size of the market,
that may influence valuations. Throughout, we find a negative relationship between diversification
and bank valuations.
The paper proceeds as follows. Section 2 describes the data. Section 3 presents the core
results. Extensions and robustness tests are presented in section 4. Section 5 concludes.
7

2. Data and Variables
A. Sample of Banks
Bank-level data come from Bankscope, which contains financial information on banks
around the world and which contains considerably more data on financial firms than alternative data
sources.10 To enhance comparability across countries, we exclude small banks, defined as banks
with less than US$ 100 million in total assets. Furthermore, we exclude “banks” that are neither
engaged in investment banking nor in deposit-taking and loan-making. In extensions presented
below, we explicitly consider insurance companies and insurance activities. Also, we eliminate
banks classified as Islamic banks because the accounting information does not match with the rest
of the sample. We also exclude banks with missing data on basic accounting variables, including
assets, loans, deposits, equity, interest income and non-interest income.11 Finally, we exclude
extreme outliers, which we define as banks where the basic accounting variables are more than four
standard deviations from the sample mean.12
For the 43 countries with banks in our sample, all the countries allow banks to engage in
some investment banking and other non-lending activities, though to differing degrees (see Barth et
al., 2004). The variability in regulatory restrictions is not crucial for our analyses. The crucial issue
is that banks engage in a spectrum of activities, ranging from purely lending to purely non-lending
activities. In robustness tests that we present below, we find that this paper’s results hold when
using an index of regulatory restrictions on bank activities as an instrument for our measures of
bank diversity. We use the last five years for which Bankscope has data, 1998-2002. The final
10 Below, we show that (i) our measures of financial intermediary activities are highly correlated with those from alternative datasets (e.g., Worldscope) but (ii) Bankscope has information about many more financial institutions than these alternative datasets. Bankscope is maintained by Bureau Van Dijk. 11 This reduces the sample by 232 bank-year observations. 12 This excludes only 43 bank-year observations. The results hold when we include these observations and winsorize the data.
8

dataset includes 3,415 bank-year observations (with a maximum of 836 observations for the year
2002).13
B. Bank-Level Measures of Activities and Diversity
Ideally, we would like detailed data on the degree to which each bank underwrites securities,
provides brokerage services, operates mutual funds, securitizes assets, underwrites insurance, etc.
Data availability, however, restricts our ability to measure the diversity of bank activities. Also, for
most countries there is no information available on fee income on loans or a breakdown of interest
income by asset category (loans versus other interest earning assets). Moreover, banks in the vast
majority of countries only report net fee income, not gross fee income.
Given these data constraints, the remainder of this subsection describes the core data on
bank activities and diversity. We divide the discussion into three parts.
First, we construct asset-based and income-based measures of the extent to which banks
engage in loan making activities or fee/trading-based activities. As a caricature, we can think of
specialized – or “pure” – commercial banks as converting deposits into loans. To continue the
caricature, we can think of specialized investment banks as underwriting securities but not making
loans. Of course, financial conglomerates provide a broad array of financial services; they make
loans, underwrite securities, underwrite insurance policies, securitize assets, and sell a wide-array of
financial services. Due to data limitations, we focus on the distinction between interest generating
activities and fee generating activities. In robustness tests reported below, we distinguish insurance
activities from the provision of other financial services.
13 The 43 countries included in our sample are: Argentina, Australia, Austria, Belgium, Brazil, Canada, Chile, Colombia, Denmark, Egypt, Finland, France, Germany, Greece, Hong Kong (China), India, Indonesia, Ireland, Israel, Italy, Japan, Jordan, Kenya, Rep. of Korea, Malaysia, Mexico, Netherlands, Norway, Pakistan, Peru, Philippines, Portugal, Singapore, South Africa, Spain, Sweden, Switzerland, Taiwan, Thailand, Turkey, United Kingdom, United States, and Venezuela.
9

Second, we construct asset-based and income-based measures of diversity. That is, we
measure the degree to which banks specialize in lending or non-lending services, or whether they
perform a diversity of activities. Lower values of these diversity indexes imply more specialization,
while higher values signify that the bank engages in a mixture of lending and non-lending activities.
Clearly there is a link between these diversity measures and the measures of the degree to which
banks engage in loan making or non-loan making activities. If a bank only makes loans, it will be
classified as having zero diversity. The two measures, however, also capture different traits. The
diversity indexes measure diversity per se, while the activity measures gauge where each bank falls
along the spectrum from a pure lending bank to a pure fee-generating bank. Since we are primarily
concerned with the impact of diversity per se on valuations, we focus on the diversity measures.
Third, this subsection summarizes the data and discusses whether these activity and diversity
measures accurately characterize individual banks. Given the difficult in measuring the degree of
financial conglomeration, it is important to assess whether our measures accurately characterize
individual financial institutions.
B.1. Measures of Activities
To measure where along the spectrum each bank falls from pure commercial banking to
specialized investment banking, we first construct an asset-based measure that equals loans relative
to total earning assets. Total-earning assets include loans, securities, and investments. Very high
values signal that the bank specializes in loan making, like the specialized commercial banks
mentioned above. Though with potential measurement error, very low values of these ratios signal
10

that the bank is not specialized in loan making and indicates the financial institution specializes in
non-loan making activities.14
The second measure of where each bank falls along the continuum from pure lending to pure
fee/trading-based activities is an income-based indicator that equals the ratio of net interest income-
to-total operating income. Total operating income includes net interest income, net fee income, net
trading income, and net commission income. In terms of assessing where along the spectrum each
bank falls, a specialized loan-making bank will have a larger ratio of net interest income-to-total
operating income, while a specialized investment bank is expected to have a larger share of other
operating income (fees, commissions, and trading income).
The asset-based measure suffers from fewer measurement problems than the income-based
measure, but we include both for robustness. In particular, since loans may yield fee income, the
income-based measure may overestimate the degree to which some lending institutions engage in
non-lending activities. Also, we would prefer to use gross rather than net income to measure bank
activities, but as noted above, we simply do not have gross income for many banks. To use the
income-based measure as a robustness check, however, we simply require that there is a positive
correlation between the extent to which banks engage in a particular activity and the net income
generated from that activity. Thus, while presenting both sets of results, we place greater weight on
the analyses using the asset-based measure.
14 In some countries, banks are forced by the government to invest in government securities. In robustness tests discussed below, we control for cross-country differences in reserve requirements and government ownership of the banking industry.
11

B.2. Measures of Diversity
Next, we construct two measures that focus on diversity per se.
Asset diversity is a measure of diversification across different types of assets and is
calculated as ( )
assetsearningTotalassetsearningOtherloansNet −
−1 , where Other earning assets include securities
and investments. Total earning assets is the sum of Net loans and Other earning assets, and |.|
denotes the absolute value indicator. Asset diversity takes values between 0 and 1 and is increasing
in the degree of diversification.
Income diversity is a measure of diversification across different sources of income and is
calculated as ( )
incomeoperatingTotalincomeoperatingOtherincomeerestintNet −
−1 . Net interest income is interest
income minus interest expense and Other operating income includes net fee income, net
commission income, and net trading income. Income diversity takes values between 0 and 1 and is
increasing in the degree of diversification. Note, the asset diversity and income diversity measures
are “complementary” in that asset diversity is based on stock variables, and income diversity is
based on flow variables.
For robustness, we compute and analyze alternative diversity measures. These alternatives
(i) combine information on both asset and income diversity and (ii) use various discrete thresholds
of diversity, rather than the continuous 0 to 1 variable just described. These yield similar results and
we discuss them further in the robustness section of the paper.
B.3. Summary Statistics and Discussions of Individual Banks
Before describing how we adjust for differences in bank activities in valuing banks, we
provide summary statistics on bank activities and analyze whether our measures of asset and
12

income diversity accurately reflect the activities of individual banks. Table 1 offers summary
statistics of the main variables. Averaging across all bank-year observations, the average Net
interest income to total operating income is 66 percent. The sample variation is substantial as
indicated by the standard deviation of 20 percent. The figures for the Loans to total earning assets
ratio are similar with an average of 66 percent and a standard deviation of 18 percent. The average
income diversity is 0.54 and the average asset diversity is 0.58. Again, the variation is substantial,
with some banks having income or asset diversity scores close to one (i.e., perfect diversification
between lending and non-lending activities). Note that all four measures take values between 0 and
1. These summary statistics are virtually identical when we examine only one year from the sample.
The asset and income measures of where banks fall along the spectrum from pure lending
banks to pure fee/trade generating banks are not perfectly correlated. The correlation between the
net interest income to total operating income and the loans to total earnings asset ratio is 52 percent.
This suggests that the two indicators measure different aspects of bank activities. As explained
above, there are greater measurement problems with the income-based measure, which may help
explain the relatively low correlation between the asset-based and income-based measures.
To assess whether these gross measures of bank activities and diversity accurately
characterize individual institutions, we now examine a few banks in detail. In particular, we first use
our database to identify individual banks that are classified as specialized commercial banks,
specialized investment banks, or financial conglomerates and then use company websites and
industry publications to obtain more specific information on each bank. To facilitate comparisons,
we consider data at the mid-point of the sample period, i.e., the year 2000.
The income-based measure of bank activities does a good job of distinguishing specialized
investment banks from banks focusing on lending. For example, Net interest income-to-total
13

operating income ranges from 1.6 percent for Okasan Holdings in Japan to 98.3 percent for Hudson
City Bancorp in the United States. Okasan Holdings is a major securities house with Okasan
securities the Group’s core enterprise. Expanding beyond this one case, other securities houses like
Daewoo Securities in Korea and Tokai Tokyo Securities in Japan have net interest income-to-total
operating income of less than 3 percent. Well-known U.S. investment banks Goldman Sachs (5.9
percent) and Lehman Brothers (8.4 percent) also have a net interest income-to-total operating
income ratio of less than 10 percent. At the other extreme, the income-based measures also identify
“pure” loan making banks. Hudson City Bancorp, with a net interest income-to-total operating
income ratio of 98.3 percent, is the holding company for Hudson City Savings Bank, a thrift that
operates approximately 80 branches in more than a dozen counties in New Jersey and focuses on
consumer lending as opposed to investment banking. Other banks with a net interest income-top-
total operating income ratio of more than 90 percent include Daito Bank in Japan, IKB Deutsche
Industriebank in Germany, and State Bancorp and First Sentinel Bancorp in the United States, all of
which are commercial banks with business strategies focused on lending operations.15
The asset-based measures of bank activities also pass the “smell test” by accurately
categorizing individual financial institutions. Loans-to-total earning assets ranges from 0.0 percent
for OZ Holdings in Switzerland to 98.3 percent for Paragon Group in the United Kingdom. OZ
Holdings is a specialized investment-banking group in Switzerland, with OZ Bankers the core
enterprise. According to its website, its business philosophy focuses on the Swiss equity and options
markets. Other financial intermediaries with a loans-to-earnings assets ratio of less than 10 percent
include Daiwa Securities of Japan and Daewoo Securities of Korea, banks that both focus on the
15 In total, 44 banks have a net interest income-to-total operating income ratio of more than 90 percent. In contrast, 22 financial intermediaries have a net interest income-to-total operating income ratio of less than 10 percent.
14

securities underwriting business.16 At the other end of the spectrum, Paragon Group is a publicly
listed provider of consumer finance, providing personal loans, retail loans, mortgage loans, and car
loans. Other banks with a loans-to-earnings assets ratio of more than 90 percent include Banco de
Andalucia in Spain, Neue Aargauer Bank in Switzerland, and Republic Bancorp and Household
International in the United States, all of which have business strategies that emphasize lending, with
minimal or no investment banking activities.
Next, we consider highly diversified banks, i.e., banks classified as engaging in a diverse set
of lending and fee/income generating activities. A number of banks have loan-to-total earning assets
ratios or loans to total earning asset ratios of very close to 50% (between 49 and 51%), including
HSBC Holdings, Citigroup, and ABN Amro Bank. Again, a detailed review of these financial
conglomerates verifies that these banks engage in both commercial banking and investment banking
activities, including asset management. In sum, our measures of (1) bank activities and (2) bank
diversity do a reasonably good job in characterizing individual banks.
C. Bank-Level Performance: Tobin’s q, Activity-Adjusted q, and Excess Value
Tobin’s q: We use Tobin’s q as a measure of bank valuation. Tobin’s q is calculated as the
sum of the market value of common equity plus the book value of preferred shares plus the book
value of total debt divided by the book value of total assets. As noted by Lang and Stulz (1994), q is
designed to measure the present value of future cash flows divided by the replacement cost of
tangible assets. Thus, one of the advantages of using q is that there is no theoretical reason to adjust
for risk or leverage to compare firms. Nevertheless, two concerns are frequently expressed about
16 Goldman Sachs and Lehman Brothers have a loans-to-earnings assets ratio of 10.9 percent and 13.2 percent respectively. In total, 11 financial intermediaries have a loans-to-earnings assets ratio of less than 10 percent, while 28 banks have a net loans-to-earnings assets ratio of more than 90 percent.
15
using q to measure bank performance. First, banks are extremely highly leveraged. Second, banks’
tangible assets are primarily financial assets, so market values and replacement costs are identical
for most assets (Brook et al. 1998). For robustness, therefore, we reassess – and confirm – the
results using a simple performance measure: the ratio of operating income to total assets.
Activity-adjusted q: Since different banking activities may be valued differently, it is
important to control for the degree to which banks engage in different activities when comparing
their valuations. For example, if investment banking is valued differently from commercial banking,
one needs to control for the extent to which the bank is engaged in either activity in order to isolate
the relationship between valuation and diversity per se. Thus, we compute excess values following a
modified version of the “chop-shop” approach introduced by LeBaron and Speidell (1987) and
Lang and Stulz (1994). The idea is to compare the Tobin’s q of each bank with the q that would
exist if the bank were “chopped” into separate financial “shops” (pure-activity banks) that each
specializes in a financial activity (e.g., lending or fee/income generation).
Activity-adjusted qj is our estimate of the q that would prevail if bank j were divided into
activity-specific financial institutions and then priced according to the q’s associated with each of
those activity-specific activities. At a general level, consider bank j that engages in n activities.
Let jiα equal the share of the ith activity in the total activity of bank j, so that . Let qi equal
the Tobin’s q of financial institutions that specialize in activity i (pure-activity q). Then,
11
=∑=
n
ijiα
∑=
=n
ijij
iqqadjustedActivity1α
More specifically, we primarily consider two banking activities: lending operations versus
non-lending operations, including trading, investments, and advisory services. From an asset
perspective, we focus on the distinction between investments in loans and investments in securities
16

or other companies. From an income perspective, we focus on the distinction between interest
income (mainly from loans) and non-interest income, including fees, commissions, and trading
income. For simplicity, we refer in what follows to the first activity as “commercial banking” and to
the second as “investment banking”. Thus, q1 is the valuation of an activity-specific bank focused
on commercial banking, while q2 is the valuation of an activity-specific bank focused on investment
banking. With two activities, the definition of activity-adjusted q for bank j simplifies to the
following:
))1(()( 21211121 qqqqqadjustedActivity jjjjj αααα −+=+= (1)
In what follows, we compute two activity-adjusted q measures. That is, we calculate activity-
adjusted q based on both the asset and income measures of the share of bank activity. Thus, 1jα
equals either the ratio of net interest income to total operating income or the ratio of net loans to
earnings assets for bank j.
Excess value: equals the difference between a bank’s actual q and the activity-adjusted q, so
that the excess value for bank j is
))1(()( 21211121 qqqqqqvalueExcess jjjjj αααα −+−=+−= (2)
Again, we compute two measures of excess value, one based on weights determined by the asset
composition of the bank and the other determined by the income composition of the bank.
To measure activity-adjusted q’s and compute excess value, we construct q1 and q2 (pure-
activity q’s) from banks that specialize in one activity. We follow the literature in defining what
constitutes specialization. For asset-based measures, banks where 90% of the assets are associated
with one activity are classified as specialized. In this case, q1 is the average q of banks with a ratio
of net loans to earnings assets of more than 0.9. Similarly, for income-based measures, specialized
banks receive 90% of their income from one activity, so that q1 equals the average q of banks with a
17
ratio of net interest income to total operating income of more than 0.9. These pure-activity q’s are
calculated by averaging across banks from different countries. Most countries do not have a
sufficiently large number of pure-activity banks to estimate pure-activity q’s at the country-level. In
many of the regression analyses below, we use country fixed effects and year dummy variables to
control for differences in q across countries and years. Moreover, instead of averaging across all
specialized banks, we confirm this paper’s results when using only U.S. banks to estimate pure-
activity q’s. Furthermore, as discussed below, the results hold when using alternative definitions of
pure-activity banks, when only examining U.S. banks, and when excluding U.S. banks from the
analyses.
In constructing activity-adjusted q’s and excess values, we need to compute αj1 and αj2,
which are the shares of pure commercial banking and investment banking in bank j’s activities. The
eights are based on the relative importance of interest income to total operating income in the case
of the income diversity measure. In case of the asset diversity measure, the weights are based on the
relative importance of loans to total earning assets.
D. Alternative Data Sources: Worldscope and Compustat
Although we considered alternative data sources to measure bank diversity, there are
important advantages to using Bankscope. One alternative data source is Worldscope. For instance,
Lins and Servaes (1999) use data from Worldscope to examine the diversification discount in non-
financial corporations. At the two-digit SIC code level, Worldscope has data on bank activities
(e.g., SIC 60: Depository institutions, SIC 61: Nondepository credit institutions, and SIC 62:
Security, commodity brokers, and services). These data, however, are self-reported by banks and
are therefore subject to the Villalonga (2004a,b) biases that we discussed above. Furthermore, there
18
is not a clear match between reporting that an institution participates in an activity and the extent of
this participation (i.e., Worldscope does not have segment data for most banks). That is, we cannot
confidently assign a percentage of bank income or assets to a particular SIC code activity, so we
cannot use the two-digit SIC code data to compute comparable diversity measures to the ones that
we have. Furthermore, we only have data from Worldscope on 62% of the observations in our
sample. Nevertheless, we used Worldscope to classify banks as either lending institutions (SIC 60
or 61) or investment banks (SIC 62), where we only use the 1334 observations on specialized banks
that report operating in only one of these two categories. We find a very strong correlation between
the Worldscope data and the Bankscope measures of bank activities. Specifically, the correlations
between Lending institutions (from Worldscope) and both Loans/Earning assets and Interest
Income/Operation income (from Bankscope) are about 0.6 and significant at the one percent level.
The correlations are similar for Investment banks. Thus, our measures of bank activities correspond
closely to the self-reported information available from Worldscope. Given the problems and
limitations associated with the Worldscope data on financial institutions, we use the Bankscope
data.
Another alternative data source is Compustat. Although much of the literature on corporate
diversification examines U.S. corporations with Compustat data, it is not possible to follow this
literature and focus only on financial institutions. Besides the problems associated with using
Compustat data discussed above, Compustat has (segment) data on only 18 of the 362 U.S. banks in
our sample. Furthermore, most of these banks do not report income and asset data by activity. Given
all these limitations, we cannot apply the Lang and Stulz (1994) chop-shop approach to U.S. banks
based on Compustat data. Thus, we develop a new approach that does not rely on self-reported
19

segment data but instead directly computes the degree of diversity based on income and asset data
in Bankscope.
3. Empirical Results
A. The Excess Value of Diversified Banks: Initial Results
The first two rows of Table 2 show the mean and median excess values of diversified banks.
We report excess values for diversified banks measured by both (i) income diversity and (ii) asset
diversity. Again, a bank is defined as diversified if the ratio of interest income to total operating
income is between 0.1 and 0.9 or if the ratio of loans to total earning assets is between 0.1 and 0.9.
Diversified banks have large negative excess values, which are significant at the one percent
level. The excess values for diversified banks are about -0.06 (or 6% of average q) using either the
income or asset measure of bank diversity and when using either means or medians. This indicates a
diversification discount. Besides comparing the discount to average q, we can also compare the
discount to the variability of q, which indicates that the diversification discount is about 38 percent
of the standard deviation of q. The diversification discount as a percentage of average q is smaller
than those obtained by Lang and Stulz (1994) for non-financial corporations, 6% relative to 32%.
This is consistent with findings by Berger and Ofek (1995) who find that (i) industry diversification
reduces value on average, but (ii) relatedness mitigates the value loss from diversification. In other
words, it matters whether one considers diversification into completely different industries or into
closely related industries (for example, within the same 2-digit SIC code industry). Diversification
into closely related activities, such as within the financial services industry, produces a smaller
discount.17
17 Part of the difference between the discount in corporations and banks is explained by differences in the denominator: the q of non-financial corporations is higher than the average value of q in our sample of financial institutions (1.11
20

The third row in Table 2 confirms that diversified banks have negative excess values using a
different approach. Rather than computing means and medians of excess values, the third row
presents the estimated coefficient and t-statistic on the diversification dummy variable from a
regression of Tobin’s q on constant, country dummy variables, year dummy variables, and a
diversification dummy variable. We label this row, “unadjusted excess value,” because we do not
directly adjust bank valuation by each bank’s mix of activities, i.e., we do not use excess value as
the dependent variable. The results show that on average the q of a diversified bank is lower than
the q of specialized banks (as defined by either the income or asset diversification dummy variable
respectively) after controlling for country and year effects.
B. The Excess Value of Diversified Banks: Regression Results
The objective is to assess the relationship between diversity per se and bank valuation while
abstracting from the possibility that the market values different financial activities differently and
that banks engage in distinct mixes of financial activities. In other words, it is important to control
for the possibility that banks with a large share of non-interest income may be valued differently
from banks that obtain revenues predominantly from interest. The standard way to do this is to use
the chop-shop approach and compute excess values. While Tobin’s q incorporates both the market’s
valuation of (i) diversity and (ii) each bank’s set of activities, excess value controls for the market’s
valuation of different bank activities by subtracting activity-adjusted q from Tobin’s q and therefore
provides a more direct way for assessing the impact of diversity per se on the market’s valuation of
the bank.
compared to 1.06). Also, when comparing the discount to the standard deviation of q, the discount in Lang and Stulz (1994)’s examination of non-financial corporations is 29 percent of the standard deviation of corporate q’s (0.35/1.22), while we find that the discount in banks is 38 percent of bank q’s.
21

Columns (1) and (2) of Table 3 report the results from regressing excess value on the
income diversity and asset diversity measures respectively. Since we are pooling data across
countries and over time, the regressions also include country and year dummy variables.
Furthermore, it is inappropriate to assume that bank observations over time are independent.
Consequently, the standard errors are adjusted for clustering at the bank-level.
We find that both income diversity and asset diversity are negatively linked to excess value.
After controlling for country and time effects and after controlling for differences in the valuation of
different bank activities, there is a diversification discount in financial conglomerates. The
relationship is economically meaningful. For example, a one-standard deviation increase in asset
diversity reduces excess value by almost 0.03. This is not inconsequential, when considering that
the mean value of excess q is -0.06 with a standard deviation of 0.17.
Table 3 also assesses whether there is a diversification discount in financial conglomerates
by examining Tobin’s q instead of excess value. Recall that in regressions (1) and (2), the
dependent variable is excess value, which equals Tobin’s q minus activity-adjusted q. In regressions
(3) and (4), the dependent variable is Tobin’s q. To control for the fact that banks engage in
different mixes of financial activities, regressions (3) and (4) control for these differences by
including a measure of the mixture of each bank’s activities as a regressor. Thus, when examining
income diversity, we regress Tobin’s q on income diversity and net interest income to total
operating income (regression 3). Regression (4) is very similar, except that it examines asset
diversity and controls for loans to total earning assets. In these regressions, we also include country
and year dummy variables and adjust the standard errors for clustering at the bank level.
The Table 3 results on Tobin’s q confirm the earlier results: There is a diversification
discount in financial conglomerates. We find a negative association between the diversity of bank
22

activities and the market’s valuation of the bank while controlling for differences in the mixture of
bank activities. The results also indicate that banks that engage in less traditional activities – such as
activities that generate non-interest income and activities that require investments in assets other
than loans – are generally valued more highly than banks more specialized in loan making. Since
income and asset diversity remain negatively associated with bank valuations when controlling for
net interest income to total operating income and loans to total earnings respectively, the findings
suggests that it is specialization per se that is linked with lower bank valuations.
C. The Excess Value of Diversified Banks: Bank-Level and Country-Level Controls
In Table 4, we investigate the robustness of the diversification discount in financial
conglomerates to controlling for bank-level and country-level characteristics. Table 4 has two
panels. Panel A presents regression results that focus on income diversity and Panel B presents
results that focus on asset diversity. In both panels, the first four columns present results where the
dependent variable is excess value, which is the standard measure for assessing the diversification
discount. The last four columns in each panel present results where the dependent variable is
Tobin’s q. When the dependent variable is Tobin’s q, we include both the diversity measure
(Income diversity in Panel A and Asset diversity in Panel B) and an activity measure (Net interest
income to total operating income in Panel A and Loans to total earning assets in Panel B). We
include the activity measure to control for the mixture of activities conducted by each bank and to
therefore identify the relationship between valuation and diversity per se. In Table 4, besides
controlling for specific bank-level traits and controlling for time-varying country characteristics, we
also use country and year fixed-effects.
23
In terms of bank-level controls, we control for numerous bank-level traits in Table 4 and
continue to find a negative, significant relationship between measures of the diversity of bank
activities and the market’s valuation of the bank. First, size is often thought to affect valuation and
performance through economies of scale. As in Lang and Stulz (1994), we therefore control for the
logarithm of total assets. Furthermore, we also include the logarithm of total operating income as an
alternative measure of bank size. Total operating income may better capture the importance of a
bank’s off-balance sheet items. While the logarithm of total operating income enters the valuation
regressions positively and significantly, we continue to find that diversity is associated with lower
valuation. Second, we include the ratio of total deposits to total liabilities (Deposits/Liabilities). To
the extent that a higher Deposits/Liabilities ratio implies that the bank has access to low cost,
subsidized funding (deposits generally being an inexpensive source of funding and deposits
generally enjoying government subsidized insurance), then a higher Deposits/Liabilities ratio might
signal higher valuations.18 Third, we control for the book value capitalization of the bank
(Equity/Assets). A well-capitalized bank may have fewer incentives to engage in excessive risk-
taking. If this were the case, we would expect a positive correlation between the ratio of book value
of equity to total assets (Equity/Assets) and our excess valuation measure. We do not find that
Equity/Assets enters with a statistically significant coefficient.19 Fourth, we control for past
performance by including the growth rate in total assets over the last three years and or the growth 18 We extended these analyses by multiplying each bank’s Deposit/Liabilities ratio by the generosity of the deposit insurance regime of the bank’s home country in order to provide a more precise estimate of the degree of government subsidization of each bank’s liabilities. We obtain information on the generosity of the deposit insurance regime from Demirguc-Kunt and Detragiache (2002). Controlling for each bank’s liability structure in this way does not affect the findings. We continue to find a diversification discount in financial conglomerates. 19 The results are robust to controlling for the ownership structure of the bank. In particular, we control for the direct and indirect cash-flow rights of the controlling shareholder (CF). Caprio, Laeven, and Levine (2004) show that CF positively influences bank valuations. The reason is that controlling shareholders are less likely to expropriate bank resources when they have a larger stake in the future dividend streams of the bank. A controlling shareholder with substantial cash-flow rights also has greater incentives to monitor management in an effort to prevent empire building that satisfies managerial preferences for controlling a diverse financial conglomerate through value-destroying acquisitions and expansions. Including CF does not affect the finding of a diversification discount. We do not include these results in the table because including CF cuts the sample to less than 600 observations.
24

rate in operating income over the last three years (Growth in assets and Growth in income
respectively).20 Past performance is commonly used as a proxy for growth opportunities. When
including these variables, however, income and asset diversity still enter negatively and
significantly. Fifth, competition in the product market may influence the governance of banks, so
that omitting information on the structure of the banking industry may lead to inappropriate
inferences regarding the relationship between valuation and diversity. Toward this end, we include
each bank’s market share of deposits as an indicator of the degree of competition facing the bank.21
Banks with a large market share may exert market power and enjoy correspondingly higher values.
We find no evidence of this. More importantly for this paper’s purposes, controlling for these bank-
level variables does not affect the findings on income and asset diversity: There is still a significant
diversification discount.
We also include country-level controls that vary over time (regressions 3, 4, 7, and 8 in
Table 4), but this does not affect our findings. Specifically, we control for the current annual
growth rate in the real Gross Domestic Product (GDP) per person to control for business cycle
fluctuations and overall economic conditions. We also control for the current annual inflation rate
since inflation can affect bank performance and may influence bank decisions to diversify into non-
lending financial services (Boyd, Levine, and Smith, 2001).
Overall, we find that controlling for country traits and bank characteristics does not affect
the negative relationship between diversity and excess valuation. Asset diversity enters all of the
regressions in Table 4, Panel B negatively and significantly at the five percent level. The income
diversity measure, which has the greater measurement error problems noted above, enters all of the
20 Due to missing data on past growth rates in assets and income, the sample size in Table 4 is reduced by 642 bank-year observations. We obtain the same conclusions when we exclude these two growth rate variables. 21 Using share of total assets instead of share of deposits does not change the conclusions.
25
excess value regressions significantly at the five percent level and all of the Tobin’s q regression
negatively and significantly at either the five or ten percent level.
In further robustness tests, we also controlled for an array of country traits that on a priori
grounds may influence corporate governance and hence the linkages between excess value and the
diversity of bank activities. Time-varying data do not exist on these variables, so the country fixed
effects are dropped in these regressions. We do not create a separate table for these results and
simply describe the findings. First, we controlled for cross-country differences in shareholder rights,
as measured by La Porta et al (1998), since strong shareholder protection laws may mitigate agency
problems between corporate insiders (managers and large shareholders) and small shareholders.
Second, we controlled for the competitiveness of the banking industry, as measured by each
country’s level of banking sector concentration, since the degree of competitiveness in product
markets may influence corporate governance.22 Third, we controlled for the generosity of the
deposit insurance regime, as measured by Demirgüç-Kunt and Detragiache (2002), since generous
deposit insurance may reduce the corporate governance role of depositors and hence influence the
diversification discount. Fourth, we controlled for the degree of government ownership of banks,
since government owned banks may inefficiently diversify into a range of activities. Thus,
government intervention in banking could be the source of the diversification discount, not diversity
per se. Finally, we controlled for cross-country differences in bank supervision and regulation, by
using data from Barth et al (2001), since Barth et al (2004) and Demirguc-Kunt, Laeven, and Levine
(2004) show that banking sector policies influence bank performance. Specifically, we controlled
for reserve requirements, the ability of supervisory agencies to oversee and discipline banks, and the
degree to which supervisors force accurate, timely information disclosure to the public. While some
22 More specifically, we measure concentration as the percentage of total banking system assets held by the three largest banks. We compute this from the Bankscope database.
26

of these country characteristics enter the regressions significantly, they do not change the finding of
a negative relationship between diversity and valuation.
4. Endogeneity, Extensions, and Additional Robustness Tests
A. Endogeneity
Since financial institutions choose to diversify or not to diversify, the same bank-level
characteristics that guide this decision may also affect the market’s valuation of the bank. Thus, as
argued by Campa and Kedia (2002), Chevalier (2000), Graham, Lemmon, and Wolf (2002),
Lamont and Polk (2001), Maksimovic and Phillips (2002), Villalonga (2004a, b), Whited (2001),
and others, failure to control for firm traits that drive the diversification decision may produce
misleading econometric results that inappropriately attribute the diversification discount to
diversification per se rather than to the underlying traits that induce firms to diversify. “A proper
evaluation of the effect of diversification on firm value should take into account the firm-specific
characteristics that bear both on firm value and on the decision to diversify.” (Campa and Kedia,
2002, p. 1731)
To control for bank-specific traits and endogeneity concerns, we undertake four steps. First,
we test whether bank-specific traits besides diversity drive the results. In addition to controlling for
the wide range of bank-specific characteristics described above, regression (1) in Panels A and B of
Table 5 includes fixed effects for each bank (and each year). The bank fixed effect regressions
confirm the results. Furthermore, these results hold when we also include the time-varying bank-
specific variables from Table 4 in these regressions.
Second, we use four instrumental variable (IV) specifications. Country factors may induce
both diversification and the conglomerate discount. If diversity varies systematically across
27

countries and if including country-fixed effects does not fully capture this effect, then the
diversification discount may reflect cross-country rather than cross-bank variation. Thus,
simultaneity bias may invalidate the interpretation of the coefficient on diversity. We address this
potential bias by using an index of regulatory restrictions on bank activities as an instrument for the
diversity variable. The index of regulatory restrictions is from Barth, Caprio, and Levine (2004)
and is increasing in regulatory restrictions on the degree to which banks can engage in underwriting,
brokering and dealing in securities.23 Thus, we relate banks’ market valuations to the exogenous
variation in the structure of financial institutions.24
The second IV specification uses a measure of regulatory restrictions on bank entry as an
instrumental variable for diversity. From Barth, Caprio, and Levine (2004), we use the fraction of
banking license applications denied by the regulatory authority as a proxy for restrictions on the
entry of new banks.25 A higher score indicates greater restrictions on entry. For our sample, the
entry variable ranges from 0 to 1, with a mean of 0.28. In more protected banking environments,
bankers may have greater latitude to engage in activities that extract private benefits from the bank,
including diversifying into other financial activities.
23 The index of regulatory restrictions equals one if the full range of activities can be conducted directly in the bank. It equals two if the full range of activities can be conducted, but some or all must be conducted in subsidiaries. The index equals three if less than full range of securities market activities can be conducted in the bank or subsidiaries. The index equals four if securities activities are prohibited, i.e., they cannot be conducted in either the bank or subsidiaries. No country in our sample has a value of four. The mean for our sample is 1.6. 24 We do not include the bank-specific control variables used in Table 4 in the IV regressions because they are potentially endogenous and we do not have valid instruments for these variables. Including these endogenous variables could bias the IV results. Concerns about biasing the coefficient estimates by including endogenous bank-specific regressors do not hold for the bank fixed effect regression or the Heckman self-selection estimation in Table 5. For these regressions, including the bank-specific control variables from Table 4 does not alter the results. 25 One potential shortcoming with this measure of regulatory restrictions on the entry of new banks is that if there are zero applications – which may indicate the presence of insurmountable entry barriers that discourage potential banks from completing an application – this variable is not defined. However, when we replace the missing values with ones in those countries that received zero entry application, the results hold.
28
The third IV specification uses the average income (asset) diversity of other financial
institutions in the economy as an instrumental variable for each bank’s degree of income (asset)
diversity. This is an alternative way of abstracting from country factors that induce diversification.
The fourth IV specification is motivated by the instruments employed by Campa and
Kedia’s (2002) examination of industrial conglomerates. Following their work, we include as
instruments the logarithm of total assets and the return on assets to control for the size and
performance of financial institutions since these characteristics may influence diversification
decisions. We also include the share of diversified banks in the country as an instrument, since, as
discussed above, there may be country-specific factors that influence the attractiveness of
diversification. The instrument set also contains a dummy variable for whether the financial
institution is listed on the New York Stock Exchange (NYSE), since listing on a major exchange
may give the financial institution greater visibility, reduce information costs, and lower the cost of
capital and thereby make it easier to diversify. Similarly, since banks with more liquid equities
might enjoy higher relative valuations, we use a dummy variable for whether the bank belongs to
the S&P financial index as an instrument for diversity. Besides using instrumental variables to
extract the exogenous component of diversity, the analyses include year dummy variables and
adjust the standard errors for clustering at the bank-level. The fourth IV specification also includes
country dummy variables.
Using any of the four sets of instrumental variables, the regression results continue to
indicate a diversification discount in financial conglomerates. The first set of IV results that use the
index of regulatory restrictions on commercial bank activities as an instrument are presented in
column (2) of Table 5 (both Panels A and B on income and asset diversity respectively). As shown,
income diversity and asset diversity remain negatively and significantly associated with excess
29
value. As expected, the first stage regression results show that banks are more diversified in
countries that place fewer restrictions on banking activities. The second set of IV results uses the
fraction of entry applications denied as an instrument for diversity (column 3). These IV results also
confirm the finding of a diversification discount in financial conglomerates. Also, the first stage
regression indicates that the degree of regulatory restrictions on the entry of new banks is positively
related to diversity. These results are consistent with the agency story in Fama and Jensen (1983)
and Jensen (1986) who argue that bank managers are better able to consume private benefits
(arising from diversification) when product-market competition is less vigorous. The third set of IV
results use the average diversity of other banks in the country as an instrument, and are presented in
Table 5’s column (4) for both income diversity (Panel A) and asset diversity (Panel B). Income
diversity enters negatively and significantly at the ten percent level (Panel A), while asset diversity
enters negatively and significantly at the five percent level. The fourth set of IV results, which are
based on a more comprehensive set of instruments and with correspondingly higher first-stage R-
squares, produce even stronger results. As shown in column (5) of Table 5, both income diversity
and asset diversity enter the excess value equation negatively and significantly at the five percent
level. The instrumental variable regressions are consistent with the view that diversity in financial
conglomerates destroys value.
Third, we use Heckman’s (1979) two-step procedure to control for endogeneity. The goal is
to control for the self-selection bias created by banks’ choosing to diversify by incorporating the
diversification decision formally into the econometric estimation. In the first-step, we estimate
whether the bank is diversified. Thus, depending on whether we are examining income or asset
diversity, the dependent variable in the first-step is either (a) a dummy variable that equals one if
the net interest income is between 10 and 90 percent of total income, or (b) a dummy variable that
30
equals one if loans account for between 10 and 90 percent of total earning assets. Thus, the first-step
involves a probit estimation where the explanatory variables are the instrumental variables used in
regressions 5 of Table 5: the logarithm of total assets, return on assets, share of diversified banks in
the economy, a dummy variable for whether the bank is included in the S&P financial index, and a
dummy variable for whether the bank is listed on the NYSE. In the second stage, excess value is the
dependent variable. While controlling for self-selection bias, the second stage yields estimates of (1)
the relationship between diversity and excess value and (2) the self-selection parameter (Lambda).
The results of the two-step estimation of the endogenous self-selection model confirm the
existence of a diversification discount in financial conglomerates. The results on income diversity
are reported in column (6) of Panel A in Table 5, while the asset diversity results are given in Panel
B. In the excess value equation, both income diversity and asset diversity enter negatively and
significantly. The selection parameter, Lambda, is negative but insignificant for the income
diversity regression (Panel A). The negative coefficient on Lambda suggests that bank
characteristics that are associated with banks diversifying are negatively correlated with excess
value. But, Lambda is insignificant, suggesting that self-selection is not driving the results.
Moreover, Lambda is positive, but again insignificant, in the asset diversity regression (Panel B).
Thus, the self-selection model confirms the results. These results are robust to including the bank-
specific variables from Table 4.
In sum, unlike the findings in industrial conglomerates (e.g., Campa and Kedia, 2002;
Maksimovic and Phillips, 2002), we do not find that simultaneity bias produces the diversification
discount in financial conglomerates. When using bank fixed effects, employing instrumental
variables, or estimating a self-selection model, we continue to find that diversity per se lowers
market valuations.
31

B. Scale and Scope of Specialized and Diversified Banks
Maksimovic and Phillips (2002) develop a model that clarifies some conditions under which
conglomerate firms are less productive than specialized firms, but the resultant diversification
discount has nothing to do with diversification destroying value. They note that firms may differ in
terms of expansion opportunities/capabilities. They assume that there are diminishing returns within
each activity. Thus, a firm that is highly productive in activity A faces higher opportunity costs
associated with diversifying into activity B than a firm that is less productive in activity A. This
yields the prediction that those firms that are most productive will be less likely to expand into new
activities and instead expand within their own specialized area, which implies that a specialized
firm in activity A will tend to be larger than a conglomerate firm’s operations in activity A.
Although our paper is different in that we examine diversification within the financial
services industry, we are still concerned that bank specific differences may drive the results.
Besides the assortment of econometric procedures that we use to control for endogeneity in Table 5,
Table 6 provides further information. Table 6 summarizes differences between diversified and
specialized financial intermediaries by presenting regressions of bank characteristics on dummy
variables that indicate whether the bank is a specialized commercial bank or a specialized
investment bank. The default category is a diversified bank.
The Table 6 results do not support the view that banks that lack expansion opportunities in
one activity diversify into other activities. Diversified banks do not have smaller loan portfolios
than specialized commercial banks, nor do diversified banks have smaller fee/transaction based
activities than specialized investment banks. Thus, the data are inconsistent with the view that, for
example, a productive lending bank keeps expanding its lending operations, while a less productive
32

lending bank expands into investment banking. Rather, financial conglomerates tend to be larger
than specialized commercial banks even within the specialized activity of lending.
C. Controlling for Mergers
Furthermore, mergers can bias the diversification results.26 In particular, Graham, Lemmon,
and Wolf (2002) use data from Compustat and information on mergers to assess whether the
diversification discount provides misleading inferences because there are systematic differences
between the divisions of conglomerates and the specialized firms against which they are
benchmarked in the “chop-shop” approach. They find that target firms are already discounted. Thus,
they argue that the diversification discount does not arise because diversification destroys value.
Rather, they argue that conglomerates purchase discounted target firms, so that the chop-shop
approach yields a discount.
Although we do not have sufficiently detailed information on all mergers to replicate the
Graham, Lemmon, and Wolf (2002) analysis for the case of banks, we control for the possible
impact of mergers in two ways. First, we trace the history of every bank in our sample to examine
whether they had recently undergone an important merger or acquisition. Specifically, for every
bank and every year, we determine whether the bank merged with or acquired at least one other
financial institution such that there was a change in the name of the financial institution. Then, we
create a dummy for each bank that equals one in the year of the merger or acquisition. To assess
whether mergers affect excess value with a lag, we also include lagged values of this
merger/acquisition dummy variable. Second, we identify all financial intermediaries that
experienced a change in assets of more than 50% from year t-1 to year t, which may reflect a large
26 There exists a large literature on the net gains to shareholders of bank mergers. Houston et al (2001) find for the period 1985 to 1996 that bank mergers in the United States have been value enhancing, largely because they generated cost savings.
33

acquisition. We then exclude observations on that intermediary for year t and all later years. While
large changes in assets may reflect other phenomenon, this represents an additional way of
accounting for the possible impact of mergers and acquisitions on the results.
As shown in Table 7, controlling for major mergers and acquisition in these ways does not
affect the results on the diversification discount. Income diversity and asset diversity continue to
enter negative and significantly. The merger/acquisition dummy variables do not affect the findings
on diversity and the dummy variables do not enter significantly. Similarly, excluding financial
institutions that experienced a large change in assets does not affect the results. By controlling for
mergers and acquisitions that are likely to affect valuations substantially and by controlling for
endogeneity, this allays concerns that we are misinterpreting the diversification discount.
D. Controlling for Insurance Activities
As an extension, we also include insurance activities in the analysis. From Bankscope, we
have information on banks and investment banks as discussed above. We also have information on
four bancassurance companies, which are in Bankscope but also included in Worldscope as
insurance companies. These four companies are Fortis, Sampo, Irish Life & Permanent, and ING
Groep.
Table 8 indicates that controlling for insurance activities in our analyses does not affect the
results. In columns (1) and (3), we simply eliminate the four bancassurance companies (17
conglomerate-year observations) from our standard analyses. Thus, the dependent variable is excess
value and we control for income and asset diversity respectively. Excluding these financial firms
does not change the results. In columns (2) and (4), we use dummy variables for these four financial
firms. Again, this does not change the results.
34

Next, we confirm the existence of a diversification discount in financial conglomerates when
extending the chop-shop approach to also include insurance activities (besides commercial banking
and investment banking). We obtain information on insurance companies from Worldscope (1428
firm-year observations over the period 1998-2002). We only include insurance companies because
Bankscope does not have insurance information on banks. In this robustness test, we compute
excess values using a three-dimensional chop-shop approach rather than the two dimensional
approach based on commercial and investment banking activities described above. Specifically, the
dependent variable in column (5) is the difference between actual q and activity-adjusted q (excess
value) based on income diversity, where we consider three sources of operating income: interest
income, premium income, and other income (including income from fees and commissions). We
use the global sample of insurance companies in Worldscope that are not included as banks in
Bankscope to calculate the average q of stand-alone insurance companies. Activity-adjusted q is
therefore calculated as follows: (Net Interest income/Total operating income)*Average q of pure
commercial banks + (Net premium income /Total operating income) *Average q of pure insurance
companies + (Other income/Total operating income) *Average q of pure investment banks.
Similarly, the income diversity with insurance variable considers three rather than two sources of
income: interest income, premium income and other income. To calculate net premium income, we
subtract net claims arising from insurance activities from premium income. The variable is
constructed such that 0 denotes no diversity (one source of income) and 1 denotes high diversity (all
three sources have equal share in total income).27 As shown in column five, diversity is negatively
associated with excess value when extending the analyses to include insurance activities.
27 The variable is calculated as follows: For banks without insurance activities: 1-|(Net interest income-Other income)/Total operating income|. For banks with insurance activities: 1 - |Net interest income/Total operating income - (1/3)| - |Net premium income/Total operating income - (1/3)| - |Other income/Total operating income - (1/3)|, where |.| denotes the absolute value indicator.
35
E. Sub-Samples
Next, we investigate whether the results are sensitive to examining sub-samples of banks,
excluding U.S. banks, only examining U.S. banks, or weighting observations differently.
First, we restrict the sample to diversified banks, i.e., firms for which the Diversity dummy
variables used in the previous section take a value of one (column (1) in Table 9). The results are
not affected.
Second, we restrict the sample to commercial banks only, as defined by the Bankscope
database, thereby excluding investment banks but also savings banks, cooperative banks, and bank
holding companies (column (2) in Table 9). The advantage of focusing on commercial banks is that
the group of firms is more comparable and less diverse. Again, the results are very similar.
Third, we exclude U.S. banks from the sample. We want to make sure that the results are not
driven by the U.S. banking system, which is quite special in the senses that it (i) has many small
banks and (ii) has only recently allowed commercial banks to engage in investment banking
activities. The results are presented in column (3) of Table 9. The findings are very similar.
Fourth, we examine only U.S. banks. In doing this, we first present the results when
continuing to use the global sample of banks to compute the valuation of pure activity banks
(column 4) and then we present the results when using only U.S. banks to compute pure activity q’s
(column 5). Looking at only U.S. banks is less informative than examining the full sample in the
sense that the Gramm-Leach-Bliley Act only recently (formally) expanded the range of permitted
bank activities. Indeed, looking at banks outside of the United States that have historically had
fewer regulatory impediments to diversifying activities may provide information regarding future
developments within the U.S. financial services industry. Nevertheless, we provide the U.S. only
36

results for completeness. As shown, while the results are not statistically significant for the Income
diversity measure when focusing on U.S. banks (columns (4) and (5) of Panel A), the results do
hold when using the Asset Diversity measure (columns (4) and (5) of Panel B). As noted, we
believe the Asset diversity measure is a more accurate measure of diversity because loan-making
banks may charge fees to generate income, which would distort the income measure. The use of
fees in loan-making may be more pronounced in U.S. banks. This distortion of diversity is less
likely for the asset based measure. Thus, we place more weight on the Asset diversity results.
Finally, we use weighted least squares, with the inverse of the number of country
observations (sampled banks) as weights, to verify that our results are not driven by differences in
the number of (sampled) banks across countries. The results still indicate a diversification discount
in financial conglomerates (column (6) of Table 9).
F. Alternative Valuation and Performance Measures
We consider alternative measures of firm valuation and performance.28 Thus far, we have
used the average q of single-activity banks to construct activity-adjusted q’s. Due to the sampling
variation in q for single activity banks, we test whether the results are robust to using the median
value of q of single-activity banks instead. The results hold (columns (1) and (4) of Table 10).
28 We have also checked the robustness of our results to the use of alternative diversity measures and possible non-linearities in the relationship between diversity and valuations. First, we use dummy variable to assess whether the relationship between diversification and valuation is more pronounced at high levels of diversity. We construct a dummy variable that equals one if Income (Asset) Diversity is between 2/3 and 1, and zero otherwise. Indeed, we find a statistically significant and negative effect on excess valuation at higher levels of income or asset diversity. Second, rather than using fixed and equidistant cutoffs (such as 0.1 and 0.9) to calculate the diversity measures, we test whether the results are sensitive to using cutoffs that are based on the sample characteristics. In particular, we use the 10th and 90th percentiles as cutoff of the diversity variables to construct the two diversity and excess value measures. While the percentiles imply rather different cutoff levels for the diversity variables, the results are similar. We also obtain similar results when we use the 3-year average of income diversity instead of the current value. Third, we combine data on both income and asset diversity to produce two conglomerate indexes of diversity: the average of the income diversity and asset diversity variables, and a dummy variable that takes value of one if the realizations of both income and asset diversity are between 0.1 and 0.9. The results continue to indicate a diversification discount (not shown).
37
Next, we use the sample of U.S. banks only rather than the global sample of banks to
calculate the average q of single-activity banks and our excess value measures. Using data on q
from one country has the advantage that we can focus on within-country variation in q. Cross-
country variation in q can be subsumed in country fixed effects. Ideally, we would want to calculate
activity-adjusted q’s for each country using banks in that country only. Unfortunately, most
countries do not have enough banks to implement this in practice. The results when using excess
values constructed using a sample of single activity banks from the U.S. are reported in columns (2)
and (5) of Table 10. The results do not change when using the U.S.-based measure of excess value.
In columns (3) and (6) of Table 10, we use a measure of excess performance based on the
firm’s operating income rather than Tobin’s q. The measure is constructed in a similar fashion as
the excess value measure described earlier, but uses data on operating income rather than Tobin’s q.
The results are qualitatively similar when using this alternative measure of firm performance. Banks
that diversify into multiple activities are not only valued less by the market but also show worse
performance on average as measured by total operating income.
38

5. Concluding Remarks
This paper finds that markets value financial conglomerates that engage in multiple
activities lower than if those financial conglomerates were broken into financial intermediaries that
specialize in the individual activities. To identify the independent impact of diversity on valuation,
we employ a number of econometric procedures that control for the possibility that the same
characteristics that induce financial institutions to diversify also lower market valuations. Across an
array of sensitivity checks, the data suggest that diversity reduces the value of financial
conglomerates. One explanation of these results is that financial conglomerates that engage in
multiple activities intensify agency problems and destroy value. Although we attempt to control for
alternative explanations, we do not directly measure agency problems and therefore we cannot
directly link the results to a single causal factor. The results, however, do show that economies of
scope in financial intermediation are not sufficiently large to compensate for countervailing forces
associated with diversification since we consistently find a diversification discount, never a
diversification premium.
The paper contributes to two interrelated strands of research. First, while some
policymakers, practitioners, and researchers trumpet economies of scope from one-stop shopping
for financial services, others stress intensified agency problems associated with monitoring complex
financial conglomerates. We find that markets attach a discount to financial institutions that engage
in diverse activities. Second, this paper contributes to the broader literature on corporate
diversification by examining diversification within one industry, rather than examining
diversification across very different activities. After controlling for endogeneity and other possible
explanations, we find a diversification discount even within an industry likely to enjoy economies
of scope.
39
References
Adams, R., Mehran, H., 2003. Is corporate governance different for bank holding companies? Economic Policy Review 9, 123-142.
Allen, L., Rai, A., 1996. Operational efficiency in banking: An international comparison. Journal of
Banking and Finance 18, 655-672. Amihud, Y., Lev, B., 1981. Risk reduction and managerial motive for conglomerate mergers. Bell
Journal of Economics 12, 605-617. Aron, D., 1988. Ability, moral hazard, firm size, and diversification. The Rand Journal of
Economics 19, 72-87. Barth, J., Caprio, G., Levine, R., 2001. The regulation and supervision of banks around the world:
A new database. In: Brooking-Wharton Papers on Financial Services, Eds: Litan, R. and R. Herring, Washington, DC, Brookings Institution, 183-250.
Barth, J., Caprio, G., Levine, R., 2004. Bank supervision and regulation: What works best? Journal
of Financial Intermediation 13, 205-248. Benston, G., 1994. Universal banking. Journal of Economic Perspectives 8, 121-143. Benzoni, L., Schenone, C., 2005. Conflict of interest or certification? Evidence from IPOs
underwritten by the firm’s relationship bank. Working paper, University of Minnesota. Ber, H., Yafeh, Y., Yosha, O., 2001. Conflict of interest in universal banking: Bank lending, stock
underwriting, and fund management. Journal of Monetary Economics 47, 189-218. Berger, A., Demsetz, R., Strahan, P., 1999. The consolidation of the financial services industry:
Causes, consequences, and implications for the future. Journal of Banking and Finance 23, 135-194.
Berger, A., Hanweck, G., Humphrey, D., 1987. Competitive viability in banking: Scale, scope, and
product mix economies. Journal of Monetary Economics 20, 501-520. Berger, A., Humphrey, D., 1991. The dominance of inefficiencies over scale and product mix
economies in banking. Journal of Monetary Economics 28, 117-148. Berger, P., Ofek, E., 1995. Diversification’s effect on firm value. Journal of Financial Economics
37, 39-65. Boyd, J., Chang, C., Smith, B., 1998. Moral hazard under commercial and universal banking.
Journal of Money, Credit, and Banking 30, 426-468.
40

Boyd, J., Levine, R., Smith, B., 2001. The impact of inflation on financial sector performance. Journal of Monetary Economics 47, 221-48.
Brook, Y., Hendershott, R., Lee, D., 1998. The gains from takeover deregulation: Evidence from
the end of interstate banking restrictions. Journal of Finance 53, 2185–2204. Campa, J., Kedia, S., 2002. Explaining the diversification discount. Journal of Finance 57, 1731-
1762. Caprio, G., Laeven, L., Levine, R., 2004. Governance and bank valuation. NBER Working Paper
No. 10158. Chandler, A., 1977. The Visible Hand. Cambridge, MA: Belknap Press. Chevalier, J., 2000. Why do firms undertake diversifying mergers? An analysis of the investment
policies of merging firms. Working paper, University of Chicago. Coase, R., 1937. The nature of the firm. Economica 4, 386-405. Comment, R., Jarrell, G., 1995. Corporate focus and stock returns. Journal of Financial Economics
37, 67-87. DeLong, G., 2001. Stockholder gains from focusing versus diversifying bank mergers. Journal of
Financial Economics 59, 221-252. Demirgüç-Kunt, A., Detragiache, E., 2002. Does deposit insurance increase banking system
stability? An empirical investigation. Journal of Monetary Economics 49, 1373-1406. Demirgüç-Kunt, A., Laeven, L., Levine, R., 2004. Regulations, market structure, institutions, and
the cost of financial intermediation. Journal of Money, Credit, and Banking 36, 593-622. Demsetz, H., Lehn, K., 1985. The structure of corporate ownership: Causes and consequences.
Journal of Political Economy 93, 1155-1177. Denis, D., Denis, D., Sarin, A., 1997. Agency problems, equity ownership, and corporate
diversification, Journal of Finance 52. 135-160. Diamond, D., 1984. Financial intermediation and delegated monitoring, Review of Economic
Studies 51, 393-414. Diamond, D., 1991. Monitoring and reputation: The choice between bank loans and directly placed
debt. Journal of Political Economy 99, 689-721. Drucker, S., Puri, M., 2005. On the benefits of concurrent lending and underwriting. Journal of
Finance forthcoming.
41

Fama, E., Jensen, M., 1983. Separation of ownership and control. Journal of Law and Economics 26, 301-325.
Ferrier, G., Grosskopf, S., Hayes, K., Yaisawarng, S., 1993. Economies of diversification in the
banking industry: A frontier approach. Journal of Monetary Economics 31, 229-49. Flannery, M., Kwan, S., Nimalendran, M., 2002. Market evidence on the opaqueness of banking.
Mimeo, University of Florida. Fluck, Z., Lynch, A., 1999. Why do firm merge and then divest? A theory of financial synergies.
Journal of Business 72, 319-346. Gande, A., Puri, M., Saunders, A., Walter, I., 1997. Bank underwriting of debt securities: Modern
evidence. Review of Financial Studies 10, 1175-1202. Gande, A., Puri, M., Saunders, A., 1999. Bank entry, competition, and the market for corporate
securities underwriting. Journal of Financial Economics 54, 165-195. Gertner, R., Scharfstein, D., Stein, J., 1994. Internal vs. external capital markets. Quarterly Journal
of Economics 109, 1211-1230. Graham, J., Lemmon, M., Wolf, J., 2002. Does corporate diversification destroy value? Journal of
Finance 57, 695–720. Haubrich, J., Santos, J., 2004. Banking and commerce: A liquidity approach. Journal of Banking
and Finance, forthcoming. Heckman, J., 1979. Sample selection bias as a specification error. Econometrica 47, 153-161. Houston, J., James, C., Marcus, D., 1997. Capital market frictions and the role of internal capital
markets in banking. Journal of Financial Economics 46, 135-164. Houston, J., James, C., Ryngaert, M., 2001. Where do merger gains come from? Bank mergers from
the perspective of insiders and outsiders. Journal of Financial Economics 60, 285-331. Jensen, M., 1986. Agency costs of free cash flow, corporate finance, and takeovers. American
Economic Review 76, 323-329. Jensen, M., Meckling, W., 1976. Theory of the firm: Managerial behavior, agency costs, and
ownership structure. Journal of Financial Economics 3, 305-360. John, K., Ofek, E., 1995. Asset sales and increase in focus. Journal of Financial Economics 37,
105-126. Kroszner, R., Rajan, R., 1994. Is the Glass-Steagall Act justified? A study of the U.S. experience
with universal banking before 1933. American Economic Review 84, 810-832.
42
Lamont, O., Polk, C., 2001. The diversification discount: Cash flows versus returns. Journal of
Finance 56, 1693-1721. La Porta, R., Lopez-de-Silanes, F., Shleifer, A., Vishny, R., 1998. Law and finance. Journal of
Political Economy 106, 1113-1155. Lang, L., Stulz, R., 1994. Tobin’s Q, corporate diversification, and firm performance. Journal of
Political Economy 102, 1248-1280. LeBaron, D., Speidell, L., 1987. Why are the parts worth more than the sum? ‘Chop shop,’ a
corporate valuation model. In: L. Browne and E. Rosengren, The Merger Boom, Conference Series no. 31. Boston: Federal Reserve Bank.
Lins, K., Servaes, H., 1999. International evidence on the value of corporate diversification. Journal
of Finance 54, 2215-1139. Maksimovic, V., Phillips, G., 2002. Do conglomerate firms allocate resources inefficiently across
industries? Theory and evidence. Journal of Finance 57, 721-767. Michaely, R., Womack, K., 1999. Conflict of interest and the credibility of underwriter analyst
recommendations. Review of Financial Studies 12, 653-686. Morck, R., Shleifer, A., Vishny, R., 1990. Do managerial objectives drive bad acquisition? Journal
of Finance 45, 31-48. Morgan, D., 2002. Rating banks: Risk and uncertainty in an opaque industry. American Economic
Review 92, 874-88. Penas, M., Unal, H., 2005. Gains in bank mergers: Evidence from the bond markets. Journal of
Financial Economics, forthcoming. Petersen, M., Rajan, R., 1994. The benefits of lending relationships: Evidence from small business
data. Journal of Finance 49, 3-37. Pulley, L., Humphrey, D., 1993. The role of fixed costs and cost complementarities in determining
scope economies and the costs of narrow banking proposals. Journal of Business 66, 437-462.
Puri, M., 1996. Commercial banks in investment banking: conflicts of interest or certification role.
Journal of Financial Economics 40, 373-401. Rajan, R., 1992. Insiders and outsiders: The choice between informed and arm’s-length debt.
Journal of Finance 47, 1367-1400.
43

44
Rajan, R., Servaes, H., Zingales, L., 2000. The cost of diversity: The diversification discount and inefficient investment. Journal of Finance 55, 35-80.
Rotemberg, J., Saloner, G., 1994. Benefits of narrow business strategies. American Economic
Review 84, 1330-1349. Saunders, A., Walter, I., 1994. Universal Banking in the United States: What Could We Gain? What
Could We Lose? Oxford University Press. Schenone, C., 2004. The effect of banking relationships on the firm’s IPO underpricing. Journal of
Finance 59, 2903-2958. Schoar, A., 2002. Effects of corporate diversification on productivity. Journal of Finance 57, 2379-
2403. Servaes, H., 1996. The value of diversification during the conglomerate merger wave. Journal of
Finance 51, 1201-1225. Stein, J., 2002. Information production and capital allocation: Decentralized versus hierarchical
firms. Journal of Finance 57, 1891-1921. Stulz, R., 1990. Managerial discretion and optimal financial policies. Journal of Financial
Economics 26, 3-27. Sufi, A., 2004. Does joint production of lending and underwriting help or hurt firms? A fixed
effects approach. MIT (Department of Economics), mimeo. Vander Vennet, R., 2002. Cost and profit efficiency of financial conglomerates and universal banks
in Europe. Journal of Money, Credit and Banking 34, 254-282. Villalonga, B., 2004a. Diversification discount or premium? New evidence from the business
information tracking series. Journal of Finance 59, 479-506. Villalonga, B., 2004b. Does diversification cause the ‘diversification discount’? Financial
Management 33, 5-27. Williamson, O., 1970. Corporate Control and Business Behavior: An Inquiry into the Effects of
Organizational Form on Enterprise Behavior. Englewood Cliffs, NJ: Prentice-Hall.
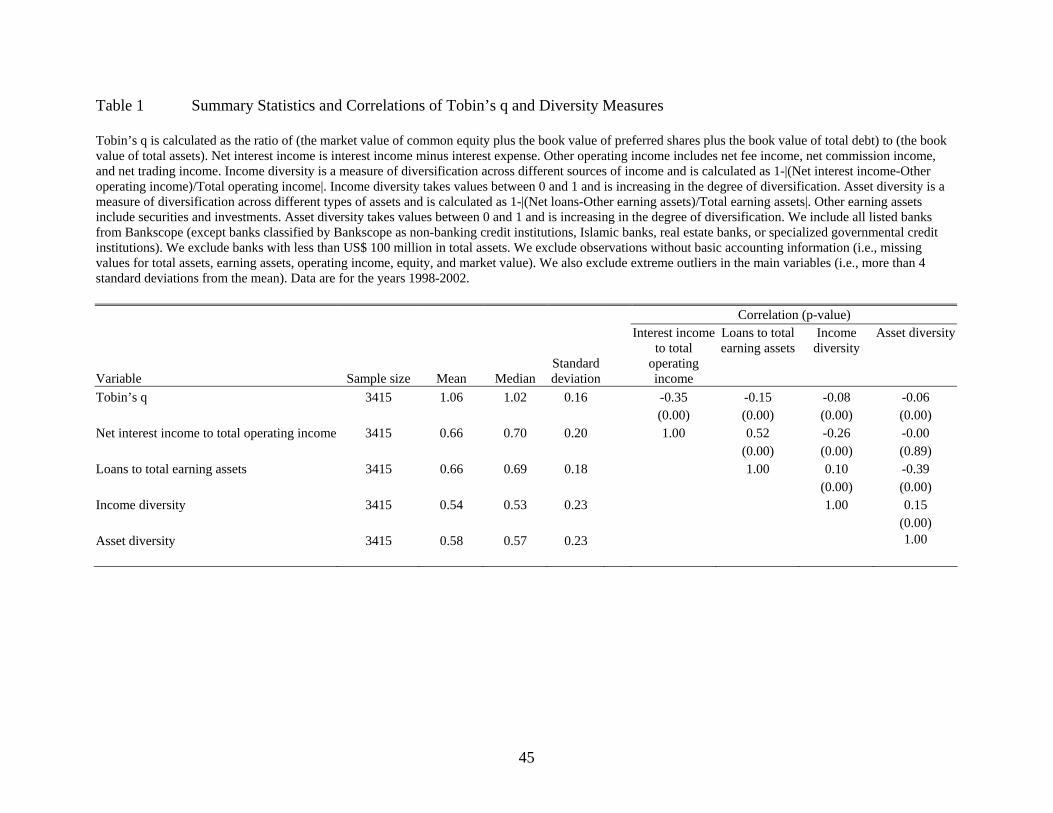
Table 1 Summary Statistics and Correlations of Tobin’s q and Diversity Measures Tobin’s q is calculated as the ratio of (the market value of common equity plus the book value of preferred shares plus the book value of total debt) to (the book value of total assets). Net interest income is interest income minus interest expense. Other operating income includes net fee income, net commission income, and net trading income. Income diversity is a measure of diversification across different sources of income and is calculated as 1-|(Net interest income-Other operating income)/Total operating income|. Income diversity takes values between 0 and 1 and is increasing in the degree of diversification. Asset diversity is a measure of diversification across different types of assets and is calculated as 1-|(Net loans-Other earning assets)/Total earning assets|. Other earning assets include securities and investments. Asset diversity takes values between 0 and 1 and is increasing in the degree of diversification. We include all listed banks from Bankscope (except banks classified by Bankscope as non-banking credit institutions, Islamic banks, real estate banks, or specialized governmental credit institutions). We exclude banks with less than US$ 100 million in total assets. We exclude observations without basic accounting information (i.e., missing values for total assets, earning assets, operating income, equity, and market value). We also exclude extreme outliers in the main variables (i.e., more than 4 standard deviations from the mean). Data are for the years 1998-2002. Correlation (p-value)
Variable Sample size Mean Median Standard deviation
Interest income to total
operating income
Loans to total earning assets
Income diversity
Asset diversity
Tobin’s q 3415 1.06 1.02 0.16 -0.35 -0.15 -0.08 -0.06 (0.00) (0.00) (0.00) (0.00) Net interest income to total operating income 3415 0.66 0.70 0.20 1.00 0.52 -0.26 -0.00 (0.00) (0.00) (0.89) Loans to total earning assets 3415 0.66 0.69 0.18 1.00 0.10 -0.39 (0.00) (0.00) Income diversity 3415 0.54 0.53 0.23 1.00 0.15 (0.00) Asset diversity 3415 0.58 0.57 0.23 1.00
45

Table 2 Excess Value of Diversified Banks The excess value for a diversified bank is the difference between its actual q and its activity-adjusted q. The activity-adjusted q of a bank is the weighted average of pure commercial banking and pure investment banking q’s. The weights are based on the relative importance of interest income to total operating income in the case of the income diversity measure and the relative importance of loans to total earning assets in the case of the asset diversity measure. In the case of the income diversity, the pure commercial banking q is proxied by the average of the q’s of banks with a ratio of interest income to total operating income of 0.9 or higher and the pure investment banking q is proxied by the average of the q’s of banks with a ratio of interest income to total operating income of 0.1 or lower. In the case of the asset diversity, the pure commercial banking q is proxied by the average of the q’s of banks with a ratio of loans to total earning assets of 0.9 or higher and the pure investment banking q is proxied by the average of the q’s of banks with a ratio of loans to total earning assets of 0.1 or lower. The row labeled “unadjusted excess value” provides the regression coefficient and t-statistic on the diversification dummy variable (income diversity and asset diversity respectively) from a regression of q on a constant, country dummy variables, year dummy variables, and the corresponding diversification dummy variable. A banking firm is defined to be diversified if the ratio of interest income to total operating income is between 0.1 and 0.9 or if the ratio of loans to total earning assets is between 0.1 and 0.9. Data are for the years 1998-2002. * significant at 10%; ** significant at 5%; *** significant at 1%. Variable Income diversity Asset diversity Mean excess value (t-statistic) -0.055*** -0.065*** (23.11) (21.56) Median excess value (p-value for non-parametric sign test) -0.061*** -0.070*** (0.000) (0.000) Unadjusted excess value (t-statistic) -0.066*** -0.071** (3.01) (2.55)
46
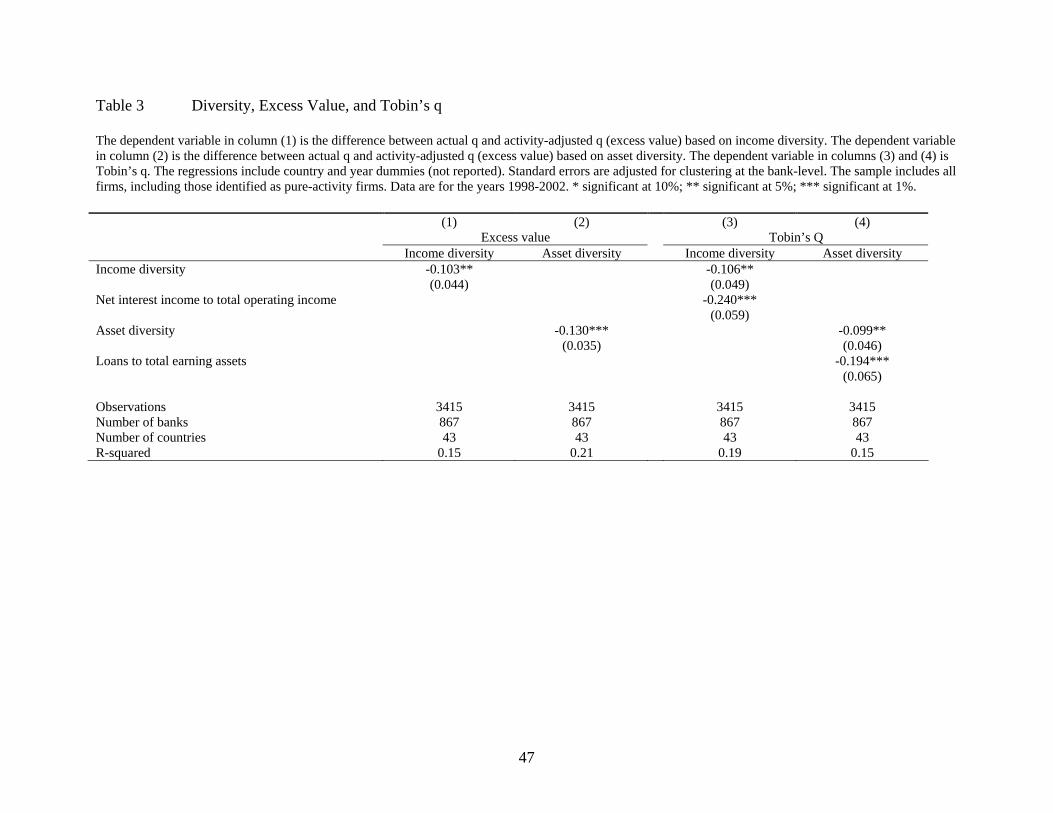
Table 3 Diversity, Excess Value, and Tobin’s q The dependent variable in column (1) is the difference between actual q and activity-adjusted q (excess value) based on income diversity. The dependent variable in column (2) is the difference between actual q and activity-adjusted q (excess value) based on asset diversity. The dependent variable in columns (3) and (4) is Tobin’s q. The regressions include country and year dummies (not reported). Standard errors are adjusted for clustering at the bank-level. The sample includes all firms, including those identified as pure-activity firms. Data are for the years 1998-2002. * significant at 10%; ** significant at 5%; *** significant at 1%. (1) (2) (3) (4) Excess value Tobin’s Q Income diversity Asset diversity Income diversity Asset diversity Income diversity -0.103** -0.106** (0.044) (0.049) Net interest income to total operating income -0.240*** (0.059) Asset diversity -0.130*** -0.099** (0.035) (0.046) Loans to total earning assets -0.194*** (0.065) Observations 3415 3415 3415 3415 Number of banks 867 867 867 867 Number of countries 43 43 43 43 R-squared 0.15 0.21 0.19 0.15
47

Table 4 Diversity and Excess Value: Controlling for Bank-Level and Country-Level Characteristics The dependent variable in panel A, columns (1) to (4), is the difference between actual q and activity-adjusted q (excess value) based on income diversity. The dependent variable in panel B, columns (1) to (4), is the difference between actual q and activity-adjusted q (excess value) based on asset diversity. The dependent variable in columns (5) to (8) is unadjusted q. Log(total assets) is the logarithm of the bank’s total assets. Log(total operating income) is the logarithm of the bank’s total operating income. Deposits/Liabilities is the ratio of total deposits to total liabilities. Equity/Assets is the ratio of book value of equity to total assets. Growth in assets is the 3-year growth rate in total assets. Growth in income is the 3-year growth rate in operating income. Market share of deposits is the bank’s share in total bank deposits in the country. GDP per capita growth is the annual real growth in GDP per capita. Inflation is the annual change in the CPI index. We include country dummies and year dummies (not reported). Standard errors are adjusted for clustering at the bank-level. Data for the years 1998-2002. * significant at 10%; ** significant at 5%; *** significant at 1%. Panel A: Income diversity (1) (2) (3) (4) (5) (6) (7) (8) Excess value Tobin’s Q Log (total assets) 0.006 0.006 0.005 0.005 (0.004) (0.004) (0.004) (0.004) Log(total operating income) 0.011*** 0.011*** 0.011*** 0.011*** (0.004) (0.004) (0.003) (0.003) Net interest income to -0.220*** -0.201*** -0.221*** -0.202*** total operating income (0.061) (0.060) (0.062) (0.060) Income diversity -0.077** -0.091*** -0.076** -0.090*** -0.080* -0.090** -0.080* -0.090** (0.032) (0.034) (0.032) (0.034) (0.041) (0.041) (0.042) (0.041) Deposits/Liabilities 0.093** 0.119*** 0.094** 0.120*** 0.094 0.112** 0.094 0.113** (0.041) (0.042) (0.041) (0.042) (0.059) (0.057) (0.059) (0.057) Equity/Assets 0.163 0.172 0.164 0.173 0.123 0.144 0.124 0.145 (0.135) (0.132) (0.135) (0.132) (0.127) (0.124) (0.127) (0.124) Growth in assets 0.052** 0.055** 0.054** 0.057** 0.059** 0.062** 0.060** 0.063** (0.024) (0.024) (0.024) (0.024) (0.026) (0.026) (0.027) (0.027) Growth in income 0.021 0.019 0.019 0.017 0.015 0.013 0.016 0.014 (0.026) (0.026) (0.027) (0.027) (0.027) (0.027) (0.027) (0.027) Market share of deposits -0.010 -0.072 -0.011 -0.073 -0.007 -0.078 -0.006 -0.077 (0.085) (0.089) (0.086) (0.089) (0.085) (0.086) (0.085) (0.086) GDP per capita growth 0.003* 0.003* 0.003 0.003 (0.002) (0.002) (0.002) (0.002) Inflation 0.004* 0.004* 0.000 0.000 (0.002) (0.002) (0.002) (0.002) Observations 2773 2773 2773 2773 2773 2773 2773 2773 R-squared 0.20 0.20 0.20 0.20 0.21 0.22 0.21 0.22
48

Panel B: Asset diversity (1) (2) (3) (4) (5) (6) (7) (8) Excess value Tobin’s Q Log (total assets) 0.005 0.005 0.006* 0.006* (0.004) (0.004) (0.003) (0.003) Log(total operating income) 0.013*** 0.013*** 0.013*** 0.014*** (0.003) (0.003) (0.003) (0.003) Loans to total earning assets -0.177** -0.171** -0.177** -0.172** (0.078) (0.077) (0.078) (0.077) Asset diversity -0.141*** -0.141*** -0.142*** -0.142*** -0.110** -0.109** -0.111** -0.110** (0.026) (0.026) (0.026) (0.026) (0.046) (0.046) (0.046) (0.046) Deposits/Liabilities 0.074* 0.109*** 0.076* 0.110*** 0.036 0.070 0.037 0.071 (0.039) (0.039) (0.039) (0.039) (0.051) (0.051) (0.051) (0.051) Equity/Assets 0.136 0.167 0.138 0.168 0.158 0.191 0.159 0.192 (0.132) (0.126) (0.131) (0.126) (0.122) (0.119) (0.122) (0.119) Growth in assets 0.027 0.031 0.030 0.034 0.042 0.047* 0.043 0.048* (0.022) (0.023) (0.023) (0.023) (0.027) (0.027) (0.027) (0.027) Growth in income 0.024 0.022 0.021 0.019 0.023 0.021 0.023 0.021 (0.026) (0.025) (0.026) (0.026) (0.027) (0.027) (0.027) (0.027) Market share of deposits -0.027 -0.130 -0.029 -0.130 -0.024 -0.127 -0.023 -0.126 (0.086) (0.091) (0.086) (0.091) (0.082) (0.086) (0.082) (0.086) GDP per capita growth 0.005** 0.005** 0.003* 0.004* (0.002) (0.002) (0.002) (0.002) Inflation 0.005** 0.005** 0.001 0.001 (0.002) (0.002) (0.002) (0.002) Observations 2773 2773 2773 2773 2773 2773 2773 2773 R-squared 0.29 0.29 0.29 0.30 0.20 0.21 0.20 0.21
49
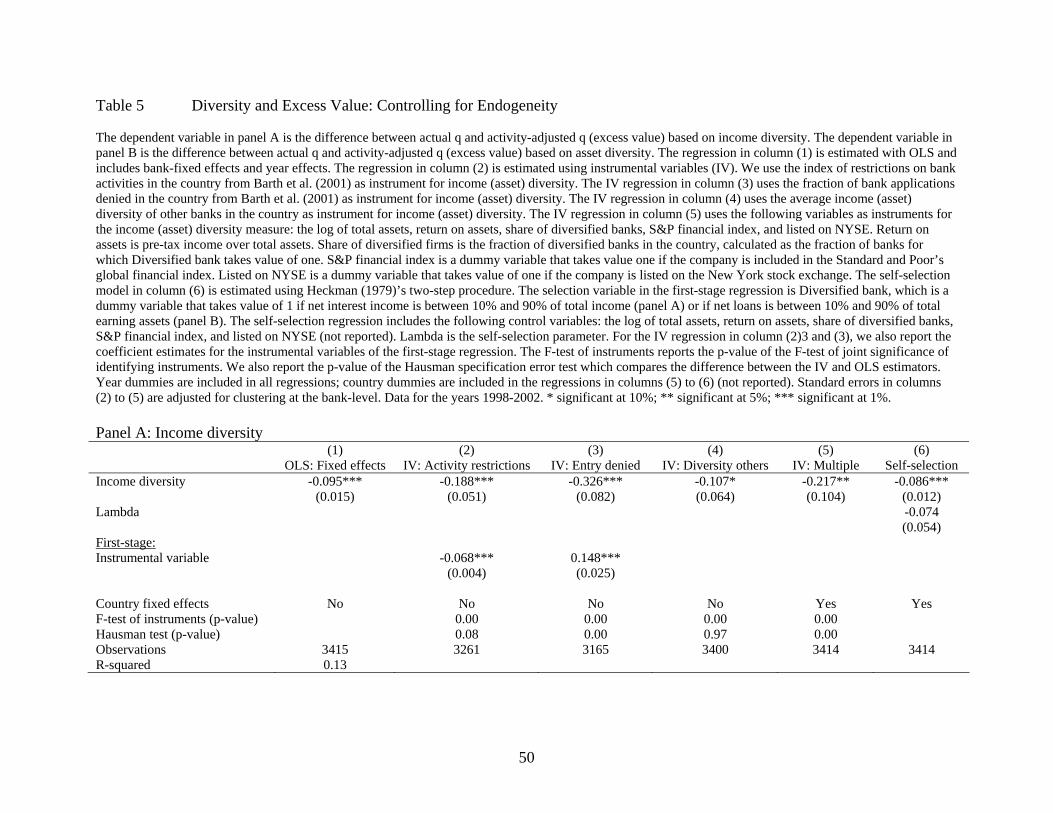
Table 5 Diversity and Excess Value: Controlling for Endogeneity The dependent variable in panel A is the difference between actual q and activity-adjusted q (excess value) based on income diversity. The dependent variable in panel B is the difference between actual q and activity-adjusted q (excess value) based on asset diversity. The regression in column (1) is estimated with OLS and includes bank-fixed effects and year effects. The regression in column (2) is estimated using instrumental variables (IV). We use the index of restrictions on bank activities in the country from Barth et al. (2001) as instrument for income (asset) diversity. The IV regression in column (3) uses the fraction of bank applications denied in the country from Barth et al. (2001) as instrument for income (asset) diversity. The IV regression in column (4) uses the average income (asset) diversity of other banks in the country as instrument for income (asset) diversity. The IV regression in column (5) uses the following variables as instruments for the income (asset) diversity measure: the log of total assets, return on assets, share of diversified banks, S&P financial index, and listed on NYSE. Return on assets is pre-tax income over total assets. Share of diversified firms is the fraction of diversified banks in the country, calculated as the fraction of banks for which Diversified bank takes value of one. S&P financial index is a dummy variable that takes value one if the company is included in the Standard and Poor’s global financial index. Listed on NYSE is a dummy variable that takes value of one if the company is listed on the New York stock exchange. The self-selection model in column (6) is estimated using Heckman (1979)’s two-step procedure. The selection variable in the first-stage regression is Diversified bank, which is a dummy variable that takes value of 1 if net interest income is between 10% and 90% of total income (panel A) or if net loans is between 10% and 90% of total earning assets (panel B). The self-selection regression includes the following control variables: the log of total assets, return on assets, share of diversified banks, S&P financial index, and listed on NYSE (not reported). Lambda is the self-selection parameter. For the IV regression in column (2)3 and (3), we also report the coefficient estimates for the instrumental variables of the first-stage regression. The F-test of instruments reports the p-value of the F-test of joint significance of identifying instruments. We also report the p-value of the Hausman specification error test which compares the difference between the IV and OLS estimators. Year dummies are included in all regressions; country dummies are included in the regressions in columns (5) to (6) (not reported). Standard errors in columns (2) to (5) are adjusted for clustering at the bank-level. Data for the years 1998-2002. * significant at 10%; ** significant at 5%; *** significant at 1%. Panel A: Income diversity (1) (2) (3) (4) (5) (6) OLS: Fixed effects IV: Activity restrictions IV: Entry denied IV: Diversity others IV: Multiple Self-selection Income diversity -0.095*** -0.188*** -0.326*** -0.107* -0.217** -0.086*** (0.015) (0.051) (0.082) (0.064) (0.104) (0.012) Lambda -0.074 (0.054) First-stage: Instrumental variable -0.068*** 0.148*** (0.004) (0.025) Country fixed effects No No No No Yes Yes F-test of instruments (p-value) 0.00 0.00 0.00 0.00 Hausman test (p-value) 0.08 0.00 0.97 0.00 Observations 3415 3261 3165 3400 3414 3414 R-squared 0.13
50
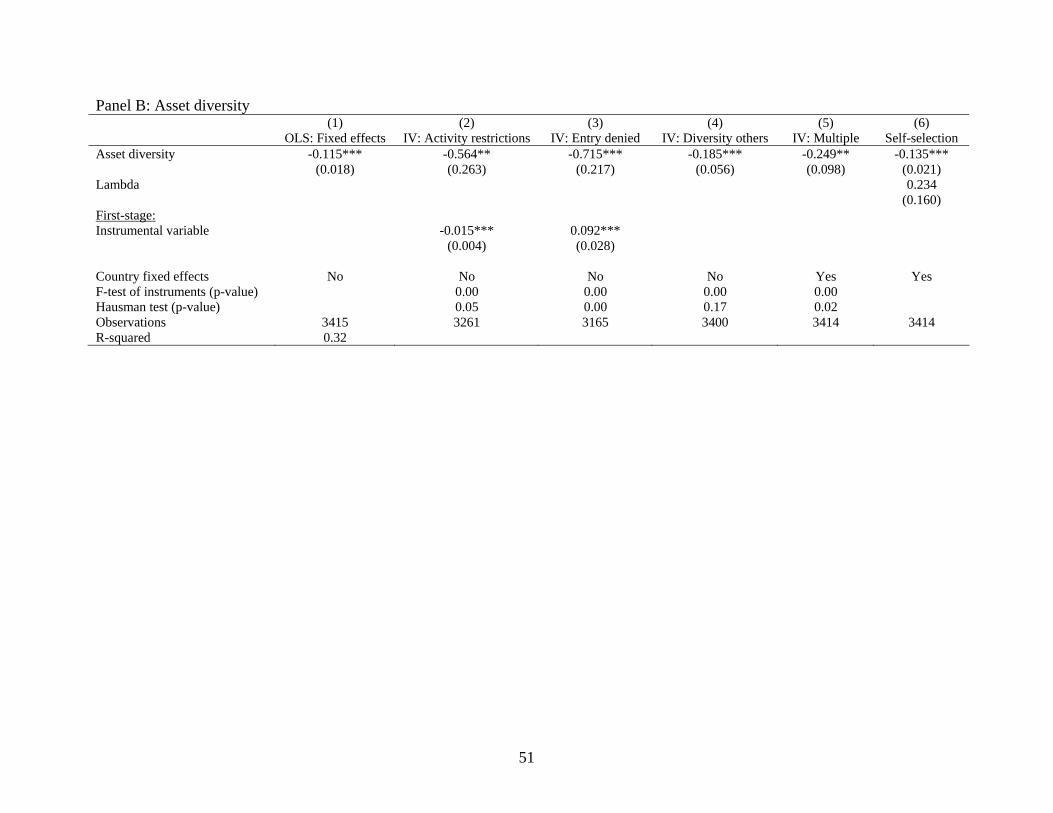
Panel B: Asset diversity (1) (2) (3) (4) (5) (6) OLS: Fixed effects IV: Activity restrictions IV: Entry denied IV: Diversity others IV: Multiple Self-selection Asset diversity -0.115*** -0.564** -0.715*** -0.185*** -0.249** -0.135*** (0.018) (0.263) (0.217) (0.056) (0.098) (0.021) Lambda 0.234 (0.160) First-stage: Instrumental variable -0.015*** 0.092*** (0.004) (0.028) Country fixed effects No No No No Yes Yes F-test of instruments (p-value) 0.00 0.00 0.00 0.00 Hausman test (p-value) 0.05 0.00 0.17 0.02 Observations 3415 3261 3165 3400 3414 3414 R-squared 0.32
51

Table 6 Scale and Scope of Activities of Specialized and Diversified Banks The dependent variable in column (1) is the logarithm of total assets. The dependent variable in column (2) is the logarithm of net loans. The dependent variable in column (3) is the logarithm of total other earning assets. The dependent variable in column (4) is the logarithm of total operating income. The dependent variable in column (5) is the logarithm of total net interest income. The dependent variable in column (6) is the logarithm of total non-interest income. Specialized commercial bank is a dummy variable that takes value of one if net interest income is more than 90% of total income (panel A) or if net loans is more than 90% of total earning assets (panel B), and zero otherwise. Specialized investment bank is a dummy variable that takes value of one if non-interest income is more than 90% of total income (panel A), or if other earning (non-loan) assets is more than 90% of total earning assets (panel B). The default category is Diversified bank, which is a dummy variable that takes value of one if net interest income is between 10% and 90% of total income (panel A) or if net loans is between 10% and 90% of total earning assets (panel B), and zero otherwise. All regressions include country dummies and year dummies (not reported). Standard errors are adjusted for clustering at the bank-level. Data for the years 1998-2002. * significant at 10%; ** significant at 5%; *** significant at 1%. Panel A: Income diversity (1) (2) (3) (4) (5) (6) Total assets Net loans Other earning assets Operating income Net interest income Non-interest income Specialized commercial bank -0.989*** -0.941*** -0.959*** -1.224*** -0.897*** -2.647*** (0.154) (0.158) (0.173) (0.152) (0.147) (0.172) Specialized investment bank -0.945** -2.454*** -0.562 0.495 -2.178*** 1.628*** (0.429) (0.372) (0.475) (0.353) (0.392) (0.371) Observations 3415 3412 3415 3415 3415 3415 R-squared 0.29 0.30 0.29 0.25 0.25 0.32 Panel B: Asset diversity (1) (2) (3) (4) (5) (6) Total assets Net loans Other earning assets Operating income Net interest income Non-interest income Specialized commercial bank -0.683** -0.264 -2.078*** -0.600* -0.440 -0.719* (0.328) (0.328) (0.343) (0.354) (0.331) (0.419) Specialized investment bank -0.373 -3.453*** 0.518 -0.112 -1.415*** 0.749 (0.547) (0.679) (0.580) (0.512) (0.486) (0.573) Observations 3415 3412 3415 3415 3415 3415 R-squared 0.29 0.30 0.29 0.25 0.25 0.32
52

Table 7 Diversity and Excess Value: Controlling for Mergers The dependent variable in columns (1), (3), and (5) is the difference between actual q and activity-adjusted q (excess value) based on income diversity. The dependent variable in columns (2), (4), and (6) is the difference between actual q and activity-adjusted q (excess value) based on asset diversity. In panel A, we exclude banks that have merged with at least one other financial institution during the current year (columns 1-2), the past 3 years (columns 3-4), or the past 5 years (columns 5-6). In panel B, we include merger dummy variables. Merger [t] is a dummy variable that takes value of one if the bank that merged with at least one other financial institution during year t. Merger [t-2, t] is a dummy variable that takes value of one if the bank that merged with at least one other financial institution during the years t-2 to t. Merger [t-4, t] is a dummy variable that takes value of one if the bank that merged with at least one other financial institution during the years t-4 to t. We define a merger as an acquisition or merger between two financial institutions where the new entity takes on a new name. This variable is constructed using data on the history of the bank from Bankscope and the mergers and acquisitions database from the Banker’s Almanac. In panel C, we exclude bank observations with a significant annual change in total assets. Specifically, if a bank experienced a change in assets of more than 50% from year t-1 to year t, then we exclude the bank for the years t, t+1, t+2, ... T, with T the end of the sample period. We include country dummies and year dummies (not reported). Standard errors are adjusted for clustering at the bank-level. Data are for the years 1998-2002. * significant at 10%; ** significant at 5%; *** significant at 1%. Panel A: Exclude banks that merged with another financial institution (1) (2) (3) (4) (5) (5) Merger [t] Merger [t] Merger [t-2, t] Merger [t-2, t] Merger [t-4, t] Merger [t-4, t] Log (total assets) -0.001 -0.003 -0.001 -0.002 -0.001 -0.002 (0.003) (0.004) (0.003) (0.004) (0.003) (0.005) Income diversity -0.102** -0.110** -0.113** (0.042) (0.044) (0.045) Asset diversity -0.123*** -0.122*** -0.122*** (0.038) (0.039) (0.040) Observations 3362 3362 3269 3269 3222 3222 R-squared 0.15 0.22 0.15 0.21 0.15 0.21
53
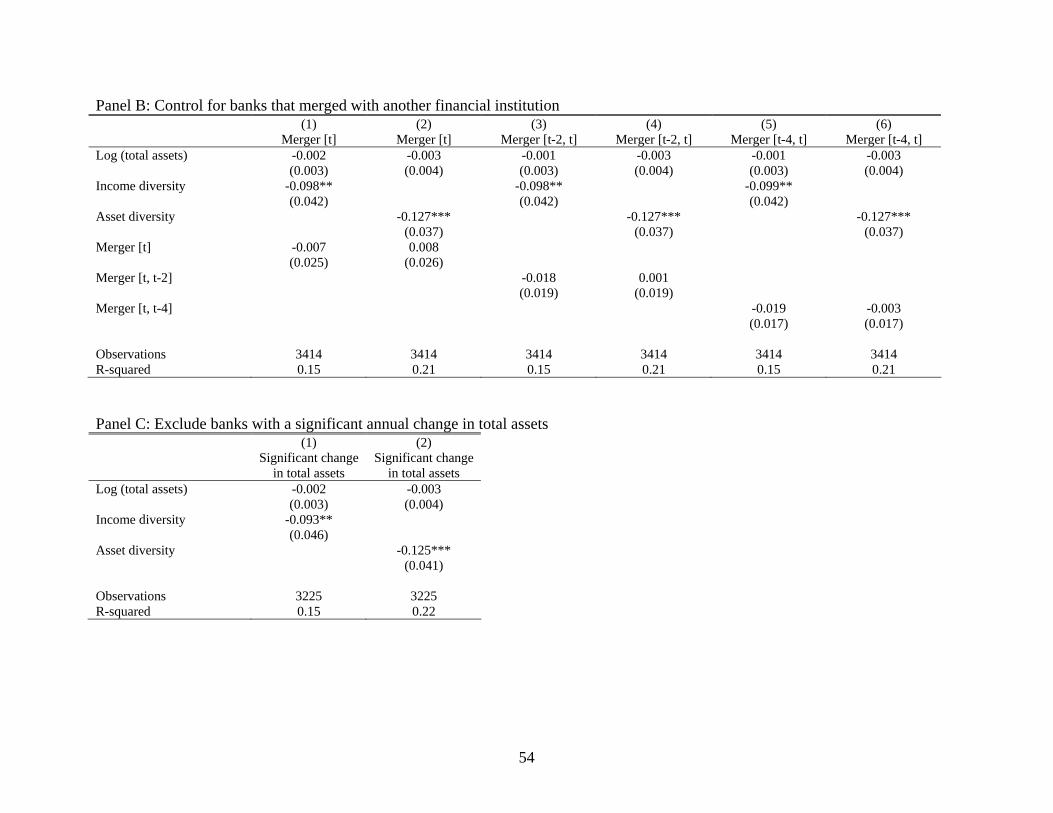
Panel B: Control for banks that merged with another financial institution (1) (2) (3) (4) (5) (6) Merger [t] Merger [t] Merger [t-2, t] Merger [t-2, t] Merger [t-4, t] Merger [t-4, t] Log (total assets) -0.002 -0.003 -0.001 -0.003 -0.001 -0.003 (0.003) (0.004) (0.003) (0.004) (0.003) (0.004) Income diversity -0.098** -0.098** -0.099** (0.042) (0.042) (0.042) Asset diversity -0.127*** -0.127*** -0.127*** (0.037) (0.037) (0.037) Merger [t] -0.007 0.008 (0.025) (0.026) Merger [t, t-2] -0.018 0.001 (0.019) (0.019) Merger [t, t-4] -0.019 -0.003 (0.017) (0.017) Observations 3414 3414 3414 3414 3414 3414 R-squared 0.15 0.21 0.15 0.21 0.15 0.21 Panel C: Exclude banks with a significant annual change in total assets (1) (2) Significant change
in total assets Significant change
in total assets Log (total assets) -0.002 -0.003 (0.003) (0.004) Income diversity -0.093** (0.046) Asset diversity -0.125*** (0.041) Observations 3225 3225 R-squared 0.15 0.22
54
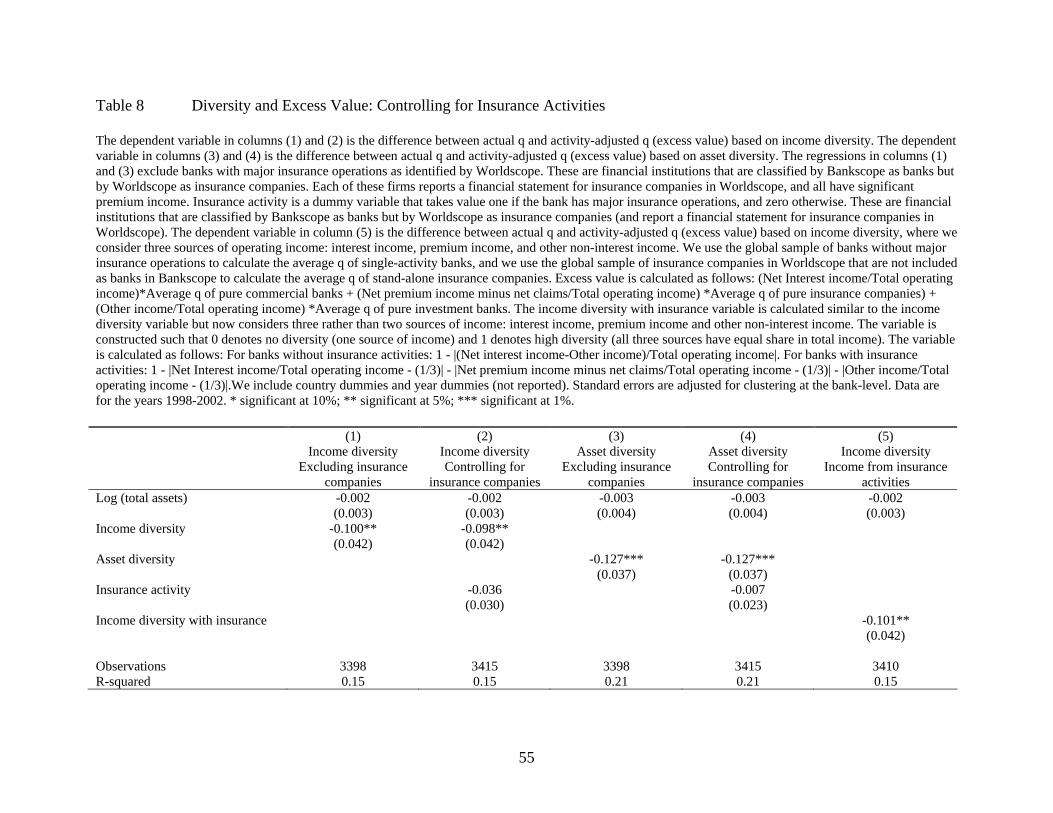
Table 8 Diversity and Excess Value: Controlling for Insurance Activities The dependent variable in columns (1) and (2) is the difference between actual q and activity-adjusted q (excess value) based on income diversity. The dependent variable in columns (3) and (4) is the difference between actual q and activity-adjusted q (excess value) based on asset diversity. The regressions in columns (1) and (3) exclude banks with major insurance operations as identified by Worldscope. These are financial institutions that are classified by Bankscope as banks but by Worldscope as insurance companies. Each of these firms reports a financial statement for insurance companies in Worldscope, and all have significant premium income. Insurance activity is a dummy variable that takes value one if the bank has major insurance operations, and zero otherwise. These are financial institutions that are classified by Bankscope as banks but by Worldscope as insurance companies (and report a financial statement for insurance companies in Worldscope). The dependent variable in column (5) is the difference between actual q and activity-adjusted q (excess value) based on income diversity, where we consider three sources of operating income: interest income, premium income, and other non-interest income. We use the global sample of banks without major insurance operations to calculate the average q of single-activity banks, and we use the global sample of insurance companies in Worldscope that are not included as banks in Bankscope to calculate the average q of stand-alone insurance companies. Excess value is calculated as follows: (Net Interest income/Total operating income)*Average q of pure commercial banks + (Net premium income minus net claims/Total operating income) *Average q of pure insurance companies) + (Other income/Total operating income) *Average q of pure investment banks. The income diversity with insurance variable is calculated similar to the income diversity variable but now considers three rather than two sources of income: interest income, premium income and other non-interest income. The variable is constructed such that 0 denotes no diversity (one source of income) and 1 denotes high diversity (all three sources have equal share in total income). The variable is calculated as follows: For banks without insurance activities: 1 - |(Net interest income-Other income)/Total operating income|. For banks with insurance activities: 1 - |Net Interest income/Total operating income - (1/3)| - |Net premium income minus net claims/Total operating income - (1/3)| - |Other income/Total operating income - (1/3)|.We include country dummies and year dummies (not reported). Standard errors are adjusted for clustering at the bank-level. Data are for the years 1998-2002. * significant at 10%; ** significant at 5%; *** significant at 1%. (1) (2) (3) (4) (5) Income diversity Income diversity Asset diversity Asset diversity Income diversity Excluding insurance
companies Controlling for
insurance companies Excluding insurance
companies Controlling for
insurance companies Income from insurance
activities Log (total assets) -0.002 -0.002 -0.003 -0.003 -0.002 (0.003) (0.003) (0.004) (0.004) (0.003) Income diversity -0.100** -0.098** (0.042) (0.042) Asset diversity -0.127*** -0.127*** (0.037) (0.037) Insurance activity -0.036 -0.007 (0.030) (0.023) Income diversity with insurance -0.101** (0.042) Observations 3398 3415 3398 3415 3410 R-squared 0.15 0.15 0.21 0.21 0.15
55

Table 9 Diversity and Excess Value: Sub-Samples The dependent variable in panel A is the difference between actual q and activity-adjusted q (excess value) based on income diversity. The dependent variable in panel B is the difference between actual q and activity-adjusted q (excess value) based on asset diversity. In column (1), we restrict the sample to diversified firms only, i.e., firms for which the Income (panel A) diversity dummy or the Asset (panel B) diversity dummy takes a value of one. In column (2), we restrict the sample to commercial banks (as defined by Bankscope) only. In column (3), we exclude U.S. banks from the sample. In columns (4) and (5), we restrict the sample to U.S. banks only. The dependent variable in column (5) uses the sample of U.S. banks rather than the global sample to calculate the average q of single activity banks. Column (6) is estimated using Weighted Least Squares, with the inverse of the number of country observations as weight. We include country dummies and year dummies (not reported). Standard errors are adjusted for clustering at the bank-level. Data are for the years 1998-2002. * significant at 10%; ** significant at 5%; *** significant at 1%. Panel A: Income diversity (1) (2) (3) (4) (5) (6) Diversified banks Commercial banks Excluding U.S.
banks U.S. banks, Global
benchmark U.S. banks, U.S.
benchmark WLS
Log (total assets) 0.000 -0.021*** -0.008*** 0.004* 0.011*** 0.005** (0.002) (0.004) (0.003) (0.002) (0.002) (0.002) Income diversity -0.081*** -0.184*** -0.144*** -0.030 -0.008 -0.041** (0.020) (0.044) (0.035) (0.020) (0.019) (0.016) Observations 3165 1495 2051 1364 1364 3415 R-squared 0.20 0.24 0.15 0.05 0.04 0.12 Panel B: Asset diversity (1) (2) (3) (4) (5) (6) Diversified banks Commercial banks Excluding U.S.
banks U.S. banks, Global
benchmark U.S. banks, U.S.
benchmark WLS
Log (total assets) -0.002 -0.024*** -0.015*** 0.008*** 0.012*** 0.008*** (0.002) (0.007) (0.004) (0.002) (0.002) (0.002) Asset diversity -0.132*** -0.163*** -0.087** -0.143*** -0.097*** -0.118*** (0.019) (0.044) (0.037) (0.018) (0.017) (0.014) Observations 3218 1495 2051 1364 1364 3415 R-squared 0.24 0.31 0.21 0.19 0.15 0.24
56
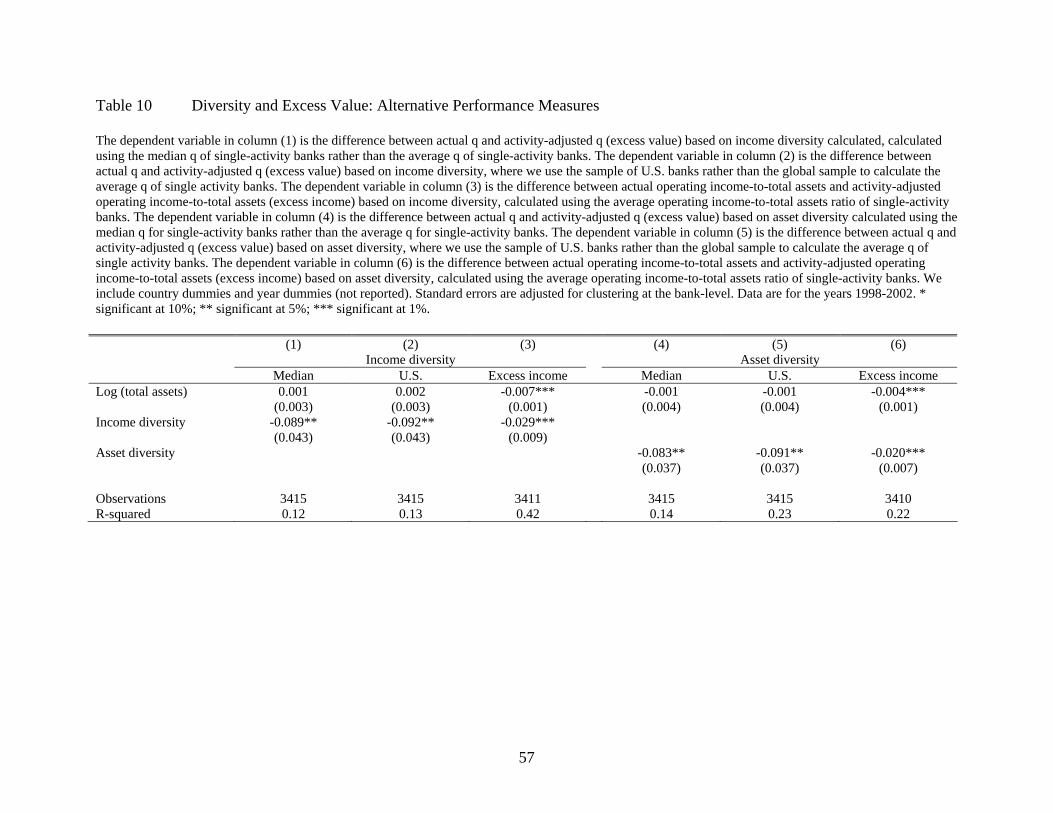
Table 10 Diversity and Excess Value: Alternative Performance Measures The dependent variable in column (1) is the difference between actual q and activity-adjusted q (excess value) based on income diversity calculated, calculated using the median q of single-activity banks rather than the average q of single-activity banks. The dependent variable in column (2) is the difference between actual q and activity-adjusted q (excess value) based on income diversity, where we use the sample of U.S. banks rather than the global sample to calculate the average q of single activity banks. The dependent variable in column (3) is the difference between actual operating income-to-total assets and activity-adjusted operating income-to-total assets (excess income) based on income diversity, calculated using the average operating income-to-total assets ratio of single-activity banks. The dependent variable in column (4) is the difference between actual q and activity-adjusted q (excess value) based on asset diversity calculated using the median q for single-activity banks rather than the average q for single-activity banks. The dependent variable in column (5) is the difference between actual q and activity-adjusted q (excess value) based on asset diversity, where we use the sample of U.S. banks rather than the global sample to calculate the average q of single activity banks. The dependent variable in column (6) is the difference between actual operating income-to-total assets and activity-adjusted operating income-to-total assets (excess income) based on asset diversity, calculated using the average operating income-to-total assets ratio of single-activity banks. We include country dummies and year dummies (not reported). Standard errors are adjusted for clustering at the bank-level. Data are for the years 1998-2002. * significant at 10%; ** significant at 5%; *** significant at 1%. (1) (2) (3) (4) (5) (6) Income diversity Asset diversity Median U.S. Excess income Median U.S. Excess income Log (total assets) 0.001 0.002 -0.007*** -0.001 -0.001 -0.004*** (0.003) (0.003) (0.001) (0.004) (0.004) (0.001) Income diversity -0.089** -0.092** -0.029*** (0.043) (0.043) (0.009) Asset diversity -0.083** -0.091** -0.020*** (0.037) (0.037) (0.007) Observations 3415 3415 3411 3415 3415 3410 R-squared 0.12 0.13 0.42 0.14 0.23 0.22
57