Funding Growth in Bank-Based and Market-Based...
40
Funding Growth in Bank-Based and Market-Based Financial Systems: Evidence from Firm Level Data Asli Demirguc-Kunt Vojislav Maksimovic* April 2001 * The authors are at the World Bank and the University of Maryland at College Park, respectively. We would like to thank Ross Levine and Thorsten Beck for useful discussions. The views expressed here are the authors’ own and not necessarily those of the World Bank or its member countries.
Transcript of Funding Growth in Bank-Based and Market-Based...
Funding Growth in
Bank-Based and Market-Based Financial Systems:
Evidence from Firm Level Data
Asli Demirguc-Kunt Vojislav Maksimovic*
April 2001
* The authors are at the World Bank and the University of Maryland at College Park, respectively. We would like to thank Ross Levine and Thorsten Beck for useful discussions. The views expressed here are the authors’ own and not necessarily those of the World Bank or its member countries.
Funding Growth in
Bank-Based or Market-Based Financial Systems:
Evidence from Firm Level Data
ABSTRACT
We investigate whether firms’ access to external financing to fund growth differs in market-
based and bank-based financial systems. Using firm-level data for forty countries, we compute
the proportion of firms in each country which relies on external finance and examine how that
proportion differs across financial systems. We find that the development of a country’s legal
system predicts access to external finance, and that stock markets and the banking system affect
access to external finance differently. However, we find no evidence that firms’ access to
external financing is predicted by several proxies for the the relative development of stock
markets to the development of the banking system.
1
1. INTRODUCTION
A key question in development economics is the relation between a country’s financial system
and its economic development. Historians such as Gerschenkron (1962) have sought to explain a
perceived relation between the differences in the pattern of economic development between
Britain and the Continental European economies and the differences between bank-based and
market-based financial systems. More recently, the differences in the relative performance of the
Japanese and the US economies have led observers to conclude that bank-based and market-
based financial systems may produce different growth patterns.1 This view has been challenged
by Laporta, Lopez-de-Silanes, Shleifer and Vishny (LLSV) (1998, 1999), who argue that the
legal system in a country is a primary determinant of the effectiveness of its financial system. An
implication of this hypothesis is that the distinction between market-based and bank-based
financial systems may not be of primary importance for policy.
In this paper we use firm-level data from a panel of forty countries to analyze how a
country’s legal and financial systems affect firms’ access to external finance to fund growth. For
each country we predict a financial system based on the country’s legal environment. We use our
estimates to ask: Does the financial system have an effect independent of the legal system? Is
the use of external financing different in market-based and bank-based systems? Do the market-
based and bank-based systems differ in the provision of long-term and short-term funds?
We find that the use of external financing by firms is positively related to the
development of both the predicted banking system and the securities markets in each country.
However, in our sample we do not find evidence that variations in the development of the
1 For a critical examination of the effect of the legal and market environment on corporate finance see Stulz (1999). Allen (1993) and Allen and Gale (1999) provide analyses of the relative benefits of market-based and bank-based financial systems.

2
financial system that are unrelated to the legal system affect access to external finance. In
particular, we find no evidence that firms use external financing differently if they are in
countries classified as bank-based or market-based, on the basis of the development of their
banking sector relative to their securities markets.
These results are consistent with the LLSV approach that stresses the primacy of the legal
system. The policy implication that flows from the results is that the way to improve access to
external finance is to aid in the development of a country’s legal system, and then to let firms
and investors contract either directly (as in a market-based system) or through the intermediation
of banks.
We also find that securities markets and bank development have a different effect on the
type of external finance firms obtain, particularly at relatively low levels of financial
development. In those countries where the legal contracting environment predicts a high level of
development for securities markets, more firms grow at rates requiring long-term external
finance. We do not find the same effect for predicted bank development. Thus, especially for
countries with lower levels of financial development, differences in contracting environments
that affect the relative development of the stock market and the banking system may have
implications for which firms and which projects obtain financing.
There exists a growing literature on the effect of financial sector development on
economic development. King and Levine (1993a,b) highlight the importance of financial
development for macro-economic growth. Recently Levine and Zervos (1998), Rajan and
Zingales (1998) and Demirguc-Kunt and Maksimovic (1998) explore the relation between
financial development and growth of countries, industries and firms, respectively.2
2 See also Wurgler (2000) for an analysis of industry growth.
3
The importance of the legal system for corporate finance was first explored by LLSV
(1998). Modigliani and Perotti (1999) argue that in the absence of a strong legal system that can
protect the rights of external investors, financial transactions are intermediated through
institutions or concentrated among agents who have sufficient bargaining power to enforce their
rights privately. Empirical evidence on the effect of legal effectiveness on firm growth and
financing is provided by Demirguc-Kunt and Maksimovic (1998, 1999), and on growth at more
aggregated levels by Levine (1998, 1999, 2000). This paper extends the methodology of
Demirguc-Kunt and Maksimovic (1998) to address the questions of the differences in bank-
based and market-based systems in firm growth.
The rest of the paper is organized as follows. Section 2. briefly discusses reasons to
believe that bank-based and market-based systems perform differently, and our approach to
testing those differences empirically. Section 3. introduces the data and summary statistics. Our
principal results are reported in Section 4.. Section 5. concludes.
2. BANK-BASED AND MARKET-BASED FINANCIAL SYSTEMS
2.1 How do the systems differ?
Among a financial system’s major tasks is to mobilize resources for investment, select
investment projects to be funded, and to provide incentives for the monitoring of the
performance of the funded investments. A large body of theoretical and empirical research has
analyzed how these tasks are performed in a market-based system, and how they are performed
in a system where banks and other financial intermediaries play a major role. This research has
identified significant differences in incentives. These differences raise the possibility that a bank-

4
based or a market-based system is inherently superior, and that economic performance can be
enhanced by adopting the superior system.
A second approach, identified with LLSV (1999), stresses the importance of the legal
system in determining the enforceable contracts between firms and investors. According to this
view, the relevant differences between countries is in the extent to which their financial systems
protect investor rights. The distinction between bank-based and market-based systems is seen as
secondary.
In our examination of the differences between bank-based and market-based financial
systems we adopt a maintained hypothesis that has elements of both of these approaches. We
posit that there exist significant differences in outcomes between systems in which financial
intermediaries like banks play the dominant role and those where they do not. For example, as
explored by Allen and Gale (1999), banks and stock markets may have a comparative advantage
in selecting different types of investment projects. Banks may also have a comparative advantage
in providing short-term financing.
In common with the legal approach, we posit that the absolute quality of the banks and
securities markets in a country depends on the legal system’s ability to enforce contracts.
However, we argue that the legal systems in different countries may have a comparative
advantage in supporting a quality banking system or a quality securities markets. Thus, for
example, a country with an inefficient legal system may have a low-quality financial system.
However, it may, through a combination of administrative regulation of the banking system, and
strong banks with bargaining power vis-à-vis their customers, partially compensate for the effect
of the deficiency of the legal system on banks. It may be more difficult to compensate for the
effect of poor legal protections on a securities markets. Thus, while the level of development of

5
the legal system in each country may be the major determinant of the quantity of financial
services supplied, the comparative advantage in supporting intermediaries and markets may
determine the optimal mix of banks versus markets.
These considerations suggest the following hypotheses:
H1. For each country there is a “warranted” level of development of the banking sector
and of stock markets, as a function of the level of development of the contracting environment.
The provision of external financing to firms is greater, the higher the warranted level of
development of these sectors.
H2. The expansion of one of the sectors, banks or securities markets beyond the levels
warranted by the contracting environment is unlikely to produce an improved allocation of
resources.
H3. Because the banking system and securities markets have a comparative advantage in
providing different services, cross-country differences in the warranted development levels of
markets and the banking sectors may affect the type of finance constraints faced by firms.
2.2 Testing for differences in performance between the systems
Differences between outcomes in market-based and bank-based systems should, if they
exist, be observable at the country, industry or firm levels. In principle, a test would relate a
performance measure, usually the growth rate, to the financial system or legal system
characteristics. While this results in straightforward applications at the country level, there exists
a potential selection bias when this procedure is applied at lower levels of aggregation, such as
the industry and firm levels.
The selection bias may arise because the way in which production is organized in different
countries may depend on their legal and financial systems. Thus, the firms that are observed in a

6
country are those that are adapted to the financial system of that country. Analyzing growth rates
of those firms does not take into account the possibility that a different financial system might
induce a different mix of firms, and that the different mix might increase wealth.
To fix ideas, consider an example involving two countries, B and M. Country B has a
bank-based financial system (perhaps because its legal system favors that type of contracting).
Country M has a market-based system. Assume that the two financial systems have different
comparative advantages in supplying financing. In particular, assume that market-based systems
are superior at providing long-term financing. Consider entrepreneurs in each country starting
firms in the same industry. Entrepreneurs in country M have a greater choice of technology and
organizational forms since they have greater access to long-term financing. As a result, economy
M is better off. However, once the initial investment is made, each individual firm, and the
industry as a whole, may grow at the same rate in country B and in country M. Indeed, firms in
country B may grow faster, because they can switch to a superior technology as they accumulate
enough funds over time to self-finance its acquisition. In this case, a comparison of firm or
industry growth rates across countries may not identify the benefits of a market-based financial
system.
An alternative approach, developed in Demirguc-Kunt and Maksimovic (1998), is to test
for differences between financial systems by testing whether the proportion of firms growing at
rates that exceed the rate that they can self-finance, or finance using short-term instruments only,
differs across different financial or legal systems.3 This is the approach we employ below, using
firm-specific data to determine whether each firm in the sample is constrained.
3 This approach would identify the financial system in economy M above as being superior.
7
While the use of firm-specific data brings advantages, it also entails two potential costs.
First, the firms for which data is available are likely to be a relatively small number of the largest
publicly traded firms in each economy. While such firms are of independent interest, they may
not be fully representative of firms in the economy.4 Second, as discussed by Ball (1995), the
quality of firm-level financial data may differ across countries. Thus, the findings of firm-level
and industry-level studies need to be assessed jointly.
3. DATA AND SUMMARY STATISTICS
3.1 Description of Sample
The firm-level data consist of financial statements for the largest publicly traded
manufacturing firms in 40 countries (SIC codes 2000-3999). Our sample of firms contains
45,598 annual observations over the period 1989-1996. The sample is from Worldscope and
contains data from both developed and developing countries as listed in Table AI in the
Appendix. For each of the countries we also use data on financial system development compiled
by Beck, Demirguc-Kunt and Levine (1999).
In Table 1 we present pertinent facts about the level of economic and institutional
development in the sample countries. The countries are arranged from highest to lowest average
per capita Gross Domestic Product (RGDPPC) in 1990 dollars. They range from Switzerland,
with a per capita income of $26,972 to Pakistan, with a per capita income of $319.
Insert Table 1 here
As an indicator of the ability of firms to enter into financial contracts we use a commercial index
of experts’ evaluations of the efficiency of the state in enforcing property rights within each
4 Industry-level data may suffer from the opposite bias: many of the firms included in industry statistics are very small and would not qualify for significant external financing under any financial system. See Rajan and Zingales (1999) discussion of European data.

8
country. This measure, produced by the International Country Risk rating agency, reflects the
degree to which the citizens of a country are willing to accept the established institutions to make
and implement laws and adjudicate disputes. It is scored on a zero to six scale, with higher
scores indicating sound political institutions and a strong court system. Lower scores indicate a
tradition of depending on physical force or illegal means to settle claims. This indicator has been
used in previous studies comparing institutions in different countries (e.g., Knack and Keefer
(1995), Demirguc-Kunt and Maksimovic (1998)).
We place more weight on this indicator than on a comparison of specific differences in
the legal codes across countries. Such a comparison may be misleading, because firms may be
able to compensate for the absence of specific legal protections by altering the provisions of
contracts. It is likely to be more difficult to compensate for the systemic failures of the legal
system to adjudicate claims captured by the law and order indicator. In Demirguc-Kunt and
Maksimovic (1999), we show that the index is a good predictor of the use of long-term debt by
large firms in our sample of countries. By contrast, we find less evidence that the indicators of
specific legal protections identified by LLSV predict the use of long-term debt. However, for
completeness we also present indicators obtained by LLSV. Common Law Dummy takes the
value one for common law countries and the value zero for others. As argued by LLSV, common
law legal systems are more likely to offer protections to outside investors than civil law systems.
Creditor rights is an index that ranges from 0 to 4 and aggregates creditor rights, and shareholder
rights is an index that ranges from 0 to 5 and aggregates shareholder rights as described in the
text. The creditor and shareholder rights variables are described in LLSV.
Table 1 shows that our sample contains countries with legal systems of very diverse
levels of effectiveness. It contains highly effective common law legal systems (such as the

9
United States and Canada) and less effective legal systems (such as India and Pakistan), as well
as highly effective civil systems (such as Switzerland) and less effective systems such as those
in Columbia and Peru.
For each country we also present three indicators of financial system development. As an
indicator of whether the financial system is bank-based or market-based we use a dummy
variable, MARKET1, defined in Demirguc-Kunt and Levine (1999). The variable classifies
countries as being market-based when they have larger, more active and efficient stock markets
compared to banks.5
We also present two other measures of the development of the market and the banking
sector separately. We measure the level of activity of the stock market by its turnover. As argued
by Grossman and Stiglitz (1976) markets on which stocks trade actively provide greater
incentives for investors to become informed, and are therefore more informationally efficient.
Turnover, TOR, is the total value of shares traded in the stock exchange divided by market
capitalization. Stock market data are from IFC’s Emerging Market Data Base.6 Bank/GDP is the
total assets of the deposit money banks divided by GDP. It is obtained from IMF, International
Financial Statistics. Both variables have been used in our previous firm-level studies (Demirguc-
Kunt and Maksimovic (1998, 1999).
5 Market 1 is a dummy that takes the value 1 for higher than mean values of an aggregate Structure index. Structure index is the means-removed average of relative size, relative activity and relative efficiency measures. Relative size is given by the ratio of stock market capitalization to total assets of deposit money banks; relative activity is defined as the total value of stocks traded divided by bank credit to the private sector; and finally relative efficiency is given by the product of total value traded on the stock market and average overhead costs of banks in the country. See Demirguc-Kunt and Levine (1999) for a discussion of alternative ways of defining market-based and bank-based systems. 6 An alternative measure, used in Levine (2000), is the ratio of total value traded to GDP. Since our sample consists of firms that are already listed on the stock exchange, the ratio of value traded to market capitalization provides a measure of the activity levels of the financial markets that is more relevant to these firms.
10
Countries scoring high on TOR include East Asian economies which were experiencing a market
boom at this time, and the United States and the United Kingdom. Countries with low scrores
include Latin American countries such as Chile and Columbia, and Peru, as well as European
countries such as Greece and Portugal. Countries with a large banking sector include
Switzerland, Japan, Germany and Hong Kong, whereas Mexico, Turkey and Columbia have
small banking sectors relative to their GDP.
3.2 Measures of firm growth
To measure whether firms’ growth in an economy is financially constrained we adopt the
approach of Demirguc-Kunt and Maksimovic (1998). For each firm in an economy we estimate a
rate at which it can grow, relying only on its internal funds or on short-term borrowing. We then
compute the proportion of firms that grow at rates that exceed each of these two estimated rates
each year. We then examine whether the proportions of firms growing faster than each of the two
estimated rates differ between bank-based and market-based financial systems, and whether they
are affected by the level of development of the legal system.
Our estimate of the firm’s growth rate is based on the standard “percentage of sales’’
financial planning model (Higgins (1974)). This model relates a firm’s growth rate to its need
for external funds. The external financing need at time t of a firm growing at gt percent a year is
given by
EFNt =gt * Assetst -(1+ gt )*Earningst * bt (1)
where EFNt is the external financing need and bt is the proportion of the firm’s earnings that are
retained for reinvestment at time t. Earnings are calculated after interest and taxes. The first term

11
on the right-hand side is the required investment for a firm growing at gt percent. The second
term is the internally available capital for investment, taking the firm’s retention ratio as given.
The financial planning model makes several implicit assumptions about the relation
between the firm’s growth rate and the EFNt. First, the ratio of assets used in production to sales
is assumed to be constant. Thus, the required total investment increases in proportion to the
firm’s growth in sales. Second, the firm’s profit rate per unit of sales is constant.7 Third, we
assume that the economic depreciation of existing assets equals that reported in the financial
statements.
We use two estimates of each firm’s attainable growth rate. The internally financed
growth rate IGt is the maximum growth rate that can be financed if a firm relies only on its
internal resources and maintains its dividend. It is obtained by assuming that the firm retains all
its earnings (i.e., bt =1), equating EFNt to zero and solving (1) for gt, and is given by
IGt =ROAt/(1- ROAt),
where ROAt is the firm’s return on assets, or the ratio of earnings after taxes and interest to total
assets. IGt is increasing in the firm’s return on assets. Thus, more profitable firms can finance
higher growth rates internally.
The short-term financed growth rate SGRt is an estimate of the maximum growth rate that
can be attained if the firm uses only short-term external financing. It is obtained by using only
the value of assets that are not financed by new short-term credit in place of total assets in
equation (1). The assets not financed by short-term debt are termed “long-term capital’’ ROLTCt
and are obtained by multiplying total assets by one minus the ratio of short-term liabilities to
total assets. More specifically, SFGt is given by
12
SFGt =ROLTCt/(1- ROLTCt).
The use of the current realized ratio of short-term borrowing to assets to calculate SFGt ensures
that the estimate is feasible, and does not assume levels of short-term credit that are so costly that
firms would not choose them.
The estimates of IGt and SFGt are conservative in several ways. First, each estimated
maximum growth rate assumes that a firm utilizes the unconstrained sources of finance no more
intensively than it is currently doing.8 Second, firms with spare capacity do not need to invest
and may grow at a faster rate than predicted by the financial planning model. We attempt to
mitigate the potential problem posed by spare capacity by using each firm’s maximum
constrained growth rates averaged over the second half of the sample period in our tests below.
Third, the financial planning model abstracts from technical advances that reduce the
requirements for investment capital. Thus, it may overstate the cost of growth and underestimate
the maximum growth rate attainable using unconstrained sources of finance.
For each country in the sample we compute the proportion of firms whose mean annual
real growth rate of sales exceeds the means of the two maximum constrained growth rates
defined above. Thus, taking IG as an example, for each firm f in each country c and for each year
t we estimate IGfct. We form a dummy variable for each firm f which takes on the value one if
the firm inflation-adjusted realized growth rate exceeds the predicted rate, and zero otherwise:
dfct=1 if gfct> IGfct and is 0 otherwise. Finally, for each country and each year we obtain
STCOUNTct, the proportion of firms that grow at average rates exceeding the IGfct rate in year t,
Σf dfct/nct , where nct is the number of firms in each country in year t. We repeat the same
7 This assumption was examined in Demirguc-Kunt and Maksimovic (1998). The results in that paper were not sensitive to different assumptions about the rate of return on marginal sales.
13
calculations with SFG in place of IG to obtain LTCOUNTct the proportion of firms that grow at
average rates exceeding the SFGfct rate in year t. Thus, LTCOUNTct is an estimate of the
proportion of firms that obtain long-term financing (debt and/or equity), by issuing public or
privately placed securities or by borrowing from the financial sector.
Our final variable is DCOUNTct, the proportion of firms in a country that grow at a rate
that exceeds IGt but does not exceed SFGt. Thus, this variable measures the proportion of firms
that have access to short-term financing, but not necessarily access to long-term financing. Thus,
DCOUNT proxies for the relative availability of short-term financing compared to the
availability of long-term financing.
Our implementation of the financial growth model implicitly assumes that there exists
a positive correlation between firms' profits and their future investment opportunities. Some
firms may have high profits from their assets in place, but poor investment opportunities. Such
firms present potential problems for methodologies, such as our approach and methodologies
based on Tobin's q, that infer future investment opportunies from current valuations.
Cash-rich firms that do not have good investment opportunities and pay out their
excess funds to shareholders are classified as growing at a rate that does not require external
financing. However, since the existence of such firms does not have any implications for the
availability of external financing, there exists the potential that such firms bias our conclusions
about the proportion of firms with access to external fiance finance in different financial systems.
Such bias can occur if the proportion of highly profitable firms without good investment
opportunities depends on a country’s financial system. To minimize potential bias, in the
8 In the case of IG the unconstrained source of finance is trade credit. In the calculation of SFG the unconstrained sources are trade credit and short-term borrowing.
14
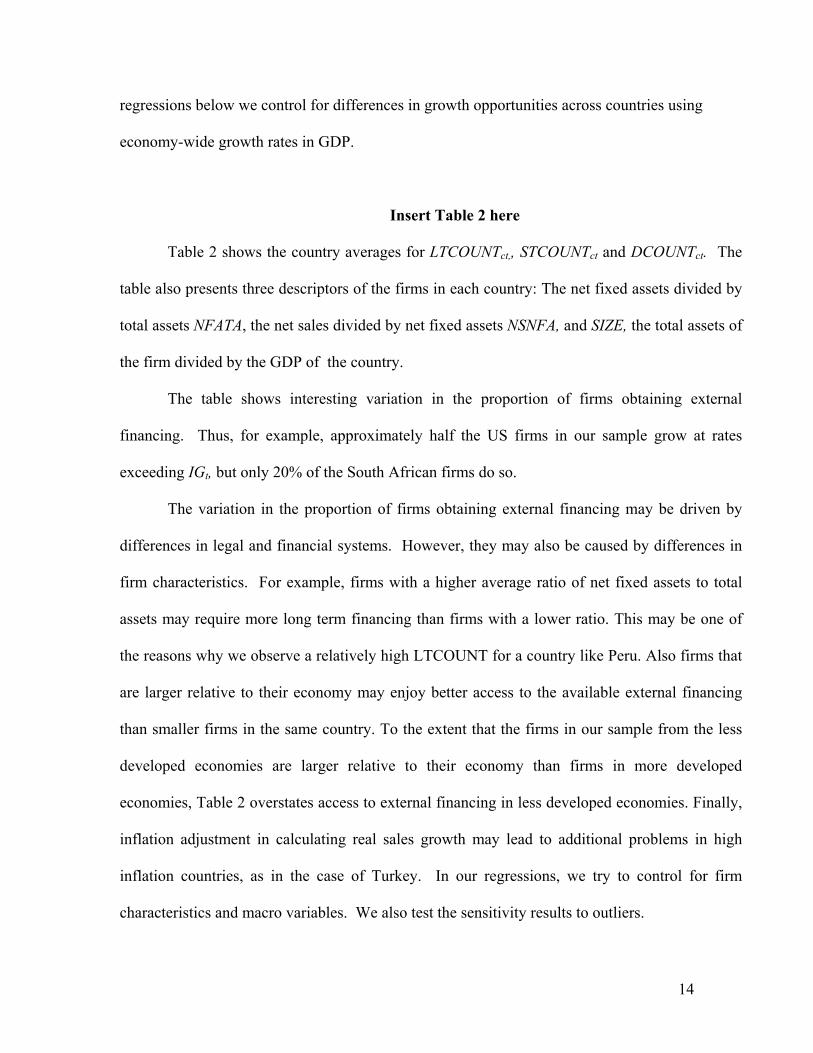
regressions below we control for differences in growth opportunities across countries using
economy-wide growth rates in GDP.
Insert Table 2 here
Table 2 shows the country averages for LTCOUNTct,, STCOUNTct and DCOUNTct. The
table also presents three descriptors of the firms in each country: The net fixed assets divided by
total assets NFATA, the net sales divided by net fixed assets NSNFA, and SIZE, the total assets of
the firm divided by the GDP of the country.
The table shows interesting variation in the proportion of firms obtaining external
financing. Thus, for example, approximately half the US firms in our sample grow at rates
exceeding IGt, but only 20% of the South African firms do so.
The variation in the proportion of firms obtaining external financing may be driven by
differences in legal and financial systems. However, they may also be caused by differences in
firm characteristics. For example, firms with a higher average ratio of net fixed assets to total
assets may require more long term financing than firms with a lower ratio. This may be one of
the reasons why we observe a relatively high LTCOUNT for a country like Peru. Also firms that
are larger relative to their economy may enjoy better access to the available external financing
than smaller firms in the same country. To the extent that the firms in our sample from the less
developed economies are larger relative to their economy than firms in more developed
economies, Table 2 overstates access to external financing in less developed economies. Finally,
inflation adjustment in calculating real sales growth may lead to additional problems in high
inflation countries, as in the case of Turkey. In our regressions, we try to control for firm
characteristics and macro variables. We also test the sensitivity results to outliers.
15
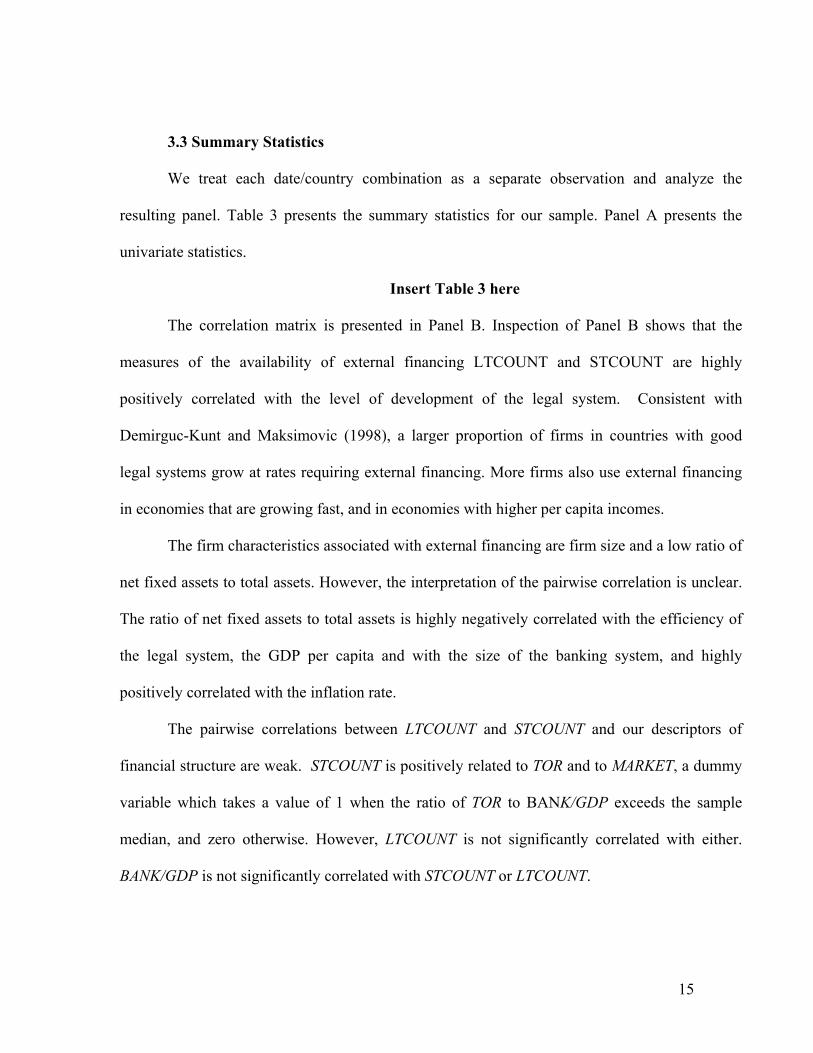
3.3 Summary Statistics
We treat each date/country combination as a separate observation and analyze the
resulting panel. Table 3 presents the summary statistics for our sample. Panel A presents the
univariate statistics.
Insert Table 3 here
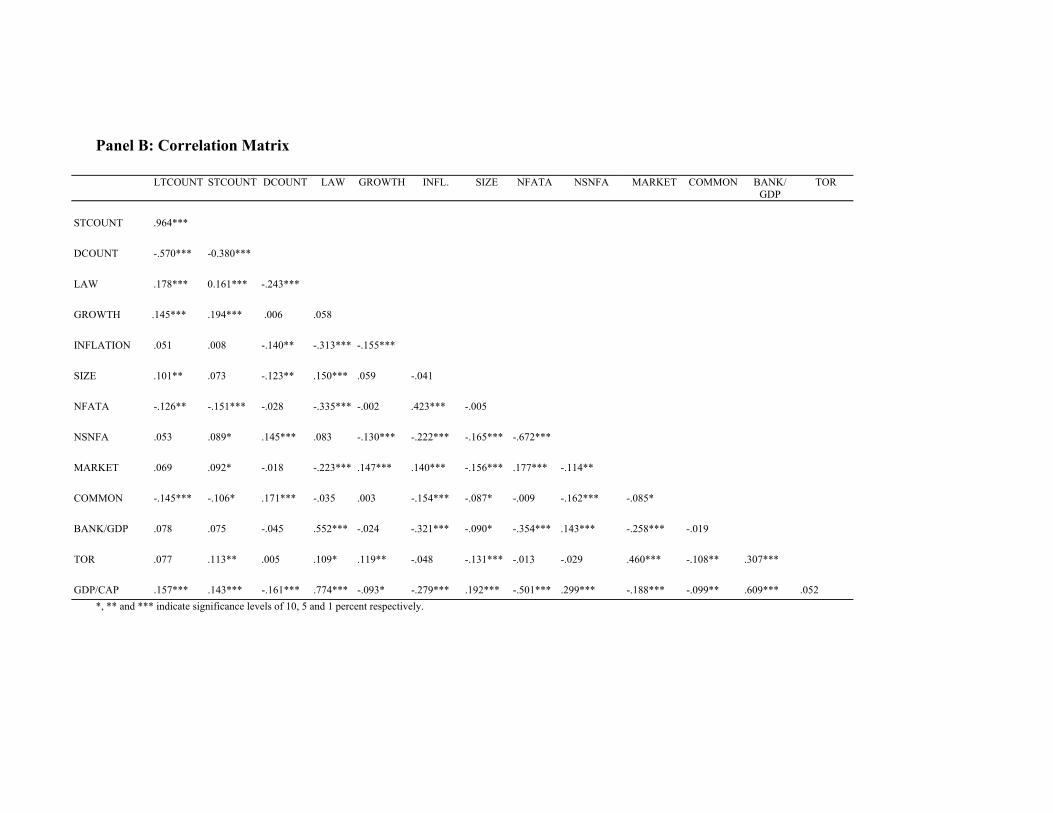
The correlation matrix is presented in Panel B. Inspection of Panel B shows that the
measures of the availability of external financing LTCOUNT and STCOUNT are highly
positively correlated with the level of development of the legal system. Consistent with
Demirguc-Kunt and Maksimovic (1998), a larger proportion of firms in countries with good
legal systems grow at rates requiring external financing. More firms also use external financing
in economies that are growing fast, and in economies with higher per capita incomes.
The firm characteristics associated with external financing are firm size and a low ratio of
net fixed assets to total assets. However, the interpretation of the pairwise correlation is unclear.
The ratio of net fixed assets to total assets is highly negatively correlated with the efficiency of
the legal system, the GDP per capita and with the size of the banking system, and highly
positively correlated with the inflation rate.
The pairwise correlations between LTCOUNT and STCOUNT and our descriptors of
financial structure are weak. STCOUNT is positively related to TOR and to MARKET, a dummy
variable which takes a value of 1 when the ratio of TOR to BANK/GDP exceeds the sample
median, and zero otherwise. However, LTCOUNT is not significantly correlated with either.
BANK/GDP is not significantly correlated with STCOUNT or LTCOUNT.
16
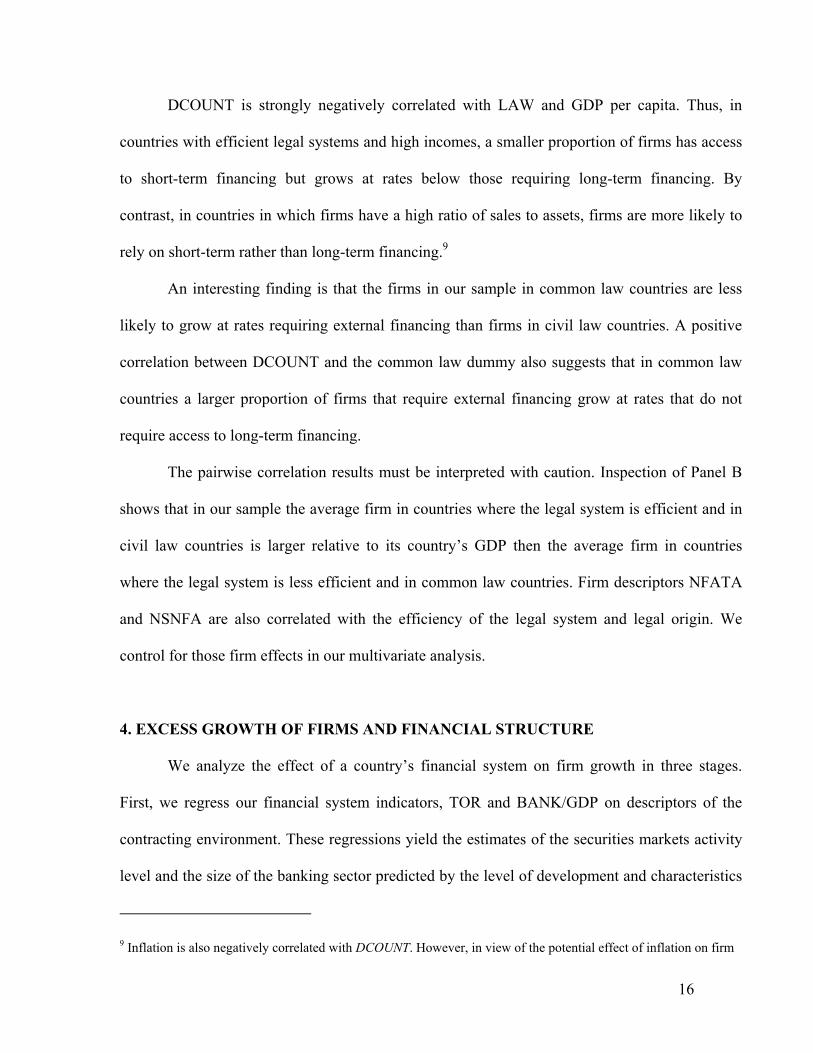
DCOUNT is strongly negatively correlated with LAW and GDP per capita. Thus, in
countries with efficient legal systems and high incomes, a smaller proportion of firms has access
to short-term financing but grows at rates below those requiring long-term financing. By
contrast, in countries in which firms have a high ratio of sales to assets, firms are more likely to
rely on short-term rather than long-term financing.9
An interesting finding is that the firms in our sample in common law countries are less
likely to grow at rates requiring external financing than firms in civil law countries. A positive
correlation between DCOUNT and the common law dummy also suggests that in common law
countries a larger proportion of firms that require external financing grow at rates that do not
require access to long-term financing.
The pairwise correlation results must be interpreted with caution. Inspection of Panel B
shows that in our sample the average firm in countries where the legal system is efficient and in
civil law countries is larger relative to its country’s GDP then the average firm in countries
where the legal system is less efficient and in common law countries. Firm descriptors NFATA
and NSNFA are also correlated with the efficiency of the legal system and legal origin. We
control for those firm effects in our multivariate analysis.
4. EXCESS GROWTH OF FIRMS AND FINANCIAL STRUCTURE
We analyze the effect of a country’s financial system on firm growth in three stages.
First, we regress our financial system indicators, TOR and BANK/GDP on descriptors of the
contracting environment. These regressions yield the estimates of the securities markets activity
level and the size of the banking sector predicted by the level of development and characteristics
9 Inflation is also negatively correlated with DCOUNT. However, in view of the potential effect of inflation on firm
17
of the legal system. We next regress our excess growth variables STCOUNT, LTCOUNT and
DCOUNT on these predicted values, and on control variables. These regressions allow us to test
whether the legal system influences excess growth by affecting the development of the financial
system. Finally, we augment these regressions by indicators of the relative development of the
stock markets to the banking system. These regressions allow us to test whether market-based or
bank-based systems perform differently.
We instrument for TOR and BANK/GDP variables used in the second stage using
variables that proxy for the contracting environment in each country. This choice is motivated by
the hypotheses that the development of the legal system can be taken as exogenous and that
financial system development depends primarily on the ability of investors or financial
intermediaries on one hand, and firms, on the other hand, to enter into effective contracts.
We use the LAW&ORDER indicator of legal effectiveness as a proxy for the contracting
environment. As suggested by LLSV we also use a legal origin variable, the common law
dummy, and the specific indices of shareholder and creditor rights. Finally, as a proxy for the
ability to enter into financial contracts, we use the rate of inflation.
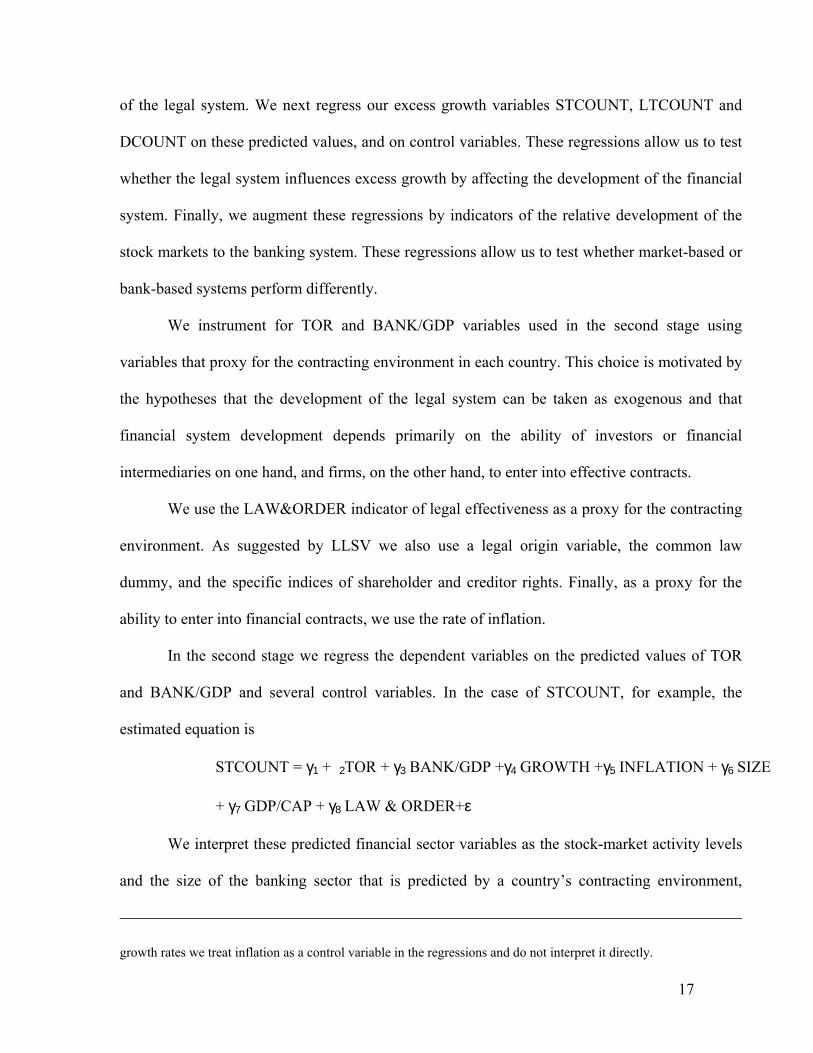
In the second stage we regress the dependent variables on the predicted values of TOR
and BANK/GDP and several control variables. In the case of STCOUNT, for example, the
estimated equation is
STCOUNT = γ1 + 2TOR + γ3 BANK/GDP +γ4 GROWTH +γ5 INFLATION + γ6 SIZE
+ γ7 GDP/CAP + γ8 LAW & ORDER+ε
We interpret these predicted financial sector variables as the stock-market activity levels
and the size of the banking sector that is predicted by a country’s contracting environment,
growth rates we treat inflation as a control variable in the regressions and do not interpret it directly.
18
respectively. We also include LAW & ORDER separately, to test for the additional channels,
independent of the financial system, by which the contracting environment may affect the firms'
access to financing.
We also include several control variables.10 We include GROWTH to control for the
possibility that the firms’ desire to grow at rates that require external financing depends on the
rate of growth of the economy.11 We also include INFLATION to control for the possibility that
in economies with high inflation the growth rates of firms will be overstated.
We also include two additional control variables. SIZE measures the average size of the
firms in each country as a proportion of their GDP. We hypothesize that large firms have more
access to the country’s financial markets and institutions. Thus, this variable controls for the
differences in sample selection across countries.
There may exist differences in access to financing that are related to the level of
development but not specifically related to the development of the legal system. We include
GDP per capita in the equation to serve as a proxy for these differences.
Our regression is estimated as a year-country unbalanced panel using a random effects
estimator. This methodology allows us to include dummy variables, which are constant across
countries in our specifications. The use of random effects panel estimators is also indicated when
the explanatory variables are subject to measurement error (Moulton (1987)).
Insert Table 4 here
10 Additional firm-specific variables NFATA and NSNFA were included in unreported runs. They were not significant and did not affect the reported results. 11 If the economy is growing fast, the rate of profit is likely to be high. This will also tend to increase the rates IG and SGR, permitting faster growth without access to external financing. The variable GROWTH allows for the possibility of additional effects of the growth in the economy.
19
Table 4 presents the second-stage regression results. In Panel A the dependent variable is
STCOUNT. Thus, the panel investigates the proportion of the firms in each country growing at a
rate that requires external financing. The basic specification is given in equation (1).
The proportion of firms growing at rates requiring outside financing is higher in countries
with high predicted TOR and BANK/GDP. Thus, a larger proportion of firms obtain outside
financing when the contracting environment is conducive to the development of a large banking
sector and an active stock market. This is in line with the implications of previous studies. The
two control variables GROWTH and INFLATION are also significantly positive.
We do not identify any effects of average firm size relative to GDP or of the general level
of development measured by GDP per capita on financing. We also do not identify any
additional effects of the efficiency of the legal system not already accounted for in the
development of the financial system.
Specification (2) augments the equation with a variable which takes the value one for
those observations where the ratio of TOR to BANK/GDP exceeds the sample median, and zero
otherwise. The MARKET dummy identifies market-based economic environments. Inspection of
specification (2) reveals that there is no evidence that the relative ratio of market activity to the
size of the banking sector affects the proportion of firms that obtain external financing.
In the specification (3) we augment the basic estimating equation with the residuals from
the first-stage regressions. ETOR is the component of the market activity level not predicted by
the legal environment. EBANK/GDP is the difference between the ratio of actual BANK/GDP and
the level BANK/GDP predicted by the country’s contracting environment. Positive coefficients
for these variables would suggest that there is a benefit to market activity and or a large banking
sector respectively, independently of the legal system.
20
The coefficients of ETOR and EBANK/GDP are not significant at the five percent level,
suggesting that there is little identifiable benefit to having a larger financial sector than that
predicted by the legal contracting environment. If anything, the marginal significance of
EBANK/GDP hints that an overexpansion of the banking sector beyond the predicted level may be
evidence that resources are being misallocated. However, this result is sensitive to outliers in our
sample. If we drop countries such as Peru and Turkey from the estimation, EBANK/GDP is not even
marginally significant and BANK/GDP becomes significant at five percent in all specifications.
Panel B presents analogous regressions for LTCOUNT. Thus in this panel we explain the
proportion of firms growing at rates that require additional long-term external financing. The
results in Panel B are analogous to those presented in Panel A, with one exception. The
coefficient for BANK/GDP, while remaining positive throughout, is no longer statistically
significant.12 Thus, we find less evidence that the size of the banking sector is an important
determinant of the availability of long-term financing for the firms in our sample. This is
consistent with the lack of significance of the MARKET indicator in specification (2).
The dependent variable in Panel C is DCOUNT, the proportion of firms that obtain
external financing but do not grow at rates that require additional long-term capital. This
proportion is likely to be high when the financial system is able to supply short-term financing
efficiently, but is not able to supply long-term financing.
Inspection of all three specifications in Panel C shows that DCOUNT is negatively
related to TOR and positively related to BANK/GDP. Firms that require external financing in
economies with strong securities markets are more likely to obtain long-term financing. By
contrast, firms that require external financing in economies with a strong banking sector are less
21
likely to grow at rates that require long-term financing. This is consistent with the notion that
well-developed securities markets facilitate long-term financing, whereas a well-developed
banking sector facilitates short-term financing. Interestingly, LAW&ORDER also has a strong
negative effect on DCOUNT independent of its effect through TOR.13 The financial structure
variables MARKET, of ETOR and EBANK/GDP are again not significant.
The coefficients of the control variables GROWTH and INFLATION are significant in the
expected directions. In high-growth economies a larger proportion of firms requiring external
financing grows at rates that require long-term financing. In economies with high inflation rates,
a higher proportion of externally financed firms grows at rate that exceeds the predicted rates IG
and SFG.
We also investigated possible nonlinearities in the way financial variables may affect
firm growth rates by including squared TOR and BANK/GDP terms into all specifications in
Table 4. The squared TOR and BANK/GDP terms enter the DCOUNT regressions significantly
with positive and negative signs, respectively. TOR and BANK/GDP terms also remain
significant with their initial signs. This indicates that the positive impact of bank development
on short term financing and stock market development on long term financing are especially
important at lower levels of financial development. 14
This finding raises the possibility that relative development of banks versus markets may
be particularly important at lower levels of development. To test this, we added an interaction
term of MARKET with GDP per capita to specification (2) in all panels of Table 4. However,
12 Dropping outliers does not make BANK/GDP significant in LTCOUNT regressions although EBANK/GDP loses significance as in STCOUNT regressions.. 13 Dropping outliers makes TOR less significant but LAW &ORDER more significant. 14 The squared terms do not develop significant coefficients in STCOUNT regressions. In LTCOUNT regressions only the squared TOR is marginally significant in some specifications with a negative sign.
22
this variable failed to develop a significant coefficient. Another possibility is that financial
structure is only important if the underlying legal structure is inadequate. This may be true since
markets in general require a better developed legal system to function efficiently. However an
interaction term of MARKET with LAW & ORDER variable does not develop a significant sign
in any of the regressions in Table 4.
Wurgler (2000) argues that the responsiveness of investment to changes in valued added
in an industry is a measure of the efficiency with which resources are allocated. He calculates
this responsiveness for manufacturing industries in a sample of countries. As a check we
estimate the correlations between our variables TOR and BANK/GDP and the responsiveness
variable reported in Wurgler (2000). Although the sample period in Wurgler (2000) does not
correspond to our sample period, the country specific variables we estimate are unlikely to
change significantly over short periods.
For the 34 countries for which data is available, the correlation between the Wurgler's
allocation efficiency measure and our variables TOR and BANK/GDP are 0.27 and 0.62,
respectively. The former is significant at 10 percent, while the latter is significant at the one percent
level. Thus, there is a significant positive relation between our measures of financial development
and the measure of efficiency in Wurgler. However, our financial structure measure, MARKET and
Wurgler's measure is not significantly correlated. Indeed, if we were to regress Wurgler's measure on
TOR, BANK/GDP, and MARKET, BANK/GDP develops a positive and highly significant
coefficient, while MARKET is insignificant. Thus, efficiency of capital allocation appears to be
strongly correlated with financial development, but not structure. Wurgler (2000) himself observes
this in his paper when he states that it is remarkable that the four most studied financial systems all

23
fall in the top quintile of his sample in terms of efficiency of capital allocation despite considerable
institutional differences (p.199).
Further support for our findings come from Beck and Levine (forthcoming) who investigate
the same questions using industry-level data and the methodology developed in Rajan and Zingales
(1998). Indeed, they find that industry growth is highly correlated with financial development, but
not financial structure. Furthermore, Levine (2000) investigates the issue at the macro level, using
standard cross-country growth regressions. Again, he finds that overall financial development is
highly correlated with long run economic growth, whereas there is no evidence of any correlation
between growth and financial structure.
It is possible that our classification of market-based and bank-based financial does not
capture essential differences between financial systems. To check this, we reestimated the
regressions in Table 4 panels A,B, and C, including two additional proxies for the extent to
which the financial system is market based. The first proxy is the percentage of assets of the 10
largest banks in each country owned by the government as a share of total assets of these banks.
The variable is drawn from Laporta, Lopez-de-Silanes, and Shleifer (1999). The second variable
measures the ability of banks to own and control nonfinancial firms. This variable is compiled by
Barth, Caprio and Levine (1999). The variables were entered separately, and both together. None
of the coefficients were significant, indicating that these variables do not provide additional
explanation of the use of external financing.
It is also possible is that the legal efficiency variable does not adequately represent the
extent to which private property rights are safeguarded in the countries in our sample. As a
broader measure of adherence to legal norms, we have used the index of political freedom

24
calculated by Freedom House in our specifications.15 We first augment the specifications in
Table IV with this variable. It proved not to be significant in every case. We further
experimented with this indicator in additional specifications, and did not obtain significant
results. Thus, the LAW variable that we use, which focus directly on the efficiency of each
country's legal system, appears to be a better indicator of the ability to enter into long-term
contracts.16
It is unlikely that the available indicators can capture all the theoretically relevant
nuances in the organization of financial markets or of the legal systems. However, taken
together, the additional regressions suggest that in Table 4 we are using appropriate, albeit,
coarse, proxies. In sum, Table 4 yields several results:
First, we have no evidence that the relative levels development of the securities markets
and the size of the banking sector, by itself, affect firms’ access to external financing. Thus, there
is no evidence that the development of a market-based or bank-based financial system per se
affects access to financing.
Second, the securities markets and the banking system affect firms’ ability to obtain
financing in different ways, especially at lower levels of financial development. While the
development of both improves access to external financing, the development of securities
markets is more related to long-term financing, whereas the development of the banking sector is
more related to the availability of short-term financing. Thus, for these countries differences in
contracting environments that affect the relative development of the stock market and the
banking system may have implications for which firms and which projects obtain financing.
15 We are grateful to the anonymous referee for this suggestion. 16 In unreported regressions we have replaced our LAW variable by the value of legal efficiency at the beginning of the sample period. The results remain qualitatively unchanged.

25
Third, the effect of the securities markets and banking system development is closely tied
to the level of development of the country’s contracting environment. Differences in the activity
level of the securities markets not predicted by the contracting environment are not significantly
related to the ability of firms do obtain external financing. This is consistent with the emphasis in
LLSV on the importance of the legal system on financing.
Fourth, the proportion of firms that grow at rates that cannot be self-financed is positively
related to the development of both the securities markets and the banking system. This is
consistent with the findings of Demirguc-Kunt and Maksimovic (1998).
5. CONCLUSION
The relative development of banks versus markets varies considerably across countries. The
financial systems of some countries, such as the US, are market-based, whereas the financial
systems of other economies, such as Japan, are bank-based. In this paper we investigate whether
this difference in the organization of financial systems affects firms’ ability to obtain external
financing for growth.
Our initial finding that that the proportion of firms that grow at rates that cannot be self-
financed is positively related to the development of both the securities markets and the banking
system. This is consistent with the findings of Demirguc-Kunt and Maksimovic (1998), and with
parallel findings of Levine and Zervos (1998), at the country level, and Rajan and Zingales
(1998), at the industry level.
Our results show that the effects of the stock market and banking system development on
firms’ growth is closely tied to the level of development of the country’s contracting
environment. Development of the financial system beyond that predicted by the contracting

26
environment are not significantly related to the ability of firms to obtain external financing. This
is consistent with the emphasis on the importance of the legal system in LLSV on financing.
Using several proxies, we find no evidence that the relative levels of development of the
securities markets compared to that of the banking sector, affect firms’ access to external
financing. Thus, there is no evidence that the development of a market-based or bank-based
financial system per se affects access to financing.
Finally, the securities markets and the banking system affect firms’ ability to obtain
financing in different ways, especially at lower levels of financial development. While the
development of both, if predicted by the contracting environment, improves access to external
financing, the development of securities markets is more related to long-term financing, whereas
the development of the banking sector is more related to the availability of short-term financing.
Thus, for these countries differences in contracting environments that affect the relative
development of the stock market and the banking system may have implications for which firms
and which projects obtain financing.

27
REFERENCES
Allen, Franklin and Gale, Douglas. 1999 Comparing Financial Systems. Cambridge, MA: MIT Press.
Allen, Franklin, 1993, Stock markets and resource allocation, in Mayer, Colin, and Xavier Vives,
eds.: Capital Markets and Financial Intermediation, (Cambridge University Press, Cambridge, England).
Beck, Thorsten; Demirguc-Kunt, Asli; Levine, Ross, 1999, “A New database on Financial
Development and Structure” Washington, D.C.: World Bank, mimeo. Demirguc-Kunt, Asli and Ross Levine, 1999, “Financial Structures Across Countries: Stylized
Facts” Washington, D.C.: World Bank, mimeo. Demirguc-Kunt, Asli and Ross Levine, 1996, Stock market development and financial
intermediaries: stylized facts, World Bank Economic Review10, 291-321. Demirguc-Kunt, Asli and Vojislav Maksimovic, 1999, Institutions, Financial Markets And Firm
Debt Maturity, Journal of Financial Economics. Demirgüç-Kunt, Asli and Vojislav Maksimovic, 1998, Law, Finance, and Firm Growth, Journal
of Finance 53,.2107-2137. Demirguc-Kunt, Asli and Vojislav Maksimovic, 1996, Stock Market Development and Firms’
Financing Choices, World Bank Economic Review 10, 341-369. Diamond, Douglas W., 1996, Liquidity, banks and markets, Policy Research Working Paper No
1566, The World Bank. Gerschenkron, Alexander, 1962, Economic Backwardness in Historical Perspective, Belknap
Press of Harvard University Press, Cambridge, MA. King, Robert G. and Ross Levine, 1993a, "Finance, Entrepreneurship, and Growth: Theory and
Evidence," Journal of Monetary Economics 32, 513-42. King, Robert G., and Ross Levine, 1993b, Finance and growth: Schumpeter might be right,
Quarterly Journal of Economics, 108, 717-738. Knack, Stephen and Phillip K. Keefer, 1995, Institutions and economic performance: cross-
country tests using alternative institutional measures, Economics and Politics 7, 207-227. Kumar, Krshna.B., Rajan, Raghuram, and Luigi Zingales, 1999, What determines firm size?
mimeo.
28
Laporta, Rafael; Lopez-de-Silanes, Florencio; Shleifer, Andrei; and Vishny, Robert W. “The
Quality of Government,1999, Journal of Law, Economics, and Organization 15, 222-279.
Laporta, Rafael; Lopez-de-Silanes, Florencio; Shleifer, Andrei; and Vishny, Robert W. 1998, Law and Finance, Journal of Political Economy 106, 1113-1155.
Levine Ross, and Sara Zervos, 1998, Stock markets, banks, and economic growth, American Economic Review.
Levine, Ross, 2000, Bank-based or market-based financial systems: Which is better? University of Minnesota, mimeo.
Modigliani, F., and E. Perotti, 1999, Security Markets versus Bank Financing and the Enforcement of Legal Rules, mimeo.
Morck, Randall, Shleifer, Andrei, and Robert W. Vishny, 1990, The Stock Market and Investment: Is the Market a Sideshow? Brookings Papers on Economic Activity 0, 157-202.
Myers, Stewart C. and Nicholas S. Majluf, 1984, Corporate financing and investment decisions
when firms have information that investors do not have, Journal of Financial Economics 13, 187-221.
Rajan, Rhaguram and Luigi Zingales, 1996, Financial dependence and growth, forthcoming in
American Economic Review. Stulz, Rene M. “Financial Structure, Corporate Finance, and Economic Growth,” 1999, Ohio
State University mimeo. Wurgler, Jeffrey, 2000, “Financial Markets and the Allocation of Capital,” Journal of Financial
Economics.
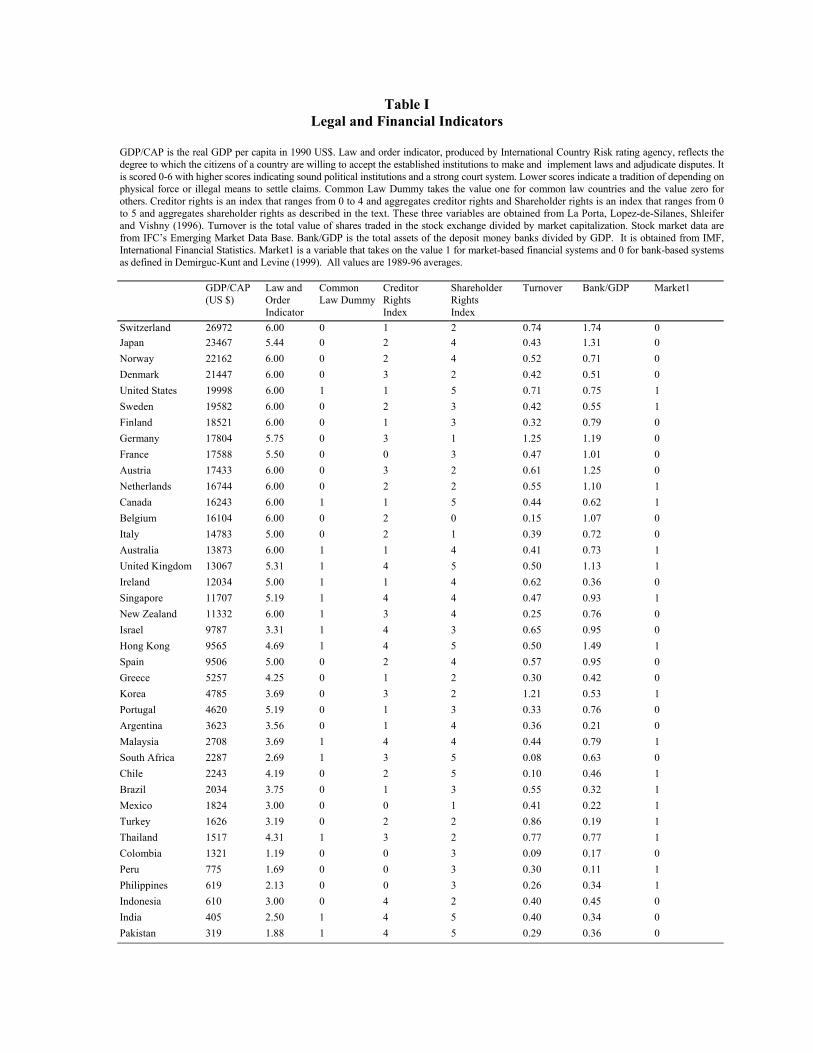
Table I Legal and Financial Indicators
GDP/CAP is the real GDP per capita in 1990 US$. Law and order indicator, produced by International Country Risk rating agency, reflects the degree to which the citizens of a country are willing to accept the established institutions to make and implement laws and adjudicate disputes. It is scored 0-6 with higher scores indicating sound political institutions and a strong court system. Lower scores indicate a tradition of depending on physical force or illegal means to settle claims. Common Law Dummy takes the value one for common law countries and the value zero for others. Creditor rights is an index that ranges from 0 to 4 and aggregates creditor rights and Shareholder rights is an index that ranges from 0 to 5 and aggregates shareholder rights as described in the text. These three variables are obtained from La Porta, Lopez-de-Silanes, Shleifer and Vishny (1996). Turnover is the total value of shares traded in the stock exchange divided by market capitalization. Stock market data are from IFC’s Emerging Market Data Base. Bank/GDP is the total assets of the deposit money banks divided by GDP. It is obtained from IMF, International Financial Statistics. Market1 is a variable that takes on the value 1 for market-based financial systems and 0 for bank-based systems as defined in Demirguc-Kunt and Levine (1999). All values are 1989-96 averages.
GDP/CAP (US $)
Law and Order Indicator
Common Law Dummy
Creditor Rights Index
Shareholder Rights Index
Turnover Bank/GDP Market1
Switzerland 26972 6.00 0 1 2 0.74 1.74 0 Japan 23467 5.44 0 2 4 0.43 1.31 0 Norway 22162 6.00 0 2 4 0.52 0.71 0 Denmark 21447 6.00 0 3 2 0.42 0.51 0 United States 19998 6.00 1 1 5 0.71 0.75 1 Sweden 19582 6.00 0 2 3 0.42 0.55 1 Finland 18521 6.00 0 1 3 0.32 0.79 0 Germany 17804 5.75 0 3 1 1.25 1.19 0 France 17588 5.50 0 0 3 0.47 1.01 0 Austria 17433 6.00 0 3 2 0.61 1.25 0 Netherlands 16744 6.00 0 2 2 0.55 1.10 1 Canada 16243 6.00 1 1 5 0.44 0.62 1 Belgium 16104 6.00 0 2 0 0.15 1.07 0 Italy 14783 5.00 0 2 1 0.39 0.72 0 Australia 13873 6.00 1 1 4 0.41 0.73 1 United Kingdom 13067 5.31 1 4 5 0.50 1.13 1 Ireland 12034 5.00 1 1 4 0.62 0.36 0 Singapore 11707 5.19 1 4 4 0.47 0.93 1 New Zealand 11332 6.00 1 3 4 0.25 0.76 0 Israel 9787 3.31 1 4 3 0.65 0.95 0 Hong Kong 9565 4.69 1 4 5 0.50 1.49 1 Spain 9506 5.00 0 2 4 0.57 0.95 0 Greece 5257 4.25 0 1 2 0.30 0.42 0 Korea 4785 3.69 0 3 2 1.21 0.53 1 Portugal 4620 5.19 0 1 3 0.33 0.76 0 Argentina 3623 3.56 0 1 4 0.36 0.21 0 Malaysia 2708 3.69 1 4 4 0.44 0.79 1 South Africa 2287 2.69 1 3 5 0.08 0.63 0 Chile 2243 4.19 0 2 5 0.10 0.46 1 Brazil 2034 3.75 0 1 3 0.55 0.32 1 Mexico 1824 3.00 0 0 1 0.41 0.22 1 Turkey 1626 3.19 0 2 2 0.86 0.19 1 Thailand 1517 4.31 1 3 2 0.77 0.77 1 Colombia 1321 1.19 0 0 3 0.09 0.17 0 Peru 775 1.69 0 0 3 0.30 0.11 1 Philippines 619 2.13 0 0 3 0.26 0.34 1 Indonesia 610 3.00 0 4 2 0.40 0.45 0 India 405 2.50 1 4 5 0.40 0.34 0 Pakistan 319 1.88 1 4 5 0.29 0.36 0

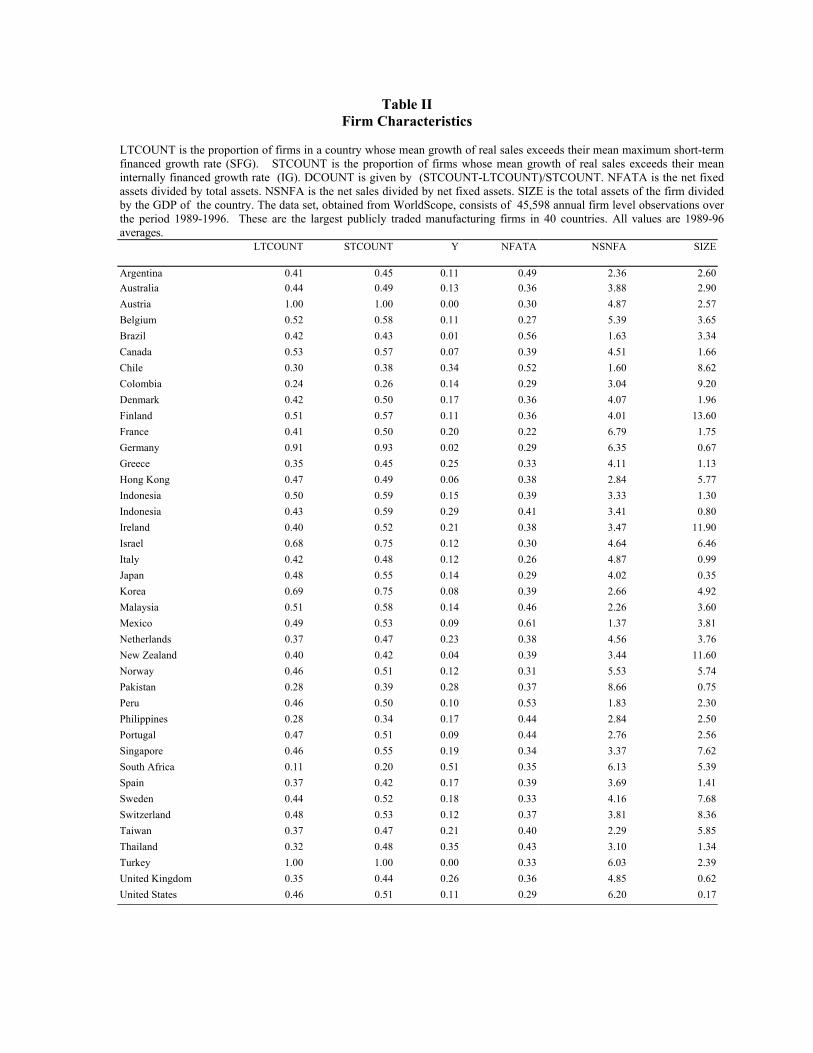
Table II Firm Characteristics
LTCOUNT is the proportion of firms in a country whose mean growth of real sales exceeds their mean maximum short-term financed growth rate (SFG). STCOUNT is the proportion of firms whose mean growth of real sales exceeds their mean internally financed growth rate (IG). DCOUNT is given by (STCOUNT-LTCOUNT)/STCOUNT. NFATA is the net fixed assets divided by total assets. NSNFA is the net sales divided by net fixed assets. SIZE is the total assets of the firm divided by the GDP of the country. The data set, obtained from WorldScope, consists of 45,598 annual firm level observations over the period 1989-1996. These are the largest publicly traded manufacturing firms in 40 countries. All values are 1989-96 averages. LTCOUNT STCOUNT Y NFATA NSNFA SIZE
Argentina 0.41 0.45 0.11 0.49 2.36 2.60Australia 0.44 0.49 0.13 0.36 3.88 2.90Austria 1.00 1.00 0.00 0.30 4.87 2.57Belgium 0.52 0.58 0.11 0.27 5.39 3.65Brazil 0.42 0.43 0.01 0.56 1.63 3.34Canada 0.53 0.57 0.07 0.39 4.51 1.66Chile 0.30 0.38 0.34 0.52 1.60 8.62Colombia 0.24 0.26 0.14 0.29 3.04 9.20Denmark 0.42 0.50 0.17 0.36 4.07 1.96Finland 0.51 0.57 0.11 0.36 4.01 13.60France 0.41 0.50 0.20 0.22 6.79 1.75Germany 0.91 0.93 0.02 0.29 6.35 0.67Greece 0.35 0.45 0.25 0.33 4.11 1.13Hong Kong 0.47 0.49 0.06 0.38 2.84 5.77Indonesia 0.50 0.59 0.15 0.39 3.33 1.30Indonesia 0.43 0.59 0.29 0.41 3.41 0.80Ireland 0.40 0.52 0.21 0.38 3.47 11.90Israel 0.68 0.75 0.12 0.30 4.64 6.46Italy 0.42 0.48 0.12 0.26 4.87 0.99Japan 0.48 0.55 0.14 0.29 4.02 0.35Korea 0.69 0.75 0.08 0.39 2.66 4.92Malaysia 0.51 0.58 0.14 0.46 2.26 3.60Mexico 0.49 0.53 0.09 0.61 1.37 3.81Netherlands 0.37 0.47 0.23 0.38 4.56 3.76New Zealand 0.40 0.42 0.04 0.39 3.44 11.60Norway 0.46 0.51 0.12 0.31 5.53 5.74Pakistan 0.28 0.39 0.28 0.37 8.66 0.75Peru 0.46 0.50 0.10 0.53 1.83 2.30Philippines 0.28 0.34 0.17 0.44 2.84 2.50Portugal 0.47 0.51 0.09 0.44 2.76 2.56Singapore 0.46 0.55 0.19 0.34 3.37 7.62South Africa 0.11 0.20 0.51 0.35 6.13 5.39Spain 0.37 0.42 0.17 0.39 3.69 1.41Sweden 0.44 0.52 0.18 0.33 4.16 7.68Switzerland 0.48 0.53 0.12 0.37 3.81 8.36Taiwan 0.37 0.47 0.21 0.40 2.29 5.85Thailand 0.32 0.48 0.35 0.43 3.10 1.34Turkey 1.00 1.00 0.00 0.33 6.03 2.39United Kingdom 0.35 0.44 0.26 0.36 4.85 0.62United States 0.46 0.51 0.11 0.29 6.20 0.17
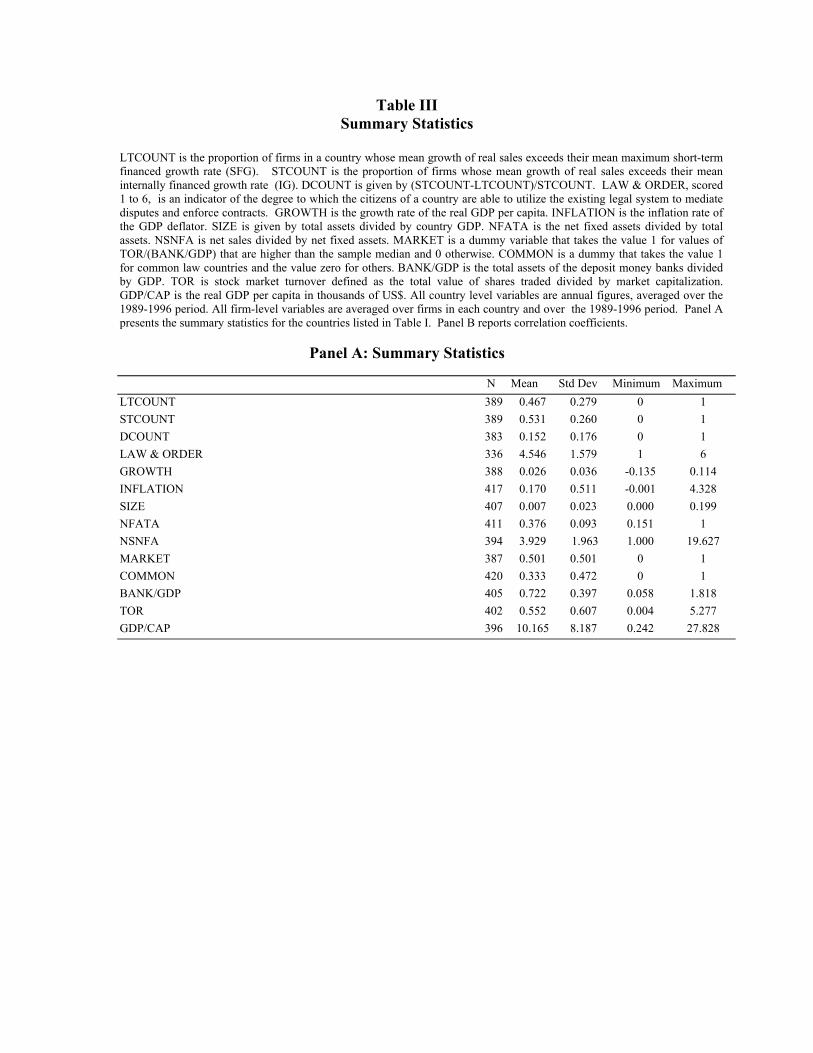
Table III Summary Statistics
LTCOUNT is the proportion of firms in a country whose mean growth of real sales exceeds their mean maximum short-term financed growth rate (SFG). STCOUNT is the proportion of firms whose mean growth of real sales exceeds their mean internally financed growth rate (IG). DCOUNT is given by (STCOUNT-LTCOUNT)/STCOUNT. LAW & ORDER, scored 1 to 6, is an indicator of the degree to which the citizens of a country are able to utilize the existing legal system to mediate disputes and enforce contracts. GROWTH is the growth rate of the real GDP per capita. INFLATION is the inflation rate of the GDP deflator. SIZE is given by total assets divided by country GDP. NFATA is the net fixed assets divided by total assets. NSNFA is net sales divided by net fixed assets. MARKET is a dummy variable that takes the value 1 for values of TOR/(BANK/GDP) that are higher than the sample median and 0 otherwise. COMMON is a dummy that takes the value 1 for common law countries and the value zero for others. BANK/GDP is the total assets of the deposit money banks divided by GDP. TOR is stock market turnover defined as the total value of shares traded divided by market capitalization. GDP/CAP is the real GDP per capita in thousands of US$. All country level variables are annual figures, averaged over the 1989-1996 period. All firm-level variables are averaged over firms in each country and over the 1989-1996 period. Panel A presents the summary statistics for the countries listed in Table I. Panel B reports correlation coefficients.
Panel A: Summary Statistics
N Mean Std Dev Minimum Maximum
LTCOUNT 389 0.467 0.279 0 1 STCOUNT 389 0.531 0.260 0 1 DCOUNT 383 0.152 0.176 0 1 LAW & ORDER 336 4.546 1.579 1 6 GROWTH 388 0.026 0.036 -0.135 0.114 INFLATION 417 0.170 0.511 -0.001 4.328 SIZE 407 0.007 0.023 0.000 0.199 NFATA 411 0.376 0.093 0.151 1 NSNFA 394 3.929 1.963 1.000 19.627 MARKET 387 0.501 0.501 0 1 COMMON 420 0.333 0.472 0 1 BANK/GDP 405 0.722 0.397 0.058 1.818 TOR 402 0.552 0.607 0.004 5.277 GDP/CAP 396 10.165 8.187 0.242 27.828
Panel B: Correlation Matrix
LTCOUNT STCOUNT DCOUNT LAW GROWTH INFL. SIZE NFATA NSNFA MARKET COMMON BANK/ GDP
TOR
STCOUNT .964*** DCOUNT -.570*** -0.380***
LAW .178*** 0.161*** -.243***
GROWTH .145*** .194*** .006 .058
INFLATION .051 .008 -.140** -.313*** -.155*** SIZE .101** .073 -.123** .150*** .059 -.041
NFATA -.126** -.151*** -.028 -.335*** -.002 .423*** -.005 NSNFA .053 .089* .145*** .083 -.130*** -.222*** -.165*** -.672*** MARKET .069 .092* -.018 -.223*** .147*** .140*** -.156*** .177*** -.114** COMMON -.145*** -.106* .171*** -.035 .003 -.154*** -.087* -.009 -.162*** -.085* BANK/GDP .078 .075 -.045 .552*** -.024 -.321*** -.090* -.354*** .143*** -.258*** -.019 TOR .077 .113** .005 .109* .119** -.048 -.131*** -.013 -.029 .460*** -.108** .307***
GDP/CAP .157*** .143*** -.161*** .774*** -.093* -.279*** .192*** -.501*** .299*** -.188*** -.099** .609*** .052
*, ** and *** indicate significance levels of 10, 5 and 1 percent respectively.
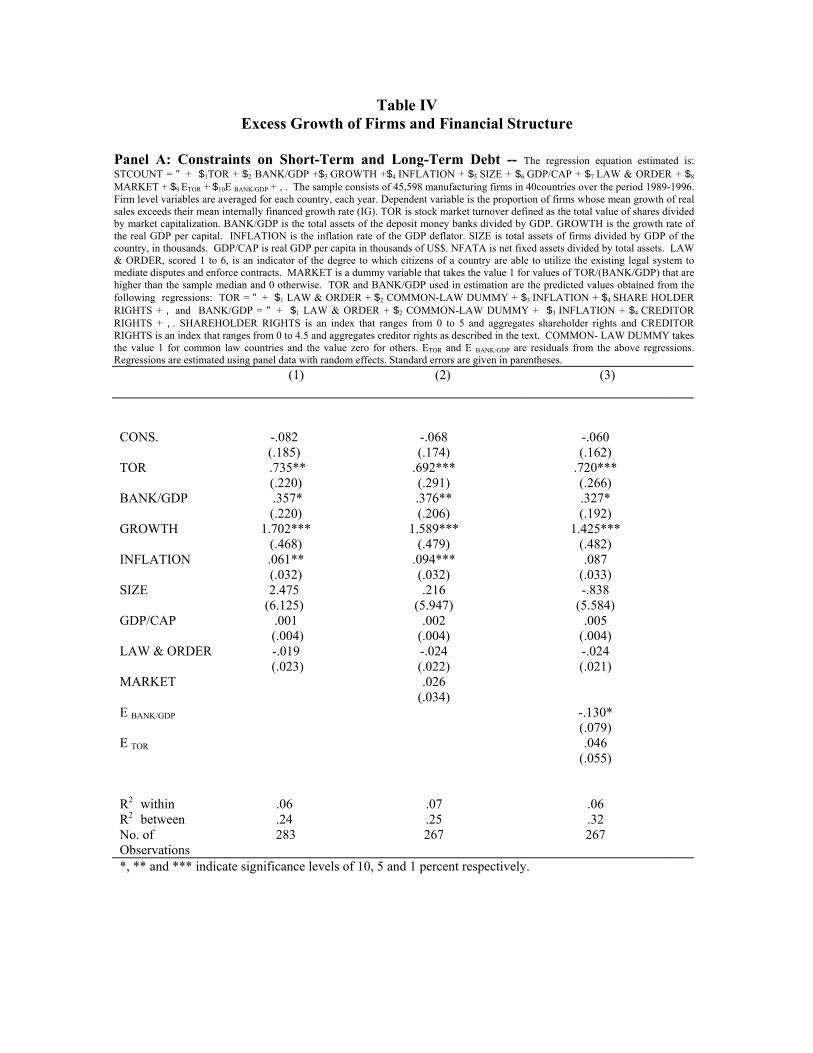
Table IV Excess Growth of Firms and Financial Structure
Panel A: Constraints on Short-Term and Long-Term Debt -- The regression equation estimated is: STCOUNT = " + $1TOR + $2 BANK/GDP +$3 GROWTH +$4 INFLATION + $5 SIZE + $6 GDP/CAP + $7 LAW & ORDER + $8
MARKET + $9 ETOR + $10E BANK/GDP + ,. The sample consists of 45,598 manufacturing firms in 40countries over the period 1989-1996. Firm level variables are averaged for each country, each year. Dependent variable is the proportion of firms whose mean growth of real sales exceeds their mean internally financed growth rate (IG). TOR is stock market turnover defined as the total value of shares divided by market capitalization. BANK/GDP is the total assets of the deposit money banks divided by GDP. GROWTH is the growth rate of the real GDP per capital. INFLATION is the inflation rate of the GDP deflator. SIZE is total assets of firms divided by GDP of the country, in thousands. GDP/CAP is real GDP per capita in thousands of US$. NFATA is net fixed assets divided by total assets. LAW & ORDER, scored 1 to 6, is an indicator of the degree to which citizens of a country are able to utilize the existing legal system to mediate disputes and enforce contracts. MARKET is a dummy variable that takes the value 1 for values of TOR/(BANK/GDP) that are higher than the sample median and 0 otherwise. TOR and BANK/GDP used in estimation are the predicted values obtained from the following regressions: TOR = " + $1 LAW & ORDER + $2 COMMON-LAW DUMMY + $3 INFLATION + $4 SHARE HOLDER RIGHTS + , and BANK/GDP = " + $1 LAW & ORDER + $2 COMMON-LAW DUMMY + $3 INFLATION + $4 CREDITOR RIGHTS + ,. SHAREHOLDER RIGHTS is an index that ranges from 0 to 5 and aggregates shareholder rights and CREDITOR RIGHTS is an index that ranges from 0 to 4.5 and aggregates creditor rights as described in the text. COMMON- LAW DUMMY takes the value 1 for common law countries and the value zero for others. ETOR and E BANK/GDP are residuals from the above regressions. Regressions are estimated using panel data with random effects. Standard errors are given in parentheses. (1) (2) (3)
CONS.
-.082 (.185)
-.068 (.174)
-.060 (.162)
TOR .735** (.220)
.692*** (.291)
.720*** (.266)
BANK/GDP .357* (.220)
.376** (.206)
.327* (.192)
GROWTH 1.702*** (.468)
1.589*** (.479)
1.425*** (.482)
INFLATION .061** (.032)
.094*** (.032)
.087 (.033)
SIZE
2.475 (6.125)
.216 (5.947)
-.838 (5.584)
GDP/CAP .001 (.004)
.002 (.004)
.005 (.004)
LAW & ORDER -.019 (.023)
-.024 (.022)
-.024 (.021)
MARKET .026 (.034)
E BANK/GDP -.130* (.079)
E TOR .046 (.055)
R2 within .06 .07 .06 R2 between .24 .25 .32 No. of Observations
283 267 267
*, ** and *** indicate significance levels of 10, 5 and 1 percent respectively.

Panel B: Constraints on Long-Term Debt -- The regression equation estimated is: LTCOUNT = " + $1TOR + $2 BANK/GDP +$3 GROWTH +$4 INFLATION + $5 SIZE + $6 GDP/CAP + $7 LAW & ORDER + $8 MARKET + $9 ETOR + $10E BANK/GDP + ,. The sample consists of 45,598 manufacturing firms in 40 countries over the period 1989-1996. Firm level variables are averaged for each country, each year. Dependent variable is the proportion of firms in a country whose mean growth of real sales exceeds their mean maximum short-term financed growth rate (SFG). TOR is stock market turnover defined as the total value of shares divided by market capitalization. BANK/GDP is the total assets of the deposit money banks divided by GDP. GROWTH is the growth rate of the real GDP per capital. INFLATION is the inflation rate of the GDP deflator. SIZE is total assets of firms divided by GDP of the country, in thousands. GDP/CAP is real GDP per capita in thousands of US$. NFATA is net fixed assets divided by total assets. LAW & ORDER, scored 1 to 6, is an indicator of the degree to which citizens of a country are able to utilize the existing legal system to mediate disputes and enforce contracts. MARKET is a dummy variable that takes the value 1 for values of TOR/(BANK/GDP) that are higher than the sample median and 0 otherwise. TOR and BANK/GDP used in estimation are the predicted values obtained from the following regressions: TOR = " + $1 LAW & ORDER + $2 COMMON-LAW DUMMY + $3 INFLATION + $4 SHARE HOLDER RIGHTS + , and BANK/GDP = " + $1 LAW & ORDER + $2 COMMON-LAW DUMMY + $3 INFLATION + $4
CREDITOR RIGHTS + ,. SHAREHOLDER RIGHTS is an index that ranges from 0 to 5 and aggregates shareholder rights and CREDITOR RIGHTS is an index that ranges from 0 to 4.5 and aggregates creditor rights as described in the text. COMMON- LAW DUMMY takes the value 1 for common law countries and the value zero for others. ETOR and E BANK/GDP are residuals from the above regressions. Regressions are estimated using panel data with random effects. Standard errors are given in parentheses. (1) (2) (3)
CONS.
-.176 (.208)
-.133 (.200)
-.144 (.184)
TOR .843*** (.360)
.819*** (.338)
.830*** (.307)
BANK/GDP .261 (.249)
.230 (.237)
.202 (.220)
GROWTH 1.738*** (.496)
1.704*** (.510)
1.517*** (.514)
INFLATION .089*** (.034)
.124*** (.036)
.118*** (.035)
SIZE
3.904 (6.789)
1.864 (6.728)
.866 (6.305)
GDP/CAP .001 (.005)
.002 (.005)
.006 (.005)
LAW & ORDER -.014 (.024)
-.018 (.024)
-.019 (.023)
MARKET
.011 (.037)
E BANK/GDP
-.137* (.089)
E TOR
.024 (.060)
R2 within .07 .08 .08 R2 between .19 .18 .25 No. of Observations
283 267 267
*, ** and *** indicate significance levels of 10, 5 and 1 percent respectively.
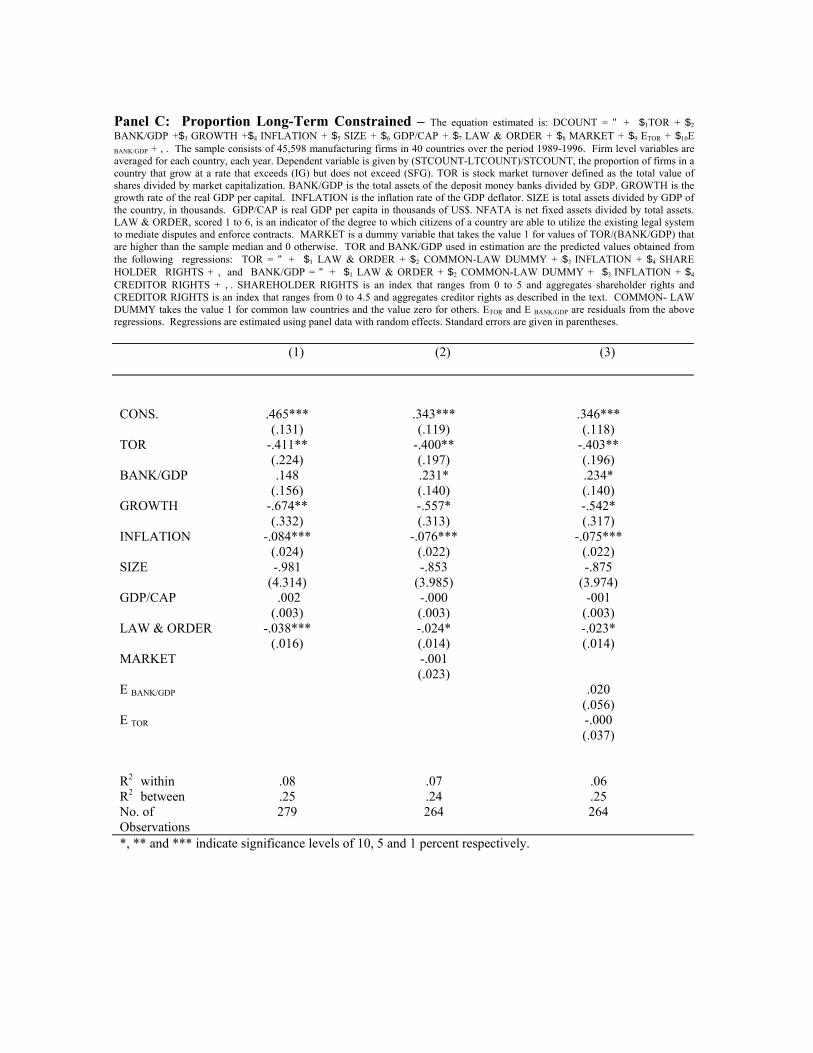
Panel C: Proportion Long-Term Constrained – The equation estimated is: DCOUNT = " + $1TOR + $2 BANK/GDP +$3 GROWTH +$4 INFLATION + $5 SIZE + $6 GDP/CAP + $7 LAW & ORDER + $8 MARKET + $9 ETOR + $10E BANK/GDP + ,. The sample consists of 45,598 manufacturing firms in 40 countries over the period 1989-1996. Firm level variables are averaged for each country, each year. Dependent variable is given by (STCOUNT-LTCOUNT)/STCOUNT, the proportion of firms in a country that grow at a rate that exceeds (IG) but does not exceed (SFG). TOR is stock market turnover defined as the total value of shares divided by market capitalization. BANK/GDP is the total assets of the deposit money banks divided by GDP. GROWTH is the growth rate of the real GDP per capital. INFLATION is the inflation rate of the GDP deflator. SIZE is total assets divided by GDP of the country, in thousands. GDP/CAP is real GDP per capita in thousands of US$. NFATA is net fixed assets divided by total assets. LAW & ORDER, scored 1 to 6, is an indicator of the degree to which citizens of a country are able to utilize the existing legal system to mediate disputes and enforce contracts. MARKET is a dummy variable that takes the value 1 for values of TOR/(BANK/GDP) that are higher than the sample median and 0 otherwise. TOR and BANK/GDP used in estimation are the predicted values obtained from the following regressions: TOR = " + $1 LAW & ORDER + $2 COMMON-LAW DUMMY + $3 INFLATION + $4 SHARE HOLDER RIGHTS + , and BANK/GDP = " + $1 LAW & ORDER + $2 COMMON-LAW DUMMY + $3 INFLATION + $4
CREDITOR RIGHTS + ,. SHAREHOLDER RIGHTS is an index that ranges from 0 to 5 and aggregates shareholder rights and CREDITOR RIGHTS is an index that ranges from 0 to 4.5 and aggregates creditor rights as described in the text. COMMON- LAW DUMMY takes the value 1 for common law countries and the value zero for others. ETOR and E BANK/GDP are residuals from the above regressions. Regressions are estimated using panel data with random effects. Standard errors are given in parentheses. (1) (2) (3)
CONS.
.465*** (.131)
.343*** (.119)
.346*** (.118)
TOR -.411** (.224)
-.400** (.197)
-.403** (.196)
BANK/GDP .148 (.156)
.231* (.140)
.234* (.140)
GROWTH -.674** (.332)
-.557* (.313)
-.542* (.317)
INFLATION -.084*** (.024)
-.076*** (.022)
-.075*** (.022)
SIZE
-.981 (4.314)
-.853 (3.985)
-.875 (3.974)
GDP/CAP .002 (.003)
-.000 (.003)
-001 (.003)
LAW & ORDER -.038*** (.016)
-.024* (.014)
-.023* (.014)
MARKET
-.001 (.023)
E BANK/GDP
.020 (.056)
E TOR
-.000 (.037)
R2 within .08 .07 .06 R2 between .25 .24 .25 No. of Observations
279 264 264
*, ** and *** indicate significance levels of 10, 5 and 1 percent respectively.
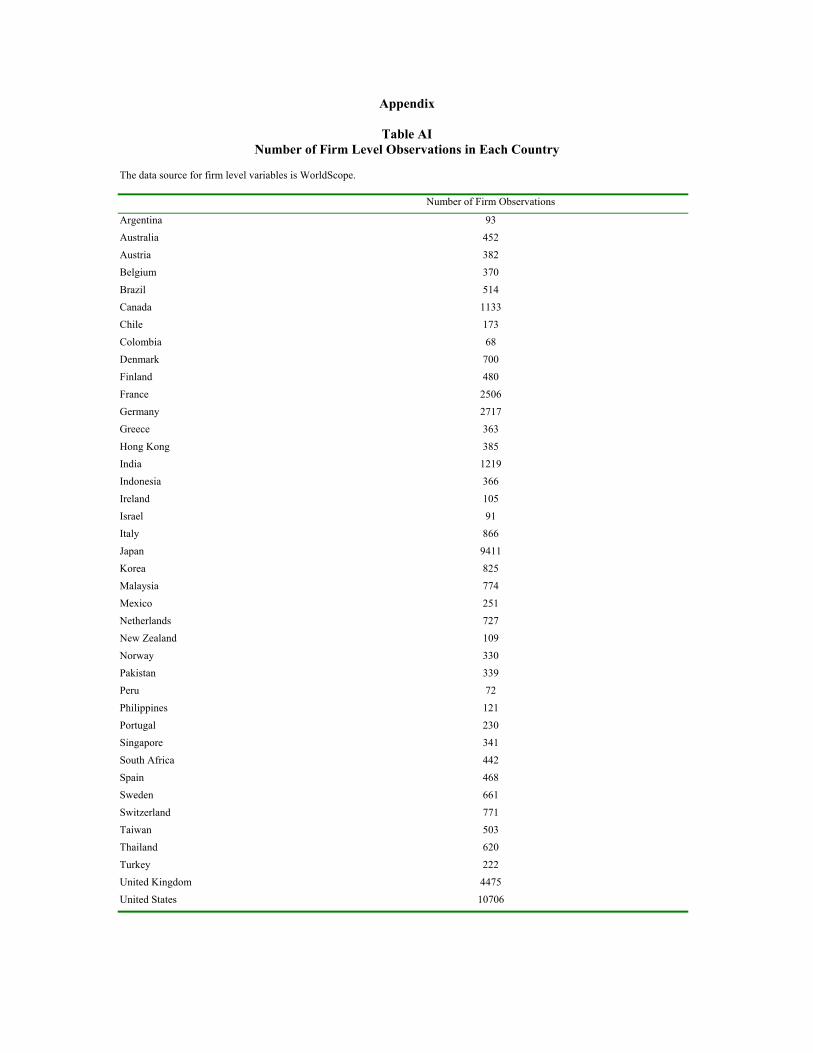
Appendix
Table AI Number of Firm Level Observations in Each Country
The data source for firm level variables is WorldScope. Number of Firm Observations
Argentina 93 Australia 452 Austria 382 Belgium 370
Brazil 514 Canada 1133 Chile 173
Colombia 68 Denmark 700 Finland 480
France 2506 Germany 2717 Greece 363
Hong Kong 385 India 1219 Indonesia 366
Ireland 105 Israel 91 Italy 866
Japan 9411 Korea 825 Malaysia 774
Mexico 251 Netherlands 727 New Zealand 109
Norway 330 Pakistan 339 Peru 72
Philippines 121 Portugal 230 Singapore 341
South Africa 442 Spain 468 Sweden 661
Switzerland 771 Taiwan 503 Thailand 620
Turkey 222 United Kingdom 4475 United States 10706