IS THE WORLD BECOMING SMALLER? …siteresources.worldbank.org/INTRANETTRADE/Resource… · ·...
56
1 IS THE WORLD BECOMING SMALLER? GLOBALIZATION AND CONVERGENCE ACROSS COUNTRIES Heather Berry George Washington University Mauro F. Guillén University of Pennsylvania Arun Hendi University of Pennsylvania* May 2011 Version * Authors listed alphabetically. Corresponding author: [email protected].
Transcript of IS THE WORLD BECOMING SMALLER? …siteresources.worldbank.org/INTRANETTRADE/Resource… · ·...

1
IS THE WORLD BECOMING SMALLER?
GLOBALIZATION AND CONVERGENCE ACROSS COUNTRIES
Heather Berry
George Washington University
Mauro F. Guillén
University of Pennsylvania
Arun Hendi
University of Pennsylvania*
May 2011 Version
* Authors listed alphabetically. Corresponding author: [email protected].

2
IS THE WORLD BECOMING SMALLER?
GLOBALIZATION AND CONVERGENCE ACROSS COUNTRIES
Abstract
We seek to establish whether distances between pairs of countries have decreased or not over the
last half century. We consider various dimensions of distance, including demographic, economic,
financial, knowledge, political, global connectedness, and cultural. Using a new methodology
that enables the calculation of the minimum volume ellipsoid encompassing all countries during
the 1960-2009 period, we find no evidence that the world has become smaller. We also
investigate if distances between countries within specific subcomponents of the global system
have become smaller. Taking into account core-semiperiphery-periphery clusters or trade blocs
does not produce evidence of shrinkage within each subcomponent either. Finally, we predict
that subcomponents are becoming more distant from one another. We find that core-
semiperiphery-periphery subcomponents and trade blocs are becoming more distant from one
another.

3
―Certainly,‖ returned Ralph. ―I agree with Mr. Fogg. The world has
grown smaller, since a man can now go round it ten times more
quickly than a hundred years ago.‖
—Gauthier Ralph and Phileas Fogg in Jules Verne’s Around the
World in Eighty Days (1873:19).
Introduction
One of the most common ways of defining globalization involves the metaphor of a
shrinking world. The globalizing processes caused by sweeping economic, financial, political
and technological forces have led a number of social scientists to conceptualize globalization in
terms of its effects on the actual and perceived magnitude of changes in space (for reviews, see
Guillén 2001a; Hargittai and Centeno 2001; Sklair 1991). Thus, sociologist Anthony Giddens
(1990:64, 1991:21) proposed to regard globalization as a decoupling or ―distanciation‖ between
space and time, and Roland Robertson (1992:8) argued that globalization ―refers both to the
compression of the world and the intensification of consciousness of the world as a whole.‖
Other social scientists have also dwelled upon the shrinking metaphor. For instance, geographer
David Harvey (1989) and political scientist James Mittelman (1996) observed that globalization
entails a ―compression‖ of space and time, social anthropologist Thomas Eriksen (2007:16)
proposed that ―a minimal definition of globalization could delimit it simply as all the
contemporary processes that make distance irrelevant,‖ and management scholar C. Gopinath
(2008:30) argued that ―digital technology has seemingly shrunk the world… Distances are not
significant anymore.‖
In this paper we examine the extent to which there is institutional convergence in the
world using a spatial approach in terms of distance between pairs of nation-states. Social
scientists have emphasized that, in spite of popular images, globalization is far from being a

4
uniform, irreversible, and inexorable trend. Rather, they propose that it is a fragmented,
incomplete, discontinuous, contingent, and in many ways contradictory and puzzling process
(Gilpin 2000:294; Guidry et al. 1999; Held et al. 1999:431), thus casting doubt on the argument
that the world is shrinking or converging. Giddens (1990:64, 175) noted that globalization ―is a
process of uneven development that fragments as it coordinates. […] The outcome is not
necessarily, or even usually, a generalized set of changes acting in a uniform direction, but
consists in mutually opposed tendencies.‖ In another book, Giddens (1991:21–22) asserted that
―globalization has to be understood as a dialectical phenomenon, in which events at one pole of a
distanciated relation often produce divergent or even contrary occurrences at another‖ (see also
Held et al 1999:431, 441). In a similar vein, anthropologist Jonathan Friedman (1994:210–211)
asserted that globalization is the product of cultural fragmentation as much as it is the result of
modernist homogeneity. Other scholars also saw globalization as a process that preserves local
variations. Thus, Zelizer (1999) argued that ―the economy […] differentiates and proliferates
culturally in much the same way as other spheres of social life do, without losing national and
even international connectedness,‖ while Robertson (1995:34–35) saw globalization as the
―linking of localities.‖
Social scientists have also empirically examined different aspects of convergence and the
shrinking of the world as a result of globalization. Empirical research focused on the impact of
globalization on various economic outcomes, including variations in the patterns of organization
of national capitalist economies (Boyer 1996; Soskice 1998, Streeck 1991; Garrett 1998),
convergence in income and output levels (Barro 1997; Bond et al. 2001), the resilience of
national systems of innovation, trade, and investment (Doremus et al. 1998; Storper and Salais
1997), and the interaction among business firms and states (Orrù et al. 1997; Stopford and
5
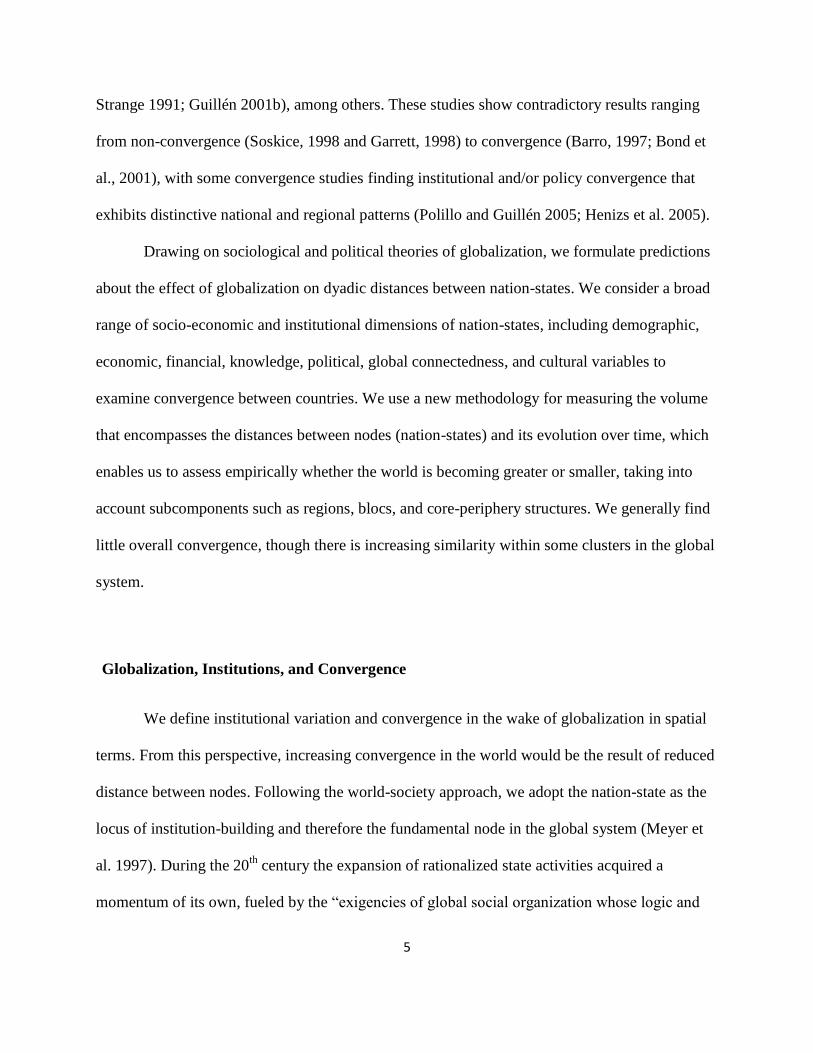
Strange 1991; Guillén 2001b), among others. These studies show contradictory results ranging
from non-convergence (Soskice, 1998 and Garrett, 1998) to convergence (Barro, 1997; Bond et
al., 2001), with some convergence studies finding institutional and/or policy convergence that
exhibits distinctive national and regional patterns (Polillo and Guillén 2005; Henizs et al. 2005).
Drawing on sociological and political theories of globalization, we formulate predictions
about the effect of globalization on dyadic distances between nation-states. We consider a broad
range of socio-economic and institutional dimensions of nation-states, including demographic,
economic, financial, knowledge, political, global connectedness, and cultural variables to
examine convergence between countries. We use a new methodology for measuring the volume
that encompasses the distances between nodes (nation-states) and its evolution over time, which
enables us to assess empirically whether the world is becoming greater or smaller, taking into
account subcomponents such as regions, blocs, and core-periphery structures. We generally find
little overall convergence, though there is increasing similarity within some clusters in the global
system.
Globalization, Institutions, and Convergence
We define institutional variation and convergence in the wake of globalization in spatial
terms. From this perspective, increasing convergence in the world would be the result of reduced
distance between nodes. Following the world-society approach, we adopt the nation-state as the
locus of institution-building and therefore the fundamental node in the global system (Meyer et
al. 1997). During the 20th
century the expansion of rationalized state activities acquired a
momentum of its own, fueled by the ―exigencies of global social organization whose logic and

6
purposes are built into almost all states.‖ From this perspective, nation-states are seen as
exhibiting convergent structural similarity, although there is a ―decoupling between purposes and
structure, intentions and results.‖ World-society researchers argued that conformity came both
from the world-culture of rationalized modernity and from domestic groups that made claims on
the state following the consensus over the formal acceptance of ―matters such as citizen and
human rights, the natural world and its scientific investigation, socioeconomic development, and
education‖ (Meyer et al. 1997:145, 148, 152–154, 161).
The contemporary intellectual origins of the convergence thesis are to be found in
modernization theory. Rostow (1960) proposed that nation-states evolve from ―undeveloped‖ to
―developed‖ via five stages as long as the right value incentives are in place: traditional society,
preconditions for take-off, take-off, maturity, and high mass-consumption. Each stage was seen
as a prerequisite for the next because new political, economic, and social institutions were
supposed to make possible ever more economically advanced and differentiated activities over
time (see also Kerr et al. 1960). Political scientists (e.g. Apter 1965) refined the argument when
asserting that the primary engine of change was a piecemeal shift from traditional to modern
values, i.e., a transformation of authority structures, a perspective also embraced by many
sociologists (see the review by Smelser 1976:144-163). Modernization theorists thought of
economic, political and social development as contributing to a ―shrinking‖ of the world, a
convergence of economies and societies, a trend towards homogeneity, or at least towards a
restricted set of alternatives (Kerr et al. 1960; see also Albrow 1997:49; Robertson 1992:91;
Waters 1995:13-19). World trade, migration and flows of capital should all work to take
resources and consumption goods from where they are cheap to where they are dear. As they
travel with increasing speed and volume (given falling transportation and communication costs),
7
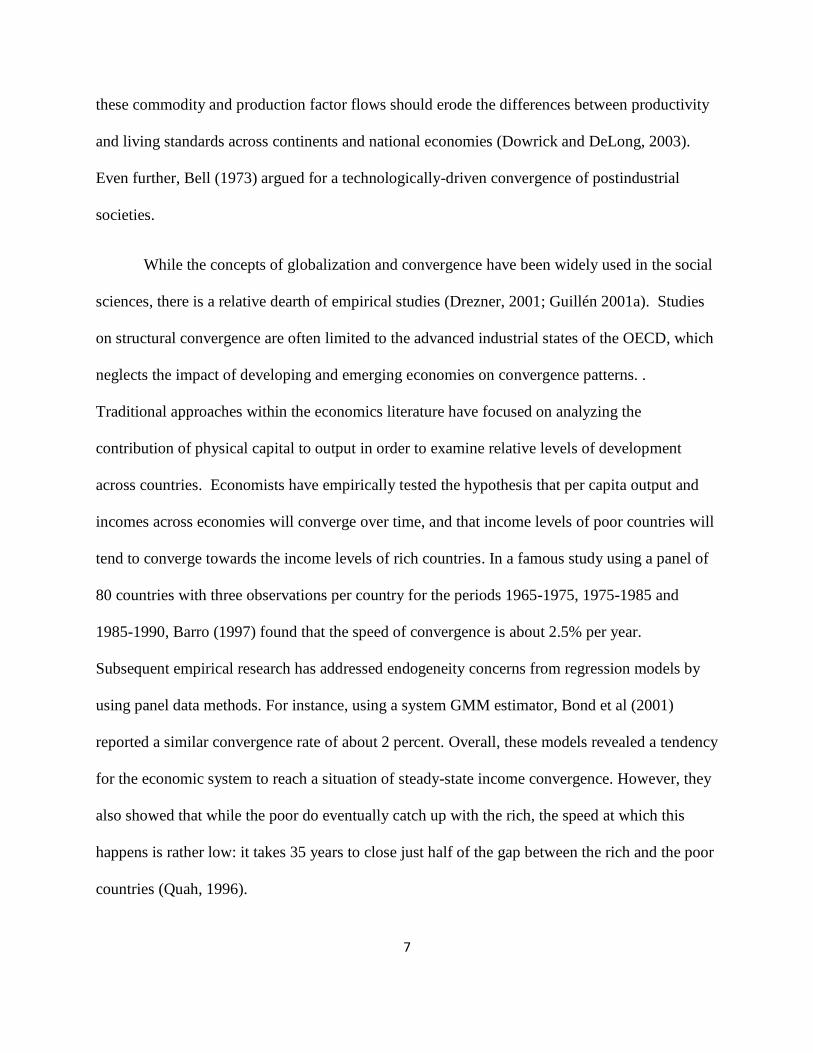
these commodity and production factor flows should erode the differences between productivity
and living standards across continents and national economies (Dowrick and DeLong, 2003).
Even further, Bell (1973) argued for a technologically-driven convergence of postindustrial
societies.
While the concepts of globalization and convergence have been widely used in the social
sciences, there is a relative dearth of empirical studies (Drezner, 2001; Guillén 2001a). Studies
on structural convergence are often limited to the advanced industrial states of the OECD, which
neglects the impact of developing and emerging economies on convergence patterns. .
Traditional approaches within the economics literature have focused on analyzing the
contribution of physical capital to output in order to examine relative levels of development
across countries. Economists have empirically tested the hypothesis that per capita output and
incomes across economies will converge over time, and that income levels of poor countries will
tend to converge towards the income levels of rich countries. In a famous study using a panel of
80 countries with three observations per country for the periods 1965-1975, 1975-1985 and
1985-1990, Barro (1997) found that the speed of convergence is about 2.5% per year.
Subsequent empirical research has addressed endogeneity concerns from regression models by
using panel data methods. For instance, using a system GMM estimator, Bond et al (2001)
reported a similar convergence rate of about 2 percent. Overall, these models revealed a tendency
for the economic system to reach a situation of steady-state income convergence. However, they
also showed that while the poor do eventually catch up with the rich, the speed at which this
happens is rather low: it takes 35 years to close just half of the gap between the rich and the poor
countries (Quah, 1996).

8
In this paper we broaden the concept of cross-national convergence beyond income
disparities to include a full set of institutional characteristics. The convergence thesis argues that
since the end of World War II globalizing processes have eroded national boundaries, making
state structures, policymaking, political institutions, the economy, social and cultural practices,
and norms and traditions more similar across countries (for reviews of the theoretical and
empirical literature, see Guillén 2001a; Held et al. 1999; Campbell 2004; Evans 1997; Berger
and Dore eds. 1996; Inglehart and Baker 2000; Strange 1996). In spatial terms, increasing
similarities imply shorter distances between countries, and therefore a ―smaller‖ world. Thus, we
formulate the general prediction that globalization has reduced the size of the world as it
generates convergence:
Hypothesis 1: Distance between nation-states is decreasing over time, thus
reducing the size of the world.
Convergence within Global Subcomponents
Very much in response to modernization and convergence theories, social scientists have
challenged the premise that postwar socioeconomic change was homogeneous in its effects.
During the 1950s and 1960s dependency scholars noted that developing countries were
dependent on more advanced ones, often former colonizers, for capital, technology and access to
markets, with important implications not only for the economy but also for the political system.
Dependency theorists observed that the terms of trade between advanced (core) countries and
developing (peripheral) countries tended to evolve against the latter, who would become more

9
impoverished as they engaged in international trade (Prebisch 1950; Frank 1967; Furtado 1970;
Bruton 1998). Thus, the tendency of capitalist development was to create exploitative
relationships between developed and underdeveloped countries, i.e. a duality of effects as a result
of global economic forces, which affected different subcomponents of the global system in
different ways. They also predicted that development efforts resulted in the gradual
displacement of the small-scale local bourgeoisie not connected to foreign and state capital, with
the ―triple alliance‖ of state-owned enterprises, subsidiaries of foreign multinationals, and local
business groups gaining in importance (Evans 1979; Frank 1967; Cardoso and Faletto 1973).
Economic theories of growth that incorporate technological differences across regions
also predict divergence in income levels and growth rates across regions (Grossman and
Helpman, 1991). Even if trade across countries may facilitate convergence, growth rates and
productivity gaps within industries across countries might persist when factor endowments are
different because of the mismatch between labor skills available in more developing countries
versus more sophisticated technologies imported from more developed countries, for example.
This suggests that fundamental differences in initial conditions across countries can impact both
the diffusion of technology across countries and resulting convergence.
Building on the dependency perspective, Wallerstein (1974) proposed another influential
theory of development that emphasized systemic patterns of dependence in the global political
economy and the emergence of subcomponents in the global system. He saw underdevelopment
as the result of a country’s integration into the modern ―world-system‖ created by the capitalist
development of Western Europe since the sixteenth century. In this view, global capitalist forces
have not only generated oppression and duality between the ―core,‖ on the one hand, and the
undeveloped ―periphery‖ and developing ―semi-periphery,‖ on the other, but also a momentum

10
of their own as the capitalist world-system inexorably experiences a series of recurrent crises that
result from its inherent contradictions (see also Ragin and Chirot 1984:292-294). Unlike
dependency theorists, however, states (and not social classes) are central to world-system
analysis because they manage the social problems generated by the expansion of world
capitalism and thus contribute to the stabilization of the world-system (Waters 1995:22-26).
Recent empirical research has found that the world-system is indeed formed of core, semi-
peripheral, and peripheral subcomponents in terms of the role that countries play in global
economic, financial, political, diplomatic, and military affairs (Van Rossem 1996; Smith and
White 1992; Chase-Dunn et al. 2000). Building on this insight, world-society scholars were
among the first to point out that ―the world as a whole shows increasing structural similarities of
form among societies without, however, showing increasing equalities of outcomes among
societies‖ (Meyer & Hannan 1979:3, 13–15). This cross-national institutional diversity has been
the dominant theme in much recent theorizing about nation-states and their effects on the society,
the economy, and the culture (Campbell 2004; Orrù, Biggart, and Hamilton 1997; Dobbin 1994;
Guillén 2006).
A third theory emphasizing the emergence of subcomponents in the global system has to
do with trade blocs. The first modern trade bloc was the German Zollverein of 1834, which
created a customs union among the various German-speaking principalities. Beginning in the
1980s, the world witnessed the emergence of continental-size trade blocs such as the European
Union (EU), the North American Free Trade Agreement (NAFTA), and the Mercosur, among
others. A simple functional analysis highlights that trade blocs tend to be formed by countries
geographically adjacent or close, with similar trade policies or regimes, and sharing a desire to
organize regionally. While they are an attempt to enhance trade, in practice they destroy, divert,

11
and create trade in complex ways (De Melo and Panagariya 1992; Mansfield and Milner 1999).
Nevertheless, based on a variety of empirical models, a consensus has emerged in the political
economy literature that regional trade agreements are trade-creating for member states (Thursby
and Thursby 1987; Frankel and Rose 2000; Rose 2000), but could lead to trade diversion or
destruction relative to non-members For example, Bayoumi and Eichengreen (1997) found that
the formation of the European Economic Community reduced the annual growth of trade
between members and industrialized non-members by 1.7 percentage points, while Leonardi
(1995) analyzed per capita income convergence relative to the period 1970-1995 and found
convergence at both the regional and national level for European countries. Soloaga and Winters
(2001) showed that the European Union (EU), the European Free Trade Association (EFTA) and
the North American Free Trade Agreement (NAFTA) led to a decline in levels of trade with third
countries. Moreover, the formation of a trade bloc requires political commitments and extensive
institution building and policy coordination among member countries (Gilpin 1987; Mansfield
and Milner 1999; Fligstein and Sweet 2002).
In addition to generating convergence among member countries, trade blocs tend to
diverge from one another. Perhaps the most important reason for divergence across trade blocs
is that they tend to have very different characteristics. For example, some entail a coordination of
overall trade policy (e.g. a customs union such as the EU) while others are limited to the removal
of internal barriers (the NAFTA), and some blocs entail deeper agreements over matters such as
labor mobility, taxes, regulation, antitrust policies, and even monetary matters. There are other
reasons why trade agreements generate convergence within the bloc but divergence across blocs.
Trade blocs have often resulted in pressures to initiate political reforms (as in Southern and
Eastern Europe prior to accessing the EU), enhanced power in global trade negotiations, and an

12
extension of influence over weaker nation-states, especially in the developing world (Mansfield
and Milner 1999).
Dependency, world-system, and political-economic trade-bloc theories emphasize the
emergence of a multi-layered world as a result of economic and sociopolitical development, one
in which countries within each subcomponent—developed and developing, core and periphery,
or trade blocs—become more similar to one another while each component becomes more
distinct than the others. In other words, convergence is expected within components while
divergence obtains across components. Thus, we predict that
Hypothesis 2: Distances within each subcomponent of the global system of
nation--states decrease over time, thus reducing the size of each subcomponent.
Hypothesis 3: Distance across subcomponents of the global system of nation
states is increasing over time, thus expanding the size of the world.
Data
We approach cross-national institutional variation and convergence taking into account
the dimensions that the world-society approach (Meyer et al. 1997) associates with social change
on a global scale, including demographic, economic, financial, knowledge, political, global
connectedness, and cultural dimensions (Berry, Guillén and Zhou, 2010). These dimensions can
be operationalized following Whitley’s (1992) sociological analysis of national business
systems, Henisz and Williamson’s (1999) and La Porta et al.’s (1998) economic frameworks of
13
national governance institutions, Nelson and Rosenberg’s (1993) concept of national innovation
institutions, and Inglehart and Baker’s (2000) theory of cross-national cultural change. National
business systems are ―particular arrangements of hierarchy-market relations becoming
institutionalized and relatively successful in particular contexts‖ (Whitley 1992:10). Countries
differ to varying degrees in terms of the characteristics of their business systems, specifically
their economic, financial, and administrative practices. Whitley (1992:231) argued that such
differences originate in demographic, geographic, cultural, and political institutions, which make
some countries more different, or distant, than others from a given focal country.
National governance systems refer to the ―set of incentives, safeguards, and dispute-
resolution processes used to order the activities of various corporate stakeholders‖ such as
owners (i.e. shareholders), managers, workers, creditors, suppliers and customers (Kester,
1996:109). They originate in administrative, legal and political institutions that historically make
certain stakeholders more powerful in certain countries than others (Glendon et al. 1994; Henisz
& Williamson 1999; Henisz 2000; La Porta et al. 1998). While this theoretical tradition
emphasizes a smaller set of institutional dimensions than the theory of business systems, the
underlying logic is also one of institutional variation that produces longer distances between
countries.
National innovation systems refer to configurations of institutions that foster the
development of technology and innovation (Nelson and Rosenberg 1993). A central tenet
documented by this literature is that countries differ in their ability to produce knowledge and in
the extent to which they can leverage that knowledge by being connected to other countries
(Porter 1990; Furman et al. 2002). Finally, we also took into consideration the model of cultural
14
change proposed by Inglehart and Baker (2000), in which cross-national cultural values are
considered to be the result of the intersection of forces tending towards modernization (including
economic and political influences) and those tending to preserve traditions.
As described in Table 1, we included several variables for each of our seven measures of
cross-national institutional variation. We consulted several sources to create the seven measures
of cross-national institutional variation. For the economic, financial, demographic and global
connectedness measures, our data came from the World Bank’s World Development Indicators
database. For the political measure, we used data from Henisz’ POLCONV database, Freedom
House, and the World Trade Organization. The knowledge measures came from the U.S. Patent
and Trademark Office and the Institute for Scientific Information. Finally, the cultural measures
are all based on the World Values Surveys. Each data source, year availability, and country
coverage are summarized in Table 2.1
Methods
We measured patterns in global convergence through a multidimensional modeling
approach. We relied on a panel of data where we observe characteristics of nation-states across
many years. For a given distance dimension (e.g. political, economic, cultural), we observed a set
of variables2 each year for each country being considered in the analysis. We can thus think of
countries as points lying in a -dimensional characteristic space, where the points move over
time. Convergence can be conceptualized as the process of these points moving closer together—
1 Data used in our analysis are available from http://www.lauder.wharton.upenn.edu/ciber/research/faculty.asp
2 is in general different for each distance dimension

15
that is, countries becoming less distant over time. Figure 1 depicts a three-dimensional example
at one point in time.
We use changes in global volume to measure the process of country points compressing
or expanding over time. To quantify the extent of the compacting of distance across nation-
states, we analyze the minimum-volume ellipsoid (MVE) measure. For each year, we first
calculate the -dimensional ellipsoid of minimum volume that contains all of the country points.
The volume of this ellipsoid is the MVE measure. Let be the set of -dimensional
country points in year (as in Figure 1a). Formally, the minimum volume ellipsoid in year is
the -dimensional ellipsoid { ( ̂) ̂
( ̂) }, where ̂ is a matrix
and ̂ is a vector that jointly solve
( ( ))
( )
( ) ( )
We compute a different ( ̂ ̂) pair for each year and then calculate the associated ellipsoid
volume for each year. Because we have data for several distance dimensions, we calculate a
separate volume for each distance dimension in each year. We use the cluster package
(Maechler, Rousseeuw, Struyf, and Hubert 2005) in the R statistical software (R Development
Core Team 2010) to compute the minimum volume ellipsoid of a set of points.
As an example of our approach, consider Figure 1a, which depicts one year of our
political distance data for all country points in a 3-dimensional political space. The
minimum volume ellipsoid enclosing the country points is shown in Figure 1b. This is, by
definition, the smallest ellipsoid that contains all the points, and it thus is a good estimate of the

16
political ―size‖ of the world in 1972. If we repeat the process for 1973 and later years and find
progressively smaller volumes, we consider this to be evidence of convergence along the
political dimension. In our first hypothesis, we consider the global system as a whole. For our
second and third hypotheses, we consider subcomponents of nation-states and compare our
minimum volume ellipsoid measures both within and across these subcomponent groupings.
Figure 2 provides an example of how these subcomponent patterns might look when examining
the patterns suggested by the second and third hypotheses. Frame (a) in figure 3 shows country-
level data for a particular year. When attempting to measure global volumes, we would enclose
the points in the minimum volume ellipsoid shown in frame (b). If we suspect distinct group
patterns, we would define the subcomponents and enclose each set of subcomponent points in its
own minimum volume ellipsoid as in frame (c). Frame (d) in Figure 3 shows the group ellipsoids
along with the world ellipsoid. If subcomponents have their own distinct patterns over time, then
it is easy to imagine a scenario where within-subcomponent convergence coexists with
worldwide divergence.
There are a few useful features of the MVE measure. One of the most appealing
properties of the MVE measure is that it is invariant to affine transformations of .3 This
implies that the MVE measure is not affected by time-invariant issues of scale or correlation in
the data. This is particularly useful for our purposes since the variables are in general measured
in different units and are correlated with each other. Second, the ellipsoid volumes are indices, so
that multiplying any time series of volumes by a fixed constant does not affect our inference. A
3 If we were to premultiply each ⋃ by the same fixed nonzero matrix and add a -vector to each
product, the resultant volumes would not be affected except perhaps by a constant multiple. Since the
MVE measure is an index, the constant multiple is irrelevant and would not affect our inference.

17
third appealing feature of this method is that the assumption of an ellipsoidal pattern closely
approximates the shape of the actual data. Finally, the MVE method has a nice intuitive
interpretation that lends itself to our hypotheses and for consideration of how small the world has
become over time.
This methodology is different from the approach used in the economics literature on
convergence. For example, Barro (1997) estimated a regression of economic growth rates on
national incomes to examine whether national incomes will converge to the same steady-state
level. Our definition of convergence is broader—we analyze convergence across multiple
distance dimensions each containing multiple variables, and thus use a measure of joint
convergence.
For comparison and robustness, we calculate volume indices using two other methods: a
mean-based and a median-based measure of the size of the world. The mean-based volume
algorithm finds the mean Mahalanobis distance between each country point and the centroid of
the set of points. It then calculates the volume of a -sphere with radius equal to the
aforementioned mean. The median-based calculation proceeds similarly, but replaces the mean
of distances to the centroid with the median. While the mean-based calculation is relatively
simple and provides a good description of the process being modeled, it is susceptible to the
problem of extreme observations. The median-based measure, though more robust to outlying
observations, only describes the volume occupied by half of the countries. Both the mean- and
median-based measures assume spherical volumes, and thus will not approximate the shape of
as closely as the MVE volume. However, these two measures act as robustness checks for the
MVE volume and also highlight different aspects of the data.

18
Results
The first hypothesis predicted smaller distances over time and hence a smaller world.
Figure 3 shows the volume ellipsoid calculations for each of the seven distance dimensions over
time. There are different time periods reflected in each of these graphs due to data availability
across dimensions. In general, the graphs in Figure 3 show that world volumes increased over
time for the economic, cultural, demographic, financial, and global connectedness dimensions.
The knowledge and political volumes appear to exhibit more cycles over time than the other
variables, but also reveal increasing trends. These graphs suggest that global volume is not
monotonically decreasing as a function of time for any of the seven dimensions of distance.
To formally test hypothesis 1, we implement a variant of Kendall’s tau test. Kendall’s tau
is a nonparametric statistic that measures the rank correlation between two sets of data. By
estimating the rank correlation between the volumes and the years in which they were measured,
we can obtain a quantity that summarizes the extent to which the volumes exhibit time trends.
We specify a tau test where the null hypothesis is zero correlation (no trend) and the alternative
hypothesis is negative correlation (decreasing trend). These tests, reported in Table 5, fail to
reject the null hypothesis at the 5% significance level for any of the seven distance dimensions.
Thus, we do not find evidence in favor of the first hypothesis.4
We implemented several robustness checks. We found that the MVE volume measure is
positively correlated with both the mean-based and median-based volume measures. Since the
median-based volume measure is less sensitive to outliers, the positive correlation implies that
4 A regression of volumes on time show similar patterns of rejection. Kendall’s tau, however, is less restrictive due
to its ordinal nature.
19
inference based on the MVE measure is not heavily influenced by outlying countries.
Furthermore, the MVE volume measure is robust to issues of scale and time-invariant correlation
in the country-level data. To evaluate the claim that distances between countries may have
become smaller in recent years as opposed to during the entire 1960-2009 period, we calculated
the tau trend test for the 1985-2009 period. With the exception of the knowledge distance
dimension, we do not find evidence of smaller distances and volumes at the 5% significance
level (results available upon request).
In the second hypotheses, we argued that smaller distances and volumes may be expected
within subcomponents of the global system of nation-states. We considered two different
groupings of nation-states to examine subcomponents of the global system, including: core-
semiperiphery-periphery groups, and trade blocs. We start by discussing the core-periphery
grouping results.
We used the core, semi-periphery and periphery country groupings from Van Rossem
(1996) that are reported in Table 3 to calculate the minimum ellipsoid volumes for the core-
periphery subcomponents of the global system. These volumes are plotted in figures 4a, 4b and
4c. Visually, there are appear to be no trends of smaller distances or volumes. Table 6 shows the
results of the Kendall’s tau trend tests, which shows little to no evidence of convergence within
the core, semiperiphery, and periphery subcomponents.5
We also calculated all volume measures and tests for three free trade areas (the
Association of Southest Asian Nations, ASEAN, the Central European Free Trade Agreement,
5 For all subcomponents, we calculate the tau trend tests restricting the years to 1985-2009. The rejection patterns,
reported in tables 9 through 12, are very similar to the full set of volumes (1960-2009), indicating a lack of evidence
for recent convergence.
20
CEFTA, and the South Asian Association for Regional Cooperation, SAARC). We report the
results in Figures 5a, 5b and 5c, respectively. We took into account when a country became part
of the trade bloc (see Table 4). In general, the graphs in Figures 5a, 5b and 5c reveal a similar
lack of convergence. We report the Kendall’s tau estimates in Table 6. Only two of them were
significant: demographic in the core and knowledge in the semiperiphery, indicating that there is
a decline in volume over time.
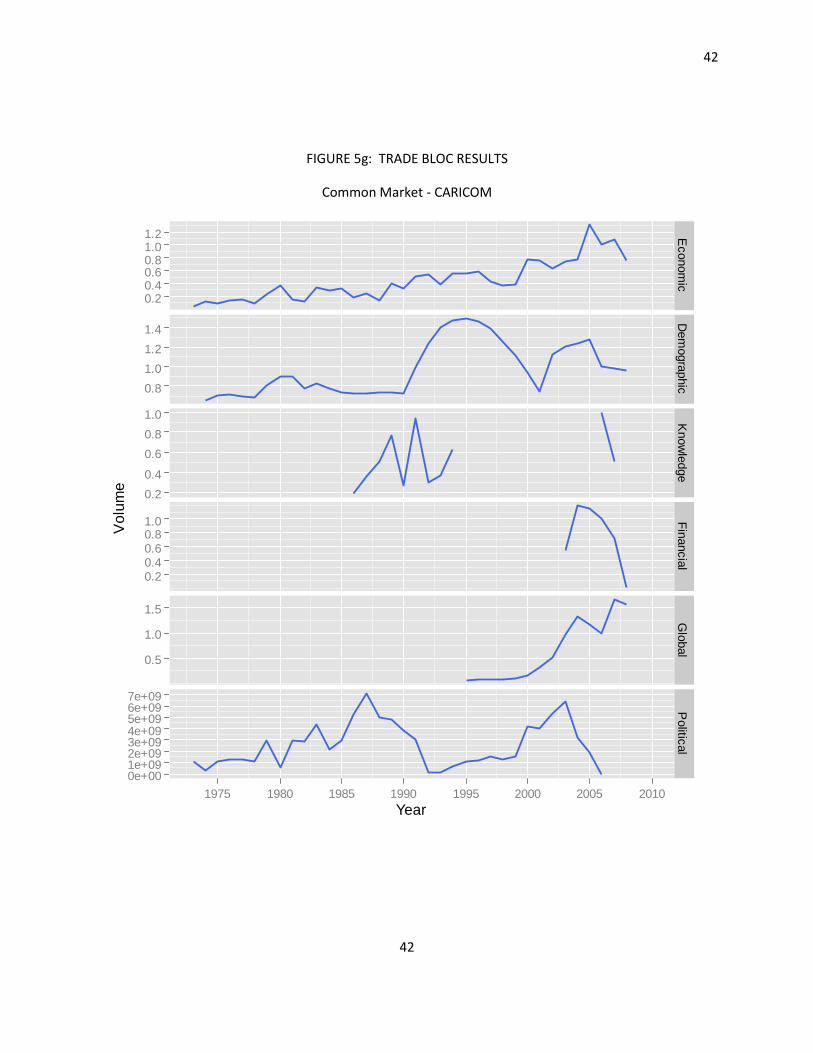
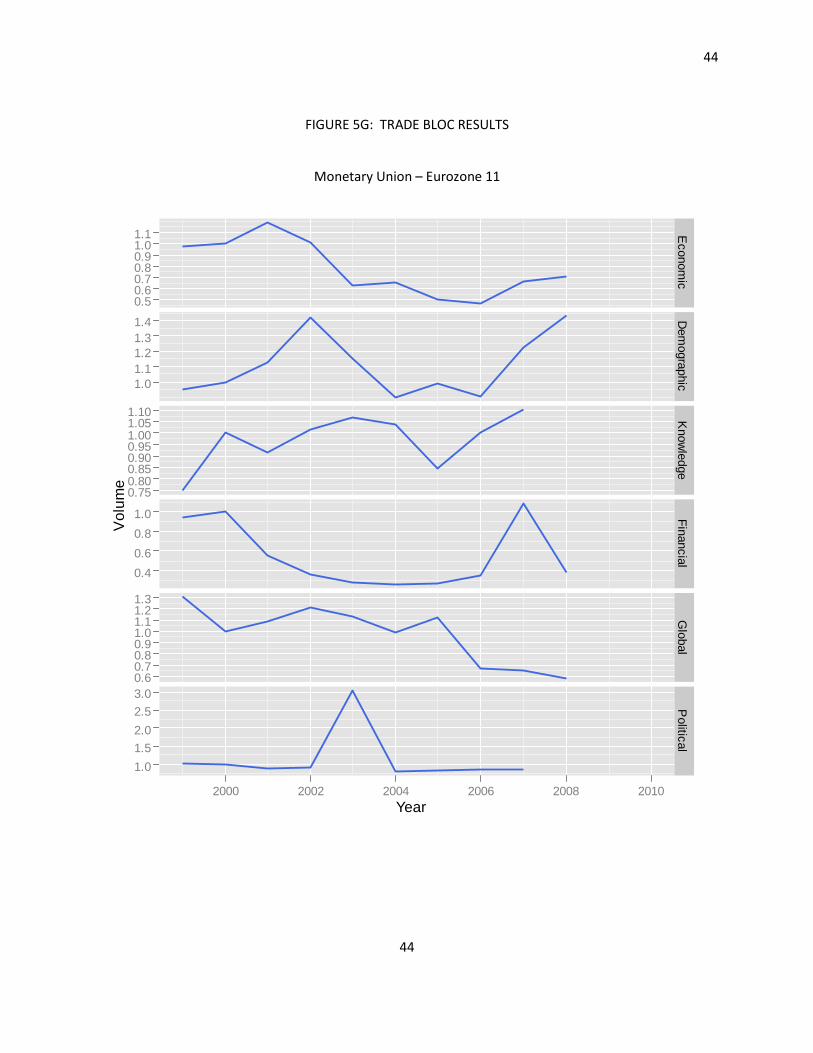
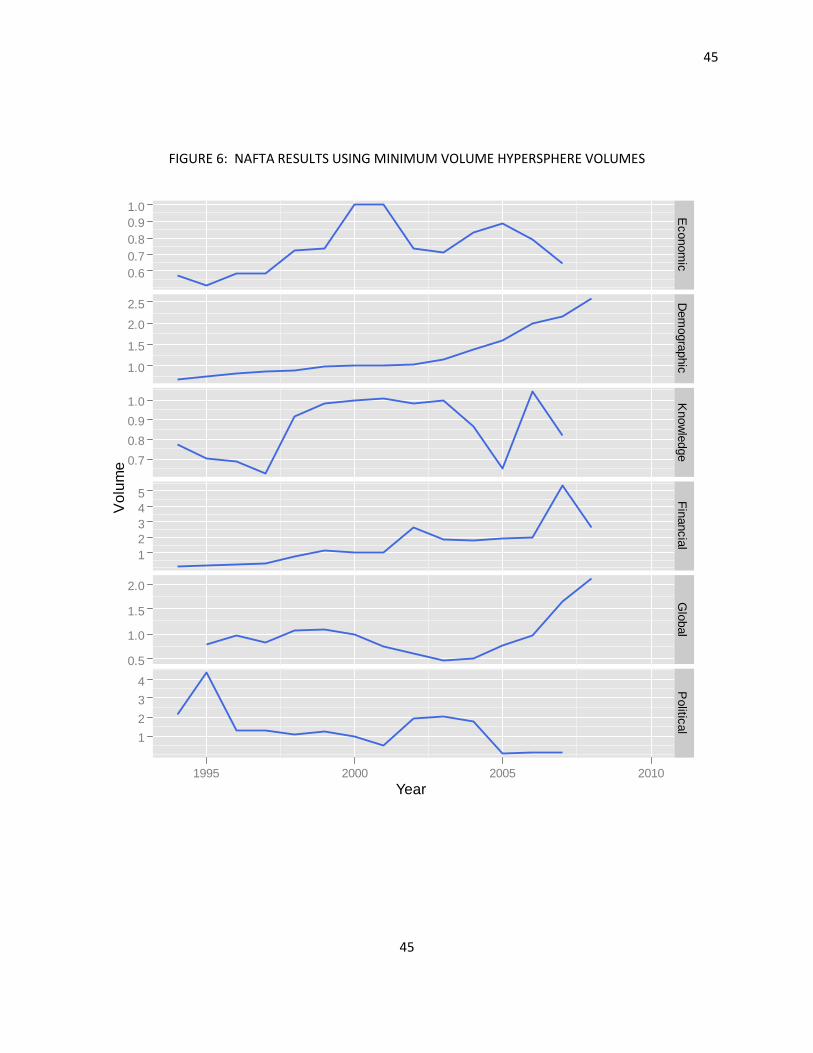
Next we examined the patterns within trade blocs (Figure 5). We show results for
ASEAN, CEFTA, SAARC, Andean Pact, Mercosur, SACU, Caricom, EU27, the Eurozone-11,
and NAFTA. As reported in Table 7, only Mercosur, SACU, Mercosur and NAFTA show some
evidence of decreasing volumes over time, but only along one or at most two dimensions
(NAFTA). In sum, we find little support for Hypothesis 2 that distances and volumes within
subcomponents of the global system are dropping over time.
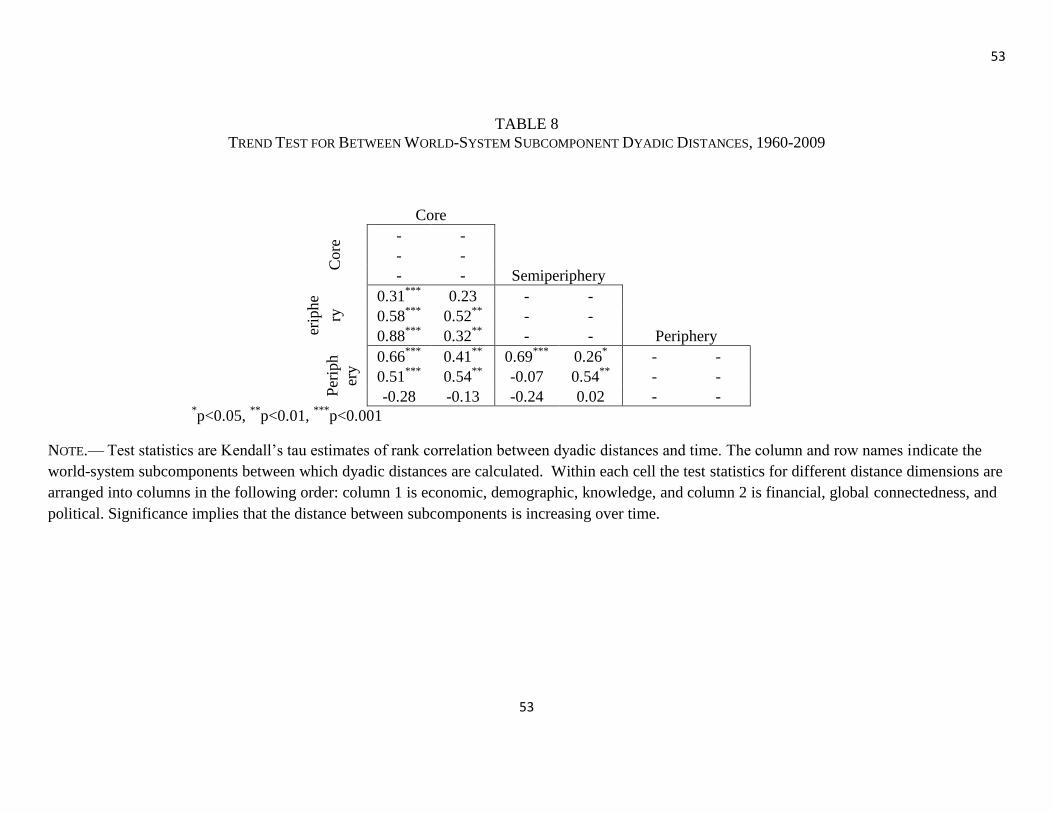
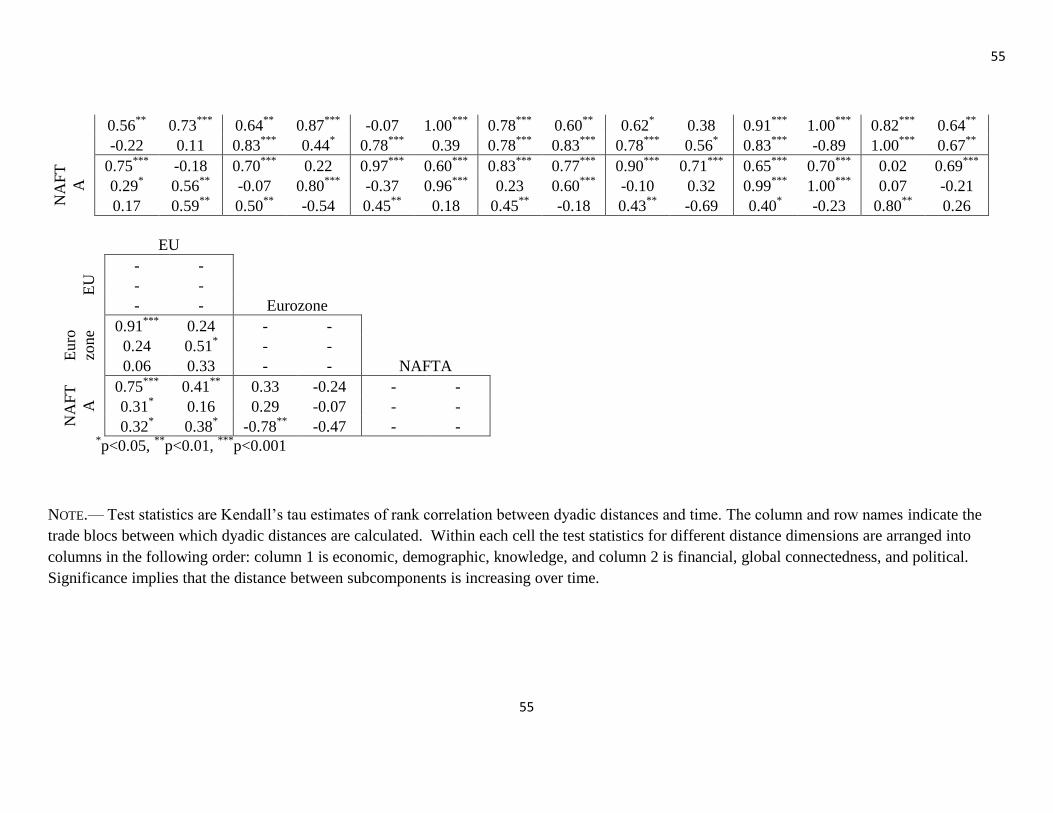
To examine Hypothesis 3 on distances and volumes between subcomponents, we also
calculated Kendall’s tau tests (see Tables 8 and 9). We find that core-semiperiphery-periphery
subcomponents and trade blocs are becoming more distant from one another, indicating that
globalizing processes have exerted different effects within and between subcomponents.
Discussion and Conclusion
***This section needs to be written after all empirical results are verified.

21

22
References
Albrow, Martin. 1997. The Global Age. Stanford, CA: Stanford University Press.
Apter, David. 1965. The Politics of Modernization. Chicago, Ill.: The University of Chicago
Press.
Barro. R., 1997. Determinants of Economic Growth. Cambridge, MIT Press.
Bayoumi, T. and B. Eichengreen, 1997. Is regionalism simply a Diversion? Evidence from the
Evolution of the EC and EFTA. In Ito, R and A. Krueger, eds., Regionalism Versus
Multilateral Trade Arrangements, pp 141-67. Chicago, University of Chicago Press.
Beckfield, Jason. 2010. ―The Social Structure of the World Polity.‖ American Journal of Sociology
115(4) (January):1018-1068.
Bell, Daniel. [1973] 1976. The Coming of Post-Industrial Society. New York: Basic Books.
Berger, Suzanne, and Ronald P. Dore. 1996. National Diversity and Global Capitalism. Ithaca, NY:
Cornell University Press.
Berry, Heather, Mauro F. Guillén, and Nan Zhou. 2010. ―An Institutional Approach to
Measuring Cross-National Distance.‖ Journal of International Business Studies 41:1460-
1480.
Bond, R., A. Hoeffler and J. Temple. 2001. GMM Estimation of Empirical Growth Models. CEPR
Discussion Paper No 3048. November.
Boyer, R. 1996. ―The Convergence Hypothesis Revisited: Globalization but Still the Century of
Nations?‖ Pp. 29-59 in National Diversity and Global Capitalism, ed. S Berger and R Dore.
Ithaca, NY: Cornell University Press.
Bruton, Henry J. 1998. ―A Reconsideration of Import Substitution.‖ Journal of Economic
Literature 36 (June):903-936.

23
Campbell, John L. 2004. Institutional Change and Globalization. Princeton, NJ: Princeton
University Press.
Cardoso, Fernando Henrique, and Enzo Faletto. [1973] 1979. Dependency and Development in
Latin America. Berkeley, Calif.: University of California Press.
Chase-Dunn, Christopher, Yukio Kawano and Benjamin Brewer. 2000. ―Trade Globalization
since 1795: Waves of Integration in the World-System.‖ American Sociological Review
65(February):77-95.
De Melo, Jaime, and Arvind Panagariya. 1992. "The new regionalism," Finance & Development
29(4) (December):37-40.
Dobbin, Frank. 1994. Forging Industrial Policy: The United States, Britain, and France in the Railway
Age. New York, New York: Cambridge University Press.
Dore, Ronald. [1973] 1990. British Factory, Japanese Factory: The Origins of National Diversity in
Industrial Relations. Berkeley, Calif.: University of California Press.
Doremus, Paul N., William W. Keller, Louis W. Pauly, and Simon Reich. 1998. The Myth of the
Global Corporation. Princeton, NJ: Princeton University Press.
Drezner, D., 2001. Globalization and Policy Convergence.
Eriksen, Thomas Hylland. 2007. Globalization. New York Berg.
Evans, Peter 1979. Dependent Development. Princeton, New Jersey: Princeton University Press.
____. 1997. The Eclipse of the State? Reflections on Stateness in an Era of Globalization. World
Politics 50 (October):62-87.

24
Fligstein, Neil, and Alec Stone Sweet. 2002. "Constructing markets and politics: An
institutionalist account of European integration.‖ American Journal of Sociology 107:
1206-1243.
Frank, André G. 1967. Capitalism and Underdevelopment in Latin America. New York, New
York: Monthly Review Press.
Frankel, J., and A. Rose, 2000. Estimating the effect of currency unions on trade and output. NBER
working paper 5272. National Bureau of Economic
Friedman, Jonathan. 1994. Cultural Identity and Global Process. London: Sage.
Furman, J. L., Porter, M. E., and Stern, S. 2002. ―The determinants of national innovative
capacity.‖ Research Policy, 31(6): 899-933.
Furtado, Celso. 1970. Obstacles to Development in Latin America. Garden City, New York,
New York: Doubleday.
Garrett, Geoffrey. 1998. Partisan Politics in the Global Economy. New York: Cambridge University
Press.
Giddens, Anthony. 1990. The Consequences of Modernity. Stanford, CA: Stanford University Press.
____. 1991. Modernity and Self-Identity. Cambridge, MA: Polity Press.
Gilpin, Robert. 1987. The Political Economy of International Relations. Princeton, NJ: Princeton
University Press.
____. 2000. The Challenge of Global Capitalism: The World Economy in the 21st Century.
Princeton, NJ: Princeton University Press,
Glendon, M. A., Gordon, M. W., and Osakwe, C. 1994. Comparative Legal Traditions. St. Paul,
MN: West.
Gopinath, C. 2008. Globalization: A Multidimensional System. Thousand Oaks, CA: Sage.

25
Guidry, John A., Michael D. Kennedy, and Mayer N. Zald. 1999. Globalizations and Social
Movements. In Globalizations and Social Movements: Culture, Power, and the Transnational
Public Sphere.
Guillén, Mauro F. 2001a. ―Is Globalization Civilizing, Destructive or Feeble? A Critique of Six Key
Debates in the Social-Science Literature.‖ Annual Review of Sociology 27: 235-260.
____. 2001b. The Limits of Convergence: Globalization and Organizational Change in Argentina,
South Korea, and Spain. Princeton, NJ: Princeton University Press.
Hargittai, Eszter, and Miguel A. Centeno. 2001. ―Defining a Global Geography.‖ American
Behavioral Scientist 10(44):1545-1560.
Harvey, David. 1989. The Condition of Postmodernity. Oxford: Blackwell.
Held, David, Anthony McGrew, David Goldblatt, and Jonathan Perraton. 1999. Global
Transformations. London: Polity Press.
Henisz, W. J. 2000. ―The institutional environment for economic growth.‖ Economics and
Politics, 12: 1-31.
Henisz, Witold J., Bennet A. Zelner, and Mauro F. Guillén. 2005. ―Market-Oriented
Infrastructure Reforms, 1977-1999.‖ American Sociological Review 70(6)
(December):871-897.
Henisz, Witold. J., and Williamson, Oliver E. 1999. ―Comparative economic organization—
within and between countries.‖ Business and Politics 1(3): 261-277.
Inglehart, Ronald, and Wayne E. Baker. 2000. Modernization, Cultural Change, and the Persistence
of Traditional Values. American Sociological Review, 65:19-51.
Kerr, Clark, John T. Dunlop, Frederick Harbison, and Charles A. Myers. [1960] 1964.
Industrialism and Industrial Man. New York, New York: Oxford University Press.

26
Kester, W.C. 1996. ―American and Japanese corporate Governance.‖ Pp. 07-137 in S. Berger
and R. Dore eds., National Diversity and Global Capitalism. Ithaca: Cornell University
Press.
La Porta, R., Lopez-de-Silanes, F., Shleifer, A., & Vishny, R. W. 1998. ―Law and Finance.‖
Journal of Political Economy 106(6):113-1155.
Leonardi, R. 1995. Convergence, Cohesion and Integration in the European Union. Macmillan,
London.
Maechler, M., P. Rousseeuw, Struyf, A., and M. Hubert. 2005. Cluster Analysis Basics and
Extensions. Unpublished manuscript.
Mansfield, Edward D., and Helen V. Milner. 1999. ―The New Wave of Regionalism.‖
International Organization 53(3) (Summer):589-627.
Meyer, John W., and Michael T. Hannan. 1979. National Development in a Changing World System:
An Overview. Pp. 3-16 in National Development and the World System: Educational,
Economic, and Political Change, 1950-1970, ed. John W. Meyer and Michael T. Hannan.
Chicago: The University of Chicago Press.
Meyer, John W., John Boli, George M. Thomas and Francisco O. Ramirez. 1997. World Society and
the Nation-State. American Journal of Sociology 103(1) (July):144-181.
Mittelman, James H. 1996. The Dynamics of Globalization. Pp. 1-19 in Globalization: Critical
Reflections, ed. James H. Mittelman. Boulder: Lynne Rienner Publishers.
Mittelman, James H. ed. 1996. Globalization: Critical Reflections. Boulder: Lynne Rienner
Publishers.

27
Nelson, Richard. R., and Nathan Rosenberg. 1993. Technical Innovation and National Systems.
Pp. 3-21 in R. R. Nelson eds. National Innovation Systems. New York: Oxford University
Press.
Orrù, M., N. W. Biggart, and G. G. Hamilton. 1997. The Economic Organization of East Asian
Capitalism. Thousand Oaks, CA: Sage.
Polillo Simone and Mauro F. Guillén. 2005. ―Globalization Pressures and the State: The Global
Spread of Central Bank Independence.‖ American Journal of Sociology 110(6)
(May):1764-1802.
Porter, Michael E. 1990. The Competitive Advantage of Nations. New York: Free Press.
Prebisch, Raúl. 1950. The Economic Development of Latin America and Its Principal Problems.
New York, New York: United Nations.
Quah, D. 1996. Twin Peaks: Growth and Convergence in Models of Distribution Dynamics.
Center for Economic Performance Discussion Paper No. 280.
R Development Core Team. 2010. R: A Language and Environment for Statistical Computing.
Vienna: R Foundation for Statistical Computing http://www.R-project.org.
Ragin, Charles, and Daniel Chirot. 1984. ―The World System of Immanuel Wallerstein:
Sociology and Politics and History.‖ Pp. 276-312 in Vision and Method in Historical
Sociology, edited by Theda Skocpol. New York, New York: Cambridge University Press.
Robertson, Roland. 1995. ―Glocalization: Time-Space and Homogeneity-Heterogeneity.‖ Pp. 25-44
in Global Modernities, ed. Mike Featherstone, Scott Lash and Roland Robertson. London:
Sage.
____. 1992. Globalization: Social Theory and Global Culture. London: Sage Publications.

28
Rose, A., 2000. One money, one market? The effects of common currencies on international
trade. Economic Policy. 15: 7-46.
Rostow, Walt W. 1960. The Stages of Economic Growth: A Non-Communist
Manifesto. Cambridge: Cambridge University Press.
Sklair, Leslie. 1991. Sociology of the Global System. New York: Harvester Wheatsheaf.
Smelser, Neil J. 1976. Comparative Methods in the Social Sciences. Englewood Cliffs, New Jersey:
Prentice-Hall.
Smith, Anthony D. 1990. ―Towards a Global Culture?‖ Theory, Culture & Society 7:171-191.
Smith, Dave A. and Douglas R. White. 1992. ―Structure and Dynamics of the Global Economy:
Network Analysis of International Trade, 1965-1980.‖ Social Forces 70:857-893.
Sologa, I. and L. Winters 2001. Regionalism in the Nineties: What Effect on Trade? The North
American Journal of Economics and Finance 12: 1-29.
Soskice, David. 1998. ―Divergent Production Regimes: Coordinated and Uncoordinated Market
Economies in the 1980s and 1990s.‖ Pp. 101-134 in Continuity and Change in Contemporary
Capitalism, ed. Herbert Kitschelt, Peter Lange, Gary Marks, and John D. Stephens. New York:
Cambridge University Press.
Stopford, John M. and Susan Strage. 1991. Rival States, Rival Firms: Competition for World Market
Shares. New York: Cambridge University Press.
Storper, Michael and Robert Salais. 1997. Worlds of Production: The Action Frameworks of the
Economy. Cambridge, MA: Harvard University Press.
Strange, Susan. 1996. The Retreat of the State: The Diffusion of Power in the World Economy. New
York: Cambridge University Press.
29
Streeck Wofgang. 1991. ―On the Institutional Conditions of Diversified Quality Production.‖ Pp. 21-
61 in Beyond Keynesianism: The Socio-Economics of Production and Full Employment, ed. E.
Matzner and W. Streeck. Hants, England: Edward Elgar Publishing.
Thursby, J and M. Thursby. 1987. Bilateral trade flows, the Lindner hypothesis and exchange risk.
The Review of Economics and Statistics 69: 488-495.
Van Rossem, Ronald. 1996. ―The World-System Paradigm as General Theory of Development: A
Cross-National Test.‖ American Sociological Review 61:508-527.
Verne, Jules. 1873. Around the World in Eighty Days. Translated by George Makepeace Towle.
Available from Elegant Ebooks, http://www.ibiblio.org/ebooks/index.html
Wallerstein, Immanuel. 1974. The Modern World-System. New York: Academic Press.
Waters, Malcolm. 1995. Globalization. New York: Routledge.
Whitley, Richard. 1992. Business Systems in East Asia: Firms, Markets, and Societies. London:
Sage Publications.
Williamson, Jeffrey G. 1996. ―Globalization, Convergence, History.‖ Journal of Economic History
56(2) (June):277-306.
Zelizer, Viviana A. 1999. ―Multiple Markets: Multiple Cultures.‖ Pp. 193-212 in Diversity and
Its Discontents: Cultural Conflict and Common Ground in Contemporary American
Society, ed. Neil J. Smelser and Jeffrey Alexander. Princeton, NJ: Princeton University
Press.

30
FIGURE 1
COUNTRIES IN 3-DIMENSIONAL POLITICAL CHARACTERISTIC SPACE, 1972
(A) (B)
D
ddad

31
FIGURE 2
EXAMPLE OF SUBCOMPONENT VOLUME CALCULATION
(a) (b)
(c) (d)

32
32
FIGURE 3
GLOBAL VOLUMES, 1960-2009
NOTE.—All volume time series are calculated using MVE method and are scaled to equal 1 in 2000. The
penultimate graph, labeled ―Global‖, refers to the volume measure for the global connectedness distance
dimension.
Year
Vo
lum
e
0.51.01.52.02.53.03.5
0.60.8
1.0
1.2
1.4
0.20.40.60.81.01.21.4
1.0
1.5
2.0
2.5
0.20.40.60.81.01.21.4
0.5
1.0
1.5
2.0
3040506070
1960 1970 1980 1990 2000
Econom
icD
em
ogra
phic
Cultu
ral
Know
ledge
Fin
ancia
lG
lobal
Politic
al

33
33
FIGURE 4a: Core-Periphery Results
CORE COUNTRY VOLUMES, 1960-2009
NOTE.—All volume time series are calculated using MVE method and are scaled to equal 1 in 2000. The
penultimate graph, labeled ―Global‖, refers to the volume measure for the global connectedness distance
dimension.
Year
Vo
lum
e
0.5
1.0
1.5
2.0
1234567
0.50.60.70.80.91.01.1
0.5
1.0
1.5
2.0
0.2
0.4
0.6
0.8
1.0
1.2
1
2
3
4
1960 1970 1980 1990 2000 2010
Econom
icD
em
ogra
phic
Know
ledge
Fin
ancia
lG
lobal
Politic
al

34
34
FIGURE 4b: Core-Periphery Results
SEMIPERIPHERY COUNTRY VOLUMES, 1960-2009
NOTE.—All volume time series are calculated using MVE method and are scaled to equal 1 in 2000. The
penultimate graph, labeled ―Global‖, refers to the volume measure for the global connectedness distance
dimension.
Year
Vo
lum
e
0.5
1.0
1.5
2.0
2.5
0.5
1.0
1.5
2.0
0.8
1.01.2
1.4
1.6
0.20.40.60.81.01.21.4
0.2
0.4
0.6
0.8
1.0
0.4
0.6
0.8
1.0
1.2
1.4
1960 1970 1980 1990 2000 2010
Econom
icD
em
ogra
phic
Know
ledge
Fin
ancia
lG
lobal
Politic
al

35
35
FIGURE 4c: Core-Periphery Results
PERIPHERY COUNTRY VOLUMES, 1960-2009
NOTE.—All volume time series are calculated using MVE method and are scaled to equal 1 in 2000. The
penultimate graph, labeled ―Global‖, refers to the volume measure for the global connectedness distance
dimension.
Year
Vo
lum
e
0.51.01.52.02.53.0
0.60.70.80.91.01.11.2
123456
0.51.01.52.02.53.0
0.2
0.40.6
0.8
1.01.2
0.60.81.01.21.41.6
1960 1970 1980 1990 2000 2010
Econom
icD
em
ogra
phic
Know
ledge
Fin
ancia
lG
lobal
Politic
al

36
36
FIGURE 5a: TRADE BLOC RESULTS
Free Trade Agreement - ASEAN
Year
Vo
lum
e
0
1
2
3
4
0.2
0.4
0.60.8
1.0
5
10
15
0.5
1.0
1.5
2.0
2468
101214
0.20.40.60.81.0
1970 1980 1990 2000 2010
Econom
icD
em
ogra
phic
Know
ledge
Fin
ancia
lG
lobal
Politic
al

37
37
FIGURE 5E: TRADE BLOC RESULTS
Free Trade Agreement CEFTA
Year
Vo
lum
e
2
4
6
8
102030405060
0.5
1.0
1.5
2.0
0.5
1.0
1.5
2.0
2.5
10
20
30
40
50
5
10
15
1995 2000 2005 2010
Econom
icD
em
ogra
phic
Know
ledge
Fin
ancia
lG
lobal
Politic
al

38
38
FIGURE 5c – TRADE BLOC RESULTS
Free Trade Agreement - SAARC
Year
Vo
lum
e
0.5
1.0
1.5
0.5
1.0
1.5
0.51.01.52.02.53.03.5
2
4
6
8
20
40
60
80
0.60.81.01.21.41.61.8
1985 1990 1995 2000 2005 2010
Econom
icD
em
ogra
phic
Know
ledge
Fin
ancia
lG
lobal
Politic
al

39
39
FIGURE 5d: TRADE BLOC RESULTS
Customs Union ANDEAN Community
Year
Vo
lum
e
0.20.40.60.81.01.21.4
0.2
0.4
0.6
0.8
1.0
1.2
0.5
1.0
1.5
0.20.40.60.81.01.21.4
0.2
0.4
0.6
0.8
1.0
1.2
1970 1980 1990 2000 2010
Econom
icK
now
ledge
Fin
ancia
lG
lobal
Politic
al

40
40
FIGURE 5e: TRADE BLOC RESULTS
Customs Union - MERCOSUR
Year
Vo
lum
e
0.2
0.4
0.6
0.8
1.0
1.2
0.2
0.4
0.6
0.8
1.0
1.2
0.20.40.60.81.01.21.4
0.2
0.4
0.6
0.8
1.0
1.2
1.0
1.5
2.0
2.5
3.0
1995 2000 2005 2010
Econom
icK
now
ledge
Fin
ancia
lG
lobal
Politic
al

41
41
FIGURE 5f – TRADE BLOC RESULTS
Customs Union - SACU
Year
Vo
lum
e
0.5
1.0
1.5
2.0
2.5
0.5
1.0
1.5
2.0
2.5
0.20.40.60.81.01.21.4
0.4
0.6
0.8
1.0
1.2
0.5
1.0
1.5
0.5
1.0
1.5
2.0
1970 1980 1990 2000 2010
Econom
icD
em
ogra
phic
Know
ledge
Fin
ancia
lG
lobal
Politic
al
42
42
FIGURE 5g: TRADE BLOC RESULTS
Common Market - CARICOM
Year
Vo
lum
e
0.20.40.60.81.01.2
0.8
1.0
1.2
1.4
0.2
0.4
0.6
0.8
1.0
0.20.40.60.81.0
0.5
1.0
1.5
0e+001e+092e+093e+094e+095e+096e+097e+09
1975 1980 1985 1990 1995 2000 2005 2010
Econom
icD
em
ogra
phic
Know
ledge
Fin
ancia
lG
lobal
Politic
al

43
43
FIGURE 5h: TRADE BLOC RESULTS
Common Market - EU - 27
Year
Vo
lum
e
1
2
3
4
2
4
6
8
0.40.50.60.70.80.91.0
1
2
3
4
1.0
1.5
2.0
2.5
0.5
1.0
1.5
1960 1970 1980 1990 2000 2010
Econom
icD
em
ogra
phic
Know
ledge
Fin
ancia
lG
lobal
Politic
al
44
44
FIGURE 5G: TRADE BLOC RESULTS
Monetary Union – Eurozone 11
Year
Vo
lum
e
0.50.60.70.80.91.01.1
1.0
1.1
1.2
1.3
1.4
0.750.800.850.900.951.001.051.10
0.4
0.6
0.8
1.0
0.60.70.80.91.01.11.21.3
1.0
1.5
2.0
2.5
3.0
2000 2002 2004 2006 2008 2010
Econom
icD
em
ogra
phic
Know
ledge
Fin
ancia
lG
lobal
Politic
al
45
45
FIGURE 6: NAFTA RESULTS USING MINIMUM VOLUME HYPERSPHERE VOLUMES
Year
Vo
lum
e
0.6
0.7
0.8
0.9
1.0
1.0
1.5
2.0
2.5
0.7
0.8
0.9
1.0
1
2
3
4
5
0.5
1.0
1.5
2.0
1
2
3
4
1995 2000 2005 2010
Econom
icD
em
ogra
phic
Know
ledge
Fin
ancia
lG
lobal
Politic
al

46
46
Table 1: Component Variables Used in Cross-National Institutional Measures Dimension: Component Variables: 1. Economic Income GDP per capita, 2000 USD Exports Exports of goods and services (% GDP) Imports Imports of goods and services (% GDP) 2. Financial Private Credit Domestic credit to private sector (% GDP)
Stock Market Cap Market capitalization of listed companies (% GDP) Listed Companies Number of listed companies (per one million population)
3. Political Policy Making Uncertainty Political stability measured by considering independent
institutional actors with veto power Democratic character Democracy Score Size of the state Government consumption (% GDP) 4. Cultural Power distance WVS question on obedience and respect for authority Uncertainty avoidance WVS questions on trusting people and
job security Individualism WVS questions on independence and the
role of government in providing for its citizens Masculinity WVS questions on the importance of family and work 5. Demographic Life expectancy Life expectancy at birth, total (years) Birth rate Birth rate, crude (per 1,000 people)
Population under 14 Population ages 0-14 (% of total) Population under 65 Population ages 65 and above (% of total) 6. Knowledge Patents Number of patents per one million population Scientific Articles Number of scientific articles per one million population 7. Global Connectedness International Tourism Expend International tourism, expenditures (% GDP) International Tourism Receipts International tourism, receipts (% GDP) Internet use Internet users per 1,000 people

47
47
Table 2: Data Sources, Year Availability, and Country Coverage Dimension: Source Years Available # of Countries (in 2004) 1. Economic Income WDI 1960-2005 179 Exports WDI 1960-2005 165 Imports WDI 1960-2005 165 2. Financial Private credit WDI 1960-2005 122
Stock market Cap WDI 1988-2005 122 Listed companies WDI 1988-2005 122
3. Political Policymaking uncertainty POLCONV 1960-2005 155 Democracy score Freedom House 1960-2003 151 Size of the state WDI 1960-2005 155 4. Cultural Power distance WVS 1980-2004 68 Uncertainty avoidance WVS 1980-2004 66 Individualism WVS 1980-2004 69 Masculinity WVS 1980-2004 69 5. Demographic Life expectancy WDI 1960-2004 202 Birth rate WDI 1960-2004 202 Population under 14 WDI 1960-2005 203
Population under 65 WDI 1960-2005 203 6. Knowledge Patents USPTO 1977-2005 166 Scientific articles WDI & ISI 1960-2003 110 7. Global Connectedness International tourism Expend WDI 1995-2004 119 International tourism Receipts WDI 1995-2004 115
Internet users WDI 1995-2004 209

48
48
TABLE 3
CORE-SEMIPERIPHERY-PERIPHERY COUNTRY LIST
Core United States, France, Germany, United
Kingdom, Italy, Japan, Russia, Belgium, The
Netherlands, Canada, Brazil, Spain, China,
Saudi Arabia, Australia
Semiperiphery Sweden, Switzerland, India, Egypt, Austria,
Nigeria, Czech Republic, Iran, Argentina,
Romania, Algeria, Pakistan, Mexico, Iraq,
Poland, Turkey, Portugal, Libya, Greece,
Indonesia, Thailand
Periphery Venezuela, Kuwait, Denmark, Kenya,
Ethiopia, Morocco, Philippines, Norway,
Korea, Senegal, Syria, Peru, Bulgaria, Finland,
Cuba, Hungary, Malaysia, Tunisia, Colombia,
Tanzania, United Arab Emirates, Ivory Coast,
Sudan, Ecuador, Jordan, Bangladesh, Ghana,
Zimbabwe, Israel, Sri Lanka, Chile, Uruguay,
Zambia, Costa Rica, Ireland, New Zealand,
Mozambique, Cameroon, Panama, Guinea,
Bolivia, Nicaragua, Angola, Guatemala,
Somalia, Myanmar, Gabon, Oman, Dominican
Republic, Haiti, Congo, El Salvador,
Honduras, Paraguay, Qatar, Singapore,
Jamaica, Yemen, Liberia, Laos, Uganda,
Madagascar, Cyprus, Nepal, Malta, Mali,
Trinidad and Tobago, Sierra Leone, Central
African Republic, Iceland, Bahrain,
Mauritania, Togo, Papua New Guinea, Niger,
Rwanda, Burkina Faso, Burundi, Benin,
Guyana, Guinea-Bissau, Mauritius, Suriname,
Botswana, Djibouti, Seychelles, Fiji, Malawi,
The Gambia, Lesotho, Equatorial Guinea,
Antigua & Barbuda, Belize, Cape Verde,
Taiwan, Barbados, Chad, Swaziland, Bahamas,
Sao Tome & Principe, Hong Kong, Grenada,
Tonga, Comoros, Maldives, Samoa,
Netherlands Antilles, Greenland, Brunei,
Bermuda, St. Kitts and Nevis, St. Lucia, St.
Vincent and the Grenadines, Namibia,
Solomon Islands, Faeroe Islands, Gibraltar,
Guam, New Caledonia, American Samoa,
French Polynesia

49
49
TABLE 4
TRADE BLOC MEMBER STATES
Trade Bloc Nations and their Years of Participation*
ASEAN Brunei Darussalam (1984), Indonesia (1967), Cambodia (1994), Laos (1997),
Myanmar (1997), Malaysia (1967), Philippines (1967), Singapore (1967),
Thailand (1967), Vietnam (1995)
CEFTA Albania (2007), Bulgaria (1999-2007), Bosnia and Herzegovina (2007), Czech
Republic (1992-2004), Croatia (2007), Hungary (1992-2004), Kosovo (2007),
Moldova (2007), Macedonia, FYR (2006), Montenegro (2007), Poland (1992-
2004), Romania (1997-2007), Serbia (2007), Slovak Republic (1992-2004),
Slovenia (1996-2004)
SAARC Afghanistan (2005), Bangladesh (1985), Bhutan (1985), India (1985), Sri Lanka
(1985), Maldives (1985), Nepal (1985), Pakistan (1985)
NAFTA Canada (1992), Mexico (1992), United States (1992)
Andean
Community
Bolivia (1969), Colombia (1969), Ecuador (1969), Peru (1969)
Mercosur Argentina (1991), Brazil (1991), Paraguay (1991), Uruguay (1991)
SACU Botswana (1969), Lesotho (1969), Namibia (1969), South Africa (1969),
Swaziland (1969)
CARICOM Antigua and Barbuda (1973), Barbados (1973), Belize (1973), Dominica (1973),
Grenada (1973), Guyana (1973), Jamaica (1973), St. Kitts and Nevis (1973), St.
Lucia (1973), St. Vincent and the Grenadines (1973), Trinidad and Tobago (1973)
EU-27 Austria (1995), Belgium (1952), Bulgaria (2007), Cyprus (2004), Czech Republic
(2004), Germany (1952), Denmark (1973), Spain (1986), Estonia (2004), Finland
(1995), France (1952), United Kingdom (1973), Greece (1981), Hungary (2004),
Ireland (1973), Italy (1952), Lithuania (2004), Luxembourg (1952), Latvia (2004),
Malta (2004), Netherlands (1952), Poland (2004), Portugal (1986), Romania
(2007), Slovak Republic (2004), Slovenia (2004), Sweden (1995)
Eurozone-
11
Austria (1999), Belgium (1999), Finland (1999), France (1999), Germany (1999),
Ireland (1999), Italy (1999), Luxembourg (1999), Netherlands (1999), Portugal
(1999), Spain (1999)

50
50
*Years of participation are given in parentheses. A single year indicates that the country entered
the bloc and is still a member.

51
51
TABLE 5
TREND TEST FOR WORLD VOLUMES, 1960-2009
*p<0.05,
**p<0.01,
***p<0.001
NOTE.— Test statistics are Kendall’s tau estimates of rank correlation between world volumes
and time. Significance implies that the volume of the world is decreasing over time.
TABLE 6
TREND TEST FOR WITHIN CORE, SEMIPERIPHERY, AND PERIPHERY VOLUMES, 1960-2009
Core Semiperiphery Periphery
Economic 0.36 0.61 0.72
Demographic -0.40***
0.44 0.60
Knowledge 0.75 -0.30* -0.19
Financial 0.62 0.48 0.67
Global 0.71 0.27 0.76
Political -0.12 0.45 0.38 *p<0.05,
**p<0.01,
***p<0.001
NOTE.— Test statistics are Kendall’s tau estimates of rank correlation between subcomponent
volumes and time. Significance implies that the volume of the subcomponent is decreasing over
time.
Distance Dimension Correlation
Economic 0.76
Demographic 0.62
Cultural 0.67
Knowledge -0.14
Financial 0.60
Global 0.78
Political 0.29

52
52
TABLE 7
TREND TEST FOR WITHIN TRADE BLOC VOLUMES
ASEAN CEFTA SAARC
Andean
Communit
y Mercosur SACU
CARICO
M EU Eurozone NAFTA
Economic 0.70 0.52 0.55 0.28 0.14 0.14 0.76 0.77 -0.33 0.57
Demographic 0.62 0.53 0.63 - - -0.32**
0.43 0.34 0.24 -0.34***
Knowledge 0.61 -0.07 0.34 0.16 0.22 -0.13 0.38 0.73 0.39 0.42
Financial 0.19 0.24 0.51 0.24 0.31 0.27 -0.47 0.45 -0.20 0.70
Global 0.65 0.85 0.93 0.71 0.59 0.43 0.87 0.80 -0.64**
0.08
Political 0.66 0.05 0.33 0.16 -0.72***
0.40 0.18 0.38 -0.44 -0.26*
*p<0.05,
**p<0.01,
***p<0.001
NOTE.— Test statistics are Kendall’s tau estimates of rank correlation between trade bloc volumes and time. Significance implies that the volume of a
subcomponent is decreasing over time.
53
53
TABLE 8
TREND TEST FOR BETWEEN WORLD-SYSTEM SUBCOMPONENT DYADIC DISTANCES, 1960-2009
Core
Core
- -
- -
- - Semiperiphery
S
emip
erip
he
ry
0.31***
0.23 - -
0.58***
0.52**
- -
0.88***
0.32**
- - Periphery P
erip
h
ery
0.66***
0.41**
0.69***
0.26* - -
0.51***
0.54**
-0.07 0.54**
- -
-0.28 -0.13 -0.24 0.02 - - *p<0.05,
**p<0.01,
***p<0.001
NOTE.— Test statistics are Kendall’s tau estimates of rank correlation between dyadic distances and time. The column and row names indicate the
world-system subcomponents between which dyadic distances are calculated. Within each cell the test statistics for different distance dimensions are
arranged into columns in the following order: column 1 is economic, demographic, knowledge, and column 2 is financial, global connectedness, and
political. Significance implies that the distance between subcomponents is increasing over time.

54
54
TABLE 9
TREND TEST FOR BETWEEN TRADE BLOC DYADIC DISTANCES
ASEAN
AS
EA
N
- -
- -
- - CEFTA
CE
FT
A
0.75***
-0.44
- -
0.06 -0.16 - -
0.60***
-0.38 - - SAARC
SA
AR
C
0.50**
-0.76 0.25 0.38* - -
-0.50 0.19 0.51**
0.54**
- -
0.90***
0.03 0.13 -0.15 - - Andean Comm.
Andea
n C
om
0.58***
-0.71 0.71***
0.16 0.26* -0.09 - -
0.07 -0.03 0.53**
0.63***
0.21 -0.16 - -
0.88***
-0.03 0.13 -0.25 -0.84 -0.30 - - Mercosur
Mer
co
sur
0.58***
-0.60 0.62***
0.43**
0.23 -0.39 0.19 0.03 - -
-0.23 -0.76 0.90***
0.47**
0.10 -0.05 0.41* -0.49 - -
0.83***
0.18 0.03 -0.18 0.78***
0.28 0.75***
-0.28 - - SACU
SA
CU
0.48**
-0.70 -0.81 0.47**
-0.64 -0.07 -0.10 -0.06 -0.32 0.35* - -
0.51**
0.85***
0.75***
0.45**
0.40**
-0.32 0.92***
0.43* 0.87
*** -0.34 - -
0.78***
-0.38* 0.07 -0.22 -0.05 -0.42 0.02 0.04 0.74
*** -0.37 - - CARICOM
CA
RI
CO
M 0.61
*** -0.57 -0.26 0.26 -0.48 0.67
*** 0.02 0.81
*** -0.54 0.61
*** -0.31 0.12 - -
-0.46 -0.30 0.65***
-0.32 -0.58 0.14 -0.35 -0.10 0.71***
-0.34 0.24* -0.03 - -
0.80**
-0.30 -0.40 0.22 0.05 0.10 -0.02 -0.39 0.33 -0.49 0.45* 0.26
* - -
EU
0.33* 0.07 0.49
** 0.49
** 0.57
*** 0.45
** 0.80
*** 0.44
** 0.33
* 0.71
*** 0.56
*** 0.24 0.59
*** 0.46
**
0.40* -0.01 -0.28 0.85
*** 0.59
*** 0.78
*** 0.84
*** 0.63
*** 0.63
*** 0.45
** 0.88
*** 0.89
*** 0.62
*** -0.34
0.10 -0.23 0.68***
0.57***
0.70***
-0.35 0.69***
-0.47 0.57***
-0.65 0.79***
-0.48 0.60**
-0.28
E u r o z o n e 0.64**
0.64**
0.83***
-0.20 0.87***
0.29 0.73***
0.38 0.24 0.51* 0.87
*** 0.28 0.82
*** 0.47
*
55
55
0.56**
0.73***
0.64**
0.87***
-0.07 1.00***
0.78***
0.60**
0.62* 0.38 0.91
*** 1.00
*** 0.82
*** 0.64
**
-0.22 0.11 0.83***
0.44* 0.78
*** 0.39 0.78
*** 0.83
*** 0.78
*** 0.56
* 0.83
*** -0.89 1.00
*** 0.67
**
NA
FT
A
0.75***
-0.18 0.70***
0.22 0.97***
0.60***
0.83***
0.77***
0.90***
0.71***
0.65***
0.70***
0.02 0.69***
0.29* 0.56
** -0.07 0.80
*** -0.37 0.96
*** 0.23 0.60
*** -0.10 0.32 0.99
*** 1.00
*** 0.07 -0.21
0.17 0.59**
0.50**
-0.54 0.45**
0.18 0.45**
-0.18 0.43**
-0.69 0.40* -0.23 0.80
** 0.26
EU
EU
- -
- -
- - Eurozone
Euro
zone 0.91
*** 0.24 - -
0.24 0.51* - -
0.06 0.33 - - NAFTA
NA
FT
A
0.75***
0.41**
0.33 -0.24 - -
0.31* 0.16 0.29 -0.07 - -
0.32* 0.38
* -0.78
** -0.47 - -
*p<0.05,
**p<0.01,
***p<0.001
NOTE.— Test statistics are Kendall’s tau estimates of rank correlation between dyadic distances and time. The column and row names indicate the
trade blocs between which dyadic distances are calculated. Within each cell the test statistics for different distance dimensions are arranged into
columns in the following order: column 1 is economic, demographic, knowledge, and column 2 is financial, global connectedness, and political.
Significance implies that the distance between subcomponents is increasing over time.

56
56