Is it who you know or what you know? Evidence from ipo ...
34
This document is downloaded from DR‑NTU (https://dr.ntu.edu.sg) Nanyang Technological University, Singapore. Is it who you know or what you know? Evidence from ipo allocations and mutual fund performance Hwang, Chuan‑Yang; Titman, Sheridan; Wang, Yuxi 2018 Hwang, C.‑Y., Titman, S., & Wang, Y. (2018). Is It Who You Know or What You Know? Evidence from IPO Allocations and Mutual Fund Performance. Journal of Financial and Quantitative Analysis, 53(06), 2491‑2523. doi:10.1017/S0022109018000534 https://hdl.handle.net/10356/81288 https://doi.org/10.1017/S0022109018000534 © 2018 Michael G. Foster School of Business, University of Washington. All rights reserved. This paper was published in Journal of Financial and Quantitative Analysis and is made available with permission of Michael G. Foster School of Business, University of Washington. Downloaded on 23 Jan 2022 12:16:22 SGT
Transcript of Is it who you know or what you know? Evidence from ipo ...

This document is downloaded from DR‑NTU (https://dr.ntu.edu.sg)Nanyang Technological University, Singapore.
Is it who you know or what you know? Evidencefrom ipo allocations and mutual fundperformance
Hwang, Chuan‑Yang; Titman, Sheridan; Wang, Yuxi
2018
Hwang, C.‑Y., Titman, S., & Wang, Y. (2018). Is It Who You Know or What You Know? Evidencefrom IPO Allocations and Mutual Fund Performance. Journal of Financial and QuantitativeAnalysis, 53(06), 2491‑2523. doi:10.1017/S0022109018000534
https://hdl.handle.net/10356/81288
https://doi.org/10.1017/S0022109018000534
© 2018 Michael G. Foster School of Business, University of Washington. All rights reserved.This paper was published in Journal of Financial and Quantitative Analysis and is madeavailable with permission of Michael G. Foster School of Business, University ofWashington.
Downloaded on 23 Jan 2022 12:16:22 SGT

JOURNAL OF FINANCIAL AND QUANTITATIVE ANALYSIS Vol. 53, No. 6, Dec. 2018, pp. 2491–2523COPYRIGHT 2018, MICHAEL G. FOSTER SCHOOL OF BUSINESS, UNIVERSITY OF WASHINGTON, SEATTLE, WA 98195doi:10.1017/S0022109018000534
Is It Who You Know or What You Know?Evidence from IPO Allocations and MutualFund Performance
Chuan-Yang Hwang, Sheridan Titman, and Yuxi Wang*
AbstractMutual fund managers with degrees from elite universities tend to outperform their coun-terparts from less elite universities. We show that the better performance of elite graduatesis generated from their better connections with underwriters that facilitate allocations tounderpriced initial public offerings (IPOs). Indeed, we find that the funds outperform onlyin months when they are connected to underwriters issuing IPOs. A strategy of buyingmutual funds in months when they are connected to underwriters scheduled to issue IPOsgenerates significant abnormal returns, as high as 4.08% per annum in hot markets.
I. IntroductionSince the seminal work of Jensen (1968), researchers have explored the pos-
sibility that some mutual fund managers generate better performance than others.Although the original Jensen (1968) study failed to detect abnormal performance,the evidence presented by Grinblatt and Titman (1989) and others suggests that
*Hwang (corresponding author), [email protected], Nanyang Technological UniversityBusiness School; Titman, [email protected], University of Texas at Austin McCombs Schoolof Business; and Wang, [email protected], Shanghai Jiao Tong University Antai College of Eco-nomics and Management. We thank an anonymous referee, Utpal Bhattacharya, Zhanhui Chen, LaurenCohen, Jennifer Conrad (the editor), Stephen Dimmock, Paul Gao, Bing Han, David Hirshleifer, QianQian Huang, Pedro Matos, Vikram Nanda, Christopher Parsons, Yiming Qian, Jay Ritter, Chishen Wei,Adam Winegar, Hong Yan, Xiaoyun Yu, Lu Zheng, conference participants at the 2016 American Fi-nance Association (AFA) Meeting and the 2015 China International Conference in Finance (CICF),and seminar participants at Curtin University, Shanghai Advanced Institute of Finance, Murdoch Uni-versity, Nanyang Technological University, the National University of Singapore, National ChengchiUniversity, National Taiwan University, the University of Calgary and the University of Texas at Austinfor helpful comments. The paper was also presented at Fidelity and benefitted from discussions withthe portfolio managers who were allocated IPOs during our sample period. Titman serves as an advi-sor to Gerstein Fisher, an investment advisor and asset manager, and benefitted from discussions withGregg Fisher and Ronnie Shah about their mutual funds. Special thanks to Stephen Dimmock andZheng Qiao for their generous help with the data. All errors are our own.
2491
https://doi.org/10.1017/S0022109018000534D
ownloaded from
https://ww
w.cam
bridge.org/core . NTU
Library , on 14 Jan 2019 at 07:02:27 , subject to the Cambridge Core term
s of use, available at https://ww
w.cam
bridge.org/core/terms .

2492 Journal of Financial and Quantitative Analysis
some mutual fund managers have special skills or information.1 A natural ques-tion is whether mutual fund managers who are in some sense better trained ormore talented achieve consistent superior performance.
The research in this article is motivated by Chevalier and Ellison (1999),who document that mutual fund managers who attended more selective schoolsoutperform those who did not.2 The question we ask is whether this relation be-tween mutual fund performance and elite education, which also exists in our morerecent and longer time series, reflects the superior ability and training of the elitegraduates or, alternatively, the broader social network that these elite schools pro-vide. In other words, is their superior performance generated by who they knowor what they know?
To better understand the benefits of superior connections, we examine theinitial public offering (IPO) allocations of mutual funds. Given the evidence ofIPO underpricing,3 being allocated (especially hot) IPOs is a potential source ofthe observed superior performance of the mutual funds managed by elite grad-uates. Specifically, we examine data on the education of 1,420 portfolio man-agers working at 1,320 open-end equity mutual funds, along with the educationof 216 firm executives who underwrote 1,636 IPO deals during our sample period(Jan. 1992–Mar. 2012). We find that mutual funds managed by elite graduates areindeed allocated more IPOs, indicating that this is likely to be one source of theirsuperior performance.
To explore the link between educational connections and IPO allocations,we categorize the relation between a mutual fund and an underwriter with anupcoming IPO along two dimensions. The first dimension is whether or not themutual fund is managed by an individual who attended the same university asone of the officers of the bank underwriting the IPO, and the second dimensionis whether the mutual fund was allocated shares in the underwriter’s previousdeal. As we show, both dimensions are important, and the combination is a goodpredictor of whether a mutual fund is allocated a future IPO. A mutual fund withan educational tie to the underwriter as well as an allocation in its previous deal,what we are calling an effectively connected (EC) mutual fund, is approximatelyfive times as likely to be allocated an IPO in its next IPO compared with othermutual funds.
Mutual funds that are effectively connected in a given month outperformother mutual funds, but only in the months in which the funds are effectivelyconnected to an underwriter taking a firm public. Moreover, after we control forwhether or not a mutual fund is effectively connected, being managed by elitegraduates does not significantly influence the probability of being allocated an
1More recently, Kacperczyk, Sialm, and Zheng (2005) find that funds with higher industry con-centration generate annual abnormal returns, Kacperczyk, Sialm, and Zheng (2008) find that fundsthat outperform in one period using their return gap measure outperform in the following year, andCremers and Petajisto (2009) report that funds with higher active shares outperform.
2Li, Zhang, and Zhao (2011) find similar results using a hedge fund sample.3Ibbotson, Sindelar, and Ritter (1988) document a large initial day return of 16.4% for firms going
public between 1960 and 1987. The updated statistics on Ritter’s Web site (https://site.warrington.ufl.edu/ritter/ipo-data/) show that the average first-day return of IPOs was 7.2% in the 1980s, 14.8% from1990 to 1998, and 13.3% from 2001 to 2013 (it surged to 64.5% during the Internet bubble period of1999–2000).
https://doi.org/10.1017/S0022109018000534D
ownloaded from
https://ww
w.cam
bridge.org/core . NTU
Library , on 14 Jan 2019 at 07:02:27 , subject to the Cambridge Core term
s of use, available at https://ww
w.cam
bridge.org/core/terms .

Hwang, Titman, and Wang 2493
IPO and, in addition, does not significantly influence a mutual fund’s perfor-mance. In other words, mutual funds managed by elite graduates do not gener-ate significant abnormal performance in months in which they are unlikely to beallocated underpriced IPOs.
If effective connections with IPO underwriters subsume the elite graduateeffect, then mutual fund portfolio strategies that exploit these connections shoulddo even better than those that focus on elite education. We find that this is indeedthe case. Our panel regressions indicate that after controlling for various fundcharacteristics, effectively connected mutual funds outperform the unconnectedfunds by approximately 1.34% on an annualized basis. Moreover, as indicatedearlier, this superior performance occurs only in the months in which the funds areconnected to underwriters who allocate IPOs, suggesting that most, if not all, ofthe superior performance can be attributed to these connections. Indeed, a strategythat holds mutual funds only when they are connected to issuers of upcoming IPOsgenerates annual excess returns (relative to 3- and 4-factor models) of 2.28% onaverage and 4.08% in hot IPO markets.
This article contributes to a large and growing literature that explores theimportance of connections in the finance industry. Our research is particularly re-lated to Cohen, Frazzini, and Malloy (2008), who find that mutual fund managerstilt their portfolios toward firms with which they are connected through schoolties, and the connected holdings of these funds perform significantly better thantheir nonconnected counterparts. However, their estimates indicate that the totalimpact of these connections on mutual fund performance is only approximately 2basis points (bps) per year on average, which is not large enough to explain theChevalier and Ellison (1999) elite graduate effect. The relatively modest effectis likely due to the fact that mutual fund managers tend to be connected to rel-atively few firms with favorable information, and they are constrained to holdrelatively small stakes in each individual firm. In contrast, as we illustrate with asimple “back of the envelope” calculation, the high frequency of IPOs and theirlarge initial day returns are in fact sufficient to materially influence mutual fundreturns.
There are a number of other contributors to the literature on the bene-fits of connections in other parts of the finance industry. Noteworthy contri-butions include Hochberg, Ljungqvist, and Lu (2007), (2010), who find thatbetter-networked venture capital (VC) firms face less competition and experiencesignificantly better fund performance; Hwang and Kim (2009), who study theconnection between chief executive officers (CEOs) and directors and find thatindependent directors are not necessarily socially independent; Cohen, Frazzini,and Malloy (2010), who find that analysts outperform by up to 6.60% per year ontheir stock recommendations when they have an educational link to the company;Shue (2013), who studies how the alumni networks of executives affect corpo-rate policies; Engelberg, Gao, and Parsons (2013), who examine the impact ofsocial connection between CEOs and outside firm executives and find that CEOswith larger social networks have higher compensation; and Engelberg, Gao, andParsons (2012), who show that informal connections between firms and banks canlower a firm’s borrowing costs.
https://doi.org/10.1017/S0022109018000534D
ownloaded from
https://ww
w.cam
bridge.org/core . NTU
Library , on 14 Jan 2019 at 07:02:27 , subject to the Cambridge Core term
s of use, available at https://ww
w.cam
bridge.org/core/terms .

2494 Journal of Financial and Quantitative Analysis
Our article is similar to that of Engelberg et al. (2012) in that we observethe educational background of the top executives of the banks rather than thebackground of the relevant decision makers (in their case, the lending officer; inour case, the underwriter). It is interesting that in both cases these more indirectlinks explain behavior. One possibility is that the top executives in these banksdo in fact influence lending decisions and IPO allocations. A second possibilityis that the educational backgrounds of top executives at banks are in fact prettygood proxies for the educational backgrounds of the lower-level managers or insome other way influence the culture of the bank. However, in contrast to otherarticles in the social network literature, the exact channel linking education to IPOallocations is not important for our argument. We are simply documenting thefact that the superior returns of mutual funds managed by elite graduates comeabout because of these allocations. Specifically, selecting mutual funds based onconnections to the underwriters of upcoming IPOs rather than by elite educationsubstantially increases the magnitude of the returns.
We are also not the first to examine the allocation of IPOs to mutual funds.Most notably, Reuter (2006) previously showed how the connections of mutualfunds facilitate IPO allocations. However, the connections examined by Reuterare linked to the brokerage commissions paid to the IPO underwriters. Althoughwe do not have data on brokerage commissions, we do observe that mutual fundswith higher turnover tend to be allocated more IPOs, which supports Reuter’sfinding. In addition, Gaspar, Massa, and Matos’s (2006) study of mutual fundallocations within fund families suggests that in large fund families, IPOs areallocated strategically, so individual mutual fund managers in large families maynot always benefit as much from their individual connections as our analysis sug-gests. Finally, Massa, Reuter, and Zitzewitz (2010) observe that some of the mu-tual funds in large families have named managers, whereas some do not, and thosewith named managers tend to receive more IPO allocations and have higher returngaps. It should be noted that by construction, all of the managers in our samplehave named managers, and when we take out fund-family fixed effects, we do notfind evidence of preferential treatment for those managers with an elite education,but we do find evidence of educational connections mattering for within-fundfamily allocations.4
Our research is also related to the literature that explores the high and grow-ing level of compensation in the finance industry. The relevant stylized facts arethat relative wages in finance have risen (Kaplan and Rauh (2010), Philippon andReshef (2012), (2013)), that a higher proportion of elite graduates have joinedthe finance industry (Goldin and Katz (2008), Oyer (2008)), and that the returnto elite education is especially high in the finance industry (Celerier and Vallee(2015)). One interpretation of these observations is that because of increases inthe complexity of financial contracts, the finance industry requires higher-skilledworkers. An alternative interpretation, suggested by the analysis in this article,
4Our discussions with managers at Fidelity confirm that at Fidelity, IPOs are allocated from theunderwriters to the fund family, which then distributes the IPOs to the individual funds. We do nothave evidence of any preferential treatment in the allocation of IPOs at Fidelity or at the other twolarge fund families.
https://doi.org/10.1017/S0022109018000534D
ownloaded from
https://ww
w.cam
bridge.org/core . NTU
Library , on 14 Jan 2019 at 07:02:27 , subject to the Cambridge Core term
s of use, available at https://ww
w.cam
bridge.org/core/terms .

Hwang, Titman, and Wang 2495
is that an elite education provides superior networks and connections, which haverecently become more important.
Finally, it should be noted that our analysis is tangentially related to the book-building literature, which suggests that underpricing arises because of informationasymmetries between issuers and portfolio managers. As described in models byBenveniste and Spindt (1989) and Benveniste and Wilhelm (1990), the relation-ship between asset managers and underwriters is quite important for the pricing ofIPOs. Because the book-building process relies in part on trust, there are plausibleeconomic rationales for underwriters to allocate IPOs to a network of individualsthey know well. Indeed, the rents associated with being better connected that wedocument are consistent with these models.
The remainder of the article is organized as follows: In Section II, we explainhow our sample is constructed and present descriptive statistics. In Sections III–V,we explore the relation between elite school graduates, connections, and fund per-formance in more detail and explain sources of the possible relation. We provideadditional robustness checks in Section VI and conclude in Section VII.
II. Data
A. Sample ConstructionOur study examines data on mutual fund returns and holdings, IPO data, and
connection-related data. The mutual fund data come from the Thomson ReutersMutual Fund Database (TR MF) and the Center for Research in Security Prices(CRSP) Survivor-Bias-Free U.S. Mutual Fund Database (CRSP MF); the for-mer includes information from the semiannual N-SAR filings that are manda-tory for mutual funds,5 whereas the latter provides fund characteristics such astheir size, age, turnover ratio, expense ratio, and investment style at the share-class level. We also use factor portfolios from Ken French’s Web site (http://mba.tuck.dartmouth.edu/pages/faculty/ken.french/data library.html) to calculate themonthly risk-adjusted returns (ALPHA) of the mutual funds. Specifically, weregress the monthly mutual fund returns (after fees, expenses, and brokeragecommissions but before front-end and back-end loads) on the 4-factor portfo-lios, MKTRF, SMB, HML, and UMD, as detailed by Fama and French (1993)and Carhart (1997), over the whole sample period to obtain the respective factorloadings. The monthly ALPHA is then calculated as the difference between themutual fund’s monthly excess return over the risk-free rate and the sum of theproducts of the monthly factor returns and the estimated factor loadings.
We use the Securities Data Company (SDC) New Issues database to identifyIPOs. Following Loughran and Ritter (2002), we exclude unit offerings, closed-end funds, real estate investment trusts (REITs), partnerships, and American de-positary receipts (ADRs), as well as all IPOs with a file price below $5.00 pershare. There are 5,372 IPOs that meet the aforementioned criteria during thesample period of Jan. 1992–Mar. 2012.
5Wermers (2000) observes that over 80% of the funds voluntarily report their portfolio holdingson a quarterly basis.
https://doi.org/10.1017/S0022109018000534D
ownloaded from
https://ww
w.cam
bridge.org/core . NTU
Library , on 14 Jan 2019 at 07:02:27 , subject to the Cambridge Core term
s of use, available at https://ww
w.cam
bridge.org/core/terms .

2496 Journal of Financial and Quantitative Analysis
Because we use common educational background to proxy for “connectiv-ity,” we rely on biographical information on mutual fund managers and execu-tives at underwriter firms. We identify historical employment and educational in-formation for 216 senior executives6 working at 31 public lead underwriters (seeTable A1 of the Appendix for a list of the underwriters), covering 1,636 IPO deals,or 30.45% of the deals population. We also identify similar information about1,320 mutual fund managers, managing 35.30% (= 1,320/3,739) of the open-endequity funds in the sample. From our data on the education of the portfolio man-agers, we define a fund-level measure, ELITE SCHOOL, which equals 1 if theportfolio manager attended (as either an undergraduate or graduate student) oneof the top 10 universities ranked by the average SAT score of the freshmen at theportfolio managers’ tertiary institution,7 and 0 otherwise.
The educational information about the senior underwriter executives comesfrom ExecuComp, which contains information about Standard & Poor’s (S&P)1500 executives. During our sample period, the number of underwriting firms inthe S&P 1500 ranges from 16 to 24. In addition to the ExecuComp data, we checkand collect information about the executives’ education from at least two publicsources to ensure its accuracy. For example, from ExecuComp we learn that PaulC. Reilly was the CEO of Raymond James Financial in May 2010. We searchhis name on public Web sites and cross-reference the public biographies fromthree sources: the company’s Web site, the Notable Names Database (NNDB),8
and Bloomberg Businessweek. From this search, we learn that Reilly was bornin 19549 and received both a bachelor’s and a master of business administration(MBA) degree from the University of Notre Dame.10 We take extra care whendifferent people have identical names by keeping track of their employment his-tory. The employment and educational information of mutual fund managers isobtained from Morningstar.11
For each IPO, we identify each of the lead underwriters and extract the ed-ucational information about its senior executives. We then evaluate the statusof these executives’ educational connections to all mutual fund managers inthe sample during the same IPO month. Following the definition given by
6These are the top-compensated executives in underwriter firms, such as CEO, chief financialofficer (CFO), chairman, and so forth.
7The top 10 universities ranked by average SAT score over the 2001–2008 period are the CaliforniaInstitute of Technology, Harvard University, the Massachusetts Institute of Technology, PrincetonUniversity, Yale University, Pomona College, Stanford University, Dartmouth College, SwarthmoreCollege, and Columbia University.
8NNDB is an intelligence aggregator that tracks the activities of people whom the general publichas determined to be noteworthy, both living and dead.
9The graduation year of corporate executives is obtained by adding the average age at graduationfor each one of the six degree types, respectively: bachelor, master, MBA, Doctor of Medicine (MD),Juris Doctor (JD), and Doctor of Philosophy (PhD).
10The three public sources that we use to identify Paul C. Reilly’s educational information areavailable at the following sites: http://www.raymondjames.com/profiles/reilly.htm, http://www.nndb.com/people/248/000170735/, and http://investing.businessweek.com/research/stocks/people/person.asp?personId=886856&ticker=RJF.
11We match the Morningstar fund names and Thomson Reuters fund names first by restricting thespelling distance to be less than or equal to 20 and manually delete the nonmatched funds. Second, forthe remaining fund names with a spelling distance greater than 20, we use the fund ticker to obtain thematch and manually check its accuracy.
https://doi.org/10.1017/S0022109018000534D
ownloaded from
https://ww
w.cam
bridge.org/core . NTU
Library , on 14 Jan 2019 at 07:02:27 , subject to the Cambridge Core term
s of use, available at https://ww
w.cam
bridge.org/core/terms .

Hwang, Titman, and Wang 2497
Cohen et al. (2008), our connection indicator equals 1 if both the fund managerand the underwriter involved in the IPO attended the same college and 0 other-wise. We then aggregate the connection measure from the person–person level tothe deal–fund level; that is, our connection dummy is set to 1 for a mutual fundif any of the top executives from one of the lead underwriters attended the sametertiary institution as any one of the mutual fund’s portfolio managers and 0 oth-erwise. Because attending the same tertiary institution does not necessarily meanthe individuals know each other, we refine the connection measure to create anenhanced version, EC (effectively connected), which is an indicator variable thattakes a value of 1 if the fund and deal underwriter are currently connected (i.e.,one of the incumbent fund managers and underwriter firm executives attendedthe same school) and, in addition, if the fund received at least one IPO allocationfrom the same underwriter in the past and 0 otherwise. It should be emphasizedthat mutual funds managed by elite graduates are more likely to be effectivelyconnected. In our sample, the correlation between EC and ELITE SCHOOL isapproximately 0.37.
Finally, we follow Gaspar et al. (2006) to roughly identify the mutual funds’IPO allocations. Specifically, we identify whether a fund reports, in its quarterlyholdings statements, the stock of a firm that went public during the prior quarter,setting the allocation dummy, ALLOCATED, equal to 1 if the fund holds the IPOstock at the end of the issuance quarter and 0 otherwise. This, of course, is a noisymeasure because some funds sell the IPO stock prior to the quarter’s end, andothers acquire the IPO stocks on the market.
B. Fund CharacteristicsThere are 1,320 unique open-end equity funds in the sample, amounting to
approximately 35.30% of the domestic open-end equity fund population duringthe sample period. Table 1 reports descriptive statistics for our sample. Compared
TABLE 1Fund Characteristics
Table 1 reports the fund–month level summary statistics for the 76,794 fund–month observations in the sample. TNA isthe total net assets of a fund, or the closing market value of all securities owned by a fund plus all assets and minusall liabilities, in millions of dollars. EXPENSE_RATIO is the annual ongoing operating expenses shareholders pay fora mutual fund, expressed as the percentage of total investment by shareholders. TURNOVER_RATIO is the minimumof aggregated sales or aggregated purchases of securities, scaled by the average 12-month TNA of the fund. AGEis the number of years since a fund’s inception. The variable RET is the monthly return net of fees, expenses, andbrokerage commissions but before front-end and back-end loads. The variable ELITE_SCHOOL is a binary indicatorvariable for funds with top-school-graduated managers, which equals 1 if the portfolio manager has attended one of thetop 10 universities ranked by the average SAT score of the freshmen at the portfolio managers’ tertiary institution, and0 otherwise. We report statistics for all open-end equity funds in the intersection of the Center for Research in SecurityPrices (CRSP) and Thomson Reuters mutual fund databases in column 1, for the sample funds in column 2, for thosefunds managed by elite graduates in column 4, and for those managed by non-elite graduates in column 5. The p-valueof the difference between the sample funds and non-sample funds is reported in column 3, and that between the eliteand non-elite sample funds is reported in column 6.
p-Value of Non- p-Value ofAll Funds Sample Funds Difference ELITE_SCHOOL ELITE_SCHOOL Difference
Variable 1 2 3 4 5 6
TNA ($millions) 1,297.646 1,938.250 <0.001 2,718.743 1,168.095 <0.001EXPENSE_RATIO (%) 1.226 1.118 <0.001 1.159 1.194 <0.001TURNOVER_RATIO (%) 92.558 88.016 <0.001 72.098 103.211 <0.001AGE 12.756 14.168 <0.001 16.064 12.350 <0.001RET (%) 1.011 1.096 <0.001 1.101 1.092 0.802
https://doi.org/10.1017/S0022109018000534D
ownloaded from
https://ww
w.cam
bridge.org/core . NTU
Library , on 14 Jan 2019 at 07:02:27 , subject to the Cambridge Core term
s of use, available at https://ww
w.cam
bridge.org/core/terms .
2498 Journal of Financial and Quantitative Analysis
with all funds, funds in our sample tend to be larger, as measured by total netassets (TNA); they have lower turnover; and they are older, as measured byAGE in years. They also have higher returns (RET), suggesting that there maybe a selection issue, but there is no survival bias because we do not require oursample fund to be surviving funds. The univariate results in Table 1 also sug-gest that ELITE SCHOOL funds on average are larger, have lower turnover,and are older as measured by AGE in years, but they have similar returns asnon-ELITE SCHOOL funds.
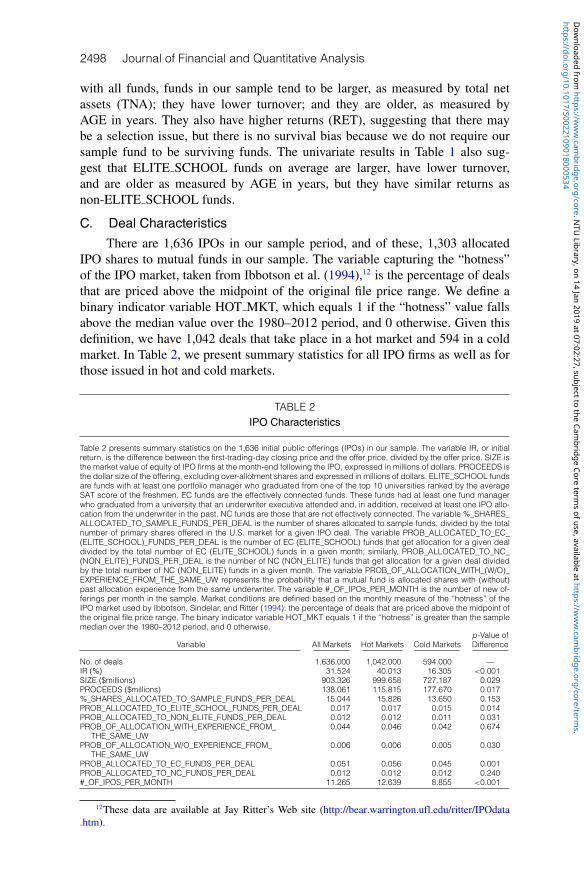
C. Deal CharacteristicsThere are 1,636 IPOs in our sample period, and of these, 1,303 allocated
IPO shares to mutual funds in our sample. The variable capturing the “hotness”of the IPO market, taken from Ibbotson et al. (1994),12 is the percentage of dealsthat are priced above the midpoint of the original file price range. We define abinary indicator variable HOT MKT, which equals 1 if the “hotness” value fallsabove the median value over the 1980–2012 period, and 0 otherwise. Given thisdefinition, we have 1,042 deals that take place in a hot market and 594 in a coldmarket. In Table 2, we present summary statistics for all IPO firms as well as forthose issued in hot and cold markets.
TABLE 2IPO Characteristics
Table 2 presents summary statistics on the 1,636 initial public offerings (IPOs) in our sample. The variable IR, or initialreturn, is the difference between the first-trading-day closing price and the offer price, divided by the offer price. SIZE isthe market value of equity of IPO firms at the month-end following the IPO, expressed in millions of dollars. PROCEEDS isthe dollar size of the offering, excluding over-allotment shares and expressed in millions of dollars. ELITE_SCHOOL fundsare funds with at least one portfolio manager who graduated from one of the top 10 universities ranked by the averageSAT score of the freshmen. EC funds are the effectively connected funds. These funds had at least one fund managerwho graduated from a university that an underwriter executive attended and, in addition, received at least one IPO allo-cation from the underwriter in the past. NC funds are those that are not effectively connected. The variable %_SHARES_ALLOCATED_TO_SAMPLE_FUNDS_PER_DEAL is the number of shares allocated to sample funds, divided by the totalnumber of primary shares offered in the U.S. market for a given IPO deal. The variable PROB_ALLOCATED_TO_EC_(ELITE_SCHOOL)_FUNDS_PER_DEAL is the number of EC (ELITE_SCHOOL) funds that get allocation for a given dealdivided by the total number of EC (ELITE_SCHOOL) funds in a given month; similarly, PROB_ALLOCATED_TO_NC_(NON_ELITE)_FUNDS_PER_DEAL is the number of NC (NON_ELITE) funds that get allocation for a given deal dividedby the total number of NC (NON_ELITE) funds in a given month. The variable PROB_OF_ALLOCATION_WITH_(W/O)_EXPERIENCE_FROM_THE_SAME_UW represents the probability that a mutual fund is allocated shares with (without)past allocation experience from the same underwriter. The variable #_OF_IPOs_PER_MONTH is the number of new of-ferings per month in the sample. Market conditions are defined based on the monthly measure of the ‘‘hotness’’ of theIPO market used by Ibbotson, Sindelar, and Ritter (1994): the percentage of deals that are priced above the midpoint ofthe original file price range. The binary indicator variable HOT_MKT equals 1 if the ‘‘hotness’’ is greater than the samplemedian over the 1980–2012 period, and 0 otherwise.
p-Value ofVariable All Markets Hot Markets Cold Markets Difference
No. of deals 1,636.000 1,042.000 594.000 —IR (%) 31.524 40.013 16.305 <0.001SIZE ($millions) 903.326 999.658 727.187 0.029PROCEEDS ($millions) 138.061 115.815 177.670 0.017%_SHARES_ALLOCATED_TO_SAMPLE_FUNDS_PER_DEAL 15.044 15.826 13.650 0.153PROB_ALLOCATED_TO_ELITE_SCHOOL_FUNDS_PER_DEAL 0.017 0.017 0.015 0.014PROB_ALLOCATED_TO_NON_ELITE_FUNDS_PER_DEAL 0.012 0.012 0.011 0.031PROB_OF_ALLOCATION_WITH_EXPERIENCE_FROM_ 0.044 0.046 0.042 0.674
THE_SAME_UWPROB_OF_ALLOCATION_W/O_EXPERIENCE_FROM_ 0.006 0.006 0.005 0.030
THE_SAME_UWPROB_ALLOCATED_TO_EC_FUNDS_PER_DEAL 0.051 0.056 0.045 0.001PROB_ALLOCATED_TO_NC_FUNDS_PER_DEAL 0.012 0.012 0.012 0.240#_OF_IPOS_PER_MONTH 11.265 12.639 8.855 <0.001
12These data are available at Jay Ritter’s Web site (http://bear.warrington.ufl.edu/ritter/IPOdata.htm).
https://doi.org/10.1017/S0022109018000534D
ownloaded from
https://ww
w.cam
bridge.org/core . NTU
Library , on 14 Jan 2019 at 07:02:27 , subject to the Cambridge Core term
s of use, available at https://ww
w.cam
bridge.org/core/terms .

Hwang, Titman, and Wang 2499
Our sample deals typically have one identifiable lead underwriter per IPOfirm, and the average underpricing (initial return (IR), calculated as the differencebetween the first-trading-day closing price and the offer price divided by the of-fer price) is approximately 31.52%. The average post-issue market capitalizationis approximately $903.33 million, and the average proceeds are approximately$138.06 million. Among the offered shares, the percentage of shares allocatedto our sample funds is approximately 15.04% per deal, which is less than halfof the 34% allocation to all open-end equity funds reported by Ritter and Zhang(2007).13
The univariate summary statistics indicate that past allocations predict futureallocations and that being a graduate of an elite school is associated with more IPOallocations. The probability that a particular IPO is allocated to an elite-schoolmanaged fund is approximately 2%, whereas the probability that a particular IPOis allocated to a non-elite-school managed fund is only approximately 1%. Inaddition, mutual funds receive allocations for 4.4% of the IPOs underwritten frombanks that allocated IPOs to them in the past, which compares to 0.6% of the IPOsunderwritten by banks with which they had no previous relation. For funds thatare effectively connected (EC), that is, that have a previous relation as well as aneducational connection, the probability of an IPO allocation is approximately 5%,which can be compared to the probability that a particular IPO is allocated to anon-EC (NC) fund, which is approximately 1%.
The last three columns of Table 2 present a comparison of deal character-istics in different market conditions: As the market conditions for IPOs becomehotter, we see more deals per month, higher average first-day returns, and lowerproceeds per deal. The lower proceeds are due to the fact that smaller issueschoose to go public in hot markets. The percentage allocated to our sample fundsis indistinguishable in the two markets. The probability of getting an allocationis higher for EC funds in hot markets, which we explore in greater depth inSection IV.
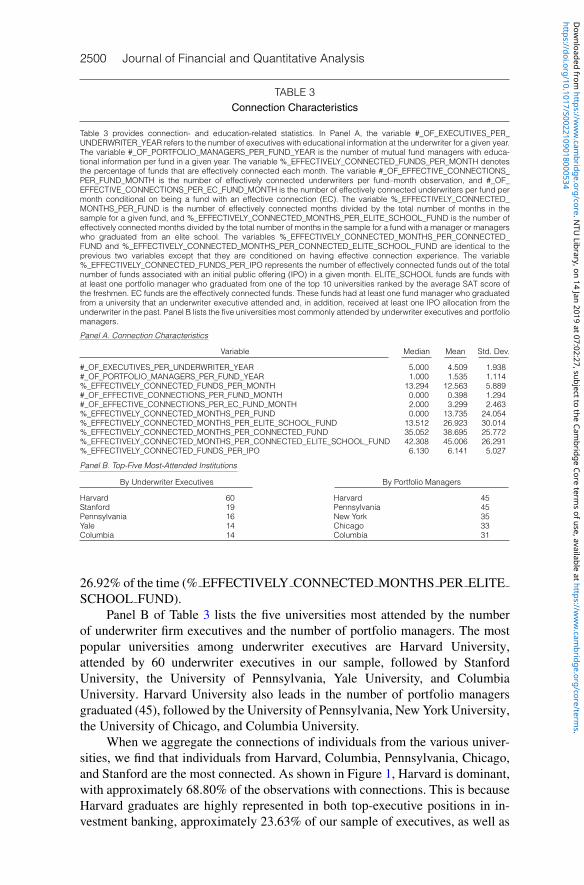
D. Connection CharacteristicsThis section provides descriptive statistics about the educational connections
between underwriters and mutual funds. As Panel A of Table 3 shows, the me-dian number of senior executives per underwriter is 5, and the median numberof portfolio managers per fund is 1. In terms of our key connection variable ofinterest in this article, 12.56% of funds are effectively connected every month.The variable # OF EFFECTIVE CONNECTIONS PER FUND MONTH indi-cates that, unconditionally, a fund is effectively connected to 0.40 deals permonth on average and that, conditioned on being connected in a particular month,a fund is effectively connected to approximately 3 deals (# OF EFFECTIVECONNECTIONS PER EC FUND MONTH). The average mutual fund iseffectively connected 13.74% of the time (% EFFECTIVELY CONNECTEDMONTHS PER FUND), but elite-school funds are effectively connected
13The discrepancy arises because we only include open-end equity funds for which we have edu-cational information about their portfolio managers.
https://doi.org/10.1017/S0022109018000534D
ownloaded from
https://ww
w.cam
bridge.org/core . NTU
Library , on 14 Jan 2019 at 07:02:27 , subject to the Cambridge Core term
s of use, available at https://ww
w.cam
bridge.org/core/terms .
2500 Journal of Financial and Quantitative Analysis
TABLE 3Connection Characteristics
Table 3 provides connection- and education-related statistics. In Panel A, the variable #_OF_EXECUTIVES_PER_UNDERWRITER_YEAR refers to the number of executives with educational information at the underwriter for a given year.The variable #_OF_PORTFOLIO_MANAGERS_PER_FUND_YEAR is the number of mutual fund managers with educa-tional information per fund in a given year. The variable %_EFFECTIVELY_CONNECTED_FUNDS_PER_MONTH denotesthe percentage of funds that are effectively connected each month. The variable #_OF_EFFECTIVE_CONNECTIONS_PER_FUND_MONTH is the number of effectively connected underwriters per fund–month observation, and #_OF_EFFECTIVE_CONNECTIONS_PER_EC_FUND_MONTH is the number of effectively connected underwriters per fund permonth conditional on being a fund with an effective connection (EC). The variable %_EFFECTIVELY_CONNECTED_MONTHS_PER_FUND is the number of effectively connected months divided by the total number of months in thesample for a given fund, and %_EFFECTIVELY_CONNECTED_MONTHS_PER_ELITE_SCHOOL_FUND is the number ofeffectively connected months divided by the total number of months in the sample for a fund with a manager or managerswho graduated from an elite school. The variables %_EFFECTIVELY_CONNECTED_MONTHS_PER_CONNECTED_FUND and %_EFFECTIVELY_CONNECTED_MONTHS_PER_CONNECTED_ELITE_SCHOOL_FUND are identical to theprevious two variables except that they are conditioned on having effective connection experience. The variable%_EFFECTIVELY_CONNECTED_FUNDS_PER_IPO represents the number of effectively connected funds out of the totalnumber of funds associated with an initial public offering (IPO) in a given month. ELITE_SCHOOL funds are funds withat least one portfolio manager who graduated from one of the top 10 universities ranked by the average SAT score ofthe freshmen. EC funds are the effectively connected funds. These funds had at least one fund manager who graduatedfrom a university that an underwriter executive attended and, in addition, received at least one IPO allocation from theunderwriter in the past. Panel B lists the five universities most commonly attended by underwriter executives and portfoliomanagers.
Panel A. Connection Characteristics
Variable Median Mean Std. Dev.
#_OF_EXECUTIVES_PER_UNDERWRITER_YEAR 5.000 4.509 1.938#_OF_PORTFOLIO_MANAGERS_PER_FUND_YEAR 1.000 1.535 1.114%_EFFECTIVELY_CONNECTED_FUNDS_PER_MONTH 13.294 12.563 5.889#_OF_EFFECTIVE_CONNECTIONS_PER_FUND_MONTH 0.000 0.398 1.294#_OF_EFFECTIVE_CONNECTIONS_PER_EC_FUND_MONTH 2.000 3.299 2.463%_EFFECTIVELY_CONNECTED_MONTHS_PER_FUND 0.000 13.735 24.054%_EFFECTIVELY_CONNECTED_MONTHS_PER_ELITE_SCHOOL_FUND 13.512 26.923 30.014%_EFFECTIVELY_CONNECTED_MONTHS_PER_CONNECTED_FUND 35.052 38.695 25.772%_EFFECTIVELY_CONNECTED_MONTHS_PER_CONNECTED_ELITE_SCHOOL_FUND 42.308 45.006 26.291%_EFFECTIVELY_CONNECTED_FUNDS_PER_IPO 6.130 6.141 5.027
Panel B. Top-Five Most-Attended Institutions
By Underwriter Executives By Portfolio Managers
Harvard 60 Harvard 45Stanford 19 Pennsylvania 45Pennsylvania 16 New York 35Yale 14 Chicago 33Columbia 14 Columbia 31
26.92% of the time (% EFFECTIVELY CONNECTED MONTHS PER ELITESCHOOL FUND).
Panel B of Table 3 lists the five universities most attended by the numberof underwriter firm executives and the number of portfolio managers. The mostpopular universities among underwriter executives are Harvard University,attended by 60 underwriter executives in our sample, followed by StanfordUniversity, the University of Pennsylvania, Yale University, and ColumbiaUniversity. Harvard University also leads in the number of portfolio managersgraduated (45), followed by the University of Pennsylvania, New York University,the University of Chicago, and Columbia University.
When we aggregate the connections of individuals from the various univer-sities, we find that individuals from Harvard, Columbia, Pennsylvania, Chicago,and Stanford are the most connected. As shown in Figure 1, Harvard is dominant,with approximately 68.80% of the observations with connections. This is becauseHarvard graduates are highly represented in both top-executive positions in in-vestment banking, approximately 23.63% of our sample of executives, as well as
https://doi.org/10.1017/S0022109018000534D
ownloaded from
https://ww
w.cam
bridge.org/core . NTU
Library , on 14 Jan 2019 at 07:02:27 , subject to the Cambridge Core term
s of use, available at https://ww
w.cam
bridge.org/core/terms .

Hwang, Titman, and Wang 2501
FIGURE 1Top 10 Most Connected Universities
0.0
Harva
rd U
niver
sity
Colum
bia U
niver
sity
Stanfor
d Univ
ersit
y
Yale U
niver
sity
New Y
ork U
niver
sity
Prince
ton U
niver
sity
Duke U
niver
sity
Dartm
outh
Coll
ege
Univer
sity o
f Pen
nsylv
ania
Univer
sity o
f Chic
ago
0.1
0.2
0.3
0.4
0.5
Per
cent
of S
ampl
e 0.6
0.7
0.8
in the portfolio manager positions in our mutual funds, approximately 8.1% ofour sample of portfolio managers.
III. Elite Education and Mutual Fund Performance RevisitedWe start our analysis by revisiting the Chevalier and Ellison (1999) obser-
vation that mutual funds managed by elite portfolio managers outperform theircounterparts who are educated at less elite institutions. Specifically, we run panelregressions of a fund’s risk-adjusted excess return in month t (ALPHA in Table 4)on a dummy indicating whether or not the fund is managed by an elite gradu-ate, along with fund characteristics that include age, assets under management,turnover, expense ratio, and investment style, all of which can plausibly influenceperformance.
Table 4 reports the results. Column 1, which reports the panel regressionover all calendar months in the sample period, shows that elite-school funds sig-nificantly outperform their non-elite counterparts by 4.6 bps per month, or 0.55%per year. The magnitude of the excess performance, which is consistent withChevalier and Ellison (1999), is roughly equivalent to typical mutual fund man-agement fees. When we further separate the sample in columns 2 and 3 by monthswith and without IPOs, we find that the ELITE SCHOOL dummy is significantonly in the subsample with IPO months. However, because we have very fewmonths with no IPOs, we cannot reject the hypothesis that the coefficients of theELITE SCHOOL dummy in the two subsamples are equal.14
14We also ran regressions over two subsamples using the median value of the number of IPOs(NIPO) as the cut-off, and we still did not find the ELITE SCHOOL dummy to be significantly differ-ent between the two subsamples.
https://doi.org/10.1017/S0022109018000534D
ownloaded from
https://ww
w.cam
bridge.org/core . NTU
Library , on 14 Jan 2019 at 07:02:27 , subject to the Cambridge Core term
s of use, available at https://ww
w.cam
bridge.org/core/terms .

2502 Journal of Financial and Quantitative Analysis
TABLE 4Do Elite School Mutual Fund Managers Outperform?
In Table 4 we report regressions of mutual fund risk-adjusted return (ALPHA) on an elite-school dummy and other controlvariables over the Jan. 1992–Mar. 2012 sample period. ALPHA, expressed in percentage, is calculated as ALPHAit ≡rit − rf t −Xt βit , where Xt is a vector of realized returns in month t for each of the 4-factor portfolios (MKTRF, SMB, HML,and UMD), and βit represents fund-specific factor loadings obtained from the whole-sample time-series regression offund excess return over market portfolio on the Carhart (1997) 4 factors. The key independent variable ELITE_SCHOOL isthe binary indicator variable for funds with top-school-graduated managers, which equals 1 if the portfolio manager hasattended one of the top 10 universities ranked by the average SAT score of the freshmen at the portfolio managers’ tertiaryinstitution, and 0 otherwise. Control variables of fund characteristics throughout the regressions include investment-stylefixed effects; the natural logarithm of fund size (ln(TNA)) and fund age (ln(AGE)); EXPENSE_RATIO, which is the annualongoing operating expenses shareholders pay for the mutual fund, expressed as percentage of total investment byshareholders; and TURNOVER_RATIO, which is the minimum of aggregated sales or aggregated purchases of securities,scaled by the average 12-month total net assets (TNA) of the fund. In column 1 we run regressions over all the calendarmonths in our sample period, in column 2 we restrict the regressions to the 222 months that have initial public offering(IPO) activities, and in column 3 we restrict the regressions to the 21 sample months that do not have any IPO activities.All fund characteristics are obtained at the end of month t −1. Robust standard errors (White (1980)) are used and areclustered at the month level. t-statistics are shown in parentheses. *, **, and *** denote significance at the 10%, 5%, and1% levels, respectively.
Dependent Variable: ALPHA
Variable 1 2 3
ELITE_SCHOOL 0.046*** 0.049*** 0.008(2.862) (2.918) (0.131)
ln(TNA) −0.010 −0.007 −0.059(−1.144) (−0.963) (−1.365)
ln(AGE) 0.020 0.015 0.081(0.897) (0.720) (0.660)
EXPENSE_RATIO×100 0.096 −0.418 3.677*(0.226) (−1.168) (1.849)
TURNOVER_RATIO 0.008 0.016 −0.064*(0.607) (1.204) (−2.027)
Constant 0.098 0.113 −0.031(0.554) (0.609) (−0.057)
No. of obs. 84,879 76,794 8,085R 2 0.002 0.003 0.015
Style fixed effects Yes Yes YesSample All months IPO months Non-IPO months
IV. Elite Education, Connections, and IPO AllocationsThe evidence reported in the preceding section confirms Chevalier and
Ellison’s (1999) finding that elite-school funds outperform in our longer andmore recent sample period. As we mentioned in the Introduction, a possible ex-planation is that elite graduates benefit from their connections. In this section weconsider a potential channel that can enable elite graduates to benefit from theirconnections: the allocation of IPOs. We examine whether the connections of elitegraduates increase the number of their IPO allocations as well as the quality oftheir IPO allocations.
A. Elite Education and IPO AllocationsWe first estimate logit regressions of the binary indicator variable
ALLOCATED on the ELITE SCHOOL dummy, deal characteristics, and fundcharacteristics. These regressions examine whether or not a particular mutualfund was allocated a particular IPO, so the dependent variable in the regression,ALLOCATED, equals 1 if the fund holds the stock of any firm that went pub-lic in the prior quarter, and 0 otherwise. As we previously noted, this is a noisysignal of whether or not a fund receives an IPO allocation because funds can sell
https://doi.org/10.1017/S0022109018000534D
ownloaded from
https://ww
w.cam
bridge.org/core . NTU
Library , on 14 Jan 2019 at 07:02:27 , subject to the Cambridge Core term
s of use, available at https://ww
w.cam
bridge.org/core/terms .

Hwang, Titman, and Wang 2503
their allocations before the end of the quarter and can purchase IPOs they are notallocated in the secondary market. If this noise is uncorrelated with the educa-tion of the portfolio manager, it will generate a bias against finding a significantrelation.15
Our first connection measure, CONNECTED, designated as a type I con-nection by Cohen et al. (2008),16 is a dummy variable that equals 1 if the fundmanager and at least one of the underwriter executives attended the same ter-tiary institution, and 0 otherwise. We also define ALLOCATED BEFORE, whichequals 1 if the fund was previously allocated an IPO from the bank underwrit-ing the current deal and 0 otherwise, to capture the past allocation history. As wewill show, both variables, that is, a common educational experience and a pastIPO allocation, predict IPO allocations. In addition, the interaction between thesevariables is quite important. In particular, past allocations are much better indica-tors of future allocations if they are accompanied by common school ties. We saythat a fund is effectively connected (EC) if both dummy variables equal 1.
Panel A of Table 5 presents a set of logit regressions that estimate the rela-tion between whether or not an IPO is allocated to a particular mutual fund andthe education of the mutual fund manager, whether the mutual fund manager hasan educational connection with the IPO underwriter, and whether the mutual fundwas allocated an IPO from the underwriter in the past. In addition to these educa-tion and connection variables, the regressions also include control variables thatdescribe characteristics of the mutual funds and the IPOs. These variables show,for example, that mutual funds are more likely to be allocated shares in largerofferings (because there are more shares to allocate). It should also be noted thatbigger funds are allocated more IPOs, but after controlling for size, older funds areallocated fewer IPOs. Finally, higher turnover is associated with more IPO allo-cations, which is consistent with the idea that IPO allocations are used to rewardmutual funds that generate large trading commissions, as described by Reuter(2006).
The positive coefficient of CONNECTED reported in column 1 of Table 5shows that having an educational connection increases the odds of receiving IPOallocations. Column 2 shows that a fund’s past allocation history, ALLOCATEDBEFORE, is the most important indicator of future IPO allocation decisions,which is not surprising because the past-allocation history essentially captures theeffect of all the factors that influence IPO allocations, including CONNECTED.Column 2 also shows a strong positive interaction between CONNECTED andALLOCATED BEFORE, indicating that the positive impact of a fund’s allocation
15We do not have either evidence or theory about how education will affect the tendency of mutualfunds to flip shares after an allocation.
16Cohen et al. (2008) also adopt the more restrictive definition of connections that requires con-nected individuals to attend the same colleges at the same time or to attend the same schools or depart-ments in the colleges. Because we are considering a relatively small number of underwriters rather thanthe entire sample of corporations, these more restrictive criteria generate very few connections. Ourless restrictive definition captures the connections developed outside of classrooms, such as alumnifunctions that graduates may attend. It is also likely that affinity between individuals who attendedthe same university influences decisions. For example, job recruiters may show favoritism to alums intheir hiring decisions. We conduct a robustness check with a more restrictive definition of connectionsin a later section.
https://doi.org/10.1017/S0022109018000534D
ownloaded from
https://ww
w.cam
bridge.org/core . NTU
Library , on 14 Jan 2019 at 07:02:27 , subject to the Cambridge Core term
s of use, available at https://ww
w.cam
bridge.org/core/terms .

2504 Journal of Financial and Quantitative Analysis
history on the odds of receiving a current allocation is larger when the fund hasan educational connection with the underwriter.
TABLE 5What Determines IPO Allocations?
In Panel A of Table 5, we run logit regressions of the binary indicator variable ALLOCATED on the CONNECTED dummy,deal characteristics, and fund characteristics in column 1. The dependent variable ALLOCATED equals 1 if the fund holdsthe initial public offering (IPO) stock at the end of the quarter of its issuance, and 0 otherwise. The key independent vari-able CONNECTED in column 1 is built in the sameway as described by Cohen et al. (2008) and, in our case, equals 1 if thefund manager and one of the underwriter executives attended the same tertiary institution, and 0 otherwise. As the namesuggests, the independent variable ALLOCATED_BEFORE in column 2 represents the existence of previous allocation ex-perience from the same underwriter; that is, it equals 1 if the fund has received an allocation from the same underwriter inthe past, and 0 otherwise. ALLOCATED_BEFORE×CONNECTED is the interaction term between ALLOCATED_BEFOREand CONNECTED, and it is our key independent variable of effective connection (EC) in column 3 when bothALLOCATED_BEFORE and CONNECTED are equal to 1. The key independent variable EC in columns 3 and 5 is theeffective connection indicator denoting that the fund manager and underwriter executive attended the same school andthe fund received at least one IPO allocation from the same connected underwriter in the past. In column 4 the key inde-pendent variable ELITE_SCHOOL is the binary indicator variable for funds with top-school-graduated managers, whichequals 1 if the portfolio manager has attended one of the top 10 universities ranked by the average SAT score of thefreshmen at the portfolio managers’ tertiary institution, and 0 otherwise. The binary indicator variable AWC in column 6equals 1 if the fund has obtained IPO allocation through the same underwriter in the past and was not educationallyconnected then, and 0 otherwise. Throughout the table, we control for the deal characteristics of the natural logarithmof dollar proceeds (ln(PROCEEDS)). Fund characteristics include investment-style fixed effects; the natural logarithm offund size (ln(TNA)) and fund age (ln(AGE)); EXPENSE_RATIO, which is the annual ongoing operating expenses share-holders pay for the mutual fund, expressed as percentage of total investment by shareholders; and TURNOVER_RATIO,which is the minimum of aggregated sales or aggregated purchases of securities, scaled by the average 12-month totalnet assets (TNA) of the fund. In Panel B we construct a 2×2 probability table that displays the probabilities of allocationfor funds with and without connections and with and without an allocation in past deals. We compute probabilities withthe same set of control variables as in column 2 of Panel A, held at the mean and with the fund style being small-capfunds. In Panel C we construct a 2×2 table that displays the mean initial return of IPO deals for funds with and withoutconnections and with and without an allocation in past deals. We restrict to the subsample of funds with current IPOallocation. In Panel D we employ a subsample of funds whose fund family can be identified and run the same regressionas those in columns 3–5 of Panel A with additional family fixed effects. Standard errors are heteroscedasticity robust andclustered at the month level. Z -statistics are shown in parentheses. The sample period is Jan. 1992–Mar. 2012. *, **, and*** denote significance at the 10%, 5%, and 1% levels, respectively.
Panel A. Dependent Variable: ALLOCATED
Variable 1 2 3 4 5 6
CONNECTED 0.284*** −0.400***(7.831) (−6.931)
ALLOCATED_BEFORE 0.966***(15.143)
ALLOCATED_BEFORE 0.522*** 1.077*** 1.062***×CONNECTED (EC) (6.172) (23.717) (22.377)
AWC 1.118***(32.194)
ELITE_SCHOOL 0.272*** 0.034 0.397***(7.602) (0.870) (11.537)
ln(PROCEEDS) 0.145*** 0.135*** 0.144*** 0.140*** 0.144*** 0.131***(6.257) (5.830) (6.247) (6.101) (6.243) (5.659)
ln(SIZE) 0.351*** 0.345*** 0.340*** 0.364*** 0.340*** 0.358***(15.013) (14.513) (14.303) (15.608) (14.299) (15.154)
ln(TNA) 0.318*** 0.279*** 0.287*** 0.311*** 0.286*** 0.273***(22.985) (20.467) (20.790) (22.515) (20.931) (19.748)
ln(AGE) −0.239*** −0.296*** −0.272*** −0.236*** −0.272*** −0.268***(−8.186) (−9.981) (−9.199) (−8.158) (−9.213) (−9.179)
EXPENSE_RATIO 1.377* 0.645 0.635 1.284* 0.599 0.529×100 (1.911) (0.901) (0.891) (1.807) (0.840) (0.731)
TURNOVER_RATIO 0.027*** 0.017** 0.021*** 0.029*** 0.021*** 0.031***(4.125) (2.553) (3.268) (4.383) (3.280) (4.657)
Constant −5.199*** −5.119*** −5.161*** −5.306*** −5.182*** −5.735***(−23.984) (−23.825) (−24.101) (−24.240) (−23.947) (−25.832)
No. of obs. 457,592 457,592 457,592 457,592 457,592 457,592Pseudo-R 2 0.091 0.109 0.103 0.091 0.103 0.114
Style fixed effects Yes Yes Yes Yes Yes Yes
(continued on next page)
https://doi.org/10.1017/S0022109018000534D
ownloaded from
https://ww
w.cam
bridge.org/core . NTU
Library , on 14 Jan 2019 at 07:02:27 , subject to the Cambridge Core term
s of use, available at https://ww
w.cam
bridge.org/core/terms .

Hwang, Titman, and Wang 2505
TABLE 5 (continued)What Determines IPO Allocations?
Panel B. Probability of IPO Allocations Panel C. Initial Returns
ALLOCATED_BEFORE ALLOCATED_BEFORE
0 1 0 1
CONNECTED 0 2.58% 6.50% CONNECTED 0 33.18% 29.59%1 1.74% 7.28% 1 28.80% 43.73%
Panel D. Funds with Families
Dependent Variable: ALLOCATED
Variable 1 2 3
ELITE_SCHOOL −0.125** −0.247***(−2.353) (−4.536)
EC 0.462*** 0.545***(8.492) (9.782)
ln(PROCEEDS) 0.118*** 0.123*** 0.122***(7.395) (7.686) (7.638)
ln(SIZE) 0.224*** 0.200*** 0.203***(15.695) (13.346) (13.549)
ln(TNA) 0.111*** 0.097*** 0.105***(6.744) (5.985) (6.413)
ln(AGE) 0.048 0.018 0.026(1.388) (0.511) (0.792)
EXPENSE_RATIO×100 0.282 −0.638 −0.039(0.352) (−0.769) (−0.048)
TURNOVER_RATIO −0.228*** −0.235*** −0.208***(−5.710) (−5.962) (−5.246)
Constant 4.164*** 4.079*** 4.307***(15.945) (20.593) (18.705)
No. of obs. 34,178 34,178 34,178Pseudo-R 2 0.371 0.377 0.380
Style fixed effects Yes Yes YesFund-family fixed effects Yes Yes Yes
In column 3 of Table 5 we estimate the column 2 regression without the indi-vidual components of EC, CONNECTED, and ALLOCATED BEFORE. The R2
of this regression is only slightly lower than the column 2 R2, suggesting that thecombined EC variable captures the notion of being connected to the underwriteras well as the individual components.
The estimates reported in column 4 of Table 5, which include theELITE SCHOOL dummy but no connection variables, indicate that mutual fundsmanaged by elite graduates are indeed more likely to be allocated IPOs thantheir non-elite counterparts. However, as illustrated in the column 5 regres-sion, the effect of ELITE SCHOOL is completely subsumed by EC, suggest-ing that elite-school graduates receive better IPO allocations because they aremore likely to be connected to an underwriter. To further corroborate this con-clusion, the regression in column 6 replaces EC with its counterpart, allocationwithout connection (AWC). Because AWC is slightly negatively correlated withELITE SCHOOL, the inclusion of this variable does not affect the significanceof the ELITE SCHOOL effect, providing further evidence of the importance ofschool connections.
To glean more intuition from these coefficient estimates, one can use thecoefficients reported in column 2 of Table 5 to calculate the probabilities of
https://doi.org/10.1017/S0022109018000534D
ownloaded from
https://ww
w.cam
bridge.org/core . NTU
Library , on 14 Jan 2019 at 07:02:27 , subject to the Cambridge Core term
s of use, available at https://ww
w.cam
bridge.org/core/terms .

2506 Journal of Financial and Quantitative Analysis
receiving an IPO allocation for funds conditioned on their previous allocationsand their educational connections. As shown in the 2×2 classification reportedin Panel B of Table 5, EC funds, that is, those with ALLOCATED BEFORE andCONNECTED taking values of 1, have the greatest probability, 7.28%, of receiv-ing allocations of the upcoming IPOs. This probability is larger than the 6.50%probability of receiving a current allocation if the fund is classified as AWC; thatis, ALLOCATED BEFORE takes a value of 1, and CONNECTED takes a valueof 0. It should also be noted that CONNECTED funds that were not allocatedIPOs in the past are actually slightly less likely to be allocated future IPOs thantheir less connected counterparts. This observation, which suggests that many ofthe educational connections have no influence on allocations, was our motiva-tion for combining past allocations and educational connections into a single ECmeasure.
Although the difference in the probability of IPO allocation between ECfunds and AWC funds is small, the difference in the quality of the IPOs, measuredas first-day return (IR), is significantly larger. As shown in Panel C of Table 5,EC funds are allocated IPOs with greater initial returns on average (43.73%) thanthose allocated to AWC funds (29.59%). This could reflect the possibility that con-nections are more important for being allocated the hottest IPOs or, alternatively,that portfolio managers are better positioned to evaluate the IPOs underwritten bybankers with common educational backgrounds and thus are better positioned toaggressively seek the better IPOs.17 In any event, this observation is important forunderstanding the superior performance of EC funds relative to AWC funds.
Finally, Panel D of Table 5 reports regressions that include fund-family fixedeffects. In particular, we add family fixed effects to the regressions reported incolumns 3, 4, and 5 of Panel A and estimate the regressions on the subsample offunds that are part of an identified fund family. These regressions, which allowus to examine whether managers with an elite education receive favorable IPOallocations within their fund families, is motivated by Gaspar et al. (2006) andMassa et al. (2010), who show that fund families may strategically allocate IPOsto favor some funds over others. The regressions reported in columns 1 and 3 ofPanel D are inconsistent with the idea that fund families preferentially allocateIPOs to those funds managed by elite graduates. Indeed, the evidence suggeststhat they do the opposite. However, we find (in columns 2 and 3) that EC fundsdo receive more IPO allocations than NC funds within families.
B. Are Connected Mutual Funds Allocated Better IPOs?As the regressions described in the previous subsection illustrate, EC is a
strong predictor of whether or not a mutual fund is allocated an IPO, and impor-tantly, when we control for EC, elite education does not predict IPO allocations.Hence, when we examine mutual fund returns, controlling for EC should subsumethe elite-education effect if it is indeed the IPO channel that generates the excessreturns of those mutual funds managed by elite graduates. However, before reeval-uating mutual fund returns, we will document that EC mutual funds are even morelikely to be allocated the better-quality IPOs.
17We thank the referee for proposing this alternative interpretation.
https://doi.org/10.1017/S0022109018000534D
ownloaded from
https://ww
w.cam
bridge.org/core . NTU
Library , on 14 Jan 2019 at 07:02:27 , subject to the Cambridge Core term
s of use, available at https://ww
w.cam
bridge.org/core/terms .

Hwang, Titman, and Wang 2507
To estimate whether connected funds are more likely to be allocated thebetter-quality IPOs, we consider two proxies for quality. The first is a direct proxy,IR ADJ, which is the demeaned first-day IPO return. The second is an indirectproxy, HOT MKT, which is an indicator variable measuring whether the IPO isissued in a hot-market period, as defined earlier in Table 2.
To estimate how these quality variables influence IPO allocations, we inter-act them with our EC variables in the regressions that predict IPO allocations.As shown in column 1 of Table 6, the coefficient of EC× IR ADJ (the interactiveterm between EC and IR ADJ) is positive and significant, indicating that EC funds
TABLE 6Are Connected Mutual Funds Allocated Better IPOs?
Table 6 reports logit regressions of the binary indicator variable ALLOCATED on the effective connection (EC) dummy,initial return of deals, deal characteristics, and fund characteristics. The dependent variable ALLOCATED equals 1 ifthe fund is found to hold initial public offering (IPO) stock within the first quarter of its issuance, and 0 otherwise. Theindependent variable, EC, is the effective connection indicator, which equals 1 if the fund manager and underwriterexecutive attended the same school and the fund received at least one IPO allocation from the underwriter in the past. Incolumn 1 we control for the adjusted first-day return of IPO deals, IR_ADJ, which is the demeaned version of IR, as well asthe interaction between EC and IR_ADJ. We introduce themarket condition indicator HOT_MKT and its interaction with ECin column 2. The market condition, that is, the ‘‘hotness’’ of the IPO market, is measured in the way proposed by Ibbotsonet al. (1994), that is, the percentage of deals that are priced above the midpoint of the original file price range. The binaryindicator variable HOT_MKT is equal to 1 if the ‘‘hotness’’ is greater than the sample median over the 1980–2012 period,and 0 otherwise. The deal characteristics include the natural logarithm of dollar proceeds (ln(PROCEEDS)) and logIPO size measured at the end of the IPO month (ln(SIZE)). Fund characteristics include investment-style fixed effects; thenatural logarithm of fund size (ln(TNA)) and fund age (ln(AGE)); EXPENSE_RATIO, which is the annual ongoing operatingexpenses expressed as percentage of total investment by shareholders; and TURNOVER_RATIO, which is the minimumof aggregated sales or aggregated purchases of securities, scaled by the average 12-month total net assets (TNA) ofthe fund. We repeat the logit regression in column 1 in the subsamples of hot and cold IPO markets in columns 3 and 4,respectively. Standard errors are heteroscedasticity robust and clustered at the month level. Z -statistics are shown inparentheses. The sample period is Jan. 1992–Mar. 2012. *, **, and *** denote significance at the 10%, 5%, and 1% levels,respectively.
Dependent Variable: ALLOCATED
Hot Market Cold Market
Variable 1 2 3 4
EC 1.071*** 0.969*** 1.110*** 1.007***(24.910) (13.590) (21.258) (13.930)
IR_ADJ −0.010 −0.108*** 0.471***(−0.253) (−2.823) (4.639)
EC× IR_ADJ 0.135*** 0.178*** 0.029(3.486) (3.938) (0.291)
HOT_MKT −0.039(−0.746)
EC×HOT_MKT 0.179**(1.980)
ln(PROCEEDS) 0.154*** 0.144*** 0.102*** 0.285***(5.852) (6.279) (3.567) (5.208)
ln(SIZE) 0.328*** 0.339*** 0.350*** 0.227***(11.920) (14.074) (10.833) (4.181)
ln(TNA) 0.288*** 0.287*** 0.306*** 0.260***(20.802) (20.894) (17.031) (12.171)
ln(AGE) −0.276*** −0.273*** −0.273*** −0.282***(−9.298) (−9.207) (−7.118) (−5.966)
EXPENSE_RATIO×100 0.678 0.635 1.035 0.052(0.952) (0.894) (1.124) (0.046)
TURNOVER_RATIO 0.021*** 0.021*** 0.023*** 0.024*(3.292) (3.314) (3.209) (1.852)
Constant −5.183*** −5.133*** −5.281*** −4.982***(−23.801) (−23.479) (−21.847) (−11.876)
No. of obs. 453,823 457,592 274,448 177,258Pseudo-R 2 0.103 0.103 0.103 0.107
Style fixed effects Yes Yes Yes Yes
https://doi.org/10.1017/S0022109018000534D
ownloaded from
https://ww
w.cam
bridge.org/core . NTU
Library , on 14 Jan 2019 at 07:02:27 , subject to the Cambridge Core term
s of use, available at https://ww
w.cam
bridge.org/core/terms .

2508 Journal of Financial and Quantitative Analysis
are more likely to be allocated IPOs with higher first-day returns, and the coeffi-cient of IR ADJ is insignificant, suggesting that the allocation to NC funds is notaffected by deal quality. Similarly, as shown in column 2, the positive and signifi-cant coefficient on EC×HOT MKT indicates that the gains from connections arelarger in hot markets,18 and the significantly negative coefficient of HOT MKT in-dicates that NC funds are less likely to receive IPO allocations in hot markets thanin cold markets. The positive and significant coefficient of EC indicates that ECfunds have an edge in receiving allocations over NC funds even in cold markets.
We also run these regressions separately in subsamples of hot and cold mar-kets, which we report in columns 3 and 4 of Table 6, respectively. The juxtapo-sition of these two columns provides a clearer picture: The significant coefficientof EC in both columns indicates that EC funds are more likely to get IPO alloca-tions in both hot and cold markets, but the better allocation of high-quality dealsto EC funds only occurs in hot IPO markets, as indicated by the coefficients ofEC× IR ADJ in the hot and cold markets.
V. IPO Connection and Fund PerformanceUp to this point we have presented evidence that is consistent with the finding
of Chevalier and Ellison (1999) that mutual funds managed by graduates of eliteuniversities outperform their counterparts from less prestigious universities. Weconsider one potential channel that could have generated these excess returns,the allocation of underpriced IPOs, and find that mutual funds managed by elite-school graduates are indeed allocated more IPOs.
In this section, we “connect the dots” and examine the extent to which theexcess mutual fund returns realized by the elite graduates can be attributed totheir superior IPO allocations. We start with panel regressions that more closelyresemble the regressions estimated by Chevalier and Ellison (1999) but also in-clude our measures of mutual fund connections. We also report Fama–MacBeth(1973) regressions that address the same issues. Finally, we present the returns ofan implementable portfolio strategy that uses connected mutual funds to indirectlyexploit the underpricing of IPOs.
A. Panel RegressionsTable 7 reports regressions that are similar to those reported in column 2
of Table 4, but the focus is on the relation between EC and excess returns. Theobservation unit in this regression is the fund-month, so EC takes a value of 1 ifa particular fund is effectively connected to any of the underwriters who conductan IPO in month t , and 0 otherwise. As the regression in column 1 indicates, inmonths in which a mutual fund is connected to an underwriter doing an IPO (i.e.,EC= 1), the fund earns a 0.11% (t=3.76) higher risk-adjusted return than itsnonconnected peers with the same investment style and characteristics.19
18In unreported tests, we explore various definitions of market conditions, including those basedon monthly IPO volume and average underpricing. The results remain qualitatively the same as incolumns 3 and 4 of Table 6.
19As shown in the Supplementary Material, the Table 7 results are robust to clustering the standarderrors at the level of mutual fund investment style.
https://doi.org/10.1017/S0022109018000534D
ownloaded from
https://ww
w.cam
bridge.org/core . NTU
Library , on 14 Jan 2019 at 07:02:27 , subject to the Cambridge Core term
s of use, available at https://ww
w.cam
bridge.org/core/terms .

Hwang, Titman, and Wang 2509
TABLE 7Connections, Elite Education, and Fund Performance
The regressions in Table 7 examine the effect of connections and education on mutual fund performance. We defineeffective connection (EC) as a binary variable that equals 1 if the fund is connected in month t and has received aninitial public offering (IPO) allocation from the same connected underwriter at least once prior to month t . The variableNCNOW_ECBEFORE is a binary indicator variable that takes a value of 1 if the fund was effectively connected before butis not connected in the current month, and 0 otherwise. ELITE_SCHOOL is a binary indicator variable for funds with top-school-graduatedmanagers, which equals 1 if the portfolio manager has attended one of the top 10 universities ranked bythe average SAT score of the freshmen at the portfolio managers’ tertiary institution, and 0 otherwise. The binary indicatorvariable AWC in columns 5 and 8 equals 1 if the fund has obtained an IPO allocation through the same underwriter inthe past and was not educationally connected then, and 0 otherwise. The following fund-characteristic controls areincluded in the regression but are not reported in the table: ln(TNA), the natural logarithm of the total net assets (TNA)of a fund; ln(AGE), the natural logarithm of (1+ fund age); EXPENSE_RATIO, the annual ongoing operating expensesof the mutual fund; and TURNOVER_RATIO, the minimum of aggregated sales or aggregated purchases of securities,scaled by the average 12-month total net assets (TNA) of the fund. The dependent variable ALPHA is calculated asALPHAit ≡ rit − rf t −Xt βit , where Xt is a vector of the realized returns in month t for each of the 4-factor portfolios (MKTRF,SMB, HML, and UMD), and βit represents fund-specific factor loadings estimated from the time-series regression offund excess returns on the 4 factors over the entire sample period. The sample period is Jan. 1992–Mar. 2012. Robuststandard errors (White (1980)) are used and are clustered at the month level, and t-statistics are shown in parentheses.*, **, and *** denote significance at the 10%, 5%, and 1% levels, respectively.
Dependent Variable: ALPHA
Hot Market Cold Market
Variable 1 2 3 4 5 6 7 8
EC 0.112*** 0.144*** 0.084* 0.108*** 0.099***(3.761) (3.670) (1.875) (3.780) (3.063)
NCNOW_ECBEFORE −0.026(−0.752)
ELITE_SCHOOL 0.049*** 0.026 0.054***(2.918) (1.409) (3.210)
AWC 0.055 0.064*(1.625) (1.853)
Constant 0.127 0.147 0.142 0.097 0.100 0.113 0.113 0.079(0.681) (0.793) (0.533) (0.386) (0.535) (0.608) (0.609) (0.423)
No. of obs. 76,794 76,794 38,915 37,879 76,794 76,794 76,794 76,794R 2 0.003 0.002 0.009 0.009 0.003 0.003 0.003 0.003
Fund controls Yes Yes Yes Yes Yes Yes Yes YesStyle fixed effects Yes Yes Yes Yes Yes Yes Yes Yes
The 0.11% monthly excess return of EC funds is more than twice as highas the previously estimated excess return of funds managed by elite graduates.To help us interpret the plausibility of the magnitude of this effect, we provide asimple back-of-the-envelope calculation that uses the observed quarterly holdingsof the mutual funds, along with an assumption about the probability that mutualfunds that are allocated shares in IPOs flip the shares prior to the quarter’s end.
Specifically, we posit that
Monthly return of funds due to IPOs =
mean IR×observed probability of allocation
(1− probability of flipping)
×size of IPO allocation× number of IPO allocations per month.
Assuming that both EC funds and NC funds flip 50% of their IPOs, we cancalculate that the monthly excess return of EC funds due to allocated IPOs=43.73%× (7.28%/0.5)× 0.28%× 11.265= 20 bps and that the monthly returnof NC funds due to allocated IPOs= 32.31%× (2.39%/0.5)× 0.45%× 11.265= 8 bps. The probability of an allocation for EC funds (7.28%) is obtained from
https://doi.org/10.1017/S0022109018000534D
ownloaded from
https://ww
w.cam
bridge.org/core . NTU
Library , on 14 Jan 2019 at 07:02:27 , subject to the Cambridge Core term
s of use, available at https://ww
w.cam
bridge.org/core/terms .

2510 Journal of Financial and Quantitative Analysis
Panel B of Table 5. The probability of an allocation for NC funds (2.39%) isobtained by the weighted average of the probabilities of the other three cells inPanel B of Table 5 with the weight being the number of observations in each cell.The initial returns of EC funds (43.73%) and NC funds (32.31%) are obtained ina similar fashion from Panel C of Table 5. Given these numbers, EC funds gener-ate excess returns from IPO allocations that exceed the NC funds’ excess returnsfrom IPO allocations by approximately 12 bps, which is close to the 11 bps weestimated from Table 7.20
In column 2 of Table 7, we include a dummy variable NCNOW ECBEFOREthat captures the subsample of funds that are not currently connected butwere effectively connected previously. The insignificant coefficient of NCNOWECBEFORE implies that mutual funds do not outperform in month t if they arenot connected to an underwriter that conducts an IPO in month t . In other words,EC funds outperform NC funds only in months in which they are connected tounderwriters taking firms public. This finding indicates that the superior perfor-mance of connected funds is in fact generated by connections to underwritersrather than unobserved mutual fund characteristics. Further evidence is revealedin the regressions reported in columns 3 and 4, which separately examine hot andcold markets. A comparison of the EC coefficient estimates in these columns re-veals that being effectively connected is more important in hot-market periodswhen the IPOs are more underpriced; however, we cannot reject the hypothesisthat these two coefficients are equal.21
In column 5 of Table 7, we introduce the variable AWC, which is the binaryvariable that indicates whether the mutual fund received a previous allocationfrom an underwriter taking a firm public in the upcoming month without the ben-efit of an educational connection. The introduction of this variable does not havea material effect on the coefficient of EC, and the coefficient of AWC is approx-imately half the size of the coefficient of EC and is not statistically significant.The difference in the magnitudes of these coefficients (0.108% for EC funds and0.055% for AWC funds) is noteworthy because higher AWC is also associatedwith greater IPO allocations. However, as we showed in Table 5, the IPOs allo-cated to funds without educational connections tend to have substantially lowerinitial returns (29.59% for AWC funds vs. 43.73% for EC funds). The magnitude
20Note that this derivation ignores the possibility that firms flip part of their IPO allocation. Toaccount for partial flipping we can modify the previous equation as follows:
Monthly return of funds due to IPOs = mean IR×observed probability of allocation
(1− probability of flipping)
×observed IPO holding
(1− degree of partial flipping)
×number of IPO allocations per month.
If we set the probability of flipping and the degree of partial flipping at 0.3, we get very similarresults.
21An alternative definition of hot markets, defined by IPO volume, provides similar point esti-mates for hot and cold markets. These point estimates do turn out to be statistically different fromeach other.
https://doi.org/10.1017/S0022109018000534D
ownloaded from
https://ww
w.cam
bridge.org/core . NTU
Library , on 14 Jan 2019 at 07:02:27 , subject to the Cambridge Core term
s of use, available at https://ww
w.cam
bridge.org/core/terms .

Hwang, Titman, and Wang 2511
of this difference in initial returns is roughly consistent with the difference in themagnitude of the coefficients.22
Column 6 in Table 7 simply reproduces column 2 from Table 4, which repli-cates the Chevalier and Ellison (1999) result, and column 7 adds EC to that re-gression. Our findings suggest that EC, which is statistically significant in thisregression, substantially subsumes the effect of ELITE SCHOOL, which is notstatistically significant in this specification. In column 8, we replace EC with itscounterpart, AWC. The coefficient of AWC is marginally significant in this re-gression, and in contrast to the regression reported in column 7, the coefficient ofELITE SCHOOL remains positive and significant. These regressions are consis-tent with the pattern observed in the Table 5 regressions that examine characteris-tics that predict IPO allocations, reinforcing the observation that school connec-tion is critical to the explanation of the ELITE SCHOOL effect. Furthermore, acomparison of the two tables reveals that combinations of variables that predictIPO allocations also predict returns, suggesting that the excess returns are indeedgenerated by the IPO allocations.23
B. Fama–MacBeth RegressionsThis subsection estimates similar regressions using the Fama and
MacBeth (1973) methodology. The results are reported in Table 8. The depen-dent variable ALPHA and the independent variable EC for fund i are obtained atmonth t , and fund characteristics such as ln(TNA), ln(AGE), EXPENSE RATIO,TURNOVER RATIO, and fund styles are obtained at the end of month t−1.
The results in column 1 of Table 8 are consistent with the panel regressions inTable 7. The Fama–MacBeth (1973) coefficient of EC is positive and significant,but the magnitude is slightly smaller than that of our panel regression estimate.We also note that the superior performance generated by having an effective con-nection is greater in hot IPO markets, as evidenced by the significant coefficienton EC in column 2 and the insignificant coefficient in column 3. These resultsreinforce our earlier findings in columns 3 and 4 of Table 7.24
22Column 5 of Table 7 shows that the excess return of EC over AWC is 0.108%−0.055%=0.53%.Because the observed IPO probability is similar for EC and AWC funds (about 7%), the key differenceis the IPO first-day return (43.73% vs. 29.59%), which is mainly responsible for the difference in fundperformance for EC funds and AWC funds. The following back of the envelope calculation suggeststhat the difference in excess returns of EC and AWC funds is roughly consistent with the difference inthe first-day returns of the IPOs they are allocated:
(IR of EC− IR of AWC)× number of IPOs per month
×actual probability of IPO allocation× average size of IPO allocation
= (43.73%− 29.59%)× 11.265×[0.07/(1− 0.5)]× 0.3% = 0.07%.
23To estimate the robustness of this regression we considered a number of alternative specifica-tions. Specifically, we estimated the regressions in Table 7 with returns before fees, alphas estimatedwith time-varying betas calculated over the previous 36 months, and alphas calculated with factormodels that also include the Pastor and Stambaugh (2003) and Sadka (2006) liquidity factors. Theseregressions generate results that are very similar to those reported.
24One cannot introduce interaction terms in the Fama–MacBeth regression presented in Table 8.We do, however, test for a difference between the EC coefficient in hot and cold IPO markets andcannot reject the hypothesis that the coefficients are equal.
https://doi.org/10.1017/S0022109018000534D
ownloaded from
https://ww
w.cam
bridge.org/core . NTU
Library , on 14 Jan 2019 at 07:02:27 , subject to the Cambridge Core term
s of use, available at https://ww
w.cam
bridge.org/core/terms .

2512 Journal of Financial and Quantitative Analysis
TABLE 8IPO Connection and Fund Performance
Table 8 replicates some of the regressions in Table 7 with Fama andMacBeth (1973) regressions. The dependent variableALPHA and the independent variable EC for fund i are obtained at month t ; fund characteristics such as ln(TNA), ln(AGE),EXPENSE_RATIO, and TURNOVER_RATIO and fund styles are obtained at the end of month t −1. Market conditions aredefined based on the monthly measure of the ‘‘hotness’’ of the initial public offering (IPO) market used by Ibbotson et al.(1994): the percentage of deals that are priced above the midpoint of the original file price range. We define the binaryindicator variable HOT_MKT as equal to 1 if the ‘‘hotness’’ is greater than the sample median over the 1980–2012 period,and 0 otherwise. The dependent variable ALPHA is calculated as ALPHAit ≡ rit − rf t −Xt βit , where Xt is a vector of therealized returns in month t for each of the 4-factor portfolios (MKTRF, SMB, HML, and UMD), and βit represents fund-specific factor loadings estimated from the time-series regression of fund excess returns on the 4 factors over the entiresample period. The cross-sectional estimation is performed using the Fama–MacBeth method over the 222 IPO monthsduring the sample period of Jan. 1992–Mar. 2012; the results appear in column 1. Columns 2 and 3 present the Fama–MacBeth regression results for the subsamples of hot and cold IPO markets. The means of coefficients are presentedwith t-statistics in parentheses. *, **, and *** denote significance at the 10%, 5%, and 1% levels, respectively.
Dependent Variable: ALPHA
Full Sample Hot Market Cold Market
Variable 1 2 3
EC 0.070** 0.109** 0.021(1.971) (2.163) (0.443)
ln(TNA) −0.001 0.006 −0.011(−0.174) (0.527) (−0.976)
ln(AGE) 0.005 −0.011 0.026(0.359) (−0.551) (1.254)
EXPENSE_RATIO×100 −0.095 0.598 −0.940*(−0.241) (1.031) (−1.864)
TURNOVER_RATIO −0.026 −0.015 −0.041(−1.149) (−0.412) (−1.504)
Constant 0.147 0.271 −0.004(0.886) (1.094) (−0.017)
No. of obs. 76,794 38,915 37,879R 2 0.395 0.402 0.387
Style fixed effects Yes Yes Yes
C. Daily Returns and Placebo TestsIf the excess returns of connected funds arise exclusively from IPO alloca-
tions, they should be observed only on the first day that the IPOs trade. To testthis, we repeat Table 8 with daily alphas.
To identify the day the IPO starts to trade, we rely on both CRSP and SDCPlatinum data. There is potentially some ambiguity regarding the IPO date be-cause the date given in SDC Platinum is generally, but not always, 1 day beforethe first trading date in the CRSP data. When there is ambiguity, we sum themutual fund returns on the date identified by the SDC and the following date.In column 1 of Table 9, we regress the daily fund alphas on the IPO dates onEC and other control variables. The highly significant coefficient of EC revealsthat connected funds outperform their nonconnected counterparts by 2 bps on theIPO dates. On average, there are 4.61 IPO days per month in our sample period,so the 2-bps daily premium of an EC fund would translate to a 9.2-bps monthlypremium, which is close to the 11 bps we report in Table 7.
Columns 2–4 of Table 8 present placebo tests that use the fund alphas from 2to 4 days after the IPO dates as the dependent variables. If the excess returnsof the connected funds arise exclusively from IPO allocations, the coefficientof EC should only be significant on the IPO dates. Consistent with the hypoth-esis, the coefficients of EC in columns 2–4 are not reliably different from 0.
https://doi.org/10.1017/S0022109018000534D
ownloaded from
https://ww
w.cam
bridge.org/core . NTU
Library , on 14 Jan 2019 at 07:02:27 , subject to the Cambridge Core term
s of use, available at https://ww
w.cam
bridge.org/core/terms .

Hwang, Titman, and Wang 2513
TABLE 9IPO Connection and Daily Fund Performance
Table 9 presents Fama and MacBeth (1973) regressions of daily mutual fund ALPHA on EC and other control variables.The dependent variable ALPHA is calculated as ALPHAit ≡ rit − rf t −Xt βit , where Xt is a vector of the realized returns ondate t for each of the 4-factor portfolios (MKTRF, SMB, HML, and UMD), and βit represents fund-specific factor loadingsestimated from the time-series regression of daily fund excess returns on the daily 4 factors over the sample periodof Oct. 1998–Mar. 2012. The starting date of the daily mutual fund return series is Oct. 1, 1998. The regressions areestimated on initial public offering (IPO) days and the 4 subsequent days. We use the first trading date that appears inthe Center for Research in Security Prices (CRSP) data as the IPO day. We then take the mutual fund daily alpha, ALPHAit ,from that particular date, expressed in percentage, as the dependent variable in column 1. In column 2, we extract funddaily alphas (expressed in percentage) 1 trading day subsequent to an IPO day, and we exclude observations when theIPO+1 day is an IPO date itself. Similar treatments are used in columns 3–5, whereby daily alphas on the 2–4 tradingdays following the IPO date are taken as dependent variables, respectively, and observations are excluded if the IPO+2to IPO+ 4 day is an IPO date. We define effective connection (EC) as the type of connection when the fund manager andunderwriter executive attended the same school and the fund received at least one IPO allocation from the underwriter inthe past. We therefore aggregate effective connection to the date level to form the EC indicator variable (i.e., EC equals1 if the fund is effectively connected to at least one of the underwriters on a particular day, and 0 otherwise). We controlfor fund characteristics such as ln(TNA), ln(AGE), EXPENSE_RATIO, and TURNOVER_RATIO and fund styles that areobtained at the end of the month prior to IPO. In Panel A, the cross-sectional estimation is performed using the Fama–MacBeth method over the 680 IPO days during the sample period of Oct. 1998–Mar. 2012. In Panels B and C, we runregressions for subsamples based on market conditions. We define the binary indicator variable HOT_MKT as equal to1 if the ‘‘hotness’’ is greater than the sample median over the 1980–2012 period, and 0 otherwise. *, **, and *** denotesignificance at the 10%, 5%, and 1% levels, respectively.
Dependent Variable: ALPHA
IPO Day IPO+1 IPO+2 IPO+3 IPO+4
Variable 1 2 3 4 5
Panel A. All IPO Days
EC 0.019*** 0.006 0.004 0.004 −0.006(2.983) (0.950) (0.786) (0.615) (−1.018)
ln(TNA) 0.002 −0.002 0.001 −0.002 −0.004**(1.630) (−1.494) (0.567) (−1.312) (−2.567)
ln(AGE) −0.000 0.003 −0.003 −0.001 0.003(−0.018) (1.309) (−1.419) (−0.375) (1.343)
EXPENSE_RATIO×100 0.077 −0.079 −0.061 −0.079 −0.163**(1.402) (−1.271) (−1.023) (−1.322) (−2.466)
TURNOVER_RATIO −0.001 −0.003* −0.001 0.000 0.001(−0.548) (−1.817) (−0.487) (0.234) (0.363)
Constant 0.001 0.034* 0.002 0.031 0.009(0.038) (1.661) (0.089) (1.515) (0.426)
No. of obs. 271,384 271,384 271,384 271,384 271,384R 2 0.308 0.315 0.312 0.315 0.308
Style fixed effects Yes Yes Yes Yes Yes
Panel B. Hot IPO Markets
EC 0.022** 0.009 0.009 −0.007 −0.010(2.533) (1.071) (1.242) (−0.859) (−1.120)
ln(TNA) 0.002 −0.002 0.000 −0.002 −0.005***(1.215) (−1.217) (0.129) (−0.801) (−2.606)
ln(AGE) −0.002 0.003 −0.003 −0.002 0.005(−0.552) (0.927) (−1.044) (−0.748) (1.564)
EXPENSE_RATIO×100 0.150* −0.003 −0.002 −0.069 −0.160*(1.929) (−0.029) (−0.023) (−0.789) (−1.707)
TURNOVER_RATIO 0.001 −0.001 0.001 0.001 0.003(0.525) (−0.608) (0.355) (0.439) (1.253)
Constant −0.004 0.020 0.002 0.038 −0.002(−0.151) (0.773) (0.061) (1.410) (−0.092)
No. of obs. 154,976 154,976 154,976 154,976 154,976R 2 0.315 0.323 0.319 0.323 0.312
Style fixed effects Yes Yes Yes Yes Yes(continued on next page)
https://doi.org/10.1017/S0022109018000534D
ownloaded from
https://ww
w.cam
bridge.org/core . NTU
Library , on 14 Jan 2019 at 07:02:27 , subject to the Cambridge Core term
s of use, available at https://ww
w.cam
bridge.org/core/terms .

2514 Journal of Financial and Quantitative Analysis
TABLE 9 (continued)IPO Connection and Daily Fund Performance
Dependent Variable: ALPHA
IPO Day IPO+1 IPO+2 IPO+3 IPO+4
Variable 1 2 3 4 5
Panel C. Cold IPO Markets
EC 0.014 0.000 −0.004 0.021** −0.001(1.575) (0.040) (−0.539) (2.580) (−0.125)
ln(TNA) 0.002 −0.001 0.001 −0.002 −0.001(1.373) (−1.015) (1.224) (−1.612) (−0.456)
ln(AGE) 0.003 0.003 −0.003 0.002 −0.000(1.024) (1.124) (−1.137) (0.628) (−0.183)
EXPENSE_RATIO×100 −0.044 −0.205*** −0.160** −0.096 −0.168**(−0.632) (−2.884) (−2.130) (−1.445) (−2.051)
TURNOVER_RATIO −0.004* −0.005*** −0.004* −0.001 −0.003(−1.734) (−2.602) (−1.677) (−0.271) (−1.387)
Constant 0.008 0.056* 0.002 0.020 0.028(0.262) (1.728) (0.070) (0.626) (0.805)
No. of obs. 116,408 116,408 116,408 116,408 116,408R 2 0.296 0.301 0.299 0.301 0.303
Style fixed effects Yes Yes Yes Yes Yes
We repeat the same test in hot and cold markets in Panels B and C and find thatthe connected funds benefit from IPO allocations only in hot markets.
The fact that evidence of superior performance is only observed on IPO datesprovides further support for our conclusion that the outperformance of connectedfunds arises from favorable IPO allocations. It also provides further evidencethat the methodology of using end-of-quarter holdings as a proxy for allocations,initially used by Gaspar et al. (2006), is a reasonable approximation.25
D. A Trading Strategy Based on Effective ConnectionThe return premium of EC funds we document in Table 7 suggests a trading
strategy that may allow retail investors to indirectly exploit underpricing in theIPO markets. The strategy exploits public information about mutual fund hold-ings, the educational backgrounds of fund managers, most of the top executivesfrom underwriter firms, and scheduled IPO dates. Using this information, we cancreate a trading strategy that buys EC mutual funds at the beginning of everymonth and holds them for 1 month.
Table 10 compares the profits from this strategy to those of an equivalentstrategy that invests in NC funds. For EC (row 1) and NC (row 0) portfolios, weregress the monthly excess return, that is, the equally weighted portfolio returnin excess of the 1-month T-bill rate on the capital asset pricing model (CAPM)market risk factor, the Fama and French (1993) 3 factors, and the Carhart (1997)4 factors. We report the alphas and the beta coefficients on each of the factors
25It should be noted that we also use end of quarter holdings to proxy for past allocation experi-ence to define EC. However, unlike current allocation, past allocation experience is less likely to bemeasured with error consistently. For example, we would mistreat an EC fund consistently as NC fundonly when this fund flips out all IPO shares by the end of the first quarter each time it is allocated IPOshares by its connected underwriters.
https://doi.org/10.1017/S0022109018000534D
ownloaded from
https://ww
w.cam
bridge.org/core . NTU
Library , on 14 Jan 2019 at 07:02:27 , subject to the Cambridge Core term
s of use, available at https://ww
w.cam
bridge.org/core/terms .

Hwang, Titman, and Wang 2515
TABLE 10Trading Strategy Based on Effective Connection
Table 10 presents the alphas and betas of a trading strategy that exploits effective connections. Portfolios are formedby sorting all sample funds every month into one of two bins according to the value of effective connection (EC); then,for the test month t , we compute the monthly average excess return for the two portfolios and regress the excess returnon the monthly market risk factor, as well as the Fama and French (1993) and Carhart (1997) factors. The table presentsthe intercepts from these regressions, alphas, and coefficients on the respective risk factors, as well as the t-statistics(in parentheses). Rows 1 and 0 display the results for EC and NC portfolios, respectively; the ‘‘Difference’’ row presentsthe result of regressing the hedged return of a long/short portfolio of EC and NC portfolios on risk factors. Panels A, B,and C present results for the capital asset pricing model (CAPM), 3-factor, and 4-factor regressions, respectively. Marketconditions are defined based on a monthly measure of the ‘‘hotness’’ of the initial public offering (IPO) market used byIbbotson et al. (1994): the percentage of deals that are priced above the midpoint of the original file price range. Wedefine the binary indicator variable HOT_MKT as equal to 1 if the ‘‘hotness’’ is greater than the sample median over the1980–2012 period, and 0 otherwise. We then use this variable to separate the sample into subsamples of hot and coldmarkets. The sample period is Jan. 1992–Mar. 2012. Robust standard errors (White (1980)) are used. *, **, and *** denotesignificance at the 10%, 5%, and 1% levels, respectively.
Panel A. CAPM ALPHA
Market Condition EC ALPHA MKTRF
All markets 1 0.252*** 1.030***(2.696) (41.974)
0 0.091 0.956***(1.386) (47.163)
Difference 0.157** 0.074***(2.533) (4.005)
Hot IPO markets 1 0.468*** 1.001***(3.301) (24.096)
0 0.201** 0.927***(2.169) (30.790)
Difference 0.259*** 0.075**(2.715) (2.413)
Cold IPO markets 1 0.017 1.047***(0.142) (37.689)
0 −0.019 0.976***(−0.214) (36.371)
Difference 0.034 0.070***(0.430) (3.179)
Panel B. 3-Factor ALPHA
Market Condition EC ALPHA MKTRF SMB HML
All markets 1 0.190*** 0.988*** 0.271*** 0.045*(2.803) (52.642) (8.074) (1.666)
0 −0.011 0.954*** 0.191*** 0.132***(−0.245) (70.706) (9.217) (6.877)
Difference 0.203*** 0.035*** 0.080*** −0.089***(4.106) (2.641) (3.279) (−3.933)
Hot IPO markets 1 0.329*** 0.976*** 0.272*** 0.058(3.473) (31.120) (7.054) (1.464)
0 0.035 0.930*** 0.187*** 0.141***(0.510) (43.703) (7.832) (5.235)
Difference 0.296*** 0.048** 0.084** −0.088**(4.114) (2.188) (2.547) (−2.428)
Cold IPO markets 1 0.034 0.990*** 0.265*** 0.022(0.329) (39.980) (3.939) (0.598)
0 −0.048 0.968*** 0.201*** 0.123***(−0.744) (54.255) (4.257) (4.163)
Difference 0.081 0.021 0.063** −0.101***(1.207) (1.343) (2.213) (−3.750)
(continued on next page)
https://doi.org/10.1017/S0022109018000534D
ownloaded from
https://ww
w.cam
bridge.org/core . NTU
Library , on 14 Jan 2019 at 07:02:27 , subject to the Cambridge Core term
s of use, available at https://ww
w.cam
bridge.org/core/terms .

2516 Journal of Financial and Quantitative Analysis
TABLE 10 (continued)Trading Strategy Based on Effective Connection
Panel C. 4-Factor ALPHA
Market Condition EC ALPHA MKTRF SMB HML UMD
All markets 1 0.193*** 0.987*** 0.272*** 0.044 −0.003(2.847) (51.445) (8.233) (1.622) (−0.177)
0 0.020 0.943*** 0.197*** 0.121*** −0.030***(0.409) (63.831) (10.140) (6.900) (−2.740)
Difference 0.176*** 0.046*** 0.073*** −0.079*** 0.029**(3.796) (3.461) (2.924) (−3.556) (2.157)
Hot IPO markets 1 0.343*** 0.971*** 0.273*** 0.048 −0.012(3.675) (31.582) (7.189) (1.001) (−0.559)
0 0.098 0.910*** 0.190*** 0.103*** −0.048***(1.416) (40.457) (8.164) (4.082) (−3.700)
Difference 0.251*** 0.065*** 0.080** −0.058 0.038**(3.766) (3.270) (2.474) (−1.419) (2.041)
Cold IPO markets 1 0.011 0.994*** 0.256*** 0.019 0.025(0.109) (41.335) (3.728) (0.464) (0.583)
0 −0.044 0.967*** 0.203*** 0.124*** −0.004(−0.685) (57.016) (4.763) (3.842) (−0.152)
Difference 0.054 0.027 0.053 −0.105*** 0.029(0.791) (1.601) (1.546) (−4.067) (1.345)
in Panels A, B, and C, respectively, as well as t-statistics calculated with White(1980) robust standard errors. We also report the alphas and betas of the portfoliothat takes a long position in the EC funds and a short position in the NC funds.These alphas and betas are also reported separately for hot and cold markets.
There are on average 55 EC funds and 348 NC funds per month in oursample. We have 1 EC fund and 84 NC funds in the first sample month, Jan. 1992;49 EC and 256 NC funds in Jan. 2000; and 74 EC and 675 NC funds in Jan. 2008.From row 1 in the “All Markets” sections of Panels A–C, we find that investingin an EC portfolio generates a significant (at the 1% level) monthly abnormal re-turn of approximately 0.25% (t=2.70), or an equivalent 3% annual return usingthe CAPM alpha; 0.19% (t=2.80), or approximately 2.28% annualized abnormalreturn using the 3-factor model; and 2.28% (t=2.85) using the 4-factor model.The insignificant alphas in row 0 of the CAPM, 3-factor, and 4-factor modelsindicate that investing in an NC portfolio will not yield an abnormal return. Thedifference between EC and NC portfolios is 1.92% (t=2.53), 2.40% (t=4.11), or2.04% (t=3.80) per annum, depending on whether we use the CAPM, 3-factor,or 4-factor model, respectively.
The profits from this strategy are generated exclusively in hot-marketperiods. Using the same definition of hot and cold markets detailed in “DealCharacteristics,” we find that in hot IPO markets, the strategy of buying EC fundsyields an annualized abnormal return of 5.64% (t=3.30) for the 1-factor model,3.96% (t=3.47) for the 3-factor model, and 4.08% (t=3.68) for the 4-factormodel. In cold IPO markets, the excess return from investing in an EC portfoliois not significantly different from 0 regardless of the factor model used, whichis consistent with the excess return being generated from allocations of under-priced IPOs. Estimated loadings of the risk factors imply that compared with theirNC peers, the EC funds tend to exhibit a tilt toward small, growth-oriented, and
https://doi.org/10.1017/S0022109018000534D
ownloaded from
https://ww
w.cam
bridge.org/core . NTU
Library , on 14 Jan 2019 at 07:02:27 , subject to the Cambridge Core term
s of use, available at https://ww
w.cam
bridge.org/core/terms .
Hwang, Titman, and Wang 2517
momentum stocks. This is not surprising because EC funds are more likely to beallocated IPOs, which tend to be small growth firms.
VI. Robustness Tests and Extensions
A. Alternative Sources of ConnectionIt is likely that there are some funds that are well connected for reasons other
than the education of their portfolio managers, and these funds may also attract (orprefer) graduates from elite universities. In particular, because of their proximityto investment banks and Ivy League universities, one might expect mutual fundsthat are located in New York and Boston to employ more elite graduates and toalso have more connections with IPO underwriters. One might also expect thelargest fund families to be better connected and to be more attractive for elitegraduates. Our concern is that a relation between big fund families, fund locations,IPO connections, and elite graduates may be spuriously generating our results.
To address this concern, we define two dummy variables: a BIG3 dummy,which takes a value of 1 if a fund belongs to a fund family ranked among the topthree at the end of the year 2000,26 and 0 otherwise, and a NYBOSTON dummy,which takes a value of 1 if a fund is located in either New York or Boston, and 0otherwise.
Panel A of Table 11 shows that elite graduates are indeed more prevalent inthe big fund families as well as in those funds located in New York and Boston.Specifically, 80.61% of the fund managers in the BIG3 families come from eliteschools versus 44.53% in the non-BIG3 families, and 63.97% of the New Yorkand Boston fund managers come from elite schools versus 43.21% in other cities.Similarly, 35.08% of BIG3 fund managers are connected to the underwriters thatconduct IPOs in a given month, versus 11.30% for those outside of the BIG3. Thecorresponding numbers are 24.00% and 10.46%, respectively, for funds in NewYork and Boston versus other cities.
Panel B of Table 11 revisits the return results from Table 7. In the col-umn 1 regression, which includes a BIG3 dummy, the coefficient of EC is stillsignificant; the coefficient of BIG3 is insignificant, as is the coefficient of theEC and BIG3 interaction. The results in column 2 indicate that there is a signif-icant NYBOSTON effect, as indicated by the significant positive coefficient ofNYBOSTON: Mutual funds located in New York and Boston appear to outper-form by approximately 7.8 bps per month; however, the coefficient of EC is stillsignificant in this regression, and there is no significant interaction between ECand NYBOSTON, suggesting that the connections between IPO underwriters andmutual funds in New York and Boston are no different than they are in other cities.We draw similar conclusions from the regressions in column 3, which control forBIG3 and NYBOSTON effects simultaneously.
Columns 4–6 of Table 11 have the same specifications as those in columns1–3 except that the EC dummy has been replaced with the ELITE SCHOOLdummy. We find that the elite effects in all columns are close to the results reported
26The top-three mutual fund families ranked by the asset under management at the end of year2000 are Fidelity, Vanguard, and American Funds.
https://doi.org/10.1017/S0022109018000534D
ownloaded from
https://ww
w.cam
bridge.org/core . NTU
Library , on 14 Jan 2019 at 07:02:27 , subject to the Cambridge Core term
s of use, available at https://ww
w.cam
bridge.org/core/terms .
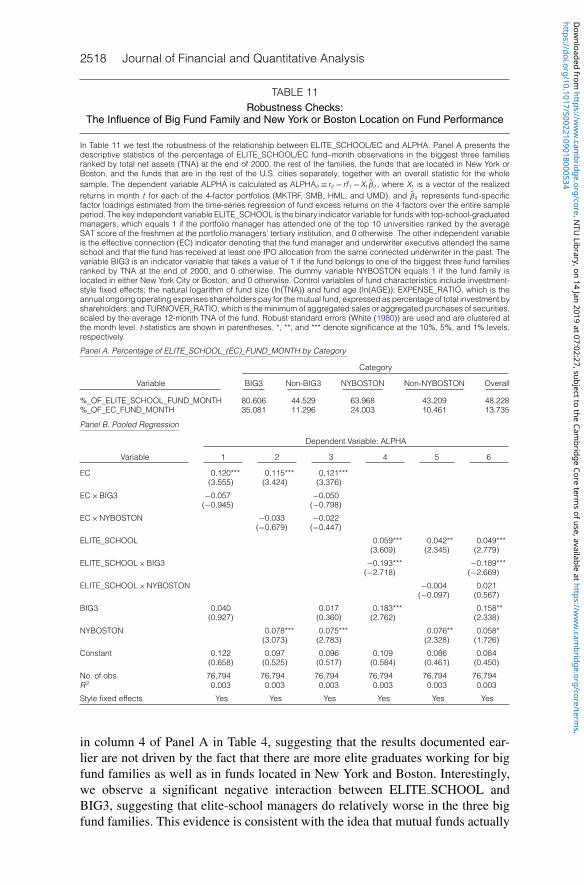
2518 Journal of Financial and Quantitative Analysis
TABLE 11Robustness Checks:
The Influence of Big Fund Family and New York or Boston Location on Fund Performance
In Table 11 we test the robustness of the relationship between ELITE_SCHOOL/EC and ALPHA. Panel A presents thedescriptive statistics of the percentage of ELITE_SCHOOL/EC fund–month observations in the biggest three familiesranked by total net assets (TNA) at the end of 2000, the rest of the families, the funds that are located in New York orBoston, and the funds that are in the rest of the U.S. cities separately, together with an overall statistic for the wholesample. The dependent variable ALPHA is calculated as ALPHAit ≡ rit − rf t −Xt βit , where Xt is a vector of the realizedreturns in month t for each of the 4-factor portfolios (MKTRF, SMB, HML, and UMD), and βit represents fund-specificfactor loadings estimated from the time-series regression of fund excess returns on the 4 factors over the entire sampleperiod. The key independent variable ELITE_SCHOOL is the binary indicator variable for funds with top-school-graduatedmanagers, which equals 1 if the portfolio manager has attended one of the top 10 universities ranked by the averageSAT score of the freshmen at the portfolio managers’ tertiary institution, and 0 otherwise. The other independent variableis the effective connection (EC) indicator denoting that the fund manager and underwriter executive attended the sameschool and that the fund has received at least one IPO allocation from the same connected underwriter in the past. Thevariable BIG3 is an indicator variable that takes a value of 1 if the fund belongs to one of the biggest three fund familiesranked by TNA at the end of 2000, and 0 otherwise. The dummy variable NYBOSTON equals 1 if the fund family islocated in either New York City or Boston, and 0 otherwise. Control variables of fund characteristics include investment-style fixed effects; the natural logarithm of fund size (ln(TNA)) and fund age (ln(AGE)); EXPENSE_RATIO, which is theannual ongoing operating expenses shareholders pay for themutual fund, expressed as percentage of total investment byshareholders; and TURNOVER_RATIO, which is the minimum of aggregated sales or aggregated purchases of securities,scaled by the average 12-month TNA of the fund. Robust standard errors (White (1980)) are used and are clustered atthe month level. t-statistics are shown in parentheses. *, **, and *** denote significance at the 10%, 5%, and 1% levels,respectively.
Panel A. Percentage of ELITE_SCHOOL_(EC)_FUND_MONTH by Category
Category
Variable BIG3 Non-BIG3 NYBOSTON Non-NYBOSTON Overall
%_OF_ELITE_SCHOOL_FUND_MONTH 80.606 44.529 63.968 43.209 48.228%_OF_EC_FUND_MONTH 35.081 11.296 24.003 10.461 13.735
Panel B. Pooled Regression
Dependent Variable: ALPHA
Variable 1 2 3 4 5 6
EC 0.120*** 0.115*** 0.121***(3.555) (3.424) (3.376)
EC×BIG3 −0.057 −0.050(−0.945) (−0.798)
EC×NYBOSTON −0.033 −0.022(−0.679) (−0.447)
ELITE_SCHOOL 0.059*** 0.042** 0.049***(3.609) (2.345) (2.779)
ELITE_SCHOOL×BIG3 −0.193*** −0.189***(−2.718) (−2.669)
ELITE_SCHOOL×NYBOSTON −0.004 0.021(−0.097) (0.567)
BIG3 0.040 0.017 0.183*** 0.158**(0.927) (0.360) (2.762) (2.338)
NYBOSTON 0.078*** 0.075*** 0.076** 0.058*(3.073) (2.783) (2.328) (1.726)
Constant 0.122 0.097 0.096 0.109 0.086 0.084(0.658) (0.525) (0.517) (0.584) (0.461) (0.450)
No. of obs. 76,794 76,794 76,794 76,794 76,794 76,794R 2 0.003 0.003 0.003 0.003 0.003 0.003
Style fixed effects Yes Yes Yes Yes Yes Yes
in column 4 of Panel A in Table 4, suggesting that the results documented ear-lier are not driven by the fact that there are more elite graduates working for bigfund families as well as in funds located in New York and Boston. Interestingly,we observe a significant negative interaction between ELITE SCHOOL andBIG3, suggesting that elite-school managers do relatively worse in the three bigfund families. This evidence is consistent with the idea that mutual funds actually
https://doi.org/10.1017/S0022109018000534D
ownloaded from
https://ww
w.cam
bridge.org/core . NTU
Library , on 14 Jan 2019 at 07:02:27 , subject to the Cambridge Core term
s of use, available at https://ww
w.cam
bridge.org/core/terms .

Hwang, Titman, and Wang 2519
have a higher bar for the intellect of those hired from the less elite schools becausethey tend to contribute less in terms of connections. If this is the case, and if theIPO allocations are allocated centrally in the big fund families,27 then we mightexpect the smarter but less connected portfolio managers to outperform.28
Finally, as we noted earlier, a large fraction of the effectively connectedmutual fund managers are Harvard graduates. We were curious about whethera Harvard connection is better or worse than other connections and found that theprobability of a connected Harvard graduate being allocated an IPO is somewhatless than the probability of a connected non-Harvard graduate being allocated anIPO. We conjecture that this is because the Harvard connections are much moreprevalent than, say, connections between two Brown graduates, suggesting thatthe tie may not be as strong when they are connected. However, given the muchgreater number of connections, the Harvard degree still may be more valuable.
B. Alternative Measures of ConnectionTo address the robustness of our results with respect to the definition of
school connection, we explore more restrictive alternative definitions of schoolties. Specifically, other than CONNECTED, the connection variable we have usedup to now, we also define CONNECTED2, which equals 1 if CONNECTEDequals 1 and, in addition, the fund manager attains the same degree as one ofthe underwriter executives, for example, an MBA and 0 otherwise. We also de-fine CONNECTED3, which equals 1 if CONNECTED equals 1 and, in addition,the fund manager graduated at around the same time and 0 otherwise. Finally,we define CONNECTED4, which equals 1 if CONNECTED1, CONNECTED2,and CONNECTED3 each equal 1, and 0 otherwise. For the reason mentionedin footnote 15, the percentage of fund observations with these more restrictiveconnections drops significantly. The percentage of fund observations defined asconnected based on CONNECTED is 43.50%, it drops to 36.61%, 15.70%, and9.92% when the connection is based on CONNECTED2, CONNECTED3, andCONNECTED4, respectively.
Using these alternative measures, we repeat our main tests in the logit regres-sion of IPO allocation in Panel A of Table 12 and the panel regression of mutualfund performance in Panel B. All of the four types of connections are significantin these two regressions in Panels A and B, but the precision of the estimatesbecomes less reliable with CONNECTED3 and CONNECTED4 because of thedrop in the number of fund observations that are connected when we adopt themore restrictive definitions of connection.
VII. ConclusionOn average, graduates from elite universities have better analytical ability
than those from less elite universities. This does not mean that, conditioned onbeing a mutual fund portfolio manager, a graduate from an elite university islikely to be smarter than his or her counterparts from less elite universities. If the
27We were able to confirm that this is indeed the case at Fidelity.28In unreported regressions (available from the authors) we replicate our analysis excluding data
from the three largest mutual fund families and mutual funds from New York and Boston.
https://doi.org/10.1017/S0022109018000534D
ownloaded from
https://ww
w.cam
bridge.org/core . NTU
Library , on 14 Jan 2019 at 07:02:27 , subject to the Cambridge Core term
s of use, available at https://ww
w.cam
bridge.org/core/terms .

2520 Journal of Financial and Quantitative Analysis
TABLE 12Robustness Checks: Alternative Measures of Educational Connection
In Panel A of Table 12, we test the four alternative measures of educational connection as described by Cohen et al.(2008) in the logit regression in Panel A of Table 5, and in Panel B we test these measures in the panel regressionof Table 7. In Panel A, the dependent variable ALLOCATED equals 1 if the fund holds the initial public offering (IPO)stock at the end of the quarter of its issuance, and 0 otherwise; in Panel B, the dependent variable ALPHA is cal-culated as ALPHAit ≡ rit − rf t −Xt βit , where Xt is a vector of the realized returns in month t for each of the 4-factorportfolios (MKTRF, SMB, HML, and UMD), and βit represents fund-specific factor loadings estimated from the time-series regression of fund excess returns on the 4 factors over the entire sample period. The key independent variableCONNECTED1 in column 1 is built in the same way as described by Cohen et al. (2008) and, in our case, equals 1 ifthe fund manager and one of the underwriter executives attended the same tertiary institution, and 0 otherwise. Similarly,CONNECTED2 equals 1 if CONNECTED1 equals 1 and, in addition, the fund manager attains the same degree as one ofthe underwriter executives. CONNECTED3 equals 1 if CONNECTED1 equals 1 and, in addition, the fund manager grad-uated at approximately the same time. CONNECTED4 equals 1 if CONNECTED1, CONNECTED2, and CONNECTED3all equal 1, and 0 otherwise. Throughout the table, we control for the deal characteristics of the natural logarithm ofdollar proceeds (ln(PROCEEDS)). Control variables of fund characteristics include investment-style fixed effects; thenatural logarithm of fund size (ln(TNA)) and fund age ln(AGE)); EXPENSE_RATIO, which is the annual ongoing operat-ing expenses shareholders pay for the mutual fund, expressed as percentage of total investment by shareholders; andTURNOVER_RATIO, which is the minimum of aggregated sales or aggregated purchases of securities, scaled by theaverage 12-month total net assets (TNA) of the fund. Robust standard errors (White (1980)) are used and are clusteredat the month level. t-statistics are shown in parentheses. *, **, and *** denote significance at the 10%, 5%, and 1% levels,respectively.
Variable 1 2 3 4
Panel A. Dependent Variable: ALLOCATED
CONNECTED1 0.284***(7.831)
CONNECTED2 0.286***(7.495)
CONNECTED3 0.253***(4.451)
CONNECTED4 0.326***(4.778)
Constant −5.199*** −5.155*** −5.138*** −5.130***(−23.984) (−23.884) (−23.886) (−23.862)
No. of obs. 457,592 457,592 457,592 457,592
Fund controls Yes Yes Yes YesDeal controls Yes Yes Yes YesStyle fixed effects Yes Yes Yes Yes
Pseudo-R 2 0.0908 0.0906 0.0897 0.0898
Panel B. Dependent Variable: ALPHA
CONNECTED1 0.079***(3.200)
CONNECTED2 0.085***(3.146)
CONNECTED3 0.057**(2.193)
CONNECTED4 0.064*(1.805)
Constant 0.110 0.118 0.135 0.140(0.586) (0.634) (0.724) (0.753)
No. of obs. 76,794 76,794 76,794 76,794R 2 0.003 0.003 0.003 0.003
Fund controls Yes Yes Yes YesStyle fixed effects Yes Yes Yes Yes
distribution of analytical ability at elite universities and non-elite universities over-lap, then mutual funds should be able to find individuals who match the abilitiesof elite graduates from, say, the top 1% of the graduates of large state institu-tions. In contrast, given the concentration of talent at the elite schools, the typicalelite graduate is likely to be better connected than even the most connected grad-uates of the lower-tier schools. As a result, although we see no reason to expect
https://doi.org/10.1017/S0022109018000534D
ownloaded from
https://ww
w.cam
bridge.org/core . NTU
Library , on 14 Jan 2019 at 07:02:27 , subject to the Cambridge Core term
s of use, available at https://ww
w.cam
bridge.org/core/terms .

Hwang, Titman, and Wang 2521
portfolio managers from elite universities to have better analytical ability thantheir non-elite counterparts, the elite grads are likely to be better connected. In-deed, mutual funds may rationally hire elite graduates with less analytical ability,given the compensating benefits that can be generated by their connections.
The evidence in this article suggests that the characterization just describedprovides a plausible description of the portfolio managers of active equity mu-tual funds. We replicate the Chevalier and Ellison (1999) finding that mutual fundmanagers from elite universities perform better, and we show that the better per-formance can be attributed to their better connections. Specifically, their perfor-mance is generated from their being allocated more underpriced IPOs.
We also show that retail investors, who may otherwise be shut out of theIPO market, can indirectly take advantage of IPO underpricing with a strategythat buys mutual funds that are managed by individuals who may be connected tothe underwriters of upcoming IPOs. It is worth mentioning that the returns fromthis strategy are comparable to those of other mutual fund strategies that have beendocumented in the literature. Examples include Kacperczyk et al. (2005), who findthat the most concentrated funds earn an annual abnormal return of approximately2.12%; Kacperczyk and Seru (2007), who document a performance gap of 2.16%between managers in the top 30% and bottom 30% of their RPI (reliance on publicinformation) measures; Kacperczyk et al. (2008), who document a 3.41% returndifference between the top- and bottom-decile portfolios based on their return gapmeasure; and Cremers and Petajisto (2009), who document a 2.55% excess returnwith their active share measure.
As we mentioned in the Introduction, this article also contributes to a grow-ing literature that studies the benefits of social connections in the finance industry.It should be noted that we find that educational ties explain IPO allocations eventhough our measure may be a very rough proxy for direct social connections; thatis, we observe the colleges attended by the issuing banks’ top executives ratherthan the colleges attended by the individuals who actually make the allocations.One possibility is that the top executives in these banks do in fact influence IPOallocations, and another possibility is that the educational backgrounds of a bank’stop executives are either pretty good proxies for the educational backgrounds ofthe lower-level managers or that the educational backgrounds of the executivesinfluence the bank culture in other ways. The exact channel by which these linksinfluence behavior is beyond the scope of the current study; however, by linkingthese connections to mutual fund performance, we can very roughly quantify thevalue that connections can generate. For example, the typical mutual fund man-aged by an elite graduate had approximately $2 to $3 billion in assets and realizedrisk-adjusted excess returns of approximately 55 bps per year from their IPO allo-cations. Hence, their elite educations could conceivably generate several milliondollars per year and may thus rationalize the very high return to “talent” in thisindustry.
Supplementary MaterialSupplementary material for this article is available at https://doi.org/10.1017/
S0022109018000534.
https://doi.org/10.1017/S0022109018000534D
ownloaded from
https://ww
w.cam
bridge.org/core . NTU
Library , on 14 Jan 2019 at 07:02:27 , subject to the Cambridge Core term
s of use, available at https://ww
w.cam
bridge.org/core/terms .

2522 Journal of Financial and Quantitative Analysis
Appendix
TABLE A1List of Underwriters in the Sample
Table A1 provides a list of the underwriters included in the sample. We start with all of the underwriters involved in dealsduring the sample period of Jan. 1992–Mar. 2012 and extract the PERMNO for each underwriter firm from the Centerfor Research in Security Prices (CRSP) data based on the Committee on Uniform Securities Identification Procedures(CUSIP) number. We get the historical information on senior executives from ExecuComp, which provides compensationand employment information for up to nine executives per firm. This information is supplemented by the Corporate Libraryfrom 2000. The sample of underwriters is further limited by the availability of relevant educational information; that is, wekeep only the senior executives we know graduated from U.S. universities. The variable SDATE denotes the later oftwo dates: the date of the first IPO underwritten by the bookrunner during the sample period or the start date of thePERMNO–bookrunner name link in CRSP. EDATE represents the earlier of the date of the last IPO deal underwritten bythe underwriter or the end of the PERMNO–bookrunner link, which may happen when the underwriter goes bankrupt or isacquired by another bank. The dash (‘‘—’’) indicates that the start date is earlier than the start date of our sample periodor later than the end date of our sample period. The variable IS_TOP_10 is a binary indicator variable that takes a valueof 1 if the underwriter is among the top 10 underwriters, ranked by number of deals during the sample period, and 0otherwise.
PERMNO Bookrunner SDATE EDATE IS_TOP_10
10071 Alex Brown & Sons Inc. — Aug. 29, 1997 136469 First Union Capital Markets Group — Dec. 31, 2008 038703 Wells Fargo Bank NA Nov. 3, 1998 Dec. 31, 2012 047159 Fleet Boston Apr. 20, 1992 Mar. 31, 2004 047248 Westfield Financial Corporation Oct. 3, 2001 — 047896 Chase Manhattan Jan. 2, 2001 Dec. 31, 2012 148071 Morgan JP Co. Inc. — Dec. 29, 2000 150200 Wachovia Securities Inc. — Aug. 31, 2001 054463 PaineWebber Inc. — Nov. 3, 2000 059408 Banc of America Securities LLC Oct.1, 1998 — 063220 Dain Rauscher Wessels — Jan. 10, 2001 064995 KeyCorp/McDonald Investments — — 065330 Legg Mason & Co. Inc. — — 066157 US Bancorp Piper Jaffray Inc. May 2, 1998 Jan. 1, 2004 068144 Robinson-Humphrey Co. — — 068304 Bear Stearns & Co. Inc. — May 30, 2008 069032 Morgan Stanley — — 169649 Raymond James & Associates Inc. — — 070519 Citigroup Oct. 8, 1998 — 072726 State Street Capital Markets Corp. — — 072996 Stifel Nicolaus & Co. Inc. — — 077043 Southwest Securities Group Inc. Oct. 11, 1991 — 078946 Dean Witter Reynolds Inc. Feb. 23, 1993 May 30, 1997 080599 Lehman Brothers May 31, 1994 Sept. 17, 2008 183823 Hambrecht & Quist Inc. Aug. 9, 1996 Dec. 10, 1999 185653 Friedman Billings Ramsey Group Dec. 23, 1997 June 9, 2009 085944 Tucker Anthony Inc. Apr. 2, 1998 Oct. 31, 2001 086868 Goldman Sachs & Co. May 4, 1999 — 189195 Principal Financial Securities Inc. Oct. 23, 2001 — 089826 Texas Capital Securities Inc. Aug. 13, 2003 — 089968 Piper Jaffray Cos Jan. 2, 2004 — 0
ReferencesBenveniste, L. M., and P. A. Spindt. “How Investment Bankers Determine the Offer Price and Alloca-
tion of New Issues.” Journal of Financial Economics, 24 (1989), 343–361.Benveniste, L. M., and W. J. Wilhelm. “A Comparative Analysis of IPO Proceeds under Alternative
Regulatory Environments.” Journal of Financial Economics, 28 (1990), 173–207.Carhart, M. M. “On Persistence in Mutual Fund Performance.” Journal of Finance, 52 (1997), 57–82.Celerier, C., and B. Vallee. “Are Bankers Worth Their Pay? Evidence from a Talent Measure.” Working
Paper, University of Zurich (2015).Chevalier, J., and G. Ellison. “Are Some Mutual Fund Managers Better than Others? Cross-Sectional
Patterns in Behavior and Performance.” Journal of Finance, 54 (1999), 875–899.Cohen, L.; A. Frazzini; and C. Malloy. “The Small World of Investing: Board Connections and Mutual
Fund Returns.” Journal of Political Economy, 116 (2008), 951–979.Cohen, L.; A. Frazzini; and C. Malloy. “Sell-Side School Ties.” Journal of Finance, 65 (2010),
1409–1437.Cremers, K. J. M., and A. Petajisto. “How Active Is Your Fund Manager? A New Measure That
Predicts Performance.” Review of Financial Studies, 22 (2009), 3329–3365.
https://doi.org/10.1017/S0022109018000534D
ownloaded from
https://ww
w.cam
bridge.org/core . NTU
Library , on 14 Jan 2019 at 07:02:27 , subject to the Cambridge Core term
s of use, available at https://ww
w.cam
bridge.org/core/terms .

Hwang, Titman, and Wang 2523
Engelberg, J.; P. Gao; and C. A. Parsons. “Friends with Money.” Journal of Financial Economics, 103(2012), 169–188.
Engelberg, J.; P. Gao; and C. A. Parsons. “The Price of a CEO’s Rolodex.” Review of Financial Studies,26 (2013), 79–114.
Fama, E. F., and K. R. French. “Common Risk Factors in the Returns on Stocks and Bonds.” Journalof Financial Economics, 33 (1993), 3–56.
Fama, E. F., and J. D. MacBeth. “Risk, Return, and Equilibrium: Empirical Tests.” Journal of PoliticalEconomy, 81 (1973), 607–636.
Gaspar, J.-M.; M. Massa; and P. Matos. “Favoritism in Mutual Fund Families? Evidence on StrategicCross-Fund Subsidization.” Journal of Finance, 61 (2006), 73–104.
Goldin, C., and L. Katz. “Transitions: Career and Family Life Cycles of the Educational Elite.” Amer-ican Economic Review, 98 (2008), 363–369.
Grinblatt, M., and S. Titman. “Mutual Fund Performance: An Analysis of Quarterly Portfolio Hold-ings.” Journal of Business, 62 (1989), 393–416.
Hochberg, Y. V.; A. Ljungqvist; and Y. Lu. “Whom You Know Matters: Venture Capital Networks andInvestment Performance.” Journal of Finance, 62 (2007), 251–301.
Hochberg, Y. V.; A. Ljungqvist; and Y. Lu. “Networking as a Barrier to Entry and the CompetitiveSupply of Venture Capital.” Journal of Finance, 65 (2010), 829–859.
Hwang, B.-H., and S. Kim. “It Pays to Have Friends.” Journal of Financial Economics, 93 (2009),138–158.
Ibbotson, R. G.; J. L. Sindelar; and J. R. Ritter. “Initial Public Offerings.” Journal of Applied Corpo-rate Finance, 1 (1988), 37–45.
Ibbotson, R. G.; J. L. Sindelar; and J. R. Ritter. “The Market’s Problems with the Pricing of InitialPublic Offerings.” Journal of Applied Corporate Finance, 7 (1994), 66–74.
Jensen, M. C. “The Performance of Mutual Funds in the Period 1945–1964.” Journal of Finance, 23(1968), 389–416.
Kacperczyk, M., and A. Seru. “Fund Manager Use of Public Information: New Evidence on Manage-rial Skills.” Journal of Finance, 62 (2007), 485–528.
Kacperczyk, M.; C. Sialm; and L. Zheng. “On the Industry Concentration of Actively Managed EquityMutual Funds.” Journal of Finance, 60 (2005), 1983–2011.
Kacperczyk, M.; C. Sialm; and L. Zheng. “Unobserved Actions of Mutual Funds.” Review of FinancialStudies, 21 (2008), 2379–2416.
Kaplan, S., and J. Rauh. “Wall Street and Main Street: What Contributes to the Rise in the HighestIncomes?” Review of Financial Studies, 23 (2010), 1004–1050.
Li, H.; X. Zhang; and R. Zhao. “Investing in Talents: Manager Characteristics and Hedge Fund Per-formances.” Journal of Financial Quantitative and Analysis, 46 (2011), 59–82.
Loughran, T., and J. R. Ritter. “Why Don’t Issuers Get Upset about Leaving Money on the Table inIPOs?” Review of Financial Studies, 15 (2002), 413–444.
Massa, M.; J. Reuter; and E. Zitzewitz. “When Should Firms Share Credit with Employees? Evi-dence from Anonymously Managed Mutual Funds.” Journal of Financial Economics, 95 (2010),400–424.
Oyer, P. “The Making of an Investment Banker: Stock Market Shocks, Career Choice, and LifetimeIncome.” Journal of Finance, 63 (2008), 2601–2628.
Pastor, L., and R. F. Stambaugh. “Liquidity Risk and Expected Stock Returns.” Journal of PoliticalEconomy, 111 (2003), 642–685.
Philippon, T., and A. Reshef. “Wages and Human Capital in the U.S. Finance Industry: 1909–2006.”Quarterly Journal of Economics, 127 (2012), 1551–1609.
Philippon, T., and A. Reshef. “An International Look at the Growth of Modern Finance.” Journal ofEconomic Perspectives, 27 (2013), 73–96.
Reuter, J. “Are IPO Allocations for Sale? Evidence from Mutual Funds.” Journal of Finance, 61(2006), 2289–2324.
Ritter, J. R., and D. Zhang. “Affiliated Mutual Funds and the Allocation of Initial Public Offerings.”Journal of Financial Economics, 86 (2007), 337–368.
Sadka, R. “Momentum and Post-Earnings-Announcement Drift Anomalies: The Role of LiquidityRisk.” Journal of Financial Economics, 80 (2006), 309–349.
Shue, K. “Executive Networks and Firm Policies: Evidence from the Random Assignment of MBAPeers.” Review of Financial Studies, 26 (2013), 1401–1442.
Wermers, R. “Mutual Fund Performance: An Empirical Decomposition into Stock-Picking Talent,Style, Transactions Costs, and Expenses.” Journal of Finance, 55 (2000), 1655–1703.
White, H. “A Heteroskedasticity-Consistent Covariance Matrix Estimator and a Direct Test forHeteroskedasticity.” Econometrica, 48 (1980), 817–838.
https://doi.org/10.1017/S0022109018000534D
ownloaded from
https://ww
w.cam
bridge.org/core . NTU
Library , on 14 Jan 2019 at 07:02:27 , subject to the Cambridge Core term
s of use, available at https://ww
w.cam
bridge.org/core/terms .