irs tjoint iopu monary rkshop - NASA · cardiopulmonary adaptation to microgravity so that health...
188
I I u,:. 10068 Conference Puu,_.ation (NASA-CP-IO068) PROCEEDINGS OF THE FIRST JOINT NASA CARDIOPULMONARY WORKSHOP (Krug Life sciences) 171 p irs_t ...................... joint iopu monary rkshop -!!!!!!!!_!!!!! _L ....... N94-I1991 --THRU-- N94-12007 Uncl as G3/52 0182923 at https://ntrs.nasa.gov/search.jsp?R=19940007519 2018-05-29T09:31:27+00:00Z
Transcript of irs tjoint iopu monary rkshop - NASA · cardiopulmonary adaptation to microgravity so that health...

I
I
u,:. 10068Conference Puu,_.ation
(NASA-CP-IO068) PROCEEDINGS OF THEFIRST JOINT NASA CARDIOPULMONARY
WORKSHOP (Krug Life sciences)
171 p
irs_t.........................jointiopu monary
rkshop-!!!!!!!!_!!!!!
_L .......
N94-I1991
--THRU--
N94-12007
Uncl as
G3/52 0182923
at
https://ntrs.nasa.gov/search.jsp?R=19940007519 2018-05-29T09:31:27+00:00Z


NASA Conference Publication 10068
Proceeding of the First JointNASA _ardlopulmonary
Workshop
Suzanne Fortney, Ph.D. and
Alan R. Hargens, Ph.D., Editors
NASA Lyndon B. Johnson Space Center
Houston, Texas
Proceedings of a workshop sponsored by the
National Aeronautics and Space Administration,
Washington, D.C., and cosponsored by
Lyndon B. Johnson Space Center and
KRUG Life Sciences
Houston, Texas
December 5- 7, 1990
N/ SANational Aeronautics and
Space Administration
April 1991
f,) .INTENTIONALLYBI_NIt

_ _ _ =_ _ _ii_ i_
V

CONTENTS
Program ..............................................................................
Participants .................................... :"" """ :'" .......... :" " " " .............,
Introduction .........................................................................
vii
ix
xi
xii
Glycerol-induced Hyperhydration ......................................................
Spectral Analysis of Resting Cardiovascular Variables and Responsesto Oscillatory LBNP Before and After 6 Degree Head Down Bedrest ................... 51 _ 6
Effect of Prolonged LBNP and Saline Ingestion on Plasma Volumeand Orthostatic Responses During Bed Rest ......................................... 61 " "7
Fitness, Autonomic Regulation, and Orthostatic Tolerance ............................... 71 - _/
Valsalva Maneuver: Insights into Baroreflex Modulation of Human79 -
Sympathetic Activity .............................................................
Mechanistic Studies on Reduced Exercise Performance and CardiacDeconditioning with Simulated Zero-Gravity ........................................ 89-/(9
Fluid Compartment and Renal Function Alterations in the Rat _///97
During 7- and 14-Day Head Down Tilt ..............................................
Discussion ...........................................................................
Carotid-Cardiac Baroreflex: Relation with Orthostatic HypotensionFollowing Simulated Microgravity and Implications for 3-/Development of Countermeasures ..................................................
7-2-tEchocardiography in the Flight Program ...............................................
Pulmonary Function in Microgravity: KC-135 Experience ............................... 11
Central Circulatory Hemodynamics as a Function of Gravitational Stress ................. 13 _'_'/
37__ -r
Local Fluid Shifts and Edema in Humans During Simulated Microgravity ................. 109" j "2-
Hormonal Regulation of Fluid and Electrolyte Metabolism 121-/3in Zero-Gravity and Bedrest .......................................................
Hormonal Regulation of Fluid and Electrolyte Metabolism During Periods _¥of Headward Fluid Shifts .......................................................... 141-/
Autogenic-feedback Training: A Countermeasure for Orthostatic 145 -;5Intolerance ......................................................................
Cardiovascular Dynamics During Space Sickness and Deconditioning ..................... 155 _/_
J
\-
L t T tlt0ap41

Cardiovascular Measurements in Chronically InstrumentedConscious Monkeys
".............. ' ...... ,: ....................................... 165
Insights into Control of Human Sympathetic Nerve Activity Derived From theYalsalva Maneuver
............................................................... 171
V
vi
M_J
\
t
Proceedings ofthe
NASA Cardiopulmonary Workshop5 -7 December 1990
Program
Titles
Introduction
Presenters
Alan R Hargens, Ph.D.Suzanne M. Fortney, Ph.D.
Discussion
Carotid-Cardiac Baroreflex: Relation with
Orthostatic Hypotension Following SimulatedMicrogravity and Implications for Developmentof Countermeasures
Echocardiography in the Flight Program
Maximum Expiratory Flow-volume Curves During Short
Periods ofMicrogravity
Central Circulatory Hemodynamics as a Function ofGravitational Stress
Glycerol-induced Hyperhydration
Spectral Analysis of Resting CardiovascularVariables and Responses to Oscillatory LBNP Beforeand After 6 ° Head Down Bedrest
Effect of Prolonged LBNP and Saline Ingestion onPlasma Volume and Orthostatic Responses DuringBed Rest
Fitness and Orthostatic Tolerance
Insights into Baroreflex Modulation of HumanSympathetic Activity
Mechanistic Studies on Reduced Exercise Performance
and Cardiac Deconditioning with Simulated Zero
Gravity
Fluid Compartment and Renal Function Alterationsin the Rat During 7- and 14-Day Head Down Tilt
Local Fluid Shiftsand Edema in Humans During
Simulated Microgravity
Hormonal Regulation of Fluid and ElectrolyteMetabolism in Zero-G and Bedrest
Hormonal Regulation ofFluid and Electrolyte
Metabolism during Periods ofHeadward Fluid Shifts
Charles M. Tipton, Ph.D.
Victor A. Convertino, Ph.D.
John B. Charles, Ph.D.
Haroid J.B. Guy, M.D.
Rick D. Latham, M.D.
Marvin L. Riedesel, Ph.D.
Charles F. Knapp, Ph.D.
Suzanne M. Fortney, Ph. D.
Jay C. Buckey, M.D.
Michael L. Smith, Ph.D.
Charles M. Tipton, Ph.D.
Bryan J. Tucker, M.S.
Alan R. Hargens, Ph.D.
Joan Vernikos, Ph.D.
Lanny C. Keil,Ph.D.
vii

Autogenic-FeedbackTraining: A CountermeasureFor Orthostatic [ntolerance
Cardiovascular Dynamics During Space Sicknessand Deconditioning
Cardiovascular Measurements inChronicallyInstrumented Conscious Monkeys
Patricia S.Cowings, Ph. D.
Ary L.Goldberger, M.D.
Stephen F. Vatner, M.D.
V
_i|_

ParticipantsNASA Cardiopulmonary Workshop
5 - 7 December 1990
Jay C. Buckey, M.D.University ofTexas Health Science Center
Division ofCardiology, H8, 116
5323 Harry Hines Blvd.Dallas,TX 75235-9034
(214)688-3240
John B. Charles, Ph.D.
NASA Johnson Space CenterMail Code SD5
Houston, TX 77058
Victor A. Convertino, Ph.D.
Research PhysiologistLifeScience Research Office
MD-RES-P
Kennedy Space Center
Kennedy Space Center, FL 32899
(407) 867-4237
PatriciaCowings, Ph.D.
Research ScientistNASA Ames Research Center
M/S 239A-2
Moffett Field,CA 95035-1000
(415)604-5724
*Dwain Eckberg, M.D.Veterans Administration Medical Center
1201 Broad Rock Boulevard
Richmond, VA 23249
(804) 230-0001 ext.2606
Suzanne Fortney, Ph.D.
NASA Johnson Space CenterMail Code SD5
Houston, TX 77058
(713) 483-7213
Ary L. Goldberger, M.D.Associate Professor of MedicineHarvard Medical SchoolCardiovascular Division
Beth Israel Hospital330 Brookline Avenue
Boston, MA 02215(617) 735-4199
Harold Guy, M.D.General Atomics3550 General Atomics Court
Bldg. 2, Room 205San Diego, CA 92121
Alan R. Hargens, Ph.D.
Space Station ProjectScientistLifeScience DivisionNASA Ames Research Center
M/S 239-I 1
Moffett Field,CA 95035-1000
(415) 604-5746
Lanny Keil,Ph.D.Research ScientistNASA Ames Research Center
M/S 239-17
MoffettField,CA 95035-1000
(415) 604-6378
Charles Knapp, Ph.D.Biomedical Engineering CenterWenner-Gren Research Laboratory
University of KentuckyLexington, KY 40506-0070(606) 257-2894
Rick Latham, M.D. °
Lab for Aerospace Cardipulmonary ResearchUSAF SAM/NGIYBrooks AFBSan Antonio, TX 78235-5301(512) 536-3202
Marvin Riedesel, Ph.D.
Department of BiologyUniversity of New MexicoAlbuquerque, New Mexico 87131(505} 277-2824
Michael L. Smith, Ph.D.Asst. Prof., Dept. CardiologyCase Western Reserve UniversityUniversity Hospitals2074 Abington RoadCleveland, Ohio 44106(216) 844-8970
* Not present. Report submitted and included here.
\\
= \\
• ix

CharlesM.Tipton, Ph.D.Professor and Chairman -"
Department of Exercise and Sport Sciences _T108 Ina E. Gittings BuildingUniversity of ArizonaTucson, AZ 85721(602) 621-6992
Bryan J. Tucker, M.S.Specialist
Nephrology Res. (V-151)Department of Medicine _ _
University of California San DiegoLaJolla, CA 92093
(619) 552-8585, Ext. 3445
Stephen F. Vatner, M.D.Associate ProfessorDepartment of MedicineHarvard Medical School
New England Regional Primate Center1 Pine Hill Drive
Southborough, MA 01772(508) 481-4588
Joan Vernikos, Ph.D.Chief(Acting)Life Science DivisionNASA Ames Research CenterM/S 239-11
Moffett Field, CA 95035-l_00(415) 604-3736
Charles Wade, Ph.D.Deputy ChiefLife Science Division
NASA Ames Research CenterM/S 239-11
Moffett Field, CA 95035-1000(415) 604-3943
V
V
INTRODUCTION
The goal of this First Joint Cardiopulmonary Workshop for Ames Research Center, JohnsonSpace Center, and Kennedy Space Center was to allow principal investigators to inform each other oftheir previous progress and future plans for their National Aeronautics and Space Administration(NASA)-funded projects. Through this meeting it was hoped that more contact, interaction, andcollaboration would be fostered among investigators within the Research and Technology Objectivesand Plan IRTOP). Also, it was hoped that this knowledge base could be transferred to space flight
experiments and that information from actual microgravity could be used to improve ground-basedhuman and animal models of simulated microgravity. Presently, NASA-Iteadquarters hasrecommended that RTOP tasks shift from acute to long-term studies, including more emphasis oncountermeasure development. In the present environment of decreasing research support in theNASA RTOP Program, it is our goal to maximize basic understanding of mechanisms of
cardiopulmonary adaptation to microgravity so that health and performance ofcrewmembers is
optimized in space and upon return to Earth.
These proceedings include copies of papers presented at the workshop. For those paperspreviously published, we have included a reference and a brief description of the research performed.In some instances, additional reference material is also provided.
Alan R. HargensSuzanne M. Fortney
6 December 1990
M.J
\
xi
DISCUSSION
Alterpresentationsbyeachprincipalinvestigatoranddiscussionoftheir progress,Dr.CharlesTiptonledadditionaldiscussionof: 1)animalandhumanmodelsofmicrogravitysimulationand2}possiblecardiopulmonarycountermeasurestomaintainhumanhealthinspaceandduringreturntoEarth. Thefollowingdiscussiondoesnotalwaysrepresentall ofthepointsorthetotal consensus ofall Workshop participants. _ :
Animal and Human Models
It was agreed that the optimal model for mierogravity usually depencls Upon the question asked.However, ground-based models such as head-down tilt II:tDT), horizontal posture and immersion areall valid models. Also, spinal cord lesion patients show promise as subjects for orthostatic:intoler.
anee countermeasure development. Because 5 ° to 6° tIDT is considered the best ground-based,human model for the cardiovascular system today, investigators who use a different model should
specify their reasons for using their particular model The need to reduce psychological stress and tostandardize protocols for HDT was discussed. For example, more emphasis should be placed on the
control period before HDT and what measurements are critical during this time. Generally, it wasagreed the upright standing or sitting is the best posture for control measurements. However, it waspointed out that often such variables as posture and stress could not be controlled during launch or inflight. It was emphasized that more teamwork and collaboration was desirable for future bed restand in/light studies when studies did not adversely affect each other. In this regard, Extended-Duration Orbiter (EDO) experiment and Detailed Supplementary Objective {DSO) opportunities are
open to non JSC investigators but it is recommended that a JSC sponsor be recruited to monitor theEDO or DSO. Overall, it was agreed that principal investigators should justify their proposal better;i.e., clearly demonstrate the flight-relevance of their work, and that NASA should provide Requestsfor Proposals to give priorities for future research.
In terms ofanimals, the model should be selected that best addresses the mechanism underinvestigation. Whenever possible, however, the animal should be a species designated for future
flight experimentation. Evidence was presented at this Workshop that the rat is a very good overallmodel for some aspects of macro- as well as the microcirculation. However, the time course of cardio-vascular changes may be slower for the rat as compared to that for humans. At present, head-down
tilt is considered an adequate model to study select cardiovascular responses to microgravity. It wasemphasized that animals are important for their own reasons as experimental subjects for spaceresearch. Large sample sizes, an extensive data base, and low costs are key advantages for use ofrodent models. However, the nonhuman primate, particularly the rhesus monkey, may be a bettermodel for cardiac research and for certain cardiovascular parameters.
Countermeasures
Practicality and efficiency should be key factors in developing countermeasures. In this regarda minimum effective countermeasure such as high intensity, high-resistance exercise may be
preferred over aerobic exercise. Specificity should also be considered, and a variety of exercises,developed into an overall exercise program, should be considered, rather than a single exercise form.For example, moderate aerobic exercise may be useful in maintaining aerobic capacity, while more
intense or resistive forms of exercise may be more effective in maintaining baroreceptor function, forexample. Cardiopulmonary issues during extravehicular activities (EVAs) are not being adequatelyaddressed. Important areas of future work should include thermoregulation during EVA andpharmacologic countermeasures for postflight orthostatic intolerance. Saline ingestion is not
sufficient in itself to prevent orthostatic intolerance. Although the primary cardiopulmonaryproblem has been identified as orthostatic intolerance and receives large amounts of funding fromNASA, actual fainting occurs infrequently postflight. It may be more difficult to readapt to Earthafter prolonged microgravity exposures and therefore possible loss of baroreceptor function andvascular tone in leg vessels must be investigated. It was generally agreed that all countermeasures
V
xii

mustbe developed scientifically and that investigators within the Cardiopulmonary RTOP are
excellent resources for such development.
Suzanne M. FortneyAlan R. Hargens
12 December 1990
_,je /
x...j
°°,
Xlll

V
_..j./
J PRESENTED MATERIAL

V
_jiu_ w_

N94-Ii992
CAROTID-CARDIAC BAROREFLEX: RELATION WITH ORTHOSTATICH'YPOTENSION FOLLOWING SIMULATED MICROGRAVITY AND
IMPLICATIONS FOR DEVELOPMENT OF COUNTERMEASURES
Victor A. Convertino
¢
Abstract
In a series of studies, we have examined the effects of exposure to simulated microgravity,
varying states of vascular volume, and acute exercise on the function of the carotid-cardiac
baroreflex in man. In the first study, exposure to simulated microgravity (6 ° headdown bedrest)
reduced the sensitivity and buffer capacity of the vagal baroreceptor-cardiac reflex mechanisms and
this impaired baroreflex function was associated with orthostatic hypotension. Since the reduction
in plasma volume during BR was not correlated with impaired baroreflex function, a second studywas conducted which demonstrated that the carotid-cardiac baroreflex response was not affected by
either acute hypovolemia or hypervolemia. These results suggest that acute fluid replacement prior
to reentry may not reverse impaired baroreflex function associated with postflight hypotension. In a
third study, we demonstrated that one bout of maximal exercise increased baroreflex sensitivity and
buffer capacity through 24 h post-exercise. These baroreflex changes were opposite to those observed
following BR. Taken together, these data suggest that the contributions of reduced blood volume and
impaired carotid-cardiac baroreflex function to orthostatic hypotension following exposure to
microgravity are probably separate and additive; maximal exercise in addition to fluid replacement
may provide an acute effective countermeasure against postflight hypotension.
The complete text of this manuscript is printed in Acta Astronautica, Vol. 23, pp. 9-17, 1990.
Other Publications
1. CONVERTINO, V.A., D.F. DOERR, and S.L. STEIN. Changes in size and compliance of the
calf following 30 days of simulated microgravity. J. Appl. Physiol. 66:1509-1512, 1989.
2. CONVERTINO, V.A., D.F. DOERR, D.L. ECKBERG, J.M. FRITSCH, and J. VERNIKOS-
DANELLIS. Carotid baroreflex response following 30 days exposure to simulated
microgravity. Physiologist 32 (Suppl):S67-S68, 1989.
3. CONVERTINO, V.A., D.F. DOERR, K.L. MATHES, S.L. STEIN, and P. BUCHANAN.
Changes in volume, muscle compartment, and compliance of the lower extremities in man
following 30 days of exposure to simulated microgravity. Aviat. Space Environ. Med. 60:653-
658, 1989.
4. KINZER, S.M., and V.A. CONVERTINO. Role of leg vasculature in the cardiovascular
response to arm work in wheelchair-dependent populations. Clin. Physiol. 9:525-533, 1989
5. CONVERTINO, V.A., C.A. THOMPSON, B.A. BENJAMIN, L.C. KEIL, W.M. SAVIN,
E.P. GORDON, W.L. HASKELL, J.S. SCHROEDER, and H. SANDLER. Hemodynamic and
PAGII _ INKNTIONALL¥_NI

.
.
.
.
10.
11.
12.
13.
14.
15.
16.
17.
ADH responses to central blood volume shifts in cardiac-denervated humans. Clin. Physiol.10:55-67, 1990. = _ : =_ : _: :
CONVERTINO, V.A., C.A. THOMPSON, DL. ECKBERG, J.M. FRITSCH, G.W. MACK, and
E.R. NADEL. Baroreflex responses and LBNP tolerance following exercise training.Physiologist 33 (Suppl):S40-S41, 1990.
CONVERTINO, V.A. Physiological adaptations to weightlessness: effects on exercise and
work performance. Exer. Sports Sci. Rev. 1_88:119-165, 1990.
CONVERTINO, V.A., D.F. DOERR, DL. ECKBERG, J.M. FRITSCH, and J. VERNIKOS-
DANELLIS. Head-down bedrest impairs vagal baroreflex responses and provokes orthostatichypotension. J. Appl. Physiol. _8:1458-1464, 1990.
THOMPSON, C.A., D.L. TATRO, D.A. LUDWIG, and V.A. CONVERTINO. Baroreflex
responses to acute changes in blood volume in man. Am. J. Physiol. 25__99(RegulatoryIntegrative Comp. Physiol.):R792-R798, 1990.
CONVERTINO, V.A. Carotid-cardiac baroreflex: relation with orthostatic hypotension
following simulated microgravity and implications for development of countermeasures. ActaAstronautica 23:9-17, 1990.
CONVERTINO, V.A., G.W. MACK, and E.R. NADEL. Elevated venous pressure: a
consequence of exercise training-induced hypervolemia? Am. J. Physiol. 26__0 (RegulatoryIntegrative Comp. Physiol.):R000-R000, 199i (in press).
CONVERTINO, V.A., and W.C. ADAMS. Enhanced vagal baroreflex response during 24
hours after acute exercise. Am. J. Physiol. 260 (Regulatory Integrative Comp. Physiol.):R000-R000, 1991 (in press).
CONVERTINO, V.A., W.C. ADAMS, J.D. SHEA, C.A. THOMPSON, and G.W. HOFFLER.
Impairment of the carotid-cardiac vagal baroreflex in wheelchair-dependent quadriplegics.
Am. J. Physiol. 260 (Regulatory Integrative Comp. Physiol.):R000-R000, 1991 (in press).
THOMPSON, C.A., D.A. LUDWIG, and V.A. CONVERTINO. Carotid baroreceptor influence
on forearm vascular resistance during low level LBNP. Aviat. Space Environ. Med. 1991 tinpress).
CONVERTINO, V.A. Endurance exercise training: Conditions of enhanced hemodynamic
responses and tolerance to LBNP. Med Sci. Sports Exer., 1991 (in press).
MACK, G.W., V.A. CONVERTINO, and E R. NADEL. Effect of exercise training on
cardiopulmonary baroreflex control of forearm vascular resistance in humans. Med. Sci.Sports Exer., 1991 (in press).
CONVERTINO, V.A., and J.M. FRITSCH. Human carotid-cardiac vagal baroreflex responses
are attenuated after physical inactivity. Aviat. Space Environ. Med. 1991 (in press).
V
4

18. EIKEN, O., V.A. CONVERTINO,D.F. DOERR,G.A. DUDLEY, G. MORARIU, andI.B.MEKJAVIC. Interactionof the muscleehemoreflexandthe carotidbaroreflexin manduringexercise. Am.J. Physiol.260(RegulatoryIntegrativeComp.Physiol.):R000-R000,1991(inpress).
19. ECKBERG,D.L.,V.A. CONVERTINO,J.M. FRITSCH,andD.F. DOERR.Humancarotidbaroreceptor-cardiacreflexresponsesare highly reproducible.Am.J. Physiol.(HeartCirc.Physiol).1991(in review).
20. TATRO,D.L.,G.A.DUDLEY,andV.A.CONVERTINO.Carotid-cardiacbaroreflexresponse,calfcompliance,andLBNPtolerancefollowingresistancetraining. Med.Sci.SportsExer.1991(in review).
5

N94-11993
ECHOCARDIOGRAPHY IN THE FLIGHT PROGRAM
A Report of Ultrasound Cardiography Results
from Space Shuttle Missions
/82y2S-
John B. Charles, Ph.D.
Michael W. Bungo, M.D.
Sharon L. Mulvagh, M.D.
Introduction.
Observations on American and Soviet astronauts have documented
the association of changes in cardiovascular function during
orthostasis with space flight. A basic understanding of the
cardiovascular changes occurring in astronauts requires the
determination of cardiac output and total peripheral vascular
resistance as a minimum. In 1982, we selected ultrasound
echocardiography as our means of acquiring this information.
ultrasound Offers a quick, non-invasive and accurate means of
determining stroke volume which, when combined with the blood
pressure and heart rate measurements of the stand test, allowscalculation of changes in peripheral vascular resistance, the
body's major response to orthostatic stress.
Methods.
Pre- and post flight echocardiography during the Shuttle program
began with STS-5 in 1982 (Nov., 1982) as part of DSO 402 (Fluid
Loading Countermeasure). ("DSO" stands for "Detailed o erationally-Supplementary Objective," an avenue for collecting P
important medical data on Space Shuttle crewmembers.) It was
performed on a sporadic basis on volunteer crewmembers through
1986. Data from the first several flights was determined from
two-dimensional (2D) echocardiographic images acquired with an
instrument originally designed for obstetric use. In 1983, we
upgraded to the ATL 4000 S/LC, which permitted 2D-guided M-mode
imaging. Two of these units were acquired specifically forconversion into "flight units" (one primary unit and one backup
unit) allowing data collection by trained crewmembers during
Shuttle flights. The prime flight unit has flown on two Shuttle
missions to date: STS 51-D (Apr., 1985) and STS-32 (Jan., 1990).
Up to three more flights may be accomplished by this unit before
it is retired.
Starting with STS-26 (Sept., 1988), several DSOs using
echocardiography have allowed us to collect information on
changes in cardiovascular function associated with flight
duration (DSO 466), in-flight aerobic exercise (DSQ'476), new
fluid loading prescriptions (DSO 479), the use of LBNP as a
countermeasure (DSO 478), and for correlation with heart rate and
blood pressure immediately after landing (DSO 603). Beginning
with STS-28 (Aug., 1989), We have been using a Biosound Genesis
II echocardiograph with Doppler capability. This allows us to
determine cardiac dimensions in conformance with o_r pre-existing
data base and also to determine aortic flow by Doppler techniques
EA_I_____INiI_NTIONAUJI
without the geometrical assumptions required by calculationsbased on M-mode measurements.
Results.
From 1982 through 1989, 54 crewmembers on 16 Shuttle missions
volunteered to be subjects for pre- and post flight
echocardiography. Typically, the ultrasound examination is
performed during the operational Stand Test, a routine assessment
of orthostatic function performed on all Shuttle crewmembers
before launch (about ten days before flight), shortly after
landing, and several days later. Continuous echocardiographic
measurements were made while the crewmember was supine for five
minutes, and then when the crewmember was standing upright for
five minutes. The electrocardiogram was recorded continuously,
and blood pressure was determined once per minute. The variables
analyzed were: heart rate (HR), systolic and diastolic pressures
(SBP and DBP), left ventricular end-diastolic and end-systolic
dimensions, left ventricular wall thicknesses, right ventricular
end-diastolic dimensions, left atrial and aortic dimensions,
velocity of circumferential fiber shortening (VCF, and index of
contractility), and (using Doppler) left ventricular inflow and
outflow velocities. Hemodynamic parameters derived from these
measurements included: mean and pulse arterial blood pressures
(MAP and PP), left ventricular end-diastolic, end-systolic and
stroke volume indexes (LVEDVI, LVESVI and LVSI), ejection
fraction (EF), cardiac index (CI) and total peripheral resistance
index (TPRI). The use of hemodynamic indexes normalizes for
differences in body surface area between crewmembers. All
crewmembers used the operational fluid loading protocol shortlybefore landing.
Briefly, the pre-Challenger data (collected only during the
supine portion of the stand test) showed that left ventricular
dimensions were reduced by an average of 25% after flights of 5-8
days duration; as a result the stroke volume is similarlyreduced.
Subsequently, DSO 466 allowed measurements to be made with the
crewmember resting supine (actually left-lateral decubitus) and
then while standing upright, during the operational stand test.
Supine and standing HR were increased by 23% and 35% (P<0.0001)
on landing day compared to preflight. The HR response to
orthostasis was also increased (p<0.0001) on landing day. SupineDBP increased slightly, and supine and standing pp decreased
slightly on landing day. There were no significant differences
in supine or standing SBP or MAP on landing day compared to
preflight. LVEDVI and LVSI were significantly deG;eased by 11.4%
and 16.6% on landing day compared to preflight. TPRI was
significantly greater in the standing position than in the supineposition on all days except landing day.
In-flight measurements made on STS 51-D and STS-32 documented the
decrease in left ventricular dimensions and increase in arterial
pressure over the first 4-5 days in flight. Typically, late in-
flight measurements reproduced landing day measurements.
Discussion.
Cardiovascular physiological changes associated with short Spacein left ventricular end-Shuttle flights include decreases
diastolic volume and stroke volume indexes compensated for by
increased heart rate to maintain cardiac output. Decreased
LVEDVI follows the reduction in plasma volume known to occur in
weightlessness.
Comparisons with echocardiographic data from the last Skylab crewand from Soviet Salyut crewmembers showed that the decrease in
cardiac dimensions (and presumably function) occurs rapidly in-
flight and changes only minimally after the first week in
weightlessness.
These results revealed the nearly complete absence of a
peripheral vascular resistance response to orthostasis on landing
day after as little as 4-5 days in weightlessness. This suggests
strongly that even crewmembers who are not syncopal are relying
largely on their physiological reserve mechanisms (such asincreased heart rate) to remain standing. If they were
confronted with an emergency requiring increase performance, a
successful outcome would be in doubt.
%= J
9

V
N94-11994
Pulmonary Function in Microgravity: KC-135 Experience
Harold J. Guy and G. K. Prisk, University of California, San Diego
Presented to Joint ARC/JSC Cardiopulmonary Workshop December 5-7, 1990.
We have commenced a KC-135 program that parallals and preceeds our
Spacelab (SLS-I) pulmonary function experiment. Our first task was toelucidate the affect of normal gravitation on the shape of the maximum
expiratory flow volume (MEFV) curve. Nine normal subjects performed multipleMEFV maneuvers at O-G, I-G and approximately 1.7-G. The MEFV curves for each
subject were filtered, aligned at RV, and ensemble-averaged to produce an
average MEFV curve for each state, allowing differences to be studied.
Most subjects showed a decrease in the FVC at O-G, which we attribute to
an increased intrathoracic blood volume. In most of these subjects, the mean
lung volume associated with a given flow was lower at O-G, over about the
upper half of the vital capacity. This is similar to the change previously
reported during head out immersion and is consistent with the known affect of
engorgement of the lung with blood, on elastic recoil. There were alsoconsistent but highly individual changes in the position and magnitude of
detailed features of the curve, the individual patterns being similar to those
previously reported on transition from the erect to the supine position. This
supports the idea that the location and motion of choke points which determinethe detailed individual configuration of MEFV curves, can be significantly
influenced by gravitational forces, presumably via the effects of change in
longitudinal tension on local airway pressure-diameter behavior and thus wave
speed. (I)
We have developed a flight mass spectrometer and have commenced a study ofsingle breath gradients in gas exchange, inert gas washouts, and rebreathingcardiac outputs and lung volumes at O-G, I-G, and 1.7-G. Comparison of ourresults with those from SLS-I should identify the opportunities andlimitations of the KC-135 as an accessible microgravity resource.
ref:
I) Guy, H.J.B., G.K. Prisk, A.R. Elliott, and J.B. West. Maximum expiratoryflow-volume curves during short periods of microgravity. J. ADDI_
Physiol., (In Press).
2
IIj_L,_IN'iF.ATIOHALI,N IIIbANi
11

V
W

N94-1i995
FUNCTION OF _._v _ _-_-_
/ vn'7.[
Latham RD, White CD, Fanton JW, owens RW, Barber JF,
Lewkowski BE, Goff OT
from
Laboratory for Aerospace Cardiovascular Research (LACR),
USAFSAM/USAARL Brooks AFB, TX and Ft Rucker, AL
Most current knowledge regarding the central hemodynamic
functions in man are known for the supine posture, data having
been obtained during acute cardiac catheterization procedures.
Very detailed descriptions of ventricular and vascular function
and their coupling have been published for this posture.
Unfortunately, similar sophisticated analyses from invasive data
for the upright posture in man are lacking due to the unusual
conditions required for study. Tilt studies in the clinical
cardiac catheterization laboratory are generally reserved for
electrophysiologic studies as opposed to hi-fidelity hemodynamic
recordings. Limited animal studies are available which have
evaluated some aspect of ventricular/vascular function for the
k_J
upright posture,
The effects of gravity upon cardiovascular performance still
remains to be more precisely elucidated. Certainly,
gravitational stresses at extremes of human tolerance are even
less well described. Man has ventured into such hostile
environments as those imposing as much as 9-10 times the force of
gravity on his system to other environments in which he
experiences the virtual absence of gravity. To make
13
recommendations regarding the health and safety operational
envelopes for these environments, an_understanding of how these
alterations in gravitational stress effect cardiovascular
function and its integration with other systems becomes more
critical. Investigations must, of necessity, begin with gaining
insight into the "normal" physiologic response, then advance to
understanding responses to mild degrees of pathophysiology.
This study focuses on an evaluation of the central
hemodynamics in a nonhuman primate model to variations in
gravitational states. The baboon, phylogenectically close to man
was chosen as the human surrogate. The study environments
selected are head-down and head-up tilt in the physiology
laboratory, centrifugation to test hypergravic stress, and
parabolic flights to test transient acute responses to
microgravity.
Therefore, the objectives of the present study are:
I) Develop the chronically instrumented conscious baboon
model for hemodynamic studies,
2) Evaluate baroreflex function, contractility, pulsatile
and steady ventricular loading characteristics, and the
ventricular/vascular coupling phenomenon during
postural tilt changes,
3) Evaluate ventricular/vascu!ar function during
centrifugation (acceleration stress),
4) Evaluate ventricular/vascular performance during
transient microgravity induced by parabolic flight,
5) Compare acceleration responses pre i and post- 48 hour
V
r
V
14

k,_/head-down tilt with and without fluid loading and anti-
G trousers.
This project is still in its early phases. To date, we have
developed the chronically instrumented baboon model. We have
also begun collecting data and performing the required analyses
into ventricular/vascular function. This report will summarize
the surgical technique and the hardware R&D required.
Additionally, some examples of data analysis will be presented.
Finally, some comments on future plans and directions will be
presented.
MODEL DEVELOPMENT
k_/
The previous year has been utilized to develop the implanted
animal model. Prior to surgical transducer implantation the
selected baboons are acclimatized to a vest or jacket and a
confinement chair used for the studies. Acceptance of these
devices is prerequisite for surgical implantation.
Echocardiography and radionuclide angiography noninvasive studies
are also performed. Finally, a pre-surgery complete right and
left heart catheterization supine and 70 ° head-up tilt, each with
aortography is performed.
All surgical subjects undergo food and water
restriction for 14 hours preoperatively. Preoperative
medications include ketamine HCL (10 mg/kg im) and atropine
sulfate (0.04 mg/kg iv). Maintenance anesthesia is provided by
fentanyl citrate (50 mcg/kg iv) and supplemented by isoflurane
15

administered via a cuffed endotracheal tube connected to a volume
controlled ventilator.
The surgical approach is via a left intercostal
thoracotomy at the 4th intercostal space. A linear incision
along the long axis of the pericardium is made, followed by
placement of sutures to cradle the heart away from the
mediastinum. Aortic instrumentation consists of an
electromagnetic flow probe placed at the root of the ascending
aorta, and a Konigsberg pressure transducer placed immediately
distal to the margin of the flow probe. Another flow probe is
placed around the descending aorta distal to the divergence of
the brachiocephalic and subclavian arteries. Atrial
instrumentation consists of a kinkless catheter tubing placed in
the right atrial appendage and the body of the left atrium. Left
ventricular instrumentation is comprised of a Konigsberg pressure
transducer placed in the apex of the left ventricle, endocardial
ultrasound crystal pairs positioned in 3 axes: anterior to
posterior, free wall to septum, and base to apex. Epicardial
crystals have been used for several baboons, and an additional
crystal pair is positioned to measure LV free wall thickness in
this situation. Additional instrumentation is limited to
placement of a heavy-duty silastic occluder cuff encircling the
inferior vena cava immediately posterior to the right atrium.
Intraoperative medications consist of bretylium tosylate
(2-5 mg/kg/min iv) diluted to 2 mg/ml with 5% Dextrose in sterile
water, lidocaine HCL, and procainamide HCL. After placement of
all instrumentation, the wire leads and fluid catheters are
V
V
16

k_J
tunneled subcutaneously to exit the skin in the interscapular
region of the back, where they are secured with mattress sutures
of monofilament nylon. The percutaneous wire and catheter
implants are positioned so their velour wrapping is at the level
of the skin, to provide a scaffold for fibroblastic ingrowth. A
thoracostomy tube is positioned at the 8th intercostal space for
drainage, and serialaspirations are made for 24 hours.
Postoperative care consists of intensive care monitoring
until the baboons can sit up without assistance. Analgesia is
provided by oxymorphone HCL (0.i mg/kg im) or buprenorphine HCL
(0.02 mg/kg im) for a period of at least 72 hours. Baboons are
closely monitored for caloric intake, and are l_berally
supplemented with fresh fruit on a daily basis. Antibiotic
therapy with cephapirin sodium (I0 mg/kg im) or gentamycin (4
mg/kg im) is usually implemented due to the 3-4 hour length of
the surgical procedure. The baboons are fitted with a nylon vest
which contains a pocket at the interscapular lead exit site for
protecting the transducer wires.
Wound healing is monitored closely at 48 hour intervals.
Initial care immediately after surgery consists of using hydrogen
peroxide on the exteriorized velour to remove fibrin and cellular
material. Peroxide is never used for direct wound treatment.
After this initial cleansing, the velour is dried with gauze and
povidone iodine solution (0.1%) is placed on the velour at the
percutaneous exit site. Wound care thereafter is minimal,
consisting of cleaning the velour when sebaceous secretions
adherent. If lead sites become erythematous or an exudate is
17

apparent around the velour, the exit sites are gently cleansed
with normal saline and a Q-tip swab, followed by lavage with 0.1%
povidone iodine or 0.1% chlorhexidene solutions, and topical
placement of povidone iodine ointment for residual antimicrobial
activity.
Fluid lines are flushed at 48-72 hour intervals with
heparinized saline, and serial blood cell counts are performed as
a monitor of clinical status. Fluid lines are then filled with
heparin after the flushing procedure. When recovery is complete,
chair training resumes. A repeat right and left heart
catheterization is performed to calibrate transducer elements.
The hemodynamic information desired is essential to the
questions being addressed and requires rather sophisticated and
extensive invasive physiologic data acquisition. The
methodologies necessary to obtain certain data requires surgical
implantation of transducers in the heart as well as great
vessels. It is obvious that ethical and moral constraints
prohibit the use of human volunteers _. It is also necessary to
obtain data and derive parameters of cardiovascular function that
may be easily extrapolated to human physiology for these
operational environments. Additionally these invasive data are
necessary to provide the basis for and validation of computer
model constructs for ventricular/vascular function in the
microgravity environment. The evaluation baroreflex responses
and describing physiologic changes with intact bar,reflexes is
similarly important. It is well known that quadrupeds have
different cardiopu!monary and arterial baroreflex responses
18
k_J
compared to humans or nonhuman primates phylogenetically close to
man.
INSTRUMENTATION R&D
A number of R & D efforts have been required. Several blood
flow transducers were evaluated, including transit-time doppler,
permanent magnet EMF and standard EMF flow probes. We determined
that for the time being, standard EMF was the best probe for our
studies until a custom-designed pulsed doppler flow system is
constructed and tested. Additionally, we have had several custom
modifications made to the Konigsberg transducers. Using totally
silastic transducers we have had manufactured monofilament molded
special angles to the distal portions of both the aortic and LV
transducer elements. The aortic cell has a 90 ° bend and the LV
pressure cell has a 135 ° angle over a 1 cm distance. The distal
shank of the LV transducer was reinforced. Furthermore, silastic
rings are applied to the distal portions to aid with surgical
implantation stabilization. A custom-designed "kinkless"
silastic tubing is used for the atrial lines. This allows
placement of a small 2FR Millar catheter into the LA and LV. The
leads are encased with fine velour fixed with a silastic glue.
This innovation has prevented the infectious complications post-
op. Specialized jackets have been designed to keep the
transducer leads secure and take the pressure off exit sites.
Two other R&D products relate to centrifugation. A special
designed "G" chair for the animal arm of the centrifuge has been
manufactured and tested. We are also having a computer
19
controlled signal conditi0ner/biotelemetry system unit designed
and assembled by NASA ARC. This unit will interface with our
transducer elements and allow us to collect data remotely from
the centrifuge arm. The unit may be used for study of other
environments with difficult accessibility.
DATA ANALYSIS:
Data are passed through antialiasing filters (corner
frequency of I00 Hz, 30 Db/octave roll-off) and digitized offline
at a sample rate of 500 Hz using a Concurrent Computer (Model
SLS-6300, real-time Unix 5.0) and LabWorkbench commercial
software. Signals are then post-processed using both custom-
designed and commercial (DaDisp, DSP Corporation) software.
Five consecutive beats are averaged for LV and Ao pressures
and ascending aortic flow (ASC FLOW). Averaged beats are used to
measure basic pressure and flow parameters. The first derivative
of LV pressure are taken and the peak positive & peak negative
values averaged for I0 beats are then determined. Average
pressure and flow for simultaneous beats are submitted to Fourier
analysis. Harmonics of pressure are divided by corresponding
harmonics for flow to derive the aortic input impedance, and the
phase angles of flow are subtracted from corresponding phase
angles of pressure. The fifth to the fifteenth harmonic values
are averaged to determine the characteristic impedance, Zc (See
Figs 1,2).
These same averaged beats Of pressure and flow are also
submitted to a 3-element Windkessel analog model of the
V
V
2O
k_S
circulation. This model uses a Marquardt fitting algorithm to
fit a calculated flow from input pressure to a measured flow.
With an optimal fit, the model returns estimates for Zc,
peripheral resistance (Rp), and systemic arterial compliance (C),
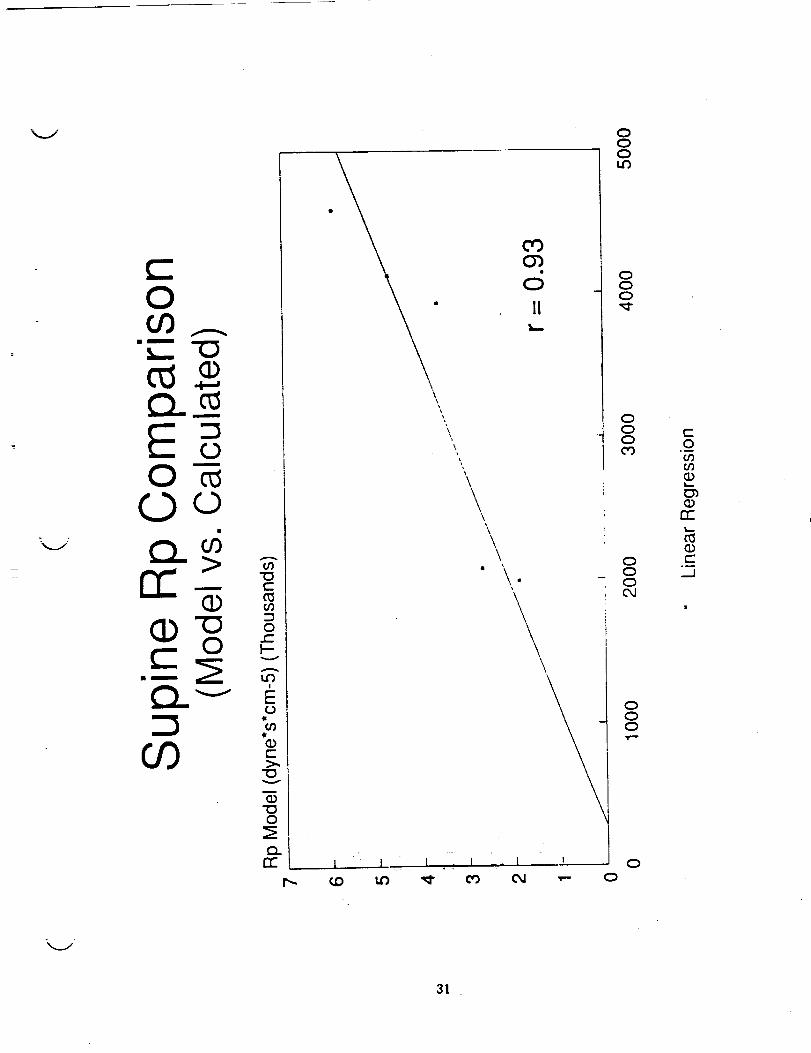
see Figs 3,4. These values are then compared to conventional
calculations of these variables using a linear regression
analysis, Figs 5-8.
A hydraulic occluder cuff is used to decrease pressures
transiently. Simultaneous LV pressure and volume are submitted
to a time-varying elastance model to determine the end-systolic
pressure volume relationship (ESPVR). At least 7 beats and a
minimum fall in systolic pressure of 10% of baseline are required
for analysis. Any runs with ectopic beats are discarded. The
ESPVR is fitted with a linear regression and the slope taken as
the estimate of ventricular elastance, an index of contractile
function, Figs 9,10. The volume intercept, Vo, is determined as
well.
RESULTS
Fourteen baboons have been enrolled in some phase of model
development. There has been 1 surgical death in the eldest cull
animal and there have been 2 post-op hemorrhages. The
hemorrhages were due to a transit-time doppler probe in one case
and the aortic transducer (pressure cell) in another. Since
incorporating silastic rings on the implanted transducers and
using silastic electromagnetic flow probes these problems have
not been seen. One animal suffered sudden death, presumed
2!

arrhythmic. One fluid line became nonfunctional prior to use of
silastic rings.
The head-down tilt studies will be conducted with the
primates under sedation to alleviate anxiety. Initial trials
with low dose midazolam (Versed) infusion have been performed.
Unlike humans, the baboon is more resistant to the sedative
pharmacological effects of this new agent such that intermittent
Ketamine injections are required. Future studies will
incorporate Ketamine infusion at a lower dose level.
Initial supine and tilt data are under analysis. A
combination of commercially available signal analysis software
(DaDisp, DSP Corporation) and custom programmed software are used
to analyze data.
Some very preliminary results suggest that the pulsatile
load of the baboon is not significant changed as a function of
posture changes, in contrast to peripheral resistance which
increases. We previously found compliance decreased with the
upright tilt under sedation. In six of the baboons' data thus
analyzed the compliance values tended to be unchanged but were
quite variable.
In a comparison of model vs. conventional calculations of
parameters of LV loading we found that these were well correlated
for both supine and head-up tilt conditions. The Zc, however,
was less well correlated with the upright posture than Rp.
Compliance values tend to be overestimated by the 3-element
Windkessel when compared to C determined from the RC time (tau)
of aortic diastolic pressure decay.
V
22
l J Pre and post-ketamin e studies are also under analysis. Finally,
we have found in preliminary analyses that contractility by the
ESPVR appears to be unchanged with 70° head-up tilt. Analyses
are still in progress and in too premature status to apply
statistical tools. Some examples of the types of analysis being
performed are included.
kj
CONCLUSION
We have demonstrated that we can instrument a nonhuman
primate, the baboon, for sophisticated invasive hemodynamic
evaluation of the cardiovascular system. We are establishing a
noninvasive studies protocol such that these data may be compared
with invasive findings. This year the tilt studies will be
completed, as well as the centrifugation and parabolic flight
tests. Data analysis is ongoing in parallel fashion. We further
hope to extend development of some vascular access technology.
we also expect delivery of a new cardiovascular signal
conditioner/biotelemetry system for testing and evaluation. This
system is scheduled to include a new custom-designed doppler
probe which will provide flow velocity as well as vessel
dimension.
ACKNOWLEDGEMENTS: This work has been supported in part by a
grant to Dr. Latham from the USAF Office of Scientific Research,
#2312/W7 and from NASA, #T-3685R. The authors are grateful to
the extensive work effort given by staff of the Veterinary
Research Support Branch of USAF School of Aerospace Medicine.
23
REFERENCES: ......
I. Sunagawa K, Sagawa K, Maughan WL: Ventricular
interaction with the vascular system, in Yin FCP, ed.
Ventricular/vascular Interaction, New York, Springer-Verlag,
1987, pp. 210-239.
2. Kono A, Maughan WL, Sunagawa K et al. The use of left
ventricular end-ejection pressure and peak pressure in the
estimation of the end-systolic pressure-volume relationship.
Circulation 70:1057-1065, 1974.
3. Suga H, Sagawa K: Mathematical interrelationship
between instantaneous, ventricular pressure-volume ratio and
myocardial force-velocity relation. Ann Biomed Eng I:160-181,
1972.
4. Rowell LB: Human Circulation Requlation Durinq
physical Stress. New York, Oxford University Press, 1986, pp.
137-173.
5. Bishop VS, Malliani A, Thoren: "Cardiac
Mechanoreceptors" in Handbook of Physioloqy, III(2), The
Cardiovascular System; eds. Spepherd JT, Abboud FM, Geiger SR; Am
Phys Soc., Wash., D.C., 1983, pp. 497-555.
6. O'Rourke MF: Steady and pulsatile energy losses in the
systemic circulation under normal conditions in stimulated
arterial disease. Cardiovasc Res 1967;1:313-326
7. Westerhof N, Eizinga G, Sipkema P: An artificial
arterial system or pumping hearts. J Appl Physiol 1971;31:776-781
8. Nichols WW, O'Rourke MF, Aviolo AP, Yaginuma T, Murgo
JP, Pepine CJ, Conti CR: Effects of age on ventricular-vascular
V
V
24

J
coupling. Am J Cardiol 1985;55:1179-I184
9. Westerhof N, Sipkema P,Elzinga G, Murgo JP, Giolma JP:
Arterial Impedance. In: Hwang NHC, Gross DR, Patel DJ (eds) :
Quantitative Cardiovascular Studies. Baltimore, University Park
Press, 1979,pp iii.
i0. Randall OS, Esler MD, Calfee RV, Bulloch GF: Arterial
compliance in hypertension. Aust NZJ Med 1976;6:49-58
ii. Yang, Sing San, M.D., Maranhao, M.D., Bentivoglio
Lamberto G, M.S., M.D., Goldberg, Harry, M.D. (eds) : "Flow
Resistance" In: From Cardiac Catherization Data to Hemodynamic
Parameters 3rd edition. FA Davis Publishers, Philadelphia,
1988,pp 66-72.
12. Liu Z, Brin KP, Yin FCP: Estimation of total arterial
compliance: an improved method and evaluation of current methods.
Am J Physiol 1986;252:H588-H600
13. Toorop GP, Westerhof N, Elzinga G: Beat-to-beat
estimation of peripheral resistance and arterial compliance
during pressure transients. Am J Physiol 1986;252:HI275-HI283
14. Latham RD, Rubal BJ, Sipkema P, Westerhof N, Virmani R,
Rabinowitz M, Walsh RA: Ventricular/vascular coupling and
regional arterial dynamics in the chronically hypertensive
baboon; correlations with cardiovascular structural adaptation.
Circ Res 1988:63;798-811
15. Latham RD, Rubal BJ, Schwartz RS: Postural effects in
the baboon on the Windkessel model or circulatory dynamics. The
Physiologist 1989;32(i) :S82-S83
16. Randall OS: Effect of arterial compliance on systolic
25
blood pressure and cardiac function. Clin and Exper Hyper-Theory
and Practice 1982;A4 (7):1045-1057
17. Westerhof N: Analog Studies_Of Human Arterial _
Hemodynamics. Doctoral thesis, niversity of Pennsylvania,
Philadelphia, 1968.
18. Elzinga G, Westerhof N: Pressure and flow generated by
the left ventricle against different impedances. Circ Res
1973;32:178-186 .........
v
V
L --
26

k_i
A1 08 Aortic Input ImpedanceSUP INE
500
400u34<
-W
EO
300O9
O9 2OOD
O
_- I00
o 2.5 5 _._ _.9:2:5 I_ 2o 22 2s 2_
Frequency (Hz)
A108 Aortic Input Impedanc_UPRIGHT
500
--- 400
U
300O9
"1o
oi 2OO
,--4
0
tO0
o 2.78s.5_8._::._i_.916._lg.sn.2 2_
Frequency. (Hz)
150 150
!00
A
O3_D(I) 5O
"0
O),-4
0
-50
n,
-I00
-150 _ ' I , I I I I ' 1 '
2.48 4.96 7.44 9.92 12.4 14.9 17.4 1.9.8 22.3 24.8
Frequency (Hz)
v
i00
5O
,-'4
0
C<
O)
o9 -50tO
.Cn.
-100
-150 I ' I ,, _ I I I I '
_._ s.s_ ,._ _1.1._i_.91._._9.4_._s._:
Frequency (Hz)
Fig. I
27 '

1600
J, 126 UPRIGHT IMPEDANC/
EtO
,Ill(,.)
.It(2)
>,"O
03
...I
nO
1400-
1200,
1000-
800-
600-
400-
200_
Rp = 2805
-_-.....
Zc= 150
I I I I I I I I I
5 10 15 20 25 30 35 40 45
FREQUENCY (Hz)
5O
Fig 2
28

,,,_../
•Z
o_ _ ,?-_._ o _
- r.,,
o _ _ ° ° II !
(oeSlOO) _0TS
o o o
,.#..,,
<--_>I:D')_
I
II(I)i.-- _J
0")
(Di-- 0
13_._
i,-- t.J0
,.0_ E-,'4.T
illf._
?.f
l
( 6 I.ILLm.0 _nss_c]
o
,,i
Zn-
n-
_ _<o @
n
0
E E -r
O
"_ I'_ ¢Oc.o
oN rr O
29

(SNtm_) e_nsse_,_
uv
_Ve,,o
V
3O
O
__ -O
m
CO
"[D
t_
O
LO
o9
(Dt-
"CDV
(D"IDO
Q.rr
\
\
\\\\
o3O_
II
\\\
O
OLO
I
OOO_-
OOO
OOOOJ
ooo
O
t-O
00(D
m"
0_(Dt-
._J
31

OO9_- "t3
c'_cu
O
rr >+-_-O
Oo_
O_
' I J
\
O O O OO O O Oo O O O
\
\
\\
\
I
OOO
cOO_
(D
II
\
\
\
J
OOO
O_ 0
0
00
C2)_ 0
0C_
\\,
\
\° 0O
_ 00 00
OOO
OOOLO
CO00O_
CDrr
t-
._J
V
V
32

\ /
O
• m
L_ -O
,,i.-i
Om
O
09
(D-O.c_
V t_
41
t--
v
O
t_N
OO
OO4
I
O
l
OO
00CO
O
II
\\
\
\\
\\
\
I
O
o_.I
•, EO
.ic¢0
o t-
"oV
OD
, OO
-_ o N
O04
OO
CO
or)CD
13=
Jm,_.
.._1
|
o_1
33 ..

O00_-- "C3
Oi
OOoO 00
N-_
Ot3_
0 0 0 0
0
II
00
0
c-O
o_
n-
c-
_.J
V
34 ' "

150
A 126 SUPINE ESPVR
125-
O1-r"E 100-E
U..Irr
75-
COLIJ
rr 50-tl
>,25-
00
Emax= .254
Vo = -3.0I I I I ! I I I 1 I I I
10 15 20 25 30 35 40 45 50 55 60 65 70
VOLUME (CC)
Fig. 9 !
35

A 126 ESPVR - UPRIGHT
ILlrr
O003LLIrr1:3,_>....J
4(
0t I
5 10! !
i5 20
LV VOLUME (CC)
! I
25 3O 35
Fig I0
36

N94-11996
"Glycerol-induced Hyperhydration"
_ by
Marvin L. Riedesel, Timothy P. Lyons and M. Colleen McNamara
Department of Biology
University of New Mexico
Albuquerque, New Mexico87109
-5"5---62_.-i
Maintenance of euhydration is essential for maximum work performance. Environments
which induce hypohydration reduce plasma volume and cardiovascular performance progressively
declines as does work capacity (Fortney et al., 1981). Hyperhydration prior to exposure to
dehydrating environments appears to be a potential countermeasure to the debilitating effects of
hypohydration. The extravascular fluid space, being the largest fluid compartment in the body, is
the most logical space by which significant hyperhydration can be accomplished. Volume and
osmotic receptors in the vascular space result in physiological responses which counteract
hyperhydration.
Our hypothesis is that glycerol-induced hyperhydration (GIH) can accomplish
extravascular fluid expansion because of the high solubility of glycerol in lipid and aqueous media.
A hypertonic solution of glycerol is rapidly absorbed from the gastrointestinal tract, results in mild
increases in plasma osmolality and is distributed to 65% of the body mass (Lin, 1977). A large
volume of water ingested within minutes after glycerol intake results in increased total body water
because of the osmotic action and distribution of the glycerol (Riedesel et al. 1987). The
resulting expanded extravascular fluid space can act as a reservoir to maintain plasma volume
during exposure to dehydrating environments. We have conducted experiments to be presented
later which demonstrate advantages of GIH for subjects exercising in a hot environment (Lyons et
al. 1990). The fluid shifts associated with exposure to microgravity result in increased urine
production and is another example of an environment which induces hypohydration. Our goal is
37
to demonstrate that GIH will facilitate maintenance of euhydration and cardiovascular
_ : performance during space flight and upon return to a 1 g environment.
The experimental protocol for the GIH experiments involved the subjects checking into
the hospital at 1900 h and drinking one liter of water at 2000 h to ensure euhydration. No food
or water after midnight and at 0715 h a catheter was placed in a cubital vein. At 0730 subjects
drank glycerol, 1 g/kg, in orange juice, 3.4 ml/kg. In the first study subjects drank 1.5 liter of 0.1%
NaC1 during the next two hours and 300 ml of 0.1% NaCi during the third hour. The control run
involved the same protocol including the same volume of fluid intake except without glycerol
either 48 h prior to or after the experimental run.
The glycerol intake markedly decreased the urine volumes (Figure 1). Another
experiment with the same protocol involved 1.5, 1.0 and 0.5 g/kg glycerol intake. The serum
glycerol values varied with the glycerol dosages (Figure 2). The 015 g/kg dosage did not result in
significant changes in water retention. The amount of Water retained after 4 h was similar for the
1.0 and 1.5 g/kg glycerol dosages. Therefore subsequent studies have involved the 1.0 g/kg:
dosage. Apparently the rates of glycerol catabolism and excretion are dose dependent such that
the 1.5 g/kg doesn't result in a greater water retention than the 1.0 g/kg. The mean volume of
water retained after 4 h has been 10.2 ml/kg (S.E. = 0.5) when subjects ingested 1 g/kg glycerol
and drank 1.5 to 1.8 liter of water within 1 to 3 h of time zero. It is also of interest to note that
whereas the retention of water was for 4 h the increased plasma osmolality following the glycerol
intake had returned to control values within 2 h (Figure 3). This indicates that glycerol and water
havemoved f_m ihepiasma to ifie ififfaceliularspa-ce and the Wate_ remlnedis inlracellular}: _:
The next study asked the question, does the GIH provide an advantage for subjects
exercising in the heat? :_e-subjects Were heat acclimated prior tO :participation. At 48-h or
longer intervals the 6 men and 2 women participated in random order in three separate 4.5-h
v
V
z
!=
z
E
38

experiments.Eachexperimentincluded a 1.5-h bout of exercise at 60% of maximum oxygen
consumption in a moderate dry heat (42" C). One experiment involved limited fluid intake (5.4
ml/kg) which was similar to ad libitum fluid intake in pilot studies under similar conditions. The
other two experiments involved ingesting a large volume of fluid in an attempt to hyperhydrate
the subjects prior to the exercise. One attempt at hyperhydration involved ingestion of glycerol (1
g/kg) in orange juice plus a large volume of water (21.4 ml/kg) at time zero plus additional
glycerol (0.1g/kg) in orange juice at hourly intervals after the first two hours. The subjects drank
50 ml of water at hourly intervals after the second hour (Table 1). The second involved drinking
the same volume of water and orange juice (Table 1).
Time Zero
Within 1 h
Each hour after 2 h
Total Fluid intake in 4 h
Table 1. Fluid Ingestion Regimens
Large Fluid Intake _ Limited Fluid
_ Intake
1 g GLY/kgin
3.3 ml/kg OJ
3.3 ml/kg OJ
21.4 ml/kgof water
21.4 ml/kgof water
0.1 g GLY/kgin
0.1 ml/kg OJ
plus50 ml water
0.1 ml/kg OJ
plus50 ml water
28.4 ml/kg 28.4 mllkg
3.3 ml/kg OJ
50 ml water
5.4 ml/kg
GLY = glycerol, OJ = orange juice.
39

The mean accumulated sweat output tbr the 90 min of exercise was 1450 + 160 ml with the
glycerol ingestion compared to 1130 ml + 100 ml following just the large volume of water (p <
0.05) (Figure 4). During the 60- to 90-rain interval of exercise in the heat, the glycerol ingestion
resulted in a mean sweat output of 700 + 90 ml and the large volume of water without glycerol at_=
time zero resulted in a-mean volume of 470 ml + 40 ml (P < 0.01). This difference amounted to a
33% increase in sweat following the pre-exercise GIH.
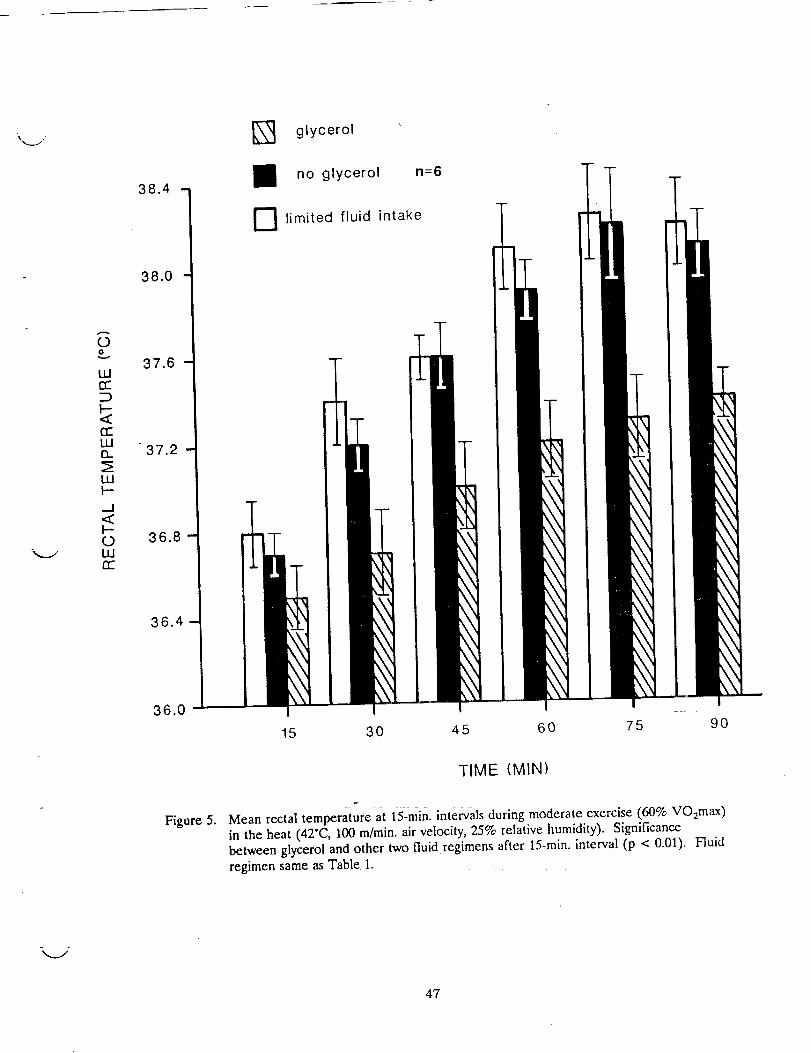
After 30 min of exercise, the mean rectal temperature was lower (P < 0.05) following
glycerol ingestion when compared to the other two fluid regimens. The limited fluid intake and large
volume of water at time zero resulted in similar mean rectal temperatures during the 90 rain of
exercise (Figure 5).
The next experiment was designed to determine whether or not we could extend the GIH to 48
h. This experiment involved 7 male subjects and once again at time zero they ingested a large
volume of fluid (21.4 ml/kg) either with or without glycerol, 1 g/kg. On both the control and
glycerol intake days, the total water plus orange juice intake_0ver the 48-h period was 50.8 ml/kg.
On days they ingested glycerol, the glycerol intake was 1 g/kg at 0700 h, 0.10 g/kg at 0800 h, 0.303
g/kg at 1000 h and 1100 h, and 0.379 g/kg at 1400 h and i600 h. Previous studies and pilot
experiments had indicated that these rates of water and glycerol intake would provide GIH for 48 h.
The fluid intake and urine volumes are presented in figure 6.
Our current studies involve cardiovascular responses to lower body negative pressure
(LBNP) prior to and after bedrest with and without GIH. Prior to bedrest subjects undergo a
maximum oxygen consumption test (VO:max), underwater weighing to determine percent body fat
and three pre-syncope LBNP tests. The 4 male subjects had VO2max values greater than 40 ml
02/kg/min and less than 20% body fat. The LBNP box involved a seal with a kayak skirt at the
V
40

\ iv
waist and a foot rest rather than a bicycle saddle for support of the subject. During the LBNP
tests the electrocardiogram was recorded continuously and the arterial blood pressures were
recorded manually at 1-min intervals. The reproducibility of the LBNP responses is illustrated in
figure 7.
The standard LBNP test conducted on days -1, 4, 5, 6, & 7 of the bedrest involved 5 min
at each level of negative pressure, -10, -20, -30, -40, -50, and -60 mm Hg. Glycerol and fluid
intake was administered on days 5 and 6 of the bedrest as described above for the 48-h GIH.
The heart rate, systolic and diastolic blood pressure were analyzed by analysis of multiple variance
and the Dunnett's test for multiple comparison of treatments.
Subjects had less tolerance for LBNP on bedrest day 4 when compared to pre-bedrest
(day -1), (p < 0.05). The heart rate and blood pressure responses on bedrest days 4, 5, 6, and 7
were similar (p > 0.05). The GIH on days 5 and 6 did not improve cardiovascular responses to
the standard LBNP test. This may have been expected because the standard LBNP test is only of
30 min duration. In the heat stress experiment described in the previous paragraphs, the
increased sweating after GIH was greater during the 30 to 60-rain and 60 to 90-rain intervals than
during the 0 to 30-min interval of heat stress.
Experiments for the immediate future will involve bedrest, a "soak n procedure (2-h
exposure to cycling LBNP, 1 rain to -60 and 1 min to zero LBNP). The _soak" procedure will be
conducted 1.5 h after the GIH on day 5 of the bedrest. Pre-syncope LBNP will be conducted on
days -1, 4, 5, and 6 of the be&est. These experiments will also include monitoring of cranial
blood flow by the transcranial doppler technique during all LBNP tests.
Additional future studies will include measurements of 14-C tagged glycerol and tritiated
water in the laboratory rat after GIH to determine the distribution of glycerol and water among
various body fluid compartments. We are also interested in testing the extent to which we can
41

increasethe amount of hyperhydration by changing the timing and dosages of glycerol and water
intake. V
REFERENCES
Fortney, S.M., E,.R. Nadel, C.B. Wenger and J.R. Bove. 1981. Effect of blood volume on
sweating rate and body fluids in exercising humans. J. Appl. Physiol. 51:1594-1600.
Lin, E.C. 1977. Glycerol utilization and its regulation in mammals. Annu. Rev. Biochem.46:765-795.
Lyons, P.T., M.L. Riedesel, LE. Meuli, and T.W. Chick. 1990. Effects of glycerol-induced
hyperhydration prior to exercise in the heat on sweating and core temperature. Med. Sci.SA_orts Exert. 22:477-483.
Riedesel, M.L, D.L. Allen, G.T. Peake, and K. A1-Qattan. 1987. Hyperhydration with glycerolsolutions. J. Appl. Physiol. 63:2262-2268.
V
42

700
600-
LL! 500-
..J0> 400LLIZ
CCE)
200-
glycerol
no glycerol
n = 10
_mm
/\/ \/ \/ \
\\-t"
/
TIME (HOUR)
Figure 1. Mean volume of urine voided at each hour (ingestion of 0.1% NaCI, 21.4 ml/kg, duringfirst two hours and 300 ml during third hour).
43

..jOn'-'LU
..J(_ 13)
_E
rr'-ILlO9
Figure 2.
140-
130
120.
110"
100
90"
80-
70
60"
50-
GLYCEROL DOSAGE1.5 g/kg xn = 7
1.0 g/kg • n = 80.5 g/kg®n = 7
40
30.
20-
10-
0•2 3 4
TIME (HOUR)
Serum glycerol after glycerol ingestion (ingestion of 0.1% NaCI, 21.4 ml/kg, during first40 rain.).
V
V
44

Glycerol n=9
.... 0.1% NaCI n=10
305-
.--- ,,,,.
E_ot_ 0OE
E._°
_.E
300-
295-
290-
285-
28O
275
}SE
/// \ T
r" 1 ',
| I I i I I i
0 40 80 120 160 200 240
min
Figure 3. Plasma Osmolality (same fluid ingestion as Figure 2).
45

Ev
b-<tU
CO
720-
600-
480 -
360 -
m
D
glycerol
no glycerol n=6
limited fluid intake
0-30
..-I-
30-60 60-90
V
Figure 4.
TIME (MIN)
i
Mean sweat output for six subjects at 30-min. intervals during moderate exercise (60%
VO2max ) in the heat (42'C, 100 m/rain, air velocity, 25% relative humidity).
Significance between glycerol and other two fluid regimens at 30-60 rain. (p < 0.05)and 60-90 min. (p < 0.01). Fluid regimen same as Table 1.
46
OO
Wc_
<
1.11n
wl-,..J<)-0wn-
38.4
38.0
37.6
37.2
36.8
36.4
36.0
Figure 5.
\3 glycerol
no glycerol n=6
E] limited fluid intake
15
m
30 45 60 75 9O
TIME (MIN)
Mean rectal temperature at 15-rain. intervals during moderate exercise (60% VO2max )in the heat (42"C, 100 m/min, air velocity, 25% relative humidity). Significancebetween glycerol and other two fluid regimens after 15-min. interval (p < 0.01). Fluid
regimen same as Table 1.
47

7.iro----o FLUID INTAKEt_---_URINE, NO GLYCEROLo---o URINE, GLYCEROL
N=7
} SEV
1.5
1
0 4 8 12 16 20 24 28 32 36 40 44 48
Figure 6.
TIME (HOUR)
Accumulated fluid intake and urine output with and without glycerol. Significance inurine output between glycerol and no glycerol was p < 0.05 at each hour.
48

__J
Figure 7.
I
/II
I
\
I
_ ,jf.o-o_ t t I mm LBNPo-_i_'___ _ .o...-3,,__o;o 6,o8,0,oo,,_o,.o,, _o,,
3 6 9 1"2 15 18 21 24 27 30MIN.
Heart rate and blood pressure responses to lower body negative pressure for a given
subject at the same time of day on separate days.
49

V
V
V
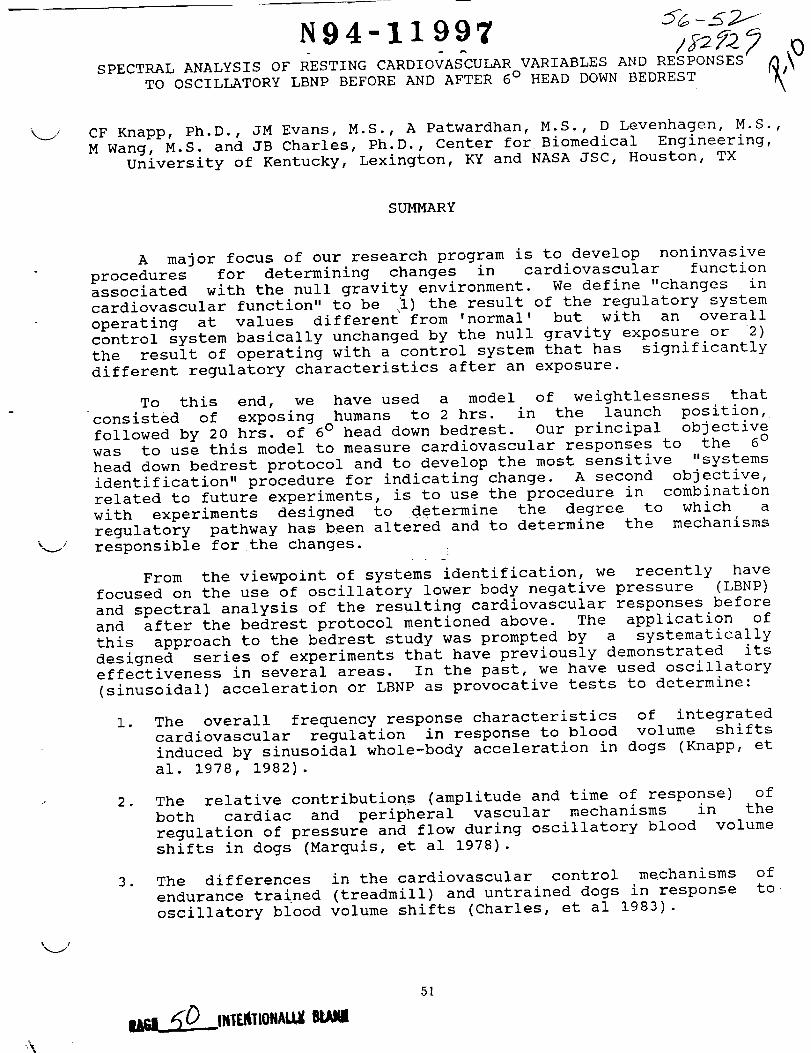
N94-I 1 997
SPECTRAL ANALYSIS OF RESTING CARDIOVASCULAR VARIABLES AND RESPONSES
TO OSCILLATORY LBNP BEFORE AND AFTER 6 ° HEAD DOWN BEDREST
CF Knapp, Ph.D., JM Evans, M.S., A Patwardhan, M.S., D Levenhagen, M.S.,
M Wang, M.S. and JB Charles, Ph.D., Center for Biomedical Engineering,
university of Kentucky, Lexington, KY and NASA JSC, Houston, TX
SUMMARY
A major focus of our research program is to develop noninvasive
procedures for determining changes in cardiovascular function
associated with the null gravity environment. We define "changes in
cardiovascular function" to be ._i) the result of the regulatory system
operating at values different from 'normal' but with an overall
control system basically unchanged by the null gravity exposure or 2)
the result of operating with a control system that has significantly
different regulatory characteristics after an exposure.
To this end, we have used a model of weightlessness that
consisted of exposing humans to 2 hrs. in the launch position,
followed by 20 hrs. of 6° head down bedrest. Our principal objective
was to use this model to measure cardiovascular responses to the 6 °
head down bedrest protocol and to develop the most sensitive "systems
identification" procedure for indicating change. A second objective,
related to future experiments, is to use the procedure in combination
with experiments designed to determine the degree to which a
regulatory pathway has been altered and to determine the mechanisms
responsible for the changes.
From the viewpoint of systems identification, we recently have
focused on the use of oscillatory lower body negative pressure (LBNP)
and spectral analysis of the resulting cardiovascular responses before
and after the bedrest protocol mentioned above. The application of
this approach to the bedrest study was prompted by a systematically
designed series of experiments that have previously demonstrated itseffectiveness in several areas. In the past, we have used oscillatory
(sinusoidal) acceleration or LBNP as provocative tests to determine:
i. The overall frequency response characteristics of integrated
cardiovascular regulation in response to blood volume shifts
induced by sinusoidal whole-body acceleration in dogs (Knapp, et
al. 1978, 1982).
2. The relative contributions (amplitude and time of response) of
both cardiac and peripheral vascular mechanisms in the
regulation of pressure and flow during oscillatory blood volume
shifts in dogs (Marquis, et al 1978).
3. The differences in the cardiovascular control mechanisms of
endurance trained (treadmill) and untrained dogs in response to
oscillatory blood volume shifts (Charles, et al 1983).
5l

.
.
The chronotropic frequency response characteristics of humans
during sinusoidal ± ig z acceleration (Knapp, et al 1983).
The relative contributions of cardiac and peripheral mechanisms
to blood pressure regulation in dogs during sinusoidal LBNP(Aral, et al 1986).
%.i
.
The chronotropic frequency response characteristics
during sinusoidal LBNP (Knapp, et al 1987).of humans
•
The differences in stroke volume and heart rate in response to
sinusoidal LBNP in the same human subject in salt replete anddepleted states (Knapp, et al 1990).
We now seek to evaluate the effectiveness of the oscillatory LBNP
(and spectral analysis) protocol to evaluate cardiovascular regulation
in humans before and after head down bedrest. We also seek to place
the sensitivity of the technique in perspective with other protocols
that do not use provocative tests. Our current studies are designedto answer the following specific questions_ ..... _ .....
i•
Can the frequency response characteristics of cardiovascular
regulation in normal supine humans be identified by spectral
analysis of responses to oscillatory LBNP? How do the results
compare to those from the spectral analysis of restingvariables?
•
Can bedrest-induced changes in cardiovascular function be
identified by spectral analysis of responses to oscillatory
LBNP? How do the results compare to those from the spectral _
analysis of resting variables? If they are more sensitive, does _
the enhancement justify the extra effort involved with theprovocative test?
,
Which spectral analysis technique is the most sensitive to track
subtle changes in cardiovascular function during bedrest? Can
the details of the spectra provide information about the mechan-
isms of cardiovascular control and do chanqes in the spectra
associated with bedrest reflect changes in control mechanisms?
In an effort to answer these questions, we have been
investigating several approaches to determine the spectral content of
resting variables alone and in response to sinusoidal LBNP Atpresent, we are:
I ,
•
•
measuring the spectral content of resting variables usingautoregression and chirp Z transform analysis.
measuring the excursions (peak-to-peak differences)
cardiovascular responses as a function of LBNP frequencies.in
measuring the spectral content of each response to each LBNP
input frequency using discrete Fourier transforms, chirp Z
transforms (for increased spectral resolution) andautoregression analysis.
k_/
52
k_/
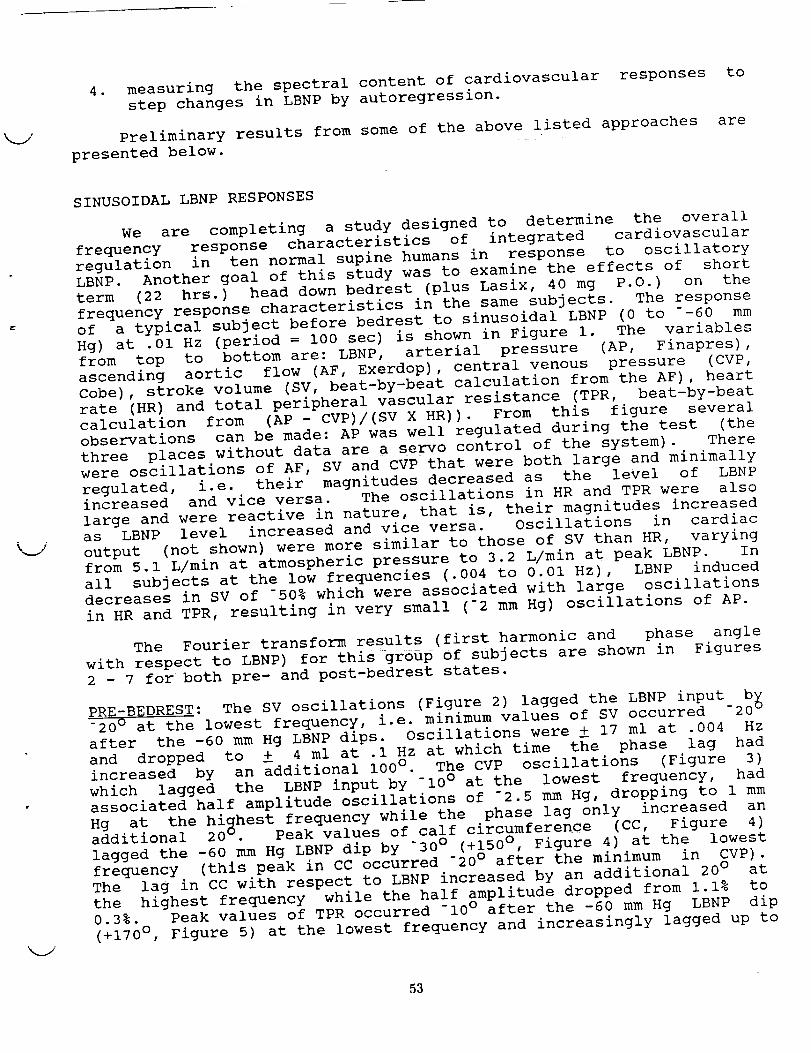
4. measuring the spectral content of cardiovascular responses
step changes in LBNP by autoregression.
Preliminary results from some of the above listed approaches
presented below.
to
are
k_/
SINUSOIDAL LBNP RESPONSES
We are completing a study designed to determine the overall
frequency response characteristics of integrated cardiovascular
regulation in ten normal supine humans in response to oscillatoryLBNP. Another goal of this study was to examine the effects of short
term (22 hrs.) head down bedrest (plus Lasix, 40 mg P.O.) on the
frequency response characteristics in the same subjects. The response
of a typical subject before bedrest to sinusoidal LBNP (0 to --60 mm
Hg) at .01 Hz (period = i00 sec) is shown in Figure I. The variablesfrom top to bottom are: LBNP, arterial pressure (AP, Finapres),
ascending aortic flow (AF, Exerdop), central venous pressure (CVP,
Cobe), stroke volume (SV, beat-by-beat calculation from the AF), heart
rate (HR) and total peripheral vascular resistance (TPR, beat-by-beat
calculation from (AP - CVP)/(SV X HR)). From this figure several
observations can be made: AP was well regulated during the test (the
three places without data are a servo control of the system). There
were oscillations of AF, SV and CVP that were both large and minimally
regulated, i.e. their magnitudes decreased as the level of LBNPincreased and vice versa. The oscillations in HR and TPR were also
large and were reactive in nature, that is, their magnitudes increased
as LBNP level increased and vice versa. Oscillations in cardiac
output (not shown) were more similar to those of SV than HR, varying
from 5.1 L/min at atmospheric pressure to 3.2 L/min at peak LBNP. In
all subjects at the low frequencies (.004 to 0.01 Hz), LBNP induced
decreases in SV of -50% which were associated with large oscillations
in HR and TPR, resulting in very small (-2 mm Hg) oscillations of AP.
The Fourier transform results (first harmonic and phase angle
with respect to LBNP) for this group of subjects are shown in Figures
2 - 7 for both pre- and post-bedrest states.
PRE-BEDREST: The SV oscillations (Figure 2) lagged the LBNP input b_
_20 ° at the lowest frequency, i.e. minimum values of SV occurred -20
after the -60 mm Hg LBNP dips. Oscillations were ± 17 ml at .004 Hz
and dropped to ± 4 ml at .I Hz at which time the phase lag had
increased by an additional i00 °. The CVP oscillations (Figure 3)
which lagged the LBNP input by "i0 ° at the lowest frequency, had
associated half amplitude oscillations of -2.5 mm Hg, dropping to 1 mm
Hg at the highest frequency while the phase lag only increased anadditional 20 _- Peak values of calf circumference (CC, Figure 4)the lowest
lagged the -60 mm Hg LBNP dip by "30 ° (+150° , Figure 4) at
frequency (this peak in CC occurred "20 ° after the minimum in CVP).
The lag in CC with respect to LBNP increased by an additional 20 ° at
the highest frequency while the half amplitude dropped from 1.1% to
0.3%. Peak values of TPR occurred "i0 ° after the -60 mm Hg LBNP dip
(+170 ° , Figure 5) at the lowest frequency and increasingly lagged up to
53
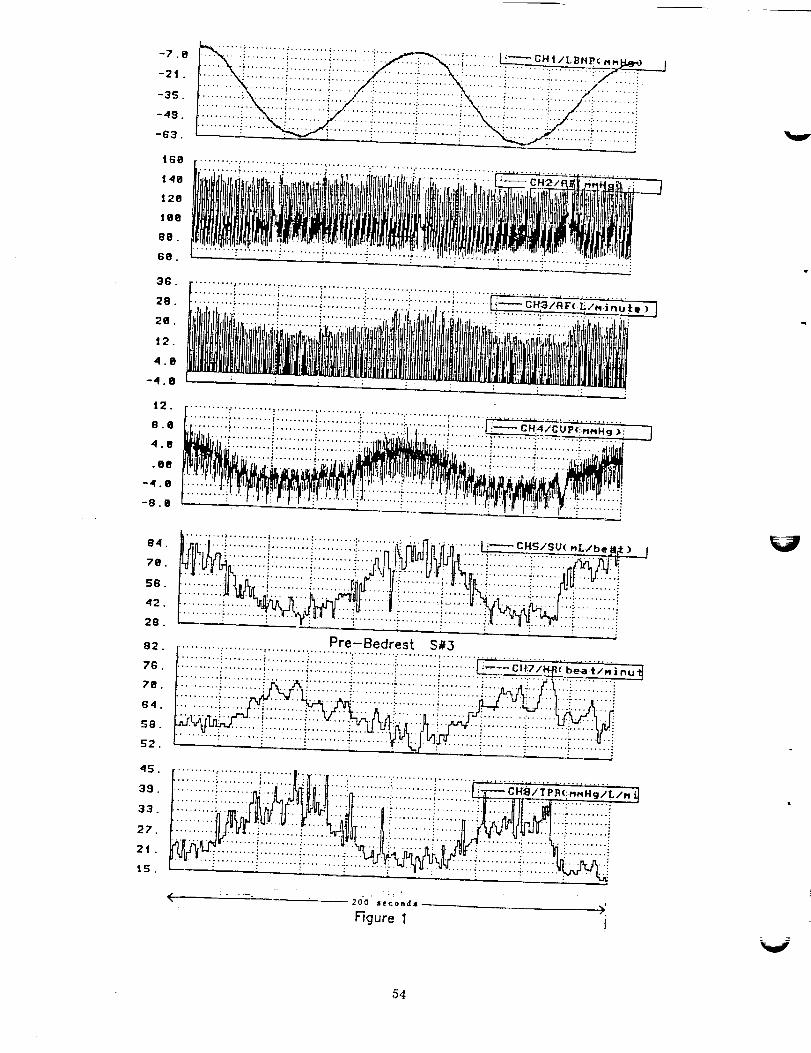
-7.8
-2t .
-3S.
-49.
-63.
iGg
148
t2O
t6e
88.
6e.
......;..i.;.....;ii;.....;..,.... ;;.: . . .i_:-;.;i;i:;;;:;;;.i__.. _ ..:,_.... :::
36.
28.
2B.
J2.
4.B
-4.8
.......... *' .... ' .... t ......... ; ......
.......... i ......... ;.... _ ....... :....................................• " ..... " .......... :.......... i, ..... • C . ''''1.
_.........i.;;:;;;;;i:::::;;;:_;;;;::_;i; .... ;_ ........
12.
8._
4.B
.ee
-4.8
-8 .e
.......... t ......... t .... , .... ; .............
.......... .,........ i ........ , .... "..... :............................... _._._ ....
......... ......... ..... ""-'" i i :;;;_;'" _' "'!"i:;:: 'I':'!!!!!!!i!!!!!!!!!i!!!!': :' :iiiiiiiiiiiiiiiii:!
9,1. _i_ni.l... i ......... i ......... •......... ;ii:_;i;'......... ......... .... __U( .L/be _ll_: ) f"'"""" "? ; :
:::::i:::::::i! :iiiiiiiii:iiiiii!iii!iii:28.
g2.
7G.
78.
84.
$8.
K2.
45.
39.
33.
27.
2t.
15.
:;;;:;::;:; ........i ..........:.....'P":;_:-B"_d_st.....S_3.....................................
. • : i .......... .:" . . : : . ii
2oo seconas ),
Figure 1 !
54
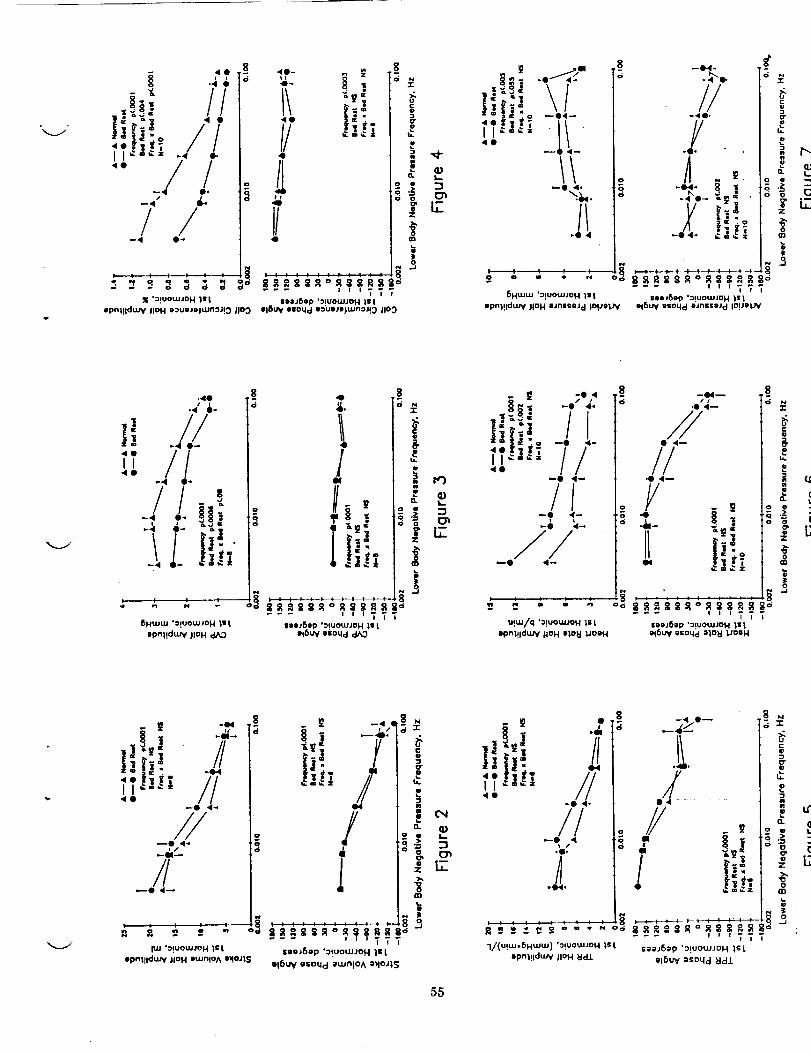
,4 •
ii!!_il //I I _-=¢= -._ o.
..//•-j e.
_4 4L
/ /_4 0-
I/ z 1
40
4
/I<I
I/
gd
i
_1_":IUOUJJOH 111 iiaJ61p '_!UOtLIJO H |l i
Jpnl!ldt.uy lid H II:uoJo|UJfl"lJ!_ JlOO 016 W eeoqd 113uIIjIDjt,un3Jt_ JlO_
40
i c_ _._,.
_ _O 4
3
8FIN-
//
--40.
//
-4 O-
_k
g
Z
o
i
--- ' ' ';TT8HUJW 'o!u°wJOH t s I IOOJSOp ':_IUOWJO H _1; |
Ipnl!lduJy )ION IJn|SoJ d IO.UOT,_ ' Ol6UV goNd IJnl;sl'Jcl IO.U_l..,'_f
.4O
.4 i.
"" /LII'40
6HUJUJ "O!UOWJOH 11 I
opn1!du_f JlOH
8 8o
o
4
i.
/44
i;!
8OOJ6@p '_IUO_JD H lit
ol6W olO_d
-r
i!
el
itl
o.
i -t) 4-
Ii,!, /I_ 7/40
_0 4--
/I-o _-
u!m/q '_!uow.loH;s iIpi'll!ldtUY lion Ilolt IJooH
44_
I/44_
Y - t- |.&_ I
I I;_".o
it
-r
i
!
o
i i _"'" T?T
llOJ_ep ':IUO_JO H ]il
ot6_ osoqdtlo_ _OIH
_e Ill tT L!
//
°l,I
//
_J 'O!UOt.UJOH iet
. _ -,%'
tli, !l
!
ilpnl!lduJy liON lluinlOA ll_Oil$
"-" T7TIooJfiop ':!uo_JoH Is t
OlSW osoqd i_nlOA I_OJ1S
i
IiQ.
!0
m,
io,
L.
:3C_
E
]]i;i 7!,- ,/'7/.II
/I
_o _N
_/(u!_-SH_w) "o!uowJoHIs tIpnl!ld_ JIOH _
i
/i/ -'0,.
/ !_i "m
--- '' 'TTTsii_6_p 'O!UO_UJDH IS: t
el_U_ ;soqd _]dJ.
/14
55
an additional 140 ° at the highest frequency. The half amplitude of TPR
decreased from 8 mm Hg/(L/min) to 2 mm Hg /(L/min) across the range.
Peak values of HR (Figure 6) lagged the -60 mm Hg LBNP dip by "30 °
(+150 ° , Figure 6) at the lowest frequency and increasingly lagged up to
an additional 180 ° at the highest frequency while the half amplitude of _
HR oscillations decreased from 8 b/min to 3 b/min. The AP half
amplitudes (Figure 7) increased with increasing frequency up to 0.04 Hz
and then decreased slightly. Peak AP led the -60 mm Hg LBNP dip by"30 ° at the lowest frequency, switching to a phase lag after 0.04 Hz.
POST-BEDREST: The post-bedrest results from this group of subjects
indicated several interesting responses: The AP, HR, SV and TPR half
amplitudes were larger than those in the pre-bedrest state and the
half amplitudes of CVP and CC were smaller. The phase relationships
of these variables with respect to the LBNP input were notsignificantly affected by the short term bedrest.
The principal conclusions from this study were that in normal
male subjects: i) AP was well regulated at LBNP input frequencies
below .01 Hz due to the appropriate timing of large amplitudes of
oscillations of both HR and TPR which counteracted the large
relatively passive oscillations of SV. 2) AP oscillations were largest
between .01 and 0.08 Hz due to the inappropriate phasing of relatively
small amplitudes of oscillations in SV, HR and TPR. 3) The half
amplitudes of oscillations of AP were increased by bedrest even though
the amplitude of the vascular volume being shifted was reduced as
indicated by the decreased half amplitudes of CVP and CC. 4) The in-
creased half amplitude of AP oscillations in post- vs pre-bedrest were
therefore due to the inappropriate timing of larger oscillations of
HR, SV and TPR in response to smaller oscillations of vascular volume.V
CARDIOVASCULAR SPECTRA FROM RESTING SUBJECTS
Based on the fact that an increase in heart rate and peripheral
resistance has been a consistent finding in bedrest and spaceflight
studies, we hypothesized that these deconditioning procedures produce
a net increase in peripheral neural sympathetic activity. Previous
studies (Akselrod, Rimoldi) by other investigators have demonstrated
that changes in neural activity are manifest in changes in arterial
pressure (Rimoldi) and heart rate (Akselrod, Rimoldi) spectra. We are
currently using autoregressive techniques to calculate the spectral
content in data records of resting arterial pressure, heart rate,
respiration rate, stroke volume, peripheral resistance, central venous
pressure and cardiac output in the same subject before and after our
22 hrs. of 6 ° head down bedrest. Arterial pressure and heart rate from
a supine, freely breathing subject, are shown in Figure 8. The top
row shows 6 spectra obtained from consecutive, individually detrended,
2.5 min segments of arterial pressure (left) and heart rate (right).
Each data point in the AP time record was obtained by integrating
arterial pressure over a beat (one R-R interval). Each data point for
HR was obtained by taking the reciprocal of the R-R interval. In the
pre-bedrest data (top row), power in AP was localized in two ranges
(<.06 Hz and between .06 - .14 Hz) while power in HR spectra was
localized in the region <.04 Hz and between .06 - .18 Hz. The
56

(/)
,.a..a
r_-
I
• ....... !
i i i iii ii ii
i ii i!! ii !_
L_i!!ili i i!iiiiii
; _ I ." °
.4..m
d_. 4)m
;:i:i i i i i i i ii :
!=Z= H - " _ .: " H "
: C * : .......• o.I - : : : : : :
: : : : : : : : : :m
::::::::i:--
_ i i i i i i i i i<
:°iiiiii _ .
I#IIIIl&_l
• o
i !. _ ! ! _ " "I' :c : : : : : : : :
!::.-._-_._....i....i.-.-._---6-.-_-,.._......L-..-'X....: =i " _ ! !
ti,;i .: _ H _ • _ _
|i-:ii ! i i"i i i
I;im : : : : : : : :
• D.I : : : : : : : ;
iiiill ii_: : : ; : ." : ; : :
: : ; ; : : : • : :
. . , o ......
..... o , , . .
..... ," " --_I.4----..4 ....
! ii iiiii ii: : : : : : I : : :
: : : : ; : : : : :
H =. H E i
e_.
..o 4)
o"1O
: : : : : : :: .| i i i i :. _ :
i: : : : : : : :
• !: I: : : : . : : : :
i'::: i i i i i i i• bll_
:Ilk : : : : : : :
i:.;;._ i ! i i i ! i• ! ........
: : : : : : : : : :
::::::::::
::::::::::
::::::::::
II;II;!L :::::: |
• . . _. :.-,i _q
!
• I. : : : : : :
: --TI : : : : : • : ;
_ : -._--:----_, - .-_--_._ _-____:,_ _q:e : : : : : : :
c:;m : : : :
• • : : " ' iu; : ! ; i i ! i !
|
- o-I : : : : : : :
" ": ! :" : : _ ! _ i •• " --.4
I I= - .- . ;
•_. I1_I_. El
T_: : ....... T
: q: I: : : : : : : - •
::i:_iiiii!!i
_- _.e e. • =•
57

: -+: o i - ! i : m. . q. • '. ; ;" ". ".'+"'+'T...........: b: : ; : : : ; "+ - @" • : : " " +
:"' _-w- j.--+...:..-..-:-+,.._...---.?--....-:........:...... _ _ " +. _ ! _ +: i _ i: ,sl : : : - + . :
: II:u • : , : : : J: * ,t. • _ ! i :+ i : " : , +.w m, : : ; " i._" _"i p.:, ._ . _ +: : -.L _. : : : : ....
..... --+, -- iiiiii!]!,_,!t,,
i-i:.; ++++i i- !...... i
+ ++++ITS+
D_°_. :i i i ! .i i + i!:._, r+*:'--'------_--_:. "r--T----''+.: .... ..*" i _i + _ _ _ + i i _" _'-- ................
, + I + n _ I _ + I I
• _+" " '": ] I+ ":
s,.-0 (0 14)
Q-m i:_. 1_. m
! + _. i + + i ! + +-_,: - , - + + + - _ +
._---_.----I --t--_: -- -_--_- -_-_+-.: I++" ; : : : : ; : :
:... +. ....ii+ 111 • .......
l_:u +II : + • . : : :
t2 I -: i i .: _ - i+I,
I,.. L : : : : ; : :
I_+I • .......
_-!!!!!!!!!-.__: : : : : : : : : :
: : : : : : : : : :
_ i i ! i i i i i i'-'i i i i _ i ] ] i i
_+ ,'- + + +.+ + + + :".
I:
i,.::_: ! ! i i i ! !+_-_---_ • . • .......: I.-o *m ; -* : : : :
i 4'sr _ ; : : : : : :
I
.:.,68
+ + + ++ _ + + +_]],,_.,,.-.._.-- ........................: If: ........
_ :" _ i " " i i ] i.... _'_z_ : : ; ; : --_
_:-_-+ + + : : : : :i,,, ,_ " " :" _ .: _ :: • ql ........
i L _." -" -" + + +_.j ......._:-:,+. : : : : : :
; ; ; , I + l : ; .
: : : ; : : : : : ;
+ +++,j ]yJ + +#.++++_++_+++
el _I II el • ,
IDL
v
kJ
respiratory power (data not shown) for this subject was distributed
between 0.08 and 0.4 Hz. The post-bedrest spectra are shown in the
second row where increases in AP power are seen at the lowest
frequencies. The six spectra for each state were then averaged (to
enhance statistical stability) and are shown in the last row for both
pre- and post-bedrest. The AP spectral power (area under the curve)
was found to increase after bedrest for frequencies below .06 Hz. In
this subject, power in the HR spectrum was decreased by bedrest.
Data for the group of subjects are shown in Figure 9. In the top
two rows, spectra (one for each subject) are overlaid in plots of AP
(left) and HR (right), pre- (first row) and post- (second row) bedrest.
Each subjects' spectrum is the average of the 6, 2.5 min segments (in
Figure 8). These plots reflect power in the same frequency ranges asthose shown for the individual subjects in Figure 8. The pre- and
post-bedrest averaged spectra for the group are shown in the bottom row
where again, as in the single subject, AP power was increased in both
low frequency ranges by bedrest. There did not appear to be a
significant effect of bedrest in the HR spectra. Analysis of the
remaining subjects and variables and comparison of results with those
from the LBNP provocative tests are continuing.
REFERENCES:
Knapp, CF, JA Marquis, JM Evans, and DC Randall: 1978. Frequency
response of cardiovascular regulation in canines to sinusoidalacceleration of frequencies below 1 Hz (Basis for Biodynamic Modeling.
Paper reprinted from conference proceedings No. 253. AGARD Conferenceon "Models and Analyses for the Evaluation of Human Biodynamic
Response," Performance and Protection, Paris, France.
Knapp, CF, JM Evans, DC Randall and JA Marquis: 1982. Cardiovascular
regulation in canines during low-frequency acceleration. Am. J.
_. 243: H998-HI009.
Marquis, JA: 1978. Low frequency dynamics of cardiovascular
regulation in canines exposed to sinusoidal whole body acceler-ation.
Ph.D. Dissertation. University of Kentucky, Lexington, KY.
Charles, JB: 1983. Cardiovascular responses to untrained and endurance
trained dogs to oscillatory blood volume shifts. Ph.D. Dissertation,
university of Kentucky, Lexington, KY.
Knapp, CF: 1983. Response of the cardiovascular system to vibration
and combined stresses. Final report to AFOSR, Contract #F49620-83-K,
0002.
Aral, HM, JM Evans, DR Brown, DC Randall, SV McMinn and CF Knapp:
1986. Autonomic and renin-angiotension contributions to cardiovas-
cular regulation during sinusoidal blood volume shift. Society for
Neuroscience, 10th Annual Meeting, Washington, DC. (Abstract)
Knapp, CF: 1987. Hemodynamic effects of oscillating lower body
negative pressure. Space Life sciences Symposium: Three Decades of
Life Science Research in Space, Washington, DC.
59

Knapp, CF, J Evans, D Brown, D'Levenhagen, S and C DuPlessis, M Berk,
J and T Kotchen: 1990. The effect of volume depletion on heart rate
responses of high and low normotensive subjects during sinusoidallower body negative pressure. FASEB (Abstract)
Akselrod, S, D Gordon, FA Wibel, DC Shannon, AC Barger and RJ Cohen:
1981. Power spectrum analysis of heart rate fluctuations: A
quantitative probe of beat to beat cardiovascular control ScienceWashington, DC. 215:220"222. " ,
Rimoldi, O, S Pierini, A Ferrari, S Cerutti, M Pagani and A
1990. Analysis of short-term oscillations of R-R and
pressure in conscious dogs. Am. J. Physiol 258 (Heart Circ.27): H967-H976.
Malliani:
arterial
Physiol.
6O

N94-11'998_-6_-_
/_ _2_
EFFECT OF PROLONGED LBNP AND SALINE INGESTION ON
PLASMA VOLUME AND ORTHOSTATIC RESPONSES DURINGBED REST
Suzanne M. Fortney, Larry Dussack, Tracy Rehbein, Margie Wood, andLaura Steinmann
(NASA JSC Space Biomedical Research Institute (SD5) and KRUG LIFESCIENCES)
Supported by NASA RTOP 199-14-11-13: "Mechanisms of OrthostaticIntolerance", and JSC Director's Discretionary Funds
6_

ABSTRACT
Orthostatic intolerance remains a sign'ificant problem following
space flight despite frequent use of the saline fluid-loading
countermeasure and volitional use of an anti-gravity suit during re-entry and landing. The purpose of this project is to examine the
plasma volume (PV), endocrine, and orthostatic responses of bed-
rested subjects following 2-hr and 4-hr treatments of lower body
negative pressure (LBNP) and saline ingestion. Ten healthy men (25
to 41 yrs) underwent 13 days of 6o head-down bed rest. The men
were randomly assigned into 2 groups. Group A underwent a 4-hr
LBNP/saline treatment on bed rest day 5 and the 2-hr treatment on
day 11. Group B underwent the 2-hr treatment on day 6 and the 4-
hr treatment on day 10. Blood volume was determined before and
after bed rest using radiolabelling. Changes in PV between
measurements were calculated from changes in hematocrit and
estimated red cell volume. Urinary excretion of anti-diuretic
hormone (ADH) and aldosterone (ALD) were measured each day
during the study. Orthostatic responses were measured using a rampLBNP protocol before bed rest, before each treatment, and 24 hours
after each treatment. Both 2-hr and 4-hr treatments resulted in a
restoration of PV to pre-bed rest levels which persisted at least 24
hours. This increase in PV was associated with significant increases
in urinary excretion of ADH and ALD. Twenty-four hours after the
4-hr treatment, the heart rate and pulse pressure response to LBNP
were significantly lower and stroke volumes during LBNP were
increased. Twenty-four hours after the 2-hr treatment, there was no
evidence of improvement in orthostatic responses. These results
suggest that a countermeasure which simply restores PV during
space flight may not be sufficient for restoring orthostatic responses.
INTRODUC_ONANDBACKGROUND:
LBNP has been used as a procedure to assess orthostatic
responses postflight in the Apollo program (1), and in flight duringthe Skylab program (2). In the Soviet space program LBNP is
routinely used inflight both as an assessment procedure and as a
countermeasure for postflight orthostatic intolerance (3,4).
Cosmonauts perform the LBNP countermeasure while wearing a
flexible LBNP suit (the Chibis suit). The LBNP exposures are begun 5
to 21 days before landing, depending on the mission duration, and
are combined with fluid and salt ingestion. There is no data V
62 _:
available from the Soviet flight experience which would reveal the
precise mechanism by which their LBNP countermeasure acts to
improve orthostatic responses.
American research into the possible use of LBNP as a
countermeasure began in the 1960s. Lamb and Stevens (5), Stevens
et. al (6), and McCally et. al (7) performed studies indicating that
prolonged exposures (8-12 hrs daily) to LBNP during bed rest could
maintain body fluid balance (5), plasma volume (6), and orthostatic
responses (6,7). Hyatt and West (8) were the first to combine the
LBNP exposure with fluid ingestion. They reported a restoration of
plasma volume and significantly reduced heart rate and blood
pressure changes during LBNP, in men after 7 days of bed rest. They
concluded that the improvement in orthostatic responses was most
likely the result of the increased plasma volume and that further
work was required to determine the minimum exposure duration
required to provide such improvements.
PURPOSE AND HYPOTHESES:
The operational purpose of this project is to determine whetherthe LBNP/saline countermeasure proposed by Hyatt and West (8)
may be reduced to 2 hours and still maintain the beneficial effects on
plasma volume and orthostatic responses. In answering this
question, we hope to gain a better understanding of potentialmechanisms for the loss of orthostatic function during a simulated
space flight-- 13 day bed rest--and a greater understanding of the
specific mechanisms by which prolonged LBNP during bed rest may
reverse some of these changes.
We hypothesize that during prolonged LBNP exposures, fluid is
redistributed from the thoracic region of the body to the lower body,
thus stimulating cardiopulmonary mechanoreceptors. The unloading
of these receptors due to the decrease in central blood volumeresults in an increased secretion of ADH and ALD. Increased levels of
ADH and ALD result in fluid and electrolyte retention during the 24
hour period after the LBNP/saline countermeasure. In addition, theaccumulation of fluid in the lower body during LBNP may result in
the filtration and sequestration of fluid in the lower body tissues.
This fluid is later reabsorbed, and in the presence of elevated ADH
and ALD may contribute to the plasma volume expansion. The
restoration of plasma volume will result in a larger stroke volume,
63

lower heart rates, higher blood pressures, and a larger cardiac output
during a graded orthostatic stress such as LBNP.
METHODS AND PROCEDURES:
Ten men (25 to 40 yrs; 169 to 182 cm. height; 66 to 90 kg
weight; and 45 to 59 ml/min/kg maximum oxygen consumption)
participated in this study.
The study protocol involved a crossover design with the
subjects randomly assigned to two groups, group A and group B. The
experimental protocol is shown in Figure 1. Each subject was
exposed to one 4-hr and one 2-hr LBNP/saline treatment, with half
the subjects exposed to the _ 4-hr _tfeatment firs_ _ and the 2-hr
tr_htment second (group_A), and the:' other _ half exposed to the "2-hr
treatment first and the 4-hr treatment second (group B). During
each treatment, the subject was exposed to a continuous negative
pressure exposure of -30 mm Hg and ingested one liter of isotonic
saline between exposure minutes 30 and 90.
Blood volume was calculated as the sum of red cell volume
(RCV) and PV measurements obtained before and on the last day of
bed rest. RCV was determined with 51chromium suifate and PV was
determined with 125iodinate d human serum albumin. PV was
calculated for each bed rest day from the daily RCVd (RCVd = pre
bed rest RCV minus the accumulative loss of red cells due to daily
blood draws) and the daily hematocrit value; where PV =
(RCVd/(hct/100)) RCVd.
Pre-syncopal LBNP tests (graded LBNP exposures in 3 min.
stages which continued Until pre-_ynC6pal symptoms were observed)
were done before and after bed rest. LBNP response tests (graded
LBNP exposures in 5 min. stages from 0 to -60 mm Hg in 10 mm Hg
steps) were performed pre-bed rest, before each treatment, and 24hours after each treatment.
64

"_V4"
FIGURE 1 : BEDREST PROTOCOL
BEDREST
DAY
-2 YES
-1 YES
2 YES
3
5
6
7
8
O YES
10 YES11 YES
12 YES
13
R1 'YES
R2
BLOOD
DRAWN
YES
YES
YES
YES
YES
YES
HORMONES
DETERMINED
BLOOD
VOLUME
LBNP PROCEDURE
GROUP
A
PSL-LBNPLBNP
LBNP4HR LBNPLBNP
LBNP
2HR LBNPLBNPPSL-LBNPLBNPLBNP
GROUPB
PSL-LBNPLBNP
LBNP
2HR LBNPLBNP
LBNP4HR LBNPLBNP
PSL-LBNPLBNPLBNP
Each subject underwent a 13-day, 6 ° head-down bed rest, two
days of ambulatory control before bed rest, and two days of
ambulatory recovery after bed rest. Throughout bed rest fluid, salt,
and food intake were maintained at 2500 ml of rehydration
fluid/day, 4 grams of salt/day, and 2500 Kcal/day. Twenty-four
hour urine collections were obtained each day of the study from
which volume, electrolytes, ADH, and ALD concentration were
measured. Venous blood samples were obtained without stasis each
morning and before each LBNP test. Hematocrit and hemoglobin
concentration were determined from each sample.
RESULTS AND DISCUSSION:
A. Pre-syncopal LBNP Results--Pre vs. Post Bed Rest
The effect of 13 days of bed rest on LBNP tolerance is shown in
Figure 2; where "LBNP tolerance" is defined as the LBNP pressure
tolerated for at least one minute without pre-syncopal symptoms.
Not all subjects had a decrease in LBNP tolerance during bed rest and
65
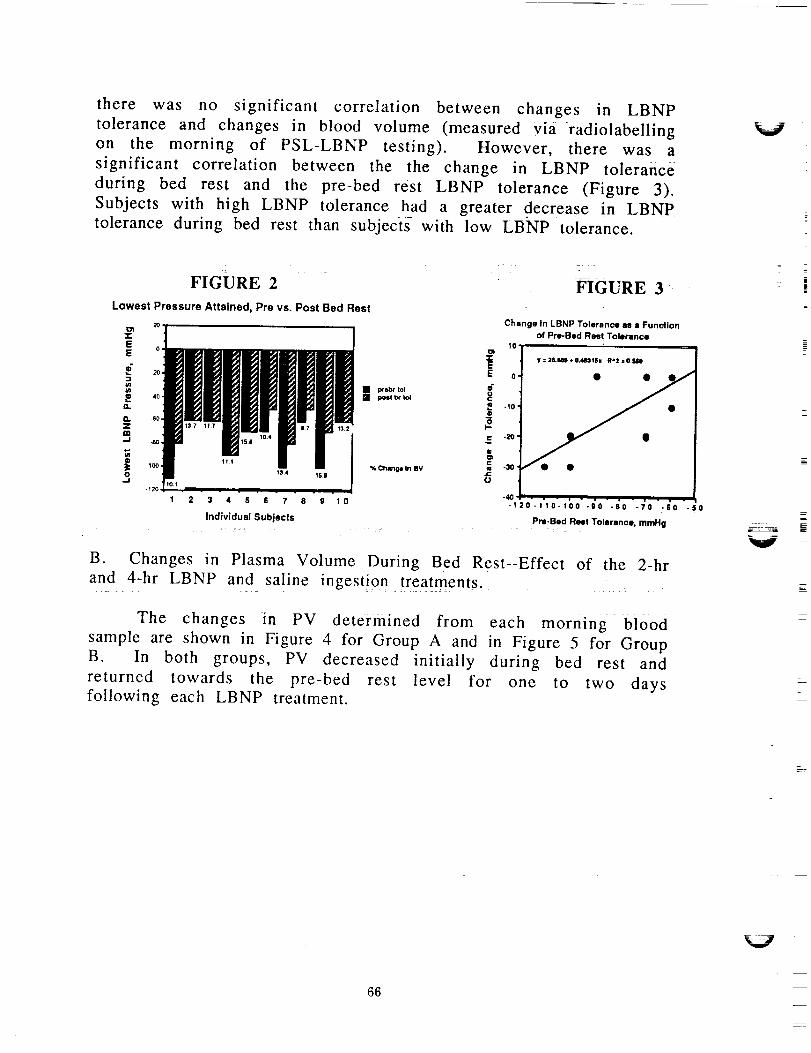
there was no significant correlation between changes in LBNPtolerance and changes in blood volume (measured via-radiolabelling
on the morning of PSL-LBNP testing). However, there was a
significant correlation between the the change in LBNP tolerance
during bed rest and the pre-bed rest LBNP tolerance (Figure 3).
Subjects with high LBNP tolerance had a greater decrease in LBNP
tolerance during bed rest than subjects with low LBNP tolerance.
V
1 2 3 4 5 6 7 8 9 10
individual Subjects
FIGURE 3
Change In LBNP Tolerance es a Function
of Pre-Bad Rest Tolerance
10 ,oD
0 y : 26,M(I + 0.48311hl RA2 = O.SIM)
.loe
gu¢ -30,
-40 , _ , . . • .
-12o-11o-loo -0O -co -7o -6o -so
Pre-Bed Rest Tolerance, mmHg
B. Changes in Plasma Volume During Bed Rest--Effect of the 2-hr
and 4-hr LBNP and saline ingestion treatments.
The changes in PV dete-i--inined from each morning blood
sample are shown in Figure 4 for Group A and in Figure 5 for Group
B. In both groups, PV decreased initially during bed rest and
returned towards the pre-bed rest level for one to two daysfollowing each LBNP treatment.
i
|
66

FIGURE 4
% Change In Plasma Volume, group s
1210
e T 4 hr LBNP ,r
.,°] ".''" L* 2hr_.._I . ., .,., .,., ..-,-I- ,-.-
"12._2"(d'l _; 3 4 s S 7 e 0101u21z 41s_
Bed Rest Day
FIGURE 5
lO
8
:p
m_. .2
@ -6
c -8,
-1ou
-14
% Change in Plasma Volume, group bn=5
2 0 2 4 6 | 10 12 14 14
Bed Rest Day
C. ADH, ALD, and PV during Bed Rest: effect of LBNP and saline
ingestion:
There were no significant differences between the two groups
in any of the treatement or bed rest responses (analysis of variance).
Therefore, the data from both groups was combined to compare the
effect of the LBNP and saline ingestion treatments on PV, endocrine,
and orthostatic responses. PV was calculated from blood samples
drawn immediately before each LBNP response test and ADH and
ALD secretion were determined from 24-hr urine samples (Table 1).
PV was significantly reduced from pre,bed rest levels before each
LBNP treatment, but, 24 hours after each treatment PV was no
longer significantly different from pre bed rest. On the day of each
LBNP treatment, there was a significant increase in the secretion of
both ADH and ALD (compared to pre-treatment) which may have
contributed to the plasma volume expansion.
TABLE 1
PreBR Pre 4hr Post 4hr
PV (ml) 3157(161)UV (ml) 2506(250)ADH (ng) 136(33)ALD (ng) 16(4)
Pre 2hr
• 2918(132) 3144(173) "2987(131) 3109(146)2538(155) +2923(111) 2258(162) +2788(191)114 (15) +177 (26) 93 (18) +155 (42)
•35(4) +*54(5) *37(7) +'46(7)
* = Different from pre bed rest, P <0.05.
+ -- Different from pre treatment (pre 4hr or pre 2hr), P < 0.05.
67

D. Orthostatic Responses during Bed Rest--effect of LBNP and salinetreatments
The results in Table 2 illustrate the orthostatic responses
(mean + S.E.) for all 10 subjects by presenting specific cardiovascular
variables during the final (-60 mm Hg) LBNP exposure level. Heart
rates were significantly higher than pre bed rest during all pre and
post LBNP treatment tests, although post treatment, the heart rates
were lower than pre treatment. Pulse pressure was significantlyreduced during bed rest without LBNP treatment but not after
treatment. Stroke volume was reduced significantly during bed rest
without treatment, but not following treatment. Cardiac output
(measured by continuous wave Doppler at the suprasternal notch)was not affected by either bed rest or LBNP treatment.
TABLE 2
Pre-BRHeart rate (bpm) 111 (5)Pulse Pressure (mm Hg) 25 (3)Cardiac Output (I/rain) 4.2 (0.4)Stroke Volume (ml/beat) 39 (5)
Pre-4hr Post-4hr _ Pos_
"134 (4) "128 (5) "144 (5) "134 (5)"16(2) 19 (2) "18 ('3) 19 (3)
3.7 (0.2) 3.8 (0.4) 3.6 (0.3) 4.0 (0.3)*27 (2) 29 (3) *27 (3) 29 (3)
* = Different from pre bed rest value, P < 0.05.
Figures 6 and 7 illustrate the mean + S.E. heart rate response to
the entire LBNP ramp test (0 to -60 mm Hg) and they compare this
response pre bed rest, during bed rest before treatment (pre 2-hr
and pre 4-hr) and 24 hours after the 4-hr and 2-hr treatments.
After the 4-hr treatment, the heart rate response was
significantly elevated from pre-bed rest, but significantly improved
from pre treatment (pre 4-hr). The effectiveness of the treatment to
lower heart rate diminished with increasing LBNP exposure.
After the 2-hr treatment, the heart rate response was
significantly elevated from pre bed rest and there was no significant_mprovement after the treatment.
V
V
68

E 12oD..o
o
_" 1oo
t:mo"T"
8o
FIGURE 6
Effect of 4hr Soak
Pm 4hr I
24 Post 4hr
Pre br
2_, " " A 6"0 so
Ibnp _m
ii -*l Webr
pn_4hr
24p_ 4_
n=10
11;o
14o,
E
g120
m
rr100
't:
O-r'
S0,
IR,
FIGURE 7
Effect of 2 hr Soak
Posl 2hr
Pro br
,'_
• n=lO
2 0 4 0 S'O
Darm from "brhr" Ibnp pressure
Bo
CONCLUSIONS:
1) The loss of tolerance to LBNP after 13 days of bed rest is most
marked in individuals with high LBNP tolerance pre bed rest.
2) Prolonged LBNP exposures during bed rest effectively increase PVfor at least 24 hours and this expansion may be related to an
increased secretion of ADH and ALD.
3) 4-hr LBNP exposures combined with salt water ingestion may
provide some improvement of orthostatic responses for
approximately 24 hours. 2-hr exposures are less effective.
SIGNIFICANCE:
Prolonged LBNP and saline ingestion may provide an effective
means to restore PV during space flight. However, with this
particular protocol (LBNP pressure and fluid ingestion) a 2 hour LBNP
exposure is not sufficient to restore orthostatic responses.
REFERENCES:
1) Hoffler, GW, and RL Johnson. Apollo flight crew cardiovascular
evaluations. In: Biomedical Results of Apollo. Edited by RS Johnston,
LE Dietlein, and CA Berry, NASA SP-368, 1975, pg. 227-264.
69

2) Johnson, RL, GW Hoffler, AE Nicogossian, SA Bergman, and MM
Jackson. Lower body negative pressure- third manned skyiabmission. In: Biomedical Results from Skylab. Edited by RS Johnstonand LF Dietlein. NASA SP-377, 1977, pgs. 284-312.
3) Mikhaylov, VM, Pometov, YD, and VA Andretsov. LBNP trainingof crew members on main missions aboard salyut-6 orbital station.Kosm. Biol. i. Aviakosm. Med. 18: 29-33, 1984.
4) Kakurin, LI, BS Katkovskiy, VA Tishler, GI Kozyrevskaya, VS
Shashkov, VS Georgiyevskiy, AI Grigor'yev, VM Mikhaylov, OD
Anashkin, GV Machinskiy, AA Savilov, and YP Tikhomirov.
Substantiation of a set of preventive measures referable _ to the
objectives of missions in the salyut orbital station. Kosm. Biol. iAviakosm. Med. 12: 20-27, 1978.
5) Lamb, LE, and PM Stevens. Influence of lower body negative
pressure on the level of hydration during bed rest. Aerospace Med.36: 1145-1151, 1965.
6) Stevens, PM, PB Miller, CA Gilbert, TN Lynch, RL Johnson, and LE
Lamb. Influence of long-term lower body negative pressure on the
circulatory function of man during prolonged bed rest. AerospaceMed. 37" 357-367, 1966.
7). McCally, M, TE Piemme, RH Murray. Tilt table responses of
human subjects following application of lower body negativepressure. Aerospace Med. 37- 1247-1249, 1966.
8) Hyatt, KH and DA West. Reversal of bedrest-induced orthostatic
intolerance by lower body negative pressure and saline. Aviat. SpaceEnviron. Med. 48" 120-124, 1977.
V
V
70

k_j
N94- 11 999
Research Summaryfor: g2%
NASA Grant NAG9-297
"Fitness, Autonomic Regulation and Orthostatic Tolerance" \
Principal Investigator: Jay C. Buckey, M.D.
Work on this grant has consisted of two major studies of
cardiovascular regulation in athletes along with several smaller
supporting studies. This summary will give a brief overview of two
major studies, and then conclude with an analysis of what the
findings from these studies mean practically, and how they can be
applied to current problems with post-flight orthostatic
intolerance.
BACKGROUND
Orthostatic intolerance has been a consistent finding after
spaceflight. The factors modulating the severity of this
intolerance, however, have not been clear. Also, the adaptation
leading to postflight orthostatic intolerance has been called
"cardiovascular deconditioning", implying that exercise might help
to prevent orthostasis. But the relationship between aerobic
fitness and orthostatic intolerance is controversial. For example,
the U.S. Air Force encourages its fighter pilots to avoid excessive
aerobic training, out of a concern that it might reduce G
tolerance. On the other hand, aerobic exercise is being studied as
a possible countermeasure for the orthostatic intolerance seen
after spaceflight.
To deal with this controversy, this project had two main
goals. One was to determine whether aerobically trained individuals
do indeed have greater orthostatic intolerance, and if so, what are
the mechanisms. The second was to determine the differences between
those individuals with orthostatic intolerance and those without,
to see if any mechanisms for the intolerance could be elucidated.
Dr. Benjamin Levine at UT-Southwestern was the leader of the team
performing the studies done for this project.
STUDY I: CROSS-SECTIONAL STUDY OF ORTHOSTATIC INTOLERANCE IN HIGHLY
AEROBICALLY TRAINED INDIVIDUALS
(see enclosed paper Levine et al. "Physical Fitness and
Cardiovascular Regulation: Mechanisms of Orthostatic Intolerance"
for complete data.)
The first study was a cross-sectional study of individuals
with varying degrees of fitness. Three groups were identified, a
high fit group (Max. VO2=60 ml/_in/kg), a mid-fit group (Max.
VO2=48.9 ml/min/kg) and a low-fit group (Hax. VO2=35.7). The large
range of fitness levels allowed for correlations to be drawn
between fitness and various cardiovascular variables--including
orthostatic intolerance. Graded lower body negative pressure (LBNP)
was used to measure orthostatic tolerance, and as a test of
cardiovascular regulation. Cardiac output, stroke volume, heart
rate, blood pressure, arm flow, plasma volume and maximal leg
7!
conductance were measured during supine rest. The changes incardiac output, stroke volume, heart rate, blood pressure, and armflow were measured during LBNP.
Baroreceptor function was measured two ways. A neck collarmade of silastic was placed around the neck to stimulate thecarotid baroreceptors. A short R-wave triggered protocol duringheld expiration was used to measure "open-loop" baroreceptorfunction, and a prolonged (2 minute) protocol using random sequenceof negative and positive pressures was used to measure !'closed-loop" gain. The "open-loop" procedure and equipment used for thebaroreflex testing was the same as the one used after Shuttleflights as part of DSO #467.
The study produced several interesting results. The highly fit
individuals did have lower orthostatic tolerance, when compared to
the mid and low fit subjects together (LBNPxtime=l175 mmHg-min
high-fit, 2003 mid-fit, 1883 low-fit). But, orthostatic tolerance
(as measured by LBNP) did not correlate with VO2. A multivariate
function predicting tolerance was developed, and it included terms
both related and unrelated to physical fitness. This indicates that
orthostatic tolerance is a complex function of many different
variables, and that no linear relationship between fitness and
orthostatic tolerance exists. It is also clear, however, that
orthostatic tolerance is not better in the fit individuals, which
calls into question using regular aerobic training to counterorthostatic intolerance.
The baroreceptor data was also intriguing. Typically, the
baroreceptor curves use R-R interval as the dependent variable.
Differences in R-R interval can be expected since the fit
individuals will have lower heart rates. This change in baseline
heart rate does not necessarily reflect a change in baroreflex
responsiveness. The important consideration, when investigating
orthostatic intolerance, is what would the change in blood pressure
be for a given change in heart rate. Since a fit individual also
has a greater stroke volume than an unfit one, the same heart rate
change will lead to a much greater change in cardiac output in the
fit person. To compensate for this, the baroreceptor curves were
plotted in a novel way, using the effective change in blood
pressure (the triple product of heart rate, stroke volume and total
peripheral resistance) as the dependent variable. No differences in
baroreceptor function between groups were seen, but "closed-loop"
gain of the carotid baroreceptor did correlate with orthostaticintolerance.
Although fitness was not a strong predictor of orthostatic
tolerance, the data could be anL!yzed in a different way. How did
the subjects who did experience pre-syncope differ from those who
did not? When this analysis was done, one striking finding emerged
(Figure i). The people who did have pre-syncope not only had a
greater stroke volume, but had a greater decrease in stroke volume
during LBNP, This suggested that the fainters were having a greater
V
V
V
72

decrease in filling pressure than the non-fainters, could this be
due to a difference in ventricular compliance between the groups?
STUDY #2: _VENTRIcULAR PRESSURE/VOLUME RELATIONSHIPS IN ATHLETES
(see enclosed paper Levine et al. "Left Ventricular Pressure/Volumeand Frank/Starling Relations in Endurance Athletes: implications
for Orthostatic Tolerance and Exercise Performance" for complete
data.)
The question about compliance led to the second major study on
this grant. Perhaps there is another, less studied, mechanism
behind the orthostatic intolerance seen in very highly aerobically
trained individuals. Differences in myocardial compliance between
highly fit and unfit individuals would led to strikingly different
Frank-Starling relationships The highly fit athlete not only has a
larger resting stroke volume than the non-athlete, but is also ableto increase stroke volume during exercise to a greater extent than
the non-athlete. This suggests that the athlete's heart operates on
the steep portion of the Starling curve. While this may be an
advantage during exercise, allowing for greater increases in stroke
volume for a given change in filling pressure, this could also be a
major disadvantage during orthostatic stress. Stroke volume would
drop to a greater degree with a fall in filling pressure.
To test this hypothesis, two groups of subjects were studied.
One consisted of highly trained endurance athletes (Max. VO2 =68
ml/min/kg), and the other sedentary subjects (Max. VO2 =41
ml/min/kg). Left ventricular end-diastolic pressure was measured
with a Swan-Ganz catheter. This pressure was varied using twointerventions, lower body negative pressure to -15 and -30 mmHg,
and saline infusion at 15ml/kg and 30ml/kg. Cardiac volume was
measured with two techniques. Stroke volume was calculated from
acetylene rebreathing cardiac outputs and end-diastolic volume was
calculated from echocardiography-
The results from this study are shown in Fig. 2. The fit
subjects have a much greater change in stroke volume for a given
change in pulmonary capillary wedge pressure. The echocardiographic
data produced the same result; the athletes had greater decreases
in end-diastolic volume with LBNP. The athletes also had
significantly less orthostatic tolerance as measured by LBNP. This
suggests that basic cardiac structural differences (i.e. a change
in myocardial compliance) may be significant contributors to
orthostatic tolerance.
73

CONCLUSIONSAND RELEVANCE
Orthostatic intolerance and aerobic fitness
In both these studies, the fit individuals had diminishedorthostatic tolerance compared to unfit controls. This supports thedata from many other studies showing a decrease in orthostaticintolerance with aerobic fitness. It is significant, however, thatthis is not a simple, linear relationship. The interactions betweenorthostatic tolerance and fitness are complex, many highly fitindividuals have excellent tolerance while many unfit subjectspass out easily.
Nevertheless, several inferences can be made. Whileproscribing aerobic exercise for astronauts in sground would be excessive usin_ ..... ___ _ _ pace or on the
, _ _±_r _nuense aerobic exerciseas a countermeasure for orthostatic intolerance does not makesense. The relationship between fitness and orthostatic tolerancemay be U shaped. Very highly fit subjects are on the steep portion
of the Frank-Starling relationship, moderately fit subjects have
the best tolerance, and very unfit subjects (such as would occur
after bedrest or spaceflight), like the highly fit subjects, also
have hearts on the steep portion of the Starling curve. In the very
unfit subject, plasma volume and stroke volume are so low that verysmall changes in filling pressure would lead to orthostatic
instability. This may explain why the bouts of maximal exercise
proposed by Convertino are effective during bedrest in reducing
post-bedrest orthostatic intolerance. The bed-rested subjects may
experience a transient increase in plasma volume and stroke voltrmeafter the exercise thereby moving "up" the Frank-Starling curve.
Extensive, regular aerobic conditioning in space may be useful
for bone or muscle atrophy, and for maintaining endurance, but not
for combatting orthostatic intolerance. This does not mean that
exercise itself has no role, since static exercise and bouts of
maximal aerobic exercise Cas mentioned above) have been shown toimprove orthostatic tolerance.
Mechanisms of orthostatic intolerance
Often, studies on orthostatic intolerance focus on differences
in cardiovascular regulation. Various tests have been used to studythe heart rate, cardiac output and peripheral responses to
orthostatic stress to see if the response is blunted. For example,the first study in this series used extensive measurements of
baroreceptor function to test the hypothesis that baroreceptor
responsiveness was impaired in the fit subjects. Despite this, no
striking differences in baroreceptor function were noted between
groups. This does not mean that the baroreceptors have no role,
since closed loop gain did correlate with orthostatic tolerance,but does indicate that any orthostatic intolerance seen in fit
individuals cannot immediately be ascribed to baroreceptordifferences.
74

k_J
Another possibility to explain differences in orthostaticresponses, could be a greater decreases in filling pressures withorthostatic stress. This can be ascribed to basic structuralchanges in the cardiovascular system (i.e. compliance of themyocardium), rather than a change in neurohumoral regulation. Inathletes, this reasoning provides a very useful way of thinkingabout orthostatic intolerance. The Frank-Starling relationshipshows that high stroke volumes during exercise and the large dropin stroke volume with standing are really two sides of the samecoin. The shift in the athletes to the steep portion of theStarling curve provides an advantage during exercise and adisadvantage with orthostatic stress.
The athletes produced several structural changes in theircardiovascular systems. They have a greater blood volume at thesame central venous pressure as unfit subjects, indicating a muchgreater venous capacity. Also, their maximal vascular conductanceis greater, indicating a greater ability for vasodilation.
Analysis of baroreceptor function
One other result from the set of studies performed on this
grant has been a new way to analyze baroreceptor function curves.
Typically, R-R interval is plotted as a function of carotid
distending pressure to produce a curve describing carotid
baroreceptor function. R-R interval is used since it reflects the
change in vagal outflow.
This approach has a problem when studying orthostatic
intolerance in individuals with different resting values of heart
rate, stroke volume and total peripheral resistance. Similar
changes in R-R interval in two subjects with greatly differing
levels of TPR, for example, would result in widely different
changes in blood pressure. This means that to interpret the
baroreflex curves, the effective change in blood pressure that
would result from a change in R-R interval is important.
One limitation to this approach is the assumption that stroke
volume and total peripheral resistance stay relatively constant
during a baroreflex testing session. This was checked during a
supporting study done as part of this grant. Stroke volume was
measured using Doppler echocardiography during the sequence of R
wave triggered changes in carotid distending pressure used in the
studies. Stroke volume changed less than 5% during the baroreflex
test (see enclosed abstract "The Effect of Carotid Baroreceptor
Stimulation on Stroke Volume").
Overall, the approach of u_ing the effective change in blood
pressure proved useful in normalizing baroreflex curves for greatly
different basal values of stroke volume and total peripheral
resistance. Obviously, this is a simplified approach that applies
an analysis more appropriate for steady flow to a system with
pulsatile flow. Nevertheless, it does allow for more meaningful
comparisons between groups, and has been used during a study of
75

changes in baroreceptor function with posture (see enclosedabstract "Effect of posture on the carotid baroreflex").
SUMMARY
The studies performed on this grant have provided newinformation about fitness and orthostatic intolerance. Orthostatic
intolerance is more prevalent in highly trained athletes, but it is
not a simple, linear function of VO2 max. The mechanism may have
more to do with myocardial compliance, as reflected in the
different Frank-Starling relationships (LV end-diastolic pressure
vs. LV diastolic volume) between elite athletes and sedentary
controls. These points are described in detail in the enclosed
paper by Levine, "Regulation of central blood volume and cardiac
filling in endurance athletes-utilization of the Frank-Starlingmechanism as a determinant of orthostatic tolerance."
V
76

k_/
Publications from NASA Grant NAG9-297
Papers:
Levine BD, Buckey JC, Fritsch JM, Yancy CW, Watenpaugh DE, Snell
PG, Lane LD, Eckberg DL, Blomqvist CG: Physical fitness and
cardiovascular regulation: mechanisms of Orthostatic intolerance.
j. Appl. Physiol. (in press).
Levine BD: Regulation of central blood volume and cardiac filling
in endurance athletes-utilization of the Frank-Starling mechanism
as a determinant of orthostatic tolerance. Med. sci. Sports Exer.,
23, (in press). D Buckey JC, Friedman DB, Blomqvist CG: LeftLevine BD, Lane L , ..... _ _ -Starling relations in
ventricular pressure/volume _nu _nkendurance athletes: implications for orthostatic tolerance and
exercise performance. Circulation (submitted).
Abstracts:
Levine BD, Buckey JC, Fritsch JM, Yancy CW, Watenpaugh DE, Eckberg
DL, Blomqvist CG: Physical fitness and orthostatic tolerance: The
role of the carotid baroreflex, clin. Res. 36(3):295A, 1988.
Levine BD, Buckey JC, Fritsch JM, Yancy CW, Watenpaugh DE, Eckberg
DL, Blomqvist CG: Physical fitness and cardiovascular regulation:
orthostatic intolerance- Circulation, 80(4):II-291, 1989.
Levine BD, Buckey JC, Friedman DB, Lane LD, Watenpaugh DE,
Blomqvist CG: Right atrial pressure (RA) vs. pulmonary capillary
wedge pressure (PCW) in normal man. circulation, 80(4):II-250,
1989.
wright SJ, Levine BD, Blomqvist CG: Effect of posture on the
carotid baroreflex, circulation, 82(4):III-515, 1990.
Levine BD, Lane LD, Buckey JC, Friedman DB, Blomqvist CG:
Ventricular pressure/volume relations in endurance athletes: non-
autonomic determinants of orthostatic tolerance, circulation,
82(4):III-694, 1990.
Levine BD, Pawelczyk JA, Buckey JC, Parra BA, Raven PB, Blomqvist
CG: The effect of carotid baroreceptor stimulation on stroke
volume, clin. Res., 38(2):333A, i990.
77

Figure
STROKE VOLUME
EARLY (..{.--50mrnHG) vs LATE OR NO PRE-SYNCOPE150
125
100.3
75-
so
25
Figure 2
.... _ -"' "" "" "_l_&_'_ """ ",., _. _, .,,,,._.. ¢.
@= LATE OR NO PRE-_':'(NCOPE "_.,,,• @
-100 10 20 30 40 50
LBNP (-mrnHG)
STARLING CURVES
60
O
_E
et
v0n,-I=-
100
500 10
PULMONARYCAPILLARYWEDGEPRESSURE(mmHg)2O
V
'78

" N94-12000
Valsalva maneuver: Insights into baroreflex
modulation of human sympathetic activity
MICHAEL L. SMITH, DWAIN L. ECKBERG, JANICE M. FRITSCH,
LARRY A. BEIGHTOL, AND KENNETH A. ELLENBOGEN
Departments of Medicine and Phvsioloqy, Hunter Holmes McGuire
Department of Veterans Affairs Medical Center, and Medical Colleq?
of Virginia, Richmond, Virginia 23249
. j
79

METHODS
We recorded R-R intervals, tidal volumes, arterial pressures,
expiratory pressures, and muscle sympathetic nerve activity on
electrostatic and FM recorders. Two protocols were followed.
Protocol #I: Nine subjects performed five Valsalva maneuvers at
each of three expiratory pressures (i0, 20, and 30 mmHg) during
which muscle sympathetic activity was recorded. The order of
pressure levels was randomized. Protocol #2: Six subjects
performed five Valsalva trials at 30 mmHg during which right atrial
pressure was recorded from a saline-filled catheter connected to a
pressure transducer. The same parameters listed above were measured
except muscle sympathetic nerve activity. This protocol was used to
determine the time course of return of right atrial pressure to
baseline levels after a strain, and the relation of this time
course to the return of arterial pressure.
%.,
RESULTS
A sample tracing of one Valsalva trial from one subject is
depicted in Fig. i. The typical phases of the Valsalva maneuver and
their sympathetic responses are shown clearly. These include phase
1 elevation of arterial pressure and inhibition of sympathetic
activity at the onset of straining; phase 2 reduction of pressure
and increase of sympathetic activity as straining continues; phase
3 abrupt decrease of pressure and increase of sympathetic activity
after release of straining; and phase 4 elevation of pressure and
inhibition of sympathetic activity during resumption of controlled-
rate breathing.
8O

k_/
Relation between sympathetic nerve activity and arterial
pressure. Average changes of peak muscle sympathetic nerve
activity during straining and arterial pressure during phase 4 are
listed in Table i. Absolute sympathetic nerve activity correlated
only modestly with absolute diastolic pressure during straining (r
= 0.55, p < 0.05); whereas, beat-to-beat change of sympathetic
nerve activity correlated well with beat-to-beat change of
diastolic pressure (r = 0.79, p < 0.01). Peak sympathetic activity
during straining correlated significantly with phase 4 increases of
systolic and diastolic pressures (r > 0.80; p < 0.0001).
Post-strain sympathetic inhibition. Several measurements were
made to determine what physiologic adjustments account for post-
strain sympathetic inhibition. The time to return of baseline
systolic pressure, sympathetic activity, and the occurrence of the
first post-straining sympathetic burst correlated significantly
with the intensity of straining. The time of return to baseline
sympathetic nerve activity was consistently greater than the return
to baseline arterial pressure (Fig 3).
Six subjects were studied to determine the time of return to
baseline right atrial pressure after Valsalva straining. The time
of return to baseline right atrial pressure (27.3 _ 3.0 s) was not
different (p = 0.40) from time of return to baseline systolic
arterial pressure (24.5 ± 2.2 s), and therefore was not predictive
of the return to baseline sympathetic nerve activity.
k_/
8!

SUMMARY
Valsalva's maneuver, voluntary forced expiration against a
Closed glottis, is a well-characterized research tool, used to
assess the integrity of human autonomic cardiovascular control.
Valsalva straining provokes a stereotyped succession of alternating
positive and negative arterial pressure and heart rate changes
mediated in part by arterial baroreceptors. Arterial pressure
changes result primarily from fluctuating levels of venous return
to the heart and changes of sympathetic nerve activity.
we measured muscle sympathetic activity directly in nine
volunteers to explore quantitatively the relation between arterial
pressure and human sympathetic outflow during pressure transients
provoked by controlled graded Valsalva maneuvers. Our results
underscore several properties of sympathetic regulation during
Valsalva straining. First, muscle sympathetic nerve activity
changes as a mirror image of changes in arterial pressure. Second,
the magnitude of sympathetic augmentation during Valsalva straining
predicts phase 4 arterial pressure elevations. Third, post-Valsalva
sympathetic inhibition persists beyond the return of arterial and
right atrial pressures to baseline levels which reflects an
alteration of the normal relation between arterial pressure and
muscle sympathetic activity. Therefore, Valsalva straining may
have some utility for investigating changes of reflex control of
sympathetic activity after spaceflight; however, measurement of
beat-to-beat arterial pressure is essential for this use. The
utility of this technique in microgravity can not be determined
from these data. Further investigations are necessary to determine
V
V
82

whether these relations are affected by the expansion
intrathoracic blood volume associated with microgravity.
of
83

TABLE i. Peak sympathetic nerve activity during straining andarterial pressure elevations after Valsalva straining
V
Valsalva pressure, mmHg
i0 20
Sympathetic activity,
arbitrary units/10 s
Change of systolic
pressure, mmHg
Change of diastolic
pressure, mmHg
1905_203 3086±374
i0.4_1.2 17.9!1.4
3.6+0.7 7.8+1.0
3O
4801±505
25.5+1.8
13. I+i. 1
All values are mean + SEM. All changes were significantly different
from zero (p < 0.001_ n = 7). Pressure changes reflect the Phase 3
to 4 change; sympathetic increases reflect peak increase duringPhase 2.
V
84
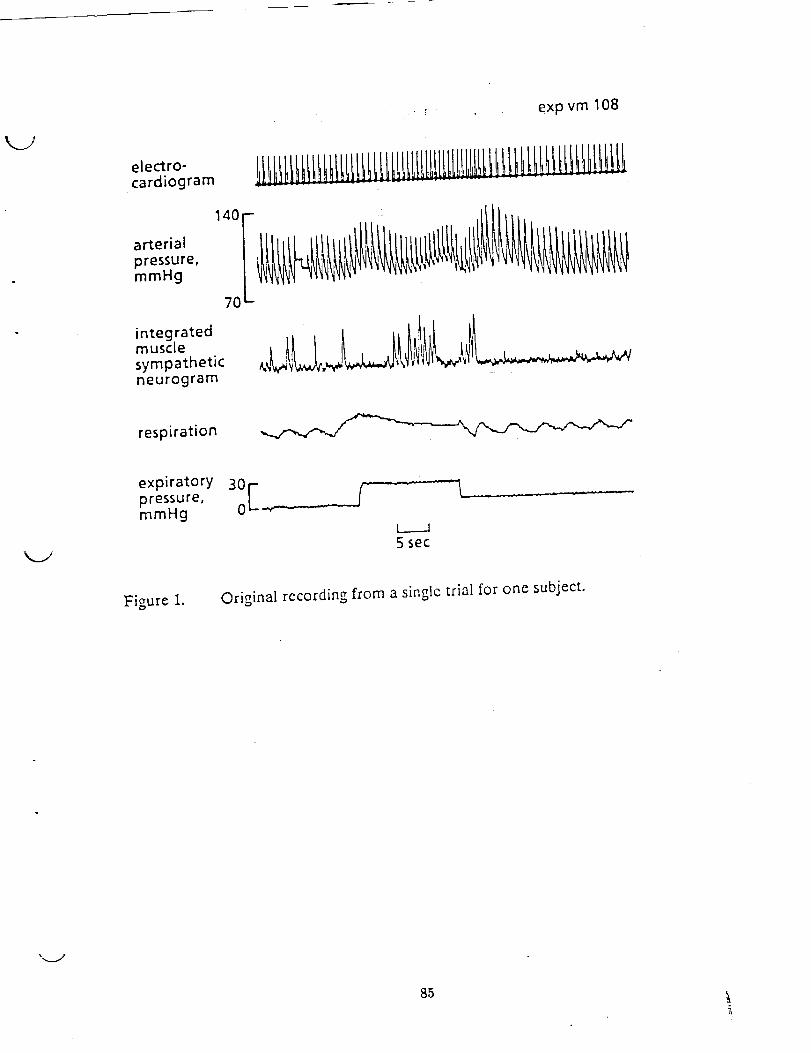
K_Y
exp vm 108
electro-cardiogram
arterial
pressure,mmHg
integratedmusclesympatheticneurogram
140 I
7O
respiration
expiratorypressure,mmHg
Figure 1.
30 J-"'
L_._..A5 sec
Original recording from a singlc trial for one subject.
".,._j
85
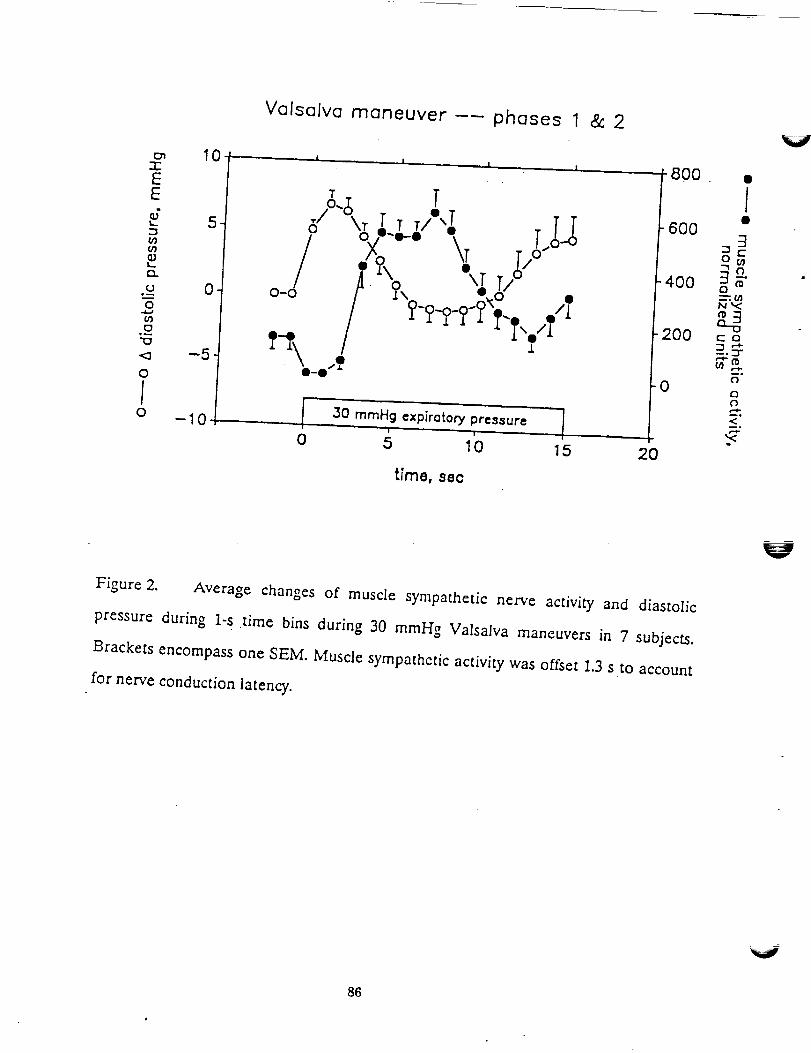
Valsalva maneuver -- phases 1 & 2
TTI _._: T /5 o \1" 1" T/ "e 600
_ ,,J .. J _, "o. _ r/" t-4oo o_.._ _-/ o-d /'_ Y\_ _6" . /
8 O0 c a
--5 _ i = "*
"" g0 "-"
o _ ,_10 15 20
time, 8e¢
Figure 2. Average changes of muscle sympathetic nerve activity and diastolic
pressure during 1-s time bins during 30 mmHg VaIsalva maneuvers in 7 subjects.
Brackets encompass one SEM. Muscle sympathetic activity was offset 1.3 s to account
for nerve conduction latency.
V
86
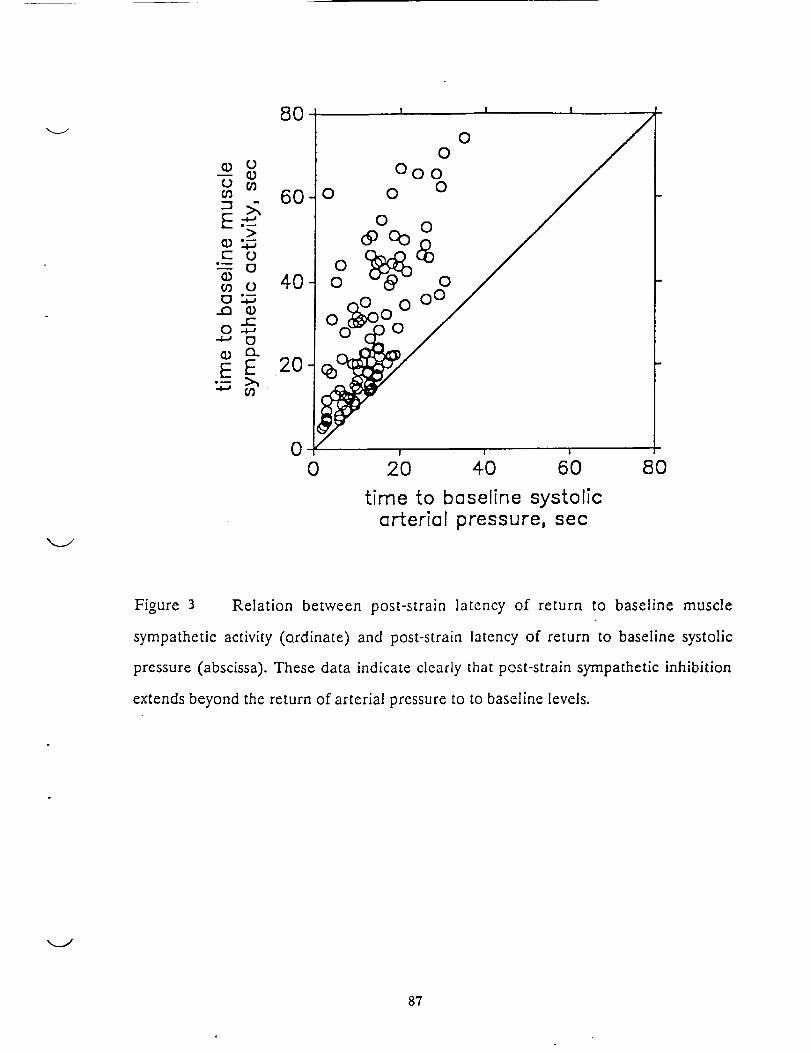
t- O"---tDffl O
O .+..,
°-- _'i
8O
6O
4O
2O
0
O
OO
I ! I
00
000
0 0
I I I
0 2O 40 6O 8O
time to baseline systolicarterial pressure, sec
Figure 3 Relation between post-strain la[ency of return to baseline muscle
sympathetic activity (Qrdinate) and post-strain latency of return to baseline systolic
pressure (abscissa). These data indicate clearly that post-strain sympathetic inhibition
extends beyond the return of arterial pressure to to baseline levels.
8?

N94-_12001
Mechanistic Studies on Reduced Exercise Performance
and Cardiac Deconditioning with Simulated Zero Gravity
(NASA-NAG 2-392)
52_ -4'7/
/k,
Charles M. Tipton, Ph.D.
Department of Exercise and Sport Sciences
University of Arizona
Tucson, Arizona 85721
IIIIEII...__._,.INIE_IO NALI_ B_,ANII
89
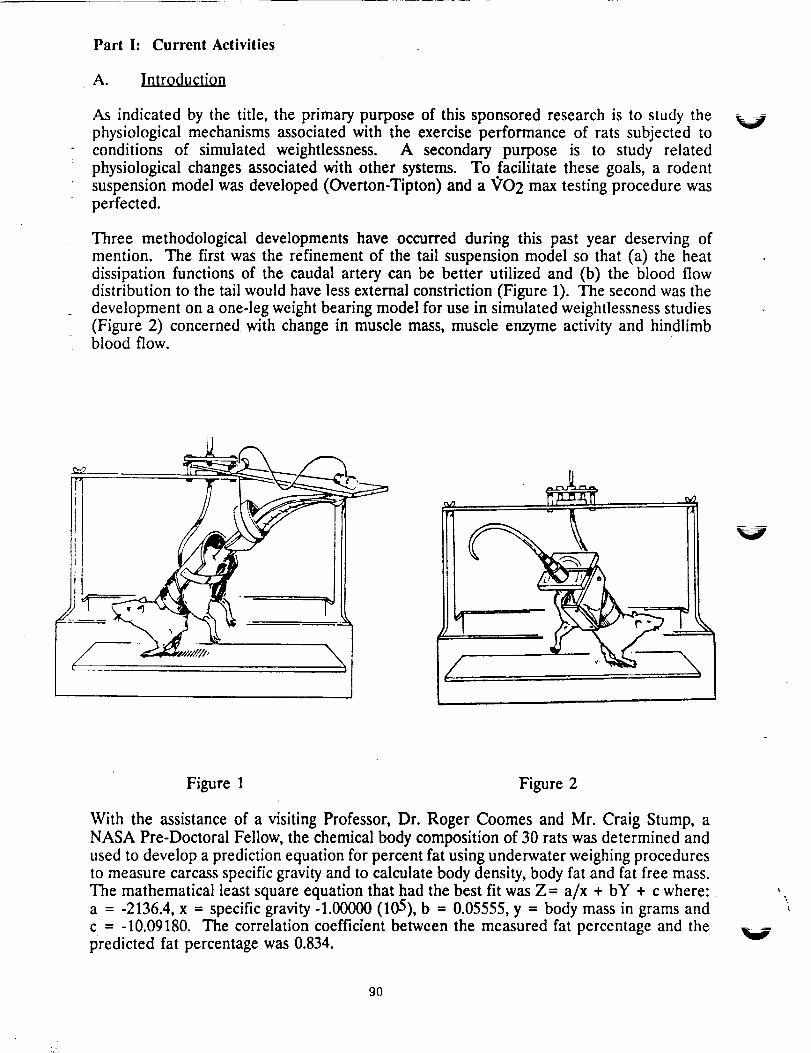
Part h Current Activities
A. Introduction
As indicated by the title, the primary purpose of this sponsored research is to study thephysiological mechanisms associated with the exercise performance of rats subjected to
conditions of simulated weightlessness. A secondary purpose is to study relatedphysiological changes associated with other systems. To facilitate these goals, a rodentsuspension model was developed (Overton-Tipton) and a _O2 max testing procedure was
perfected.
Three methodological developments have occurred during this past year deserving ofmention. The first was the refinement of the tail suspension model so that (a) the heatdissipation functions of the caudal artery can be better utilized and (b) the blood flowdistribution to the tail would have less external constriction (Figure 1). The second was thedevelopment on a one-leg weight bearing model for use in simulated weightlessness studies
(Figure 2) concerned with change in muscle mass, muscle enzyme activity and hindlimbblood flow.
V
II
j- i
Figure 1 Figure 2
With the assistance of a visiting Professor, Dr. Roger Coomes and Mr. Craig Stump, a
NASA Pre-Doctoral Fellow, the chemical body composition of 30 rats was determined andused to develop a prediction equation for percent fat using underwater weighing proceduresto measure carcass specific gravity and to calculate body density, body fat and fat free mass.The mathematical least square equation that had the best fit was Z- a/x + bY + c where:a = -2136.4, x -- specific gravity -1.00000 (105), b = 0.05555, y = body mass in grams and
c = -10.09180. The correlation coefficient between the measured fat percentage and thepredicted fat percentage was 0.834.
90
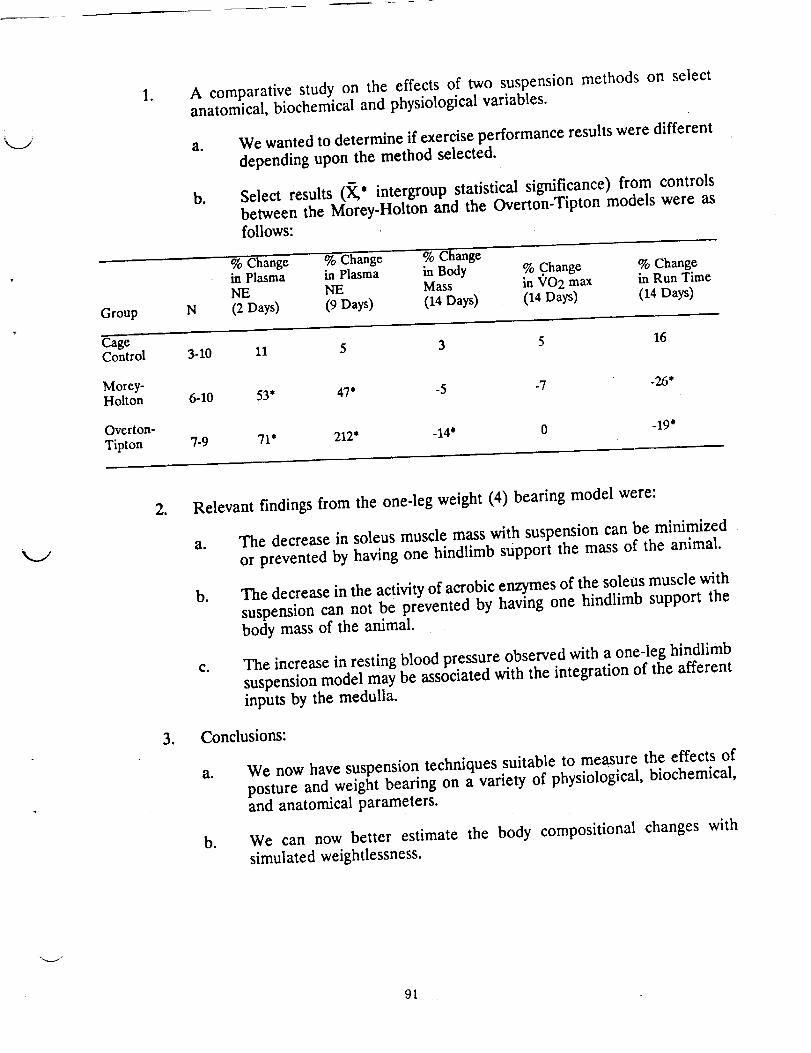
Group
.A comparative study on the effects of two suspension methods on selectanatomical, biochemical and physiological variables.
a. We wanted to determine if exercise performance results were different
depending upon the method selected.
b. Select results (X,* intergroup statistical significance) from controlsbetween the Morey-Holton and the Overton-Tipton models were as
N
follows:
% Change % Change - % Changein Plasma in Plasma in Body % Change % ChangeICE NE Mass in 'v'O2 max in Run Time
(2 Days) (9 Days) (14 Days) (14 Days) (14 Days)
CageControl 3-10 11 5
3 5
Morey- -7Holton 6-10 53* 47* -5
7-9 71" 212"Overton-
Tipton-14' 0
16
-26*
-19"
o
.
Relevant findings from the one-leg weight (4) bearing model were:
a. The decrease in soleus muscle mass with suspension can be minimized
or prevented by having one hindlimb support the mass of the animal.
b. The decrease in the activity of aerobic enzymes of the soleus muscle with
suspension can not be prevented by having one hindlimb support the
body mass of the animal.
c. The increase in resting blood pressure observed with a one-leg hindlimb
suspension model may be associated with the integration of the afferent
inputs by the medulla.
Conclusions:
a. We now have suspension techniques suitable to measure the effects of
posture and weight bearing on a variety of physiological, biochemical,and anatomical parameters.
b. We can now better estimate the body compositional changes with
simulated weightlessness.
v
91

B°
of SympathetiC Nervous System
1. Time course of changes in catecholamines.
a.
To determine the changes in the Overton-Tipt0n model before initiatingsympathectomy studies, a study with 10 control and 11 suspended rats
was conducted. The results are listed in Figure 3 (_SE, • intergroup andintragroup difference that was statistically significant).
A EPinel_hrlne 8. Horeplnephrlne
I0 -m-CO
i _ I ,o 1 , _ HDS
jo
7 ,, * "; ?4
009 Day
.
The effects of chemical sympathectomy andexercise performance. simulated weightlessness on
a. To determine whether exercise Performance would be altered after the"removal" of the sympathetic nervous system.
b. Select _O2 max results with saline or quanethidine sulfate injections inmale or female rats (_SE,* intragroup, ® intergroup statisticalsignificance, nil. ram-1 - " FFM-1).• kg 1 or ml.rmn-l.kg
N Pre-Suspension )
Cage Control 6 84+3 86_+3 85+2 102_+6Suspended 6 84+2 87+1 80+2° 94-+6
(males)
Cage Control 6 81+1 82_+2 77_+2 88_+4Suspended 8 86_+2 98_+2"_ 94_+1"_.................................................... , ....................... 108_+6"
(females)
Cage Control 8 83+2 85_+2 78-+2 92-+2Suspended 7 89-+1 84_+2 88+2_ 94-+3
(females)
Cage Control 6 88-+4 89+3 88_+3 104_+3Suspended 7 85+2 95-+4* 94_+4_ 109-+4
V
92

C,
Group
Cage Control
Suspended
4. The combined influences of sympathectomy, adrenal demedullation and simulated
weightlessness on exercise performance.
a. Although the results are in the analysis stage, the data (presented) are in form
for publication.
b. Trends suggest that absolute VO2 max is significantly decreased whendemedullation is coupled with sympathectomy. Changes in relative VO2 max
are not as apparent.
5. Conclusions: The presence of circulating epinephrine (and its receptors) appears tobe essential to avoid the marked decrease in VO2 max that occurs with
weightlessness.
Effects of Simulated Weightlessness for 28 Days on Performance and Fat-free Mass
1. To determine whether longer durations would affect both exercise performance and
fat-free mass.
a. - E * intergroup statistical significance)Select results (X ,S , intragroup, ®
pertaining to % fat, _'O2 max (ml.min-1 .kg-1 or FFM-1) or run time (rain)
of female rats.
_'O2 max Run Time
N % Fat Start End End (FFM) Start End
9 124"1 994"3 92---2* 109+-8 15-+'6 13+'7"
8 74"-2* 96---3* 90+4 102".4-8 154. .8 10-.4-.5*@
v
O.
2. Conclusions: Simulated weightlessness causes more of a change in fat mass than in fat-free mass.Consequently, the decline in VO2 max is due to other mechanisms than a decrease in the active muscle
mass.
The Effect of Prior Endurance Training on Exercise Performance of Rats Exposed to Conditions of Simulated
W_ightlessness for 28 Days
1. To determine whether trained rats would exhibit greater decreases in exercise performance than
nontrained rats with suspension.
2. Results are after 6 weeks of training (XSE,@ intergroup statistical significance).
Body Mass _/O2 max Run TimeN (g) (ml" min"1 "kg "1) (Minutes)
Nontrained 12 33,4+ 16 82-.4-2 12-.4'.4
Trained 10 330-.4-10 98".4-10 16".4'.4"
.
The influence of simulated weightlessness for 28 days on the exercise performance of nontraincd and
trained animals.
a. Rational was the same as listed in above.
93

b°
Results are (XSE,* intragroup, _ intergroup statistical significance) for body mass (gram), _'O 2max (ml. min-lkg-1) and run time (min).
Run-Time -Group N Start End Start End Start End
-Cage
Control 12 344_+16 431_+11" 82+2 75-+4 12-+.4 11-+.4
NT-Suspended 9 341_+16 309_+16" 81+4 77+3 12+ 5 8+ 2"_T-Cage Controi ................................................................................ Z--"............ S'...-
& Detraining 10 330-+10 419+11" 91-+1 84_+3 16-+.4 15-+.5
T-Suspended 10 344-+7 285-+ 15"_ 95_+2 81-+3" 16-+3 10-+1.1"_
Eo
4. Conclusions: Prior exercise training is associated with a faster decline in
performance measures than nontrained rats during this time period. It is unknownwhether the same trends would continue longer durations.
Published Results on _h¢ Eft f im 1 W i h l n n 1 Ph si I ic
Part II:
A.
1. Baroreflex control of heart rate (LBNP; sympathominetric agents) was notsignificantly altered by 9 days of simulated weightlessness (3).
2. Suspended rats exhibited a reduced pressor response to phenylephrine injectionsthan cage control rats. Also with this finding was a significant elevation inmesenteric vascular resistance (3).
3. Suspended rats had greater decreases, but not statistically, in plasma volume thannonsuspended rats (3).
4. Blood flow results obtained from Doppler probes indicated that:
a. Suspension was associated with an increase in iliac and mesenteric vascularresistance during exercise (3).
b. Iliac blood flow was significantly decreased after 48 hours suspension (4).
c. The decrease in iliac blood flow with suspension was prevented by having onehindlimb support the weight of the animal (4).
5. The effects of Simulated weightlessness on the rise in core temperature with a
gradual heat challenge indicated that the suspended rats reached 40.5 °C sooner thantheir nonsuspended controls. We speculate that these results occur because of areduction in hindlimb blood flow and a decline in plasma volume.
Future Projects and Their Relevance to Current or Future NASA Projects
The influence of 42-56 days of simulated weightlessness on exercise performance asevaluated by _?O2 max, run time and mechanical efficiency.
B. The influence of 42-56 days of simulated weightlessness on resting and exercisecardiac hemodynamics, plasma volume, blood gas changes, and baroreflexes.
94
V
V
Co The influence of an elevated plasma volume on the prevention of VO2 max changes
with short (14 day) and long (42-56) durations of simulated weightlessness.
D. The influence of short (14 days) and long (42-56) durations of simulated
weightlessness on tissue norepinephrine turnover rates.
Eo
FQ
Part III.
A.
The influence of front leg exercise training by suspended rats on their whole body_O2 max values.
The influence of short (14 days) and long durations (42-56 days) of simulatedweightlessness on the exercise performance of hypophysectomized rats.
Publications Associated Directly or Indirectly with NASA-NAG 2-392
Manuscript8 Published in 1990
1) Kregel, K.C., D.G. Johnson, C.M. Tipton, and D.R. Seals. Arterial baroreceptorreflex modulation of sympathetic cardiovascular adjustments to heat stress.
Hypertension 15:497-504, 1990.
2) Kregel, K.C., C.M. Tipton, D.R. Seals. Thermal adjustments to nonexertional heatstress in mature and senescent Fisher 344 rats. L.._. 68:1337-1342, 1990.
3) Overton, J.M. and C.M. Tipton. Effect of hindlimb suspension on cardiovascular
responses to sympathectomized and lower body negative pressure. J. Appl. Physiol.68:355-362, 1990.
4) Stump, C.S., J.M. Overton, and C.M. Tipton. Influence of a single hindlimb support
during simulated weightlessness in the rat. J. ApplL Ph_i_0_!. 68:627-634, 1990.
B. Abstracts Published in 1990
5) Coomes, R.K., L.A. Sebastian, C.S. Stump, P.K. Edwards, and C.M. Tipton.Influence of two methods of head-down suspension (HDS) on the stress response of
rats: Preliminary Results. _A__. 4(1) 73, 1990.
6) Kregel, K.C., J.M. Overton, D.G. Johnson, C.M. Tipton, and D.R. Seals.Cardiovascular sympathoadrenal and thermal adjustments tO nonexertional heat stressin the conscious rat. FASEB J. 4(3):A889, 1990.
7) Stump, C.S., C.R. Woodman, and C.M. Tipton. Exercise induced glycogen depletionin select rat hindlimb muscles after two weeks of hindlimb suspension. Med. Sci.
Sports Excr¢. 22(2):$52, 1990.
8) Woodman, C.R., K.C. Kregel, and C.M. Tipton. Thermal responses to non-exertional heat stress following simulated weightlessness in the conscious rat.FASEB ,1. 4(3):A569, 1990.
9) Woodman, C.R., C.S. Stump, L.A. Sebastian, and C.M. Tipton. Influences of 28 daysof hindlimb suspension on the "Q'O2 max of trained and nontrained rats. ASGSB
_, 4(1):65, 1990.
95

\\
\
V
l_ t _ _ I
:N94-12002 S// -_2-- -_
Fluid compartment and renal function alterations in the rat
during 7 and 14 day head down tilt
Bryan J. Tucker
Department of Medicine
University of California, San Diego
La Jolla, California 92093-9151
Supported by NASA grant NAG 2-659
I_'_l,._._._t fl'l'Elf"rlo NAIj,.i
97

Exposure to conditions of microgravity for any extended duration can modify the
distribution of fluid within the vascular and interstitial spaces, and eventually intracellular
volume. Whether the redistribution of fluid and resetting of volume homeostasis
mechanisms is appropriate for the long term environmental requirements of the body in
microgravity remains to be fully defined. The event that initiates the change in fluid
volume homeostasis is the cephalad movement of fluid which potentially triggers volume
sensors and stretch receptors (atrial stretch with the resulting release of atrial natriuretic
peptide) and suppresses adrenergic activity via the carotid and aortic arch baroreceptors.
All these events act in concert to reset blood and interstitial volume to new levels, which
in turn modify the renin-angiotensin system. All these factors have an influence on the
kidney, the end organ for fluid volume control. How the fluid compartment volume
changes interrelate with alterations in renal functions under conditions of simulated
microgravity is the focus of the present investigation which utilizes 25-30 ° head-down tilt
in the rat.
A previous investigation by our laboratory studied the effects of head-down tilt
(HDT) during the first seven days of suspension utilizing both chronic cannulation, thereby
allowing repeated measures in the same rat, and renal micropuncture methods (1). In
this study we examined the changes in extracellular fluid volume and renal function during
the time course of HDT in the rats. The measurements of extracellular fluid volume and
whole kidney function were performed in awake rats, thus permitting evaluation of the
time course alterations in renal function in conscious non-surgically stressed rats. The
HDT group was compared to suspended but non-tilted controls. In addition to the awake
V
V
V
98

studies, renal micropuncture techniques were utilized to ascertain the changes in the
determinants of glomerular ultrafiltration at the single nephron level in rats exposed to
seven days of HDT (1). Plasma renin activity, plasma catecholamine concentrations, and
urinary catecholamine excretion were also measured to ascertain whether any of the
changes in glomerular dynamics observed could be correlated with these factors which
regulate systemic and renal vascular resistance (1).
In this first study, extracellular fluid space (ECF) significantly increased within 24
hr after the onset of HDT and then returned gradually to pre-tilt values by the end of the
7 day HDT (figure 1). Glomerular filtration rate (GFR) also increased significantly (19 +_8%)
within 24 hours with a gradual decline and finally a significant reduction (-7+_1%) by day
7 of head-down tilt (figure 1). The changes in GFR were most likely renal plasma flow
dependent since the GFR changes paralleled the alteration in renal plasma flow except
after seven days HDT where GFR was reduced and renal plasma flow was not different
from control values (figure 1). In general, urine flow increased by 24 hours of HDT and
remained elevated throughout the 7 days of simulated microgravity (figure 2). Both
urinary sodium and potassium excretion changes were less consistent during the seven
day HDT (figure 2).
At the end of seven day HDT another group of rats were submitted to renal
micropuncture studies to ascertain which of the determinants of glomerular filtration
contributed to the reduction in filtration rate. In superficial nephrons, single nephron
glomerular filtration rate (SNGFR) decreased from 43+_2 to 31 _3 nl/min which was due
solely to reductions in the glomerular ultrafiltration coefficient (1). These data are
v
99
consistent with the awake rat renal function measurements in which parameters other
than renal plasma flow were responsible for the reduction in glomerular filtration rate. This _J
first study was successful in delineating some of the specific alterations in renal function
that occur in this model of cephalad fluid shift and relative hypokinesia, findings which are
similar to human studies in situations of simulated microgravity (2).
in more recent studies, initiated this year with the start of NAG 2-659, two separate
groups of rats were utilized to examine blood volume changes, extraceilular fluid volume,
and renal function alterations during 14 day HDT and 7 days post-tilt recovery. The major
focus of this study was to further define the applicability of this model for longer term
studies simulating the changes that occur in humans under conditions of microgravity and
recovery and to correlate the changes in fluid compartment volumes to alterations in renal
function to ascertain if the kidneys were responding to maintain volume homeostasis.
In the first group of rats, chronic cannulation of the femoral artery and vein was
performed and the animals were allowed one week to recover. The rats were separated
into four subgroups (n=6 in each group) and either tail suspended for 1, 7, or 14 days
or left in the normal orthostatic position. Blood volume was measured in each of the four
subgroups of awake rats utilizing 51Cr labeled endogenous erythrocytes and the changes
in volume with duration of HDT was compared to non-tilted controls. Although not
significant, blood volume tended to increase from 5.4_+0.1 to 5.6_+0.1% of body weight
after 24 hrs HDT (figure 3). By day 7, blood volume significantly decreased to 5.0_.+1%
of body weight and decreased further to 4.8-+0.1% by day 14 of HDT similar to
observations made in humans (figure 3). There were no differences in body weight, '
V
lOO

systemic hematocrit, or plasma protein concentrations among the four subgroups
indicating that the observed blood volume changes were independent of these factors.
In the second group of rats cannulation of the femoral artery and vein and bladder
was performed as in prior studies for chronic monitoring of extracellular volume, systemic
electrolytes and plasma protein concentration as well as renal function (GFR, renal plasma
flow, urine flow rate, urinary sodium and potassium excretion). Serial measurements of
these parameters were performed twice prior to HDT and then at 24 hrs, 3, 7, 10, and 14
days during HDT. After the 14 day HDT period was completed, all rats were returned to
normal orthostatic position and, after a 45 min waiting period, the measurements were
repeated. Measurements were also performed at 24 hrs, 3, and 7 days post-HDT. All
values were compared to pre-tilt control measurements in the same rat on a paired basis.
Similar to our previous findings, extracellular fluid volume increased from 28.2_+3.1 to
31.4_+3.5 % of body weight after 24 hrs of HDT and then steadily decreased to 24_+2.1
% of body weight by day 7 (figure 4). By day 14, ECF returned to values not different
from control (27.3-+ 1.2 % of body weight). During post-tilt recovery, ECF did not differ
from pre-tilt control values (figure 4). GFR increased during HDT from 2.1 -+0.1 in control
to 2.3_+0.2 after 24 hrs HDT and to 2.8_+0.2 ml/min after 3 days HDT (figure 5). By day
7, GFR was not different from control (2.2_+0.1 ml/min) and GFR at day 14 HDT was
2.3_+0.2 ml/min, also not different from pre-tilt values (figure 5). It was surprising that
GFR remained at values not different from control despite the decrease in blood volume
and 7 and 14 days HDT. Post-tilt GFR values were not different from pre-tilt values
measured in this group of rats (figure 5). Renal plasma flow increased by day 3 of HDT
101
but did not significantly deviate from control values at the other measurement time points
(figure 6). In early HDT, there seems to be a mild volume expansion With concomitant
increase in GFR and renal plasma flow, but after the initial expansion phase, ECF and
renal function return to values not different from pre-tilt measurements with a decrease
in blood volume.
These definition phase studies provide a low cost, ground based alternative for
investigation of fluid compartment volume alterations and renal function in microgravity
conditions. The results are quite similar to the studies in humans where some of the
same parameters were measured in HDT. However, the rat also provides a model for
more invasive studies, such as renal micropuncture, as well as a vehicle for therapeutic
trials to modify cardiovascular and renal response due to long term exposure to
microgravity. Also, this model can easily be extended to examine volume homeostasis
and renal function under conditions of 30-90 days of simulated microgravity.
REFERENCES
1. Tucker, B.J., Mundy, C.A., Ziegler, M.G., Baylis, C., and Blantz, R.C.J. Appl.
Physiol. 63:505-513, 1987. ......
, Greenleaf, J.E., Brock, P.J., Haines, R.F., Rositano, S.A., Montgomery, L.D., and
Keil, L.C. Aviation, space and Environ. Meal. 48:693-700, 1977.
7
=
102

k..j
Figure 1- TAILSUSPENDED BODY WEIGHT
,_. ..... NON-TILT
20 I ----- TILT
% CHANGE 10 J ...-._*FROM ] ,___............. -
CONTROL I _.z,- ._ --_----'r-- .... --"f--0 -,;-" - ¢ I I
-5 I_____.L_ .______----r '
EXTRACELLULAR SPACE
% CHANGEFROM 0 - ___
CONTROL ' ! __
-20
GLOMERULAR FILTRATION RATE....... .._,
S J
% CHANGE 10
CONTROL
-10
% CHANGEFROM
CONTROL
40
20
0
-10
RENAL PLASMA FLOW . ..
control 24 hrs 4 days 7days
TIME
II)3

Figure 2
% CHANGEFROM
CONTROL
% CHANGEFROM
CONTROL
% CHANGEFROM
CONTROL
% CHANGEFROM
CONTROL
20
10
0
-10
I00
50
0
200
I00
0
50
25
0
TAILSUSPENDED
L I I
[ T. URINE FLOW RATE
__._...__._- _......cI I
GLOM_M_M_ERULARF!LTRh !ON RATE
-,-_--NON-TILT'----TILT
J
J j
URINARY No+ EXCRETIO
._L
. URINARY K+ EXCRETION
I
I J
control 24 hrs 4 days 7 days
TIME V
104

m
I-
0
,d:LU
m
InILl
0
UJ
0
CI00
1:13
I
(D
.+ri ,,
I I
In ',d"
_,ql$!eM Apo9
Figure 3
105
Ill3:
,¢-,
m
O0>-
¢3ot
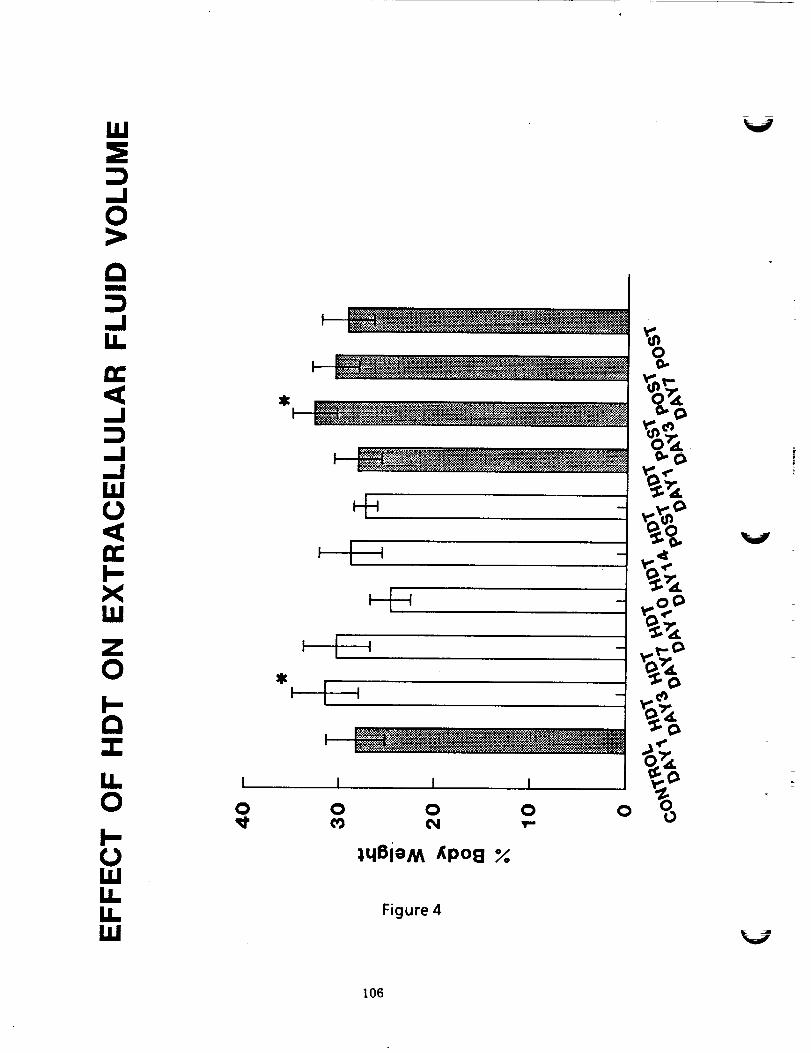
.,i0>,
m
1,6
13:<,..I
,.,I
LI,,I(b<DC
XW
0
c_
I I I
Il '
I II
[L I I
O 0 0 0 0
I-,lqBieM _po8
1.1,1rEIL Figure 4
ILl
0
o
0-¢>
v..¢_
%%
,f*
V
I06

I.UI-.
m
I.-
0
0I'-- u!w/lUJ0U.IIL Figure 5I,I.UJ
t07

0--IIL
<..I13.
..!
ZLU
Z0I---Im
I-
Z
0C_
C_<LU
U.0I-.(..1
U.LL,LU
0
UlW/iw
Figure 6
V
V
108
94-12oo3
LOCAL FLUID SHIFTS
AND EDEMA IN HUMANS
DURING SIMULATED MICROGRAVITY
"-._MAlan R. Hargens
Life Science Division (239-11)NASA-Ames Research Center
Moffett Field, CA 94035
Supported by NASA grant 199-14-12-04
109

Mechanisms of Headward Edema Formation during
Head-Down Tilt
Co-lnvestigators: S.E. Parazynski, M. Aratow, B. Tucker, J. Styf,
and A. Crenshaw
Recent Results:
To understand the mechanism, magnitude and time course of
facial puffiness that occurs in rnicrogravity, seven male subjects weretilted 6 ° head-down for 8 hours, and all four Starling transcapillary
pressures were directly measured before, during, and after tilt (1-4).Head-down tilt (HDT) caused facial edema and a significant elevation
of microvascular pressures measured in the lower lip: capillary
pressure increased from 27.7 + 1.5 mm Hg pre-HDT to33.9 +_ 1.7 mm Hg by the end of tilt (Fig. 1). Subcutaneous andintramuscular interstitial fluid pressures in the neck also increased
as a result of HDT, while interstitial fluid colloid osmotic pressures inthese tissues remained unchanged. Plasma colloid osmotic pressure
dropped significantly by 4 hours of HDT (21.5 +_ 1.5 mm Hg pre-HDTto 18.2 + 1.9 mm Hg at 4 hours HDT), suggesting a transition fromfluid filtr-ation to absorption in capillary beds between the heart and
feet during HDT (Fig. 2). After 4 hours of seated recovery from HDT,
m.icrovascular pressures (capillary and venule pressures) remained
significantly elevated from baseline values, despite a significant HDTdiuresis and the orthostatlc challenge of an upright, seated posture.
These results suggest that facial edema resulting from HDT is
primarily caused by elevated capillary pressure in the head anddecreased plasma colloid osmotic pressure. Post-tilt maintenance of
elevated cephalic capillary pressure may suggest a compensatoryvasodflation to maintain microvascular perfusion.
V
significance and Future Plans:
This study represents the first direct measurement of all four
Starling pressures in humans and the first time that micropuncturewas applied to the human m.icrocirculation above heart level (5).These results have elucidated the mechanism of facial puffiness during
microgravity. Our results also indicate the need for measurement ofintracranial pressure (ICP) during head-down tilt and actualm.icrogravity. These results have important implications to long-duration missions because some cosmonauts had facial edema for up to
one year and intracranial edema may limit performance. Future planswill: 1) investigate the post-tilt recovery period for longer times, 2)
hopefully investigate ICP in rhesus monkeys during a future Cosmosmission, and 3) develop a noninvasive ICP technique for application to
studies of crew during actual microgravity.V
II0

B. Postural Responses of Head and Foot Microcirculations
and their Sensitivity to Bed Rest
Co-lnvestigators: M. Aratow, J.-U. Meyer, and S.B. Arnaud
_,.j
Recent Results:
To explore further the mechanism of facial puiTiness, headache,
and nasal congestion associated with microgravity, the posturalresponses of the cutaneous microcirculation in the forehead and
dorsum of the foot of 8 healthy men were studied by changing body
position on a tilt table and measuring blood flows with a laser-Dopplerflowmeter (6-8)_ increasing arterial pressure in the feet by movingfrom a 6 ° head-down tilt to a 60 ° head-up posture significantly
foot cutaneous flow by 46.5 +_ 12.0% (Fig. 3). Raisingarterial pressure in the head by tilting from the 60 ° head-up to 6 °head-down posture significantly increased forehead cutaneous flow by25.5 +_ 7.2%. To investigate the possibility that these opposite
responses could be modified by simulated microgravity, tilt tests wererepeated after 7 days of 6 ° head-down tilt bed-rest. On the 1st and
2nd days after bed-rest, flows in the foot were decreased by69.4 + 8.8% and 45.8 + 18.7%, respectively, and increased in the
headby 39.3 + 8.6% and 15.5 +_ 5.9%, respectively. These responseswere not significantly different from those recorded before bed-rest.
Significance and Future Plans:
Cutaneous microcirculatory flow in the feet is well regulated toprevent edema when shifting to an upright position, whereas there islittle regulation in the head microcirculation with head-down tilt. The
lack of regulation in the forehead cutaneous microcirculation increasescapillary flow, and consequently increases fluid filtration. Thisphenomenon helps explain the facial edema associated with the
simulated or actual microgravity environment. Future plans includelonger-term bed-rest experiments and studies of intracranial blood
flow by transcranial Doppler and correlation of blood flow alterations
with performance indices in human subjects. The development of
arterial and microvascular adaptations to gravitational blood pressuregradients is weU documented in tall species such as humans and
giraffes. It is expected that some or all of this vascular adaptation willbe lost during long-duration flight.
I11

C. Transcapillary Fluid Transport Associated with LBNPwith and without Saline Ingestion
Co-lnvestigators: S. Fortney, M. Aratow, D.E. Watenpaugh,and/_ Crenshaw
Recent Results:
Lower body negative pressure (LBNP) may enhance fluid
replacement during spaceflight by sequestering fluids in the lower body
to help maintain plasma volume and post-flight orthostasis. Wehypothesized that saline ingestion during LBNP would further increasetranscapillary fluid filtration into leg interstitium and further improve
postflight orthostatic tolerance. Six subjects underwent 4 h of30 mm Hg LBNP and 50 min of recovery on two separate days with andwithout drinking one liter of isotonic saline during LBNP (9-11).Interstitial fluid pressures (IFP), venous pressure (VP), and change incircumference (LC) were continuously measured in the leg. Whole-body
transcapiUary fluid transport rate (TFT, net filtration if TFT < 0) wasdetermined by subtracting urine production and insensible fluid loss
from changes in plasma volume. Leg IFPs decreased in parallel withLBNP (3.0 + 2.6 mm Hg to -26.5 + 2.9 mm Hg, p < 0.05), yet VPremained constant (Fig. 4). Although IFPs returned to baseline afterLBNP alone, LC remained 4.1 + 1.3% above baseline at 50 min of
recovery (p < 0.05) (Fig. 5). Saline ingestion increased post-LBNP IFPand LC relative to LBNP alone. TFT was 145 +_ 10 ml/h (723 + 43 ml)
during LBNP with saline ingestion, compared to -7 +_ 12 ml/h(-40 + 64 ml) during LBNP alone.
Significance and Future Plans:
Increased vascular transmural pressure during LBNP led to venous
pooling and filtration into lower body interstitium, yet reabsorption fromupper-body interstitium compensated for this filtration during LBNPalone. Saline ingestion with LBNP supplemented lower-body interstitialvolume. Post-LBNP reabsorption of fluid from lower-body interstitiumwas similar with and without saline ingestion, which indicates about halfof the fluid load remained in the interstitial space at 50 min of recovery.
Future plans may include studies of other types of fluid ingestion andLBNP as well as evaluation of the effect on post bed-rest orthostatic
intolerance. These results provide objective data on possible use of
LBNP and saline ingestion to improve orthostatic tolerance followingshort-duration as well as long-duration flight.
112
References:
I. Parazynski, S.E., A.R. Hargens, B.J. Tucker, J.R. Styf, A.G. Crenshaw, andM, Aratow. Cephalic tissue fluid pressures during acute, simulated
microgravity. ASGSB Annual Meeting, p. 87(044), 1989.
2. Parazynski, S.E.. M. Aratow, B.J. Tucker, J.R. Styf, A-G. Crenshaw, andA.R. Hargens. Physiological mechanisms of tissue fluid shifts during acute,simulated weightlessness. 61st Annual Meeting, Aerospace MedicalAssociation. New Orleans, LA, p. A48 (295), 1990.
3. Hargens, A-R., S. Parazynski. M. Aratow, J.-U. Meyer, A- Crenshaw, andR. Whalen. Exercise and tissue-fluid shift studies at NASA-Ames Research
Center. Advances in Bioengineering 15:155-156, 1989.
4. Parazynski, S.E., A-R. Hargens, B. Tucker, M. Aratow, J. Styf, andA- Crenshaw. TranscapiUary fluid shifts in tissues of the head and neck
during and after simulated microgravity. J. Appl. Physiol., submitted 1990.
5. Parazynski, S.E., B. Tucker, M. Aratow, A- Crenshaw, and A.R. Hargens.Direct measurement of capillary blood pressure in the human lip. Am. J.
Physiol., submitted 1990.
6. Aratow, M., A.R. Hargens, and S.B. Arnaud. Effect of simulated
microgravity on the postural response of microvascular cutaneous blood flow.1 lth Annual Meeting IUPS Commission on Gravitational Physiology, Lyon,
France, p. 11, 1989.
7. _tow, M., A-R. Hargens, S.B. Arnaudl and J.-U. Meyer. Effect of
simulated weightlessness on the postural response of microvascularcutaneous blood flow. The Physiologist 33:$54-$55, 1990.
8. Aratow, M., A-R. Hargens, J.-U. Meyer, and S.B. Arnaud. Postural
responses of head and foot cutaneous microvascular flow and their sensitivityto bed rest. Aviation, Space, and Environ. Med., in press, March 1991.
9. Watenpaugh, D.E., M. Aratow, S. Fortney, A- Crenshaw and A-R. Hargens.Transcapillary fluid trarisport associated with LBNP with and without saline
• loading. ASGSB Bulletin 4:87, 1990.
10. Aratow, M., D.E. Watenpaugh, S. Formey, A- Crenshaw, and A.R. Hargens.
Saline loading during LBNP increases transcapillary filtration. 62nd AnnualMeeting, Aerospace Medical Association, Cincinnati, OH, submitted 1990.
11. Aratow, M., S. Fortney, D.E. Watenpaugh. A- Crenshaw, and A-R. Hargens.
Transcapillary pressures and fluid shifts in response to LBNP and salineingestion. J. Appl. Physiol., to be submitted, 1991.
113

Figure Legends:
Figure 1"Capillary blood pressure increased significantly in the lipwithin the frst half hour of I-K)T and remained elevatedthroughout HDT and in the recovery period. Lower barindicates period of HDT.
Figure 2:
Figure 3:
Plasma colloid osmotic pressure decreased significantlyafter 4 hours HDT. Lower bar indicates period of HDT.
Responses of the forehead and dorsal foot cutaneous
microcirculations to an arterial pressure increase beforeand after a one week period of bedrest. Forehead
microcirculatory flow _ significantly whereas thatin the foot decreases significantly with increased local
blood pressure. The clear bars represent the percentagechange in forehead cutaneous flow caused by a tilt to thehead-down position, and the response of the foot
cutaneous flow caused by a tilt to the head-up position isrepresented by the shaded bars. The magnitudes of these
changes due to 7 days of bed rest were not significantlydifferent from each other.
Figure 4:Tissue fluid and foot venous pressures during LBNP withand without saline ingestion. The lower rectangle labelled
"LBNP" in each graph represents the time period duringwhich LBNP was applied to each subject. The subdivisions
at the beginning and end of the rectangle represent theramp up and ramp down of the chamber pressure. Therectangle in each graph labelled "saline" represents thetime period over which the subject was required to drink1 liter of isotonic saline.
Figure 5: Calf circumference change, calculated plasma volume, and
serum colloid oncotic pressure during LBNP with and
without saline ingestion. The lower rectangle labelled
"LBNP" in each graph represents the time period duringwhich LBNP was applied to each subject. The subdivisions
at the beginning and end of the rectangle represent theramp up and ramp down of the chamber pressure. Therectangle in each graph labelled "saline" represents the
time period over which the subject was required to dri_Ik1 liter of isotonic saline.
V
I14

FIGURE 1
k_/
&,,
0.
"000
>,
mIm
0,
0
I.,,,., Im_i
0
$ I,,---- -4 ''''4V
$
0 tO 0
_1_
0
0
(§HWW) 'g'S -I+ a_nsseJd _Jell!deo
\
115
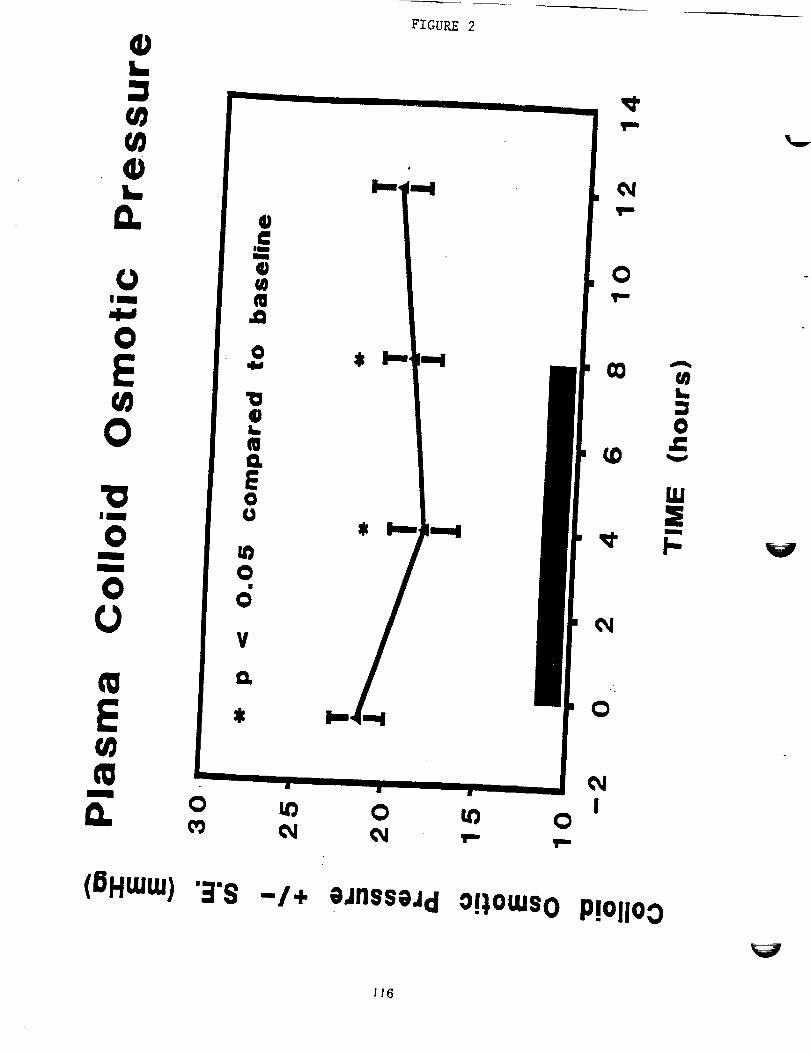
+FIGURE 2
WW
L
0.
IS
O
E
O
I
O
V
_L O U_ O U_ O
¢W
OT"
(OHtUUJ)".R'S -/+ eJnssojd o!),omso P!OliOO
JI6

_+ FIGURE 3
O
G) (nL_ *--
O OU.a
d
!_iii_iiiii!i_i_;_i!iiiii_iii_iiii_!_i_iii!ii!i!!_!iii!i_i::ii[i!iiiii[iiii!_!_iii_i_iiiiiiii_[i::iii:iiiil----------.--
| a
0 0 0 0 0 0 0
l | il l il
,,4,-4
t,/}
n::
0:)
a,..
(3,)
.il,,.o
It"
O)0:)i,,._
O
pU
am
E,,4,.,Pmim
|
O
EOU
t,_
V
(%) eEiueqo _o1_-I _elnoseAo_o!!N117

FIGURE 4
118

E
E
o:>
E(n
0.
FIGURE 5
:1500"
mOO
3200 -
3100
3OO0
290O
2800"
No SaJln*
u001
_0oiIII
250O
J Saline j
LBHP III
IO0
Time (min.)
2:
EE
(nol
I1.
o
oor-oEL--
G)(/)
3O
25 TM
2O
1S
10-30
111 LBHP tl I
o _o . ,o ,_o ,_o _':o =1o =,o =_,o
Time (rain.)
30O
EE
c_C_e-c=e,
O
G)(3t-
Oqlw
E
.oO
G]O
15'
10'
S'
-5-30
No Saline
With S4dine
III CBNP I1 Ii i w , ". ' i i • 1 i
0 30 60 90 120 150 180 210 240 270 300
Time (min.)
119

V
VZ
7 r
V

N94-12004
'HORMONAL REGULATION OF FLUIDAND ELECTROLYTE METABOLISM IN
ZERO-G AND BEDREST
Joan VernikosLife Science Division
M/S 239-11NASA-Ames Research Center
Moffett Field, CA 94035
Supported by NASA Grant 199-14-12-03
I_G_INIENI'IONALL_
121

-INTRODUCTION;
Tz
The study of man in spaceflight has consistently indicated changes in fluid andelectrolyte balance. Sodium (Na), Potassium (K) and Calcium (Ca) excretion areincreased, accompanied by changes in the levels and responsiveness of adrenalhormones and the sympathetic nervous system (SNS). These hormones andneurohumors are critical to the regulation of blood pressure, blood flow and bloodvolume. The primary objectives of the research conducted under this task have been
to use -6 o head down bedrest (BR) as the analog to spaceflight, to determine the longterm changes in these systems, their relationship to orthostatic tolerance and todevelop and test suitable countermeasures.
Over the course of this work we conducted a series of BR studies designed to:
(1) Determine the physiological response to postural change and to 7 days BR inmales;
(2)
(3)
(4)
(5)
Compare the effects of 7 days BR in male and female subjects;
Determine the mechanisms underlying these responses during (a) shortduration BR (7 days), (b) more prolonged BR (30 days);
Investigate the relationship between the mechanisms regulating fluids andelectrolytes during BR and the development of orthostatic intolerance post BR;
Use the information derived to develop and test pharmacological, dietary andother counteractive options.
SIGNIFICANCE:
The importance of the proposed work lies in its ability to provide practical, effective
solutions to the problems of post-flight orthostatic tolerance and readaptation to 1Gafter missions of short or prolonged duration, based on knowledge of the mechanismsunderlying the problem. It is obvious that post-flight orthostatic hypotension involvesmultiple systems which seem to be affected to varying degrees in different individuals.
Furthermore, the vasomotor regulatory deficits after relatively short exposures may bemore readily compensated for by techniques (such as volume expansion) than thoseoccurring after prolonged missions, when a new state of physiological adaptation toweightlessness has been achieved; nor might a single countermeasure be effective inall individuals.
The importance of postural cues to the regulation of aldosterone secretion and theimportance of the secretions of the adrenal gland as a whole and the autonomic
nervous system in the homeostatic maintenance of fluid and electrolyte balance havelong been recognized. The experiments in this task should contribute to better
understanding of the mechanisms that regulate the effective levels of circulatingaldosterone, and, in particular, the ways in which other metabolic and neuroendocrine
122

changes occurring in weightlessness affect the responsiveness of the adrenal to itsregulatory influences.
There are few data on these regulatory systems beyond seven days of -6 o BR and onfluid volume regulation in general beyond 14 days of horizontal BR (Greenleaf andKozlowski, 1982; Greenleaf, 1984). Two 56 day horizontal BR studies suggestingreduced sensitivity of endocrine and metabolic target organ responsiveness wereconducted almost 20 years ago (Vernikos-Danellis et al., 1974). Indirect evidencefrom animals and man have also indicated this is probably the case with moreprolonged exposures. Antiorthostatic BA (-6 o) has proven its usefulness as asimulation for the initial response to weightlessness and physiological changes occurearlier and are more pronounced than they are with horizontal BR. With the advent ofthe space station era, the understanding of physiological changes occurring in bothmale and female subjects in weightlessness should form the rational basis for thedevelopment of procedures to prevent or control these changes on extended spacemissions.
PROGRESS:
We use a subject population of healthy volunteers, 30-50 years of age, to bestapproximate the astronaut corps. Diet is strictly regulated and contains 120 mEq/dayNa and 70-80 mEq/day K; three days are allowed at the beginning of each study forequilibration.
The first two studies in the series were identical in design and their primary purpose
was to determine the immediate effects of assuming the -6 ° head down posture and tocompare these responses in male and female subjects. Such early responses havenot been measured either in flight or in ground studies. In flight, understandably, it hasbeen impossible to do so without interfering with the heavy schedule of the first day.Nor is it likely that such measurements will be possible within the foreseeable future.Furthermore, data on fluid and electrolytes would be inevitably affected by the malaiseand/or vomiting of the early phases of the space adaptation syndrome or bymedications taken for this. In contrast to investigations using immersion for simulationof space flight, BR studies had not used sufficiently frequent sampling to document theearly changes. Yet, the immediate and dramatic responses to simply assumingupright posture, in those systems that regulate blood volume and blood flow, are wellknown and it could well have been expected that assuming the head down posturewould produce equally immediate and marked effects in those systems.
Eight males and eight females were setected fr0m groups of 14-16 after preliminaryscreening tests which included a PV determination, cardiovascular and endocrineresponses to a Standard Posture Test (SPT, one hour supine, one hour standing) andtaking into consideration the phase of the menstrual cycles of the females. Nosignificant correlation between menstrual phase and response was evident. Subjectsof both sexes were selected to cover the widest possible range of "normal" bloodpressures and plasma volumes, so that a fair assessment of the contribution of the
initial physiological status to the responses to BR and post BR orthostatic intolerancecould be made.
123
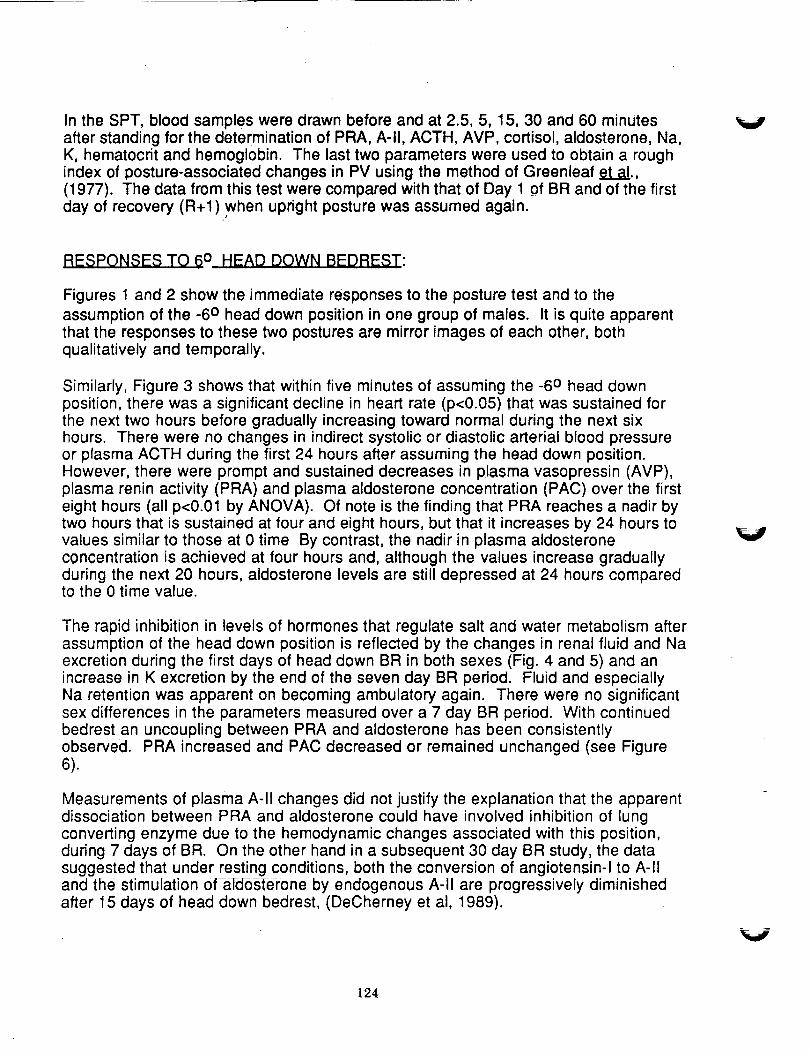
In the SPT, blood samples were drawn before and at 2.5, 5, 15, 30 and 60 minutesafter standing for the determination of PRA, A-II, ACTH, AVP, cortisol, aldosterone, Na,K, hematocrit and hemoglobin. The last two parameters were used to obtain a roughindex of posture-associated changes in PV using the method of Greenleaf et a!.,(1977). The data from this test were compared with that of Day 1 of BR and of the first
day of recovery (R+l).when upright posture was assumed again.
V
RESPONSES TO 6 ° HEAD DOWN BEDREST:
Figures 1 and 2 show the immediate responses to the posture test and to theassumption of the -6 o head down position in one group of males. It is quite apparentthat the responses to these two postures are mirror images of each other, bothqualitatively and temporally.
Similarly, Figure 3 shows that within five minutes of assuming the -6 ° head downposition, there was a significant decline in heart rate (p<0.05) that was sustained forthe next two hours before gradually increasing toward normal during the next sixhours. There were no changes in indirect systolic or diastolic arterial blood pressureor plasma ACTH during the first 24 hours after assuming the head down position.However, there were prompt and sustained decreases in plasma vasopressin (AVP),plasma renin activity (PRA) and plasma aldosterone concentration (PAC) over the firsteight hours (all p<0.01 by ANOVA). Of note is the finding that PRA reaches a nadir bytwo hours that is sustained at four and eight hours, but that it increases by 24 hours tovalues similar to those at 0 time By contrast, the nadir in plasma aldosteroneconcentration is achieved at four hours and, although the values increase graduallyduring the next 20 hours, aldosterone levels are still depressed at 24 hours comparedto the 0 time value.
The rapid inhibition in levels of hormones that regulate salt and water metabolism afterassumption of the head down position is reflected by the changes in renal fluid and Naexcretion during the first days of head down BR in both sexes (Fig. 4 and 5) and anincrease in K excretion by the end of the seven day BR period. Fluid and especiallyNa retention was apparent on becoming ambulatory again. There were no significantsex differences in the parameters measured over a 7 day BR period. With continuedbedrest an uncoupling between PRA and aldosterone has been consistentlyobserved. PRA increased and PAC decreased or remained unchanged (see Figure6).
Measurements of plasma A-II changes did not justify the explanation that the apparentdissociation between PRA and aidosterone could have involved inhibition of lungconverting enzyme due to the hemodynamic changes associated with this position,during 7 days of BR. On the other hand in a subsequent 30 day BR study, the datasuggested that under resting conditions, both the conversion of angiotensin-I to A-IIand the stimulation of afdosterone by endogenous A-II are progressively diminishedafter 15 days of head down bedrest, (DeCherney et al, 1989).
V
124

In addition, BR exceeding 7 days showed the following results. Plasma volumemeasured using Evans Blue, continued to decline slowly until on d25 it had decreased
by 12%. The volume responsive hormones, plasma AVP and PRA remained elevated,but PAC remained at control values throughout the 30d BR period. The response ofadrenal aldosterone to graded doses of ACTH or A-II were significantly greater as BR
progressed whereas the cortisol response was unaltered by 30d BR. In contrast boththe systolic and diastolic blood pressure (BP) responses to A-II (Figure 7 and 8) weregreatly reduced by the 16th day of BR. We believe these changes are related to theoverall Na deficiency induced by BR. Such enhanced adrenal sensitivity to infused A-ll and reduced vascular smooth muscle responses to this peptide have been reported
in experimental animals and humans after drastic dietary manipulation of Na.Similarly, the BP response to NE has been reported to be reduced by Na deficiency.In our study the rise in diastolic BP to graded doses of infused NE appeared reducedbut the dose of NE was too small to]n_uCe significant increases under controlconditions. To our knowledge, such observations have only been reported inresponse to dietary Na manipulations or pathological conditions but not tophysiological environmental change (i.e. BR) and are worthy of further pursuit.
Accompanying the changes in the vasomotor hormones involved in fluid andelectrolyte changes was a significant reduction in the responsiveness of the carotidsinus cardiac baroreflex response measured using an Eckberg cuff (Figure 9). Thiseffect was evident at d12 of BR and persisted through at least 5 days of ambulatoryrecovery (Convertino et al, 1990). Furthermore, the buffer capacity of the reflex wasreduced as indicated by the decrease in the R-R range. Consequently, not only wasthe BP response to A-II reduced but the capacity to respond and compensate formoment to moment changes in blood pressure was also reduced by prolonged BR.
POST BEDREST ORTHOSTATIC INTOLERANCE:
During the course of these studies a physiological pattern emerged characteristic ofindividuals in their normal ambulatory state who are most likely to become syncopalafter a period of BR (F). These we_e_ubjects showing the lowest resting initial BP's,the highest resting plasma volume (PV); the lowest resting PRA and the smallestdecrease in plasma volume on standing. This preservation of an expanded PVbecomes a very critical mechanism for the maintenance of BP in these individualsunder normal ambulatory conditions (Bannister, 1979) and would therefore be
expected to gain importance during any perturbation. There was no correlationbetween the decrease in PV during BR and post BR orthostatic intolerance but therewas a good correlation between the reduced sensitivity of the high pressure baroreflexduring BR and post BR orthostatic sy6_ope (Convertino et al, 1990), (Figure 10).
The most significant endocrine differences between these individuals (F) and thosewho did not become syncopal (NF)became apparent during the effort of individuals tomaintain orthostatic control on standing after 7d BR. In NF's there was potentiation ofNE, Dopamine and Epinephrine responses to standing after 7d BR as compared toambulatory controls, suggesting that NF's probably maintain their BP, supported by alarge and sustained increase in sympathetic activity. On the other hand F's were
125

unable either to increase or sustain increased circulating NE and PRA levels (Figures11 and 12) on standing.
COUNTERMEASURES:
Based on the data from these studies a variety of approaches designed to expand PVand restore baroreflex sensitivity have been and continue to be tested. The results todate from our studies may be summarized as follows:
PV expansion (16%) may be achieved with acute (2 day) administration offludrocortisone after 7d BR, (Vernikos et al. In Press). it may also be
prevented by daily bouts of 30 minutes isotonic exercise (at 50% max VO2)twice a day during 30d of BR, (Greenleaf et al. In Press).
Increased dietary carbohydrate throughout bedrest was ineffective inincreasing the NE response to standing. On the other hand, a combinationof dextro amphetamine and atropine together with expanded PV afterfludrocrotisone resulted in greatly enhanced and sustained HR, NE andPRA resp0nsesl Four of 7 previously documented F's were protected bythis treatment.
As a result of these and other findings, we decided to split the work in this task into 2tasks this year. n._ will focus on the PV and progressive baroreflex sensitivitychanges during BR periods longer than 30d. The contribution of the low pressurebaroreflex and changes in compliance to the development of orthostatic intoleranceduring BR will be addressed. The countermeasure effectiveness of fludrocortisone willbe compared to that of NaCI and water ingestion. On the one hand, the dosageregimes will be refined for maximum effectiveness, and on the other, the mechanismby which fludrocortisone exerts its protective effects in orthostatic intolerance will beinvestigated. Although it is possible that all of its BP regulating properties may bemediated by its Na retaining activity, it is also likely that it may possess otherindependent actions on the autonomic or central control of BP, and provides aninteresting investigative tool.
_, will focus on the endocrine and neurohumoral regulation of fluids andelectrolytes, the uncoupling of endocrine regulating mechanisms, sympathetic nervous
system and target organ systems observed in flight and in BR studies, the progressionof these changes with more prolonged exposures and the renal consequences ofthese changes. The role of Na and K in the development of these changes and therelationship of these to the cardiovascular system will continue to be addressed.
v
V
126

\ J
BIBLIOGRAPHY:
• Greenleaf, J.E. and Koslowski, S (1982) Physiological Consequences of Reduced
Physical Activity During Bedrest: In: Exercise and Sport Science Reviews, vol 10.R.J. Terjung (Ed.) Franklin Institute Press, Philadelphia, pp. 84-119.
• Greenleaf, J.E. (1984) Med. Sci. Sports Exerc., 16:20-25. ;
• Vernikos-Danellis, J., Winget, C.M., Leactl, C.S' ancl Rambaut, P.C. (1974):Circadian, Endocrine and Metabolic Effects of Prolonged Bedrest; Two 56-DayBedrest Studies, NASA TM X3051.
• Greenleaf, J.E., Brock, P.J., Haines, R.F., Rositano, S.A., Montgomery, L.D., andKeil, L.C. (1977) Aviation, Space and Environ. Med.:48: 693-700.
• DeCherney, G.S., Dallman, M.F., Keil, L.C., Convertino, V., and Vernikos-Danellis,
J. (1989) Proc. Endocrin Soc. 12,.1773.
• Convertino, V.A., Doerr, D.F., Eckberg, D.L., Fritsch, J.M. and Vernikos-Danellis, J.
(1990): J. Appl. Physiol. 68:1 458-1464
• Bannister, R. (1979) Lancet 2:404-406
• Vernikos, J. Dallman, M.F., Van Loon, G., and Keil, L.C. (1991) J. Clin. Pharmacol.
In Press.
• Greenleaf, J.E., Vernikos, J., Wade, C.E. and Barnes, P.R. (1991) J. Appl. Physiol.In Press.
127
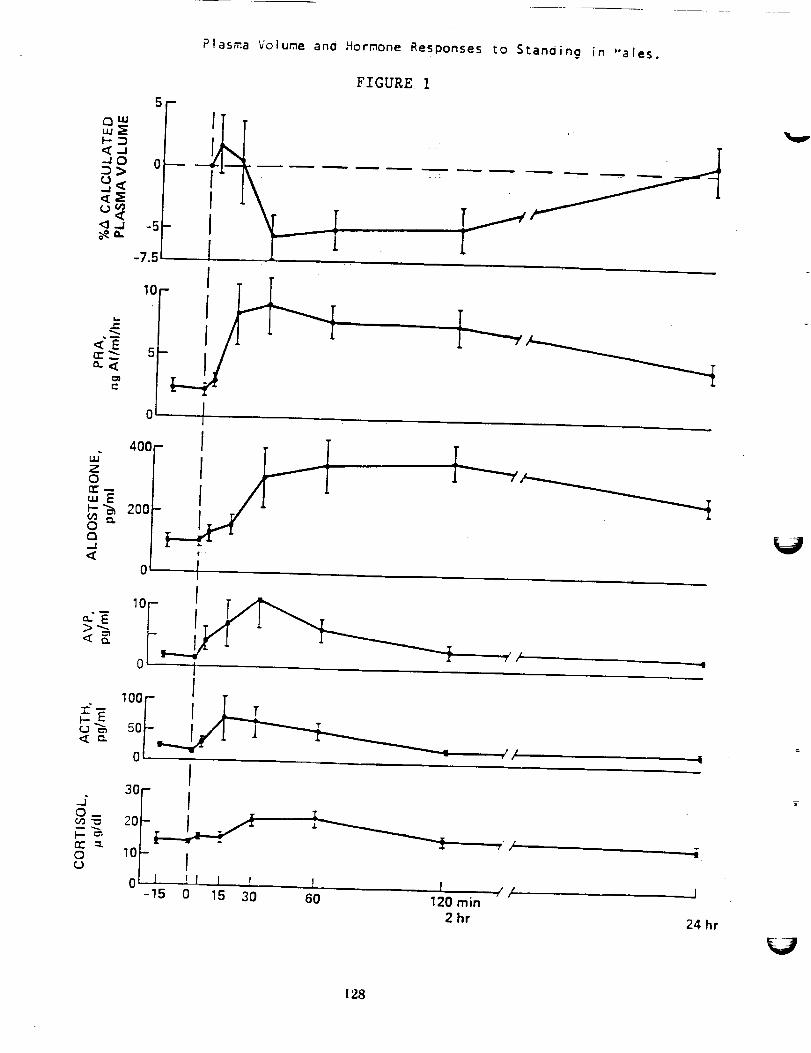
Plasma Volume ano Hormone Responses to Stan0ing in "ales.
m
aim
<-JJO 0D>
(j(4
<_ <' -5
-7.5
FIGURE 1
<Err_---a.<
t_
c
z0rr"
_-_ 2000Q
-J 0<
< cL
I
,o_5
oi l
400 - I
_ ,52-II
I
I7" /t
I
_- _ol-'0 1 /
I30-
0 10-
0 I P[ [ r-15 0 15 30
T
6O 120 min
2 hr
J/ J
24 hr
128

Plasma Volume and Hormone Responses in yales on assuming the
6° Neaddown Posture.
_-__ 1
C
150
'¢ 50
0
0
3O
I
!
I3O
!, I J
120 min2 hr 4 hr 8 hr 24 hr
•F-iGURE 2 "
129

F_GURE 3
EARLY RESPONSES TO 6 ° HEADDOWN TILT
Heart ra.te(beats/min)
BO
_,rteriai pressure _i(mm Hg)
sole _--4_I- -O- * , , ,
Plasma ACTH 6o F- _.[ _
(_) _o_ T--______.___._._,,_,+Plasma AVP
(pg/mii
PRA 1
(ng A I/mi/h)0
i00
sm ,,os,e,one(pg/ml) 6o_ -'-
20 LI I ! !
0 5 15 30 60 (min) 120
Time (h) 2 4
"Decreases significant by ANOVA
oI I I I
8 24
130

_J
0
t.4
W33
33t,_
W33
01
33',4
33
33I%1
URINARY
K+"
mEq/24 hr
(3 O
I-
+,II
P-- -_1
I
I
J
I-
I
(3')(3 0
URINARY
Na +,
mEq/24 hr
01 C3(3 (3 (3! I I
I-'1
I-
I--I
II, ÷,+II
I,+
1-"4
R
_4
i
FIGURE 4
0
URINE
VOLUME,
ml/24 hr
01 (:3(3 (:30 0I
I---I
I,--I
I.-4
i---.I
II+--_
iI-4
i--I
P
I-
01(3(3]
÷
t_
I1)
r_
pz-
t_
o
xr_
tD
0-I
m,
13
t-
,+Q
o"
"3-
13r'_
0:[
13[
c_
131

V
V
V
132

k.../
FIGURE 6
pLASMA RENIN ACTIVITY INCREASES AND ALDOSTERONE
DECREASES DURING HEADDOWN BEDREST
PRA O_o..__.. 0
(ng A _[/mi/h)
4Aldosterone
(pg/ml)
Na +
" (mEq/I)
2o.--_e'--o---_
50--
0--
I'II/138 O-----
<0.01 0--...._,,
NS
K +
(mEq/I)
AVP
(pg/ml)
ACTH
(pg/mi)
Day of study
42
3
30 0 (_ NS
lO I t __._14 6 8
Ambulatory
+---+--4
I 1 J11 13 15
Bedrest
133
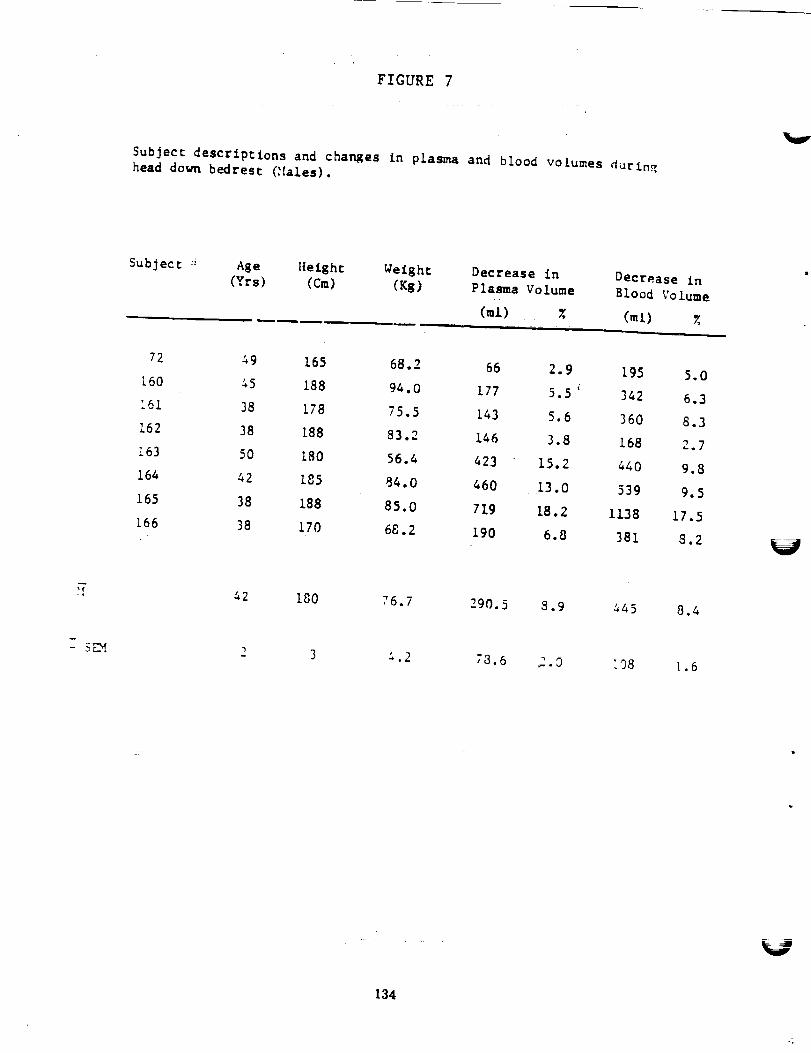
FIGURE 7
Subject descriptions and changes fn plasma and blood volumes duringhead down bedres¢ ('lales).
Subject :" Age Height Weight Decrease in
(Yrs) (Cm) (Kg) Plasma Volume
(rot) %
Decrease in
Blood Volume
(ml) %
72 49 165 68.2 66 2.9 195 5.0
160 45 188 94.0 177 5.5 i 342 6.3
161 38 !78 75.5 143 5.6 360 8.3
162 38 188 83.2 146 3.8 168 2.7
163 50 180 56.4 423 15.2 440 9.8
164 42 185 84.0 460 13.0 539 9.5
165 38 188 85.0 719 18.2 1138 17.5
166. 38 170 68.2 190 6.8 381 8.2
- 5LM
42 180 76.7 290.5 8.9
2 3 & .2 78.6 2.0
445 8.4
!08 1.6
134

FIGURE 8
Subjec= descrlp=ions and chan_es in plasma and blood ° volumes during
head dow_ bedres_ (Females) _
Subject :' Age Neigh= Weight Decrease In Decrease In(Yrs) (Cm) (Kg) Plasma Volume Blood Volume
= (ml) X (ml)
_i &l 157 49.6 270 10.5 476 12.0
200 36 173 76.6 170 7.3 240 6.5
20_-'-_. 30 138 58.9 163 5.7 306 6.9
_ 35 173 84.8 259 8.7 402 8.8_0_
:o_-_ 37 158 63.9 553 18.6 693 15.3
205 44 161 63.9 255 I0.4 515 13.5
50.5 119 4.7 81 2.1
34 166
209 40 157 63.6 304 12.0 290 7.7
_! 37 160 64.0 262 9.7 375 9.2
_ _F/_.1.6 :_.0 &.l _7.2 1.55 66.6 !.6
135

FIGURE 9
uO
|
a:
.j
a
0.20
0.15
0.10
0.05
0.00
6O
PANEL A
80 100 120 140 160 180
CAROTID PRESSURE, mmHg200
(.14)(n
.j-
>n-w
Z
=,
_Jw
0.20
0.15
0.10
0.05
0.00
60
PANEL B
80 100 120 140 160 180 200
CAROTID PRESSURE, mmHg
Carotid baroreceptor-cardiac reflex response relationships. Panel A
depicts relations generated on days I, 3, 12, and 25 of bedrest (BR)
and the pre-bedrest control day (C4). Panel B depicts relations
generated on days 2, 5 and 30 of post-bedrest ambulatory recovery (R) and C4.
136

PANELA
U.IO_
¢ _ 3.0otuU.l_
w 0 1.0.Ju. _,UJUJn-n_onn"< 0.0rn
t
!
NON-SYNCOPAL
(N= 6)
7
SYNCOPAL
(N = 4)
2O
-r-EE 10
m0
<I-
tu -10
-2oZ
k--30
PANEL Bii
o NON-SYNCOPAL
• SYNCOPAL
r = +0.70, P = 0.030
0
00
0
I i I I
-4 -3 -2 -1 0
DELTA BAROREFLEX SLOPE, msec/rnmHg
OO
Reduction in the maximum slope of the carotid baroreceptor-cardiac
relationship after bedrest in non-syncopal and syncopal subjects
(Panel A) and the relationship between the chan_e in maximum slope
_ and the change in systolic blood pressure (SBP) during the post-
bedrest stand test (Pane! B). Asterisk indicates differences at P_O.05.
t37

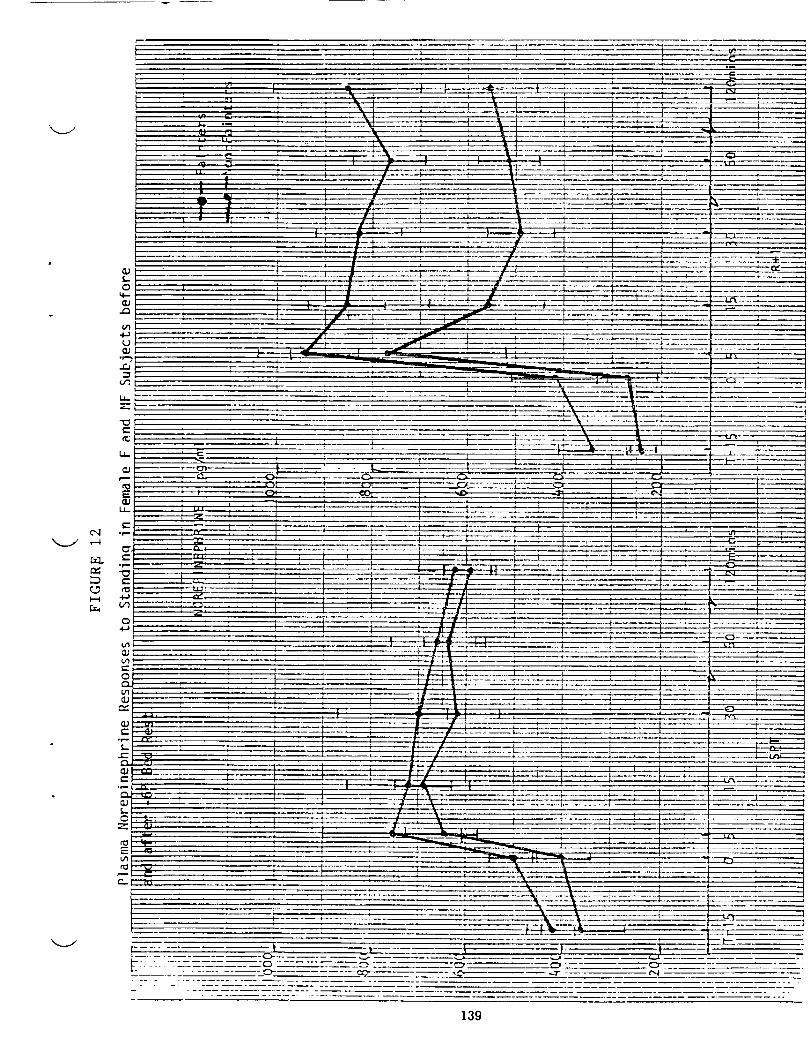
_____4.'__
i -i: ......
................ _° .
139

V
v

t
N94-12005
TITLE:
Hormonal Regulation of Fluid and Electrolyte Metabolism
during Periods of Headward Fluid Shifts
Principal Investigator:
Dr. L. C. Keil, Nasa Ames Research Center
Co-Principal Investigatators:
W.B. Severs, Pennsylvania State University
T. Thrasher, University of California at San Francisco
D.J. Ramsay, University of California at San Francisco
INTRODUCTION:
In the broadest sense, this project evaluates how spaceflight induced shifts of blood and
interstitial fluids into the thorax affect regulation by the central nervous system (CNS) of
fluid-electrolyte hormone secretion. Specifically, it focuses on the role of hormones related
to salt/water balance, and their potential function in the control of intracranial pressure and,I
cerebrospinal fluid (CSF) composition. Fluid-electrolyte status during spaceflight
gradually equilibrates, with a reduction in all body fluid compartments. Related to this is
the cardiovascular deconditioning of spaceflight which is manifested upon return to earth as
orthostatic intolerance.
PROJECTS WITHIN THIS WORK UNIT
GROUND-BASED STUDIES
Small Anim.al Studier _
The objective of this task was to determine the role of intracranial pressure (ICP) on the
CNS regulation of fluids and electrolytes. To do this it was necessary to measure ICP in
conscious unrestrained rats. With some difficulty this was accomplished. Our initial
studies showed that an intraventicular (IVT) infusion of angiotensin II increased ICP, and
this increase could be blocked with prior IVT administration of vasopressin. Since both of
these hormones are endogenous to CSF it is possible that they are involved in ICP
regulation either by affecting CSF formation and/or drainage. Recent results indicate that
the ICP increase following angiotensin II adminsistration is due to a stimulation of CSF
secretion.
tAG(/ O INTENrl0N^LL¥ ANll
141

As these ICP studies continued we found that prolonged, low volume infusions (0.5
gl/min) of artificial CSF into a lateral cerebroventricle more than doubled ICP. If this same
volume was infused bilaterally into each lateral cerebroventricle, the rise in pressure was
even more pronounced. One explanation for the rise in ICP may be a dilution of the
neurochemical control system(s) with artificial CSF that disrupts the pressure
autoregulation since artificial CSF does not contain any hormonal or neurochemical factors.
V
Primate Studies
When nonhuman primates are water immersed to the neck they show patterns of diuresis
and natriuresis similar to humans. Anesthetised animals showed an increase in 1) left
ventricular end-diastolic pressure urine flow, sodium/potassium clearance and atrial
natriuretic peptide. Experiments by Gilmore, et al. showed that water immersion diuresis
in monkeys could not be abolished by removal of neural afferent input to the CNS or with
administration of large doses of vasopressin. Perhaps changes in ICP provide an important
redundant signal that can trigger renal and hormonal responses to the "hypervolemia"
associated with headward fluid shifts in the absence of peripheral pressure/volume sensors.
Intracranial pressure measurements have not been made in animals or humans exposed to
water immersion or head-down tilt.
To determine the ICP effects of headward fluid displacement we exposed anesthetised
rhesus to a short period of -6 ° head-down tilt followed by a 30 min period of water
immersion. The increase in ICP was greater with water immersion. ICP remained elevated
throughout the 30 minutes of immersion. A sustained increase in ICP has been observed
for immersion periods up to 60 minutes.
V
Headward fluid shifts and increased atrial pressure are known to stimulate release of ANP
and a fall in plasma vasopressin (see above). The role of afferent neural input from the
heart has been determined by use of the surgical denervation. Another procedure for acute
and reversible cardiac "denervation" is being used to determine the relationship between
cardiac afferent input and plasma fluid/electrolyte hormone levels in response to changes in
left and right atrial pressure in conscious animals. These studies are in progress.
FLIGHT STUDIES
Obiective
Although fluid-electrolyte balance in rats has not been determined during flight, post-flight
hormone measurements and salt-water loading experiments indicate that rats respond to
142

"x_,.., J
microgravity by readjustment of their fluid-electrolyte metabolism. The purpose of this
investigation was to make post-flight determinations of pituitary oxytocin (OT) and
vasopressin (VP) content as possible indicators of changes in hormonal regulation of fluid-
electrolyte balance during'flight.
Two Cosmos experiments (U.S./U.S.S.R.) have been completed over the past three years.
Cosmos 1887 which flew in the Fall of 1987 for 12.5 days and Cosmos 2044 which was a
14 day flight in 1989. In Cosmos 1887, pituitary levels of oxytocin (OT) and vasopressin
(VP) were measured in the flight rats and their ground based controls. A significant
reduction in both posterior lobe hormones were found in the flight animals when compared
to either set of ground-based controls. Difficulties were encountered in landing which cast
some doubt on whether the results reflected the effects of spaceflight or simply the
conditions associated with the delayed recovery. We had another opportunity to repeat the
pituitary measurements as well as determine natriuretic peptide content of atria in Cosmos
2044. The results of this 14 day flight were similar to those from Cosmos 1887. Pituitary
OT and VP levels in the flight animals were lower than all the controls including a third
control group of tail suspended animals for a df'ect comparison of results from this model
with those from flight. Atrial natriuretic peptide (ANP) content was also reduced in the
atria of flight rats.
The reason(s) for the reductions in the tissue contents of these fluid-electrolyte hormones of
flight animals are unclear. A simultaneous reduction in pituitary OT and VP occurs with
water depravation that is also accompanied by a loss of body weight. Body weight was not
significantly decreased in the flight rats, and postflight measurements of water and food
consumption indicated that an appropriate amounts had been consumed. It has yet to be
determined if this reduction reflects increased secretion or decreased hormone synthesis and
storage. The lack of significant changes in the tail suspended group make this model
questionable for use in at least some aspects fluid-electrolyte hormone studies.
FUTURE PLANS:
Determine if head-down rats exhibit changes in pituitary and cardiac hormones similar to
those observed in animals exposed to 14 days of spaceflight. Study the effects of
continuous intraventricular infusions of neuropeptides (8 to 24 hr) on CSF pressure and
possible changes in CSF outflow from ependymal and arachnoid surfaces.
t43
PUBLICATIONS:
Palm, D.E., Keil, L.C., Sassani,J.W., and W.B. Severs. Immunoreactive atrial
natriureticpeptidein theretinaof ratsandrabbits.Brain Research,504:142-144(1989).
Morrow, B.A, Starcevic,V.P., Keil, L.C., and W.B. Severs. Intracranial hypertension
after cerebroventricular infusions in conscious rats. Am. Physiological Society, R1170-R1176 (1990).
Starcevic, V.P., Morrow, B.A., Farner, L.A., Keil, L.C. and W.B. Severs. Long-term
recording of cerebrospinal fluid pressure in freely behaving rats. Brain Research, 112-117(1988).
Matsukaea, S., Keil, L.C. and I.A. Reid. Role of renal nerves in regulation of vasopressin
secretion and blood pressure in conscious rabbits. Am. J. Physiol, F821-F830 (1990).
V
144

N94-12006/y 2f
AUTOGENIC-FEEDBACK TRAINING: A
COUNTERMEASURE FOR ORTHOSTATIC INTOLERANCE
Principal Investigator: Patricia S. Cowings, Ph.D.NASA Ames Research Center
Space Life Sciences Division
Moffett Field, California
Co-Investigators: William B. Toscano, M.A.
Langley Porter Institute
University of California at San Francisco
San Francisco, California
Joe Kamiya, Ph.D.
Langely Porter Institute
University of California at San Francisco
San Francisco, California
Neal E. Miller, Ph.D., Ds.C.
Psychology Department
Yale University
New Haven Conn.
Thomas G. Pickering, M.D.
Cornell University Medical School
New York, N.Y.
145
NASA has identified cardiovascular deconditioning as a seriousbiomedical problem associated with long-duration exposure to microgravity inspace. High priority has been given to the development of countermeasuresfor this disorder and the resulting orthostatic intolerance experienced by
crewmembers upon their return to the l-g norm of Earth. The present studywas designed to examine the feasibility of training human subjects to controltheir own cardiovascular responses to gravitational stimulation (i.e., a tilttable). Using an operant conditioning procedure, Autogenic-FeedbackTraining (AFT), we would determine if subjects could learn to increase theirown blood pressure voluntarily.
When operant conditioning is used to train voluntary control of anautonomic response, the process is called "biofeedback". The question thatdominated biofeedback research in its earliest years and excited the interest ofthe scientific community concerned the rules of plasticity for visceral andcentral nervous system (CNS) function. It was Miller's contention (1969) thatvisceral and CNS events may be modified by contingent reinforcement (i.e.,operant conditioning) in the same way overt behaviors or skeletal responsesmay be conditioned. Hence, the "same rules" apply for describing the processby which a pilot learns to control eye-hand coordination when learning to flyan aircraft as in the situation where an individual learns voluntary control ofhis own heart rate or the vasomotor activity of his hands.
The question as to the specific mechanism by which control of anautonomic response may be learned has spawned considerable basic research.When either classical or operant conditioning is used to modify a visceral
response, there are a number of different ways that the effect can be produced(Miller & Brucker, 1979). Skeletal responses may produce mechanical artifactin the measurement of the visceral response. For instance, contractions of theabdominal muscle may produce pressure changes in the intestine that can be
mistaken for intestinal contractions, (Miller, 1977). Skeletal muscles mayproduce purely mechanical effects on visceral processes. Yogis who claim the
ability to stop their hearts actually perform valsalva maneuvers, buildingsufficient thoracic pressure to collapse the veins returning blood to the heart.
Although heart sounds and pulse cannot be detected , the electrocardiogramshows that the heart still beats (Anand & Chhina, 1961). Skeletal responsesmay stimulate a visceral reflex such as heart rate and blood pressureincreased by isometric contractions (Lynch, Schuri & D'Anna, 1976). Any ofthese skeletally influenced responses may be learned but they do not indicatelearning by the autonomic nervous system.
A series of clinical investigations was initiated on Patients withgeneralized bodily paralysis who suffered from episodic orthostaticintolerance, (Brucker & lnce, 1977; Pickering, et al., 1977). It washypothesized that if learned control of blood pressure could be demonstratedin these individuals where skeletal influence was not a factor, then the basic
research question of visceral plasticity could be examined and the therapeuticbenefits of such training could be explored. The results of these studies
showed that patients could learn to produce increases in blood pressureranging from 20 to 70 mm Hg, with the consequence of eliminating theirorthostatic intolerance. These studies succeeded in establi,hing that control of
blood pressure can be learned independent of skeletal mu.sculature or changes
V
V
146

| J
JV
in respiration. They demonstrated also that training increases specificity ofcontrol, eventually eliminating accompanying pulse rate increases. And
performance of these patients conformed to the cardinal "rule" of operantconditioning: skill increases with practice.
The implications of these results for developing a potentialcountermeasure for orthostatic intolerance in cardiovascularly deconditionedcrewmembers, are apparent. Paralyzed patients show much greater
spontaneous variability in blood pressure than do normotensives, but bedreststudies indicated that normal subjects also tend to exhibit weaker homeostaticcontrol over cardiovascular responses after prolonged inactivity (Sandier &
Vernikos, 1986). Rather than attempting to remove the influence of skeletalmusculature (as was the goal of the above authors), contraction of muscles by
non-paralyzed subjects would be expected to enhance the desired effect ofincreasing blood pressure. The presence of sympathetic vasomotorinnervation in normals should further facilitate peripheral vasoconstriction.
The hypotheses of this study were:
1. Normotensive individuals could learn to increase blood pressure under
supine conditions.
2. Control of blood pressure could be produced under conditions of
gravitational stimulation.
METHODS
_Subjects_. Six men and women between the ages of 32 and 42 participated in this
study. Subjects were physically fit as determined by medical examination and
their participation was voluntary.
Apparatus. A primary criterion for this type of training, is that the individualmust be presented with on-going information about his own physiologicalresponses in real-time (e.g., displaying heart rate on a digital panel meter).For the present study, a computer-controlled blood pressure monitoringsystem was developed, which provided continuous "feedback" of both systolicand diastolic blood pressure on every beat of the heart (Tursky, Shapiro &Schwartz, 1972). This non-invasive system used two blood pressure cuffs,mounted over the brachial arteries of the left and right arms.
The cuff measuring systolic blood pressure was initially inflated to just
above systoli. Using the R wave of an electrocardiogram to initiate a timingwindow, cuff pressure automatically deflated or inflated, in 3 mm Hgincrements, as the system "searched" for the presence of Karotkoff sounds
detected by a crystal microphone beneath the cuff. If the K-sound was
present, cuff pressure was increased on the subsequent heart beat; if absent,cuff pressure was decreased. In this manner, it was possible to track bloodpressure on each heart beat. The tracking cuff was inflated for a period ofone-minute at a time, alternating with deflation during 30-second "rest
periods" to allow normal circulation to resume. The measurement of diastolic
blood pressure (on the other arm) reversed this process.
147

Proccdur¢, Each subject was given 4 to 9 training sessions (15-30 minutes in
duration). Baseline recordings were taken of resting supine heart rate and
blood pressure and changes in these variables resulting from passive head-uptilt of 45 degrees. Subjects were then provided with information on their own
blood pressure in the form of a computer screen numerical display whichupdated on each heart beat and/or two mercury columns showing systolic anddiastolic pressure, respectively. Under supine conditions, subjects were
instructed to increase their own blood pressure, and given an opportunity topractice control. When blood pressure increases were demonstrated undersupine conditions, subjects were again tilted to 45 degrees (head up) and askedto increase their blood pressure.
RESULTS
Under baseline supine and passive tilt conditions, the blood pressure trackingsystem was able to reliably measure blood pressure and heart rate on a beat-tobeat basis. All subjects showed, in response to passive tilt, an initial drop insystolic pressure, increase in diastolic pressure and a corresponding rise inpulse rate (Figure 1).
During supine training sessions, all subjects demonstrated learned increasesin blood pressure ranging from 20 to 50 mm Hg (Figures 2-3). In all of thesesubjects, this same degree of blood pressure control was also possible undersubsequent head-up tilt conditions. Figure 4 shows the data of one of thesesubjects. The left side of this graph shows one minute of resting blood
pressure and heart rate, followed by a voluntary increase of blood pressureduring tilt of maximally 50 mm Hg. Heart rate showed an initial increase from64 to 96 beats per minute, with a Subsequent fall in pulse rate withoutchanging blood pressure levels.
CONCLUSIONS
This study demonstrates that learned control of blood pressure bynormotensive individuals is possible. This skill could be a valuable adjunct toother counter-measures (e.g., inflight fluid loading and exposure to LowerBody Negative Pressure, LBNP). A bed-rest study could be conducted whichwould best evaluate the effectiveness of this procedure, alone and incombination with other tr6atments, as a countermeasure for orthostatic
intolerance in cardiovascularly deconditioned people. The results of that studywould determine the value of developing AFT for preflight and in-flightprocedures for treatment of orthostatic intolerance in aerospace crews. Forexample, blood pressure conditioning sessions could be incorporated into thespacelab exercise facility.
V
V
148
REFERENCES
Anand, B.K. and Chhina, G.S. (1961). Investigations on Yogis claiming to stoptheir heart beats. _0urnal of Medical Research, 49, 90-94.
Brucker, B.S. and Ince, L.P. (1977). Biofeedback as an experimental treatmentfor postural hypotension in a patient with spinal cord lesion. Archives
of Physiology. Medicine and Rehabilitation, .58, 49-53.Miller, N.E. (1969). Learning of Visceral and Glandular Responses, Science, 163.3,
434-445.Miller, N.E. (1977). Effects of learning on gastrointestinal function. Clinics of
Selected Documents in Psychology. 6, Washington, D.C., American
Psychological Association. MS No. 1329.Miller, N.E. and Brucker, B.S. (1979). A Learned visceral response apparently
independent of skeletal ones in patients paralyzed by spinal lesions. In(N. Birbaumer and H.D. Kimmel, Eds.). BiQfeedback and Self-Regulation,
New Jersey: Lawrence Erlbaum Assoc., Pp. 287-304.Pickering, T.G., Brucker, B., Frankel, H.L., Mathias, C.J., Dworkin, B.R., and
Miller, N.E. (1977). Mechanisms of learned voluntary control of blood
pressure in patients with generalized bodily paralysis. In (J. Beatty & H.Legewis, Eds. B_eedback and _. New York: Plenum.
Sandler, H. and Vernikos, J. (Eds.),19861 Inactivity; Physiological Effects.
Orlando: Academic Press, Inc.
Tursky, B., Shapiro, D. and Schwartz, G.E. (1972). Automated constant cuff-pressure system for measuring average systolic and diastolic bloodpressure in man. ][EEE Trlan_actions of Biomedical Engineering, 19, 271.
HGURE CAPTIONS:
Figure l:The data of a representative subject during supine baseline andpassive tilt conditions. The upper dark line represents systolic blood pressure,the lower dark line is diastolic blood pressure (read axis on left, mm Hg). Thethin line is heart rate (read axis on right, BPM). Note: all subsequent graphs
are read similarly.
Figure 2: A two minute sample of one subject's data while practicing bloodpressure increases under supine conditions.
Figure 3: A two minute sample of one subject's data while practicing blood
pressure increases under supine conditions.
Figure 4: A two minute sample of one subject's data while practicing blood
pressure increases under head-up tilt of 45 degrees.
149

O
u.
._o
¢)
o
V
V
o o o o o o _ o
EE
Q O O O
V
_50
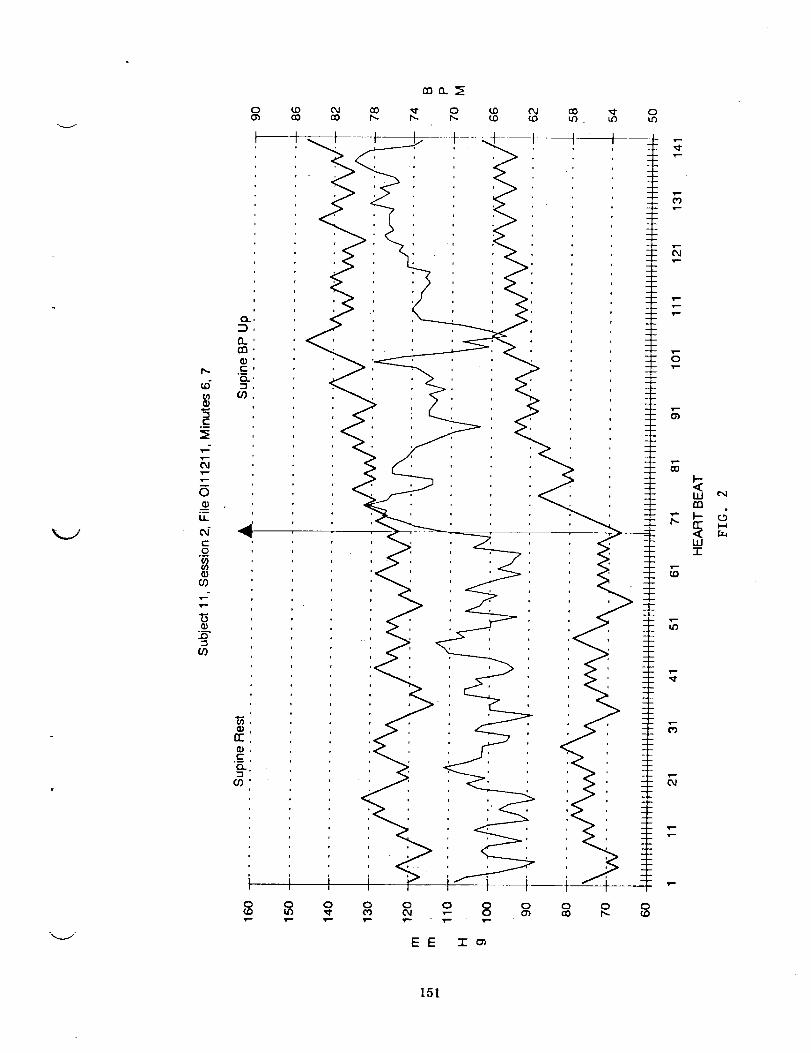
D,-
c_
v-v-OJ
v-m0
LL
e_r-.o
G)co
(o
0
Q_rr
t0COv-
(0CO
OJ¢0
rno__
O0 _!" 0 (,0 CO
I0Lt_
I0
v-
EE I_
0u_
Ill
m
w
151
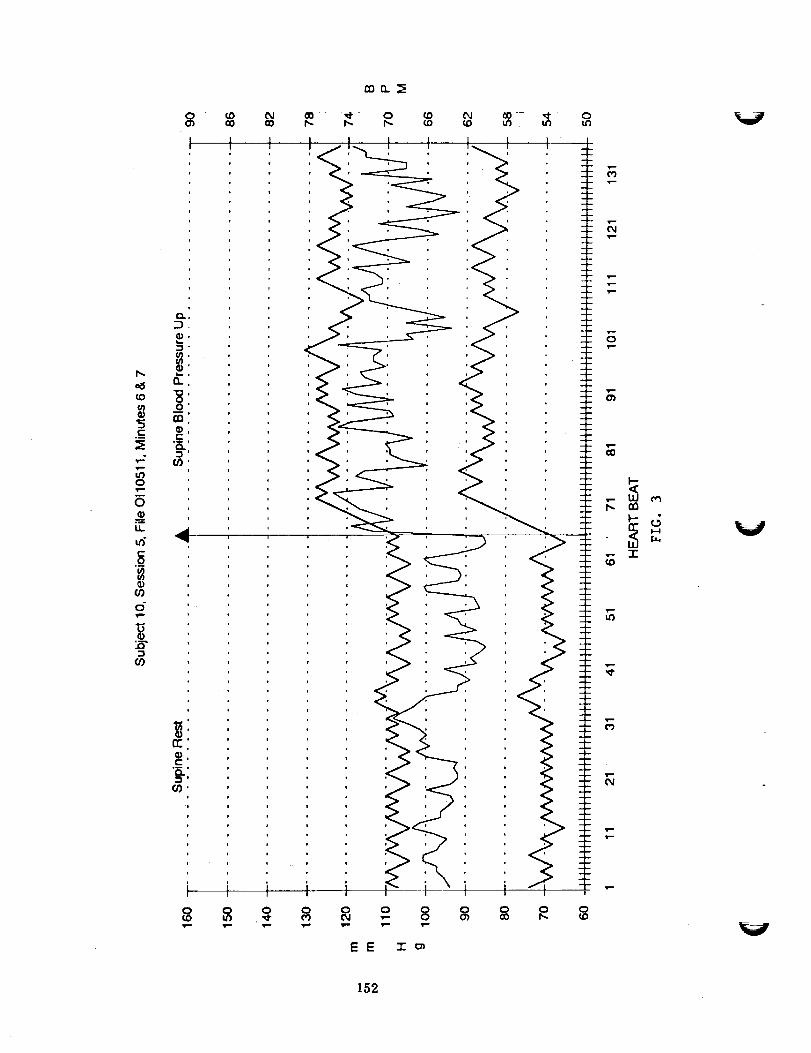
oO •_ 0h. h-
lID Ol a_ _1" 0¢D ¢D LO . U_ U3
h-
¢O(,14)
c_
I'--
N0
Lt.
u_c._o
o"
GO
EE "1" ol
F,1.--
T-!'--
s-
O
1--"
9--
O_
!,--
00
b.,V
V
152

v--
0
t-
_0o
00
u,
0
0
O9
o-
o
o9
| ___!
ocov--
_----I I I I
0 0 0 0 0
<
0 0 0 O
EE -rc_
T--
rn
-r
153

L
|

. iv
N94-12007
RESEARCH REPORT
5/$-S2_-
ip2 sf
Title: Cardiovascular Dynamics During Space Sickness and Deconditioning
(NAG 2-514)
Principal Investigator: Ary L. Goldberger, M.D.
Associate Professor of Medicine
Harvard Medical School
Director, Electrocardiography and ArrhythmiaLaboratories
Beth Israel Hospital
Boston, MA 02215
(617) 735-4199
Co-Investigator: David R. Rigney, Ph.D.
Assistant Professor of Medicine/BiophysicsHarvard Medical School
Associate Director, Arrhythmia/Bioengineering
Laboratory
Beth Israel Hospital
Boston, MA 02215
(617) 735-5121
I_G,___INTENTIONALLI[ Bth,ANII1,55

I. INTRODUCTION
_Wd are currently funded by NASA for the project, "Cardiovascular Dynamics
During Space Sickness and Deconditioning" (#NAG2-514). NASA has given
:priority to the investigation of two problems encountered in the lo__qD_g-term
i space flights currently being planned: i) space motion sickness and, 2)
cardiovascular deconditioning. We have proposed to use spectral and nonlinear
dynamical analysis of heart rate data to quantify the presence of theseproblems and to evaluate countermeasures against them. _:-
We recently reported the first evidence that space motion sickness may be
associated with very bow frequency oscillations in heart rate which can be
easily detected using frequency analysis of Holter monitor data (Fig. I).
These oscillations were not appreciated in earlier studies, which confined
their analysis to alterations of mean heart rate and not to dynamic beat-to-
beat fluctuations. These heart rate oscillations probably reflect altered
autonomic nervous function and are of potential practical importance because
they may i) serve as the first objective non-invasive way of assessing
susceptibility to space motion sickness in flight, 2) help monitor the
efficacy of preventive and therapeutic measures and, 3) permit comparison with
the dynamics of conventional terrestrial motion sickness.
We also reported the use of spectra% analysis in detecting a _oss of normal
heart rate variability in healthy athletic men subjected to 7-10 days of head-
down bed rest, a model for cardiovascular deconditioning during space flight
(Goldberger AL, et al. Atropine unmasks bed rest deconditioning effect in
healthy men: a spectral analysis of cardiac interbeat intervals. J. Appl.
Physiol. 61:1843-1848, 1986). Simila_ analysis ma_ be of practical use inassessinE the efficacy of countermeasures, such as intermittent centrifugal
acceleration or time-varying lower body negative pressure.
The goals of this project, in concert with colleagues at NASA-Ames and JSC
are:
i) To compile digitized databases of continuous ECG recordings a) from
crew members of previous and future flights and b) from previous studies
of induced motion sickness in ground-based simulations.
2) To correlate the low frequency (! .01 Hz) heart rate oscillations
observed during space flight with a) subjective motion sickness
symptoms, b) activity level, and c) a respiratory signal derived from
the Holter ECG.
3) To determine whether heart rate dynamics during terrestrial motion
sickness (rotating chair test) are equivalent to those observed in space
flight.
4) To develop a physiological model of heart rate variability that
explicitly includes gravitational forces and that can be used tosimulate the oscillations observed in space and to test the role of
autonomic perturbations in their pathogenesis.
%.i
156
5) To quantitate the loss of heart rate variability associated with
bedrest deconditioning; to determine whether countermeasures (e.g.
intermittent acceleration) prevent this deconditioning effect; and to
determine whether bedrest deconditioning induces changes in heart rate
dynamics comparable to those actually observed during space flight.
% 7
II. RECENT ACCOMPLISHMENTS
A. Analysis of Ground-Based Motion Sickness Tests
In collaboration with Pat Cowings, Ph.D. and her associates at NASA-Ames, we
have performed detailed spectral and time series analysis of data from 20
healthy volunteers studied during a rotating chair protocol designed to
simulate ground-based motion sickness. Analysis of the relatively short (<5
min) data segments obtained at successive stages of the protocol did not
reveal heart rate patterns or changes that were predictive of susceptibility
to terrestrial motion sickness. However, the short data segments available
from the study preclude any conclusions about lower frequency fluctuations
(eg., ! .05 Hz) that may be of importance. For example, in our preliminary
analyses of space flight data, the oscillations we detected were ! .01 Hz.
Similarly, pathologic heart rate oscillations we have observed in other
settings (eg., heart failure) were also usually ! .04 Hz.
B. Analysis of In-Flight Data
Apart from the Holter records that we have analyzed previously (Fig. 1 from:
Goldberger AL et al. Low frequency heart rate oscillations in space shuttle
astronauts: a potential new marker of susceptibility to space motion sickness.
Space Life Science Symposium. Three Decades of Life Science Research in
Space. Washington, D.C. 1987:78-80), the only existing records of in-flight
heart rate variability are found in the records acquired by Dr. Cowings and on
echocardiograms given to us by Dr. Charles of NASA Johnson. Release of in-
flight data from Dr. Cowing's laboratory is still pending administrative
clarification from NASA Headquarters and NASA-Ames. We have developed image
processing software to help extract the heart-rate data from Dr. Charles'
video tapes. However, preliminary analysis of these data show that they do
not provide a consistent recording of continuous heartbeat cycles since the
echocardiographic transducer is not in one locus for sustained periods. Also,
the recordings contain frequent interruptions due to change from M-mode to 2D
images. Therefore, analysis of continuous in-flight data remains of critical
importance.
C. Analysis of Other Heart Rate Data
In collaboration with Lewis Lipsitz, M.D. of the Gerontology Division at Beth
Israel Hospital and Harvard Medical School, we analyzed spectral
characteristics of heart rate variability before and during postural tilt in
young and old subjects. We found that young, healthy subjects with syncope
had a significant increase in low frequency heart rate variability during tilt
compared to those without vasovagal syncope. On the other hand, elderly
subjects did not develop syncope and showed reduced supine heart rate
157

variability, as well as absent or attenuated low frequency activation during
tilt. Our findings may provide a marker for susceptibility to vasovagal
syncope and may provide a physiologic explanation for resistance to vasovagalsyncope in old age.
D. Mathematical Modeling and Nonlinear ADalysi._
Interpretation of the observed heart rate variability is being made with the
aid of mathematical models of the cardiovascular system. We have devised a
preliminary nonlinear model of heart rate control that under different
parameter values yields erratic fluctuations, sustained oscillations and
abrupt changes of the type we have observed under a variety of physiologic andpathologic conditions (Fig. 2).
We have also analyzed the nonlinear dynamics of normal heart rate variability
in healthy subjects. To test the hypothesis that physiologic beat-to-beat
variability in sinus rhythm represents nonlinear "chaos .... a non-random typeof erratic behavior generated by deterministic processes --we computed
Lyapunov exponents for heart rate time series (10,240 consecutive data points
over 1 1/2 hours) of subjects under basal conditions, after filtering with
singular value decomposition. All data sets had a positive Lyapunov exponent(.02-.04) consistent with an underlying nonlinear chaotic mechanism. This
novel finding will be presented at the 1990 National American HeartAssociation Meeting.
A flow chart of our ECG data analysis protocol is given in Fig. 3.
ill.
A. In-Flight Data Analysis
Analysis of in-flight data (with suitable pre- and post-flight controls)
remains a high priority. We have arranged with Dr. H. Bungo and Dr. J.
Charles of JSC to collaborate in the analysis of Holter monitor data to be
provided by the Soviets from ongoing and future flights. We have participated
extensively in discussion and briefings with Dr. Bungo and colleagues by
telephone and in person during a May 1990 invited visit to JSC, to review the
technical aspects of data collection and data analysis. During that visit Dr.
Goldberger and Dr. Rigney presented a seminar on Cardiac Dynamics and met withmembers of the JSC cardiovascular research team.
Based on conversations with Dr. J. Stoklosa of NASA Headquarters, we
anticipate the imminent release of data from Dr. Cowings' laboratory with
recordings of in-flight and post-flight data from several U.S. astronauts.
B. Bedrest Studies
During our May 1990 visit to JSC we met with Suzanne Fortney, Ph.D. and made
plans to collaborate in the analysis of heart rate data obtained from healthy
subjects during a bedrest protocol. We have begun to perform analysis on thefirst subjects in this session to test the hypothesis that bedrest
V
158

\ i
deconditioning alters heart rate variability, particularly with an attenuation
of higher frequency components due to vagal tone (Fig. 4).
C. Management Distribution and Archiving of Physiological Signals
We have been informed that essentially all the computer tapes with heart rate
data from earlier missions (Mercury, Gemini, Apollo and Skylab) have already
been discarded because of lack of storage space at NASA/Johnson and
incompatibility of the tapes with current equipment. Given the great expense
of these missions and the uniqueness of the data, a centralized, accessible
and comprehensive library of these kinds of records is of critical importance.
It should be emphasized that these heart rate data are not only of value to
groups such as ours interested specifically ins_pace sickness and
cardiovascular deconditioning. They are also an invaluable resource for
investigators in other areas, such as studies of circadian rhythms.
Details related to archiving and distribution of the ECG data needs to be
decided in collaboration with NASA. In particular, the possibility of
distributing these data after de-identification in the form of compact discs
should be explored. We have practical experience with this novel form of
inexpensive ($3.00/disc) data archiving and distribution. Other important
issues relating to the contents of the database, authorization for its use,
and so forth, will also require collaboration with NASA during the definition
phase of the project. This new archiving and retrieval system using compact
discs would greatly simplify information and storage by Life ScienceInvestigators.
Discussion with NASA is also required concerning the protocol for recording
and archiving of heart rate data from future flights. Careful analysis of
existing data will help guide the formulation of protocols for data
acquisition on future missions. Should heart rate data be acquired throughout
the flights or just at selected times? What control data should be acquired
pre-flight and post-flight? What equipment should be used to record thesedata?
k_J
IV. PUBLICATIONS AND PREPRINTS SUPPORTED BY PRESENT GRANT
i. Goldberger AL, Rigney DR. On the non-linear motions of the heart:
fractals, chaos and cardiac dynamics. In A Goldbeter, ed. Cell to cell
signalling: from experiments to theoretical models, Academic Press, San
Diego, 1989, pp 541-549.
2. Rigney DR, Goldberger AL. Nonlinear dynamics of the heart's swinging
during pericardial effusion. Am J Physiol. 257:(Heart Circ Physiol 26):
H1292-1305, 1989.
3. Goldberger AL, Rigney DR, West BJ. Chaos and fractals in human
physiology. Sci American. 262:42-49, 1990.
Goldberger AL. Nonlinear dynamics, fractals and chaos: Application to
cardiac electrophysiology. Ann Biomed Eng. 18:195-198, 1990.
.
159

5.
.
.
.
.
Goldberger AL. Fractal electrodynamlcs of the heartbeat, Ann NY AcadScl. 591:402-409, 1990.
Lipsitz LA, Mietus J, Moody GB, Goldberger AL. Spectral characteristics
of heart rate variability before and during postural tilt. Relations to
aging and risk of syncope. Circulation 81:1803-1810, 1990.
Goldberger AL. Fractal mechanisms in cardiac electrophysiology. In S.
Sideman, A Kleber, eds. Cardiac electrophysiology and transport, Kluwer
Academic Publishers, Norwell, MA, in press.
Goldberger AL. Fractals and the heart. Proc Royal Dutch Acad Sci, inPress.
Rigney DR, Mietus J, Goldberger AL. Is normal sinus rhythm "chaotic"?
Measurement of Lyapunov exponents. Circulation. 82(Suppl III): 236,1990.
160

r I-....
gO
SO
T_ME SERIES
- 7'0 J
4O
30 [ ! l :[ l l t l2 4 G 8 IO _2 i4 t6
TiM( {mlnl
_.0
J
MEART RATE SPECTRUM
1 '
_' / O'_'i '/ ._ (_:_"_"\ ._,V_'._ -'b'_'_'_' _._ '"•_ _,"._'.'.'"
0 " ."Y_' "_,.'._.." .---'_ ....... " Io o_ oz . OS 04 OS
HI
Figure 1. Heart rate time series and corresponding frequency spectrum from.an
as_r6naut with space motion sickness (SMS). Upper panel': During SMS, the
.astronaut's" heart rate is seen to exhibit a series of large amplitude
oscillations, not seen under normal conditions, that might be used as a marker
of the syndrome's presence. Lower panel" This is the Fourier spectrum of the
above heart rate time series, showing the range of frequencies over which the
oscillations occur. They are found in the band centered around 0.01 Hz that
is indicated by the arrow.
HcLrt R_= Va,nab,Zi_ -
i-- A
1-uM (see)
i t1|
oo o_ OJ o) o. O_
"_ " B
1
Figure 2. Erratic and periodic heart rate data in a totally deterministic,
nonlinear model of cardiovascular control. A. For certain parameter values,
the heart rate fluctuates deterministically for thousands of beats. The peak
at 0.225 beat "_ is due to baroreflex. B. The continuation of the simulation
in (A) demonstrating intermittency that starts and stops abruptly.
161

Figure 3. Flow chart for electrocardi_graphlc data analysis in ourlaboratory.
L IDIGITIZED
ECG
EDR
ECG derived
resp£ra,_on
ANALOG IECG
CONVERSION
HOLTKRMONITOR
....
ARISTOTLE
• "detect_ QRS complexes
classifies" beats
FIXANN
interpolatesectopic
and missedbeats
I
SCANNER
FFT
Fast
Fourier
Transform
TACH
instantaneous
heart rate
SVD
Singular
Value
Decompostion
Lyapunov
Exponent
Estimation V
162

A: q,ie_ BreaO_|. P._ Bed R,.a
|4_ •
j .m
20
0
o ; I; 2O
4'
_ 3' I
I<
...... o _=-. ..... , .no o.1 o4 03 0'.4 oJ
F_.enc7 _z)
Poem= O.O.S= t1.13
0-0.01 - 14.16 (0.l?)
0.0! • 0.15 • 39.13 (0.4S)
0.15 * O_ - 3434 (031)
v
• o
. . . .. ,
B: <_ B_. 4 Days B_ Re..
IX
o '°6C
4O
Ol
0 10 15 -,n 25
T_ne (m_)
5
3.
pl: 2.
.<
I'i" a- J
' + + " + "I0.0 0.1 0.2 0.3 0.4 0.5
Fr_um_-y 0"{z)i
Powzrtc O- 0.5 • 10#2
0 - 0.0! • 34 _ (0A3)
0.01 • 0.15 - 3'+19 (0.40)
O.15-0J - 14.2'7(0.11)
C: _e4 Brcazhinl. 9 Days Bed P.csl
140
120
IO
60.
4o,
20.
0
0
+..
i -i ,-' j
$ lO 15 20
T_me (rain)
,+ .+o.o o.1 0.2 o.3 o._ o+
F_uencx _)
Pom+zn: O-OJ • l.qI..lO
O- 0.0! - 17,_ (031)
0.01 - 0. I$ = $1.d0 (0..r_)
0.15.03 - 1:._. (0+01)
Figure 4. Heart rate time series and spectra from a young healthy adult
female before and during bedrest study. Note the prominent, vagally-mediated
high frequency peak in panel A associated with metronomic breathing at .25 Hz.
During bedrest (B, C) there is attenuation of this peak, consistent with a
loss of vagal tone associated with deconditionlng. Average heart rate is also
increased. Data are from the study being conducted by Dr. Suzanne Fortney,
JSC. Spectral power for different bands is shown below each data set.
Numbers in parentheses indicate percentage of total power in each band.
163

V
V

SUMMARY:
Cardiovascular Measurements in Chronically Instrumented Conscious Monkeys
November 21, 1990
Stephen F. Vatner, M.D.
Professor of Medicine
Chairman, Cardiovascular Divison
Harvard Medical School
New England Regional Primate Research Center
TEL: (508) 624-8021
FAX: (508) 624-0747
J
165

SUMMARY: Cardiovascular Measurements
in Chronically Instrumented Conscious Monkeys
Flow Measurement Comparison Studies
These studies are being conducted to compare the ability to measure blood flow
in chronically instrumented animals using four different techniques, the electromagnetic,
ultrasonic transit-time, ultrasonic pulse-Doppler, and ultrasonic directional-Doppler. The
studies are conducted in phases, with phase 1, bench comparisons completed, and phase2, animal studies in progress.
The bench studies demonstrate that all flowmeters possess good linearity of output
with volume flow calibrations, in excess of the maximum physiologic range of flowvelocities.
To date, 5 animals have been studied after chronic implantation of pairs of flow
probes on the left and right iliac arteries. The studies indicate that the EMF and transit-
time probes both compare well as volume flow measuring devices, and linearity of
calibrations compare favorably in all three techniques. The EMF probes are less stable
relative to zero flow, and require an occlusive flow reference for meaningful
measurements. The transit-time device seems to be much more stable at zero, since
electrical contact with electrodes is not necessary, as with the EMF system. The transit-
time technique may well require an occlusive zero reference for best accuracy, since this
parameter depends partially upon the actual aIignment of the vessel and probe after thefull development of connective tissue around the probe.
Long Term Implants in Small Monkey
This project examines the long-term viability for measurement of aortic pressure,
aortic blood flow, and left ventricular pressure in primates. Eight animals have been
studied after chronic implantation of left ventricular pressure gauges (Konigsberg),
indwelling catheters for calibration of the Konigsberg, and either EMF or Transonic
ultrasonic flow probes around the aorta. The Konigsberg transducers measured LV
pressure reliably for four to six months. The indwelling catheters remained patent forvarious times, from three to seven months. All flow transducers worked well for the
duration of the implant.
Attached is a figure (Figure I) showing signals obtained from two animals. The
left hand panel shows the signals from the Konigsberg LV transducer, LV dP/dt, and the
Transonic flowprobe around the aorta, at four months post-implantation. The right panel
shows similar signals from the other animal at six months, with an electromagnetic flowprobe around the aorta.
We have also utilized the instrumentation for the two studies referenced at the
beginning of this Progress Report. Examples of the phasic data in chronically-instrumentedprimates are shown in Figures 1 and 2.
V •
166

%_./'
Future Plans and Rationale for Chronically Instrumented Monkeys for Understanding
Cardiovascular function in Long Duration Missions
The problems with cardiovascular deconditioning will become much more intense
with the projected long-duration missions planned by NASA. In order to study the
problems and hope to gain any insight into the mechanisms which may ameliorate the
deleterious effects of long-term space flight in microgravity, a non-human primate model
to assess chronic cardiovascular function in a conscious state will be required.
Prolonged spaceflight and microgravity induce body fluid shifts, which increase
cardiac dimensions and pressures, which in turn, alter cardiac output, the distribution of
blood flow to vital organs and adrenergic control and reflex control of the cardiovascular
system. It is important to determine the mechanisms for these cardiovascular alterations
during microgravity and spaceflight in order to design countermeasures for future
prolonged spaceflight.
To accomplish this, a Rhesus monkey model will be utilized to measure cardiac
output, cardiac function, and regional blood flows during prolonged spaceflight and
microgravity. A second major goal will be to determine whether prolonged spaceflight and
microgravity alter reflex and adrenergic control of cardiac function and regional blood flow
in the Rhesus monkey. This will be achieved by examining the effects of 1) baroreflex
perturbation with inferior vena caval occlusion (IVCO) and bilateral carotid occlusion
(BCO), 2) low pressure cardiac receptors perturbation with volume loading, lower body
negative pressure (LBNP) and lower body positive pressure (LBPP), 3) stimulation and
blockade of autonomic receptors with a, J3, and cholinergic subtype selective agonists and
antagonists. However, before all of these goals can be accomplished, the appropriate
instrumentation must be calibrated and verified to be useful for cardiovascular
experimentation in spaceflight. A third major goal is to examine the above interventions
on coronary and cerebral blood flows in the Rhesus monkey. The fourth major goal is
to determine whether prolonged spaceflight and microgravity induce catecholamine
desensitization in the Rhesus monkey; which could be the underlying biochemical
mechanism responsible for alterations in adrenergic control.
167

i:iF
mo
0_/
h_
{j
OZ
[,Jul_(,,,IM
!,1,1 VI
V
..-',,.,
I,,I ZZO0_"
i.-- I.I.
I11
I,,4LL
0I,-I
I-ZIll r,"
Vl_-w
-.J_.
I-r_
r_
:>
168
£300
tJ
0,_

C:0
i .......
169
.._ r,e- Qo EE
0 :
u G
m C
Eo o a
o_ 0 .D
Z _ o_
m u,l:
u.l:: c
_,1 ,,,,.4 _
q- o 4.
_ "_ o004..)-,-•-_ _ E
I_NC
U
_ tJ Q
_ C
r_

V
..... Z
mm--_ _,
_L
V
V
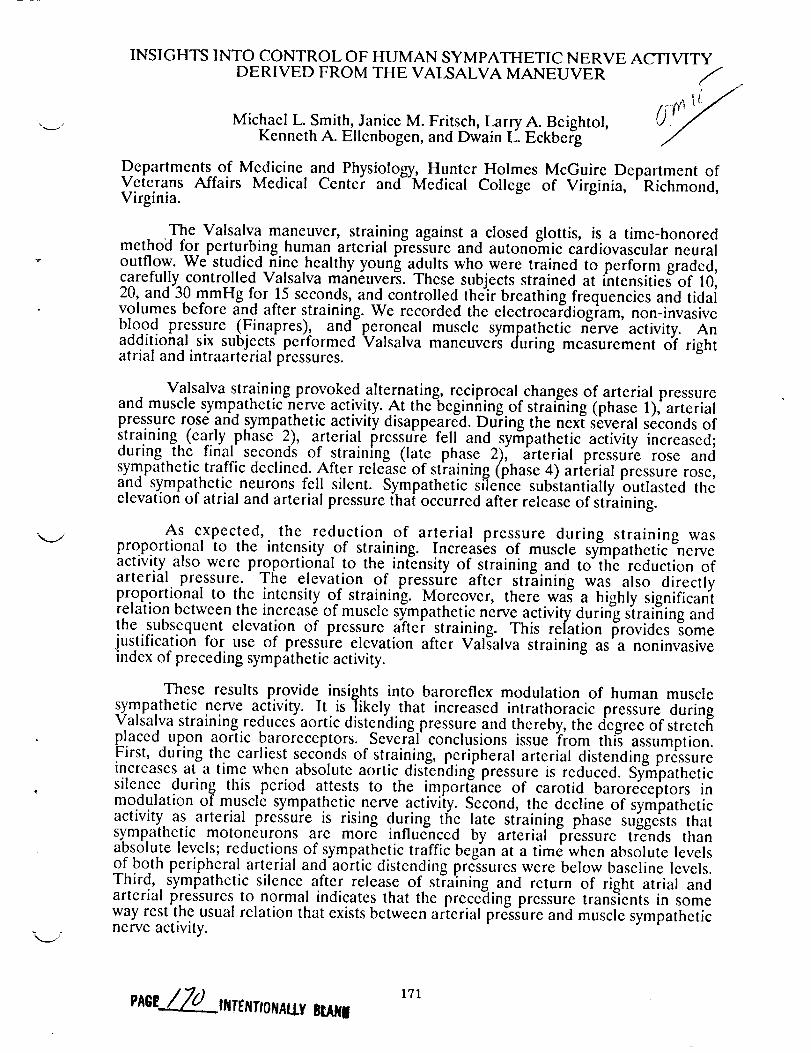
x_.j
INSIGHTS INTO CONTROL OF HUMAN SYMPATHETIC NERVE ACTIVITY
DERIVED FROM THE VALSALVA MANEUVER ¢//"
Michael L. Smith, Janice M. Fritsch, Larry A. Beightol, (it'/
Kenneth A. Ellenbogen, and Dwain L. Eckberg /
Departments of Medicine and Physiology, Hunter Holmes McGuire Department ofVeterans Affairs Medical Centcr and Medical College of Virginia, Richmond,Virginia.
The Valsalva maneuver, straining against a closed glottis, is a time-honoredmethod for perturbing human arterial pressure and autonomic cardiovascular neural
outflow. We studied nine healthy young adults who were trained to perform gradcd,carefully controlled Valsalva maneuvers. These subjects strained at intensities of 10,20, and 30 mmHg for 15 seconds, and controlled their breathing frequencies and tidalvolumes before and after straining. We recorded the electrocardiogram, non-invasive
blood pressure (Finapres), and peroncal muscle sympathetic nerve activity. Anadditional six subjects performed Valsalva maneuvers during measurement of rightatrial and intraarterial pressures.
Valsalva straining provoked alternating, reciprocal changes of arterial pressureand muscle sympathetic nerve activity. At the beginning of straining (phase 1), arterialpressure rose and sympathetic activity disappeared. During the next several seconds ofstraining (early phase 2), arterial pressure fell and sympathetic activity increased;during the final seconds of straining (late phase 2), arterial pressure rose andsympathetic traffic declined. After release of straining (phase 4) arterial pressure rose,and sympathetic neurons fell silent. Sympathetic silence substantially outlasted theelevation of atrial and arterial pressure that occurred after release of straining.
As expected, the reduction of arterial pressure during straining wasproportional to the intensity of straining. Increases of muscle sympathetic nerveactivity also were proportional to the intensity of straining and to the reduction of
arterial pressure. The elevation of pressure after straining was also directlyproportional to the intensity of straining. Moreover, there was a hi_,hlv significantrelation betwcen the increase of muscle sympathetic nerve activity durin_ s'trai?fing andthe subsequent elevation of pressure after straining. This relation provides somejustification for use of pressure elevation after Valsalva straining as a noninvasiveindex of preceding sympathetic activity.
These results provide insights into baroreflex modulation of human muscle
sympathetic nerve activity. It is likely that increased intrathoracicpressure duringValsalva straining redtices aortic distending pressure and thcreby, the dcgree of stretchplaced upon aortic baroreceptors. Several conclusions issue from this assumption.First, during the earliest seconds of straining, peripheral arterial distending pressureincreases at a time when absolute aortic distending pressure is reduced. Sympatheticsilence during this period attests to the importance of carotid baroreceptors inmodulation of muscle sympathetic nerve activity. Second, the decline of sympatheticactivity as arterial pressure is rising during the late straining phase suggests thatsympathetic motoneurons are more influcnccd by arterial pressure trends thanabsolute levels; reductions of sympathetic traffic began at a time when absolute levelsof both peripheral arterial and aortic distending pressures were below bascline levels.
Third, sympathetic silence after release of straining and return of rig.ht atrial andarterial pressures to normal indicates that the preccding pressure transients in some
way rest the usual relation that exists bctwecn arterial pressure and muscle sympatheticnerve activity.
PAOFJ-.-_._ INTEN'frOH,_LLy B_NII171

V


%atlonat AeronautiCS and53ace Administration
1. Report No
CP-10068
REPORT DOCUMENTATION PAGE
2. Government Accession NO.
4. Title and SubtitleProceedings of First Joint NASA Cardiopulmonary Workshop
7. Author(s)
Suzanne Fortney, Ph.D.R. Hargens, Ph.D.
9. Performing Organization Name and Address
KRUG Life Sciences1290 Hercules, Suite 120Houston, TX 77058
12. Sponsoring Agen_ Name and Address
NASA Johnson Space CenterMail Code SO5Houston, TX 77058
3. Recipient's Catalog No.
5. Report Date5 - 7 December 1990
6. Performing Organization Code
SD5
8, Performing Organization Report NO •
10. Work Unit No.T
Contract or Grant No.
NAS9-17720
13. Fype of Report and Period Covered
Conference Publication5 - 7 December 1990
Sponsoring Agency Code
15, Supplementary Notes
16.Abstract f ideas among NASA cardiopulmonary principalOn 5-7 December 1990, a workshop was held at the Johnson Space Center to promote
communication and cross fertilization o ........ ._^..imonarv investigators sponsored
investigators. This was the first such meetlng or _=rui_w- -by the Johnson Space Center, Kennedy Space Center, and the Ames Research Center. Each_ summar of recent progress in his or herprincipal investigator gave a_20 m_u _ocardiography (J- Char_es))..PU_[_1_uncU_U / --,, inht eclaknr_t rv. loPics covered _nc,u .. ? ....._ _._°_ hvnerhvdratlon tm. _,¢u¢=_ _,:?_--TJ° ;...._ _pntral hemodynamics IK. LacnamJ, _,J_-_l C_..._,,o -ressure countermeas-tlon in. uuj(, _--;_ _...... A A c_IHberaer), lower body u_9_'_ _. ,., ,...... +4.nspectral analysls tb. _=_:_+_o_n_v (J. Buckey), autonomic functlon iv. bu..=-_ ....,ures (S. Fortney), orthosLa_,_ _ ......." " - uid and renal responses toM. Smith, D. Eckberg), cardiac deconditioning (C. Tipton), flhead-down tilt (B. Tucker), local fluid regulation (A. Hargens), endocrine regulation
during bedrest (J. Vernikos, C. Wade), autogenic feedback (P. Cowings), and chroniccardiovascular measurements (S. Vatner). The program ended with a general discussion of
weightless models and countermeasures.
Key Words (Sugge_ed by Author(s)) lB. Distribution Statement7 weightlessness, microgravity, space_ Unclassified - Unlimited
io ulmonary function, bedrest, heart, I r 52card" p ........ _ Subject catego Y -autonomic function, barorecepcur=,_
spectral analysis19 _ Class,fication (of this _20" Secu-_ty
Unclassified _ UnclassifiedFor sale by the National Technl(a nfqlf_,al;o _ _erwce. Springfield VA 22161 2171
;SC Form 1424 (Rev Aug 89) (EthernetJanB8)
22 Price
1
!