Irrigation benefits for pasture production in the Wairarapa benefits for... · Irrigation benefits...
25
Irrigation benefits for pasture production in the Wairarapa Green S. November 2005 Data for communication Report to Meridian Energy Ltd HortResearch Client Report No. 17964 HortResearch Contract No. 20365 Green S. HortResearch Palmerston North Batchelar Research Centre Private Bag 11030 Palmerston North, New Zealand Tel: +64-6-356 8080 Fax: +64-6-354 0075
Transcript of Irrigation benefits for pasture production in the Wairarapa benefits for... · Irrigation benefits...

Irrigation benefits for pasture production in the Wairarapa Green S.
November 2005
Data for communication
Report to Meridian Energy Ltd
HortResearch Client Report No. 17964
HortResearch Contract No. 20365
Green S.
HortResearch Palmerston North
Batchelar Research Centre
Private Bag 11030
Palmerston North, New Zealand
Tel: +64-6-356 8080
Fax: +64-6-354 0075

DISCLAIMER
Unless agreed otherwise, HortResearch does not give any prediction, warranty or assurance in relation to the
accuracy of or fitness for any particular use or application of, any information or scientific or other result
contained in this report. Neither HortResearch nor any of its employees shall be liable for any cost (including
legal costs), claim, liability, loss, damage, injury or the like, which may be suffered or incurred as a direct or
indirect result of the reliance by any person on any information contained in this report.
This report has been prepared by The Horticulture and Food Research Institute of New Zealand Ltd
(HortResearch), which has its Head Office at 120 Mt Albert Rd, Mt Albert, AUCKLAND. This report has been
approved by:
_____________________________ ___________________________
Research Scientist Group Leader, Quality Systems
Date: 22 November 2005 Date: 22 November 2005

1
CONTENTS
Page
EXECUTIVE SUMMARY ........................................................................................................ 1
BACKGROUND ........................................................................................................................ 3
MODEL APPROACH ............................................................................................................... 3
SCENARIO MODELLING ....................................................................................................... 6
LIMITATIONS OF THE MODELLING .................................................................................. 9
REFERENCES ......................................................................................................................... 11
APPENDIX A - MASTERTON RESULTS ............................................................................ 12
APPENDIX B - MARTINBOROUGH RESULTS ................................................................. 16
APPENDIX C: ANNUAL IRRIGATION DEMAND AND PASTURE PRODUCTION FOR
THE WAIRARAPA ................................................................................................................. 20
EXECUTIVE SUMMARY
Irrigation benefits for pasture production in the Wairarapa
Report to Meridian Energy Ltd
Green S. November 2005
Meridian Energy is interested in the benefits that irrigation may have for agricultural and
horticultural activities in the Wairarapa region. HortResearch has been contracted to carry out
a desktop modelling exercise to evaluate the benefits of irrigation in terms of potential pasture
production. The objective is to quantify the difference in yields between dry-land and
irrigated pastoral (kg DM / Ha) farms over a range of seasons, in order to understand the
variability of irrigation requirements, and pasture yields.
For this task, model calculations were carried out using HortResearch’s SPASMO (Soil Plant
Atmosphere System Model) model. The soil water balance was calculated by considering the
inputs (rainfall and irrigation) and losses (plant uptake, evaporation, runoff and drainage) of
water from the soil profile. Pasture growth was modelled as being proportional to actual
evaporation rate, ETA. Model inputs included long-term (1972-2004) records of daily climate
from Masterton and Martinborough. Three soil series (Ahikouka silt loam, Kokotau clay
loam, and Tauherenikau shallow silt loam) were considered and calculations were made of the
water balances and annual dry-matter productions from a dry-land and an irrigated farm. The
key results are:
Average pasture production from a dry-land farm near Masterton was calculated to be just
69% (Tauherenikau shallow silt loam), 73% (Kokotau clay loam) and 85% (Ahikouka silt
loam) of an irrigated farm. The average annual irrigation requirement was calculated to be
350 mm yr-1
(Tauherenikau shallow silt loam), 400 mm yr-1
(Kokotau clay loam) and 250
mm yr-1
(Ahikouka silt loam).
Average pasture production on a dry-land farm near Martinborough was calculated to be
just 61% (Tauherenikau shallow silt loam), 65% (Kokotau clay loam) and 78% (Ahikouka

2
silt loam) of an irrigated farm. The average annual irrigation requirement was calculated
to be 400 mm yr-1
(Tauherenikau shallow silt loam), 475 mm yr-1
(Kokotau clay loam)
and 350 mm yr-1
(Ahikouka silt loam).
Irrigation is expected to increase annual pasture production by between 15 and 40%,
depending on soil type and rainfall. Masterton receives about 140 mm yr-1
more rain than
Martinborough. On average, pastures in Martinborough require about 50-100 mm more
irrigation each year.
The range in pasture production, as represented by (max-min)dryland /meanirrigated, is somewhere
between 28 and 43% on a dryland farm. The corresponding range on an irrigated farm is just
20%. These results confirm that irrigation reduces the year-to-year variability in pasture
production.
Realizing these potential yield gains in an efficient manner will require careful management
of irrigation, especially on some of the very stony free-draining soils.
For further information contact: Steve Green
HortResearch Palmerston North
Batchelar Research Centre
Private Bag 11030
Palmerston North, New Zealand
Tel: +64-6-356 8080
Fax: +64-6-354 0075
Email: [email protected]

3
BACKGROUND
Meridian Energy is interested in the benefits irrigation may have for agricultural and
horticultural activities in the Wairarapa region. It is anticipated that irrigation will offer both
an increase in yield and an increase in the reliability of the yield from year to year. Both the
total amount of pasture produced and the variability of that production on an annual basis are
important in determining the type and intensity of farming system that can be adopted.
HortResearch has been contracted to carry out a desktop modelling exercise to evaluate the
benefits of irrigation in terms of potential pasture production. The results were requested in
tabular form, with commentary limited to details of the data sources, descriptions of the
scenarios modelled, the assumptions used and any limitations applicable.
The objective of the modelling was to:
Quantify the difference in yields between dry-land and irrigated pastoral (kg DM / Ha)
farms for two representative soils (low and medium soil moisture holding capacity) for
the Wairarapa region
Compare the dry-land and irrigated pastoral systems over a representative range of
seasons (30-year simulation, based on actual climatic data from the Wairarapa region),
in order to understand the variability of irrigation requirements, and pasture yields.
The results will be used as the driver for decisions on the land use diversification and
intensification options possible. The results also create output parameters to be used in
subsequent farm financial performance modelling. Model output includes dry matter
production on an annual basis for both dry-land and irrigated systems, the depth of water
applied during the irrigation season, and a ranking of the drought return period.
MODEL APPROACH
Model calculations were carried out using HortResearch’s SPASMO model (Green et al.
1999; Rosen et al. 2004). The soil water balance was calculated by considering the inputs
(rainfall and irrigation) and losses (plant uptake, evaporation, runoff and drainage) of water
from the soil profile. Pasture water use was modelled using the FAO crop-factor approach
that relates water use to the prevailing weather and time of year (Allen et al. 1998). Measured
values of global radiation, air temperature, relative humidity and wind speed were used to
calculate the reference evaporation rate, ETO [mm d-1
] as:
)34.01(
)()273(
900)(
2
2
0us
eeuT
GRs
ET
asHN
[Eq. 1]
where RN [MJ m-2
d-1
] is the net radiation, GH [MJ m-2
d-1
] is the ground heat flux, T [oC] is
the mean air temperature, es [kPa] is the saturation vapour pressure at the mean air
temperature, ea (kPa) is the mean actual vapour pressure of the air, u2 [m s-1] is the mean
wind speed at 2 m height, s [Pa oC
-1] is the slope of the saturation vapour-pressure versus
temperature curve, [66.1 Pa] is the psychrometeric constant, and [2.45 MJ kg-1
] is the
latent heat of vaporisation for water. Input data were compiled from the national climate
database using long-term (1972-2004) records from Masterton [Te Ore Ore (7578) and East
4
Taratahi (2610)] and Martinborough [Martinborough (SN2651 & SN 21938) and
Tauherenikau (SN2623)].
Pasture production was modelled in the following manner. To an acceptable first
approximation, dry matter production is proportional to transpiration (McAneney and Judd
1983). Furthermore, for full-cover pasture (leaf area index > 3), nearly all the
evapotranspiration is transpiration (Kerr et al. 1986). Thus, we modelled pasture growth as
being proportional to actual evaporation rate, ETA,
G = k ETA. [Eq. 2]
The proportionality constant, k with units of kg DM ha-1
mm-1
, is a site-specific factor which
could also be an index of soil fertility status. A set value of k = 19 kg DM ha-1
mm-1
has been
reported by Moir et al. (2000) for a range of pastures in the Wairarapa. This value of k is
consistent with our own studies of pasture production on an irrigated dairy farm in Hawke’s
Bay (Green et al. 2003), and a dry-land farm in the central North Island (Webby et al. 2003).
Transpiration proceeds at a maximum (climate dependent) rate, providing soil water and
nutrients are non-limiting. However, once the root-zone water deficit increases above a given
threshold, pastures exhibit symptoms of water stress that reduce transpiration and curtail
productivity.
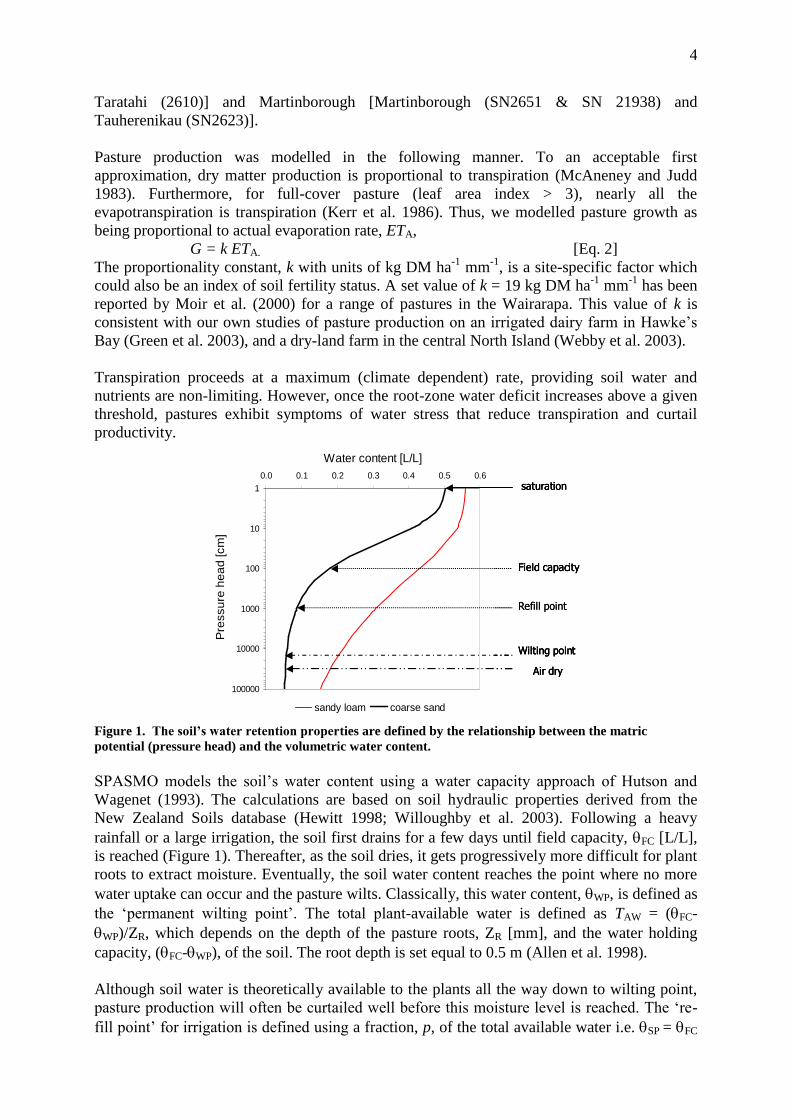
Figure 1. The soil’s water retention properties are defined by the relationship between the matric
potential (pressure head) and the volumetric water content.
SPASMO models the soil’s water content using a water capacity approach of Hutson and
Wagenet (1993). The calculations are based on soil hydraulic properties derived from the
New Zealand Soils database (Hewitt 1998; Willoughby et al. 2003). Following a heavy
rainfall or a large irrigation, the soil first drains for a few days until field capacity, FC [L/L],
is reached (Figure 1). Thereafter, as the soil dries, it gets progressively more difficult for plant
roots to extract moisture. Eventually, the soil water content reaches the point where no more
water uptake can occur and the pasture wilts. Classically, this water content, WP, is defined as
the ‘permanent wilting point’. The total plant-available water is defined as TAW = (FC-
WP)/ZR, which depends on the depth of the pasture roots, ZR [mm], and the water holding
capacity, (FC-WP), of the soil. The root depth is set equal to 0.5 m (Allen et al. 1998).
Although soil water is theoretically available to the plants all the way down to wilting point,
pasture production will often be curtailed well before this moisture level is reached. The ‘re-
fill point’ for irrigation is defined using a fraction, p, of the total available water i.e. SP = FC
1
10
100
1000
10000
100000
0.0 0.1 0.2 0.3 0.4 0.5 0.6
Water content [L/L]
Pre
ssu
re h
ea
d [cm
]
sandy loam coarse sand
saturation
Field capacity
Wilting point
Air dry
Refill point
1
10
100
1000
10000
100000
0.0 0.1 0.2 0.3 0.4 0.5 0.6
Water content [L/L]
Pre
ssu
re h
ea
d [cm
]
sandy loam coarse sand
saturation
Field capacity
Wilting point
Air dry
1
10
100
1000
10000
100000
0.0 0.1 0.2 0.3 0.4 0.5 0.6
Water content [L/L]
Pre
ssu
re h
ea
d [cm
]
sandy loam coarse sand
saturation
Field capacity
Wilting point
Air dry
Refill point

5
– p(WP-FC). A typical value of p equals 0.60 for pastures in the Waikato (McAneney et al.,
1982) and Taranaki (Parfitt et al. 1985) regions. We have been more conservative and, for the
purpose of allocation, have assumed p=0.50. The effect of a mild-water stress is modelled by
reducing ETO whenever soil moisture decreases below SP. This is achieved by multiplying
ETO by a water stress coefficient, KS, which decreases linearly from 1.0 to 0.0 for soil
moistures in the range SP > > WP.
The surface runoff component of SPASMO is based on a daily rainfall total and uses the Soil
Conservation Service (SCS) curve number approach (Williams 1991). Surface runoff is
calculated as:
SRQ
SRSR
SRQ
2.0,,0
2.0,8.0
2.02
[Eq. 3]
where Q [mm] is the daily runoff , R [mm] is the daily rainfall, and S [mm] is the retention
parameter that reflects variations among soils, land use and management. The retention
parameter, S, is related to the curve number, CN, using the SCS equation (Soil Conservation
Service, 1972)
1
100254
CNS [Eq. 4]
where the constant, 254, gives S in millimetres. The average curve number can be obtained
easily for any area of land use type from the SCS Hydrology Handbook (Soil Conservation
Service). Pasture in good condition on a free draining soil has a low CN value (39), while
pasture in poor condition on a poorly drained soil has a high CN value (89). The SCS runoff
calculation has an additional adjustment to S, to express the effect of slope and soil moisture
(Williams 1991). In the calculations presented here, we have assumed the field slope was
always less than 5% and have used a reference CN value for pasture in average condition. The
only other adjustment with respect to run-off was to include any changes in S that were due to
different soil moisture levels.
SPASMO runs on a daily time step. The water balance calculations are made in the following
sequence:
Subtract evaporation from the soil surface
Calculate transpiration losses and partition water uptake in proportion to the depth-
wise pattern of roots
If there is rain or irrigation, then perform the leaching process
Redistribute water through the soil profile according to soil matric potential
Repeat the process for the next day.
For modelling purposes, the irrigation regime applied 25 mm of water only on those days
when the pasture was in need of it. This ‘need’ was determined when a given fraction of
readily available moisture (p) has been extracted from the root-zone soil. Irrigation was not
applied if there was already sufficient water in the root-zone soil, or if the daily rainfall
exceeded 5 mm. We consider this irrigation regime as being “optimum” for the purpose of
calculating the monthly and annual irrigation needs.

6
SCENARIO MODELLING
Two scenarios (dry-land and irrigated pasture) were simulated for three soil series (Ahikouka
silt loam, Kokotau clay loam & Tauherenikau shallow silt loam) and two climates (Masterton
and Martinborough). The results are presented in tabular form in Appendices A and B. A brief
description of these is presented below.
Scenario 1 – Masterton
Masterton has an average annual rainfall of 933 mm yr-1
(Table A1). One year in ten the
annual rainfall exceeds 1174 mm yr-1
. The annual ET is calculated to be 781 mm yr-1
(Table
A2) and the average annual dry-matter production for an irrigated pasture in good condition is
calculated to be 14840 kg ha-1
yr-1
(Table A3). Pasture production on a dry-land farm declines
to about 69% (Tauherenikau shallow silt loam), 73% (Kokotau clay loam) and 85%
(Ahikouka silt loam) of the irrigated farm, on average (Tables A7-9 & Figure 2). The average
annual irrigation requirement for pasture in Masterton is calculated to be 350 mm yr-1
(Tauherenikau shallow silt loam), 400 mm yr-1
(Kokotau clay loam) and 250 mm yr-1
(Ahikouka silt loam) (Tables A10-12 & Figure 3).
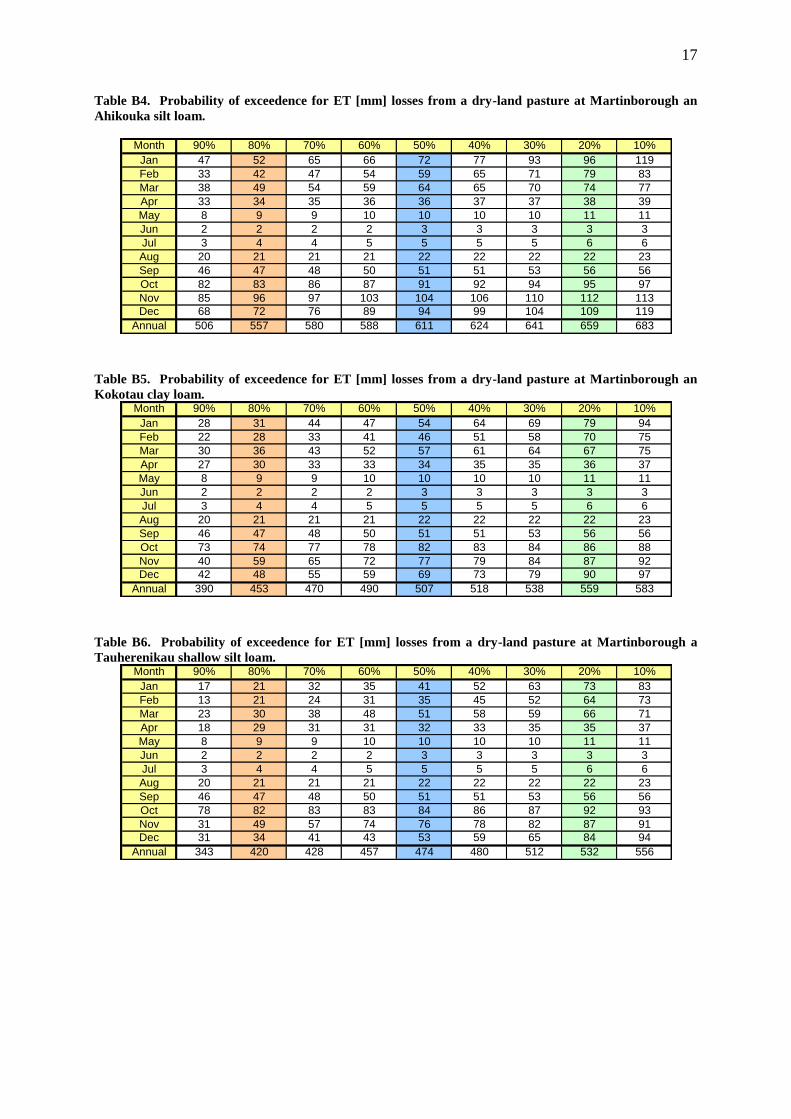
Scenario 2 – Martinborough
Martinborough has an average annual rainfall of 794 mm yr-1
(Table B1). One year in ten the
annual rainfall exceeds 996 mm yr-1
. The annual ET is calculated to be 796 mm yr-1
(Table
B2) and the annual dry-matter production for an irrigated pasture in good condition is
calculated to be 15115 kg ha-1
yr-1
(Table B3), on average. Pasture production on a dry-land
farm declines to about 61% (Tauherenikau shallow silt loam), 65% (Kokotau clay loam) and
78% (Ahikouka silt loam) of the irrigated farm, on average (Tables B7-9 & Figure 3). The
average annual irrigation requirements for pasture in Masterton are calculated to be 400 mm
yr-1
(Tauherenikau shallow silt loam), 475 mm yr-1
(Kokotau clay loam) and 350 mm yr-1
(Ahikouka silt loam) (Tables B10-12 & Figure 4).
Figure 2. Probability of exceedence for annual dry-matter production [kg/ha] from a dry-land farm at
Masterton (Te Ore Ore) on an Ahikouka silt loam, Kokotau clay loam, and Tauherenikau shallow silt
loam soil. The solid symbol represents potential production from an irrigated farm, calculated via Eqns 1
& 2.
0.0
0.2
0.4
0.6
0.8
1.0
0 5000 10000 15000 20000
Dry-matter production [kg/ha/yr]
Pro
b e
xceed
en
ce [
-]
Ahikouka Kokotau Tauherenikau Potential

7
Figure 3. Probability of exceedence for the annual irrigation requirements [mm yr
-1] for an irrigated
farm at Masterton (Te Ore Ore) on an Ahikouka silt loam, Kokotau clay loam, and Tauherenikau shallow
silt loam soil. The SPASMO calculations assume that 100% of the irrigation water is available to the
pasture (see text for details).
Figure 4. Probability of exceedence for annual dry-matter production [kg/ha] from a dry-land farm at
Martinborough on an Ahikouka silt loam, Kokotau clay loam, and Tauherenikau shallow silt loam soil.
The solid symbol represents potential production from an irrigated farm, calculated via Eqns 1 & 2.
0.0
0.2
0.4
0.6
0.8
1.0
0 100 200 300 400 500 600
Irrigation [mm/yr]
Pro
b e
xceed
en
ce [
-]Ahikouka Kokotau Tauherenikau
0.0
0.2
0.4
0.6
0.8
1.0
0 5000 10000 15000 20000
Dry-matter production [kg/ha/yr]
Pro
b e
xceed
en
ce [
-]
Ahikouka Kokotau Tauherenikau Potential

8
Figure 5. Probability of exceedence for the annual irrigation requirements [mm yr
-1] for an irrigated
farm at Masterton (Te Ore Ore) on an Ahikouka silt loam, Kokotau clay loam, and Tauherenikau shallow
silt loam soil. The SPASMO calculations assume that 100% of the irrigation water is available to the
pasture (see text for details).
Model predictions of annual pasture production are summarized in Tables 1 & 2. Irrigation is
expected to increase annual pasture production by between 15 and 40% depending on soil
type and rainfall. Masterton receives about 140 mm yr-1 more rain than Martinborough. On
average, pastures in Martinborough require about 50-100 mm more irrigation, each year.
Soils with lower water holding capacities, or higher stone fractions, are expected to exhibit
the greatest potential benefit from irrigation. The coefficient of variability (CV = standard
deviation divided by mean) in pasture production from a dry-land farm ranges between 8 and
13% at Masterton, and between 10 and 17% at Martinborough. The corresponding CV on an
irrigated farm is less than 5%. The range in pasture production, as represented by (max-
min)dryland /meanirrigated, is somewhere between 28 and 43% on a dryland farm. The
corresponding range on an irrigated farm is just 20%. This result confirms that irrigation helps
reduce the year-to-year variability in pasture production.
Appendix C provides a risk assessment of the annual irrigation demand and pasture
production for selected soils in the Wairarapa.
Realizing these potential yield gains in an efficient manner will require careful management
of irrigation, especially on some of the very stony free-draining soils.
0.0
0.2
0.4
0.6
0.8
1.0
0 100 200 300 400 500 600
Irrigation [mm/yr]
Pro
b e
xceed
en
ce [
-]
Ahikouka Kokotau Tauherenikau

9
Table 1. The effect of soil type on annual pasture production (July-July) from a dry-land farm at
Masterton and Martinborough. The simulations are based on daily climate data from 1972-2004. CV =
(standard deviation divided by mean) represents the coefficient of variation.
Table 2. The effect of soil type on annual pasture production (July-July) from a dry-land farm at
Masterton and Martinborough. The simulations are based on daily climate data from 1972-2004. CV =
(standard deviation divided by mean) represents the coefficient of variation.
LIMITATIONS OF THE MODELLING
Running the model with the evaporation equal to ETO provides a useful benchmark as it
simulates production with irrigation. The difference between this and production simulated
without irrigation indicates how much water stress will affect pasture yield. The simple k-
factor used to relate pasture production to actual ET losses has been assigned a value of k=19
kg dry-matter per mm of evaporation. This k-value is based on experimental data from
pastures in the Wairarapa and Central Hawke’s Bay, and is therefore expected to provide a
reasonable fit to reality. However, there are many other factors affecting pasture production
that have not been considered.
Moir (2000) points out that a possible weakness of the model is the way in which temperature
is treated. In winter, pasture growth is likely to be more temperature sensitive than the
reference crop evaporation, while in summer the reverse is likely to be true. Nutrients (N & P)
may also be limiting e.g. on soils that have a low-P status, the maximum productivity may be
Location Soil minimum maximum meanstandard
deviationCV [%]
AHIKOUKA SILT LOAM 10123 14108 12486 998 8.0
KOKOTAU CLAY LOAM 7868 12838 10698 1137 10.6
TAUHERENIKAU SHALLOW
SILT LOAM7002 12779 10242 1358 13.3
AHIKOUKA SILT LOAM 9339 14345 11674 1188 10.2
KOKOTAU CLAY LOAM 6977 12703 9718 1353 13.9
TAUHERENIKAU SHALLOW
SILT LOAM6004 12580 9101 1523 16.7
Martinborough
Masterton Te
Ore Ore
Location Soil minimum maximum mean std CV
AHIKOUKA SILT LOAM 12943 16194 14875 696 4.7
KOKOTAU CLAY LOAM 12943 16194 14875 696 4.7
TAUHERENIKAU SHALLOW
SILT LOAM12943 16194 14875 696 4.7
AHIKOUKA SILT LOAM 13102 16410 15073 669 4.4
KOKOTAU CLAY LOAM 13102 16410 15073 669 4.4
TAUHERENIKAU SHALLOW
SILT LOAM13102 16410 15073 669 4.4
Masterton Te
Ore Ore
Martinborough

10
a low as 8-10 T/ha rather than 16 T/ha (Moir 2000). Furthermore, the behaviour of pasture
and soil following a prolonged dry spell is complicated by scenesence and phase lags in
recovery that are not included in the simple modelling approach. On a ‘rewetted’ dry soil, lag
phases in pasture growth response because of increased moisture may, in part, be attributed to
soil microbial processes and the associated change in nutrient availability to plants (Moir
2000). Current understanding of these microbial processes is limited.
Table 3. Application efficiency for a range of irrigation systems (from McIndoe 2002).
Finally, the irrigation application efficiency is not addressed by the software. SPASMO
assumes that 100% of the irrigation water is available to the pasture. In practical terms, not all
of the applied water will enter the soil. McIndoe (2002) estimated typical losses from New
Zealand pressurized irrigation systems as 0-1% losses from leaking pipes, < 3% losses from
evaporation in the air, < 5% losses from wind blowing water off the target area, < 2% losses
from surface runoff, and < 5% interception losses from the canopy. The major loss (5-30%) is
attributed to uneven/excessive application depths and rates.
Inefficiency means that more water than average needs to be applied to replenish the root-
zone water deficit. For example, a system with uniformity1 of 70% (typical of many irrigation
systems in New Zealand) needs to apply about 45 mm of irrigation in order to replace a 25
mm soil water deficit over 90% of the field (McIndoe 2002). Improving the uniformity to
90% still means that 30 mm of irrigation is required to replace a 25 mm water deficit.
Application efficiency can be expressed via the ratio of the depth of water that enters the root-
zone soil to the total volume of water applied (Table 3). Centre pivots are the most efficient
system for pasture irrigation, yet they still have losses of between 5 to 10%. Inefficiency in
irrigation will likewise affect pasture production although we have no means to estimate such
an effect.
SPASMO assumes that 100% of the applied water enters the root zone soil.
Adding an extra 20% to the SPASMO recommendation should provide an
operational margin that accounts for application efficiency for all but the least
efficient systems (e.g. low pressure boom and big gun irrigators).
1 Uniformity coefficient =
X
xX1100 where X = actual depth and x = average depth [mm]
Irrigation system Application efficiency
Centre pivot - fixed 90-95
Centre pivot - towable 85-90
Rotary boom 80-85
K line 80-90
Low pressure boom 70-75
Big gun 65-75

11
REFERENCES
Allen, R.G., Pereria, L.S., Raes, D., and Smith, M., 1999. Crop Evapotranspiration.
Guidelines for computing crop water requirements. FAO Irrigation and Drainage Paper
No. 56, FAO, Rome, 301 pp.
Doorenbos, J., and Pruitt W.O., 1977. Crop water requirements. FAO Irrigation and Drainage
Paper No 24, Rome, Italy. Food and Agricultural Organisation of the United Nations,
pp. 144.
Green, S.R., Clothier, B.E., Mills, T.M., and Millar, A., 1999. A risk assessment of the
irrigation requirements of field crops in a maritime climate. Journal of crop production,
2: 353-377.
Green S, van den Dijssel C, and Clothier B, 2004. Monitoring of nitrates within the Hawke’s
Bay: a case study of Ingleton farms near Tikokino. Report to Hawke’s Bay Regional
Council. HortResearch Client Report No: S/320132/01
Hewitt, A.E. 1998. New Zealand soil classification. Manaaki Whenua Press:, Lincoln, New
Zealand.
Hutson and Wagenet, 1993. A pragmatic field-scale approach for modelling pesticides.
Journal of Environmental Quality, 22: 494-499.
Kerr, J.P., de Ruiter, J.M., and Hall, A.J., 1986. The magnitude and variability of seasonal
water deficits for pasture and crop growth. New Zealand Agricultural Science 20: 13-18.
McAneney, K.J., Judd, M.J., and Weeda, W.C., 1982. Loss in monthly pasture production
resulting from dryland conditions in the Waikato. NZ Journal of Agricultural Research,
25: 151-156.
McIndoe, I., 2002. Irrigation efficiency enhancement – Stage 1. Report prepared for
LandWISE Hawkes’s Bay. Report No 4452/16a, Lincoln Environment, 46 pp.
Moir, J.L, Scotter, D.R., Hedley, M.J. and Mackay, A.D., 2000. A climate-driven, soil fertility
dependent, pasture production model. NZ Journal of Agricultural Research, 43: 491-
500.
Parfitt, R.L., Roberts, A.H.C., Thomson, N.A., and Cook, F.J., 1985. Water use, irrigation and
pasture production on a Stratford silt loam. NZ Journal of Agricultural Research, 28: 393-
401.
Rosen, M.R., Reeves, R.R., Green S.R., Clothier, B.E., and Ironside, N, 2004. Prediction of
groundwater nitrate contamination after closure of an unlined sheep feed lot in New
Zealand. Vadose Journal, 3:990-1006.
Press, W.H., Flannery, B.P., Teukolsky, S.A., and Vetterling, W.T., 1989. Numerical Recipes
– the art of scientific computing. Cambridge, UK. Cambridge University Press, pp. 702.
Soil Conservation Service, 1972. Estimation of direct runoff from storm rainfall. USDA.
(downloadable copy from www.info.usda.gov/CED/ftp/CED/neh630-ch10.pdf )
Webby R, Hall J, and Green S 2003. Evaluation of financial returns from Irrigation. Report to
Te Pouakani Farms, AgResearch Client Report, 14 pp.
Williams, J.R., 1991. Runoff and water erosion. In J. Hanks and J.T. Ritchie (Eds.), Modelling
plant and soil systems. Agonomy No. 31 series, American Soc. Agronomy, Madison,
USA.
Willoughby, E.J.; Wilde, R.H.; McLeod, M.; Hewitt, A.E. and Webb, T.H. 2001: National
Soils Database Audit: A document describing Landcare Research soils data. Landcare
Research. Unpublished Report.

12
APPENDIX A - MASTERTON RESULTS
Table A1. Probability of exceedence for rainfall [mm] at Masterton (Te Ore Ore). The data are for the
years 1972-2004.
Table A2. Probability of exceedence for ET [mm] from an irrigated pasture at Masterton (Te Ore Ore)
on an Ahikouka silt loam.
Table A3. Probability of exceedence for dry-matter production [kg/ha] from an irrigated pasture at
Masterton (Te Ore Ore) on an Ahikouka silt loam.
Month 90% 80% 70% 60% 50% 40% 30% 20% 10%
Jan 20 26 30 40 54 70 73 79 88
Feb 18 31 32 36 42 57 65 91 102
Mar 36 43 50 55 64 68 70 81 107
Apr 29 32 40 52 62 68 75 84 135
May 37 53 63 75 84 90 95 112 132
Jun 43 55 69 77 87 100 108 121 138
Jul 53 61 84 92 106 110 119 131 161
Aug 40 45 59 70 77 92 104 125 139
Sep 35 43 47 57 67 69 75 88 130
Oct 34 45 50 60 65 76 81 99 128
Nov 28 52 64 71 75 80 83 92 110
Dec 26 36 41 54 59 69 83 90 107
Annual 723 788 815 887 933 950 970 1056 1174
Month 90% 80% 70% 60% 50% 40% 30% 20% 10%
Jan 128 129 133 135 137 139 143 145 149
Feb 93 97 101 102 106 108 111 115 119
Mar 67 71 74 75 76 77 79 80 83
Apr 33 34 35 36 36 36 37 38 39
May 9 9 9 9 9 10 10 10 11
Jun 2 2 2 2 3 3 3 3 3
Jul 3 4 4 4 5 5 5 5 6
Aug 20 20 21 21 21 21 22 22 22
Sep 45 46 48 49 50 51 52 53 55
Oct 81 82 85 87 89 91 92 94 95
Nov 102 106 109 110 111 113 115 116 119
Dec 121 123 127 131 134 137 140 144 151
Annual 743 752 760 771 781 796 801 805 826
Month 90% 80% 70% 60% 50% 40% 30% 20% 10%
Jan 2430 2455 2519 2557 2605 2647 2711 2761 2822
Feb 1774 1851 1911 1932 2006 2044 2103 2181 2259
Mar 1271 1343 1402 1423 1448 1471 1497 1522 1584
Apr 620 640 665 676 683 689 702 717 734
May 163 166 169 173 179 181 185 195 215
Jun 30 34 38 39 48 51 53 58 61
Jul 66 71 80 83 89 90 96 103 112
Aug 377 388 394 396 402 404 412 417 426
Sep 850 882 911 928 949 960 995 1004 1053
Oct 1546 1567 1616 1652 1693 1720 1749 1779 1805
Nov 1938 2010 2069 2088 2107 2145 2181 2206 2252
Dec 2291 2333 2421 2493 2544 2605 2666 2727 2860
Annual 14117 14280 14442 14649 14841 15124 15213 15293 15690

13
Table A4. Probability of exceedence for ET [mm] losses from a dry-land pasture at Masterton (Te Ore
Ore) on an Ahikouka silt loam.
Table A5. Probability of exceedence for ET [mm] losses from a dry-land pasture at Masterton (Te Ore
Ore) on a Kokotau clay loam.
Table A6. Probability of exceedence for ET [mm] losses from a dry-land pasture at Masterton (Te Ore
Ore) on a Tauherenikau shallow silt loam.
Month 90% 80% 70% 60% 50% 40% 30% 20% 10%
Jan 57 65 80 83 89 98 111 116 123
Feb 45 52 57 68 71 76 82 86 93
Mar 41 56 63 65 66 69 73 74 77
Apr 33 34 35 35 36 36 36 37 38
May 9 9 9 9 9 10 10 10 11
Jun 2 2 2 2 3 3 3 3 3
Jul 3 4 4 4 5 5 5 5 6
Aug 20 20 21 21 21 21 22 22 22
Sep 45 46 48 49 50 51 52 53 55
Oct 81 82 85 87 89 91 92 94 95
Nov 100 104 106 108 110 111 113 114 116
Dec 82 88 97 105 110 113 119 121 126
Annual 574 604 638 646 665 670 678 703 714
Month 90% 80% 70% 60% 50% 40% 30% 20% 10%
Jan 39 45 50 58 72 78 86 92 100
Feb 33 41 44 49 56 64 69 74 78
Mar 36 41 49 56 59 64 65 71 76
Apr 29 32 33 34 35 35 36 36 38
May 9 9 9 9 9 10 10 10 11
Jun 2 2 2 2 3 3 3 3 3
Jul 3 4 4 4 5 5 5 5 6
Aug 20 20 21 21 21 21 22 22 22
Sep 45 46 48 49 50 51 52 53 55
Oct 76 80 82 82 85 85 86 89 90
Nov 58 81 83 84 89 93 95 99 104
Dec 51 57 68 73 76 86 95 101 114
Annual 469 494 539 559 567 571 592 608 622
Month 90% 80% 70% 60% 50% 40% 30% 20% 10%
Jan 28 31 36 48 59 67 81 84 96
Feb 23 31 35 38 48 57 63 73 76
Mar 27 36 46 49 56 59 64 71 76
Apr 26 30 33 34 35 35 36 36 37
May 9 9 9 9 9 10 10 10 11
Jun 2 2 2 2 3 3 3 3 3
Jul 3 4 4 4 5 5 5 5 6
Aug 20 20 21 21 21 21 22 22 22
Sep 45 46 48 49 50 51 52 53 55
Oct 80 82 85 85 87 89 89 91 93
Nov 59 79 82 89 92 95 101 103 109
Dec 37 45 56 62 66 72 88 96 109
Annual 428 458 508 527 541 551 568 588 612

14
Table A7. Probability of exceedence for dry-matter production [kg/ha] from a dry-land pasture at
Masterton (Te Ore Ore) on a Ahikouka silt loam.
Table A8. Probability of exceedence for dry-matter production [kg/ha] from a dry-land pasture at
Masterton (Te Ore Ore) on a Kokotau clay loam.
Table A9. Probability of exceedence for dry-matter production [kg/ha] from a dry-land pasture at
Masterton (Te Ore Ore) on a Tauherenikau shallow silt loam.
Month 90% 80% 70% 60% 50% 40% 30% 20% 10%
Jan 1088 1238 1528 1570 1690 1854 2115 2200 2335
Feb 857 989 1092 1292 1348 1448 1558 1641 1761
Mar 786 1062 1198 1230 1256 1303 1385 1413 1455
Apr 618 637 661 666 676 684 690 709 727
May 163 166 169 173 179 181 185 195 215
Jun 30 34 38 39 48 51 53 58 61
Jul 66 71 80 83 89 90 96 103 112
Aug 377 388 394 396 402 404 412 417 426
Sep 850 882 911 928 949 960 995 1004 1053
Oct 1546 1567 1616 1652 1693 1720 1749 1779 1805
Nov 1893 1974 2014 2054 2092 2101 2138 2157 2206
Dec 1549 1678 1839 1999 2092 2151 2255 2291 2388
Annual 10914 11476 12122 12272 12629 12734 12876 13353 13557
Month 90% 80% 70% 60% 50% 40% 30% 20% 10%
Jan 741 852 951 1100 1361 1482 1633 1751 1900
Feb 618 770 832 939 1060 1212 1309 1414 1482
Mar 676 786 939 1073 1116 1210 1240 1345 1442
Apr 560 613 623 640 661 674 684 690 717
May 163 166 169 173 179 181 185 195 215
Jun 30 34 38 39 48 51 53 58 61
Jul 66 71 80 83 89 90 96 103 112
Aug 377 388 394 396 402 404 412 417 426
Sep 850 882 911 928 949 960 995 1004 1053
Oct 1451 1519 1549 1565 1608 1620 1643 1693 1711
Nov 1111 1535 1578 1603 1693 1767 1807 1886 1967
Dec 969 1087 1286 1386 1453 1643 1804 1913 2166
Annual 8915 9384 10249 10625 10773 10855 11246 11544 11826
Month 90% 80% 70% 60% 50% 40% 30% 20% 10%
Jan 525 592 690 913 1130 1276 1542 1602 1825
Feb 433 581 668 727 917 1079 1193 1392 1441
Mar 516 683 876 924 1066 1129 1209 1343 1442
Apr 498 561 618 637 658 673 684 689 710
May 163 166 169 173 179 181 185 195 215
Jun 30 34 38 39 48 51 53 58 61
Jul 66 71 80 83 89 90 96 103 112
Aug 377 388 394 396 402 404 412 417 426
Sep 850 882 911 928 949 960 995 1004 1053
Oct 1519 1561 1608 1618 1652 1693 1698 1738 1768
Nov 1120 1499 1562 1700 1752 1805 1910 1948 2077
Dec 708 849 1057 1181 1263 1376 1675 1830 2071
Annual 8126 8694 9650 10007 10287 10475 10783 11166 11636

15
Table A10. Probability of exceedence for irrigation [mm] requirements of pasture at Masterton (Te Ore
Ore) on a Ahikouka silt loam.
Table A11. Probability of exceedence for irrigation [mm] requirements of pasture at Masterton (Te Ore
Ore) on a Kokotau clay loam.
Table A12. Probability of exceedence for irrigation [mm] requirements of pasture at Masterton (Te Ore
Ore) on a Tauherenikau shallow silt loam.
Month 90% 80% 70% 60% 50% 40% 30% 20% 10%
Jan 25 50 50 50 75 75 100 100 100
Feb 25 25 50 50 50 50 75 75 100
Mar 0 0 0 0 25 25 25 25 50
Apr 0 0 0 0 0 0 0 0 0
May 0 0 0 0 0 0 0 0 0
Jun 0 0 0 0 0 0 0 0 0
Jul 0 0 0 0 0 0 0 0 0
Aug 0 0 0 0 0 0 0 0 0
Sep 0 0 0 0 0 0 0 0 0
Oct 0 0 0 0 25 25 25 25 25
Nov 0 25 25 25 25 25 50 50 50
Dec 25 25 25 50 75 75 75 100 100
Annual 175 200 225 225 250 275 300 325 375
Month 90% 80% 70% 60% 50% 40% 30% 20% 10%
Jan 50 75 75 100 100 100 100 125 125
Feb 50 50 50 75 75 75 75 75 100
Mar 0 25 25 25 25 50 50 50 50
Apr 0 0 0 0 0 25 25 25 25
May 0 0 0 0 0 0 0 0 0
Jun 0 0 0 0 0 0 0 0 0
Jul 0 0 0 0 0 0 0 0 0
Aug 0 0 0 0 0 0 0 0 0
Sep 0 0 0 0 0 0 0 25 25
Oct 25 25 25 25 50 50 50 50 50
Nov 25 25 50 50 50 75 75 75 75
Dec 50 75 75 75 100 100 100 100 125
Annual 325 375 375 400 400 425 450 450 500
Month 90% 80% 70% 60% 50% 40% 30% 20% 10%
Jan 50 50 75 75 100 100 100 125 125
Feb 25 25 50 50 75 75 75 75 100
Mar 0 0 25 25 25 25 25 50 50
Apr 0 0 0 0 0 0 25 25 25
May 0 0 0 0 0 0 0 0 0
Jun 0 0 0 0 0 0 0 0 0
Jul 0 0 0 0 0 0 0 0 0
Aug 0 0 0 0 0 0 0 0 0
Sep 0 0 0 0 0 0 0 0 0
Oct 0 0 0 25 25 25 25 50 50
Nov 25 25 50 50 50 50 75 75 75
Dec 25 50 50 75 75 75 100 100 100
Annual 225 300 300 325 350 350 375 375 450

16
APPENDIX B - MARTINBOROUGH RESULTS
Table B1. Probability of exceedence for rainfall [mm] at Martinborough. The data are for the years 1972-
2004.
Table B2. Probability of exceedence for ET [mm] from an irrigated pasture at Martinborough on an
Ahikouka silt loam.
Table B3. Probability of exceedence for dry-matter production [kg/ha] from an irrigated pasture at
Martinborough on an Ahikouka silt loam.
Month 90% 80% 70% 60% 50% 40% 30% 20% 10%
Jan 11 14 17 29 33 47 53 61 70
Feb 13 20 22 30 35 49 53 64 87
Mar 25 32 34 42 49 62 69 74 100
Apr 20 27 30 36 44 54 64 78 95
May 33 38 56 64 71 78 86 100 115
Jun 42 52 59 70 94 102 120 127 142
Jul 41 61 69 94 99 109 110 132 175
Aug 35 47 54 57 76 80 85 104 135
Sep 18 25 34 40 51 62 66 71 112
Oct 30 36 42 49 57 63 65 76 112
Nov 15 31 37 41 52 69 79 83 94
Dec 22 34 38 40 45 48 60 79 99
Annual 590 641 693 731 794 844 885 923 996
Month 90% 80% 70% 60% 50% 40% 30% 20% 10%
Jan 130 133 137 138 139 140 144 147 150
Feb 97 99 101 103 107 108 111 119 120
Mar 69 73 75 76 77 78 79 81 84
Apr 33 35 36 36 37 37 38 39 40
May 8 9 9 10 10 10 10 11 11
Jun 2 2 2 2 3 3 3 3 3
Jul 3 4 4 5 5 5 5 6 6
Aug 20 21 21 21 22 22 22 22 23
Sep 46 47 48 50 51 51 53 56 56
Oct 82 83 86 87 91 92 94 95 97
Nov 103 107 111 111 113 114 116 119 121
Dec 123 125 128 130 134 138 143 146 151
Annual 754 758 778 788 796 798 813 814 827
Month 90% 80% 70% 60% 50% 40% 30% 20% 10%
Jan 2468 2518 2594 2616 2645 2662 2727 2801 2842
Feb 1839 1876 1927 1951 2029 2056 2115 2257 2272
Mar 1311 1384 1422 1444 1464 1484 1505 1538 1599
Apr 633 661 679 688 695 698 715 735 755
May 161 172 177 183 185 188 198 205 209
Jun 31 37 40 47 49 54 58 61 64
Jul 65 79 81 87 93 98 102 110 116
Aug 388 393 396 405 416 418 418 420 432
Sep 868 894 916 943 965 976 1009 1060 1070
Oct 1556 1581 1640 1652 1732 1754 1777 1803 1839
Nov 1963 2025 2100 2117 2143 2164 2210 2252 2305
Dec 2331 2371 2428 2478 2542 2622 2715 2772 2877
Annual 14318 14402 14788 14966 15115 15164 15441 15457 15715
17
Table B4. Probability of exceedence for ET [mm] losses from a dry-land pasture at Martinborough an
Ahikouka silt loam.
Table B5. Probability of exceedence for ET [mm] losses from a dry-land pasture at Martinborough an
Kokotau clay loam.
Table B6. Probability of exceedence for ET [mm] losses from a dry-land pasture at Martinborough a
Tauherenikau shallow silt loam.
Month 90% 80% 70% 60% 50% 40% 30% 20% 10%
Jan 47 52 65 66 72 77 93 96 119
Feb 33 42 47 54 59 65 71 79 83
Mar 38 49 54 59 64 65 70 74 77
Apr 33 34 35 36 36 37 37 38 39
May 8 9 9 10 10 10 10 11 11
Jun 2 2 2 2 3 3 3 3 3
Jul 3 4 4 5 5 5 5 6 6
Aug 20 21 21 21 22 22 22 22 23
Sep 46 47 48 50 51 51 53 56 56
Oct 82 83 86 87 91 92 94 95 97
Nov 85 96 97 103 104 106 110 112 113
Dec 68 72 76 89 94 99 104 109 119
Annual 506 557 580 588 611 624 641 659 683
Month 90% 80% 70% 60% 50% 40% 30% 20% 10%
Jan 28 31 44 47 54 64 69 79 94
Feb 22 28 33 41 46 51 58 70 75
Mar 30 36 43 52 57 61 64 67 75
Apr 27 30 33 33 34 35 35 36 37
May 8 9 9 10 10 10 10 11 11
Jun 2 2 2 2 3 3 3 3 3
Jul 3 4 4 5 5 5 5 6 6
Aug 20 21 21 21 22 22 22 22 23
Sep 46 47 48 50 51 51 53 56 56
Oct 73 74 77 78 82 83 84 86 88
Nov 40 59 65 72 77 79 84 87 92
Dec 42 48 55 59 69 73 79 90 97
Annual 390 453 470 490 507 518 538 559 583
Month 90% 80% 70% 60% 50% 40% 30% 20% 10%
Jan 17 21 32 35 41 52 63 73 83
Feb 13 21 24 31 35 45 52 64 73
Mar 23 30 38 48 51 58 59 66 71
Apr 18 29 31 31 32 33 35 35 37
May 8 9 9 10 10 10 10 11 11
Jun 2 2 2 2 3 3 3 3 3
Jul 3 4 4 5 5 5 5 6 6
Aug 20 21 21 21 22 22 22 22 23
Sep 46 47 48 50 51 51 53 56 56
Oct 78 82 83 83 84 86 87 92 93
Nov 31 49 57 74 76 78 82 87 91
Dec 31 34 41 43 53 59 65 84 94
Annual 343 420 428 457 474 480 512 532 556

18
Table B7. Probability of exceedence for rainfall [mm] at Martinborough. The data are for the years 1972-
2004.
Table B8. Probability of exceedence for ET [mm] from an irrigated pasture at Martinborough on an
Ahikouka silt loam.
Table B9. Probability of exceedence for dry-matter production [kg/ha] from an irrigated pasture at
Martinborough on an Ahikouka silt loam.
Month 90% 80% 70% 60% 50% 40% 30% 20% 10%
Jan 895 985 1229 1255 1370 1464 1763 1818 2269
Feb 627 806 900 1033 1122 1238 1340 1506 1581
Mar 726 925 1019 1126 1225 1241 1333 1412 1472
Apr 622 638 664 679 689 698 711 724 740
May 161 172 177 183 185 188 198 205 209
Jun 31 37 40 47 49 54 58 61 64
Jul 65 79 81 87 93 98 102 110 116
Aug 388 393 396 405 416 418 418 420 432
Sep 868 894 916 943 965 976 1009 1060 1070
Oct 1556 1581 1640 1652 1732 1754 1777 1803 1839
Nov 1606 1833 1849 1953 1982 2005 2081 2122 2153
Dec 1285 1373 1440 1693 1788 1887 1984 2079 2265
Annual 9614 10585 11011 11168 11617 11852 12173 12515 12968
Month 90% 80% 70% 60% 50% 40% 30% 20% 10%
Jan 524 595 833 901 1028 1219 1314 1503 1790
Feb 426 534 633 782 872 961 1101 1338 1427
Mar 579 679 811 996 1089 1163 1214 1276 1419
Apr 519 574 624 633 644 661 674 689 695
May 161 165 177 183 185 188 198 205 209
Jun 31 37 40 47 49 54 58 61 64
Jul 65 79 81 87 93 98 102 110 116
Aug 388 393 396 405 416 418 418 420 432
Sep 868 894 916 943 965 976 1009 1060 1070
Oct 1384 1406 1465 1485 1552 1577 1591 1632 1675
Nov 753 1124 1242 1367 1462 1506 1595 1645 1742
Dec 801 907 1037 1120 1304 1384 1507 1705 1851
Annual 7404 8609 8928 9312 9624 9842 10230 10615 11071
Month 90% 80% 70% 60% 50% 40% 30% 20% 10%
Jan 321 397 614 671 786 986 1188 1383 1577
Feb 243 403 462 598 674 856 990 1219 1388
Mar 428 578 730 919 975 1101 1130 1252 1340
Apr 345 546 581 595 613 630 657 670 695
May 151 163 172 181 185 188 197 202 209
Jun 31 37 40 47 49 54 58 61 64
Jul 65 79 81 87 93 98 102 110 116
Aug 388 393 396 405 416 418 418 420 432
Sep 868 894 916 943 965 976 1009 1060 1070
Oct 1479 1556 1569 1576 1596 1636 1644 1742 1773
Nov 591 928 1084 1398 1441 1483 1564 1662 1722
Dec 585 652 774 822 1014 1112 1237 1591 1778
Annual 6511 7984 8130 8689 9008 9128 9728 10106 10560

19
Table B10. Probability of exceedence for irrigation [mm] requirements of pasture at Martinborough on a
Ahikouka silt loam.
Table B11. Probability of exceedence for irrigation [mm] requirements of pasture at Martinborough on a
Kokotau clay loam.
Table B12. Probability of exceedence for irrigation [mm] requirements of pasture at Martinborough on a
Tauherenikau shallow silt loam.
Month 90% 80% 70% 60% 50% 40% 30% 20% 10%
Jan 50 75 75 75 100 100 100 125 125
Feb 25 50 50 50 50 75 75 75 100
Mar 0 0 25 25 25 25 25 50 50
Apr 0 0 0 0 0 0 0 25 25
May 0 0 0 0 0 0 0 0 0
Jun 0 0 0 0 0 0 0 0 0
Jul 0 0 0 0 0 0 0 0 0
Aug 0 0 0 0 0 0 0 0 0
Sep 0 0 0 0 0 0 0 0 0
Oct 0 0 25 25 25 25 25 50 50
Nov 25 25 25 50 50 50 50 75 75
Dec 25 25 50 50 75 75 100 100 100
Annual 200 225 275 325 350 350 375 400 425
Month 90% 80% 70% 60% 50% 40% 30% 20% 10%
Jan 75 75 75 100 100 100 125 125 125
Feb 50 50 75 75 75 100 100 100 100
Mar 0 25 25 25 50 50 50 50 75
Apr 0 0 0 0 25 25 25 25 25
May 0 0 0 0 0 0 0 0 0
Jun 0 0 0 0 0 0 0 0 0
Jul 0 0 0 0 0 0 0 0 0
Aug 0 0 0 0 0 0 0 0 0
Sep 0 0 0 0 0 25 25 25 25
Oct 25 25 25 50 50 50 50 50 75
Nov 50 50 50 75 75 75 75 100 100
Dec 50 75 75 75 100 100 100 125 125
Annual 375 400 450 450 475 475 500 525 550
Month 90% 80% 70% 60% 50% 40% 30% 20% 10%
Jan 75 75 100 100 100 100 100 125 125
Feb 50 50 50 50 75 75 75 100 100
Mar 0 25 25 25 25 50 50 50 50
Apr 0 0 0 0 0 25 25 25 25
May 0 0 0 0 0 0 0 0 0
Jun 0 0 0 0 0 0 0 0 0
Jul 0 0 0 0 0 0 0 0 0
Aug 0 0 0 0 0 0 0 0 0
Sep 0 0 0 0 0 0 0 25 25
Oct 0 25 25 25 25 50 50 50 50
Nov 25 50 50 50 50 75 75 75 100
Dec 25 75 75 75 75 100 100 100 125
Annual 275 325 350 400 400 425 450 475 500

20
APPENDIX C: ANNUAL IRRIGATION DEMAND AND
PASTURE PRODUCTION FOR THE WAIRARAPA
The uncertain and erratic nature of rainfall over the summer months means that irrigation is
beneficial for pasture production in the Wiararapa region. During summer evaporative
demands are at their peak and rainfall is often low. It is the uncertainty of rainfall which makes
scheduling of irrigation difficult. A statistical estimate of probability is used here to define
probable irrigation demand and pasture production. Since these will vary from year to year, a
dependable level, rather than a mean level is used (Doorenbos and Pruit 1977; Smith 1990).
In the case of pasture production we are interested in the lower limits that may
constrain farming productivity. The dependable level for pasture production is defined
as being the annual amount of pasture that can be grown, in say, 4 out of 5 years. This
corresponds to an 80% probability of exceedence, and some 80% of the time more than
this amount of pasture can be grown. However, one year in five pasture production will
be less than this amount.
In the case of irrigation demand we are interested in the upper limits that may constrain
water supply. Thus, we define the allocation level for irrigation as being the annual
amount that is required to meet the pasture requirement in 4 out of 5 years. This
corresponds to a 20% probability of exceedence, and some 20% of the time more than
this amount of irrigation will be required.
Time series data (daily) are used to generate the probability distributions. The lowest 20%
quantile then defines the level of dependable pasture production while the upper 20% quantile
defines the irrigation demand. We use the gamma distribution to describe the probability of
annual irrigation and the annual pasture production on both an irrigated and a dry-land farm.
The cornerstone of the gamma distribution is the gamma function which, for any real number
r>0, is defined as
dxexr xr
0
1)( . [Eq. C1]
If X is a random variable such that
f xr
x e dx xX
x( )( )
, rr
1 0 [Eq. C2]
then X is said to have a gamma distribution with parameters r and , where both r and must
be greater than 0. The corresponding cumulative density function may be written as
F xr
x e dxX
r
R
x( )( )
r
-1
0
[Eq. C3]
This function is sometimes referred to as the incomplete gamma function (Press et al. 1989).
The value of FX(x) represents the probability that an event, with at least as great a magnitude
as x, will occur in one time interval, while the probability of exceedence during the same time
interval is given by [1-FX(x)]. Thus, we can define the dependable level of pasture production
as the value of x when [1-FX(x)] = 0.8. Method of moment estimators for the gamma function
are given by
x
rx
xx
2
2
2, [Eq. C4]

21
where x and x are the sample mean and standard deviation. The gamma distribution involves
a number of complex integrations. Its computation is made easy because it is included as a
standard function in Microsoft® Excel. The inverse gamma CDF is used to derive estimates
of dependable rainfall. Calculations are presented in Tables C1 & C2.
Consider the case of pasture growing in Martinborough on an Ahikouka series soil (top panel
of Table C1). The average irrigation requirement is calculated to be 330 mm per year (this
corresponds to a 50% probability of exceedence, assuming 100% irrigation efficiency). This
amount of irrigation should meet the pasture needs, on average, about once every two years.
An irrigation allocation of 413 mm will meet pasture demands in 4 out of 5 years (a 20%
probability of exceedence), while an allocation of 461 mm per year will meet the pasture
needs some 9 years out of 10 (a 10% probability of exceedence). On an irrigated farm, the
dependable level of pasture production is calculated to be 14.2 T DM ha-1
yr-1
. The
corresponding pasture production on a dry-land farm is calculated to be just 10.7 T DM ha-1
yr-1
.
The basic aspects of the statistics of extremes can be expressed in a very simple manner. If the
probability of exceedence is EX(x), then the mean return period T is simply equal to 1/EX(x).
This mean return period does not imply, of course, that an event of magnitude x will occur at a
regular time interval of T, but that for a large number of these events the average period of
time separating them will be T. With this aspect in mind, the gamma distribution curves of
Tables C1 & C2 can now be used to calculate a mean return period for events of a given
magnitude. In the case of irrigation, where we are interested in extreme high values, the mean
return period is 5 and 10 years, respectively, for events that have a 20% and 10% probability
of exceedence. In the case of pasture production, where we are interested in extreme low
values, the mean return period is 5 and 10 years, respectively, for events that have a 80% and
90% probability of exceedence.

22
Table C1. Probability of exceedence associated with irrigation and pasture production on a range of soils
in Martinborough. The blue cells represent the annual irrigation amount that will meet pasture needs in 4
out of 5 years. The green cells represent the corresponding minimum pasture production expected in 4 out
of 5 years.
Site/soilProbability of
exceedanceIrrigation [mm/yr]
Irrigated pasture
[T DM/ha/yr]
Dry-land pasture
[T DM/ha/yr]
0.9 227 14.2 10.2
0.8 260 14.5 10.7
0.5 330 15.1 11.7
0.2 413 15.6 12.7
0.1 461 15.9 13.2
Mart
inbo
rou
gh
Ah
iko
uka
Site/soilProbability of
exceedanceIrrigation [mm/yr]
Irrigated pasture
[T DM/ha/yr]
Dry-land pasture
[T DM/ha/yr]
0.9 372 14.2 8.0
0.8 403 14.5 8.6
0.5 469 15.1 9.7
0.2 541 15.6 10.9
0.1 581 15.9 11.5
Mart
inbo
rou
gh
Ko
ko
tau
Site/soilProbability of
exceedance
Irrigation
[mm/yr]
Irrigated pasture
[T DM/ha/yr]
Dry-land pasture
[T DM/ha/yr]
0.9 307 14.2 7.1
0.8 341 14.5 7.8
0.5 411 15.1 9.1
0.2 490 15.6 10.4
0.1 535 15.9 11.1
Mart
inbo
rou
gh
Ta
uh
ere
nik
au

23
Table C2. Probability of exceedence associated with irrigation and pasture production on a range of soils
in Masterton. The blue cells represent the annual irrigation amount that will meet pasture needs in 4 out of
5 years. The green cells represent the corresponding minimum pasture production expected in 4 out of 5
years.
Site/soilProbability of
exceedanceIrrigation [mm/yr]
Irrigated pasture
[T DM/ha/yr]
Dry-land pasture
[T DM/ha/yr]
0.9 176 14.0 11.2
0.8 203 14.3 11.6
0.5 264 14.9 12.5
0.2 336 15.5 13.3
0.1 378 15.8 13.8
Maste
rto
n
Ah
iko
uka
Site/soilProbability of
exceedanceIrrigation [mm/yr]
Irrigated pasture
[T DM/ha/yr]
Dry-land pasture
[T DM/ha/yr]
0.9 335 14.0 9.2
0.8 362 14.3 9.7
0.5 416 14.9 10.7
0.2 476 15.5 11.7
0.1 510 15.8 12.2Maste
rto
n K
oko
tau
Site/soilProbability of
exceedance
Irrigation
[mm/yr]
Irrigated pasture
[T DM/ha/yr]
Dry-land pasture
[T DM/ha/yr]
0.9 253 14.0 8.5
0.8 282 14.3 9.1
0.5 342 14.9 10.2
0.2 410 15.5 11.4
0.1 449 15.8 12.0
Maste
rto
n
Ta
uh
ere
nik
au