IRON MOUNTAIN INCORPORATEDd18rn0p25nwr6d.cloudfront.net/CIK-0001020569/41103a2b-0389-4132-… ·...
100
Table of Contents UNITED STATES SECURITIES AND EXCHANGE COMMISSION Washington, DC 20549 FORM 10-Q (Mark One) ý QUARTERLY REPORT PURSUANT TO SECTION 13 OR 15(d) OF THE SECURITIES EXCHANGE ACT OF 1934 For the Quarterly Period Ended September 30, 2017 OR o TRANSITION REPORT PURSUANT TO SECTION 13 OR 15(d) OF THE SECURITIES EXCHANGE ACT OF 1934 For the Transition Period from to Commission file number 1-13045 IRON MOUNTAIN INCORPORATED (Exact Name of Registrant as Specified in Its Charter) Delaware (State or other Jurisdiction of Incorporation or Organization) 23-2588479 (I.R.S. Employer Identification No.) One Federal Street, Boston, Massachusetts 02110 (Address of Principal Executive Offices, Including Zip Code) (617) 535-4766 (Registrant's Telephone Number, Including Area Code) Indicate by check mark whether the registrant: (1) has filed all reports required to be filed by Section 13 or 15(d) of the Securities Exchange Act of 1934 during the preceding 12 months (or for such shorter period that the registrant was required to file such reports), and (2) has been subject to such filing requirements for the past 90 days. Yes ý No o Indicate by check mark whether the registrant has submitted electronically and posted on its corporate Web site, if any, every Interactive Data File required to be submitted and posted pursuant to Rule 405 of Regulation S-T during the preceding 12 months (or for such shorter period that the registrant was required to submit and post such files). Yes ý No o Indicate by check mark whether the registrant is a large accelerated filer, an accelerated filer, a non-accelerated filer, smaller reporting company or an emerging growth company. See the definitions of "large accelerated filer," "accelerated filer", "smaller reporting company" and "emerging growth company" in Rule 12b-2 of the Exchange Act. (Check one): Large accelerated filer ý Accelerated filer o Non-accelerated filer o (Do not check if a smaller reporting company) Smaller reporting company o Emerging growth company o If emerging growth company, indicate by check mark if the registrant has elected not to use the extended transition period for complying with any new or revised financial accounting standards provided pursuant to Section 13(a) of the Exchange Act. o Indicate by check mark whether the registrant is a shell company (as defined in Rule 12b-2 of the Exchange Act). Yes o No ý Number of shares of the registrant's Common Stock outstanding at October 20, 2017 : 266,937,094
Transcript of IRON MOUNTAIN INCORPORATEDd18rn0p25nwr6d.cloudfront.net/CIK-0001020569/41103a2b-0389-4132-… ·...
Table of Contents
UNITED STATESSECURITIES AND EXCHANGE COMMISSION
Washington, DC 20549
FORM 10-Q
(Mark One)
ý QUARTERLY REPORT PURSUANT TO SECTION 13 OR 15(d) OF THE SECURITIES EXCHANGE ACT OF 1934
For the Quarterly Period Ended September 30, 2017
OR
o TRANSITION REPORT PURSUANT TO SECTION 13 OR 15(d) OF THE SECURITIES EXCHANGE ACT OF 1934
For the Transition Period from to
Commission file number 1-13045
IRON MOUNTAIN INCORPORATED(Exact Name of Registrant as Specified in Its Charter)
Delaware(State or other Jurisdiction ofIncorporation or Organization)
23-2588479(I.R.S. EmployerIdentification No.)
One Federal Street, Boston, Massachusetts 02110(Address of Principal Executive Offices, Including Zip Code)
(617) 535-4766(Registrant's Telephone Number, Including Area Code)
Indicate by check mark whether the registrant: (1) has filed all reports required to be filed by Section 13 or 15(d) of the Securities Exchange Act of 1934during the preceding 12 months (or for such shorter period that the registrant was required to file such reports), and (2) has been subject to such filing requirementsfor the past 90 days. Yes ý No o
Indicate by check mark whether the registrant has submitted electronically and posted on its corporate Web site, if any, every Interactive Data File requiredto be submitted and posted pursuant to Rule 405 of Regulation S-T during the preceding 12 months (or for such shorter period that the registrant was required tosubmit and post such files). Yes ý No o
Indicate by check mark whether the registrant is a large accelerated filer, an accelerated filer, a non-accelerated filer, smaller reporting company or anemerging growth company. See the definitions of "large accelerated filer," "accelerated filer", "smaller reporting company" and "emerging growth company" inRule 12b-2 of the Exchange Act. (Check one):
Large accelerated filer ý
Accelerated filer o
Non-accelerated filer o (Do not check if a
smaller reporting company)
Smaller reportingcompany o
Emerging growth company o
If emerging growth company, indicate by check mark if the registrant has elected not to use the extended transition period for complying with any new orrevised financial accounting standards provided pursuant to Section 13(a) of the Exchange Act. o
Indicate by check mark whether the registrant is a shell company (as defined in Rule 12b-2 of the Exchange Act). Yes o No ý
Number of shares of the registrant's Common Stock outstanding at October 20, 2017 : 266,937,094
Table of Contents
IRON MOUNTAIN INCORPORATED
Index
PagePART I—FINANCIAL INFORMATION Item 1—Unaudited Condensed Consolidated Financial Statements 3
Condensed Consolidated Balance Sheets at December 31, 2016 and September 30, 2017 (Unaudited) 3
Condensed Consolidated Statements of Operations for the Three Months Ended September 30, 2016 and 2017 (Unaudited) 4
Condensed Consolidated Statements of Operations for the Nine Months Ended September 30, 2016 and 2017 (Unaudited) 5
Condensed Consolidated Statements of Comprehensive Income (Loss) for the Three and Nine Months Ended September 30, 2016 and 2017(Unaudited) 6
Condensed Consolidated Statements of Equity for the Nine Months Ended September 30, 2016 and 2017 (Unaudited) 7
Condensed Consolidated Statements of Cash Flows for the Nine Months Ended September 30, 2016 and 2017 (Unaudited) 8
Notes to Condensed Consolidated Financial Statements (Unaudited) 9
Item 2—Management's Discussion and Analysis of Financial Condition and Results of Operations 57
Item 4—Controls and Procedures 88
PART II—OTHER INFORMATION
Item 2—Unregistered Sales of Equity Securities and Use of Proceeds 89
Item 6—Exhibits 90
Signatures 91
2
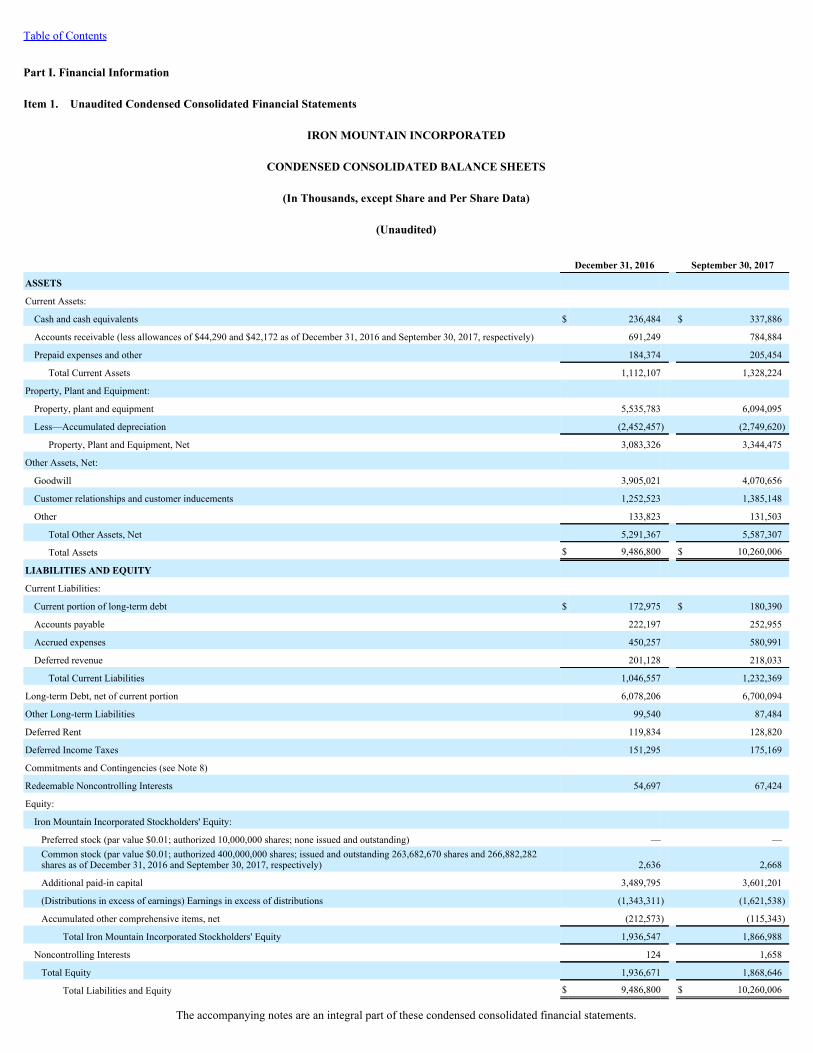
Table of Contents
Part I. Financial Information
Item 1. Unaudited Condensed Consolidated Financial Statements
IRON MOUNTAIN INCORPORATED
CONDENSED CONSOLIDATED BALANCE SHEETS
(In Thousands, except Share and Per Share Data)
(Unaudited)
December 31, 2016 September 30, 2017
ASSETS
Current Assets:
Cash and cash equivalents $ 236,484 $ 337,886
Accounts receivable (less allowances of $44,290 and $42,172 as of December 31, 2016 and September 30, 2017, respectively) 691,249 784,884
Prepaid expenses and other 184,374 205,454
Total Current Assets 1,112,107 1,328,224
Property, Plant and Equipment:
Property, plant and equipment 5,535,783 6,094,095
Less—Accumulated depreciation (2,452,457) (2,749,620)
Property, Plant and Equipment, Net 3,083,326 3,344,475
Other Assets, Net:
Goodwill 3,905,021 4,070,656
Customer relationships and customer inducements 1,252,523 1,385,148
Other 133,823 131,503
Total Other Assets, Net 5,291,367 5,587,307
Total Assets $ 9,486,800 $ 10,260,006
LIABILITIES AND EQUITY
Current Liabilities:
Current portion of long-term debt $ 172,975 $ 180,390
Accounts payable 222,197 252,955
Accrued expenses 450,257 580,991
Deferred revenue 201,128 218,033
Total Current Liabilities 1,046,557 1,232,369
Long-term Debt, net of current portion 6,078,206 6,700,094
Other Long-term Liabilities 99,540 87,484
Deferred Rent 119,834 128,820
Deferred Income Taxes 151,295 175,169
Commitments and Contingencies (see Note 8)
Redeemable Noncontrolling Interests 54,697 67,424
Equity:
Iron Mountain Incorporated Stockholders' Equity:
Preferred stock (par value $0.01; authorized 10,000,000 shares; none issued and outstanding) — —Common stock (par value $0.01; authorized 400,000,000 shares; issued and outstanding 263,682,670 shares and 266,882,282shares as of December 31, 2016 and September 30, 2017, respectively) 2,636 2,668
Additional paid-in capital 3,489,795 3,601,201
(Distributions in excess of earnings) Earnings in excess of distributions (1,343,311) (1,621,538)
Accumulated other comprehensive items, net (212,573) (115,343)
Total Iron Mountain Incorporated Stockholders' Equity 1,936,547 1,866,988
Noncontrolling Interests 124 1,658
Total Equity 1,936,671 1,868,646
Total Liabilities and Equity $ 9,486,800 $ 10,260,006
The accompanying notes are an integral part of these condensed consolidated financial statements.

3
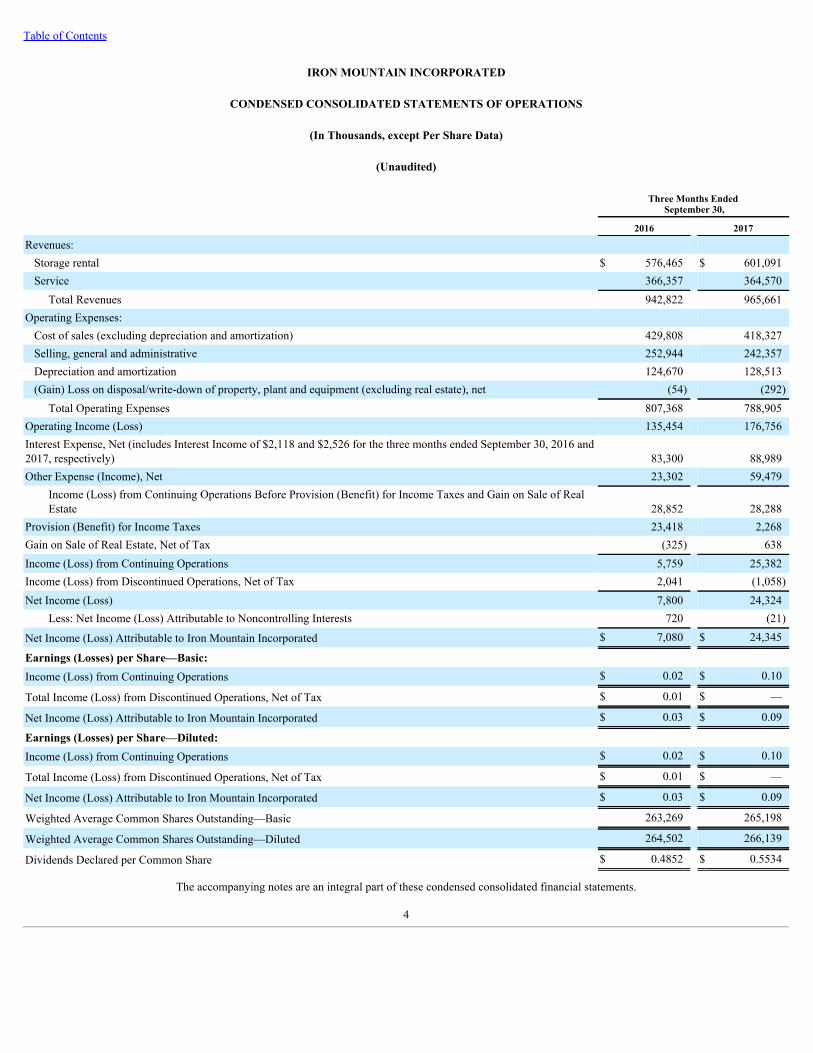
Table of Contents
IRON MOUNTAIN INCORPORATED
CONDENSED CONSOLIDATED STATEMENTS OF OPERATIONS
(In Thousands, except Per Share Data)
(Unaudited)
Three Months Ended
September 30,
2016 2017
Revenues: Storage rental $ 576,465 $ 601,091Service 366,357 364,570
Total Revenues 942,822 965,661Operating Expenses: Cost of sales (excluding depreciation and amortization) 429,808 418,327Selling, general and administrative 252,944 242,357Depreciation and amortization 124,670 128,513(Gain) Loss on disposal/write-down of property, plant and equipment (excluding real estate), net (54) (292)
Total Operating Expenses 807,368 788,905Operating Income (Loss) 135,454 176,756Interest Expense, Net (includes Interest Income of $2,118 and $2,526 for the three months ended September 30, 2016 and2017, respectively) 83,300 88,989Other Expense (Income), Net 23,302 59,479
Income (Loss) from Continuing Operations Before Provision (Benefit) for Income Taxes and Gain on Sale of RealEstate 28,852 28,288
Provision (Benefit) for Income Taxes 23,418 2,268Gain on Sale of Real Estate, Net of Tax (325) 638Income (Loss) from Continuing Operations 5,759 25,382Income (Loss) from Discontinued Operations, Net of Tax 2,041 (1,058)Net Income (Loss) 7,800 24,324
Less: Net Income (Loss) Attributable to Noncontrolling Interests 720 (21)
Net Income (Loss) Attributable to Iron Mountain Incorporated $ 7,080 $ 24,345
Earnings (Losses) per Share—Basic: Income (Loss) from Continuing Operations $ 0.02 $ 0.10
Total Income (Loss) from Discontinued Operations, Net of Tax $ 0.01 $ —
Net Income (Loss) Attributable to Iron Mountain Incorporated $ 0.03 $ 0.09
Earnings (Losses) per Share—Diluted: Income (Loss) from Continuing Operations $ 0.02 $ 0.10
Total Income (Loss) from Discontinued Operations, Net of Tax $ 0.01 $ —
Net Income (Loss) Attributable to Iron Mountain Incorporated $ 0.03 $ 0.09
Weighted Average Common Shares Outstanding—Basic 263,269 265,198
Weighted Average Common Shares Outstanding—Diluted 264,502 266,139
Dividends Declared per Common Share $ 0.4852 $ 0.5534
The accompanying notes are an integral part of these condensed consolidated financial statements.
4
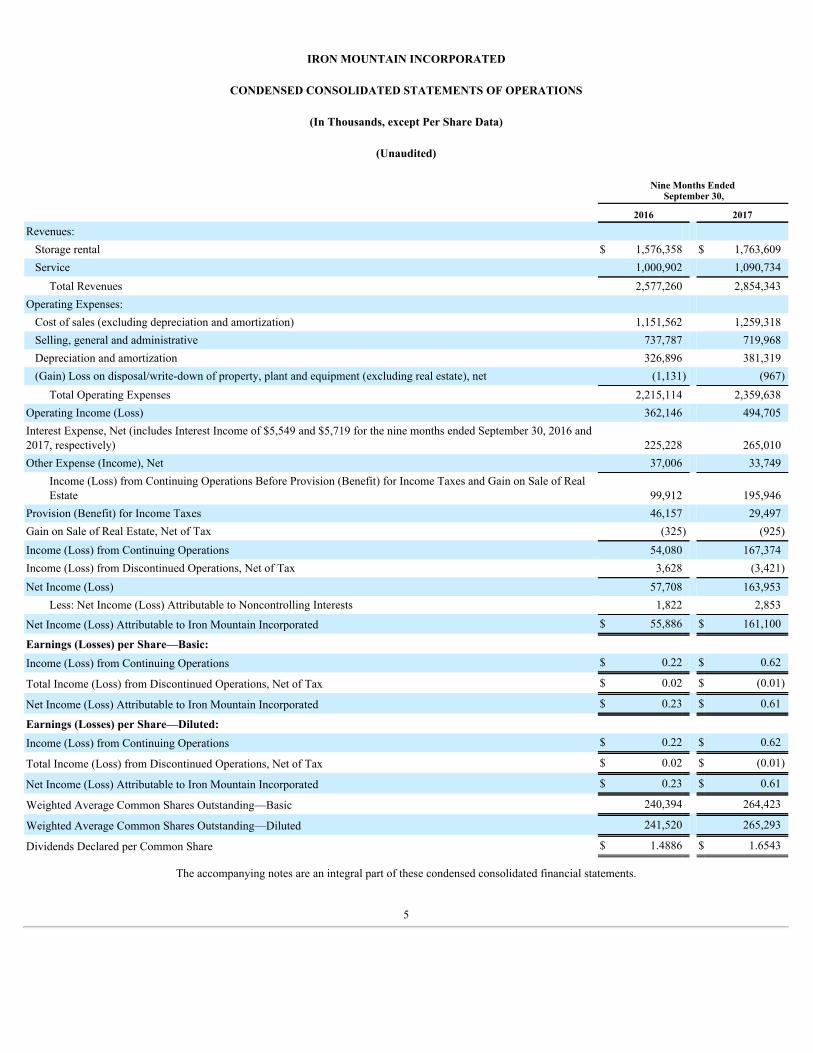
IRON MOUNTAIN INCORPORATED
CONDENSED CONSOLIDATED STATEMENTS OF OPERATIONS
(In Thousands, except Per Share Data)
(Unaudited)
Nine Months Ended
September 30,
2016 2017
Revenues: Storage rental $ 1,576,358 $ 1,763,609Service 1,000,902 1,090,734
Total Revenues 2,577,260 2,854,343Operating Expenses: Cost of sales (excluding depreciation and amortization) 1,151,562 1,259,318Selling, general and administrative 737,787 719,968Depreciation and amortization 326,896 381,319(Gain) Loss on disposal/write-down of property, plant and equipment (excluding real estate), net (1,131) (967)
Total Operating Expenses 2,215,114 2,359,638Operating Income (Loss) 362,146 494,705Interest Expense, Net (includes Interest Income of $5,549 and $5,719 for the nine months ended September 30, 2016 and2017, respectively) 225,228 265,010Other Expense (Income), Net 37,006 33,749
Income (Loss) from Continuing Operations Before Provision (Benefit) for Income Taxes and Gain on Sale of RealEstate 99,912 195,946
Provision (Benefit) for Income Taxes 46,157 29,497Gain on Sale of Real Estate, Net of Tax (325) (925)Income (Loss) from Continuing Operations 54,080 167,374Income (Loss) from Discontinued Operations, Net of Tax 3,628 (3,421)Net Income (Loss) 57,708 163,953
Less: Net Income (Loss) Attributable to Noncontrolling Interests 1,822 2,853
Net Income (Loss) Attributable to Iron Mountain Incorporated $ 55,886 $ 161,100
Earnings (Losses) per Share—Basic: Income (Loss) from Continuing Operations $ 0.22 $ 0.62
Total Income (Loss) from Discontinued Operations, Net of Tax $ 0.02 $ (0.01)
Net Income (Loss) Attributable to Iron Mountain Incorporated $ 0.23 $ 0.61
Earnings (Losses) per Share—Diluted: Income (Loss) from Continuing Operations $ 0.22 $ 0.62
Total Income (Loss) from Discontinued Operations, Net of Tax $ 0.02 $ (0.01)
Net Income (Loss) Attributable to Iron Mountain Incorporated $ 0.23 $ 0.61
Weighted Average Common Shares Outstanding—Basic 240,394 264,423
Weighted Average Common Shares Outstanding—Diluted 241,520 265,293
Dividends Declared per Common Share $ 1.4886 $ 1.6543
The accompanying notes are an integral part of these condensed consolidated financial statements.
5
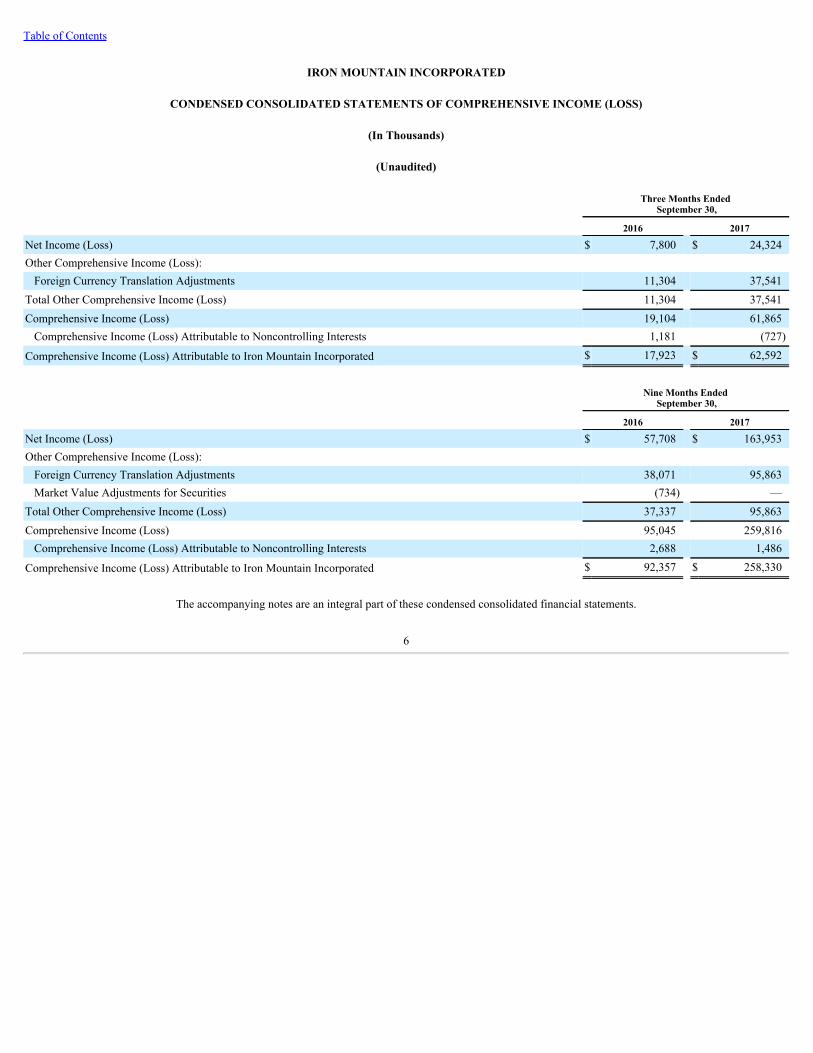
Table of Contents
IRON MOUNTAIN INCORPORATED
CONDENSED CONSOLIDATED STATEMENTS OF COMPREHENSIVE INCOME (LOSS)
(In Thousands)
(Unaudited)
Three Months Ended
September 30,
2016 2017
Net Income (Loss) $ 7,800 $ 24,324Other Comprehensive Income (Loss): Foreign Currency Translation Adjustments 11,304 37,541
Total Other Comprehensive Income (Loss) 11,304 37,541Comprehensive Income (Loss) 19,104 61,865Comprehensive Income (Loss) Attributable to Noncontrolling Interests 1,181 (727)
Comprehensive Income (Loss) Attributable to Iron Mountain Incorporated $ 17,923 $ 62,592
Nine Months Ended
September 30,
2016 2017
Net Income (Loss) $ 57,708 $ 163,953Other Comprehensive Income (Loss): Foreign Currency Translation Adjustments 38,071 95,863Market Value Adjustments for Securities (734) —
Total Other Comprehensive Income (Loss) 37,337 95,863Comprehensive Income (Loss) 95,045 259,816Comprehensive Income (Loss) Attributable to Noncontrolling Interests 2,688 1,486
Comprehensive Income (Loss) Attributable to Iron Mountain Incorporated $ 92,357 $ 258,330
The accompanying notes are an integral part of these condensed consolidated financial statements.
6
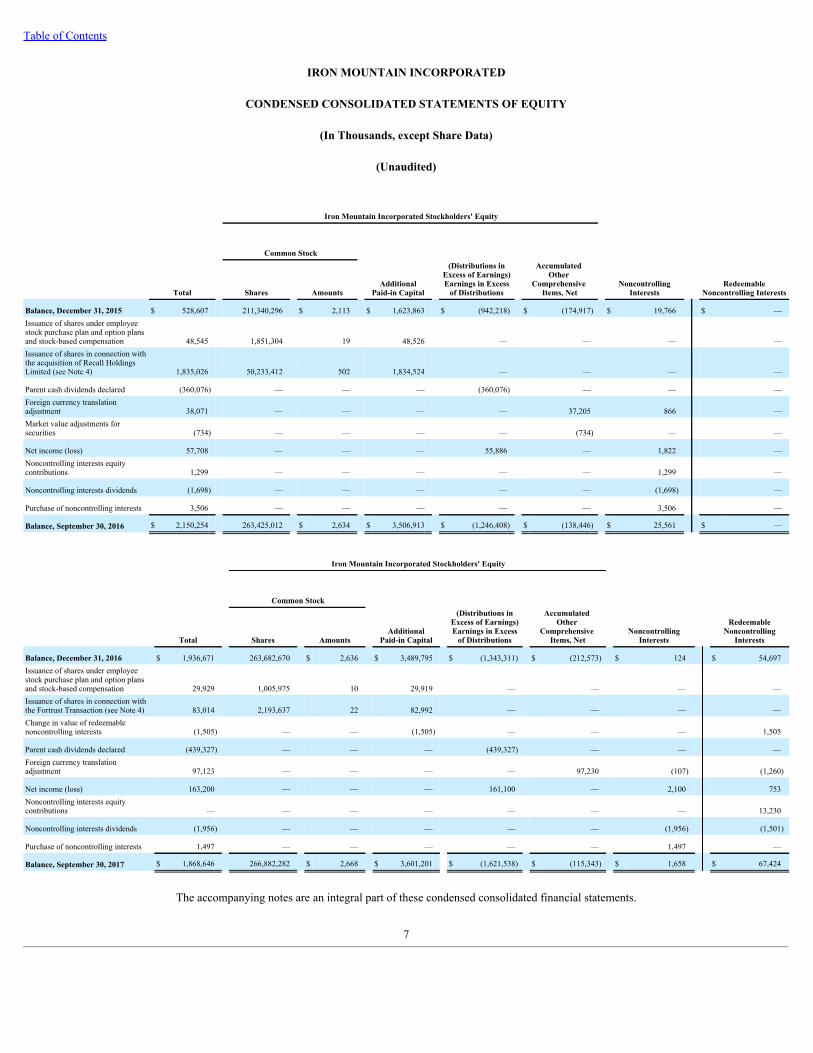
Table of Contents
IRON MOUNTAIN INCORPORATED
CONDENSED CONSOLIDATED STATEMENTS OF EQUITY
(In Thousands, except Share Data)
(Unaudited)
Iron Mountain Incorporated Stockholders' Equity
Common Stock
AdditionalPaid-in Capital
(Distributions in
Excess of Earnings)Earnings in Excess
of Distributions
NoncontrollingInterests
Total Shares Amounts
Accumulated Other
Comprehensive Items, Net Redeemable
Noncontrolling Interests
Balance, December 31, 2015 $ 528,607 211,340,296 $ 2,113 $ 1,623,863 $ (942,218) $ (174,917) $ 19,766 $ —Issuance of shares under employeestock purchase plan and option plansand stock-based compensation 48,545 1,851,304 19 48,526 — — — —Issuance of shares in connection withthe acquisition of Recall HoldingsLimited (see Note 4) 1,835,026 50,233,412 502 1,834,524 — — — —
Parent cash dividends declared (360,076) — — — (360,076) — — —Foreign currency translationadjustment 38,071 — — — — 37,205 866 —Market value adjustments forsecurities (734) — — — — (734) — —
Net income (loss) 57,708 — — — 55,886 — 1,822 —Noncontrolling interests equitycontributions 1,299 — — — — — 1,299 —
Noncontrolling interests dividends (1,698) — — — — — (1,698) —
Purchase of noncontrolling interests 3,506 — — — — — 3,506 —
Balance, September 30, 2016 $ 2,150,254 263,425,012 $ 2,634 $ 3,506,913 $ (1,246,408) $ (138,446) $ 25,561 $ —
Iron Mountain Incorporated Stockholders' Equity
Common Stock
AdditionalPaid-in Capital
(Distributions in
Excess of Earnings)Earnings in Excess
of Distributions
NoncontrollingInterests
Total Shares Amounts
Accumulated Other
Comprehensive Items, Net
RedeemableNoncontrolling
Interests
Balance, December 31, 2016 $ 1,936,671 263,682,670 $ 2,636 $ 3,489,795 $ (1,343,311) $ (212,573) $ 124 $ 54,697Issuance of shares under employeestock purchase plan and option plansand stock-based compensation 29,929 1,005,975 10 29,919 — — — —Issuance of shares in connection withthe Fortrust Transaction (see Note 4) 83,014 2,193,637 22 82,992 — — — —Change in value of redeemablenoncontrolling interests (1,505) — — (1,505) — — — 1,505
Parent cash dividends declared (439,327) — — — (439,327) — — —Foreign currency translationadjustment 97,123 — — — — 97,230 (107) (1,260)
Net income (loss) 163,200 — — — 161,100 — 2,100 753Noncontrolling interests equitycontributions — — — — — — — 13,230
Noncontrolling interests dividends (1,956) — — — — — (1,956) (1,501)
Purchase of noncontrolling interests 1,497 — — — — — 1,497 —
Balance, September 30, 2017 $ 1,868,646 266,882,282 $ 2,668 $ 3,601,201 $ (1,621,538) $ (115,343) $ 1,658 $ 67,424
The accompanying notes are an integral part of these condensed consolidated financial statements.
7
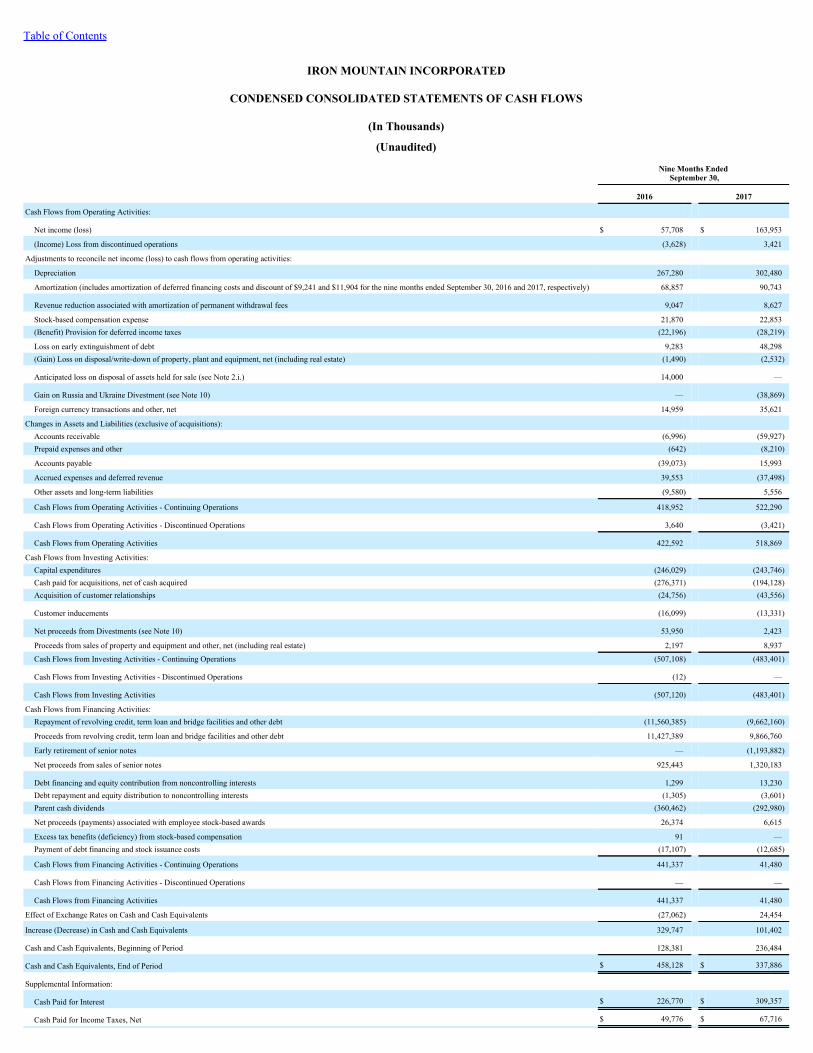
Table of Contents
IRON MOUNTAIN INCORPORATED
CONDENSED CONSOLIDATED STATEMENTS OF CASH FLOWS
(In Thousands)
(Unaudited)
Nine Months Ended
September 30,
2016 2017
Cash Flows from Operating Activities:
Net income (loss) $ 57,708 $ 163,953
(Income) Loss from discontinued operations (3,628) 3,421
Adjustments to reconcile net income (loss) to cash flows from operating activities:
Depreciation 267,280 302,480
Amortization (includes amortization of deferred financing costs and discount of $9,241 and $11,904 for the nine months ended September 30, 2016 and 2017, respectively) 68,857 90,743
Revenue reduction associated with amortization of permanent withdrawal fees 9,047 8,627
Stock-based compensation expense 21,870 22,853(Benefit) Provision for deferred income taxes (22,196) (28,219)
Loss on early extinguishment of debt 9,283 48,298(Gain) Loss on disposal/write-down of property, plant and equipment, net (including real estate) (1,490) (2,532)
Anticipated loss on disposal of assets held for sale (see Note 2.i.) 14,000 —
Gain on Russia and Ukraine Divestment (see Note 10) — (38,869)
Foreign currency transactions and other, net 14,959 35,621
Changes in Assets and Liabilities (exclusive of acquisitions): Accounts receivable (6,996) (59,927)Prepaid expenses and other (642) (8,210)
Accounts payable (39,073) 15,993
Accrued expenses and deferred revenue 39,553 (37,498)
Other assets and long-term liabilities (9,580) 5,556
Cash Flows from Operating Activities - Continuing Operations 418,952 522,290
Cash Flows from Operating Activities - Discontinued Operations 3,640 (3,421)
Cash Flows from Operating Activities 422,592 518,869
Cash Flows from Investing Activities: Capital expenditures (246,029) (243,746)Cash paid for acquisitions, net of cash acquired (276,371) (194,128)Acquisition of customer relationships (24,756) (43,556)
Customer inducements (16,099) (13,331)
Net proceeds from Divestments (see Note 10) 53,950 2,423
Proceeds from sales of property and equipment and other, net (including real estate) 2,197 8,937
Cash Flows from Investing Activities - Continuing Operations (507,108) (483,401)
Cash Flows from Investing Activities - Discontinued Operations (12) —
Cash Flows from Investing Activities (507,120) (483,401)
Cash Flows from Financing Activities: Repayment of revolving credit, term loan and bridge facilities and other debt (11,560,385) (9,662,160)
Proceeds from revolving credit, term loan and bridge facilities and other debt 11,427,389 9,866,760
Early retirement of senior notes — (1,193,882)
Net proceeds from sales of senior notes 925,443 1,320,183
Debt financing and equity contribution from noncontrolling interests 1,299 13,230Debt repayment and equity distribution to noncontrolling interests (1,305) (3,601)Parent cash dividends (360,462) (292,980)
Net proceeds (payments) associated with employee stock-based awards 26,374 6,615
Excess tax benefits (deficiency) from stock-based compensation 91 —Payment of debt financing and stock issuance costs (17,107) (12,685)
Cash Flows from Financing Activities - Continuing Operations 441,337 41,480
Cash Flows from Financing Activities - Discontinued Operations — —
Cash Flows from Financing Activities 441,337 41,480
Effect of Exchange Rates on Cash and Cash Equivalents (27,062) 24,454
Increase (Decrease) in Cash and Cash Equivalents 329,747 101,402
Cash and Cash Equivalents, Beginning of Period 128,381 236,484
Cash and Cash Equivalents, End of Period $ 458,128 $ 337,886
Supplemental Information:
Cash Paid for Interest $ 226,770 $ 309,357
Cash Paid for Income Taxes, Net $ 49,776 $ 67,716
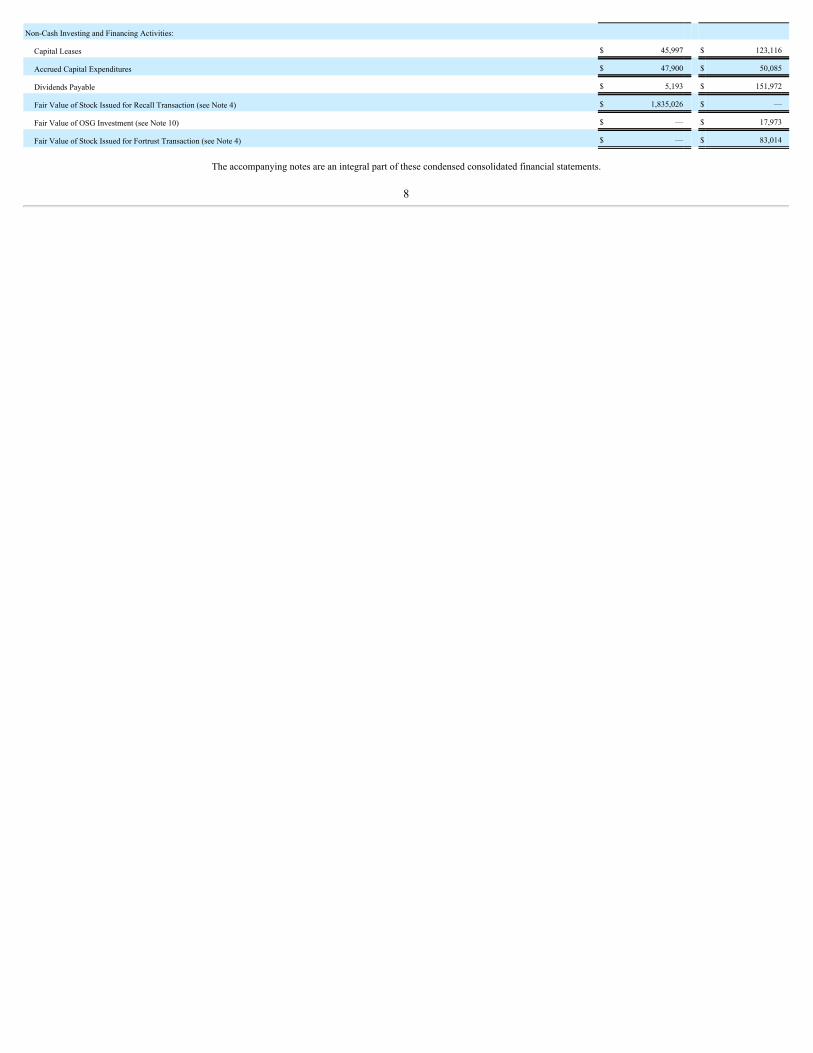
Non-Cash Investing and Financing Activities:
Capital Leases $ 45,997 $ 123,116
Accrued Capital Expenditures $ 47,900 $ 50,085
Dividends Payable $ 5,193 $ 151,972
Fair Value of Stock Issued for Recall Transaction (see Note 4) $ 1,835,026 $ —
Fair Value of OSG Investment (see Note 10) $ — $ 17,973
Fair Value of Stock Issued for Fortrust Transaction (see Note 4) $ — $ 83,014
The accompanying notes are an integral part of these condensed consolidated financial statements.
8
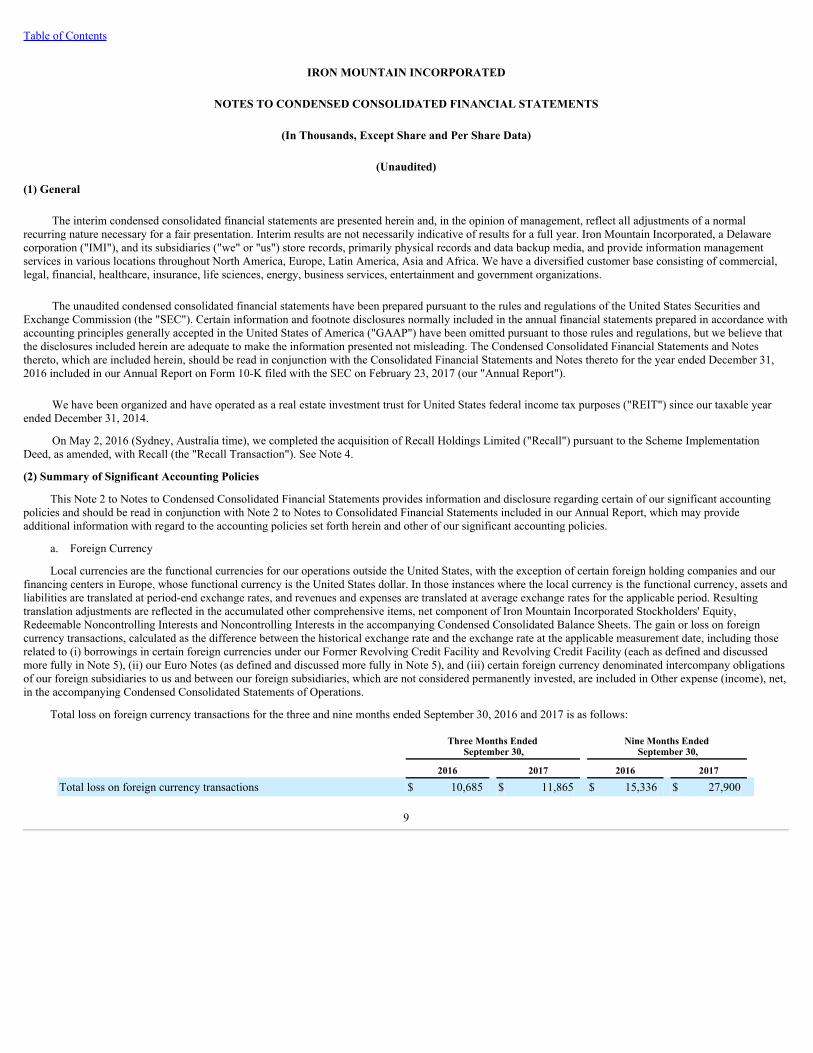
Table of Contents
IRON MOUNTAIN INCORPORATED
NOTES TO CONDENSED CONSOLIDATED FINANCIAL STATEMENTS
(In Thousands, Except Share and Per Share Data)
(Unaudited)
(1) General
The interim condensed consolidated financial statements are presented herein and, in the opinion of management, reflect all adjustments of a normalrecurring nature necessary for a fair presentation. Interim results are not necessarily indicative of results for a full year. Iron Mountain Incorporated, a Delawarecorporation ("IMI"), and its subsidiaries ("we" or "us") store records, primarily physical records and data backup media, and provide information managementservices in various locations throughout North America, Europe, Latin America, Asia and Africa. We have a diversified customer base consisting of commercial,legal, financial, healthcare, insurance, life sciences, energy, business services, entertainment and government organizations.
The unaudited condensed consolidated financial statements have been prepared pursuant to the rules and regulations of the United States Securities andExchange Commission (the "SEC"). Certain information and footnote disclosures normally included in the annual financial statements prepared in accordance withaccounting principles generally accepted in the United States of America ("GAAP") have been omitted pursuant to those rules and regulations, but we believe thatthe disclosures included herein are adequate to make the information presented not misleading. The Condensed Consolidated Financial Statements and Notesthereto, which are included herein, should be read in conjunction with the Consolidated Financial Statements and Notes thereto for the year ended December 31,2016 included in our Annual Report on Form 10-K filed with the SEC on February 23, 2017 (our "Annual Report").
We have been organized and have operated as a real estate investment trust for United States federal income tax purposes ("REIT") since our taxable yearended December 31, 2014.
On May 2, 2016 (Sydney, Australia time), we completed the acquisition of Recall Holdings Limited ("Recall") pursuant to the Scheme ImplementationDeed, as amended, with Recall (the "Recall Transaction"). See Note 4.
(2) Summary of Significant Accounting Policies
This Note 2 to Notes to Condensed Consolidated Financial Statements provides information and disclosure regarding certain of our significant accountingpolicies and should be read in conjunction with Note 2 to Notes to Consolidated Financial Statements included in our Annual Report, which may provideadditional information with regard to the accounting policies set forth herein and other of our significant accounting policies.
a. Foreign Currency
Local currencies are the functional currencies for our operations outside the United States, with the exception of certain foreign holding companies and ourfinancing centers in Europe, whose functional currency is the United States dollar. In those instances where the local currency is the functional currency, assets andliabilities are translated at period-end exchange rates, and revenues and expenses are translated at average exchange rates for the applicable period. Resultingtranslation adjustments are reflected in the accumulated other comprehensive items, net component of Iron Mountain Incorporated Stockholders' Equity,Redeemable Noncontrolling Interests and Noncontrolling Interests in the accompanying Condensed Consolidated Balance Sheets. The gain or loss on foreigncurrency transactions, calculated as the difference between the historical exchange rate and the exchange rate at the applicable measurement date, including thoserelated to (i) borrowings in certain foreign currencies under our Former Revolving Credit Facility and Revolving Credit Facility (each as defined and discussedmore fully in Note 5), (ii) our Euro Notes (as defined and discussed more fully in Note 5), and (iii) certain foreign currency denominated intercompany obligationsof our foreign subsidiaries to us and between our foreign subsidiaries, which are not considered permanently invested, are included in Other expense (income), net,in the accompanying Condensed Consolidated Statements of Operations.
Total loss on foreign currency transactions for the three and nine months ended September 30, 2016 and 2017 is as follows:
Three Months Ended
September 30, Nine Months Ended
September 30,
2016 2017 2016 2017 Total loss on foreign currency transactions $ 10,685 $ 11,865 $ 15,336 $ 27,900
9
Table of Contents
IRON MOUNTAIN INCORPORATED
NOTES TO CONDENSED CONSOLIDATED FINANCIAL STATEMENTS (Continued)
(In Thousands, Except Share and Per Share Data)
(Unaudited)
(2) Summary of Significant Accounting Policies (Continued)
b. Goodwill and Other Intangible Assets
Goodwill
Goodwill is not amortized but is reviewed annually for impairment, or more frequently if impairment indicators arise. We have selected October 1 as ourannual goodwill impairment review date. We performed our most recent annual goodwill impairment review as of October 1, 2016 and concluded there was noimpairment of goodwill at such date. As of December 31, 2016 and September 30, 2017, no factors were identified that would alter our October 1, 2016 goodwillimpairment analysis. In making this assessment, we considered a number of factors including operating results, business plans, anticipated future cash flows,transactions and marketplace data. There are inherent uncertainties related to these factors and our judgment in applying them to the analysis of goodwillimpairment. When changes occur in the composition of one or more reporting units, the goodwill is reassigned to the reporting units affected based on their relativefair values.
Our reporting units as of December 31, 2016 are described in detail in Note 2.h. to Notes to Consolidated Financial Statements included in our AnnualReport. The goodwill associated with acquisitions completed during the first nine months of 2017 (which are described in Note 4) has been incorporated into ourreporting units as they existed as of December 31, 2016. During the nine months ended September 30, 2017, there were certain changes to the composition of ourreporting units, which are described below.
i. Impact of Russia and Ukraine Divestment
Prior to the Russia and Ukraine Divestment (as defined in Note 10), our businesses in Russia and Ukraine were a component of our Northern and EasternEurope reporting unit. As disclosed in Note 10, on May 30, 2017, Iron Mountain EES Holdings Ltd. ("IM EES"), a consolidated subsidiary of IMI, sold its recordsand information management operations in Russia and Ukraine. As a result of the Russia and Ukraine Divestment, $3,515 of goodwill associated with our Northernand Eastern Europe reporting unit was allocated, on a relative fair value basis, to the Russia and Ukraine Divestment and included in the carrying value of thedivested businesses. See Note 10 for additional information regarding the Russia and Ukraine Divestment.
ii. Northern and Eastern Europe, Africa and India reporting units
During the second quarter of 2017, as a result of changes in the management of our businesses included in our Other International Business segment, wereassessed the composition of our reporting units. As a result of this reassessment, we determined that our businesses in our former Africa and India reporting unit,which included our businesses in South Africa and India, as well as our business in the United Arab Emirates which was acquired in the first quarter of 2017, werenow being managed in conjunction with our businesses included in our Northern and Eastern Europe reporting unit. This newly formed reporting unit, whichconsists of (i) the businesses included in our former Northern and Eastern Europe reporting unit and (ii) our businesses in the United Arab Emirates, South Africaand India is referred to as the Northern/Eastern Europe and Middle East, Africa and India, or NEE and MEAI, reporting unit.
iii. North American Secure Shredding reporting unit
During the second quarter of 2017, we reassessed the composition of our reporting units included in our North American Records and InformationManagement Business segment. As a result of this reassessment, we determined that the discrete financial information and operating results of our North AmericanSecure Shredding business are no longer being regularly reviewed by the segment manager of our North American Records and Information Management Businesssegment. Therefore, we have concluded that our secure shredding operations in North America no longer constitute a separate reporting unit and that our NorthAmerican Records and Information Management Business segment consists of one reporting unit, which is referred to as the North American Records andInformation Management reporting unit.
10
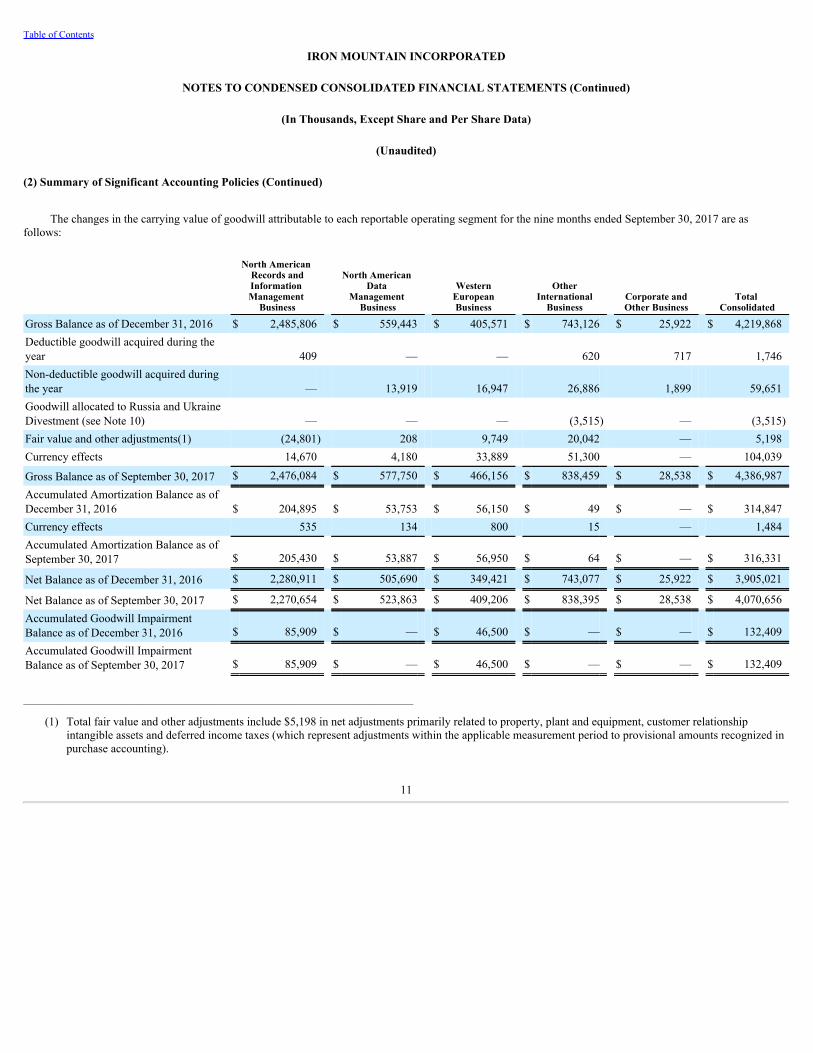
Table of Contents
IRON MOUNTAIN INCORPORATED
NOTES TO CONDENSED CONSOLIDATED FINANCIAL STATEMENTS (Continued)
(In Thousands, Except Share and Per Share Data)
(Unaudited)
(2) Summary of Significant Accounting Policies (Continued)
The changes in the carrying value of goodwill attributable to each reportable operating segment for the nine months ended September 30, 2017 are asfollows:
North American Records andInformation Management
Business
North American Data
Management Business
WesternEuropeanBusiness
OtherInternational
Business Corporate andOther Business
Total Consolidated
Gross Balance as of December 31, 2016 $ 2,485,806 $ 559,443 $ 405,571 $ 743,126 $ 25,922 $ 4,219,868Deductible goodwill acquired during theyear 409 — — 620 717 1,746Non-deductible goodwill acquired duringthe year — 13,919 16,947 26,886 1,899 59,651Goodwill allocated to Russia and UkraineDivestment (see Note 10) — — — (3,515) — (3,515)Fair value and other adjustments(1) (24,801) 208 9,749 20,042 — 5,198Currency effects 14,670 4,180 33,889 51,300 — 104,039
Gross Balance as of September 30, 2017 $ 2,476,084 $ 577,750 $ 466,156 $ 838,459 $ 28,538 $ 4,386,987Accumulated Amortization Balance as ofDecember 31, 2016 $ 204,895 $ 53,753 $ 56,150 $ 49 $ — $ 314,847Currency effects 535 134 800 15 — 1,484Accumulated Amortization Balance as ofSeptember 30, 2017 $ 205,430 $ 53,887 $ 56,950 $ 64 $ — $ 316,331
Net Balance as of December 31, 2016 $ 2,280,911 $ 505,690 $ 349,421 $ 743,077 $ 25,922 $ 3,905,021
Net Balance as of September 30, 2017 $ 2,270,654 $ 523,863 $ 409,206 $ 838,395 $ 28,538 $ 4,070,656Accumulated Goodwill ImpairmentBalance as of December 31, 2016 $ 85,909 $ — $ 46,500 $ — $ — $ 132,409Accumulated Goodwill ImpairmentBalance as of September 30, 2017 $ 85,909 $ — $ 46,500 $ — $ — $ 132,409
_______________________________________________________________________________
(1) Total fair value and other adjustments include $5,198 in net adjustments primarily related to property, plant and equipment, customer relationshipintangible assets and deferred income taxes (which represent adjustments within the applicable measurement period to provisional amounts recognized inpurchase accounting).
11
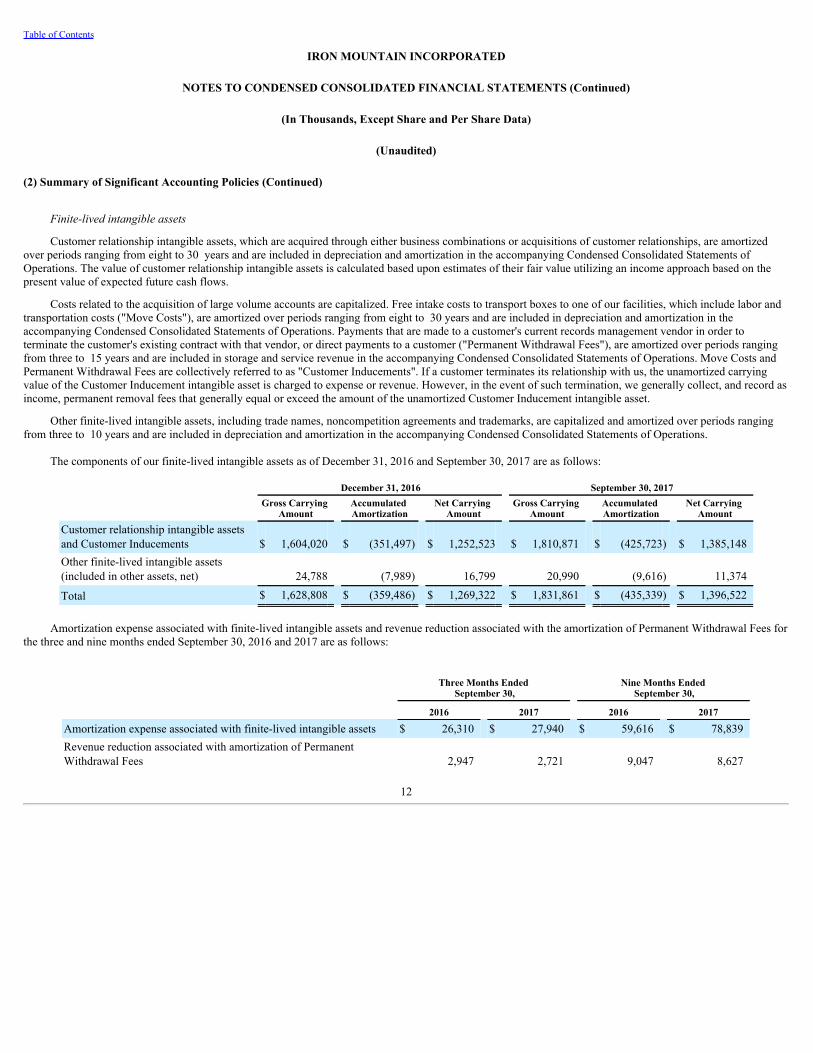
Table of Contents
IRON MOUNTAIN INCORPORATED
NOTES TO CONDENSED CONSOLIDATED FINANCIAL STATEMENTS (Continued)
(In Thousands, Except Share and Per Share Data)
(Unaudited)
(2) Summary of Significant Accounting Policies (Continued)
Finite-lived intangible assets
Customer relationship intangible assets, which are acquired through either business combinations or acquisitions of customer relationships, are amortizedover periods ranging from eight to 30 years and are included in depreciation and amortization in the accompanying Condensed Consolidated Statements ofOperations. The value of customer relationship intangible assets is calculated based upon estimates of their fair value utilizing an income approach based on thepresent value of expected future cash flows.
Costs related to the acquisition of large volume accounts are capitalized. Free intake costs to transport boxes to one of our facilities, which include labor andtransportation costs ("Move Costs"), are amortized over periods ranging from eight to 30 years and are included in depreciation and amortization in theaccompanying Condensed Consolidated Statements of Operations. Payments that are made to a customer's current records management vendor in order toterminate the customer's existing contract with that vendor, or direct payments to a customer ("Permanent Withdrawal Fees"), are amortized over periods rangingfrom three to 15 years and are included in storage and service revenue in the accompanying Condensed Consolidated Statements of Operations. Move Costs andPermanent Withdrawal Fees are collectively referred to as "Customer Inducements". If a customer terminates its relationship with us, the unamortized carryingvalue of the Customer Inducement intangible asset is charged to expense or revenue. However, in the event of such termination, we generally collect, and record asincome, permanent removal fees that generally equal or exceed the amount of the unamortized Customer Inducement intangible asset.
Other finite-lived intangible assets, including trade names, noncompetition agreements and trademarks, are capitalized and amortized over periods rangingfrom three to 10 years and are included in depreciation and amortization in the accompanying Condensed Consolidated Statements of Operations.
The components of our finite-lived intangible assets as of December 31, 2016 and September 30, 2017 are as follows:
December 31, 2016 September 30, 2017
Gross Carrying
Amount Accumulated Amortization
Net Carrying Amount
Gross Carrying Amount
Accumulated Amortization
Net Carrying Amount
Customer relationship intangible assetsand Customer Inducements $ 1,604,020 $ (351,497) $ 1,252,523 $ 1,810,871 $ (425,723) $ 1,385,148Other finite-lived intangible assets(included in other assets, net) 24,788 (7,989) 16,799 20,990 (9,616) 11,374
Total $ 1,628,808 $ (359,486) $ 1,269,322 $ 1,831,861 $ (435,339) $ 1,396,522
Amortization expense associated with finite-lived intangible assets and revenue reduction associated with the amortization of Permanent Withdrawal Fees forthe three and nine months ended September 30, 2016 and 2017 are as follows:
Three Months Ended
September 30, Nine Months Ended
September 30,
2016 2017 2016 2017
Amortization expense associated with finite-lived intangible assets $ 26,310 $ 27,940 $ 59,616 $ 78,839Revenue reduction associated with amortization of PermanentWithdrawal Fees 2,947 2,721 9,047 8,627
12

Table of Contents
IRON MOUNTAIN INCORPORATED
NOTES TO CONDENSED CONSOLIDATED FINANCIAL STATEMENTS (Continued)
(In Thousands, Except Share and Per Share Data)
(Unaudited)
(2) Summary of Significant Accounting Policies (Continued)
c. Stock-Based Compensation
We record stock-based compensation expense, utilizing the straight-line method, for the cost of stock options, restricted stock units ("RSUs") andperformance units ("PUs"). The stock options, RSUs, PUs and shares of stock issued under our employee stock purchase plan ("ESPP") are collectively the"Employee Stock-Based Awards".
Stock-based compensation expense for Employee Stock-Based Awards for the three and nine months ended September 30, 2016 was $5,957 ( $4,245 aftertax or $0.02 per basic and diluted share) and $21,870 ( $16,170 after tax or $0.07 per basic and diluted share), respectively. Stock-based compensation expense forEmployee Stock-Based Awards for the three and nine months ended September 30, 2017 was $7,761 ( $6,851 after tax or $0.03 per basic and diluted share) and$22,853 ( $20,174 after tax or $0.08 per basic and diluted share), respectively.
Stock-based compensation expense for Employee Stock-Based Awards included in the accompanying Condensed Consolidated Statements of Operations isas follows:
Three Months Ended
September 30, Nine Months Ended
September 30,
2016 2017 2016 2017
Cost of sales (excluding depreciation and amortization) $ 28 $ 25 $ 80 $ 80Selling, general and administrative expenses 5,929 7,736 21,790 22,773
Total stock-based compensation $ 5,957 $ 7,761 $ 21,870 $ 22,853
Stock Options
A summary of our stock options outstanding as of September 30, 2017 by vesting terms is as follows:
September 30, 2017
Stock OptionsOutstanding
% ofStock OptionsOutstanding
Three-year vesting period (10 year contractual life) 3,386,180 88.5%Five-year vesting period (10 year contractual life) 442,171 11.5%
3,828,351 100.0%
The weighted average fair value of stock options granted for the nine months ended September 30, 2016 and 2017 was $2.55 and $4.26 per share,respectively. These values were estimated on the date of grant using the Black-Scholes option pricing model. The weighted average assumptions used for grants inthe respective periods are as follows:
Nine Months Ended
September 30,
Weighted Average Assumptions 2016 2017
Expected volatility 27.2% 25.8%Risk-free interest rate 1.32% 1.96%Expected dividend yield 7% 6%Expected life 5.6 years 5.0 years
Expected volatility is calculated utilizing daily historical volatility over a period that equates to the expected life of the option. The risk-free interest rate wasbased on the United States Treasury interest rates whose term is consistent with the expected life (estimated period of time outstanding) of the stock options.Expected dividend yield is considered in the option pricing model and represents our current annualized expected per share dividends over the current trade priceof our common stock. The expected life of the stock options granted is estimated using the historical exercise behavior of employees.
13
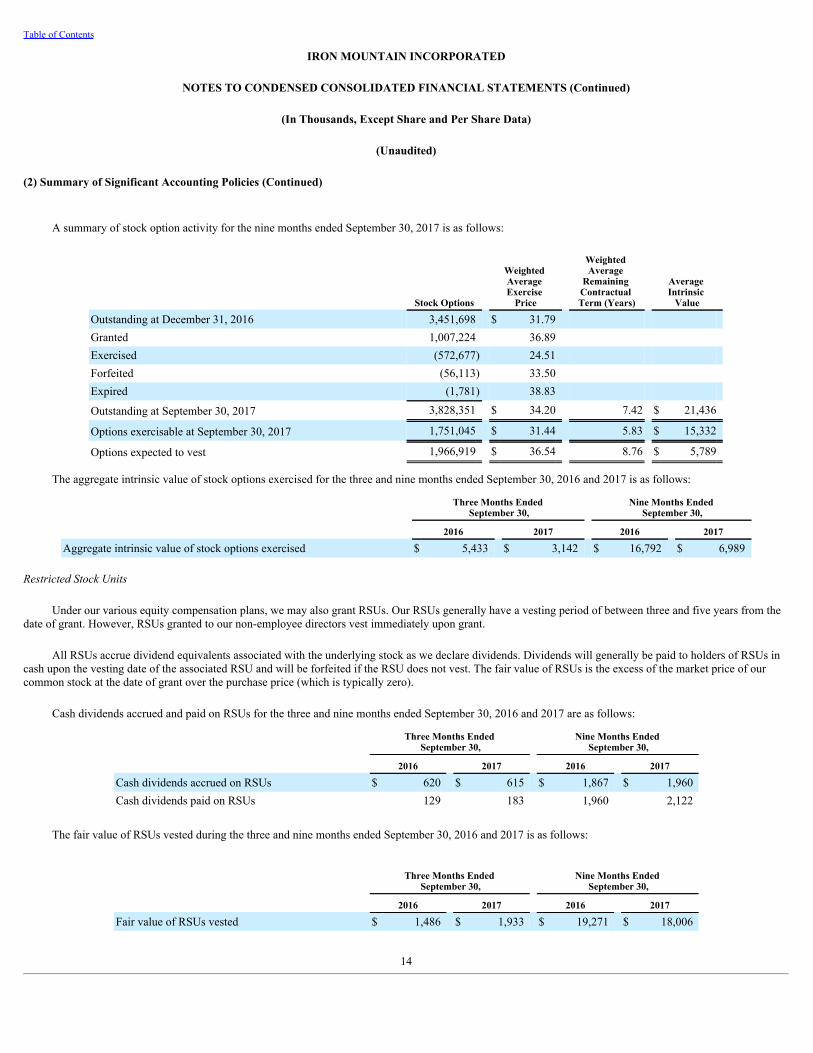
Table of Contents
IRON MOUNTAIN INCORPORATED
NOTES TO CONDENSED CONSOLIDATED FINANCIAL STATEMENTS (Continued)
(In Thousands, Except Share and Per Share Data)
(Unaudited)
(2) Summary of Significant Accounting Policies (Continued)
A summary of stock option activity for the nine months ended September 30, 2017 is as follows:
Stock Options
Weighted Average Exercise
Price
Weighted Average
Remaining Contractual Term (Years)
Average Intrinsic
Value
Outstanding at December 31, 2016 3,451,698 $ 31.79 Granted 1,007,224 36.89 Exercised (572,677) 24.51 Forfeited (56,113) 33.50 Expired (1,781) 38.83
Outstanding at September 30, 2017 3,828,351 $ 34.20 7.42 $ 21,436
Options exercisable at September 30, 2017 1,751,045 $ 31.44 5.83 $ 15,332
Options expected to vest 1,966,919 $ 36.54 8.76 $ 5,789
The aggregate intrinsic value of stock options exercised for the three and nine months ended September 30, 2016 and 2017 is as follows:
Three Months Ended
September 30, Nine Months Ended
September 30,
2016 2017 2016 2017
Aggregate intrinsic value of stock options exercised $ 5,433 $ 3,142 $ 16,792 $ 6,989
Restricted Stock Units
Under our various equity compensation plans, we may also grant RSUs. Our RSUs generally have a vesting period of between three and five years from thedate of grant. However, RSUs granted to our non-employee directors vest immediately upon grant.
All RSUs accrue dividend equivalents associated with the underlying stock as we declare dividends. Dividends will generally be paid to holders of RSUs incash upon the vesting date of the associated RSU and will be forfeited if the RSU does not vest. The fair value of RSUs is the excess of the market price of ourcommon stock at the date of grant over the purchase price (which is typically zero).
Cash dividends accrued and paid on RSUs for the three and nine months ended September 30, 2016 and 2017 are as follows:
Three Months Ended
September 30, Nine Months Ended
September 30,
2016 2017 2016 2017
Cash dividends accrued on RSUs $ 620 $ 615 $ 1,867 $ 1,960Cash dividends paid on RSUs 129 183 1,960 2,122
The fair value of RSUs vested during the three and nine months ended September 30, 2016 and 2017 is as follows:
Three Months Ended
September 30, Nine Months Ended
September 30,
2016 2017 2016 2017
Fair value of RSUs vested $ 1,486 $ 1,933 $ 19,271 $ 18,006
14
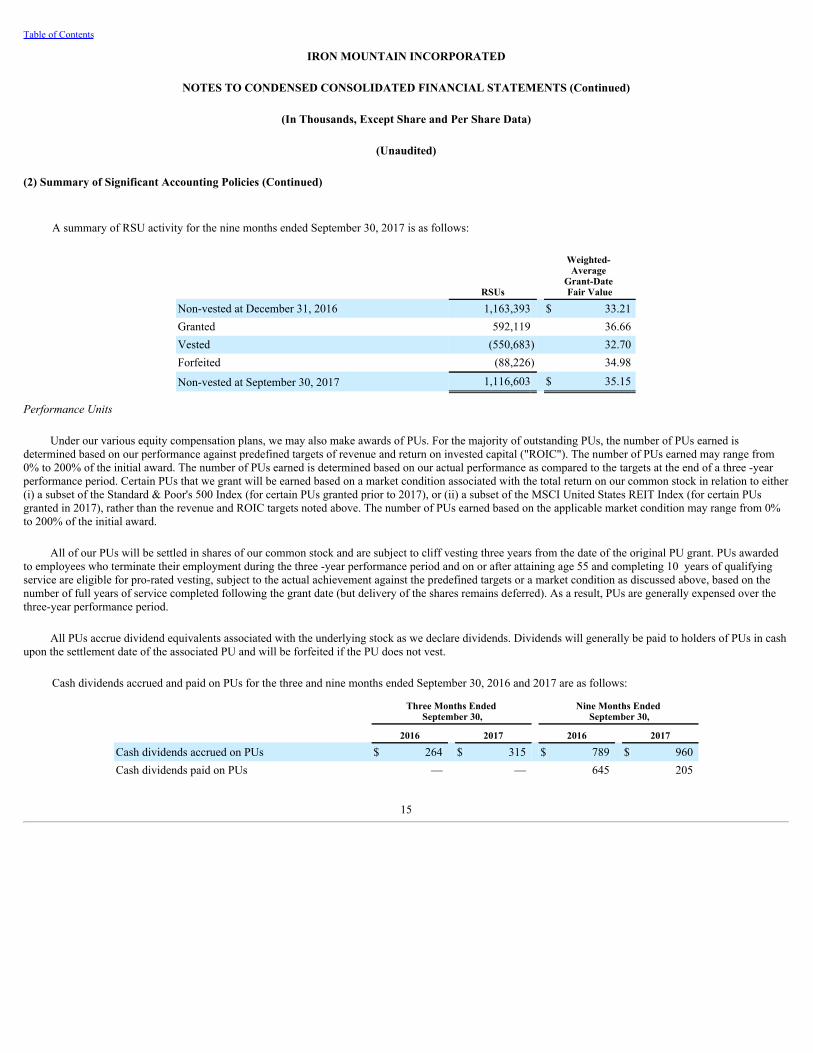
Table of Contents
IRON MOUNTAIN INCORPORATED
NOTES TO CONDENSED CONSOLIDATED FINANCIAL STATEMENTS (Continued)
(In Thousands, Except Share and Per Share Data)
(Unaudited)
(2) Summary of Significant Accounting Policies (Continued)
A summary of RSU activity for the nine months ended September 30, 2017 is as follows:
RSUs
Weighted- Average
Grant-Date Fair Value
Non-vested at December 31, 2016 1,163,393 $ 33.21Granted 592,119 36.66Vested (550,683) 32.70Forfeited (88,226) 34.98
Non-vested at September 30, 2017 1,116,603 $ 35.15
Performance Units
Under our various equity compensation plans, we may also make awards of PUs. For the majority of outstanding PUs, the number of PUs earned isdetermined based on our performance against predefined targets of revenue and return on invested capital ("ROIC"). The number of PUs earned may range from0% to 200% of the initial award. The number of PUs earned is determined based on our actual performance as compared to the targets at the end of a three -yearperformance period. Certain PUs that we grant will be earned based on a market condition associated with the total return on our common stock in relation to either(i) a subset of the Standard & Poor's 500 Index (for certain PUs granted prior to 2017), or (ii) a subset of the MSCI United States REIT Index (for certain PUsgranted in 2017), rather than the revenue and ROIC targets noted above. The number of PUs earned based on the applicable market condition may range from 0%to 200% of the initial award.
All of our PUs will be settled in shares of our common stock and are subject to cliff vesting three years from the date of the original PU grant. PUs awardedto employees who terminate their employment during the three -year performance period and on or after attaining age 55 and completing 10 years of qualifyingservice are eligible for pro-rated vesting, subject to the actual achievement against the predefined targets or a market condition as discussed above, based on thenumber of full years of service completed following the grant date (but delivery of the shares remains deferred). As a result, PUs are generally expensed over thethree-year performance period.
All PUs accrue dividend equivalents associated with the underlying stock as we declare dividends. Dividends will generally be paid to holders of PUs in cashupon the settlement date of the associated PU and will be forfeited if the PU does not vest.
Cash dividends accrued and paid on PUs for the three and nine months ended September 30, 2016 and 2017 are as follows:
Three Months Ended
September 30, Nine Months Ended
September 30,
2016 2017 2016 2017
Cash dividends accrued on PUs $ 264 $ 315 $ 789 $ 960Cash dividends paid on PUs — — 645 205
15
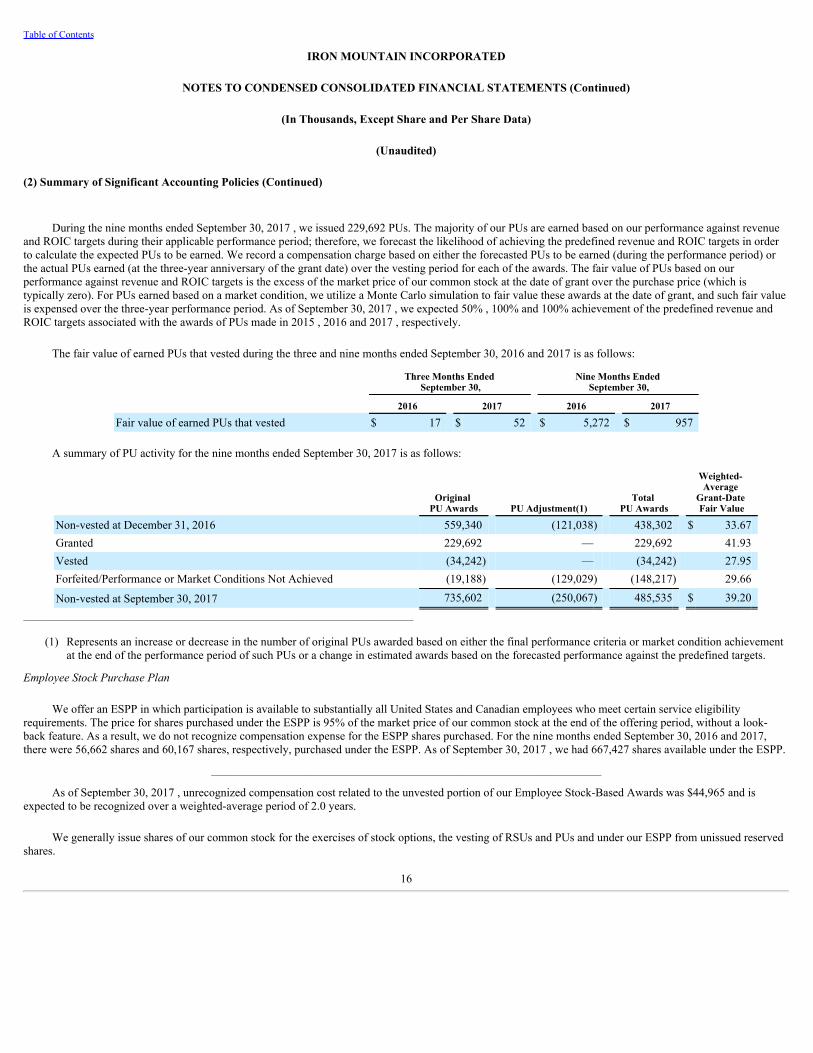
Table of Contents
IRON MOUNTAIN INCORPORATED
NOTES TO CONDENSED CONSOLIDATED FINANCIAL STATEMENTS (Continued)
(In Thousands, Except Share and Per Share Data)
(Unaudited)
(2) Summary of Significant Accounting Policies (Continued)
During the nine months ended September 30, 2017 , we issued 229,692 PUs. The majority of our PUs are earned based on our performance against revenueand ROIC targets during their applicable performance period; therefore, we forecast the likelihood of achieving the predefined revenue and ROIC targets in orderto calculate the expected PUs to be earned. We record a compensation charge based on either the forecasted PUs to be earned (during the performance period) orthe actual PUs earned (at the three-year anniversary of the grant date) over the vesting period for each of the awards. The fair value of PUs based on ourperformance against revenue and ROIC targets is the excess of the market price of our common stock at the date of grant over the purchase price (which istypically zero). For PUs earned based on a market condition, we utilize a Monte Carlo simulation to fair value these awards at the date of grant, and such fair valueis expensed over the three-year performance period. As of September 30, 2017 , we expected 50% , 100% and 100% achievement of the predefined revenue andROIC targets associated with the awards of PUs made in 2015 , 2016 and 2017 , respectively.
The fair value of earned PUs that vested during the three and nine months ended September 30, 2016 and 2017 is as follows:
Three Months Ended
September 30, Nine Months Ended
September 30,
2016 2017 2016 2017
Fair value of earned PUs that vested $ 17 $ 52 $ 5,272 $ 957
A summary of PU activity for the nine months ended September 30, 2017 is as follows:
Original
PU Awards PU Adjustment(1) Total
PU Awards
Weighted- Average
Grant-Date Fair Value
Non-vested at December 31, 2016 559,340 (121,038) 438,302 $ 33.67Granted 229,692 — 229,692 41.93Vested (34,242) — (34,242) 27.95Forfeited/Performance or Market Conditions Not Achieved (19,188) (129,029) (148,217) 29.66
Non-vested at September 30, 2017 735,602 (250,067) 485,535 $ 39.20_______________________________________________________________________________
(1) Represents an increase or decrease in the number of original PUs awarded based on either the final performance criteria or market condition achievementat the end of the performance period of such PUs or a change in estimated awards based on the forecasted performance against the predefined targets.
Employee Stock Purchase Plan
We offer an ESPP in which participation is available to substantially all United States and Canadian employees who meet certain service eligibilityrequirements. The price for shares purchased under the ESPP is 95% of the market price of our common stock at the end of the offering period, without a look-back feature. As a result, we do not recognize compensation expense for the ESPP shares purchased. For the nine months ended September 30, 2016 and 2017,there were 56,662 shares and 60,167 shares, respectively, purchased under the ESPP. As of September 30, 2017 , we had 667,427 shares available under the ESPP.
_______________________________________________________________________________
As of September 30, 2017 , unrecognized compensation cost related to the unvested portion of our Employee Stock-Based Awards was $44,965 and isexpected to be recognized over a weighted-average period of 2.0 years.
We generally issue shares of our common stock for the exercises of stock options, the vesting of RSUs and PUs and under our ESPP from unissued reservedshares.
16

Table of Contents
IRON MOUNTAIN INCORPORATED
NOTES TO CONDENSED CONSOLIDATED FINANCIAL STATEMENTS (Continued)
(In Thousands, Except Share and Per Share Data)
(Unaudited)
(2) Summary of Significant Accounting Policies (Continued)
d. Income (Loss) Per Share—Basic and Diluted
Basic income (loss) per common share is calculated by dividing income (loss) by the weighted average number of common shares outstanding. Thecalculation of diluted income (loss) per share is consistent with that of basic income (loss) per share but gives effect to all potential common shares (that is,securities such as stock options, RSUs or PUs) that were outstanding during the period, unless the effect is antidilutive.
The calculation of basic and diluted income (loss) per share for the three and nine months ended September 30, 2016 and 2017 is as follows:
Three Months Ended
September 30, Nine Months Ended
September 30,
2016 2017 2016 2017
Income (loss) from continuing operations $ 5,759 $ 25,382 $ 54,080 $ 167,374Less: Net income (loss) attributable to noncontrolling interests 720 (21) 1,822 2,853Income (loss) from continuing operations (utilized in numerator of EarningsPer Share calculation) $ 5,039 $ 25,403 $ 52,258 $ 164,521
Income (loss) from discontinued operations, net of tax $ 2,041 $ (1,058) $ 3,628 $ (3,421)
Net income (loss) attributable to Iron Mountain Incorporated $ 7,080 $ 24,345 $ 55,886 $ 161,100
Weighted-average shares—basic 263,269,000 265,198,000 240,394,000 264,423,000Effect of dilutive potential stock options 640,202 414,258 628,263 423,688Effect of dilutive potential RSUs and PUs 592,773 526,725 497,658 446,002
Weighted-average shares—diluted 264,501,975 266,138,983 241,519,921 265,292,690
Earnings (losses) per share—basic: Income (loss) from continuing operations $ 0.02 $ 0.10 $ 0.22 $ 0.62Income (loss) from discontinued operations, net of tax 0.01 — 0.02 (0.01)
Net income (loss) attributable to Iron Mountain Incorporated(1) $ 0.03 $ 0.09 $ 0.23 $ 0.61
Earnings (losses) per share—diluted: Income (loss) from continuing operations $ 0.02 $ 0.10 $ 0.22 $ 0.62Income (loss) from discontinued operations, net of tax 0.01 — 0.02 (0.01)
Net income (loss) attributable to Iron Mountain Incorporated(1) $ 0.03 $ 0.09 $ 0.23 $ 0.61
Antidilutive stock options, RSUs and PUs, excluded from the calculation 759,478 2,620,225 1,725,249 2,605,203
_______________________________________________________________________________
(1) Columns may not foot due to rounding.
17
Table of Contents
IRON MOUNTAIN INCORPORATED
NOTES TO CONDENSED CONSOLIDATED FINANCIAL STATEMENTS (Continued)
(In Thousands, Except Share and Per Share Data)
(Unaudited)
(2) Summary of Significant Accounting Policies (Continued)
e. Income Taxes
We provide for income taxes during interim periods based on our estimate of the effective tax rate for the year. Discrete items and changes in our estimate ofthe annual effective tax rate are recorded in the period they occur. Our effective tax rate is subject to variability in the future due to, among other items: (1) changesin the mix of income between our qualified REIT subsidiaries ("QRSs") and our domestic taxable REIT subsidiaries ("TRSs"), as well as among the jurisdictions inwhich we operate; (2) tax law changes; (3) volatility in foreign exchange gains and losses; (4) the timing of the establishment and reversal of tax reserves; and(5) our ability to utilize net operating losses that we generate.
Our effective tax rates for the three and nine months ended September 30, 2016 were 81.2% and 46.2% , respectively. The primary reconciling items betweenthe federal statutory tax rate of 35.0% and our overall effective tax rates for the three and nine months ended September 30, 2016 were the benefit derived from thedividends paid deduction, differences in the rates of tax at which our foreign earnings are subject, including foreign exchange gains and losses in differentjurisdictions with different tax rates, and the impact of the $14,000 charge (described in Note 2.i.) recorded during the third quarter of 2016 related to theanticipated loss on disposal of the Australia Divestment Business (as defined in Note 6 to Notes to Consolidated Financial Statements included in our AnnualReport), which had no associated tax benefit. Our effective tax rates for the three and nine months ended September 30, 2017 were 8.0% and 15.1% , respectively.The primary reconciling items between the federal statutory tax rate of 35.0% and our overall effective tax rate for the three months ended September 30, 2017were the benefit derived from the dividends paid deduction, differences in the rates of tax at which our foreign earnings are subject and a release of valuationallowances on certain of our foreign net operating losses of $18,457 as a result of the merger of certain of our foreign subsidiaries. The primary reconciling itemsbetween the federal statutory tax rate of 35.0% and our overall effective tax rate for the nine months ended September 30, 2017 were the benefit derived from thedividends paid deduction, differences in the rates of tax at which our foreign earnings are subject and a release of valuation allowances on certain of our foreign netoperating losses of $25,968 as a result of the merger of certain of our foreign subsidiaries.
During 2016, as a result of the closing of the Recall Transaction and the subsequent integration of Recall's operations into our operations, we reassessed ourintentions regarding the indefinite reinvestment of current and future undistributed earnings of our unconverted foreign TRSs outside the United States (the "2016Indefinite Reinvestment Assessment"). As a result of the 2016 Indefinite Reinvestment Assessment, we concluded that it is our intent to indefinitely reinvest ourcurrent and future undistributed earnings of our unconverted foreign TRSs outside the United States. Accordingly, we no longer provide incremental foreignwithholding taxes on the retained book earnings of these unconverted foreign TRSs. As a REIT, future repatriation of incremental undistributed earnings of ourforeign subsidiaries will not be subject to federal or state income tax, with the exception of foreign withholding taxes in limited instances; however, such futurerepatriations will require distribution in accordance with REIT distribution rules, and any such distribution may then be taxable, as appropriate, at the stockholderlevel. We continue, however, to provide for incremental foreign withholding taxes on net book over outside basis differences related to the earnings of our foreignQRSs and certain of our converted TRSs.
f. Concentrations of Credit Risk
Financial instruments that potentially subject us to credit risk consist principally of cash and cash equivalents (including time deposits) and accountsreceivable. The only significant concentrations of liquid investments as of December 31, 2016 and September 30, 2017 , respectively, related to cash and cashequivalents. At December 31, 2016 and September 30, 2017, we had time deposits with six global banks. As of December 31, 2016 and September 30, 2017 , ourcash and cash equivalents was $236,484 and $337,886 , respectively, including time deposits of $22,240 and $55,132 , respectively.
18
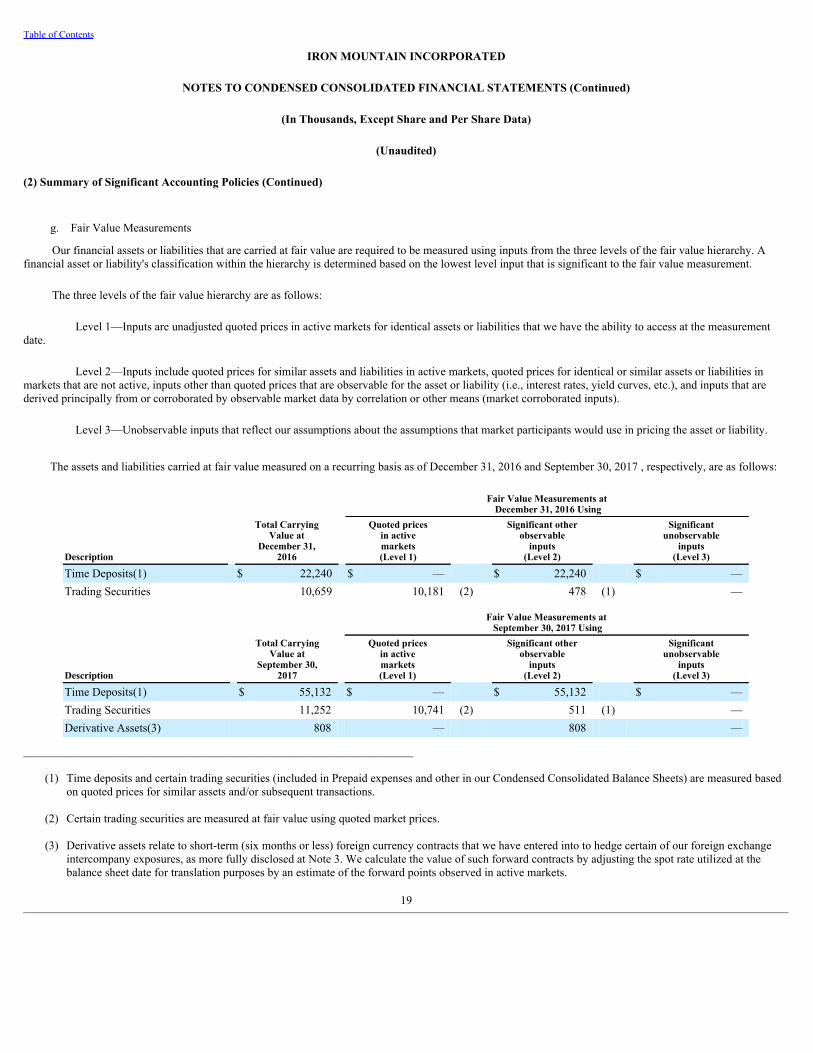
Table of Contents
IRON MOUNTAIN INCORPORATED
NOTES TO CONDENSED CONSOLIDATED FINANCIAL STATEMENTS (Continued)
(In Thousands, Except Share and Per Share Data)
(Unaudited)
(2) Summary of Significant Accounting Policies (Continued)
g. Fair Value Measurements
Our financial assets or liabilities that are carried at fair value are required to be measured using inputs from the three levels of the fair value hierarchy. Afinancial asset or liability's classification within the hierarchy is determined based on the lowest level input that is significant to the fair value measurement.
The three levels of the fair value hierarchy are as follows:
Level 1—Inputs are unadjusted quoted prices in active markets for identical assets or liabilities that we have the ability to access at the measurementdate.
Level 2—Inputs include quoted prices for similar assets and liabilities in active markets, quoted prices for identical or similar assets or liabilities inmarkets that are not active, inputs other than quoted prices that are observable for the asset or liability (i.e., interest rates, yield curves, etc.), and inputs that arederived principally from or corroborated by observable market data by correlation or other means (market corroborated inputs).
Level 3—Unobservable inputs that reflect our assumptions about the assumptions that market participants would use in pricing the asset or liability.
The assets and liabilities carried at fair value measured on a recurring basis as of December 31, 2016 and September 30, 2017 , respectively, are as follows:
Fair Value Measurements at
December 31, 2016 Using
Description
Total CarryingValue at
December 31,2016
Quoted pricesin activemarkets(Level 1)
Significant otherobservable
inputs(Level 2)
Significantunobservable
inputs(Level 3)
Time Deposits(1) $ 22,240 $ — $ 22,240 $ —Trading Securities 10,659 10,181 (2) 478 (1) —
Fair Value Measurements at
September 30, 2017 Using
Description
Total CarryingValue at
September 30,2017
Quoted pricesin activemarkets(Level 1)
Significant otherobservable
inputs(Level 2)
Significantunobservable
inputs(Level 3)
Time Deposits(1) $ 55,132 $ — $ 55,132 $ —Trading Securities 11,252 10,741 (2) 511 (1) —Derivative Assets(3) 808 — 808 —
_______________________________________________________________________________
(1) Time deposits and certain trading securities (included in Prepaid expenses and other in our Condensed Consolidated Balance Sheets) are measured basedon quoted prices for similar assets and/or subsequent transactions.
(2) Certain trading securities are measured at fair value using quoted market prices.
(3) Derivative assets relate to short-term (six months or less) foreign currency contracts that we have entered into to hedge certain of our foreign exchangeintercompany exposures, as more fully disclosed at Note 3. We calculate the value of such forward contracts by adjusting the spot rate utilized at thebalance sheet date for translation purposes by an estimate of the forward points observed in active markets.
19
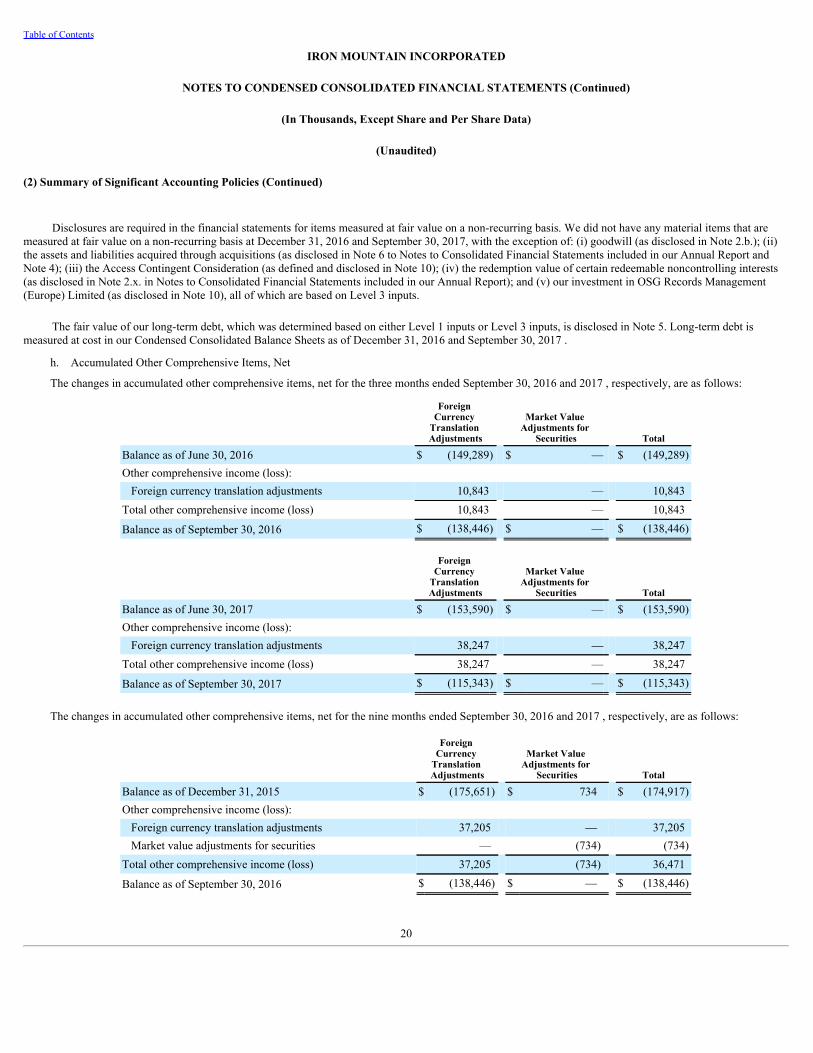
Table of Contents
IRON MOUNTAIN INCORPORATED
NOTES TO CONDENSED CONSOLIDATED FINANCIAL STATEMENTS (Continued)
(In Thousands, Except Share and Per Share Data)
(Unaudited)
(2) Summary of Significant Accounting Policies (Continued)
Disclosures are required in the financial statements for items measured at fair value on a non-recurring basis. We did not have any material items that aremeasured at fair value on a non-recurring basis at December 31, 2016 and September 30, 2017, with the exception of: (i) goodwill (as disclosed in Note 2.b.); (ii)the assets and liabilities acquired through acquisitions (as disclosed in Note 6 to Notes to Consolidated Financial Statements included in our Annual Report andNote 4); (iii) the Access Contingent Consideration (as defined and disclosed in Note 10); (iv) the redemption value of certain redeemable noncontrolling interests(as disclosed in Note 2.x. in Notes to Consolidated Financial Statements included in our Annual Report); and (v) our investment in OSG Records Management(Europe) Limited (as disclosed in Note 10), all of which are based on Level 3 inputs.
The fair value of our long-term debt, which was determined based on either Level 1 inputs or Level 3 inputs, is disclosed in Note 5. Long-term debt ismeasured at cost in our Condensed Consolidated Balance Sheets as of December 31, 2016 and September 30, 2017 .
h. Accumulated Other Comprehensive Items, Net
The changes in accumulated other comprehensive items, net for the three months ended September 30, 2016 and 2017 , respectively, are as follows:
Foreign Currency
Translation Adjustments
Market Value Adjustments for
Securities Total
Balance as of June 30, 2016 $ (149,289) $ — $ (149,289)Other comprehensive income (loss): Foreign currency translation adjustments 10,843 — 10,843
Total other comprehensive income (loss) 10,843 — 10,843
Balance as of September 30, 2016 $ (138,446) $ — $ (138,446)
Foreign Currency
Translation Adjustments
Market Value Adjustments for
Securities Total
Balance as of June 30, 2017 $ (153,590) $ — $ (153,590)Other comprehensive income (loss): Foreign currency translation adjustments 38,247 — 38,247
Total other comprehensive income (loss) 38,247 — 38,247
Balance as of September 30, 2017 $ (115,343) $ — $ (115,343)
The changes in accumulated other comprehensive items, net for the nine months ended September 30, 2016 and 2017 , respectively, are as follows:
Foreign Currency
Translation Adjustments
Market Value Adjustments for
Securities Total
Balance as of December 31, 2015 $ (175,651) $ 734 $ (174,917)Other comprehensive income (loss): Foreign currency translation adjustments 37,205 — 37,205Market value adjustments for securities — (734) (734)
Total other comprehensive income (loss) 37,205 (734) 36,471
Balance as of September 30, 2016 $ (138,446) $ — $ (138,446)
20
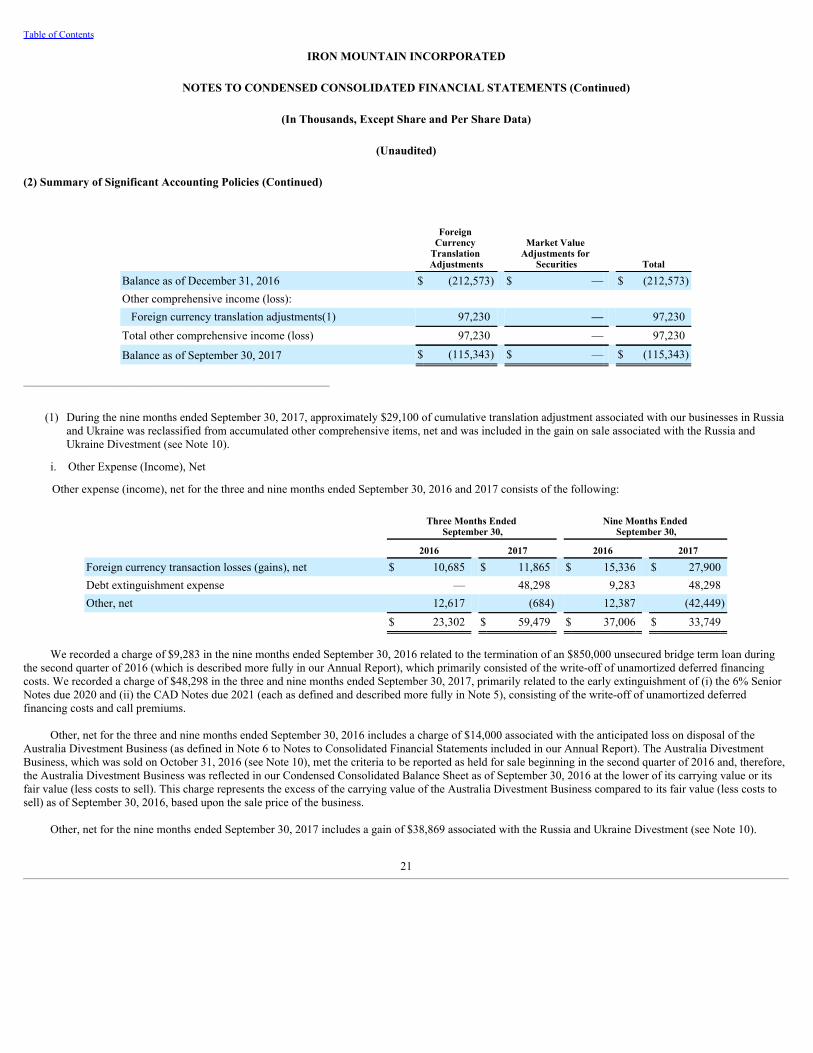
Table of Contents
IRON MOUNTAIN INCORPORATED
NOTES TO CONDENSED CONSOLIDATED FINANCIAL STATEMENTS (Continued)
(In Thousands, Except Share and Per Share Data)
(Unaudited)
(2) Summary of Significant Accounting Policies (Continued)
Foreign Currency
Translation Adjustments
Market Value Adjustments for
Securities Total
Balance as of December 31, 2016 $ (212,573) $ — $ (212,573)Other comprehensive income (loss): Foreign currency translation adjustments(1) 97,230 — 97,230
Total other comprehensive income (loss) 97,230 — 97,230
Balance as of September 30, 2017 $ (115,343) $ — $ (115,343)
______________________________________________________________
(1) During the nine months ended September 30, 2017, approximately $29,100 of cumulative translation adjustment associated with our businesses in Russiaand Ukraine was reclassified from accumulated other comprehensive items, net and was included in the gain on sale associated with the Russia andUkraine Divestment (see Note 10).
i. Other Expense (Income), Net
Other expense (income), net for the three and nine months ended September 30, 2016 and 2017 consists of the following:
Three Months Ended
September 30, Nine Months Ended
September 30,
2016 2017 2016 2017
Foreign currency transaction losses (gains), net $ 10,685 $ 11,865 $ 15,336 $ 27,900Debt extinguishment expense — 48,298 9,283 48,298Other, net 12,617 (684) 12,387 (42,449)
$ 23,302 $ 59,479 $ 37,006 $ 33,749
We recorded a charge of $9,283 in the nine months ended September 30, 2016 related to the termination of an $850,000 unsecured bridge term loan duringthe second quarter of 2016 (which is described more fully in our Annual Report), which primarily consisted of the write-off of unamortized deferred financingcosts. We recorded a charge of $48,298 in the three and nine months ended September 30, 2017, primarily related to the early extinguishment of (i) the 6% SeniorNotes due 2020 and (ii) the CAD Notes due 2021 (each as defined and described more fully in Note 5), consisting of the write-off of unamortized deferredfinancing costs and call premiums.
Other, net for the three and nine months ended September 30, 2016 includes a charge of $14,000 associated with the anticipated loss on disposal of theAustralia Divestment Business (as defined in Note 6 to Notes to Consolidated Financial Statements included in our Annual Report). The Australia DivestmentBusiness, which was sold on October 31, 2016 (see Note 10), met the criteria to be reported as held for sale beginning in the second quarter of 2016 and, therefore,the Australia Divestment Business was reflected in our Condensed Consolidated Balance Sheet as of September 30, 2016 at the lower of its carrying value or itsfair value (less costs to sell). This charge represents the excess of the carrying value of the Australia Divestment Business compared to its fair value (less costs tosell) as of September 30, 2016, based upon the sale price of the business.
Other, net for the nine months ended September 30, 2017 includes a gain of $38,869 associated with the Russia and Ukraine Divestment (see Note 10).
21
Table of Contents
IRON MOUNTAIN INCORPORATED
NOTES TO CONDENSED CONSOLIDATED FINANCIAL STATEMENTS (Continued)
(In Thousands, Except Share and Per Share Data)
(Unaudited)
(2) Summary of Significant Accounting Policies (Continued)
j. Property, Plant and Equipment and Long-Lived Assets
During the three and nine months ended September 30, 2016 , we capitalized $3,601 and $12,139 of costs, respectively, associated with the development ofinternal use computer software projects. During the three and nine months ended September 30, 2017, we capitalized $5,872 and $17,792 of costs, respectively,associated with the development of internal use computer software projects.
Consolidated gain on disposal/write-down of property, plant and equipment (excluding real estate), net for the three and nine months ended September 30,2016 was $54 and $1,131 , respectively, and $292 and $967 for the three and nine months ended September 30, 2017, respectively. These gains are primarilyassociated with the retirement of leased vehicles accounted for as capital lease assets within our North American Records and Information Management Businesssegment.
Consolidated gain on sale of real estate, net of tax, for the three and nine months ended September 30, 2016 was $325 associated with the sale of land in theUnited States and Canada. Consolidated gain on sale of real estate for the nine months ended September 30, 2017 was $925 , net of tax of $640 , and consisted ofthe sale of land and a building in the United States for net proceeds of approximately $12,700 .
k. New Accounting Pronouncements
Recently Adopted Accounting Pronouncements
In January 2017, the Financial Accounting Standards Board ("FASB") issued Accounting Standards Update ("ASU") No. 2017-04, Intangibles - Goodwilland Other (Topic 350): Simplifying the Test for Goodwill Impairment ("ASU 2017-04"). ASU 2017-04 modifies the process by which entities will test goodwill forimpairment. Under existing GAAP, when the carrying value of a reporting unit exceeds the reporting unit’s fair value, an entity would then proceed to a “Step 2”goodwill impairment analysis, which requires calculating the implied fair value of goodwill by assigning the fair value of a reporting unit to all of its assets andliabilities, as if that reporting unit had been acquired in a business combination. Under ASU 2017-04, a goodwill impairment will be the amount by which areporting unit’s carrying value exceeds its fair value, not to exceed the carrying value of the reporting unit’s goodwill. We adopted ASU 2017-04 in the first quarterof 2017. ASU 2017-04 did not impact our consolidated financial statements.
In January 2017, the FASB issued ASU No. 2017-01, Business Combinations (Topic 805): Clarifying the Definition of a Business ("ASU 2017-01"). ASU2017-01 provides greater clarity on the definition of a business to assist entities in evaluating whether transactions should be accounted for as an acquisition ordisposal of assets or businesses. We adopted ASU 2017-01 in the third quarter of 2017. ASU 2017-01 did not have a material impact on our consolidated financialstatements.
As Yet Adopted Accounting Pronouncements
a. ASU 2014-09
In May 2014, the FASB issued ASU No. 2014-09, Revenue from Contracts with Customers (Topic 606) ("ASU 2014-09"). ASU 2014-09 provides guidancefor management to reassess revenue recognition as it relates to: (1) transfer of control, (2) variable consideration, (3) allocation of transaction price based onrelative standalone selling price, (4) licenses, (5) time value of money, and (6) contract costs.
22
Table of Contents
IRON MOUNTAIN INCORPORATED
NOTES TO CONDENSED CONSOLIDATED FINANCIAL STATEMENTS (Continued)
(In Thousands, Except Share and Per Share Data)
(Unaudited)
(2) Summary of Significant Accounting Policies (Continued)
ASU 2014-09 will replace the current revenue recognition criteria under GAAP, including industry-specific requirements, and provide companies with asingle revenue recognition model for recognizing revenue from contracts with customers. The core principle of ASU 2014-09 is that a company should recognizerevenue to depict the transfer of promised goods or services to customers in an amount that reflects the consideration to which the company expects to be entitledin exchange for such goods or services. The two permitted transition methods under ASU 2014-09 are: (i) the full retrospective method, whereby ASU 2014-09would be applied to each prior reporting period presented and the cumulative effect of adoption would be recognized at the earliest period shown, or (ii) themodified retrospective method, whereby the cumulative effect of applying ASU 2014-09 would be recognized at the date of initial application. In August 2015, theFASB issued ASU No. 2015-14, Revenue from Contracts with Customers (Topic 606): Deferral of the Effective Date , which deferred the effective date of ASU2014-09 for one year, making ASU 2014-09 effective for us on January 1, 2018, with early adoption permitted as of January 1, 2017. We will adopt ASU 2014-09as of January 1, 2018 using the modified retrospective method.
During 2015, we established a project team responsible for the assessment and implementation of ASU 2014-09. We utilized a bottoms-up approach toanalyze the impact of ASU 2014-09 on our contracts with customers by reviewing our current accounting policies and practices to identify potential differencesthat would result from applying the requirements of ASU 2014-09 to our contracts with customers. We are currently in the process of designing and implementingappropriate changes to our business processes, systems and controls to support the accounting and the financial disclosure requirements under ASU 2014-09. Wehave been closely monitoring the FASB activity related to specific interpretative issues pertaining to ASU 2014-09. During the second half of 2016, wesubstantially completed our evaluation of the potential changes resulting from the adoption of ASU 2014-09 on our accounting and the financial disclosurerequirements and are currently assessing the quantification of the impacts of adopting ASU 2014-09 on our consolidated financial statements, the more significantof which are discussed below. Based on our analysis to date, we expect that the most significant impacts associated with adopting ASU 2014-09 compared tocurrent GAAP will relate to (i) the deferral of certain commissions related to our long-term storage contracts (“Accounting for Commissions”) and (ii) certainpolicy changes related to initial moves of physical storage (“Accounting for Initial Moves”).
i. Accounting for Commissions
Under current GAAP, commissions that we pay related to our long-term storage contracts are expensed as incurred. Under ASU 2014-09, however, certaincommissions will be capitalized and amortized over the period of expected earned revenue. In the year of adoption, this will result in increased contract assets onour Consolidated Balance Sheet, a reduction in selling, general and administrative expenses and a corresponding increase in amortization expense (assumingconsistent levels of spending up through the adoption date) on our Consolidated Statement of Operations and an increase in cash flows from operating activitiesand a corresponding increase in cash used for investing activities on our Consolidated Statement of Cash Flows.
ii. Accounting for Initial Moves
Under current GAAP, intake costs incurred but not charged to a customer to transport records to our facilities, which include labor and transportation costs,are capitalized and amortized as a component of depreciation and amortization in our Consolidated Statements of Operations. Under ASU 2014-09, however, therevenue and costs associated with all initial moves of physical storage, regardless of whether or not the services associated with such initial moves are provided tothe customer at no charge, will be deferred and recognized over the period consistent with the transfer of the service to the customer to which the asset relates. Inthe year of adoption, this will result in decreased assets and increased deferred revenue on our Consolidated Balance Sheet, a reduction in cost of sales and acorresponding increase in amortization expense (assuming consistent levels of initial move spending through the adoption date) on our Consolidated Statement ofOperations and an increase in cash flows from operating activities and a corresponding increase in cash used for investing activities on our Consolidated Statementof Cash Flows.
23
Table of Contents
IRON MOUNTAIN INCORPORATED
NOTES TO CONDENSED CONSOLIDATED FINANCIAL STATEMENTS (Continued)
(In Thousands, Except Share and Per Share Data)
(Unaudited)
(2) Summary of Significant Accounting Policies (Continued)
b. Other As Yet Adopted Accounting Pronouncements
In January 2016, the FASB issued ASU No. 2016-01, Financial Instruments - Overall (Subtopic 825-10): Recognition and Measurement of Financial Assetsand Financial Liabilities ("ASU 2016-01"). ASU 2016-01 requires that most equity investments be measured at fair value, with subsequent changes in fair valuerecognized in net income, while eliminating the available-for-sale classification for equity securities with readily determinable fair values and the cost method forequity investments without readily determinable fair values. ASU 2016-01 also impacts financial liabilities under the fair value option and the presentation anddisclosure requirements for financial instruments. ASU 2016-01 is effective for us on January 1, 2018. We will adopt ASU 2016-01 on January 1, 2018 and arecurrently evaluating the impact ASU 2016-01 will have on our consolidated financial statements.
In February 2016, the FASB issued ASU No. 2016-02, Leases (Topic 842) ("ASU 2016-02"). ASU 2016-02 requires lessees to recognize assets and liabilitieson the balance sheet for the rights and obligations created by all leases with terms of more than 12 months. ASU 2016-02 also will require certain qualitative andquantitative disclosures designed to give financial statement users information on the amount, timing, and uncertainty of cash flows arising from leases. ASU2016-02 will be effective for us on January 1, 2019, with early adoption permitted. We will adopt ASU 2016-02 on January 1, 2019 and are currently evaluatingthe impact ASU 2016-02 will have on our consolidated financial statements.
In November 2016, the FASB issued ASU No. 2016-18, Statement of Cash Flows (Topic 230): Restricted Cash ("ASU 2016-18"). ASU 2016-18 providesguidance on the classification of restricted cash in the statement of cash flows. ASU 2016-18 is effective for us on January 1, 2018, with early adoption permittedand is required to be adopted on a retrospective basis. We do not believe that the adoption of ASU 2016-18 will have a material impact on our consolidatedfinancial statements.
In August 2017, the FASB issued ASU No. 2017-12, Derivatives and Hedging (Topic 815): Targeted Improvements to Accounting for Hedging Activities("ASU 2017-12"). ASU 2017-12 amends the hedge accounting recognition and presentation requirements as outlined in Accounting Standards Codification Topic815 with the objective of improving the financial reporting of hedging relationships to better portray the economic results of an entity’s risk management activitiesin its financial statements and enhance the transparency and understandability of hedge transactions. In addition, ASU 2017-12 makes improvements to simplifythe application of the hedge accounting guidance. ASU 2017-12 is effective for us on January 1, 2019, with early adoption permitted. We are currently evaluatingthe impact ASU 2017-12 will have on our consolidated financial statements.
24
Table of Contents
IRON MOUNTAIN INCORPORATED
NOTES TO CONDENSED CONSOLIDATED FINANCIAL STATEMENTS (Continued)
(In Thousands, Except Share and Per Share Data)
(Unaudited)
(3) Derivative Instruments and Hedging Activities
Historically, we have entered into forward contracts to hedge our exposures associated with certain foreign currencies. At the maturity of the forwardcontracts, we may enter into new forward contracts to hedge movements in the underlying currencies. At the time of settlement, we either pay or receive the netsettlement amount from the forward contract and recognize this amount in Other expense (income), net in the Consolidated Statements of Operations as a realizedforeign exchange gain or loss. At the end of each month, we mark the outstanding forward contracts to market and record an unrealized foreign exchange gain orloss for the mark-to-market valuation. We have not designated any of the forward contracts we have entered into as hedges. Our policy is to record the fair value ofeach derivative instrument on a gross basis. As of December 31, 2016 , we had no forward contracts outstanding. As of September 30, 2017 , we had outstandingforward contracts to purchase 135,000 Euros and sell $159,591 United States dollars to hedge our foreign exchange exposures associated with the Euro. As ofSeptember 30, 2017, we recorded a derivative asset of $808 as a component of Prepaid expenses and other on our Condensed Consolidated Balance Sheet,associated with open forward contracts as of September 30, 2017. During the three and nine months ended September 30, 2016, there were no cash receipts orpayments included in cash from operating activities from continuing operations related to settlements associated with foreign currency forward contracts. Duringthe three and nine months ended September 30, 2017, cash receipts included in cash from operating activities from continuing operations related to settlementsassociated with foreign currency forward contracts was $7,643 and $8,536 , respectively.
We have designated a portion of our (i) Euro denominated borrowings by IMI under our Former Revolving Credit Facility and (ii) Euro Notes (as defined inNote 5) as a hedge of net investment of certain of our Euro denominated subsidiaries. For the nine months ended September 30, 2016, we designated, on average,29,858 Euros of our Euro denominated borrowings by IMI under our Former Revolving Credit Facility as a hedge of net investment of certain of our Eurodenominated subsidiaries. For the nine months ended September 30, 2017, we designated, on average, 84,443 Euros of our Euro denominated borrowings by IMIunder our Former Revolving Credit Facility and Euro Notes as a hedge of net investment of certain of our Euro denominated subsidiaries. As a result, we recordedthe following foreign exchange gains (losses), net of tax, related to the change in fair value of such debt due to currency translation adjustments, which is acomponent of accumulated other comprehensive items, net:
Three Months Ended
September 30, Nine Months Ended
September 30,
2016 2017 2016 2017
Foreign exchange (losses) gains $ (313) $ (4,211) $ (901) $ (12,359)Less: Tax (benefit) expense on foreignexchange (losses) gains — — — —
Foreign exchange (losses) gains, net of tax $ (313) $ (4,211) $ (901) $ (12,359)
As of September 30, 2017 , cumulative net gains of $5,844 , net of tax, are recorded in accumulated other comprehensive items, net associated with this netinvestment hedge.
25
Table of Contents
IRON MOUNTAIN INCORPORATED
NOTES TO CONDENSED CONSOLIDATED FINANCIAL STATEMENTS (Continued)
(In Thousands, Except Share and Per Share Data)
(Unaudited)
(4) Acquisitions
We account for acquisitions using the acquisition method of accounting, and, accordingly, the assets and liabilities acquired are recorded at their estimatedfair values and the results of operations for each acquisition have been included in our consolidated results from their respective acquisition dates. Cashconsideration for our various acquisitions completed in 2017 was primarily provided through cash flows from operating activities and borrowings, as well as cashand cash equivalents on-hand.
a. Acquisition of Recall in 2016
On May 2, 2016 (Sydney, Australia time), we completed the Recall Transaction. At the closing of the Recall Transaction, we paid approximately $331,800 incash and issued 50,233,412 shares of our common stock which, based on the closing price of our common stock as of April 29, 2016 (the last day of trading on theNew York Stock Exchange ("NYSE") prior to the closing of the Recall Transaction) of $36.53 per share, resulted in a total purchase price to Recall shareholders ofapproximately $2,166,900 .
In connection with the acquisition of Recall, we sought regulatory approval of the Recall Transaction from the United States Department of Justice (the“DOJ”), the Australian Competition and Consumer Commission (the “ACCC”), the Canada Competition Bureau (the “CCB”) and the United KingdomCompetition and Markets Authority (the “CMA”).
As part of the regulatory approval process, we agreed to make certain divestments in order to address competition concerns raised by the DOJ, the ACCC, theCCB and the CMA in respect of the Recall Transaction (the “Divestments”). The Divestments, all of which were completed during the year ended December 31,2016, are defined in Note 6 to Notes to Consolidated Financial Statements included in our Annual Report and are described in greater detail within that note, aswell as within Note 10 in this Quarterly Report, were as follows:
i. United States• The Initial United States Divestments• The Seattle/Atlanta Divestments
ii. Australia• The Australia Divestment Business
iii. Canada• The Recall Canadian Divestments• The Iron Mountain Canadian Divestments
iv. United Kingdom• The UK Divestments
26
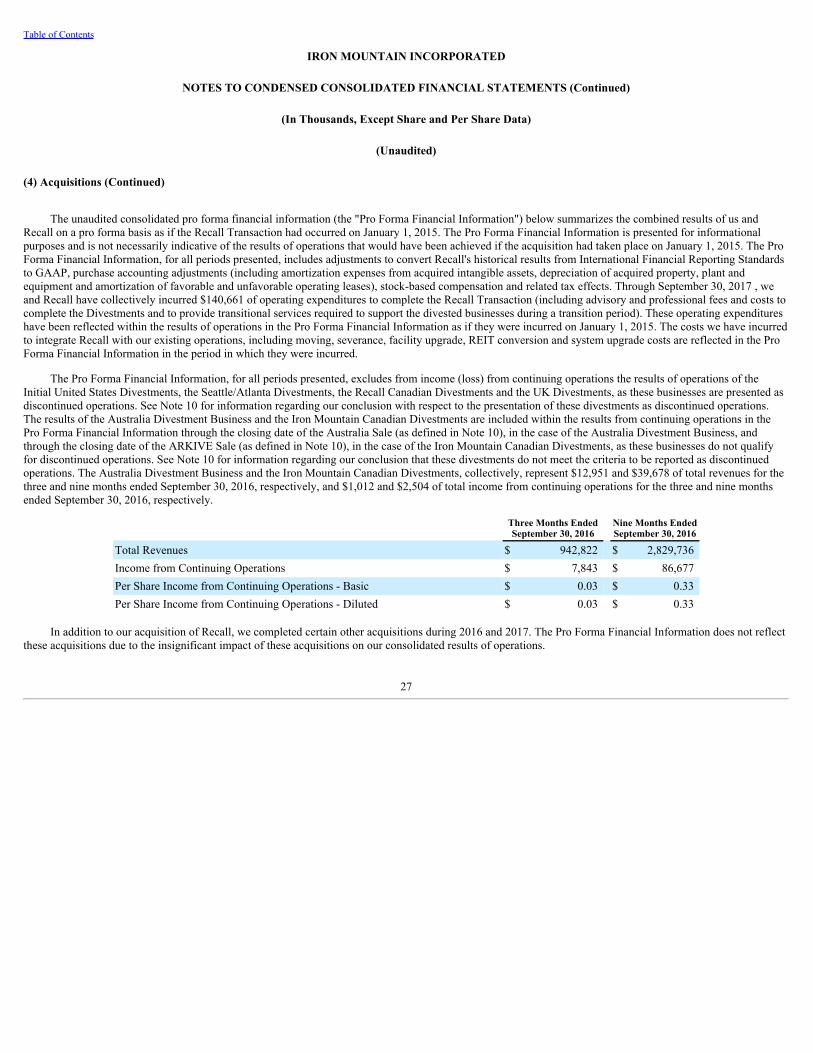
Table of Contents
IRON MOUNTAIN INCORPORATED
NOTES TO CONDENSED CONSOLIDATED FINANCIAL STATEMENTS (Continued)
(In Thousands, Except Share and Per Share Data)
(Unaudited)
(4) Acquisitions (Continued)
The unaudited consolidated pro forma financial information (the "Pro Forma Financial Information") below summarizes the combined results of us andRecall on a pro forma basis as if the Recall Transaction had occurred on January 1, 2015. The Pro Forma Financial Information is presented for informationalpurposes and is not necessarily indicative of the results of operations that would have been achieved if the acquisition had taken place on January 1, 2015. The ProForma Financial Information, for all periods presented, includes adjustments to convert Recall's historical results from International Financial Reporting Standardsto GAAP, purchase accounting adjustments (including amortization expenses from acquired intangible assets, depreciation of acquired property, plant andequipment and amortization of favorable and unfavorable operating leases), stock-based compensation and related tax effects. Through September 30, 2017 , weand Recall have collectively incurred $140,661 of operating expenditures to complete the Recall Transaction (including advisory and professional fees and costs tocomplete the Divestments and to provide transitional services required to support the divested businesses during a transition period). These operating expenditureshave been reflected within the results of operations in the Pro Forma Financial Information as if they were incurred on January 1, 2015. The costs we have incurredto integrate Recall with our existing operations, including moving, severance, facility upgrade, REIT conversion and system upgrade costs are reflected in the ProForma Financial Information in the period in which they were incurred.
The Pro Forma Financial Information, for all periods presented, excludes from income (loss) from continuing operations the results of operations of theInitial United States Divestments, the Seattle/Atlanta Divestments, the Recall Canadian Divestments and the UK Divestments, as these businesses are presented asdiscontinued operations. See Note 10 for information regarding our conclusion with respect to the presentation of these divestments as discontinued operations.The results of the Australia Divestment Business and the Iron Mountain Canadian Divestments are included within the results from continuing operations in thePro Forma Financial Information through the closing date of the Australia Sale (as defined in Note 10), in the case of the Australia Divestment Business, andthrough the closing date of the ARKIVE Sale (as defined in Note 10), in the case of the Iron Mountain Canadian Divestments, as these businesses do not qualifyfor discontinued operations. See Note 10 for information regarding our conclusion that these divestments do not meet the criteria to be reported as discontinuedoperations. The Australia Divestment Business and the Iron Mountain Canadian Divestments, collectively, represent $12,951 and $39,678 of total revenues for thethree and nine months ended September 30, 2016, respectively, and $1,012 and $2,504 of total income from continuing operations for the three and nine monthsended September 30, 2016, respectively.
Three Months EndedSeptember 30, 2016
Nine Months EndedSeptember 30, 2016
Total Revenues $ 942,822 $ 2,829,736Income from Continuing Operations $ 7,843 $ 86,677Per Share Income from Continuing Operations - Basic $ 0.03 $ 0.33Per Share Income from Continuing Operations - Diluted $ 0.03 $ 0.33
In addition to our acquisition of Recall, we completed certain other acquisitions during 2016 and 2017. The Pro Forma Financial Information does not reflectthese acquisitions due to the insignificant impact of these acquisitions on our consolidated results of operations.
27
Table of Contents
IRON MOUNTAIN INCORPORATED
NOTES TO CONDENSED CONSOLIDATED FINANCIAL STATEMENTS (Continued)
(In Thousands, Except Share and Per Share Data)
(Unaudited)
(4) Acquisitions (Continued)
b. Other Noteworthy Acquisitions
In November 2016, we entered into a binding agreement to acquire the information management assets and operations of Santa Fe Group A/S ("Santa Fe") inten regions within Europe and Asia in order to expand our presence in southeast Asia and western Europe. In December 2016, we acquired the informationmanagement assets and operations of Santa Fe in Hong Kong, Malaysia, Singapore, Spain and Taiwan (the “2016 Santa Fe Transaction”) for approximately 15,200Euros (approximately $16,000 , based upon the exchange rate between the United States dollar and the Euro as of December 30, 2016, the closing date of the 2016Santa Fe Transaction). Of the total purchase price, 13,500 Euros (or approximately $14,200 , based upon the exchange rate between the United States dollar andthe Euro on the closing date of the 2016 Santa Fe Transaction) was paid during the year ended December 31, 2016, and the remaining balance is due on the 18-month anniversary of the closing of the 2016 Santa Fe Transaction. During the first half of 2017, we acquired, in two separate transactions, (i) the informationmanagement assets and operations of Santa Fe in Macau and South Korea, and (ii) the information management assets and operations of Santa Fe in India,Indonesia and the Philippines (collectively, the “2017 Santa Fe Transaction”) for an aggregate purchase price of approximately 11,700 Euros (or approximately$13,000 , based upon the exchange rate between the United States dollar and the Euro on the closing dates of the respective transactions).
In June 2017, in order to expand our presence in Peru, we acquired the information management assets and operations of Ransa Comercial, S.A. andDepositos, S.A. (the "Ransa and Depositos Transaction"), two records and information management companies with operations in Peru, for approximately $14,700.
In July 2017, in order to expand our European operations, we acquired Fileminders Ltd., a storage and records management company with operations inCyprus (the "Fileminders Transaction"), for approximately 24,900 Euros (or approximately $28,500 , based upon the exchange rate between the United Statesdollar and the Euro on the closing date of the acquisition).
In September 2017, in order to expand our data center operations in the United States, we acquired Mag Datacenters LLC, which operates Fortrust LLC("Fortrust"), a private data center business with operations in Denver, Colorado (the “Fortrust Transaction”). At the closing of the Fortrust Transaction, we paidapproximately $54,500 in cash (the "Fortrust Cash Consideration") and issued 2,193,637 shares of our common stock (the "Fortrust Stock Consideration"). Theshares of our common stock issued to the former owners of Fortrust in connection with the Fortrust Transaction contain certain restrictions that impact themarketability of such shares for a period of six months following the closing date of the Fortrust Transaction (the “Lack of Marketability Restriction”). The2,193,637 shares issued as part of the Fortrust Stock Consideration were valued at approximately $37.84 per share, which represents the closing price of ourcommon stock as of August 31, 2017 (the last day of trading on the NYSE prior to the closing of the Fortrust Transaction), discounted for the Lack ofMarketability Restriction, resulting in a total purchase price (including the Fortrust Cash Consideration and the Fortrust Stock Consideration) of approximately$137,500 .
In September 2017, in order to expand our existing entertainment services operations in the United States and to expand our entertainment services operations
into Canada, France, Hong Kong, the Netherlands and the United Kingdom, we acquired Bonded Services of America, Inc. and Bonded Services Acquisition, Ltd.,providers of media asset management services for global entertainment and media companies (the “Bonded Transaction”), for approximately 62,000 Britishpounds sterling (or approximately $83,000 , based upon the exchange rate between the British pound sterling and the United States dollar on September 29, 2017,the closing date of the Bonded Transaction).
In addition to the transactions noted above, during 2017, in order to enhance our existing operations in the United States, Greece and South Africa and toexpand our operations into the United Arab Emirates, we completed the acquisition of three storage and records management companies, one storage and datamanagement company and one art storage company for total consideration of approximately $15,100 . The individual purchase prices of these acquisitions rangedfrom approximately $1,400 to approximately $4,400 .
28
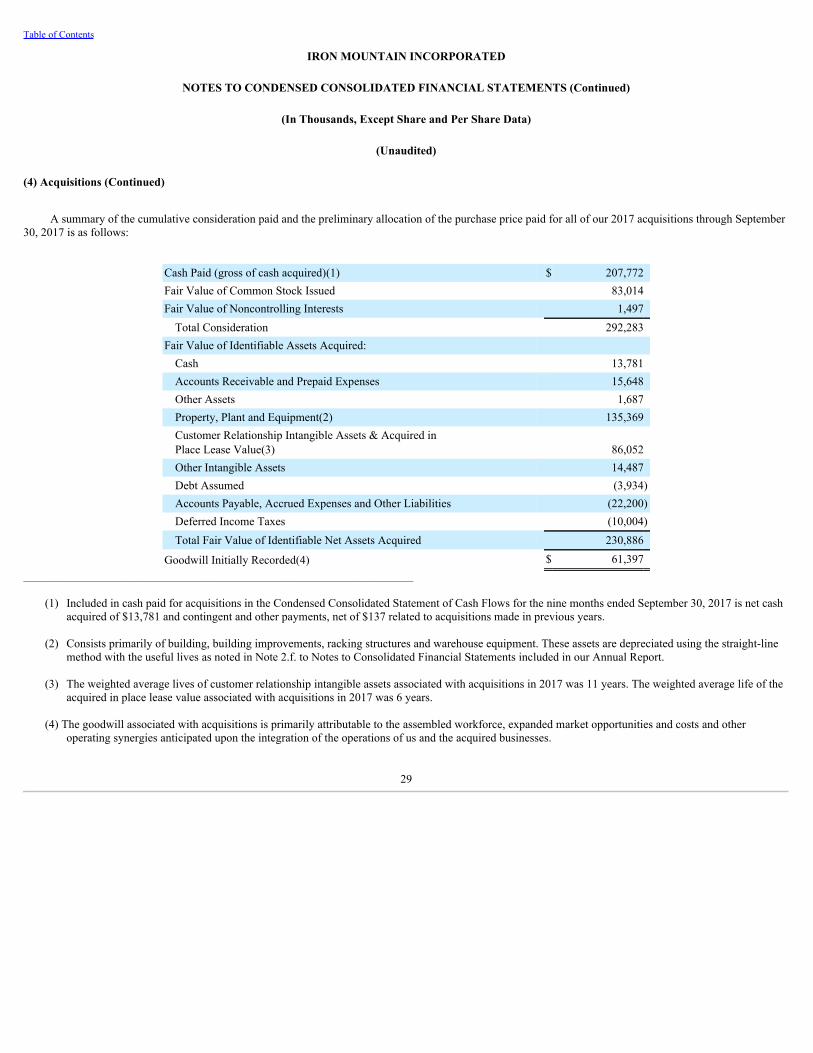
Table of Contents
IRON MOUNTAIN INCORPORATED
NOTES TO CONDENSED CONSOLIDATED FINANCIAL STATEMENTS (Continued)
(In Thousands, Except Share and Per Share Data)
(Unaudited)
(4) Acquisitions (Continued)
A summary of the cumulative consideration paid and the preliminary allocation of the purchase price paid for all of our 2017 acquisitions through September30, 2017 is as follows:
Cash Paid (gross of cash acquired)(1) $ 207,772Fair Value of Common Stock Issued 83,014Fair Value of Noncontrolling Interests 1,497Total Consideration 292,283
Fair Value of Identifiable Assets Acquired: Cash 13,781Accounts Receivable and Prepaid Expenses 15,648Other Assets 1,687Property, Plant and Equipment(2) 135,369Customer Relationship Intangible Assets & Acquired inPlace Lease Value(3) 86,052Other Intangible Assets 14,487Debt Assumed (3,934)Accounts Payable, Accrued Expenses and Other Liabilities (22,200)Deferred Income Taxes (10,004)Total Fair Value of Identifiable Net Assets Acquired 230,886
Goodwill Initially Recorded(4) $ 61,397_______________________________________________________________________________
(1) Included in cash paid for acquisitions in the Condensed Consolidated Statement of Cash Flows for the nine months ended September 30, 2017 is net cashacquired of $13,781 and contingent and other payments, net of $137 related to acquisitions made in previous years.
(2) Consists primarily of building, building improvements, racking structures and warehouse equipment. These assets are depreciated using the straight-linemethod with the useful lives as noted in Note 2.f. to Notes to Consolidated Financial Statements included in our Annual Report.
(3) The weighted average lives of customer relationship intangible assets associated with acquisitions in 2017 was 11 years. The weighted average life of theacquired in place lease value associated with acquisitions in 2017 was 6 years.
(4) The goodwill associated with acquisitions is primarily attributable to the assembled workforce, expanded market opportunities and costs and otheroperating synergies anticipated upon the integration of the operations of us and the acquired businesses.
29
Table of Contents
IRON MOUNTAIN INCORPORATED
NOTES TO CONDENSED CONSOLIDATED FINANCIAL STATEMENTS (Continued)
(In Thousands, Except Share and Per Share Data)
(Unaudited)
(4) Acquisitions (Continued)
Allocations of the purchase price for acquisitions made in 2016 and 2017 were based on estimates of the fair value of the net assets acquired and are subjectto adjustment upon the finalization of the purchase price allocations. The accounting for business combinations requires estimates and judgments as to expectationsfor future cash flows of the acquired business, and the allocations of those cash flows to identifiable tangible and intangible assets, in determining the assetsacquired and liabilities assumed. The fair values assigned to tangible and intangible assets acquired and liabilities assumed, including contingent consideration, arebased on management's best estimates and assumptions, as well as other information compiled by management, including valuations that utilize customaryvaluation procedures and techniques. The estimates and assumptions underlying the initial valuations are subject to the collection of information necessary tocomplete the valuations within the measurement periods, which are up to one year from the respective acquisition dates. The preliminary purchase price allocationsthat are not finalized as of September 30, 2017 primarily relate to the final assessment of the fair values of intangible assets (primarily customer relationshipintangible assets and acquired in-place lease value), property, plant and equipment (primarily building, building improvements and racking structures), operatingleases, contingencies and income taxes (primarily deferred income taxes), primarily associated with the 2017 Santa Fe Transaction, the Ransa and DepositosTransaction, the Fileminders Transaction, the Fortrust Transaction, the Bonded Transaction, as well as other acquisitions which closed in 2017.
As the valuation of certain assets and liabilities for purposes of purchase price allocations are preliminary in nature, they are subject to adjustment asadditional information is obtained about the facts and circumstances regarding these assets and liabilities that existed at the acquisition date. Any adjustments toour estimates of purchase price allocation will be made in the periods in which the adjustments are determined and the cumulative effect of such adjustments willbe calculated as if the adjustments had been completed as of the acquisition dates. Adjustments recorded during the three and nine months ended September 30,2017 were not material to our results from operations.
30
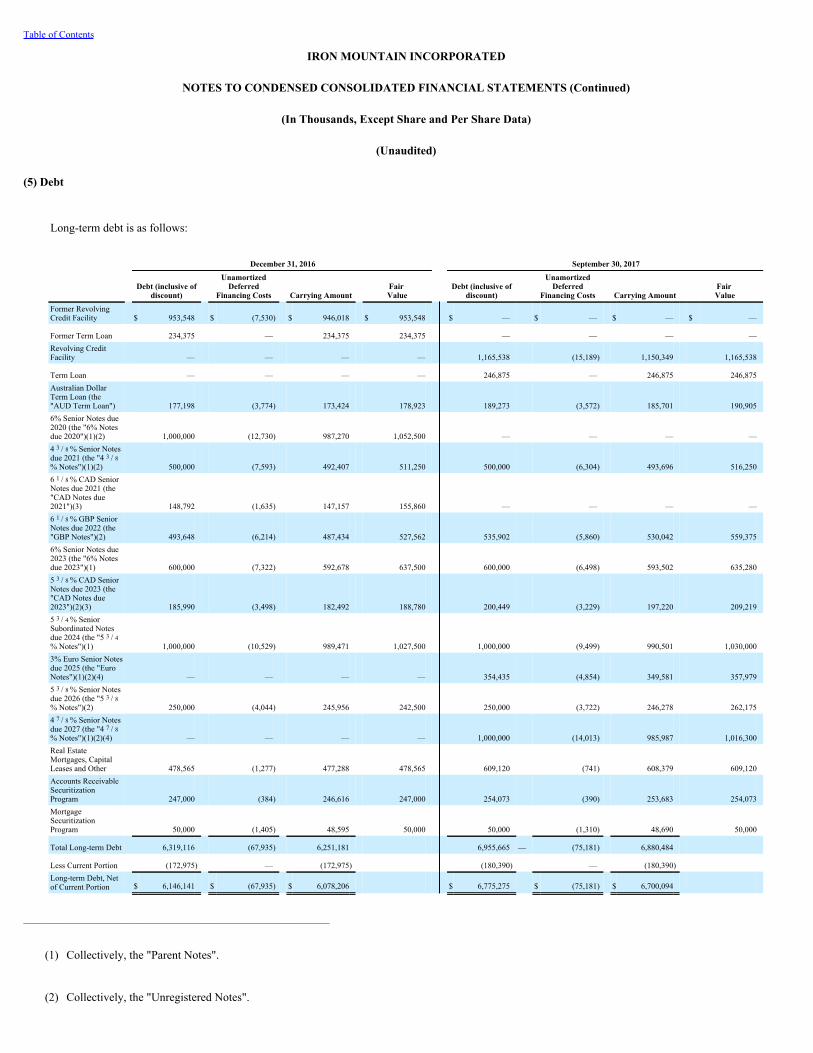
Table of Contents
IRON MOUNTAIN INCORPORATED
NOTES TO CONDENSED CONSOLIDATED FINANCIAL STATEMENTS (Continued)
(In Thousands, Except Share and Per Share Data)
(Unaudited)
(5) Debt
Long-term debt is as follows:
December 31, 2016 September 30, 2017
Debt (inclusive ofdiscount)
UnamortizedDeferred
Financing Costs Carrying Amount Fair Value Debt (inclusive of
discount) Unamortized
DeferredFinancing Costs Carrying Amount
Fair Value
Former RevolvingCredit Facility $ 953,548 $ (7,530) $ 946,018 $ 953,548 $ — $ — $ — $ —
Former Term Loan 234,375 — 234,375 234,375 — — — —Revolving CreditFacility — — — — 1,165,538 (15,189) 1,150,349 1,165,538
Term Loan — — — — 246,875 — 246,875 246,875Australian DollarTerm Loan (the"AUD Term Loan") 177,198 (3,774) 173,424 178,923 189,273 (3,572) 185,701 190,9056% Senior Notes due2020 (the "6% Notesdue 2020")(1)(2) 1,000,000 (12,730) 987,270 1,052,500 — — — —4 3 / 8 % Senior Notesdue 2021 (the "4 3 / 8% Notes")(1)(2) 500,000 (7,593) 492,407 511,250 500,000 (6,304) 493,696 516,2506 1 / 8 % CAD SeniorNotes due 2021 (the"CAD Notes due2021")(3) 148,792 (1,635) 147,157 155,860 — — — —6 1 / 8 % GBP SeniorNotes due 2022 (the"GBP Notes")(2) 493,648 (6,214) 487,434 527,562 535,902 (5,860) 530,042 559,3756% Senior Notes due2023 (the "6% Notesdue 2023")(1) 600,000 (7,322) 592,678 637,500 600,000 (6,498) 593,502 635,2805 3 / 8 % CAD SeniorNotes due 2023 (the"CAD Notes due2023")(2)(3) 185,990 (3,498) 182,492 188,780 200,449 (3,229) 197,220 209,2195 3 / 4 % SeniorSubordinated Notesdue 2024 (the "5 3 / 4% Notes")(1) 1,000,000 (10,529) 989,471 1,027,500 1,000,000 (9,499) 990,501 1,030,0003% Euro Senior Notesdue 2025 (the "EuroNotes")(1)(2)(4) — — — — 354,435 (4,854) 349,581 357,9795 3 / 8 % Senior Notesdue 2026 (the "5 3 / 8% Notes")(2) 250,000 (4,044) 245,956 242,500 250,000 (3,722) 246,278 262,1754 7 / 8 % Senior Notesdue 2027 (the "4 7 / 8% Notes")(1)(2)(4) — — — — 1,000,000 (14,013) 985,987 1,016,300Real EstateMortgages, CapitalLeases and Other 478,565 (1,277) 477,288 478,565 609,120 (741) 608,379 609,120Accounts ReceivableSecuritizationProgram 247,000 (384) 246,616 247,000 254,073 (390) 253,683 254,073MortgageSecuritizationProgram 50,000 (1,405) 48,595 50,000 50,000 (1,310) 48,690 50,000
Total Long-term Debt 6,319,116 (67,935) 6,251,181 6,955,665 — (75,181) 6,880,484
Less Current Portion (172,975) — (172,975) (180,390) — (180,390) Long-term Debt, Netof Current Portion $ 6,146,141 $ (67,935) $ 6,078,206 $ 6,775,275 $ (75,181) $ 6,700,094
______________________________________________________________
(1) Collectively, the "Parent Notes".
(2) Collectively, the "Unregistered Notes".

31
Table of Contents
IRON MOUNTAIN INCORPORATED
NOTES TO CONDENSED CONSOLIDATED FINANCIAL STATEMENTS (Continued)
(In Thousands, Except Share and Per Share Data)
(Unaudited)
(5) Debt (Continued)
(3) Collectively, the "CAD Notes".
(4) The fair value (Level 1 of fair value hierarchy described in Note 2.s. to Notes to Consolidated Financial Statements included in our Annual Report) of theEuro Notes and the 4 7 / 8 % Notes is based upon quoted market prices for the Euro Notes and the 4 7 / 8 % Notes on September 30, 2017.
See Note 4 to Notes to Consolidated Financial Statements included in our Annual Report for additional information regarding our long-term debt, includingthe direct obligors of each of our debt instruments as well as information regarding the fair value of our debt instruments (including the levels of the fair valuehierarchy used to determine the fair value of our debt instruments). The levels of the fair value hierarchy used to determine the fair value of our debt as ofSeptember 30, 2017 are consistent with the levels of the fair value hierarchy used to determine the fair value of our debt as of December 31, 2016 (which aredisclosed in our Annual Report). Additionally, see Note 6 for information regarding which of our consolidated subsidiaries guarantee certain of our debtinstruments.
a. Credit Agreement
On August 21, 2017, we entered into a new credit agreement (the "Credit Agreement") which amended and restated our then existing credit agreement (the"Former Credit Agreement") which consisted of a revolving credit facility (the "Former Revolving Credit Facility") and a term loan (the "Former Term Loan") andwas scheduled to terminate on July 6, 2019. The Credit Agreement consists of a revolving credit facility (the "Revolving Credit Facility") and a term loan (the"Term Loan"). The maximum amount permitted to be borrowed under the Revolving Credit Facility is $1,750,000 . The original amount of the Term Loan is$250,000 . We have the option to request additional commitments of up to $500,000 , in the form of term loans or through increased commitments under theRevolving Credit Facility, subject to the conditions specified in the Credit Agreement. The Credit Agreement is scheduled to mature on August 21, 2022, at whichpoint all obligations become due.
The Revolving Credit Facility is supported by a group of 24 banks and enables IMI and certain of its United States and foreign subsidiaries to borrow inUnited States dollars and (subject to sublimits) a variety of other currencies (including Canadian dollars, British pounds sterling and Euros, among othercurrencies) in an aggregate outstanding amount not to exceed $1,750,000 . The Term Loan is to be paid in quarterly installments in an amount equal to $3,125 perquarter, with the remaining balance due on August 21, 2022.
The interest rate on borrowings under the Credit Agreement varies depending on our choice of interest rate and currency options, plus an applicable margin,which varies based on our consolidated leverage ratio. Additionally, the Credit Agreement requires the payment of a commitment fee on the unused portion of theRevolving Credit Facility, which fee ranges from between 0.25% to 0.4% based on our consolidated leverage ratio and fees associated with outstanding letters ofcredit. As of September 30, 2017, we had $1,165,538 and $246,875 of outstanding borrowings under the Revolving Credit Facility and the Term Loan,respectively. Of the $1,165,538 of outstanding borrowings under the Revolving Credit Facility, $939,800 was denominated in United States dollars, 140,600 wasdenominated in Canadian dollars and 95,650 was denominated in Euros. In addition, we also had various outstanding letters of credit totaling $53,646 . Theremaining amount available for borrowing under the Revolving Credit Facility as of September 30, 2017, which is based on IMI's leverage ratio, the last 12 months' earnings before interest, taxes, depreciation and amortization and rent expense ("EBITDAR"), other adjustments as defined in the Credit Agreement andcurrent external debt, was $530,816 (which amount represents the maximum availability as of such date). The average interest rate in effect under the CreditAgreement was 3.2% as of September 30, 2017 . The average interest rate in effect under the Revolving Credit Facility was 3.2% and ranged from 2.0% to 5.3% asof September 30, 2017 and the interest rate in effect under the Term Loan as of September 30, 2017 was 3.2% .
32
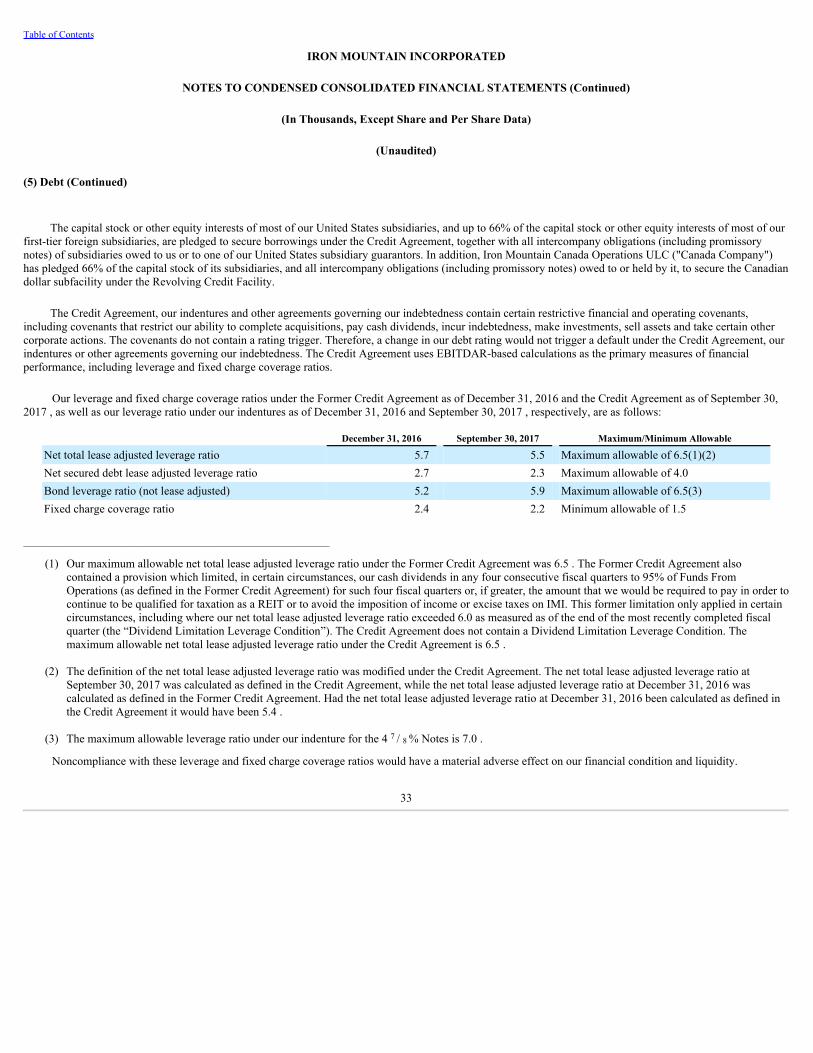
Table of Contents
IRON MOUNTAIN INCORPORATED
NOTES TO CONDENSED CONSOLIDATED FINANCIAL STATEMENTS (Continued)
(In Thousands, Except Share and Per Share Data)
(Unaudited)
(5) Debt (Continued)
The capital stock or other equity interests of most of our United States subsidiaries, and up to 66% of the capital stock or other equity interests of most of ourfirst-tier foreign subsidiaries, are pledged to secure borrowings under the Credit Agreement, together with all intercompany obligations (including promissorynotes) of subsidiaries owed to us or to one of our United States subsidiary guarantors. In addition, Iron Mountain Canada Operations ULC ("Canada Company")has pledged 66% of the capital stock of its subsidiaries, and all intercompany obligations (including promissory notes) owed to or held by it, to secure the Canadiandollar subfacility under the Revolving Credit Facility.
The Credit Agreement, our indentures and other agreements governing our indebtedness contain certain restrictive financial and operating covenants,including covenants that restrict our ability to complete acquisitions, pay cash dividends, incur indebtedness, make investments, sell assets and take certain othercorporate actions. The covenants do not contain a rating trigger. Therefore, a change in our debt rating would not trigger a default under the Credit Agreement, ourindentures or other agreements governing our indebtedness. The Credit Agreement uses EBITDAR-based calculations as the primary measures of financialperformance, including leverage and fixed charge coverage ratios.
Our leverage and fixed charge coverage ratios under the Former Credit Agreement as of December 31, 2016 and the Credit Agreement as of September 30,2017 , as well as our leverage ratio under our indentures as of December 31, 2016 and September 30, 2017 , respectively, are as follows:
December 31, 2016 September 30, 2017 Maximum/Minimum Allowable
Net total lease adjusted leverage ratio 5.7 5.5 Maximum allowable of 6.5(1)(2)Net secured debt lease adjusted leverage ratio 2.7 2.3 Maximum allowable of 4.0Bond leverage ratio (not lease adjusted) 5.2 5.9 Maximum allowable of 6.5(3)Fixed charge coverage ratio 2.4 2.2 Minimum allowable of 1.5
______________________________________________________________
(1) Our maximum allowable net total lease adjusted leverage ratio under the Former Credit Agreement was 6.5 . The Former Credit Agreement alsocontained a provision which limited, in certain circumstances, our cash dividends in any four consecutive fiscal quarters to 95% of Funds FromOperations (as defined in the Former Credit Agreement) for such four fiscal quarters or, if greater, the amount that we would be required to pay in order tocontinue to be qualified for taxation as a REIT or to avoid the imposition of income or excise taxes on IMI. This former limitation only applied in certaincircumstances, including where our net total lease adjusted leverage ratio exceeded 6.0 as measured as of the end of the most recently completed fiscalquarter (the “Dividend Limitation Leverage Condition”). The Credit Agreement does not contain a Dividend Limitation Leverage Condition. Themaximum allowable net total lease adjusted leverage ratio under the Credit Agreement is 6.5 .
(2) The definition of the net total lease adjusted leverage ratio was modified under the Credit Agreement. The net total lease adjusted leverage ratio atSeptember 30, 2017 was calculated as defined in the Credit Agreement, while the net total lease adjusted leverage ratio at December 31, 2016 wascalculated as defined in the Former Credit Agreement. Had the net total lease adjusted leverage ratio at December 31, 2016 been calculated as defined inthe Credit Agreement it would have been 5.4 .
(3) The maximum allowable leverage ratio under our indenture for the 4 7 / 8 % Notes is 7.0 .
Noncompliance with these leverage and fixed charge coverage ratios would have a material adverse effect on our financial condition and liquidity.
33
Table of Contents
IRON MOUNTAIN INCORPORATED
NOTES TO CONDENSED CONSOLIDATED FINANCIAL STATEMENTS (Continued)
(In Thousands, Except Share and Per Share Data)
(Unaudited)
(5) Debt (Continued)
b. Australian Dollar Term Loan
On September 28, 2016, Iron Mountain Australia Group Pty. Ltd., a wholly owned subsidiary of IMI, entered into a 250,000 Australian dollar SyndicatedTerm Loan B Facility (the "AUD Term Loan"), which matures in September 2022. The AUD Term Loan was issued at 99% of par. The net proceeds ofapproximately 243,750 Australian dollars (or approximately $185,800 , based upon the exchange rate between the Australian dollar and the United States dollar onSeptember 28, 2016 (the settlement date for the AUD Term Loan)), after paying commissions to the joint lead arrangers and net of the original discount, were usedto repay outstanding borrowings under the Former Revolving Credit Facility and for general corporate purposes.
Principal payments on the AUD Term Loan are to be paid in quarterly installments in an amount equivalent to an aggregate of 6,250 Australian dollars peryear, with the remaining balance due on September 28, 2022. The AUD Term Loan is secured by substantially all assets of Iron Mountain Australia Group Pty.Ltd. IMI and its direct and indirect 100% owned United States subsidiaries that represent the substantial majority of its United States operations (the “Guarantors”)guarantee all obligations under the AUD Term Loan. The interest rate on the AUD Term Loan is based upon BBSY (an Australian benchmark variable interestrate) plus 4.3% . As of September 30, 2017, we had 243,750 Australian dollars ( $190,905 based upon the exchange rate between the United States dollar and theAustralian dollar as of September 30, 2017 ) outstanding on the AUD Term Loan and the interest rate in effect under the AUD Term Loan was 6.0% . The amountof debt for the AUD Term Loan reflects an unamortized original issue discount of $1,725 and $1,632 as of December 31, 2016 and September 30, 2017 ,respectively.
c. Issuance of the Euro Notes and the 4 7 / 8 % Notes
In May 2017, IMI completed a private offering of 300,000 Euro in aggregate principal amount of the Euro Notes, which were issued at par. The net proceedsto IMI from the Euro Notes of 296,250 Euro (or $332,683 , based upon the exchange rate between the Euro and the United States dollar on May 16, 2017 (thesettlement date for the Euro Notes)), after deducting discounts to the initial purchasers, were used to repay outstanding borrowings under the Former RevolvingCredit Facility.
In September 2017, IMI completed a private offering of $1,000,000 in aggregate principal amount of the 4 7 / 8 % Notes. The 4 7 / 8 % Notes were issued atpar. The net proceeds of approximately $987,500 from the 4 7 / 8 % Notes after deducting discounts to the initial purchasers, together with borrowings under theRevolving Credit Facility, were used to fund the redemption of all of the 6% Notes due 2020, as described below.
IMI is the direct obligor on the Euro Notes and the 4 7 / 8 % Notes, which are fully and unconditionally guaranteed, on a senior basis, by the Guarantors.These guarantees are full and unconditional, as well as joint and several obligations of the Guarantors. Canada Company, Iron Mountain Europe PLC (“IME”), theAccounts Receivable Securitization Special Purpose Subsidiaries (as defined below), the Mortgage Securitization Special Purpose Subsidiary (as defined below)and the remainder of our subsidiaries do not guarantee the Euro Notes or the 4 7 / 8 % Notes. See Note 6.
d. Redemption of CAD Notes due 2021 and 6% Notes due 2020
In August 2017, we redeemed all of the 200,000 Canadian dollars in aggregate principal outstanding of the CAD Notes due 2021 (approximately $157,458 ,based upon the exchange rate between the Canadian dollar and the United States dollar on August 15, 2017 (the redemption date for the CAD Notes due 2021)) at103.063% of par, plus accrued and unpaid interest to, but excluding the redemption date, utilizing borrowings under the Former Revolving Credit Facility. Werecorded a charge of $6,354 to other expense (income), net in the third quarter of 2017 related to the early extinguishment of this debt, representing the callpremium associated with the early redemption, as well as a write off of unamortized deferred financing costs.
In September 2017, we redeemed all of the $1,000,000 in aggregate principal outstanding of the 6% Notes due 2020 at 103.155% of par, plus accrued andunpaid interest to, but excluding, the redemption date, utilizing the net proceeds from the issuance of the 4 7 / 8 Notes and borrowings under the Revolving CreditFacility. We recorded a charge of $41,738 to other expense (income), net in the third quarter of 2017 related to the early extinguishment of this debt, representingthe call premium associated with the early redemption, as well as a write off of unamortized deferred financing costs.
34
Table of Contents
IRON MOUNTAIN INCORPORATED
NOTES TO CONDENSED CONSOLIDATED FINANCIAL STATEMENTS (Continued)
(In Thousands, Except Share and Per Share Data)
(Unaudited)
(5) Debt (Continued)
e. Accounts Receivable Securitization Program
In March 2015, we entered into a $250,000 accounts receivable securitization program (the "Accounts Receivable Securitization Program") involving severalof our wholly owned subsidiaries and certain financial institutions. Under the Accounts Receivable Securitization Program, certain of our subsidiaries sellsubstantially all of their United States accounts receivable balances to our wholly owned special purpose entities, Iron Mountain Receivables QRS, LLC and IronMountain Receivables TRS, LLC (the "Accounts Receivable Securitization Special Purpose Subsidiaries"). The Accounts Receivable Securitization SpecialPurpose Subsidiaries use the accounts receivable balances to collateralize loans obtained from certain financial institutions. The Accounts ReceivableSecuritization Special Purpose Subsidiaries are consolidated subsidiaries of IMI. The Accounts Receivable Securitization Program is accounted for as acollateralized financing activity, rather than a sale of assets, and therefore: (i) accounts receivable balances pledged as collateral are presented as assets andborrowings are presented as liabilities on our Condensed Consolidated Balance Sheets, (ii) our Condensed Consolidated Statements of Operations reflect theassociated charges for bad debt expense related to pledged accounts receivable (a component of selling, general and administrative expenses) and reductions torevenue due to billing and service related credit memos issued to customers and related reserves, as well as interest expense associated with the collateralizedborrowings and (iii) receipts from customers related to the underlying accounts receivable are reflected as operating cash flows and borrowings and repaymentsunder the collateralized loans are reflected as financing cash flows within our Condensed Consolidated Statements of Cash Flows. Iron Mountain InformationManagement, LLC ("IMIM") retains the responsibility of servicing the accounts receivable balances pledged as collateral for the Accounts ReceivableSecuritization Program and IMI provides a performance guaranty.
On July 31, 2017, we amended the Accounts Receivable Securitization Program to (i) increase the maximum amount available from $250,000 to $275,000and (ii) to extend the maturity date from March 6, 2018 to July 30, 2020, at which pointall obligations become due.
The maximum availability allowed under the Accounts Receivable Securitization Program is limited by eligible accounts receivable, as defined under theterms of the Accounts Receivable Securitization Program. As of September 30, 2017 , the maximum availability allowed and amount outstanding under theAccounts Receivable Securitization Program was $254,073 . The interest rate in effect under the Accounts Receivable Securitization Program was 2.2% as ofSeptember 30, 2017 .
f. Mortgage Securitization Program
In October 2016, we entered into a $50,000 mortgage securitization program (the "Mortgage Securitization Program") involving certain of our wholly ownedsubsidiaries with Goldman Sachs Mortgage Company (“Goldman Sachs”). Under the Mortgage Securitization Program, IMIM contributed certain real estate assetsto its wholly owned special purpose entity, Iron Mountain Mortgage Finance I, LLC (the "Mortgage Securitization Special Purpose Subsidiary"). The MortgageSecuritization Special Purpose Subsidiary then used the real estate to secure a collateralized loan obtained from Goldman Sachs. The Mortgage SecuritizationSpecial Purpose Subsidiary is a consolidated subsidiary of IMI. The Mortgage Securitization Program is accounted for as a collateralized financing activity, ratherthan a sale of assets, and therefore: (i) real estate assets pledged as collateral remain as assets and borrowings are presented as liabilities on our CondensedConsolidated Balance Sheets, (ii) our Condensed Consolidated Statement of Operations reflects the associated charges for depreciation expense related to thepledged real estate and interest expense associated with the collateralized borrowings and (iii) borrowings and repayments under the collateralized loans arereflected as financing cash flows within our Condensed Consolidated Statement of Cash Flows. The Mortgage Securitization Program is scheduled to terminate onNovember 6, 2026, at which point all obligations become due. As of September 30, 2017 , the outstanding amount under the Mortgage Securitization Program was$50,000 . The interest rate in effect under the Mortgage Securitization Program was 3.5% as of September 30, 2017 .
35

Table of Contents
IRON MOUNTAIN INCORPORATED
NOTES TO CONDENSED CONSOLIDATED FINANCIAL STATEMENTS (Continued)
(In Thousands, Except Share and Per Share Data)
(Unaudited)
(5) Debt (Continued)
g. Cash Pooling
Certain of our subsidiaries participate in cash pooling arrangements (the “Cash Pools”) with Bank Mendes Gans (“BMG”), an independently operated fully-owned subsidiary of ING Group, in order to help manage global liquidity requirements. Under the Cash Pools, cash deposited by participating subsidiaries withBMG is pledged as security against the debit balances of other participating subsidiaries, and legal rights of offset are provided and, therefore, amounts arepresented in our Condensed Consolidated Balance Sheets on a net basis. Each subsidiary receives interest on the cash balances held on deposit or pays interest onits debit balances based on an applicable rate as defined in the Cash Pools. At December 31, 2016, we had a net cash position of approximately $1,700 (whichconsisted of a gross cash position of approximately $69,500 less outstanding debit balances of approximately $67,800 by participating subsidiaries).
During the first quarter of 2017, we significantly expanded our utilization of the Cash Pools and reduced our utilization of our financing centers in Europe forpurposes of meeting our global liquidity requirements. We currently utilize two separate cash pools with BMG, one of which we utilize to manage global liquidityrequirements for our QRSs (the "QRS Cash Pool") and the other for our TRSs (the "TRS Cash Pool"). During the second quarter of 2017, we executed overdraftfacility agreements for the QRS Cash Pool and TRS Cash Pool, each in an amount not to exceed $10,000 . Each overdraft facility permits us to cover a temporarynet debit position in the applicable pool. As of September 30, 2017 , we had a net cash position of approximately $1,000 in the QRS Cash Pool (which consisted ofa gross cash position of approximately $406,300 less outstanding debit balances of approximately $405,300 by participating subsidiaries) and we had a net cashposition of approximately $2,700 in the TRS Cash Pool (which consisted of a gross cash position of approximately $223,300 less outstanding debit balances ofapproximately $220,600 by participating subsidiaries). The net cash position balances as of December 31, 2016 and September 30, 2017 , respectively, arereflected as cash and cash equivalents in the Condensed Consolidated Balance Sheets.
36
Table of Contents
IRON MOUNTAIN INCORPORATED
NOTES TO CONDENSED CONSOLIDATED FINANCIAL STATEMENTS (Continued)
(In Thousands, Except Share and Per Share Data)
(Unaudited)
(6) Selected Consolidated Financial Statements of Parent, Guarantors, Canada Company and Non-Guarantors
The following data summarizes the consolidating results of IMI on the equity method of accounting as of December 31, 2016 and September 30, 2017 andfor the three and nine months ended September 30, 2016 and 2017 and are prepared on the same basis as the consolidated financial statements.
The Parent Notes, CAD Notes, GBP Notes and the 5 3 / 8 % Notes are guaranteed by the Guarantors. The guarantees are full and unconditional, as well asjoint and several.
Additionally, IMI guarantees the CAD Notes, which were issued by Canada Company, the GBP Notes, which were issued by IME, and the 5 3 / 8 % Notes,which were issued by Iron Mountain US Holdings, Inc., which is one of the Guarantors. Canada Company and IME do not guarantee the Parent Notes. Thesubsidiaries that do not guarantee the Parent Notes, the CAD Notes, the GBP Notes and the 5 3 / 8 % Notes, including IME, the Accounts Receivable SecuritizationSpecial Purpose Subsidiaries and the Mortgage Securitization Special Purpose Subsidiary, are referred to below as the "Non-Guarantors". As discussed below, theresults of the Non-Guarantors for 2016 exclude the results of Canada Company, as those are presented in a separate column.
The CAD Notes due 2021 were issued by Canada Company and registered under the Securities Act of 1933, as amended (the “Securities Act”). The CADNotes due 2023 have not been registered under the Securities Act, or under the securities laws of any other jurisdiction. As disclosed in Note 5, we redeemed theCAD Notes due 2021 in August 2017 and, therefore, as of September 30, 2017, Canada Company had no outstanding debt registered under the Securities Act thatwould require the presentation of Canada Company on a standalone basis in the accompanying consolidating financial statements. Accordingly, (i) the assets,liabilities and equity of Canada Company are presented as a component of the Non-Guarantor subsidiaries in the accompanying Condensed Consolidated BalanceSheet as of September 30, 2017, (ii) the revenues, expenses and other comprehensive income (loss) of Canada Company are presented as a component of the Non-Guarantor subsidiaries in the Condensed Consolidated Statements of Operations and Comprehensive Income (Loss) for the three and nine months ended September30, 2017, and (iii) the operating, investing and financing cash flows for Canada Company are presented as a component of the Non-Guarantor subsidiaries in theCondensed Consolidated Statement of Cash Flows for the nine months ended September 30, 2017.
In the normal course of business, we periodically change the ownership structure of our subsidiaries to meet the requirements of our business. In the event ofsuch changes, we recast the prior period financial information within this footnote to conform to the current period presentation in the period such changes occur.Generally, these changes do not alter the designation of the underlying subsidiaries as Guarantors or Non-Guarantors. However, they may change whether theunderlying subsidiary is owned by the Parent, a Guarantor or a Non-Guarantor. If such a change occurs, the amount of investment in subsidiaries in the belowCondensed Consolidated Balance Sheets and equity in the earnings (losses) of subsidiaries, net of tax in the below Condensed Consolidated Statements ofOperations and Comprehensive Income (Loss) with respect to the relevant Parent, Guarantors, Non-Guarantors and Eliminations columns also would change.
37
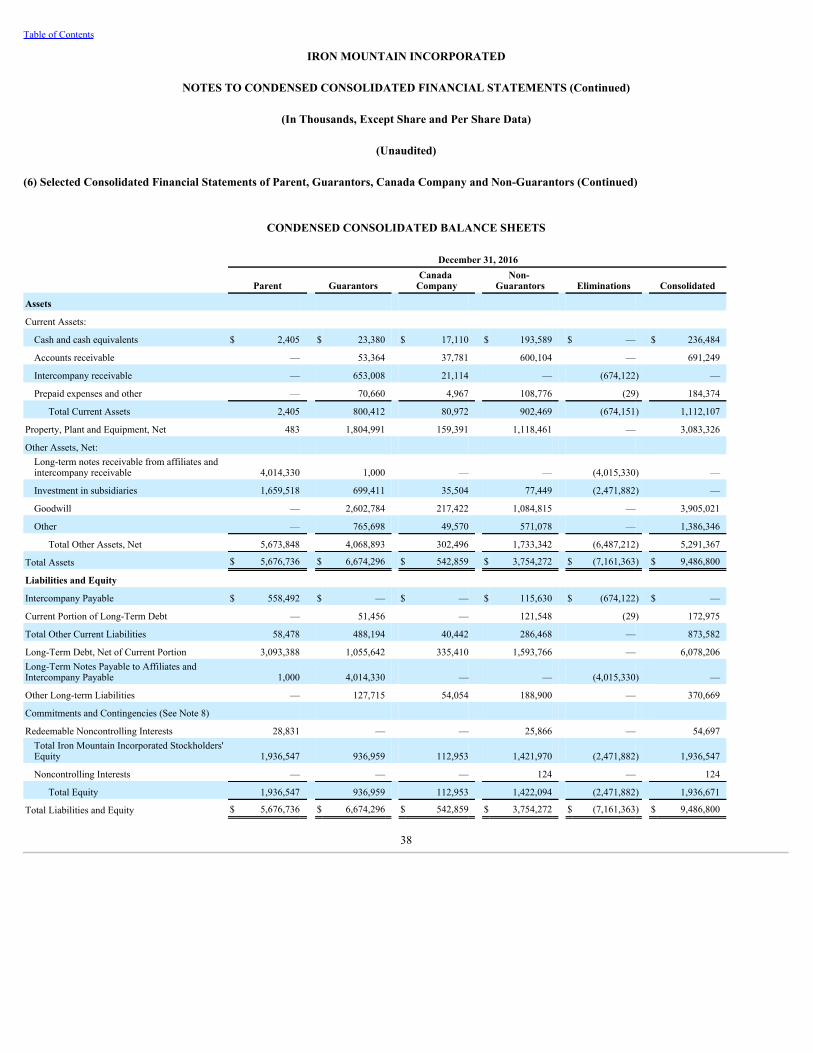
Table of Contents
IRON MOUNTAIN INCORPORATED
NOTES TO CONDENSED CONSOLIDATED FINANCIAL STATEMENTS (Continued)
(In Thousands, Except Share and Per Share Data)
(Unaudited)
(6) Selected Consolidated Financial Statements of Parent, Guarantors, Canada Company and Non-Guarantors (Continued)
CONDENSED CONSOLIDATED BALANCE SHEETS
December 31, 2016
Parent Guarantors Canada
Company Non-
Guarantors Eliminations Consolidated
Assets
Current Assets:
Cash and cash equivalents $ 2,405 $ 23,380 $ 17,110 $ 193,589 $ — $ 236,484
Accounts receivable — 53,364 37,781 600,104 — 691,249
Intercompany receivable — 653,008 21,114 — (674,122) —
Prepaid expenses and other — 70,660 4,967 108,776 (29) 184,374
Total Current Assets 2,405 800,412 80,972 902,469 (674,151) 1,112,107
Property, Plant and Equipment, Net 483 1,804,991 159,391 1,118,461 — 3,083,326
Other Assets, Net: Long-term notes receivable from affiliates andintercompany receivable 4,014,330 1,000 — — (4,015,330) —
Investment in subsidiaries 1,659,518 699,411 35,504 77,449 (2,471,882) —
Goodwill — 2,602,784 217,422 1,084,815 — 3,905,021
Other — 765,698 49,570 571,078 — 1,386,346
Total Other Assets, Net 5,673,848 4,068,893 302,496 1,733,342 (6,487,212) 5,291,367
Total Assets $ 5,676,736 $ 6,674,296 $ 542,859 $ 3,754,272 $ (7,161,363) $ 9,486,800
Liabilities and Equity
Intercompany Payable $ 558,492 $ — $ — $ 115,630 $ (674,122) $ —
Current Portion of Long-Term Debt — 51,456 — 121,548 (29) 172,975
Total Other Current Liabilities 58,478 488,194 40,442 286,468 — 873,582
Long-Term Debt, Net of Current Portion 3,093,388 1,055,642 335,410 1,593,766 — 6,078,206Long-Term Notes Payable to Affiliates andIntercompany Payable 1,000 4,014,330 — — (4,015,330) —
Other Long-term Liabilities — 127,715 54,054 188,900 — 370,669
Commitments and Contingencies (See Note 8)
Redeemable Noncontrolling Interests 28,831 — — 25,866 — 54,697Total Iron Mountain Incorporated Stockholders'Equity 1,936,547 936,959 112,953 1,421,970 (2,471,882) 1,936,547
Noncontrolling Interests — — — 124 — 124
Total Equity 1,936,547 936,959 112,953 1,422,094 (2,471,882) 1,936,671
Total Liabilities and Equity $ 5,676,736 $ 6,674,296 $ 542,859 $ 3,754,272 $ (7,161,363) $ 9,486,800
38
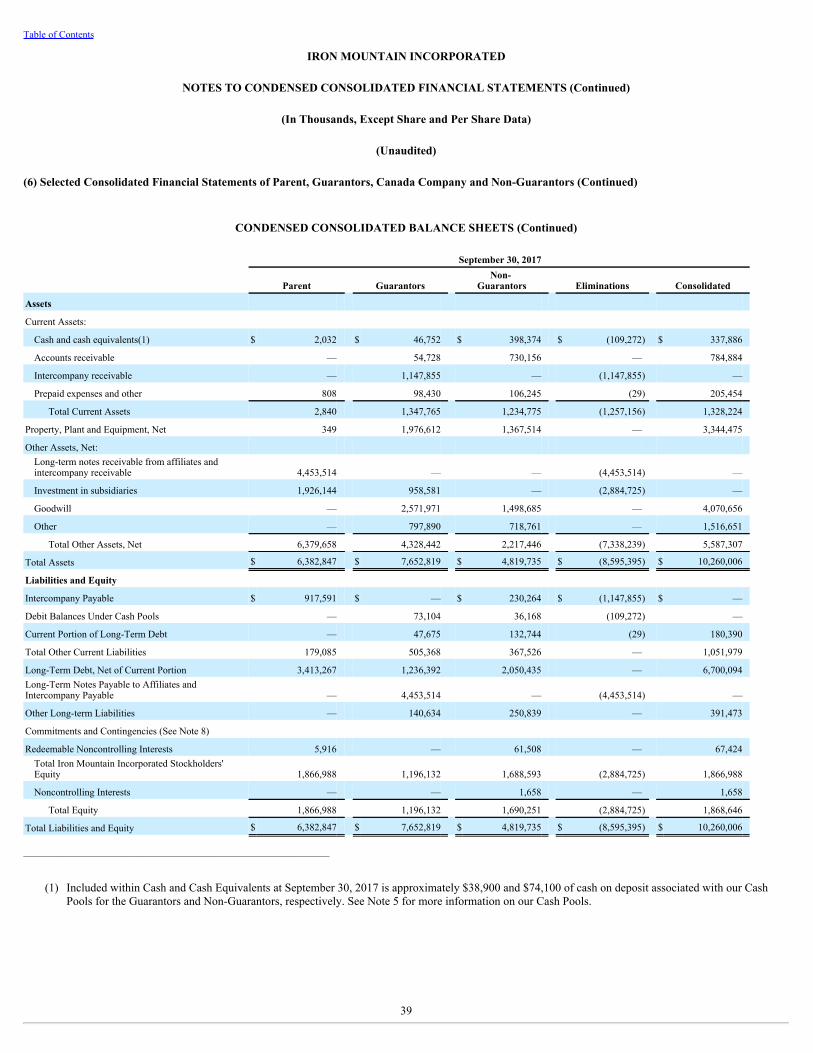
Table of Contents
IRON MOUNTAIN INCORPORATED
NOTES TO CONDENSED CONSOLIDATED FINANCIAL STATEMENTS (Continued)
(In Thousands, Except Share and Per Share Data)
(Unaudited)
(6) Selected Consolidated Financial Statements of Parent, Guarantors, Canada Company and Non-Guarantors (Continued)
CONDENSED CONSOLIDATED BALANCE SHEETS (Continued)
September 30, 2017
Parent Guarantors Non-
Guarantors Eliminations Consolidated
Assets
Current Assets:
Cash and cash equivalents(1) $ 2,032 $ 46,752 $ 398,374 $ (109,272) $ 337,886
Accounts receivable — 54,728 730,156 — 784,884
Intercompany receivable — 1,147,855 — (1,147,855) —
Prepaid expenses and other 808 98,430 106,245 (29) 205,454
Total Current Assets 2,840 1,347,765 1,234,775 (1,257,156) 1,328,224
Property, Plant and Equipment, Net 349 1,976,612 1,367,514 — 3,344,475
Other Assets, Net: Long-term notes receivable from affiliates andintercompany receivable 4,453,514 — — (4,453,514) —
Investment in subsidiaries 1,926,144 958,581 — (2,884,725) —
Goodwill — 2,571,971 1,498,685 — 4,070,656
Other — 797,890 718,761 — 1,516,651
Total Other Assets, Net 6,379,658 4,328,442 2,217,446 (7,338,239) 5,587,307
Total Assets $ 6,382,847 $ 7,652,819 $ 4,819,735 $ (8,595,395) $ 10,260,006
Liabilities and Equity
Intercompany Payable $ 917,591 $ — $ 230,264 $ (1,147,855) $ —
Debit Balances Under Cash Pools — 73,104 36,168 (109,272) —
Current Portion of Long-Term Debt — 47,675 132,744 (29) 180,390
Total Other Current Liabilities 179,085 505,368 367,526 — 1,051,979
Long-Term Debt, Net of Current Portion 3,413,267 1,236,392 2,050,435 — 6,700,094Long-Term Notes Payable to Affiliates andIntercompany Payable — 4,453,514 — (4,453,514) —
Other Long-term Liabilities — 140,634 250,839 — 391,473
Commitments and Contingencies (See Note 8)
Redeemable Noncontrolling Interests 5,916 — 61,508 — 67,424Total Iron Mountain Incorporated Stockholders'Equity 1,866,988 1,196,132 1,688,593 (2,884,725) 1,866,988
Noncontrolling Interests — — 1,658 — 1,658
Total Equity 1,866,988 1,196,132 1,690,251 (2,884,725) 1,868,646
Total Liabilities and Equity $ 6,382,847 $ 7,652,819 $ 4,819,735 $ (8,595,395) $ 10,260,006
______________________________________________________________
(1) Included within Cash and Cash Equivalents at September 30, 2017 is approximately $38,900 and $74,100 of cash on deposit associated with our CashPools for the Guarantors and Non-Guarantors, respectively. See Note 5 for more information on our Cash Pools.
39
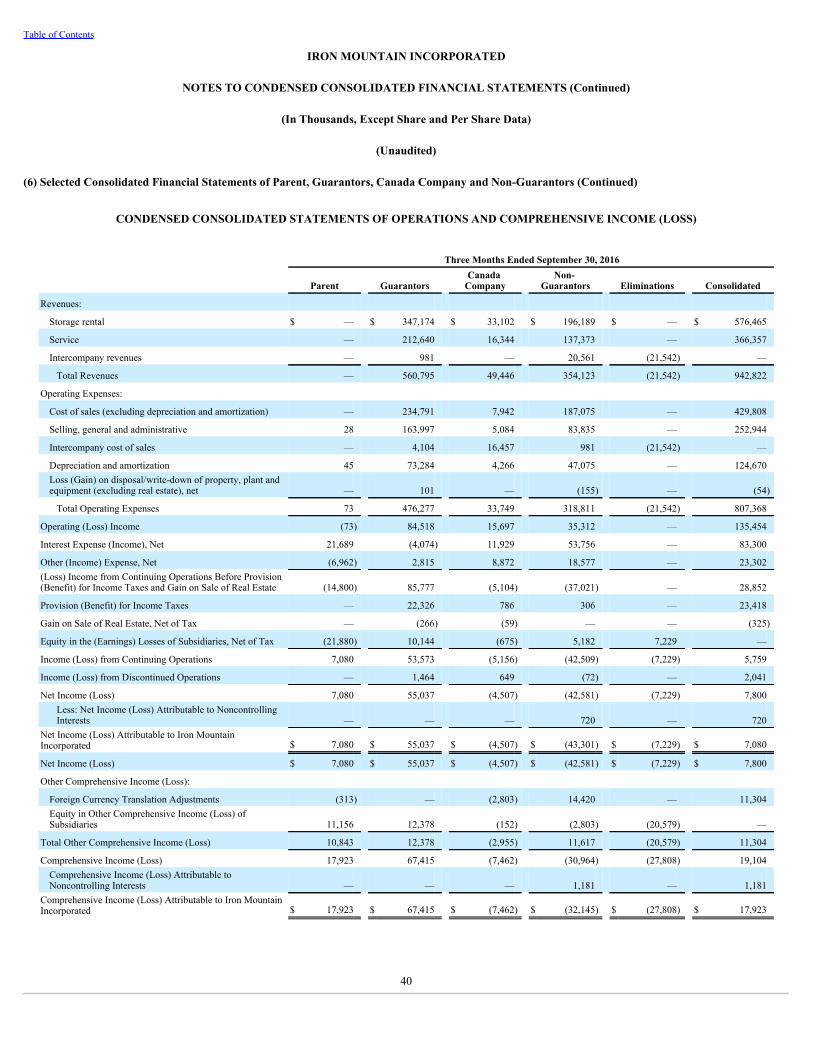
Table of Contents
IRON MOUNTAIN INCORPORATED
NOTES TO CONDENSED CONSOLIDATED FINANCIAL STATEMENTS (Continued)
(In Thousands, Except Share and Per Share Data)
(Unaudited)
(6) Selected Consolidated Financial Statements of Parent, Guarantors, Canada Company and Non-Guarantors (Continued)
CONDENSED CONSOLIDATED STATEMENTS OF OPERATIONS AND COMPREHENSIVE INCOME (LOSS)
Three Months Ended September 30, 2016
Parent Guarantors Canada
Company Non-
Guarantors Eliminations Consolidated
Revenues:
Storage rental $ — $ 347,174 $ 33,102 $ 196,189 $ — $ 576,465
Service — 212,640 16,344 137,373 — 366,357
Intercompany revenues — 981 — 20,561 (21,542) —
Total Revenues — 560,795 49,446 354,123 (21,542) 942,822
Operating Expenses:
Cost of sales (excluding depreciation and amortization) — 234,791 7,942 187,075 — 429,808
Selling, general and administrative 28 163,997 5,084 83,835 — 252,944
Intercompany cost of sales — 4,104 16,457 981 (21,542) —
Depreciation and amortization 45 73,284 4,266 47,075 — 124,670Loss (Gain) on disposal/write-down of property, plant andequipment (excluding real estate), net — 101 — (155) — (54)
Total Operating Expenses 73 476,277 33,749 318,811 (21,542) 807,368
Operating (Loss) Income (73) 84,518 15,697 35,312 — 135,454
Interest Expense (Income), Net 21,689 (4,074) 11,929 53,756 — 83,300
Other (Income) Expense, Net (6,962) 2,815 8,872 18,577 — 23,302(Loss) Income from Continuing Operations Before Provision(Benefit) for Income Taxes and Gain on Sale of Real Estate (14,800) 85,777 (5,104) (37,021) — 28,852
Provision (Benefit) for Income Taxes — 22,326 786 306 — 23,418
Gain on Sale of Real Estate, Net of Tax — (266) (59) — — (325)
Equity in the (Earnings) Losses of Subsidiaries, Net of Tax (21,880) 10,144 (675) 5,182 7,229 —
Income (Loss) from Continuing Operations 7,080 53,573 (5,156) (42,509) (7,229) 5,759
Income (Loss) from Discontinued Operations — 1,464 649 (72) — 2,041
Net Income (Loss) 7,080 55,037 (4,507) (42,581) (7,229) 7,800Less: Net Income (Loss) Attributable to NoncontrollingInterests — — — 720 — 720
Net Income (Loss) Attributable to Iron MountainIncorporated $ 7,080 $ 55,037 $ (4,507) $ (43,301) $ (7,229) $ 7,080
Net Income (Loss) $ 7,080 $ 55,037 $ (4,507) $ (42,581) $ (7,229) $ 7,800
Other Comprehensive Income (Loss):
Foreign Currency Translation Adjustments (313) — (2,803) 14,420 — 11,304Equity in Other Comprehensive Income (Loss) ofSubsidiaries 11,156 12,378 (152) (2,803) (20,579) —
Total Other Comprehensive Income (Loss) 10,843 12,378 (2,955) 11,617 (20,579) 11,304
Comprehensive Income (Loss) 17,923 67,415 (7,462) (30,964) (27,808) 19,104Comprehensive Income (Loss) Attributable toNoncontrolling Interests — — — 1,181 — 1,181
Comprehensive Income (Loss) Attributable to Iron MountainIncorporated $ 17,923 $ 67,415 $ (7,462) $ (32,145) $ (27,808) $ 17,923
40

Table of Contents
IRON MOUNTAIN INCORPORATED
NOTES TO CONDENSED CONSOLIDATED FINANCIAL STATEMENTS (Continued)
(In Thousands, Except Share and Per Share Data)
(Unaudited)
(6) Selected Consolidated Financial Statements of Parent, Guarantors, Canada Company and Non-Guarantors (Continued)
CONDENSED CONSOLIDATED STATEMENTS OF OPERATIONS AND COMPREHENSIVE INCOME (LOSS) (Continued)
Three Months Ended September 30, 2017
Parent Guarantors Non-
Guarantors Eliminations Consolidated
Revenues:
Storage rental $ — $ 360,539 $ 240,552 $ — $ 601,091
Service — 212,587 151,983 — 364,570
Intercompany revenues — 1,148 5,021 (6,169) —
Total Revenues — 574,274 397,556 (6,169) 965,661
Operating Expenses:
Cost of sales (excluding depreciation and amortization) — 231,392 186,935 — 418,327
Selling, general and administrative (203) 160,455 82,105 — 242,357
Intercompany cost of sales — 5,021 1,148 (6,169) —
Depreciation and amortization 45 74,470 53,998 — 128,513(Gain) Loss on disposal/write-down of property, plant andequipment (excluding real estate), net — (385) 93 — (292)
Total Operating Expenses (158) 470,953 324,279 (6,169) 788,905
Operating Income (Loss) 158 103,321 73,277 — 176,756
Interest Expense (Income), Net 41,369 (1,705) 49,325 — 88,989
Other Expense (Income), Net 43,258 5,547 10,674 — 59,479(Loss) Income from Continuing Operations Before Provision(Benefit) for Income Taxes and Gain on Sale of Real Estate (84,469) 99,479 13,278 — 28,288
Provision (Benefit) for Income Taxes — 6,138 (3,870) — 2,268
Gain on Sale of Real Estate, Net of Tax — — 638 — 638
Equity in the (Earnings) Losses of Subsidiaries, Net of Tax (108,814) (16,019) — 124,833 —
Income (Loss) from Continuing Operations 24,345 109,360 16,510 (124,833) 25,382
(Loss) Income from Discontinued Operations, Net of Tax — (678) (380) — (1,058)
Net Income (Loss) 24,345 108,682 16,130 (124,833) 24,324
Less: Net (Loss) Income Attributable to Noncontrolling Interests — — (21) — (21)
Net Income (Loss) Attributable to Iron Mountain Incorporated $ 24,345 $ 108,682 $ 16,151 $ (124,833) $ 24,345
Net Income (Loss) $ 24,345 $ 108,682 $ 16,130 $ (124,833) $ 24,324
Other Comprehensive Income (Loss):
Foreign Currency Translation Adjustments (4,211) — 41,752 — 37,541
Equity in Other Comprehensive Income (Loss) of Subsidiaries 42,458 30,804 — (73,262) —
Total Other Comprehensive Income (Loss) 38,247 30,804 41,752 (73,262) 37,541
Comprehensive Income (Loss) 62,592 139,486 57,882 (198,095) 61,865Comprehensive (Loss) Income Attributable to NoncontrollingInterests — — (727) — (727)
Comprehensive Income (Loss) Attributable to Iron MountainIncorporated $ 62,592 $ 139,486 $ 58,609 $ (198,095) $ 62,592
41
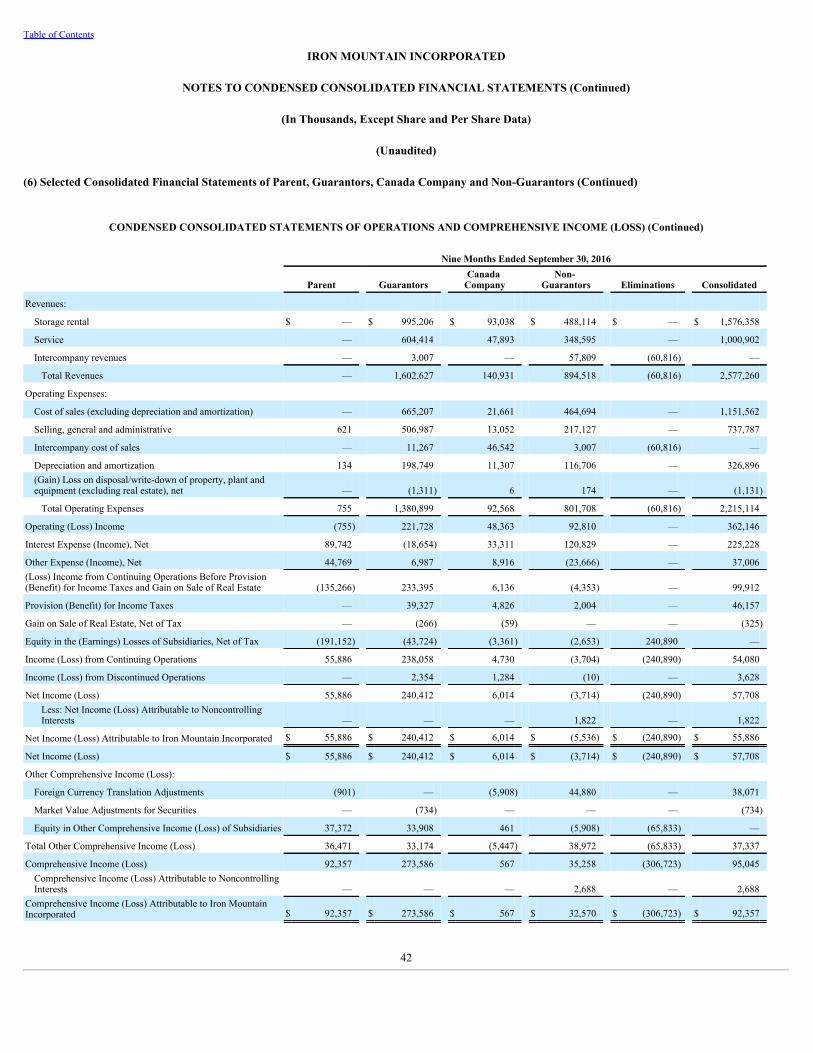
Table of Contents
IRON MOUNTAIN INCORPORATED
NOTES TO CONDENSED CONSOLIDATED FINANCIAL STATEMENTS (Continued)
(In Thousands, Except Share and Per Share Data)
(Unaudited)
(6) Selected Consolidated Financial Statements of Parent, Guarantors, Canada Company and Non-Guarantors (Continued)
CONDENSED CONSOLIDATED STATEMENTS OF OPERATIONS AND COMPREHENSIVE INCOME (LOSS) (Continued)
Nine Months Ended September 30, 2016
Parent Guarantors Canada
Company Non-
Guarantors Eliminations Consolidated
Revenues:
Storage rental $ — $ 995,206 $ 93,038 $ 488,114 $ — $ 1,576,358
Service — 604,414 47,893 348,595 — 1,000,902
Intercompany revenues — 3,007 — 57,809 (60,816) —
Total Revenues — 1,602,627 140,931 894,518 (60,816) 2,577,260
Operating Expenses:
Cost of sales (excluding depreciation and amortization) — 665,207 21,661 464,694 — 1,151,562
Selling, general and administrative 621 506,987 13,052 217,127 — 737,787
Intercompany cost of sales — 11,267 46,542 3,007 (60,816) —
Depreciation and amortization 134 198,749 11,307 116,706 — 326,896(Gain) Loss on disposal/write-down of property, plant andequipment (excluding real estate), net — (1,311) 6 174 — (1,131)
Total Operating Expenses 755 1,380,899 92,568 801,708 (60,816) 2,215,114
Operating (Loss) Income (755) 221,728 48,363 92,810 — 362,146
Interest Expense (Income), Net 89,742 (18,654) 33,311 120,829 — 225,228
Other Expense (Income), Net 44,769 6,987 8,916 (23,666) — 37,006(Loss) Income from Continuing Operations Before Provision(Benefit) for Income Taxes and Gain on Sale of Real Estate (135,266) 233,395 6,136 (4,353) — 99,912
Provision (Benefit) for Income Taxes — 39,327 4,826 2,004 — 46,157
Gain on Sale of Real Estate, Net of Tax — (266) (59) — — (325)
Equity in the (Earnings) Losses of Subsidiaries, Net of Tax (191,152) (43,724) (3,361) (2,653) 240,890 —
Income (Loss) from Continuing Operations 55,886 238,058 4,730 (3,704) (240,890) 54,080
Income (Loss) from Discontinued Operations — 2,354 1,284 (10) — 3,628
Net Income (Loss) 55,886 240,412 6,014 (3,714) (240,890) 57,708Less: Net Income (Loss) Attributable to NoncontrollingInterests — — — 1,822 — 1,822
Net Income (Loss) Attributable to Iron Mountain Incorporated $ 55,886 $ 240,412 $ 6,014 $ (5,536) $ (240,890) $ 55,886
Net Income (Loss) $ 55,886 $ 240,412 $ 6,014 $ (3,714) $ (240,890) $ 57,708
Other Comprehensive Income (Loss):
Foreign Currency Translation Adjustments (901) — (5,908) 44,880 — 38,071
Market Value Adjustments for Securities — (734) — — — (734)
Equity in Other Comprehensive Income (Loss) of Subsidiaries 37,372 33,908 461 (5,908) (65,833) —
Total Other Comprehensive Income (Loss) 36,471 33,174 (5,447) 38,972 (65,833) 37,337
Comprehensive Income (Loss) 92,357 273,586 567 35,258 (306,723) 95,045Comprehensive Income (Loss) Attributable to NoncontrollingInterests — — — 2,688 — 2,688
Comprehensive Income (Loss) Attributable to Iron MountainIncorporated $ 92,357 $ 273,586 $ 567 $ 32,570 $ (306,723) $ 92,357
42
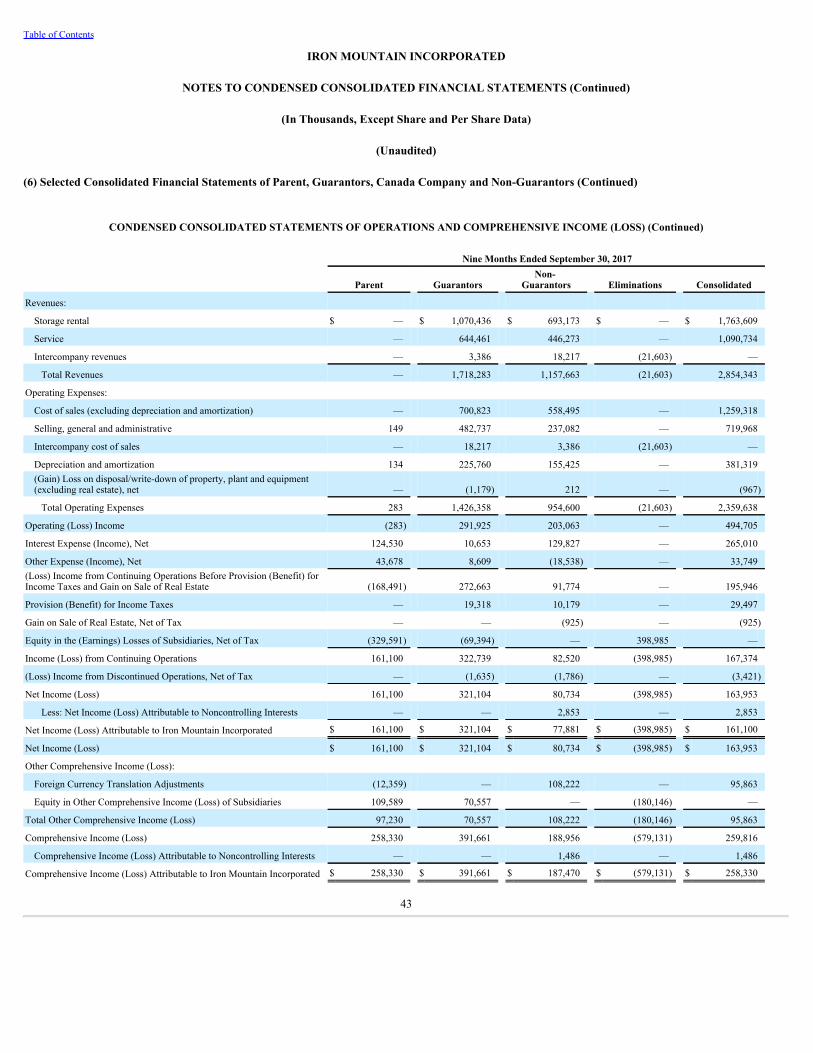
Table of Contents
IRON MOUNTAIN INCORPORATED
NOTES TO CONDENSED CONSOLIDATED FINANCIAL STATEMENTS (Continued)
(In Thousands, Except Share and Per Share Data)
(Unaudited)
(6) Selected Consolidated Financial Statements of Parent, Guarantors, Canada Company and Non-Guarantors (Continued)
CONDENSED CONSOLIDATED STATEMENTS OF OPERATIONS AND COMPREHENSIVE INCOME (LOSS) (Continued)
Nine Months Ended September 30, 2017
Parent Guarantors Non-
Guarantors Eliminations Consolidated
Revenues:
Storage rental $ — $ 1,070,436 $ 693,173 $ — $ 1,763,609
Service — 644,461 446,273 — 1,090,734
Intercompany revenues — 3,386 18,217 (21,603) —
Total Revenues — 1,718,283 1,157,663 (21,603) 2,854,343
Operating Expenses:
Cost of sales (excluding depreciation and amortization) — 700,823 558,495 — 1,259,318
Selling, general and administrative 149 482,737 237,082 — 719,968
Intercompany cost of sales — 18,217 3,386 (21,603) —
Depreciation and amortization 134 225,760 155,425 — 381,319(Gain) Loss on disposal/write-down of property, plant and equipment(excluding real estate), net — (1,179) 212 — (967)
Total Operating Expenses 283 1,426,358 954,600 (21,603) 2,359,638
Operating (Loss) Income (283) 291,925 203,063 — 494,705
Interest Expense (Income), Net 124,530 10,653 129,827 — 265,010
Other Expense (Income), Net 43,678 8,609 (18,538) — 33,749(Loss) Income from Continuing Operations Before Provision (Benefit) forIncome Taxes and Gain on Sale of Real Estate (168,491) 272,663 91,774 — 195,946
Provision (Benefit) for Income Taxes — 19,318 10,179 — 29,497
Gain on Sale of Real Estate, Net of Tax — — (925) — (925)
Equity in the (Earnings) Losses of Subsidiaries, Net of Tax (329,591) (69,394) — 398,985 —
Income (Loss) from Continuing Operations 161,100 322,739 82,520 (398,985) 167,374
(Loss) Income from Discontinued Operations, Net of Tax — (1,635) (1,786) — (3,421)
Net Income (Loss) 161,100 321,104 80,734 (398,985) 163,953
Less: Net Income (Loss) Attributable to Noncontrolling Interests — — 2,853 — 2,853
Net Income (Loss) Attributable to Iron Mountain Incorporated $ 161,100 $ 321,104 $ 77,881 $ (398,985) $ 161,100
Net Income (Loss) $ 161,100 $ 321,104 $ 80,734 $ (398,985) $ 163,953
Other Comprehensive Income (Loss):
Foreign Currency Translation Adjustments (12,359) — 108,222 — 95,863
Equity in Other Comprehensive Income (Loss) of Subsidiaries 109,589 70,557 — (180,146) —
Total Other Comprehensive Income (Loss) 97,230 70,557 108,222 (180,146) 95,863
Comprehensive Income (Loss) 258,330 391,661 188,956 (579,131) 259,816
Comprehensive Income (Loss) Attributable to Noncontrolling Interests — — 1,486 — 1,486
Comprehensive Income (Loss) Attributable to Iron Mountain Incorporated $ 258,330 $ 391,661 $ 187,470 $ (579,131) $ 258,330
43
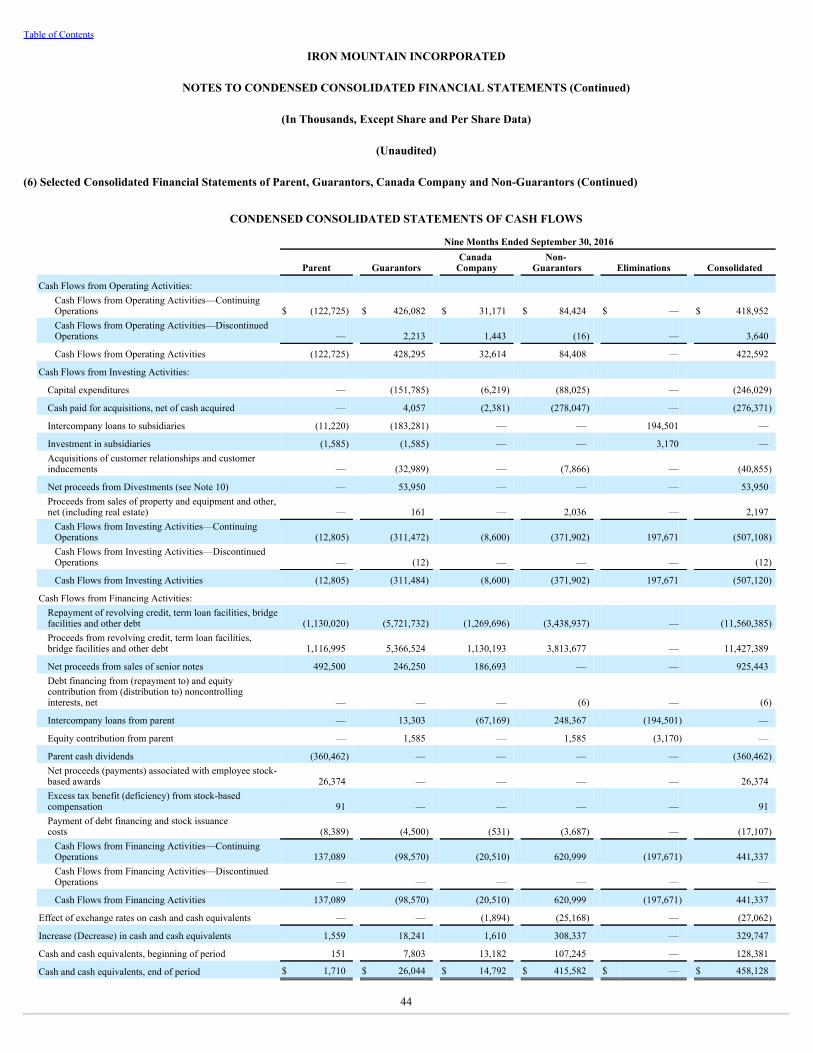
Table of Contents
IRON MOUNTAIN INCORPORATED
NOTES TO CONDENSED CONSOLIDATED FINANCIAL STATEMENTS (Continued)
(In Thousands, Except Share and Per Share Data)
(Unaudited)
(6) Selected Consolidated Financial Statements of Parent, Guarantors, Canada Company and Non-Guarantors (Continued)
CONDENSED CONSOLIDATED STATEMENTS OF CASH FLOWS
Nine Months Ended September 30, 2016
Parent Guarantors Canada
Company Non-
Guarantors Eliminations Consolidated
Cash Flows from Operating Activities: Cash Flows from Operating Activities—ContinuingOperations $ (122,725) $ 426,082 $ 31,171 $ 84,424 $ — $ 418,952Cash Flows from Operating Activities—DiscontinuedOperations — 2,213 1,443 (16) — 3,640
Cash Flows from Operating Activities (122,725) 428,295 32,614 84,408 — 422,592
Cash Flows from Investing Activities:
Capital expenditures — (151,785) (6,219) (88,025) — (246,029)
Cash paid for acquisitions, net of cash acquired — 4,057 (2,381) (278,047) — (276,371)
Intercompany loans to subsidiaries (11,220) (183,281) — — 194,501 —
Investment in subsidiaries (1,585) (1,585) — — 3,170 —Acquisitions of customer relationships and customerinducements — (32,989) — (7,866) — (40,855)
Net proceeds from Divestments (see Note 10) — 53,950 — — — 53,950Proceeds from sales of property and equipment and other,net (including real estate) — 161 — 2,036 — 2,197Cash Flows from Investing Activities—ContinuingOperations (12,805) (311,472) (8,600) (371,902) 197,671 (507,108)Cash Flows from Investing Activities—DiscontinuedOperations — (12) — — — (12)
Cash Flows from Investing Activities (12,805) (311,484) (8,600) (371,902) 197,671 (507,120)
Cash Flows from Financing Activities: Repayment of revolving credit, term loan facilities, bridgefacilities and other debt (1,130,020) (5,721,732) (1,269,696) (3,438,937) — (11,560,385)Proceeds from revolving credit, term loan facilities,bridge facilities and other debt 1,116,995 5,366,524 1,130,193 3,813,677 — 11,427,389
Net proceeds from sales of senior notes 492,500 246,250 186,693 — — 925,443Debt financing from (repayment to) and equitycontribution from (distribution to) noncontrollinginterests, net — — — (6) — (6)
Intercompany loans from parent — 13,303 (67,169) 248,367 (194,501) —
Equity contribution from parent — 1,585 — 1,585 (3,170) —
Parent cash dividends (360,462) — — — — (360,462)Net proceeds (payments) associated with employee stock-based awards 26,374 — — — — 26,374Excess tax benefit (deficiency) from stock-basedcompensation 91 — — — — 91Payment of debt financing and stock issuancecosts (8,389) (4,500) (531) (3,687) — (17,107)Cash Flows from Financing Activities—ContinuingOperations 137,089 (98,570) (20,510) 620,999 (197,671) 441,337Cash Flows from Financing Activities—DiscontinuedOperations — — — — — —
Cash Flows from Financing Activities 137,089 (98,570) (20,510) 620,999 (197,671) 441,337
Effect of exchange rates on cash and cash equivalents — — (1,894) (25,168) — (27,062)
Increase (Decrease) in cash and cash equivalents 1,559 18,241 1,610 308,337 — 329,747
Cash and cash equivalents, beginning of period 151 7,803 13,182 107,245 — 128,381
Cash and cash equivalents, end of period $ 1,710 $ 26,044 $ 14,792 $ 415,582 $ — $ 458,128
44
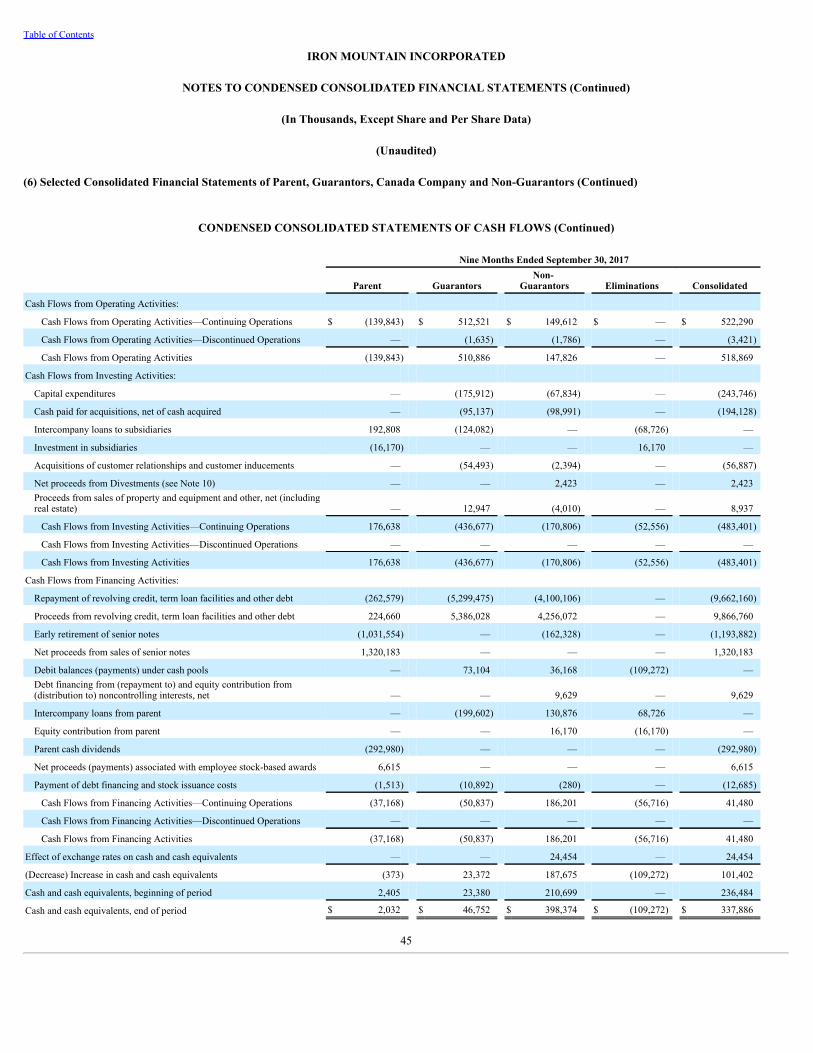
Table of Contents
IRON MOUNTAIN INCORPORATED
NOTES TO CONDENSED CONSOLIDATED FINANCIAL STATEMENTS (Continued)
(In Thousands, Except Share and Per Share Data)
(Unaudited)
(6) Selected Consolidated Financial Statements of Parent, Guarantors, Canada Company and Non-Guarantors (Continued)
CONDENSED CONSOLIDATED STATEMENTS OF CASH FLOWS (Continued)
Nine Months Ended September 30, 2017
Parent Guarantors Non-
Guarantors Eliminations Consolidated
Cash Flows from Operating Activities:
Cash Flows from Operating Activities—Continuing Operations $ (139,843) $ 512,521 $ 149,612 $ — $ 522,290
Cash Flows from Operating Activities—Discontinued Operations — (1,635) (1,786) — (3,421)
Cash Flows from Operating Activities (139,843) 510,886 147,826 — 518,869
Cash Flows from Investing Activities:
Capital expenditures — (175,912) (67,834) — (243,746)
Cash paid for acquisitions, net of cash acquired — (95,137) (98,991) — (194,128)
Intercompany loans to subsidiaries 192,808 (124,082) — (68,726) —
Investment in subsidiaries (16,170) — — 16,170 —
Acquisitions of customer relationships and customer inducements — (54,493) (2,394) — (56,887)
Net proceeds from Divestments (see Note 10) — — 2,423 — 2,423Proceeds from sales of property and equipment and other, net (includingreal estate) — 12,947 (4,010) — 8,937
Cash Flows from Investing Activities—Continuing Operations 176,638 (436,677) (170,806) (52,556) (483,401)
Cash Flows from Investing Activities—Discontinued Operations — — — — —
Cash Flows from Investing Activities 176,638 (436,677) (170,806) (52,556) (483,401)
Cash Flows from Financing Activities:
Repayment of revolving credit, term loan facilities and other debt (262,579) (5,299,475) (4,100,106) — (9,662,160)
Proceeds from revolving credit, term loan facilities and other debt 224,660 5,386,028 4,256,072 — 9,866,760
Early retirement of senior notes (1,031,554) — (162,328) — (1,193,882)
Net proceeds from sales of senior notes 1,320,183 — — — 1,320,183
Debit balances (payments) under cash pools — 73,104 36,168 (109,272) —Debt financing from (repayment to) and equity contribution from(distribution to) noncontrolling interests, net — — 9,629 — 9,629
Intercompany loans from parent — (199,602) 130,876 68,726 —
Equity contribution from parent — — 16,170 (16,170) —
Parent cash dividends (292,980) — — — (292,980)
Net proceeds (payments) associated with employee stock-based awards 6,615 — — — 6,615
Payment of debt financing and stock issuance costs (1,513) (10,892) (280) — (12,685)
Cash Flows from Financing Activities—Continuing Operations (37,168) (50,837) 186,201 (56,716) 41,480
Cash Flows from Financing Activities—Discontinued Operations — — — — —
Cash Flows from Financing Activities (37,168) (50,837) 186,201 (56,716) 41,480
Effect of exchange rates on cash and cash equivalents — — 24,454 — 24,454
(Decrease) Increase in cash and cash equivalents (373) 23,372 187,675 (109,272) 101,402
Cash and cash equivalents, beginning of period 2,405 23,380 210,699 — 236,484
Cash and cash equivalents, end of period $ 2,032 $ 46,752 $ 398,374 $ (109,272) $ 337,886
45
Table of Contents
IRON MOUNTAIN INCORPORATED
NOTES TO CONDENSED CONSOLIDATED FINANCIAL STATEMENTS (Continued)
(In Thousands, Except Share and Per Share Data)
(Unaudited)
(7) Segment Information
Our five reportable operating segments as of December 31, 2016 are described in Note 9 to Notes to Consolidated Financial Statements included in ourAnnual Report and are as follows:
• North American Records and Information Management Business• North American Data Management Business• Western European Business• Other International Business• Corporate and Other Business
There have been no changes made to our reportable operating segments since December 31, 2016, other than the impact of the Russia and UkraineDivestment. Prior to the Russia and Ukraine Divestment, our businesses in Russia and Ukraine were a component of our Other International Business segment. Theoperations associated with acquisitions completed during the first nine months of 2017 (which are described in Note 4) have been incorporated into our existingreportable operating segments.
46
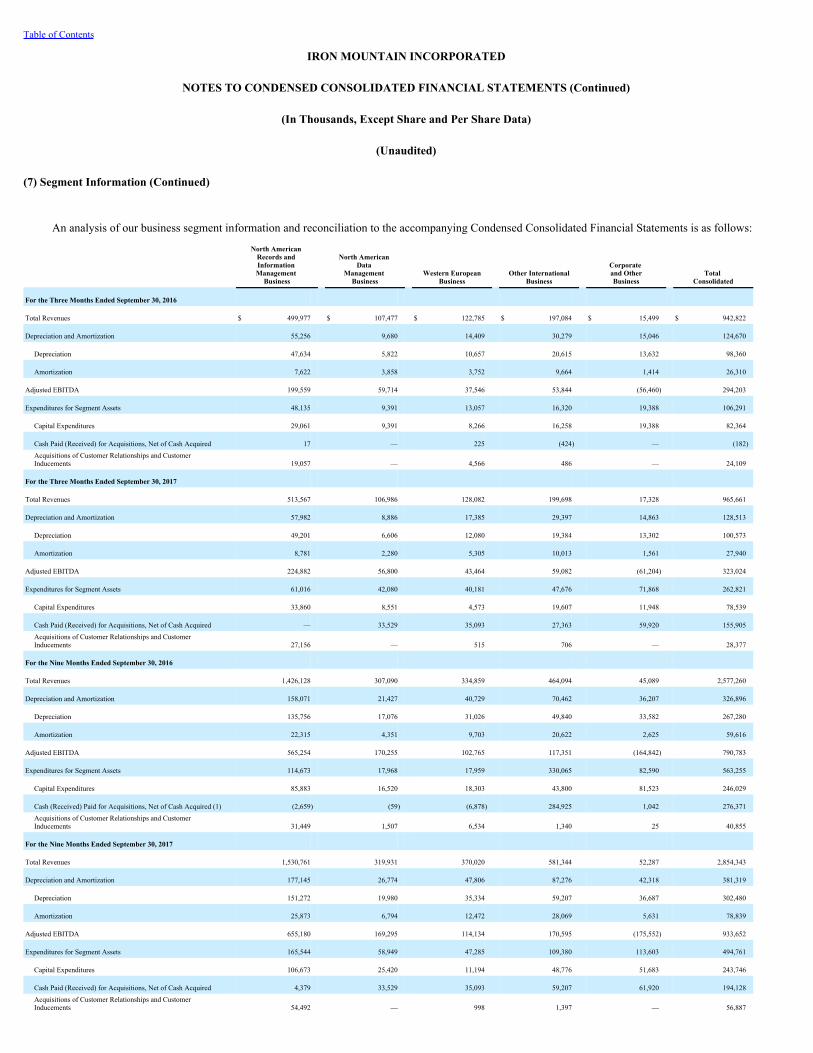
Table of Contents
IRON MOUNTAIN INCORPORATED
NOTES TO CONDENSED CONSOLIDATED FINANCIAL STATEMENTS (Continued)
(In Thousands, Except Share and Per Share Data)
(Unaudited)
(7) Segment Information (Continued)
An analysis of our business segment information and reconciliation to the accompanying Condensed Consolidated Financial Statements is as follows:
North American Records and Information Management
Business
North American Data
Management Business Western European
Business Other InternationalBusiness
Corporate and OtherBusiness Total
Consolidated
For the Three Months Ended September 30, 2016
Total Revenues $ 499,977 $ 107,477 $ 122,785 $ 197,084 $ 15,499 $ 942,822
Depreciation and Amortization 55,256 9,680 14,409 30,279 15,046 124,670
Depreciation 47,634 5,822 10,657 20,615 13,632 98,360
Amortization 7,622 3,858 3,752 9,664 1,414 26,310
Adjusted EBITDA 199,559 59,714 37,546 53,844 (56,460) 294,203
Expenditures for Segment Assets 48,135 9,391 13,057 16,320 19,388 106,291
Capital Expenditures 29,061 9,391 8,266 16,258 19,388 82,364
Cash Paid (Received) for Acquisitions, Net of Cash Acquired 17 — 225 (424) — (182)Acquisitions of Customer Relationships and CustomerInducements 19,057 — 4,566 486 — 24,109
For the Three Months Ended September 30, 2017
Total Revenues 513,567 106,986 128,082 199,698 17,328 965,661
Depreciation and Amortization 57,982 8,886 17,385 29,397 14,863 128,513
Depreciation 49,201 6,606 12,080 19,384 13,302 100,573
Amortization 8,781 2,280 5,305 10,013 1,561 27,940
Adjusted EBITDA 224,882 56,800 43,464 59,082 (61,204) 323,024
Expenditures for Segment Assets 61,016 42,080 40,181 47,676 71,868 262,821
Capital Expenditures 33,860 8,551 4,573 19,607 11,948 78,539
Cash Paid (Received) for Acquisitions, Net of Cash Acquired — 33,529 35,093 27,363 59,920 155,905Acquisitions of Customer Relationships and CustomerInducements 27,156 — 515 706 — 28,377
For the Nine Months Ended September 30, 2016
Total Revenues 1,426,128 307,090 334,859 464,094 45,089 2,577,260
Depreciation and Amortization 158,071 21,427 40,729 70,462 36,207 326,896
Depreciation 135,756 17,076 31,026 49,840 33,582 267,280
Amortization 22,315 4,351 9,703 20,622 2,625 59,616
Adjusted EBITDA 565,254 170,255 102,765 117,351 (164,842) 790,783
Expenditures for Segment Assets 114,673 17,968 17,959 330,065 82,590 563,255
Capital Expenditures 85,883 16,520 18,303 43,800 81,523 246,029
Cash (Received) Paid for Acquisitions, Net of Cash Acquired (1) (2,659) (59) (6,878) 284,925 1,042 276,371Acquisitions of Customer Relationships and CustomerInducements 31,449 1,507 6,534 1,340 25 40,855
For the Nine Months Ended September 30, 2017
Total Revenues 1,530,761 319,931 370,020 581,344 52,287 2,854,343
Depreciation and Amortization 177,145 26,774 47,806 87,276 42,318 381,319
Depreciation 151,272 19,980 35,334 59,207 36,687 302,480
Amortization 25,873 6,794 12,472 28,069 5,631 78,839
Adjusted EBITDA 655,180 169,295 114,134 170,595 (175,552) 933,652
Expenditures for Segment Assets 165,544 58,949 47,285 109,380 113,603 494,761
Capital Expenditures 106,673 25,420 11,194 48,776 51,683 243,746
Cash Paid (Received) for Acquisitions, Net of Cash Acquired 4,379 33,529 35,093 59,207 61,920 194,128Acquisitions of Customer Relationships and CustomerInducements 54,492 — 998 1,397 — 56,887

______________________________________________________________
47
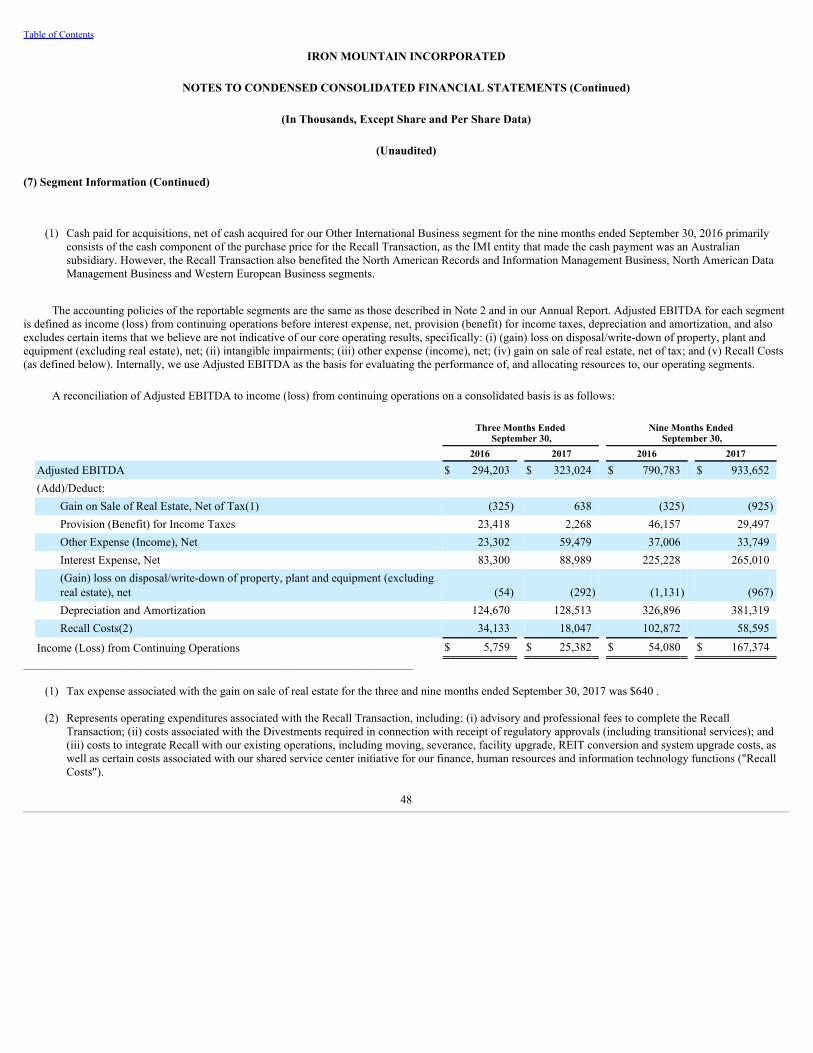
Table of Contents
IRON MOUNTAIN INCORPORATED
NOTES TO CONDENSED CONSOLIDATED FINANCIAL STATEMENTS (Continued)
(In Thousands, Except Share and Per Share Data)
(Unaudited)
(7) Segment Information (Continued)
(1) Cash paid for acquisitions, net of cash acquired for our Other International Business segment for the nine months ended September 30, 2016 primarilyconsists of the cash component of the purchase price for the Recall Transaction, as the IMI entity that made the cash payment was an Australiansubsidiary. However, the Recall Transaction also benefited the North American Records and Information Management Business, North American DataManagement Business and Western European Business segments.
The accounting policies of the reportable segments are the same as those described in Note 2 and in our Annual Report. Adjusted EBITDA for each segmentis defined as income (loss) from continuing operations before interest expense, net, provision (benefit) for income taxes, depreciation and amortization, and alsoexcludes certain items that we believe are not indicative of our core operating results, specifically: (i) (gain) loss on disposal/write-down of property, plant andequipment (excluding real estate), net; (ii) intangible impairments; (iii) other expense (income), net; (iv) gain on sale of real estate, net of tax; and (v) Recall Costs(as defined below). Internally, we use Adjusted EBITDA as the basis for evaluating the performance of, and allocating resources to, our operating segments.
A reconciliation of Adjusted EBITDA to income (loss) from continuing operations on a consolidated basis is as follows:
Three Months Ended
September 30, Nine Months Ended
September 30, 2016 2017 2016 2017
Adjusted EBITDA $ 294,203 $ 323,024 $ 790,783 $ 933,652(Add)/Deduct:
Gain on Sale of Real Estate, Net of Tax(1) (325) 638 (325) (925)Provision (Benefit) for Income Taxes 23,418 2,268 46,157 29,497Other Expense (Income), Net 23,302 59,479 37,006 33,749Interest Expense, Net 83,300 88,989 225,228 265,010(Gain) loss on disposal/write-down of property, plant and equipment (excludingreal estate), net (54) (292) (1,131) (967)Depreciation and Amortization 124,670 128,513 326,896 381,319Recall Costs(2) 34,133 18,047 102,872 58,595
Income (Loss) from Continuing Operations $ 5,759 $ 25,382 $ 54,080 $ 167,374_______________________________________________________________________________
(1) Tax expense associated with the gain on sale of real estate for the three and nine months ended September 30, 2017 was $640 .
(2) Represents operating expenditures associated with the Recall Transaction, including: (i) advisory and professional fees to complete the RecallTransaction; (ii) costs associated with the Divestments required in connection with receipt of regulatory approvals (including transitional services); and(iii) costs to integrate Recall with our existing operations, including moving, severance, facility upgrade, REIT conversion and system upgrade costs, aswell as certain costs associated with our shared service center initiative for our finance, human resources and information technology functions ("RecallCosts").
48
Table of Contents
IRON MOUNTAIN INCORPORATED
NOTES TO CONDENSED CONSOLIDATED FINANCIAL STATEMENTS (Continued)
(In Thousands, Except Share and Per Share Data)
(Unaudited)
(8) Commitments and Contingencies
a. Litigation—General
We are involved in litigation from time to time in the ordinary course of business. A portion of the defense and/or settlement costs associated with suchlitigation is covered by various commercial liability insurance policies purchased by us and, in limited cases, indemnification from third parties. Our policy is toestablish reserves for loss contingencies when the losses are both probable and reasonably able to be estimated. We record legal costs associated with losscontingencies as expenses in the period in which they are incurred. The matters described below represent our significant loss contingencies. We have evaluatedeach matter and, if both probable and reasonably able to be estimated, accrued an amount that represents our estimate of any probable loss associated with suchmatter. In addition, we have estimated a reasonably possible range for all loss contingencies including those described below. We believe it is reasonably possiblethat we could incur aggregate losses in addition to amounts currently accrued for all matters up to an additional $19,500 over the next several years, of whichcertain amounts would be covered by insurance or indemnity arrangements.
b. Italy Fire
On November 4, 2011, we experienced a fire at a facility we leased in Aprilia, Italy. The facility primarily stored archival and inactive business records forlocal area businesses. Despite quick response by local fire authorities, damage to the building was extensive, and the building and its contents were a total loss. Wehave been sued by six customers. Four of those lawsuits have been settled and two remain pending, including a claim asserted by Azienda per i TransportiAutoferrotranviari del Comune di Roma, S.p.A, seeking 42,600 Euros for the loss of its current and historical archives. We have also received correspondencefrom other affected customers, including certain customers demanding payment under various theories of liability. Although our warehouse legal liability insurerhas reserved its rights to contest coverage related to certain types of potential claims, we believe we carry adequate insurance. We deny any liability with respect tothe fire and we have referred these claims to our warehouse legal liability insurer for an appropriate response. We do not expect that this event will have a materialimpact on our consolidated financial condition, results of operations or cash flows. We sold our Italian operations on April 27, 2012, and we indemnified thebuyers related to certain obligations and contingencies associated with the fire. As a result of the sale of the Italian operations, any future statement of operationsand cash flow impacts related to the fire will be reflected as discontinued operations.
c. Argentina Fire
On February 5, 2014, we experienced a fire at a facility we own in Buenos Aires, Argentina. As a result of the quick response by local fire authorities, thefire was contained before the entire facility was destroyed and all employees were safely evacuated; however, a number of first responders lost their lives, or insome cases, were severely injured. The cause of the fire is currently being investigated. We believe we carry adequate insurance and do not expect that this eventwill have a material impact to our consolidated financial condition, results of operations or cash flows. Revenues from our operations at this facility represent lessthan 0.5% of our consolidated revenues.
d. Brooklyn Fire (Recall)
On January 31, 2015, a former Recall leased facility located in Brooklyn, New York was completely destroyed by a fire. Approximately 900,000 cartons ofcustomer records were lost impacting approximately 1,200 customers. No one was injured as a result of the fire. We believe we carry adequate insurance to coverany losses resulting from the fire. There are two pending customer-related lawsuits stemming from the fire, which are being defended by our warehouse legalliability insurer. We have also received correspondence from other customers, under various theories of liability. We deny any liability with respect to the fire andwe have referred these claims to our insurer for an appropriate response. We do not expect that this event will have a material impact on our consolidated financialcondition, results of operations or cash flows.
49
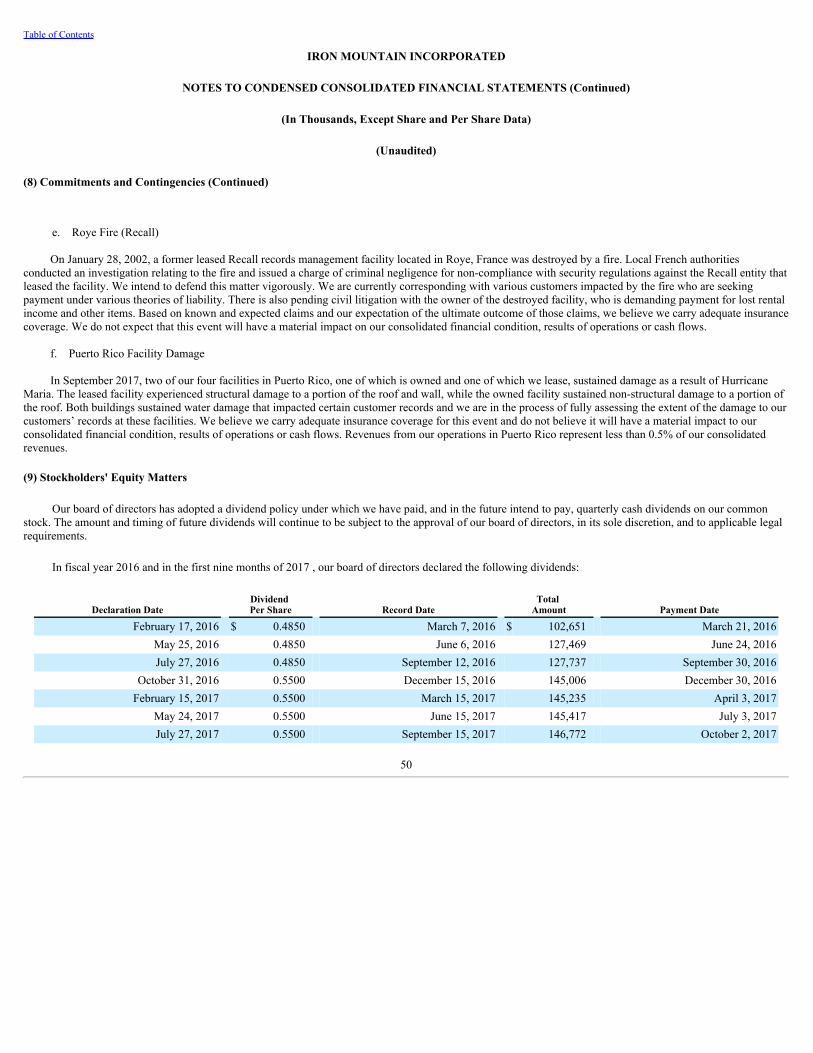
Table of Contents
IRON MOUNTAIN INCORPORATED
NOTES TO CONDENSED CONSOLIDATED FINANCIAL STATEMENTS (Continued)
(In Thousands, Except Share and Per Share Data)
(Unaudited)
(8) Commitments and Contingencies (Continued)
e. Roye Fire (Recall)
On January 28, 2002, a former leased Recall records management facility located in Roye, France was destroyed by a fire. Local French authoritiesconducted an investigation relating to the fire and issued a charge of criminal negligence for non-compliance with security regulations against the Recall entity thatleased the facility. We intend to defend this matter vigorously. We are currently corresponding with various customers impacted by the fire who are seekingpayment under various theories of liability. There is also pending civil litigation with the owner of the destroyed facility, who is demanding payment for lost rentalincome and other items. Based on known and expected claims and our expectation of the ultimate outcome of those claims, we believe we carry adequate insurancecoverage. We do not expect that this event will have a material impact on our consolidated financial condition, results of operations or cash flows.
f. Puerto Rico Facility Damage
In September 2017, two of our four facilities in Puerto Rico, one of which is owned and one of which we lease, sustained damage as a result of HurricaneMaria. The leased facility experienced structural damage to a portion of the roof and wall, while the owned facility sustained non-structural damage to a portion ofthe roof. Both buildings sustained water damage that impacted certain customer records and we are in the process of fully assessing the extent of the damage to ourcustomers’ records at these facilities. We believe we carry adequate insurance coverage for this event and do not believe it will have a material impact to ourconsolidated financial condition, results of operations or cash flows. Revenues from our operations in Puerto Rico represent less than 0.5% of our consolidatedrevenues.
(9) Stockholders' Equity Matters
Our board of directors has adopted a dividend policy under which we have paid, and in the future intend to pay, quarterly cash dividends on our commonstock. The amount and timing of future dividends will continue to be subject to the approval of our board of directors, in its sole discretion, and to applicable legalrequirements.
In fiscal year 2016 and in the first nine months of 2017 , our board of directors declared the following dividends:
Declaration Date Dividend Per Share Record Date
Total Amount Payment Date
February 17, 2016 $ 0.4850 March 7, 2016 $ 102,651 March 21, 2016May 25, 2016 0.4850 June 6, 2016 127,469 June 24, 2016July 27, 2016 0.4850 September 12, 2016 127,737 September 30, 2016
October 31, 2016 0.5500 December 15, 2016 145,006 December 30, 2016February 15, 2017 0.5500 March 15, 2017 145,235 April 3, 2017
May 24, 2017 0.5500 June 15, 2017 145,417 July 3, 2017July 27, 2017 0.5500 September 15, 2017 146,772 October 2, 2017
50
Table of Contents
IRON MOUNTAIN INCORPORATED
NOTES TO CONSOLIDATED FINANCIAL STATEMENTS (Continued)
(In Thousands, Except Share and Per Share Data)
(Unaudited)
(10) Divestments
a. Divestments Associated with the Recall Transaction
As disclosed in Note 4, in connection with the acquisition of Recall, we sought regulatory approval of the Recall Transaction from the DOJ, the ACCC, theCCB and the CMA and, as part of the regulatory approval process, we agreed to make the Divestments.
On May 4, 2016, we completed the sale of the Initial United States Divestments to Access CIG, LLC, a privately held provider of information managementservices throughout the United States (“Access CIG”), for total consideration of approximately $80,000 , subject to adjustments (the “Access Sale”). Of the totalconsideration, we received $55,000 in cash proceeds upon closing of the Access Sale, and we are entitled to receive up to $25,000 of additional cash proceeds (the"Access Contingent Consideration") on August 4, 2018, the 27-month anniversary of the closing of the Access Sale. Our estimate of the fair value of the AccessContingent Consideration is approximately $21,400 (which reflects a fair value adjustment of approximately $2,200 and a present value adjustment ofapproximately $1,400 ). We have a non-trade receivable amounting to $22,300 included in Prepaid expenses and other in our Condensed Consolidated BalanceSheet as of September 30, 2017 related to the Access Contingent Consideration.
On December 29, 2016, we completed the sale of the Seattle/Atlanta Divestments, the Recall Canadian Divestments and the Iron Mountain CanadianDivestments to Arkive Information Management LLC and Arkive Information Management Ltd., both information management companies (collectively,“ARKIVE”), for total consideration of approximately $50,000 , subject to adjustments (the “ARKIVE Sale”). Of the total consideration, we receivedapproximately $45,000 in cash proceeds upon the closing of the ARKIVE Sale and the remaining consideration is held in escrow. ARKIVE may be entitled toreceive from us, on the 24-month anniversary of the closing of the ARKIVE Sale, cash payments, up to the total consideration paid by ARKIVE, based on lostrevenues attributable to the acquired customer base.
On October 31, 2016, after receiving approval of the proposed transaction from the ACCC, we completed the sale of the Australia Divestment Business (the“Australia Sale”) to a consortium led by Housatonic Partners (the “Australia Divestment Business Purchasers”) for total consideration of approximately 70,000Australian dollars (or approximately $53,200 , based upon the exchange rate between the United States dollar and the Australian dollar as of October 31, 2016, theclosing date of the Australia Sale), subject to adjustments. The total consideration consists of (i) 35,000 Australian dollars in cash received upon the closing of theAustralia Sale and (ii) 35,000 Australian dollars in the form of a note due from the Australia Divestment Business Purchasers to us (the “Bridging Loan Note”).The Bridging Loan Note bears interest at 3.3% per annum and matures on December 29, 2017, at which point all outstanding obligations become due. The totalconsideration for the Australia Sale is subject to certain adjustments, including ones associated with customer attrition, subsequent to the closing of the AustraliaSale.
On December 9, 2016, we completed the sale of the UK Divestments (the "UK Sale") to the Oasis Group for total consideration of approximately 1,800British pounds sterling (or approximately $2,200 , based upon the exchange rate between the United States dollar and the British pound sterling as of December 9,2016, the closing date of the UK Sale), subject to adjustments.
We have concluded that the Australia Divestment Business and the Iron Mountain Canadian Divestments (collectively, the “Iron Mountain Divestments”) donot meet the criteria to be reported as discontinued operations as our decision to divest these businesses did not represent a strategic shift that had a major effect onour operations and financial results. Accordingly, the revenues and expenses associated with the Iron Mountain Divestments are presented as a component ofincome (loss) from continuing operations in our Condensed Consolidated Statements of Operations for the three and nine months ended September 30, 2016 andthe cash flows associated with the Iron Mountain Divestments are presented as a component of cash flows from continuing operations in our CondensedConsolidated Statement of Cash Flows for the nine months ended September 30, 2016.
We have concluded that the Initial United States Divestments, the Seattle/Atlanta Divestments, the Recall Canadian Divestments and the UK Divestments(collectively, the “Recall Divestments”) meet the criteria to be reported as discontinued operations in our Consolidated Statements of Operations and ConsolidatedStatements of Cash Flows as the Recall Divestments met the criteria to be reported as assets and liabilities held for sale at, or within a short period of timefollowing, the closing of the Recall Transaction.
51

Table of Contents
IRON MOUNTAIN INCORPORATED
NOTES TO CONDENSED CONSOLIDATED FINANCIAL STATEMENTS (Continued)
(In Thousands, Except Share and Per Share Data)
(Unaudited)
(10) Divestments (Continued)
The table below summarizes certain results of operations of the Recall Divestments for the three and nine months ended September 30, 2016:
Three Months Ended September 30, 2016
Description
Initial United States
Divestments(1) Seattle/Atlanta
Divestments Recall Canadian
Divestments UK Divestments Total
Total Revenues $ — $ 3,200 $ 2,977 $ 385 $ 6,562Income (Loss) from Discontinued OperationsBefore Provision (Benefit) for Income Taxes — 1,534 888 (88) 2,334Provision (Benefit) for Income Taxes — 70 — 239 (16) 293Income (Loss) from DiscontinuedOperations, Net of Tax $ — $ 1,464 $ 649 $ (72) $ 2,041
Nine Months Ended September 30, 2016
Description
Initial United States
Divestments(1) Seattle/Atlanta
Divestments Recall Canadian
Divestments UK Divestments Total(1)
Total Revenues $ — $ 5,010 $ 4,865 $ 696 $ 10,571Income (Loss) from Discontinued OperationsBefore Provision (Benefit) for Income Taxes — 2,468 1,755 (13) 4,210Provision (Benefit) for Income Taxes — 114 — 471 (3) 582Income (Loss) from DiscontinuedOperations, Net of Tax $ — $ 2,354 $ 1,284 $ (10) $ 3,628
_____________________________________________________________________________
(1) The Access Sale occurred nearly simultaneously with the closing of the Recall Transaction. Accordingly, the revenue and expenses associated with theInitial United States Divestments are not included in our Condensed Consolidated Statements of Operations for the three and nine months endedSeptember 30, 2016, respectively, and the cash flows associated with the Initial United States Divestments are not included in our CondensedConsolidated Statement of Cash Flows for the nine months ended September 30, 2016, due to the immaterial nature of the revenues, expenses and cashflows related to the Initial United States Divestments for the period of time we owned these businesses (May 2, 2016 through May 4, 2016).
52

Table of Contents
IRON MOUNTAIN INCORPORATED
NOTES TO CONDENSED CONSOLIDATED FINANCIAL STATEMENTS (Continued)
(In Thousands, Except Share and Per Share Data)
(Unaudited)
(10) Divestments (Continued)
The table below summarizes certain results of operations of the Recall Divestments for the three and nine months ended September 30, 2017:
Three Months Ended September 30, 2017
Description
InitialUnited StatesDivestments
Seattle/AtlantaDivestments
Recall CanadianDivestments UK Divestments Total(1)
Income (Loss) from Discontinued OperationsBefore Provision (Benefit) for Income Taxes $ — $ (1,061) $ (617) $ — $ (1,678)Provision (Benefit) for Income Taxes — (383) — (237) — (620)Income (Loss) from DiscontinuedOperations, Net of Tax $ — $ (678) $ (380) $ — $ (1,058)
Nine Months Ended September 30, 2017
Description
Initial United StatesDivestments
Seattle/AtlantaDivestments
Recall CanadianDivestments UK Divestments Total(1)
Income (Loss) from Discontinued OperationsBefore Provision (Benefit) for Income Taxes $ — $ (2,623) $ (2,533) $ — $ (5,156)Provision (Benefit) for Income Taxes — (988) — (747) — (1,735)Income (Loss) from Discontinued Operations,Net of Tax $ — $ (1,635) $ (1,786) $ — $ (3,421)
_____________________________________________________________________________
(1) During the three and nine months ended September 30, 2017, the loss from discontinued operations before benefit for income taxes of $1,678 and $5,156 ,respectively, was primarily related to costs to provide transition services related to the Recall Divestments.
b. Russia and Ukraine Divestment
On May 30, 2017, IM EES, a consolidated subsidiary of IMI, sold its records and information management operations in Russia and Ukraine to OSG RecordsManagement (Europe) Limited (“OSG”) in a stock transaction (the “Russia and Ukraine Divestment”). As consideration for the Russia and Ukraine Divestment,IM EES received a 25% equity interest in OSG (the “OSG Investment”).
We have concluded that the Russia and Ukraine Divestment does not meet the criteria to be reported as discontinued operations in our consolidated financialstatements, as our decision to divest these businesses does not represent a strategic shift that will have a major effect on our operations and financial results.Accordingly, the revenues and expenses associated with these businesses are presented as a component of income (loss) from continuing operations in ourCondensed Consolidated Statements of Operations for the three and nine months ended September 30, 2016 and the nine months ended September 30, 2017,respectively, and the cash flows associated with these businesses are presented as a component of cash flows from continuing operations in our CondensedConsolidated Statements of Cash Flows for the nine months ended September 30, 2016 and 2017, respectively.
53
Table of Contents
IRON MOUNTAIN INCORPORATED
NOTES TO CONDENSED CONSOLIDATED FINANCIAL STATEMENTS (Continued)
(In Thousands, Except Share and Per Share Data)
(Unaudited)
(10) Divestments (Continued)
As a result of the Russia and Ukraine Divestment, we recorded a gain on sale of $38,869 to other expense (income), net, in the second quarter of 2017,representing the excess of the fair value of the consideration received over the carrying value of our businesses in Russia and Ukraine. As of the closing date of theRussia and Ukraine Divestment, the fair value of the OSG Investment was approximately $18,000 . As of the closing date of the Russia and Ukraine Divestment,the carrying value of our businesses in Russia and Ukraine was a credit balance of $20,869 , which consisted of (i) a credit balance of approximately $29,100 ofcumulative translation adjustment associated with our businesses in Russia and Ukraine that was reclassified from accumulated other comprehensive items, net, (ii)the carrying value of the net assets of our businesses in Russia and Ukraine, excluding goodwill, of $4,716 and (iii) $3,515 of goodwill associated with ourNorthern and Eastern Europe reporting unit (of which our businesses in Russia and Ukraine were a component of prior to the Russia and Ukraine Divestment),which was allocated, on a relative fair value basis, to our businesses in Russia and Ukraine.
We account for the OSG Investment as an equity method investment. The fair value of the OSG Investment is $17,973 and is presented as a component ofOther within Other assets, net in our Condensed Consolidated Balance Sheet as of September 30, 2017.
54
Table of Contents
IRON MOUNTAIN INCORPORATED
NOTES TO CONDENSED CONSOLIDATED FINANCIAL STATEMENTS (Continued)
(In Thousands, Except Share and Per Share Data)
(Unaudited)
(11) Recall Costs
Recall Costs included in the accompanying Condensed Consolidated Statements of Operations are as follows:
Three Months Ended
September 30, Nine Months Ended
September 30,
2016 2017 2016 2017
Cost of sales (excluding depreciation and amortization) $ 4,457 $ 3,059 $ 4,788 $ 16,019Selling, general and administrative expenses 29,676 14,988 98,084 42,576
Total Recall Costs $ 34,133 $ 18,047 $ 102,872 $ 58,595
Recall Costs included in the accompanying Condensed Consolidated Statements of Operations by segment are as follows:
Three Months Ended
September 30, Nine Months Ended
September 30,
2016 2017 2016 2017
North American Records and Information Management Business $ 4,989 $ 2,540 $ 7,822 $ 16,165North American Data Management Business 1,578 295 2,095 2,171Western European Business 7,483 2,586 11,613 7,933Other International Business 5,638 2,570 11,586 6,158Corporate and Other Business 14,445 10,056 69,756 26,168
Total Recall Costs $ 34,133 $ 18,047 $ 102,872 $ 58,595
A rollforward of accrued liabilities related to Recall Costs on our Condensed Consolidated Balance Sheets as of December 31, 2016 to September 30, 2017 isas follows:
Accrual for Recall Costs
Balance at December 31, 2016 $ 4,914Amounts accrued 18,803Change in estimates(1) (230)Payments (15,179)Currency translation adjustments 89
Balance at September 30, 2017(2) $ 8,397
_______________________________________________________________________________
(1) Includes adjustments made to amounts accrued in a prior period.
(2) Accrued liabilities related to Recall Costs as of September 30, 2017 presented in the table above generally related to employee severance costs andonerous lease liabilities. We expect that the majority of these liabilities will be paid throughout 2017. Additional Recall Costs recorded in our CondensedConsolidated Statement of Operations have either been settled in cash during the nine months ended September 30, 2017 or are included in ourCondensed Consolidated Balance Sheet as of September 30, 2017 as a component of accounts payable.
55
Table of Contents
IRON MOUNTAIN INCORPORATED
NOTES TO CONDENSED CONSOLIDATED FINANCIAL STATEMENTS (Continued)
(In Thousands, Except Share and Per Share Data)
(Unaudited)
(12) Subsequent Events
Credit Suisse Data Center Acquisition
In October 2017, we entered into agreements to acquire two Credit Suisse data centers located in London and Singapore from Credit Suisse International andCredit Suisse AG (together, "Credit Suisse") for an aggregate purchase price of approximately $100,000 (the “Credit Suisse Transaction”). As part of the CreditSuisse Transaction, we will take ownership of both data center facilities, with Credit Suisse entering into a long-term lease with us to maintain existing data centeroperations. The completion of the Credit Suisse Transaction is subject to closing conditions; accordingly, we can provide no assurance that we will be able tocomplete the Credit Suisse Transaction, that the Credit Suisse Transaction will not be delayed or that the terms will remain the same. We expect to close the CreditSuisse Transaction during the first quarter of 2018.
At The Market Equity Program
In October 2017, we entered into a distribution agreement (the “Distribution Agreement”) with a syndicate of 10 banks (the “Agents”) pursuant to which wemay sell, from time to time, up to an aggregate sales price of $500,000 of our common stock, par value $0.01 per share, through the Agents (the “At The Market(ATM) Equity Program”). Sales of our common stock made pursuant to the Distribution Agreement, if any, may be made in negotiated transactions or transactionsthat are deemed to be “at the market” offerings as defined in Rule 415 under the Securities Act, including sales made directly on the NYSE, or sales made to orthrough a market maker other than on an exchange, or as otherwise agreed between the applicable Agent and us. We intend to use the net proceeds from sales ofour common stock pursuant to the At The Market (ATM) Equity Program for general corporate purposes, including financing the expansion of our adjacentbusinesses through acquisitions, such as the Credit Suisse Transaction, and repaying amounts outstanding from time to time under the Revolving Credit Facility.
56
Table of Contents
IRON MOUNTAIN INCORPORATED
Item 2. Management's Discussion and Analysis of Financial Condition and Results of Operations
The following discussion and analysis of our financial condition and results of operations for the three and nine months ended September 30, 2017 should beread in conjunction with our Condensed Consolidated Financial Statements and Notes thereto for the three and nine months ended September 30, 2017 , includedherein, and our Consolidated Financial Statements and Notes thereto for the year ended December 31, 2016 , included in our Annual Report on Form 10-K filedwith the United States Securities and Exchange Commission ("SEC") on February 23, 2017 (our "Annual Report").
FORWARD-LOOKING STATEMENTS
We have made statements in this Quarterly Report on Form 10-Q ("Quarterly Report") that constitute "forward-looking statements" as that term is defined inthe Private Securities Litigation Reform Act of 1995 and other securities laws. These forward-looking statements concern our operations, economic performance,financial condition, goals, beliefs, future growth strategies, investment objectives, plans and current expectations, such as our (1) commitment to future dividendpayments, (2) expected 2017 consolidated internal storage rental revenue growth rate and capital expenditures, (3) estimate of total acquisition and integrationexpenditures associated with our acquisition of Recall Holdings Limited ("Recall") pursuant to the Scheme Implementation Deed, as amended, with Recall (the"Recall Transaction"), and (4) our ability to close pending acquisitions. These forward-looking statements are subject to various known and unknown risks,uncertainties and other factors. When we use words such as "believes," "expects," "anticipates," "estimates" or similar expressions, we are making forward-lookingstatements. Although we believe that our forward-looking statements are based on reasonable assumptions, our expected results may not be achieved, and actualresults may differ materially from our expectations. In addition, important factors that could cause actual results to differ from expectations include, among others:
• our ability to remain qualified for taxation as a real estate investment trust for United States federal income tax purposes ("REIT");• the adoption of alternative technologies and shifts by our customers to storage of data through non-paper based technologies;• changes in customer preferences and demand for our storage and information management services;• the cost to comply with current and future laws, regulations and customer demands relating to data security and privacy issues, as well as fire and
safety standards;• the impact of litigation or disputes that may arise in connection with incidents in which we fail to protect our customers' information;• changes in the price for our storage and information management services relative to the cost of providing such storage and information management
services;• changes in the political and economic environments in the countries in which our international subsidiaries operate and changes in the global political
climate;• our ability or inability to complete acquisitions on satisfactory terms, to close pending acquisitions and to integrate acquired companies efficiently;• changes in the amount of our capital expenditures and our ability to invest according to plan;• changes in the cost of our debt;• the impact of alternative, more attractive investments on dividends;• the cost or potential liabilities associated with real estate necessary for our business;• the performance of business partners upon whom we depend for technical assistance or management expertise outside the United States; and• other trends in competitive or economic conditions affecting our financial condition or results of operations not presently contemplated.
You should not rely upon forward-looking statements except as statements of our present intentions and of our present expectations, which may or may notoccur. You should read these cautionary statements as being applicable to all forward-looking statements wherever they appear. Except as required by law, weundertake no obligation to release publicly the result of any revision to these forward-looking statements that may be made to reflect events or circumstances afterthe date hereof or to reflect the occurrence of unanticipated events. Readers are also urged to carefully review and consider the various disclosures we have madein this Quarterly Report, as well as our other periodic reports filed with the SEC including under "Risk Factors" in our Annual Report.
57
Table of Contents
Overview
The following discussions set forth, for the periods indicated, management's discussion and analysis of financial condition and results of operations.Significant trends and changes are discussed for the three and nine month periods ended September 30, 2017 within each section. Trends and changes that areconsistent with the three and nine month periods are not repeated and are discussed on a year to date basis only.
Recall Acquisition
On May 2, 2016 (Sydney, Australia time), we completed the Recall Transaction. The results of operations of Recall have been included in our consolidatedresults from May 2, 2016. See Note 4 to Notes to Condensed Consolidated Financial Statements included in this Quarterly Report for unaudited pro forma resultsof operations for us and Recall, as if the Recall Transaction was completed on January 1, 2015, for the three and nine months ended September 30, 2016.
We currently estimate total acquisition and integration expenditures associated with the Recall Transaction to be approximately $380.0 million, the majorityof which is expected to be incurred by the end of 2018. This amount consists of (i) operating expenditures to complete the Recall Transaction, including advisoryand professional fees and costs associated with the Divestments (as defined in Note 4 to Notes to Condensed Consolidated Financial Statements included in thisQuarterly Report) required in connection with receipt of regulatory approvals (including transitional services) and costs to integrate Recall with our existingoperations, including moving, severance, facility upgrade, REIT conversion and system upgrade costs, as well as certain costs associated with our shared servicecenter initiative for our finance, human resources and information technology functions ("Recall Costs") and (ii) capital expenditures to integrate Recall with ourexisting operations. From January 1, 2015 through September 30, 2017 , we have incurred cumulative operating and capital expenditures associated with the RecallTransaction of $279.9 million , including $237.6 million of Recall Costs and $42.4 million of capital expenditures.
See Note 11 to Notes to Condensed Consolidated Financial Statements included in this Quarterly Report for more information on Recall Costs, includingcosts recorded by segment as well as recorded between cost of sales and selling, general and administrative expenses.
Divestments
a. Divestments Associated with the Recall Transaction
As disclosed in Note 4 to Notes to Condensed Consolidated Financial Statements included in this Quarterly Report, we sought regulatory approval of theRecall Transaction and, as part of the regulatory approval process, we agreed to make the Divestments.
The Initial United States Divestments, the Seattle/Atlanta Divestments, the Recall Canadian Divestments and the UK Divestments (each as defined in Note 6to Notes to Consolidated Financial Statements included in our Annual Report) (collectively, the "Recall Divestments") meet the criteria to be reported asdiscontinued operations as the Recall Divestments met the criteria to be reported as assets and liabilities held for sale at, or within a short period of time following,the closing of the Recall Transaction. Accordingly, the results of operations for the Recall Divestments are presented as a component of discontinued operations inour Condensed Consolidated Statements of Operations for the three and nine months ended September 30, 2016 and 2017 and the cash flows associated with theRecall Divestments are presented as a component of cash flows from discontinued operations in our Condensed Consolidated Statements of Cash Flows for thenine months ended September 30, 2016 and 2017.
The Australia Divestment Business and the Iron Mountain Canadian Divestments (each as defined in Note 6 to Notes to Consolidated Financial Statementsincluded in our Annual Report) (collectively, the "Iron Mountain Divestments") do not meet the criteria to be reported as discontinued operations as our decision todivest the Iron Mountain Divestments does not represent a strategic shift that will have a major effect on our operations and financial results. Accordingly, therevenues and expenses associated with the Iron Mountain Divestments are presented as a component of income (loss) from continuing operations in our CondensedConsolidated Statement of Operations for the three and nine months ended September 30, 2016 and the cash flows associated with the Iron Mountain Divestmentsare presented as a component of cash flows from continuing operations in our Condensed Consolidated Statement of Cash Flows for the nine months endedSeptember 30, 2016 .
58
Table of Contents
The Australia Divestment Business represents approximately $11.6 million and $35.8 million of total revenues and approximately $0.1 million and $0.3million of total loss from continuing operations for the three and nine months ended September 30, 2016 , respectively. The Iron Mountain Canadian Divestmentsrepresent approximately $1.3 million and $3.9 million of total revenues and approximately $1.0 million and $2.8 million of total income from continuingoperations for the three and nine months ended September 30, 2016 , respectively. The Australia Divestment Business was previously included in our OtherInternational Business segment and the Iron Mountain Canadian Divestments were previously included in our North American Records and InformationManagement Business segment.
b. Iron Mountain - Russia and Ukraine Divestment
On May 30, 2017, Iron Mountain EES Holdings Ltd. ("IM EES"), a consolidated subsidiary of Iron Mountain Incorporated ("IMI"), sold its records andinformation management operations in Russia and Ukraine to OSG Records Management (Europe) Limited (“OSG”) in a stock transaction (the “Russia andUkraine Divestment”). As consideration for the Russia and Ukraine Divestment, IM EES received a 25% equity interest in OSG (the "OSG Investment").
We have concluded that the Russia and Ukraine Divestment does not meet the criteria to be reported as discontinued operations in our consolidated financialstatements, as our decision to divest these businesses does not represent a strategic shift that will have a major effect on our operations and financial results.Accordingly, the revenues and expenses associated with these businesses are presented as a component of income (loss) from continuing operations in ourCondensed Consolidated Statement of Operations for the three and nine months ended September 30, 2016 and the nine months ended September 30, 2017,respectively, and the cash flows associated with these businesses are presented as a component of cash flows from continuing operations in our CondensedConsolidated Statement of Cash Flows for the nine months ended September 30, 2016 and 2017, respectively. Our businesses in Russia and Ukraine representapproximately $4.5 million and $12.4 million of total revenues and approximately $(0.9) million and $1.1 million of total (loss) income from continuing operationsfor the three and nine months ended September 30, 2016, respectively. Our businesses in Russia and Ukraine represent approximately $8.6 million of totalrevenues and approximately $0.9 million of total income from continuing operations (excluding the gain on sale described below) for the nine months endedSeptember 30, 2017.
As a result of the Russia and Ukraine Divestment, we recorded a gain on sale of $38.9 million to other expense (income), net, in the second quarter of 2017,representing the excess of the fair value of the consideration received over the carrying value of our businesses in Russia and Ukraine. As of the closing date of theRussia and Ukraine Divestment, the fair value of the OSG Investment was approximately $18.0 million . As of the closing date of the Russia and UkraineDivestment, the carrying value of our businesses in Russia and Ukraine was a credit balance of $20.9 million , which consisted of (i) a credit balance ofapproximately $29.1 million of cumulative translation adjustment associated with our businesses in Russia and Ukraine that was reclassified from accumulatedother comprehensive items, net, (ii) the carrying value of the net assets of our businesses in Russia and Ukraine, excluding goodwill, of $4.7 million and (iii) $3.5million of goodwill associated with our Northern and Eastern Europe reporting unit (of which our businesses in Russia and Ukraine were a component of prior tothe Russia and Ukraine Divestment), which was allocated, on a relative fair value basis, to our businesses in Russia and Ukraine.
Transformation Initiative
During the third quarter of 2015, we implemented a plan that calls for certain organizational realignments to reduce our overhead costs, particularly in ourdeveloped markets, in order to optimize our selling, general and administrative cost structure and to support investments to advance our growth strategy (the"Transformation Initiative"). As a result of the Transformation Initiative, we recorded a charge of $0.2 million and $6.0 million, respectively, for the three and ninemonths ended September 30, 2016 , primarily related to employee severance and associated benefits.
59
Table of Contents
General
Our revenues consist of storage rental revenues as well as service revenues and are reflected net of sales and value added taxes. Storage rental revenues,which are considered a key driver of financial performance for the storage and information management services industry, consist primarily of recurring periodicrental charges related to the storage of materials or data (generally on a per unit basis) that are typically retained by customers for many years, technology escrowservices that protect and manage source code, data backup and storage on our proprietary cloud and revenues associated with our data center operations. Servicerevenues include charges for related service activities, which include: (1) the handling of records, including the addition of new records, temporary removal ofrecords from storage, refiling of removed records and the destruction of records; (2) courier operations, consisting primarily of the pickup and delivery of recordsupon customer request; (3) secure shredding of sensitive documents and the related sale of recycled paper, the price of which can fluctuate from period to period;(4) other services, including the scanning, imaging and document conversion services of active and inactive records, or Information Governance and DigitalSolutions, which relate to physical and digital records, and project revenues; (5) customer termination and permanent removal fees; (6) data restoration projects;(7) special project work; (8) the storage, assembly, reporting and delivery of customer marketing literature, or fulfillment services; (9) consulting services; (10)cloud-related data protection, preservation, restoration and recovery; and (11) other technology services and product sales (including specially designed storagecontainers and related supplies). Our service revenue growth has been negatively impacted by declining activity rates as stored records are becoming less active.While customers continue to store their records and tapes with us, they are less likely than they have been in the past to retrieve records for research and otherpurposes, thereby reducing service activity levels.
Cost of sales (excluding depreciation and amortization) consists primarily of wages and benefits for field personnel, facility occupancy costs (including rentand utilities), transportation expenses (including vehicle leases and fuel), other product cost of sales and other equipment costs and supplies. Of these, wages andbenefits and facility occupancy costs are the most significant. Selling, general and administrative expenses consist primarily of wages and benefits formanagement, administrative, information technology, sales, account management and marketing personnel, as well as expenses related to communications and dataprocessing, travel, professional fees, bad debts, training, office equipment and supplies. Trends in facility occupancy costs are impacted by the total number offacilities we occupy, the mix of properties we own versus properties we occupy under operating leases, fluctuations in per square foot occupancy costs, and thelevels of utilization of these properties. Trends in total wages and benefits in dollars and as a percentage of total consolidated revenue are influenced by changes inheadcount and compensation levels, achievement of incentive compensation targets, workforce productivity and variability in costs associated with medicalinsurance and workers' compensation.
The expansion of our international businesses has impacted the major cost of sales components and selling, general and administrative expenses. Ourinternational operations are more labor intensive relative to revenue than our operations in North America and, therefore, labor costs are a higher percentage ofinternational segment revenue. In addition, the overhead structure of our expanding international operations has generally not achieved the same level of overheadleverage as our North American segments, which may result in an increase in selling, general and administrative expenses, as a percentage of consolidated revenue,as our international operations become a more meaningful percentage of our consolidated results.
Our depreciation and amortization charges result primarily from the capital-intensive nature of our business. The principal components of depreciation relateto storage systems, which include racking structures, buildings, building and leasehold improvements and computer systems hardware and software. Amortizationrelates primarily to customer relationship intangible assets. Both depreciation and amortization are impacted by the timing of acquisitions.
Our consolidated revenues and expenses are subject to the net effect of foreign currency translation related to our entities outside the United States. It isdifficult to predict the future fluctuations of foreign currency exchange rates and how those fluctuations will impact our Consolidated Statements of Operations. Asa result of the relative size of our international operations, these fluctuations may be material on individual balances. Our revenues and expenses from ourinternational operations are generally denominated in the local currency of the country in which they are derived or incurred. Therefore, the impact of currencyfluctuations on our operating income and operating margin is partially mitigated. In order to provide a framework for assessing how our underlying businessesperformed excluding the effect of foreign currency fluctuations, we compare the percentage change in the results from one period to another period in this reportusing constant currency presentation. The constant currency growth rates are calculated by translating the 2016 results at the 2017 average exchange rates.Constant currency growth rates are a non-GAAP measure.
60
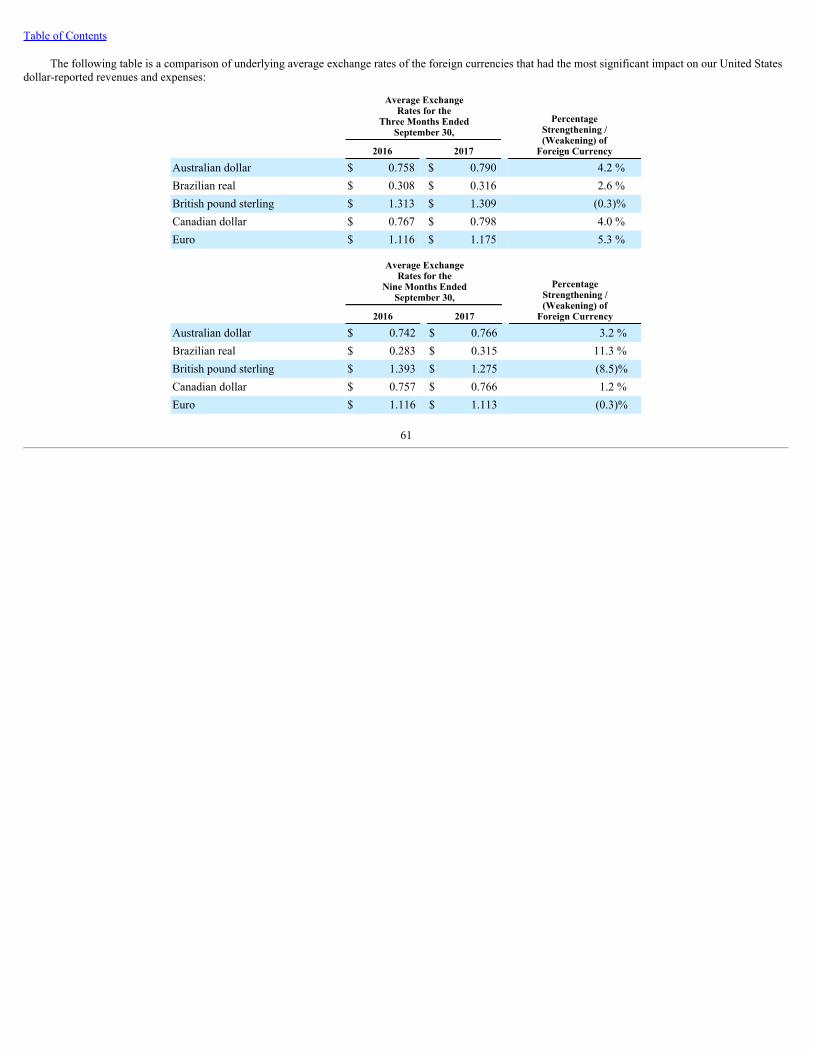
Table of Contents
The following table is a comparison of underlying average exchange rates of the foreign currencies that had the most significant impact on our United Statesdollar-reported revenues and expenses:
Average ExchangeRates for the
Three Months EndedSeptember 30,
PercentageStrengthening /(Weakening) of
Foreign Currency 2016 2017 Australian dollar $ 0.758 $ 0.790 4.2 %Brazilian real $ 0.308 $ 0.316 2.6 %British pound sterling $ 1.313 $ 1.309 (0.3)%Canadian dollar $ 0.767 $ 0.798 4.0 %Euro $ 1.116 $ 1.175 5.3 %
Average ExchangeRates for the
Nine Months EndedSeptember 30,
PercentageStrengthening /(Weakening) of
Foreign Currency 2016 2017 Australian dollar $ 0.742 $ 0.766 3.2 %Brazilian real $ 0.283 $ 0.315 11.3 %British pound sterling $ 1.393 $ 1.275 (8.5)%Canadian dollar $ 0.757 $ 0.766 1.2 %Euro $ 1.116 $ 1.113 (0.3)%
61
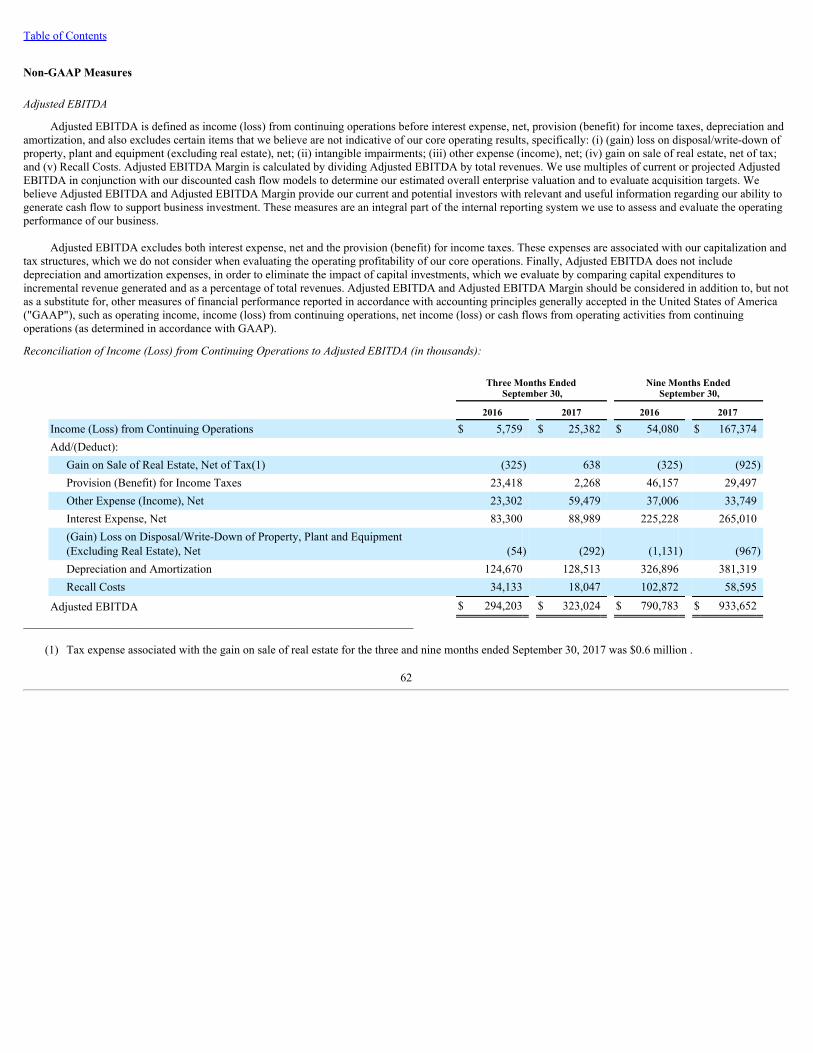
Table of Contents
Non-GAAP Measures
Adjusted EBITDA
Adjusted EBITDA is defined as income (loss) from continuing operations before interest expense, net, provision (benefit) for income taxes, depreciation andamortization, and also excludes certain items that we believe are not indicative of our core operating results, specifically: (i) (gain) loss on disposal/write-down ofproperty, plant and equipment (excluding real estate), net; (ii) intangible impairments; (iii) other expense (income), net; (iv) gain on sale of real estate, net of tax;and (v) Recall Costs. Adjusted EBITDA Margin is calculated by dividing Adjusted EBITDA by total revenues. We use multiples of current or projected AdjustedEBITDA in conjunction with our discounted cash flow models to determine our estimated overall enterprise valuation and to evaluate acquisition targets. Webelieve Adjusted EBITDA and Adjusted EBITDA Margin provide our current and potential investors with relevant and useful information regarding our ability togenerate cash flow to support business investment. These measures are an integral part of the internal reporting system we use to assess and evaluate the operatingperformance of our business.
Adjusted EBITDA excludes both interest expense, net and the provision (benefit) for income taxes. These expenses are associated with our capitalization andtax structures, which we do not consider when evaluating the operating profitability of our core operations. Finally, Adjusted EBITDA does not includedepreciation and amortization expenses, in order to eliminate the impact of capital investments, which we evaluate by comparing capital expenditures toincremental revenue generated and as a percentage of total revenues. Adjusted EBITDA and Adjusted EBITDA Margin should be considered in addition to, but notas a substitute for, other measures of financial performance reported in accordance with accounting principles generally accepted in the United States of America("GAAP"), such as operating income, income (loss) from continuing operations, net income (loss) or cash flows from operating activities from continuingoperations (as determined in accordance with GAAP).
Reconciliation of Income (Loss) from Continuing Operations to Adjusted EBITDA (in thousands):
Three Months Ended
September 30, Nine Months Ended
September 30,
2016 2017 2016 2017
Income (Loss) from Continuing Operations $ 5,759 $ 25,382 $ 54,080 $ 167,374Add/(Deduct):
Gain on Sale of Real Estate, Net of Tax(1) (325) 638 (325) (925)Provision (Benefit) for Income Taxes 23,418 2,268 46,157 29,497Other Expense (Income), Net 23,302 59,479 37,006 33,749Interest Expense, Net 83,300 88,989 225,228 265,010(Gain) Loss on Disposal/Write-Down of Property, Plant and Equipment(Excluding Real Estate), Net (54) (292) (1,131) (967)Depreciation and Amortization 124,670 128,513 326,896 381,319Recall Costs 34,133 18,047 102,872 58,595
Adjusted EBITDA $ 294,203 $ 323,024 $ 790,783 $ 933,652_______________________________________________________________________________
(1) Tax expense associated with the gain on sale of real estate for the three and nine months ended September 30, 2017 was $0.6 million .
62
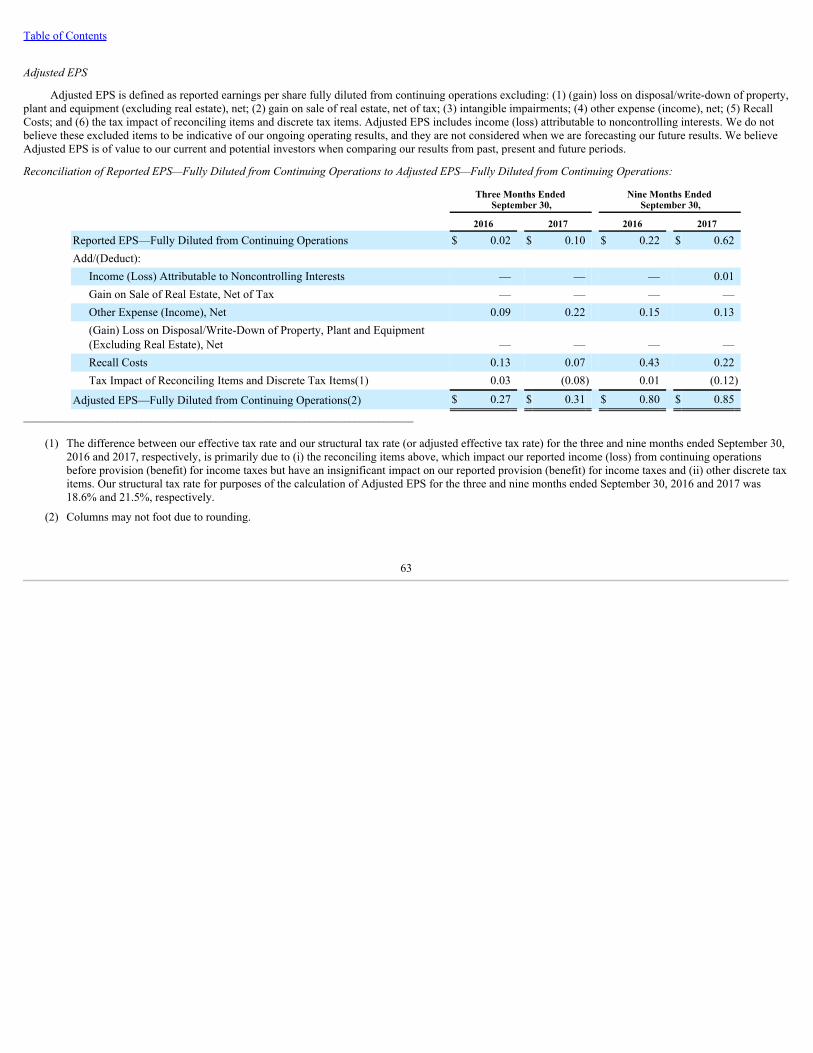
Table of Contents
Adjusted EPS
Adjusted EPS is defined as reported earnings per share fully diluted from continuing operations excluding: (1) (gain) loss on disposal/write-down of property,plant and equipment (excluding real estate), net; (2) gain on sale of real estate, net of tax; (3) intangible impairments; (4) other expense (income), net; (5) RecallCosts; and (6) the tax impact of reconciling items and discrete tax items. Adjusted EPS includes income (loss) attributable to noncontrolling interests. We do notbelieve these excluded items to be indicative of our ongoing operating results, and they are not considered when we are forecasting our future results. We believeAdjusted EPS is of value to our current and potential investors when comparing our results from past, present and future periods.
Reconciliation of Reported EPS—Fully Diluted from Continuing Operations to Adjusted EPS—Fully Diluted from Continuing Operations:
Three Months Ended
September 30, Nine Months Ended
September 30,
2016 2017 2016 2017
Reported EPS—Fully Diluted from Continuing Operations $ 0.02 $ 0.10 $ 0.22 $ 0.62Add/(Deduct):
Income (Loss) Attributable to Noncontrolling Interests — — — 0.01Gain on Sale of Real Estate, Net of Tax — — — —Other Expense (Income), Net 0.09 0.22 0.15 0.13(Gain) Loss on Disposal/Write-Down of Property, Plant and Equipment(Excluding Real Estate), Net — — — —Recall Costs 0.13 0.07 0.43 0.22Tax Impact of Reconciling Items and Discrete Tax Items(1) 0.03 (0.08) 0.01 (0.12)
Adjusted EPS—Fully Diluted from Continuing Operations(2) $ 0.27 $ 0.31 $ 0.80 $ 0.85_______________________________________________________________________________
(1) The difference between our effective tax rate and our structural tax rate (or adjusted effective tax rate) for the three and nine months ended September 30,2016 and 2017, respectively, is primarily due to (i) the reconciling items above, which impact our reported income (loss) from continuing operationsbefore provision (benefit) for income taxes but have an insignificant impact on our reported provision (benefit) for income taxes and (ii) other discrete taxitems. Our structural tax rate for purposes of the calculation of Adjusted EPS for the three and nine months ended September 30, 2016 and 2017 was18.6% and 21.5%, respectively.
(2) Columns may not foot due to rounding.
63
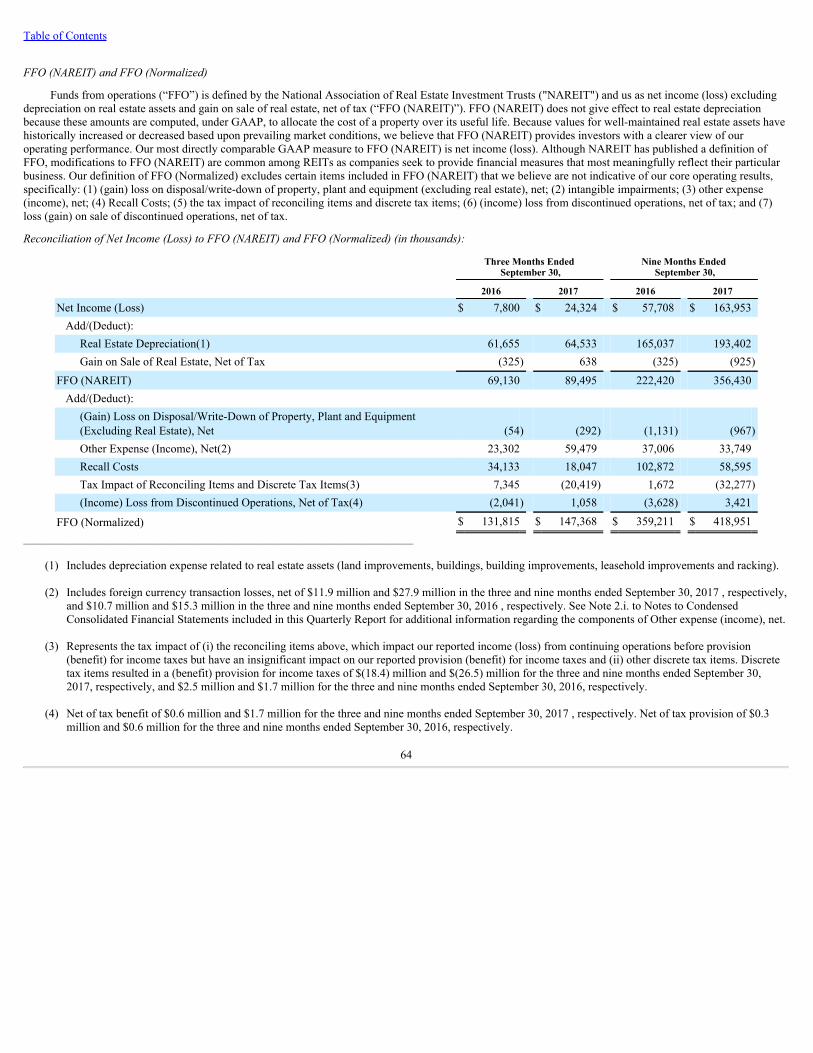
Table of Contents
FFO (NAREIT) and FFO (Normalized)
Funds from operations (“FFO”) is defined by the National Association of Real Estate Investment Trusts ("NAREIT") and us as net income (loss) excludingdepreciation on real estate assets and gain on sale of real estate, net of tax (“FFO (NAREIT)”). FFO (NAREIT) does not give effect to real estate depreciationbecause these amounts are computed, under GAAP, to allocate the cost of a property over its useful life. Because values for well-maintained real estate assets havehistorically increased or decreased based upon prevailing market conditions, we believe that FFO (NAREIT) provides investors with a clearer view of ouroperating performance. Our most directly comparable GAAP measure to FFO (NAREIT) is net income (loss). Although NAREIT has published a definition ofFFO, modifications to FFO (NAREIT) are common among REITs as companies seek to provide financial measures that most meaningfully reflect their particularbusiness. Our definition of FFO (Normalized) excludes certain items included in FFO (NAREIT) that we believe are not indicative of our core operating results,specifically: (1) (gain) loss on disposal/write-down of property, plant and equipment (excluding real estate), net; (2) intangible impairments; (3) other expense(income), net; (4) Recall Costs; (5) the tax impact of reconciling items and discrete tax items; (6) (income) loss from discontinued operations, net of tax; and (7)loss (gain) on sale of discontinued operations, net of tax.
Reconciliation of Net Income (Loss) to FFO (NAREIT) and FFO (Normalized) (in thousands):
Three Months Ended
September 30, Nine Months Ended
September 30,
2016 2017 2016 2017
Net Income (Loss) $ 7,800 $ 24,324 $ 57,708 $ 163,953Add/(Deduct):
Real Estate Depreciation(1) 61,655 64,533 165,037 193,402Gain on Sale of Real Estate, Net of Tax (325) 638 (325) (925)
FFO (NAREIT) 69,130 89,495 222,420 356,430Add/(Deduct):
(Gain) Loss on Disposal/Write-Down of Property, Plant and Equipment(Excluding Real Estate), Net (54) (292) (1,131) (967)Other Expense (Income), Net(2) 23,302 59,479 37,006 33,749Recall Costs 34,133 18,047 102,872 58,595Tax Impact of Reconciling Items and Discrete Tax Items(3) 7,345 (20,419) 1,672 (32,277)(Income) Loss from Discontinued Operations, Net of Tax(4) (2,041) 1,058 (3,628) 3,421
FFO (Normalized) $ 131,815 $ 147,368 $ 359,211 $ 418,951_______________________________________________________________________________
(1) Includes depreciation expense related to real estate assets (land improvements, buildings, building improvements, leasehold improvements and racking).
(2) Includes foreign currency transaction losses, net of $11.9 million and $27.9 million in the three and nine months ended September 30, 2017 , respectively,and $10.7 million and $15.3 million in the three and nine months ended September 30, 2016 , respectively. See Note 2.i. to Notes to CondensedConsolidated Financial Statements included in this Quarterly Report for additional information regarding the components of Other expense (income), net.
(3) Represents the tax impact of (i) the reconciling items above, which impact our reported income (loss) from continuing operations before provision(benefit) for income taxes but have an insignificant impact on our reported provision (benefit) for income taxes and (ii) other discrete tax items. Discretetax items resulted in a (benefit) provision for income taxes of $(18.4) million and $(26.5) million for the three and nine months ended September 30,2017, respectively, and $2.5 million and $1.7 million for the three and nine months ended September 30, 2016, respectively.
(4) Net of tax benefit of $0.6 million and $1.7 million for the three and nine months ended September 30, 2017 , respectively. Net of tax provision of $0.3million and $0.6 million for the three and nine months ended September 30, 2016, respectively.
64
Table of Contents
Critical Accounting Policies
Our discussion and analysis of our financial condition and results of operations are based upon our Condensed Consolidated Financial Statements, whichhave been prepared in accordance with GAAP. The preparation of these financial statements requires us to make estimates, judgments and assumptions that affectthe reported amounts of assets, liabilities, revenues and expenses, and related disclosure of contingent assets and liabilities at the date of the financial statementsand for the period then ended. On an ongoing basis, we evaluate the estimates used. We base our estimates on historical experience, actuarial estimates, currentconditions and various other assumptions that we believe to be reasonable under the circumstances. These estimates form the basis for making judgments about thecarrying values of assets and liabilities and are not readily apparent from other sources. Actual results may differ from these estimates. Our critical accountingpolicies include the following, which are listed in no particular order:
• Revenue Recognition
• Accounting for Acquisitions
• Impairment of Tangible and Intangible Assets
• Income Taxes
Further detail regarding our critical accounting policies can be found in "Item 7. Management's Discussion and Analysis of Financial Condition and Resultsof Operations" in our Annual Report, and the Consolidated Financial Statements and the Notes included therein. We have determined that no material changesconcerning our critical accounting policies have occurred since December 31, 2016 .
Recent Accounting Pronouncements
See Note 2.k. to Notes to Condensed Consolidated Financial Statements included in this Quarterly Report for a description of recently issued accountingpronouncements, including those recently adopted.
65
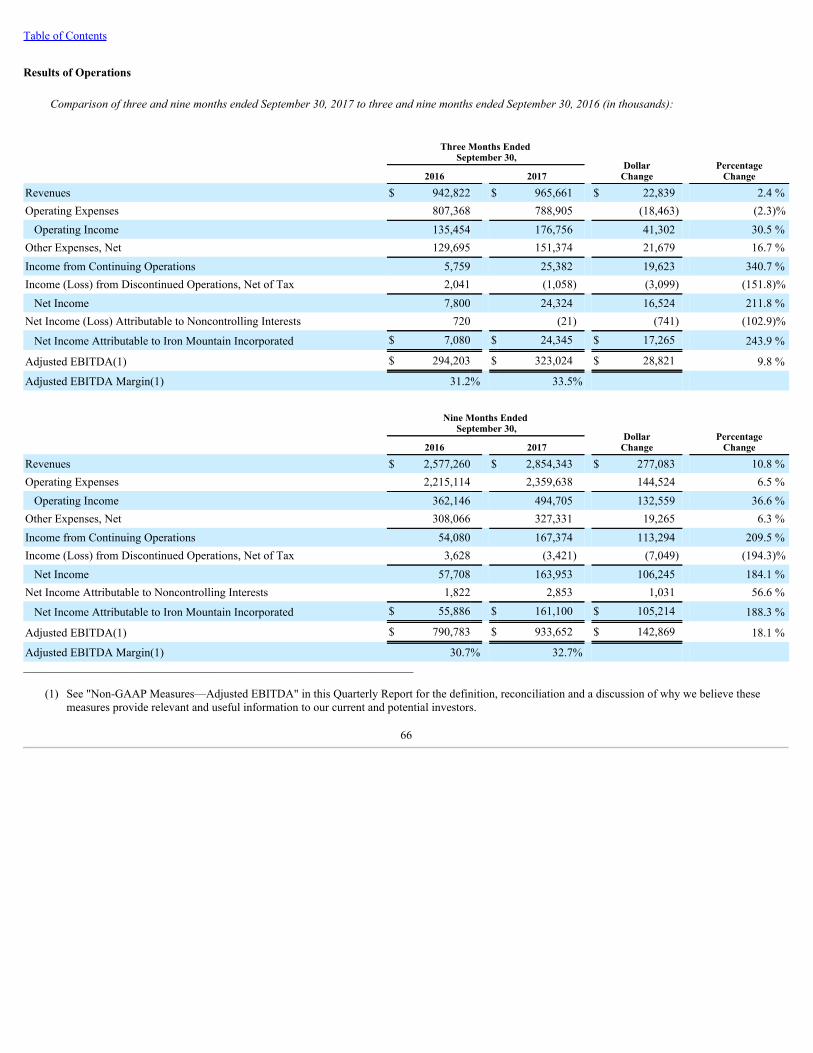
Table of Contents
Results of Operations
Comparison of three and nine months ended September 30, 2017 to three and nine months ended September 30, 2016 (in thousands):
Three Months Ended
September 30,
DollarChange
Percentage
Change 2016 2017 Revenues $ 942,822 $ 965,661 $ 22,839 2.4 %Operating Expenses 807,368 788,905 (18,463) (2.3)%Operating Income 135,454 176,756 41,302 30.5 %
Other Expenses, Net 129,695 151,374 21,679 16.7 %Income from Continuing Operations 5,759 25,382 19,623 340.7 %Income (Loss) from Discontinued Operations, Net of Tax 2,041 (1,058) (3,099) (151.8)%Net Income 7,800 24,324 16,524 211.8 %
Net Income (Loss) Attributable to Noncontrolling Interests 720 (21) (741) (102.9)%
Net Income Attributable to Iron Mountain Incorporated $ 7,080 $ 24,345 $ 17,265 243.9 %
Adjusted EBITDA(1) $ 294,203 $ 323,024 $ 28,821 9.8 %
Adjusted EBITDA Margin(1) 31.2% 33.5%
Nine Months Ended
September 30,
DollarChange
Percentage
Change 2016 2017 Revenues $ 2,577,260 $ 2,854,343 $ 277,083 10.8 %Operating Expenses 2,215,114 2,359,638 144,524 6.5 %Operating Income 362,146 494,705 132,559 36.6 %
Other Expenses, Net 308,066 327,331 19,265 6.3 %Income from Continuing Operations 54,080 167,374 113,294 209.5 %Income (Loss) from Discontinued Operations, Net of Tax 3,628 (3,421) (7,049) (194.3)%Net Income 57,708 163,953 106,245 184.1 %
Net Income Attributable to Noncontrolling Interests 1,822 2,853 1,031 56.6 %
Net Income Attributable to Iron Mountain Incorporated $ 55,886 $ 161,100 $ 105,214 188.3 %
Adjusted EBITDA(1) $ 790,783 $ 933,652 $ 142,869 18.1 %
Adjusted EBITDA Margin(1) 30.7% 32.7% _______________________________________________________________________________
(1) See "Non-GAAP Measures—Adjusted EBITDA" in this Quarterly Report for the definition, reconciliation and a discussion of why we believe thesemeasures provide relevant and useful information to our current and potential investors.
66
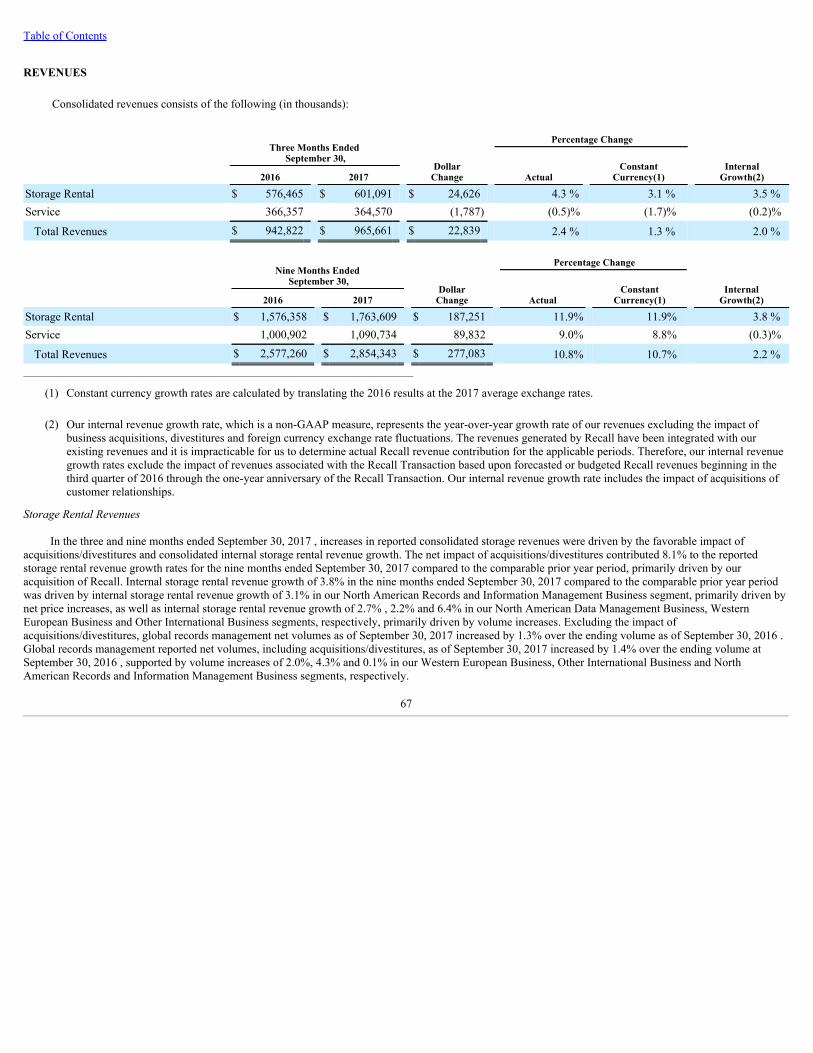
Table of Contents
REVENUES
Consolidated revenues consists of the following (in thousands):
Three Months Ended
September 30,
Percentage Change
DollarChange
Actual
Constant
Currency(1)
Internal
Growth(2) 2016 2017 Storage Rental $ 576,465 $ 601,091 $ 24,626 4.3 % 3.1 % 3.5 %Service 366,357 364,570 (1,787) (0.5)% (1.7)% (0.2)%
Total Revenues $ 942,822 $ 965,661 $ 22,839 2.4 % 1.3 % 2.0 %
Nine Months Ended
September 30,
Percentage Change
DollarChange
Actual
Constant
Currency(1)
Internal
Growth(2) 2016 2017 Storage Rental $ 1,576,358 $ 1,763,609 $ 187,251 11.9% 11.9% 3.8 %Service 1,000,902 1,090,734 89,832 9.0% 8.8% (0.3)%
Total Revenues $ 2,577,260 $ 2,854,343 $ 277,083 10.8% 10.7% 2.2 %_______________________________________________________________________________
(1) Constant currency growth rates are calculated by translating the 2016 results at the 2017 average exchange rates.
(2) Our internal revenue growth rate, which is a non-GAAP measure, represents the year-over-year growth rate of our revenues excluding the impact ofbusiness acquisitions, divestitures and foreign currency exchange rate fluctuations. The revenues generated by Recall have been integrated with ourexisting revenues and it is impracticable for us to determine actual Recall revenue contribution for the applicable periods. Therefore, our internal revenuegrowth rates exclude the impact of revenues associated with the Recall Transaction based upon forecasted or budgeted Recall revenues beginning in thethird quarter of 2016 through the one-year anniversary of the Recall Transaction. Our internal revenue growth rate includes the impact of acquisitions ofcustomer relationships.
Storage Rental Revenues
In the three and nine months ended September 30, 2017 , increases in reported consolidated storage revenues were driven by the favorable impact ofacquisitions/divestitures and consolidated internal storage rental revenue growth. The net impact of acquisitions/divestitures contributed 8.1% to the reportedstorage rental revenue growth rates for the nine months ended September 30, 2017 compared to the comparable prior year period, primarily driven by ouracquisition of Recall. Internal storage rental revenue growth of 3.8% in the nine months ended September 30, 2017 compared to the comparable prior year periodwas driven by internal storage rental revenue growth of 3.1% in our North American Records and Information Management Business segment, primarily driven bynet price increases, as well as internal storage rental revenue growth of 2.7% , 2.2% and 6.4% in our North American Data Management Business, WesternEuropean Business and Other International Business segments, respectively, primarily driven by volume increases. Excluding the impact ofacquisitions/divestitures, global records management net volumes as of September 30, 2017 increased by 1.3% over the ending volume as of September 30, 2016 .Global records management reported net volumes, including acquisitions/divestitures, as of September 30, 2017 increased by 1.4% over the ending volume atSeptember 30, 2016 , supported by volume increases of 2.0%, 4.3% and 0.1% in our Western European Business, Other International Business and NorthAmerican Records and Information Management Business segments, respectively.
67

Table of Contents
Service Revenues
In the three months ended September 30, 2017 , the decrease in reported consolidated service revenues was driven by the unfavorable impact ofacquisitions/divestitures noted below and negative internal service revenue growth of 0.2%, partially offset by favorable fluctuations in foreign currency exchangerates of 1.2% compared to the three months ended September 30, 2016 . The net impact of acquisitions/divestitures decreased reported service revenue growthrates by 1.5% for the three months ended September 30, 2017 , compared to the comparable prior year period, primarily driven by the Iron Mountain Divestmentsand the Russia and Ukraine Divestment. In the nine months ended September 30, 2017 , the increase in reported consolidated service revenues was driven by thefavorable impact of acquisitions/divestitures and favorable fluctuations in foreign currency exchange rates, partially offset by negative internal service revenuegrowth compared to the nine months ended September 30, 2016 . The net impact of acquisitions/divestitures contributed 9.1% to the reported service revenuegrowth rates for the nine months ended September 30, 2017 , compared to the comparable prior year period, primarily driven by our acquisition of Recall. Internalservice revenue growth was negative 0.3% for the nine months ended September 30, 2017 , compared to the comparable prior year period. The negative internalservice revenue growth for the nine months ended September 30, 2017 reflects continued declines in service revenue activity levels in our North American DataManagement Business segment, as the storage business becomes more archival in nature, as well as declines in project activity in our Western European Businessand Other International Business segments, partially offset by growth in secure shredding revenues, in part due to higher recycled paper prices, and the stabilizationin recent periods of the decline in retrieval/re-file activity and the related decrease in transportation revenues within our North American Records and InformationManagement Business segment.
Total Revenues
For the reasons stated above, our reported consolidated revenues increased $22.8 million , or 2.4% , to $965.7 million and $277.1 million , or 10.8% , to$2,854.3 million for the three and nine months ended September 30, 2017 , respectively, from $942.8 million and $2,577.3 million for the three and nine monthsended September 30, 2016 , respectively. The net impact of acquisitions/divestitures contributed 8.5% to the reported consolidated revenue growth rate for the ninemonths ended September 30, 2017 compared to the comparable prior year period, primarily driven by our acquisition of Recall. Consolidated internal revenuegrowth was 2.2% in the nine months ended September 30, 2017 compared to the comparable prior year period.
Internal Growth—Eight-Quarter Trend
2015 2016 2017
FourthQuarter
FirstQuarter
SecondQuarter
ThirdQuarter
FourthQuarter
FirstQuarter
SecondQuarter
ThirdQuarter
Storage Rental Revenue 2.2% 2.2% 2.1 % 2.1 % 2.9 % 3.0% 4.8 % 3.5 %Service Revenue 0.3% 1.6% (2.1)% (1.3)% (0.9)% 0.6% (1.1)% (0.2)%Total Revenue 1.4% 2.0% 0.4 % 0.8 % 1.4 % 2.0% 2.5 % 2.0 %
We expect our consolidated internal storage rental revenue growth rate for 2017 to be approximately 3.0% to 3.5%. During the past eight quarters, ourinternal storage rental revenue growth rate has ranged between 2.1% and 4.8%. Consolidated internal storage rental revenue growth and consolidated total internalrevenue growth benefited by approximately 0.8% and 0.5%, respectively, in the second quarter of 2017, from a $4.2 million customer termination fee in our datacenter business within our Corporate and Other Business segment. Our internal storage rental revenue growth rates have been relatively stable over the past twofiscal years, as internal storage rental revenue growth for full year 2015 and 2016 was 2.7% and 2.3%, respectively. At various points in the economic cycle,internal storage rental revenue growth may be influenced by changes in pricing and volume. Within our international portfolio, the Western European Businesssegment is generating consistent low single-digit internal storage rental revenue growth, while the Other International Business segment is producing high single-digit internal storage rental revenue growth by capturing the first-time outsourcing trends for physical records storage and management in those markets. Theinternal growth rate for service revenue is inherently more volatile than the internal growth rate for storage rental revenues due to the more discretionary nature ofcertain services we offer, such as large special projects, and, as a commodity, the volatility of pricing for recycled paper. These revenues, which are often event-driven and impacted to a greater extent by economic downturns as customers defer or cancel the purchase of certain services as a way to reduce their short-termcosts, may be difficult to replicate in future periods. The internal growth rate for total service revenues over the past eight quarters reflects reduced retrieval/re-fileactivity and a related decrease in transportation revenues within our North American Records and Information Management Business and Western EuropeanBusiness segments, as well as continued service declines in service revenue activity levels in our North American Data Management Business segment as thestorage business becomes more archival in nature.
68
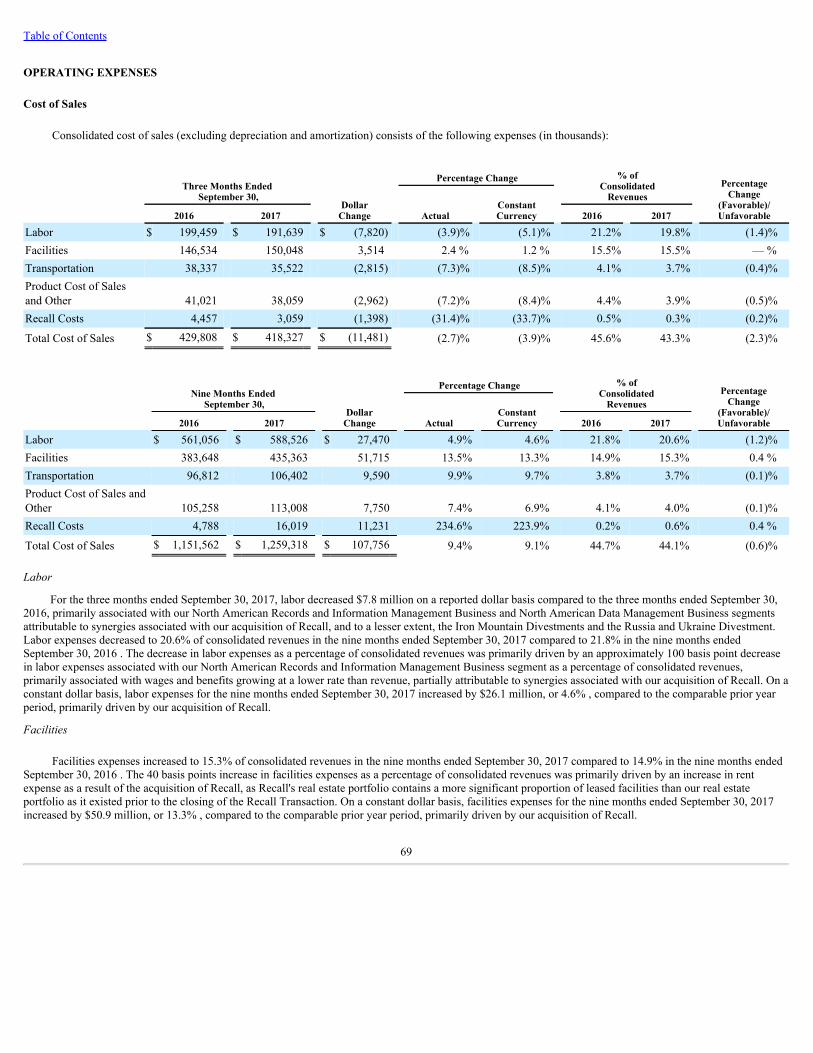
Table of Contents
OPERATING EXPENSES
Cost of Sales
Consolidated cost of sales (excluding depreciation and amortization) consists of the following expenses (in thousands):
Three Months Ended September 30,
Percentage Change
% of
ConsolidatedRevenues
PercentageChange
(Favorable)/Unfavorable
DollarChange
Actual
ConstantCurrency
2016 2017 2016 2017 Labor $ 199,459 $ 191,639 $ (7,820) (3.9)% (5.1)% 21.2% 19.8% (1.4)%Facilities 146,534 150,048 3,514 2.4 % 1.2 % 15.5% 15.5% — %Transportation 38,337 35,522 (2,815) (7.3)% (8.5)% 4.1% 3.7% (0.4)%Product Cost of Salesand Other 41,021 38,059 (2,962) (7.2)% (8.4)% 4.4% 3.9% (0.5)%Recall Costs 4,457 3,059 (1,398) (31.4)% (33.7)% 0.5% 0.3% (0.2)%
Total Cost of Sales $ 429,808 $ 418,327 $ (11,481) (2.7)% (3.9)% 45.6% 43.3% (2.3)%
Nine Months Ended September 30,
Percentage Change
% of
ConsolidatedRevenues
PercentageChange
(Favorable)/Unfavorable
DollarChange
Actual
ConstantCurrency
2016 2017 2016 2017 Labor $ 561,056 $ 588,526 $ 27,470 4.9% 4.6% 21.8% 20.6% (1.2)%Facilities 383,648 435,363 51,715 13.5% 13.3% 14.9% 15.3% 0.4 %Transportation 96,812 106,402 9,590 9.9% 9.7% 3.8% 3.7% (0.1)%Product Cost of Sales andOther 105,258 113,008 7,750 7.4% 6.9% 4.1% 4.0% (0.1)%Recall Costs 4,788 16,019 11,231 234.6% 223.9% 0.2% 0.6% 0.4 %
Total Cost of Sales $ 1,151,562 $ 1,259,318 $ 107,756 9.4% 9.1% 44.7% 44.1% (0.6)%
Labor
For the three months ended September 30, 2017, labor decreased $7.8 million on a reported dollar basis compared to the three months ended September 30,2016, primarily associated with our North American Records and Information Management Business and North American Data Management Business segmentsattributable to synergies associated with our acquisition of Recall, and to a lesser extent, the Iron Mountain Divestments and the Russia and Ukraine Divestment.Labor expenses decreased to 20.6% of consolidated revenues in the nine months ended September 30, 2017 compared to 21.8% in the nine months endedSeptember 30, 2016 . The decrease in labor expenses as a percentage of consolidated revenues was primarily driven by an approximately 100 basis point decreasein labor expenses associated with our North American Records and Information Management Business segment as a percentage of consolidated revenues,primarily associated with wages and benefits growing at a lower rate than revenue, partially attributable to synergies associated with our acquisition of Recall. On aconstant dollar basis, labor expenses for the nine months ended September 30, 2017 increased by $26.1 million, or 4.6% , compared to the comparable prior yearperiod, primarily driven by our acquisition of Recall.
Facilities
Facilities expenses increased to 15.3% of consolidated revenues in the nine months ended September 30, 2017 compared to 14.9% in the nine months endedSeptember 30, 2016 . The 40 basis points increase in facilities expenses as a percentage of consolidated revenues was primarily driven by an increase in rentexpense as a result of the acquisition of Recall, as Recall's real estate portfolio contains a more significant proportion of leased facilities than our real estateportfolio as it existed prior to the closing of the Recall Transaction. On a constant dollar basis, facilities expenses for the nine months ended September 30, 2017increased by $50.9 million, or 13.3% , compared to the comparable prior year period, primarily driven by our acquisition of Recall.
69
Table of Contents
Transportation
For the three months ended September 30, 2017, transportation decreased $2.8 million on a reported dollar basis compared to the three months endedSeptember 30, 2016, driven by a decrease in vehicle lease expense, fuel cost and third party carrier costs, primarily associated with our North American Recordsand Information Management Business segment attributable to synergies associated with our acquisition of Recall, and to a lesser extent, the Iron MountainDivestments and the Russia and Ukraine Divestment. Transportation expenses decreased to 3.7% of consolidated revenues in the nine months ended September 30,2017 compared to 3.8% in the nine months ended September 30, 2016 . The decrease in transportation expenses as a percentage of consolidated revenues wasdriven by a decrease in vehicle lease expense, primarily associated with our North American Records and Information Management Business segment, partiallyoffset by an increase in third party carrier costs as a percentage of consolidated revenue, primarily associated with our Other International Business segment. On aconstant dollar basis, transportation expenses for the nine months ended September 30, 2017 increased by $9.4 million, or 9.7% , compared to the comparable prioryear period, primarily driven by our acquisition of Recall.
Product Cost of Sales and Other
For the three months ended September 30, 2017, product cost of sales and other decreased $3.0 million on a reported dollar basis compared to the threemonths ended September 30, 2016, driven by decreased project activity in our Other International Business segment, and to a lesser extent, the Iron MountainDivestments and the Russia and Ukraine Divestment. Product cost of sales and other, which includes cartons, media and other service, storage and supply costs andis highly correlated to service revenue streams, particularly project revenues, decreased to 4.0% of consolidated revenues for the nine months ended September 30,2017 compared to 4.1% in the nine months ended September 30, 2016 . The decrease in product cost of sales and other was driven by special project costs. On aconstant dollar basis, product cost of sales and other increased by $7.3 million, or 6.9% , compared to the comparable prior year period, primarily driven by ouracquisition of Recall.
Recall Costs
Recall Costs included in cost of sales were $16.0 million in the nine months ended September 30, 2017, and primarily consisted of employee severance costsand facility integration costs including labor, maintenance, transportation and other costs related to building moves and consolidation. Recall Costs included in costof sales were $4.8 million in the nine months ended September 30, 2016, and primarily consisted of employee severance costs.
70
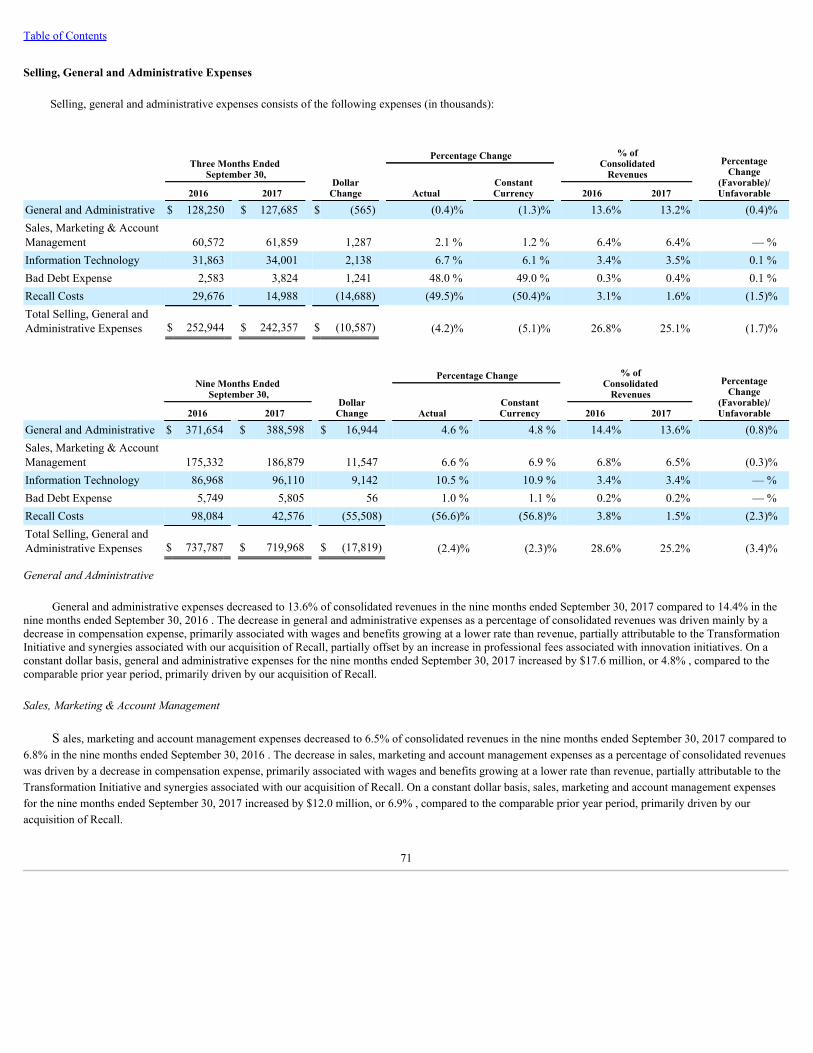
Table of Contents
Selling, General and Administrative Expenses
Selling, general and administrative expenses consists of the following expenses (in thousands):
Three Months Ended September 30,
Percentage Change
% of
ConsolidatedRevenues
PercentageChange
(Favorable)/Unfavorable
DollarChange
Actual
ConstantCurrency
2016 2017 2016 2017 General and Administrative $ 128,250 $ 127,685 $ (565) (0.4)% (1.3)% 13.6% 13.2% (0.4)%Sales, Marketing & AccountManagement 60,572 61,859 1,287 2.1 % 1.2 % 6.4% 6.4% — %Information Technology 31,863 34,001 2,138 6.7 % 6.1 % 3.4% 3.5% 0.1 %Bad Debt Expense 2,583 3,824 1,241 48.0 % 49.0 % 0.3% 0.4% 0.1 %Recall Costs 29,676 14,988 (14,688) (49.5)% (50.4)% 3.1% 1.6% (1.5)%Total Selling, General andAdministrative Expenses $ 252,944 $ 242,357 $ (10,587) (4.2)% (5.1)% 26.8% 25.1% (1.7)%
Nine Months Ended September 30,
Percentage Change
% of
ConsolidatedRevenues
PercentageChange
(Favorable)/Unfavorable
DollarChange
Actual
ConstantCurrency
2016 2017 2016 2017 General and Administrative $ 371,654 $ 388,598 $ 16,944 4.6 % 4.8 % 14.4% 13.6% (0.8)%Sales, Marketing & AccountManagement 175,332 186,879 11,547 6.6 % 6.9 % 6.8% 6.5% (0.3)%Information Technology 86,968 96,110 9,142 10.5 % 10.9 % 3.4% 3.4% — %Bad Debt Expense 5,749 5,805 56 1.0 % 1.1 % 0.2% 0.2% — %Recall Costs 98,084 42,576 (55,508) (56.6)% (56.8)% 3.8% 1.5% (2.3)%Total Selling, General andAdministrative Expenses $ 737,787 $ 719,968 $ (17,819) (2.4)% (2.3)% 28.6% 25.2% (3.4)%
General and Administrative
General and administrative expenses decreased to 13.6% of consolidated revenues in the nine months ended September 30, 2017 compared to 14.4% in thenine months ended September 30, 2016 . The decrease in general and administrative expenses as a percentage of consolidated revenues was driven mainly by adecrease in compensation expense, primarily associated with wages and benefits growing at a lower rate than revenue, partially attributable to the TransformationInitiative and synergies associated with our acquisition of Recall, partially offset by an increase in professional fees associated with innovation initiatives. On aconstant dollar basis, general and administrative expenses for the nine months ended September 30, 2017 increased by $17.6 million, or 4.8% , compared to thecomparable prior year period, primarily driven by our acquisition of Recall.
Sales, Marketing & Account Management
S ales, marketing and account management expenses decreased to 6.5% of consolidated revenues in the nine months ended September 30, 2017 compared to6.8% in the nine months ended September 30, 2016 . The decrease in sales, marketing and account management expenses as a percentage of consolidated revenueswas driven by a decrease in compensation expense, primarily associated with wages and benefits growing at a lower rate than revenue, partially attributable to theTransformation Initiative and synergies associated with our acquisition of Recall. On a constant dollar basis, sales, marketing and account management expensesfor the nine months ended September 30, 2017 increased by $12.0 million, or 6.9% , compared to the comparable prior year period, primarily driven by ouracquisition of Recall.
71
Table of Contents
Information Technology
Information technology expenses were 3.4% of consolidated revenues in both the nine months ended September 30, 2017 and the nine months endedSeptember 30, 2016 . Information technology expenses as a percentage of consolidated revenues reflect a decrease in compensation expense, primarily associatedwith wages and benefits growing at a lower rate than revenue, partially attributable to the Transformation Initiative and synergies associated with our acquisition ofRecall, offset by higher professional fees. On a constant dollar basis, information technology expenses for the nine months ended September 30, 2017 increased by$9.4 million, or 10.9% , compared to the comparable prior year period, primarily driven by our acquisition of Recall.
Bad Debt Expense
We maintain an allowance for doubtful accounts that is calculated based on our past loss experience, current and prior trends in our aged receivables, currenteconomic conditions, and specific circumstances of individual receivable balances. We continue to monitor our customers' payment activity and make adjustmentsbased on their financial condition and in light of historical and expected trends.
Recall Costs
Recall Costs included in selling, general and administrative expenses were $42.6 million in the nine months ended September 30, 2017 , and primarilyconsisted of advisory and professional fees, as well as severance costs. Recall Costs included in selling, general and administrative expenses were $98.1 million inthe nine months ended September 30, 2016 , and primarily consisted of advisory and professional fees, as well as severance and REIT conversion costs.
Depreciation and Amortization
Depreciation expense increased $35.2 million, or 13.2%, on a reported dollar basis for the nine months ended September 30, 2017 compared to the ninemonths ended September 30, 2016 , primarily due to the increased depreciation of property, plant and equipment acquired in the Recall Transaction. See Note 2.f.to Notes to Consolidated Financial Statements in our Annual Report for additional information regarding the useful lives over which our property, plant andequipment is depreciated.
Amortization expense increased $19.2 million, or 32.2%, on a reported dollar basis for the nine months ended September 30, 2017 compared to the ninemonths ended September 30, 2016 , primarily due to the increased amortization of customer relationship intangible assets acquired in the Recall Transaction,which are amortized over a weighted average useful life of 13 years.
OTHER EXPENSES, NET
Interest Expense, Net
Consolidated interest expense, net increased $39.8 million to $265.0 million in the nine months ended September 30, 2017 from $225.2 million in the ninemonths ended September 30, 2016 . This increase was a result of higher average debt outstanding during the current year period compared to the prior year period.Our weighted average interest rate was 5.0% and 5.1% at September 30, 2017 and 2016, respectively. See Note 5 to Notes to Condensed Consolidated FinancialStatements included in this Quarterly Report for additional information regarding our indebtedness.
72
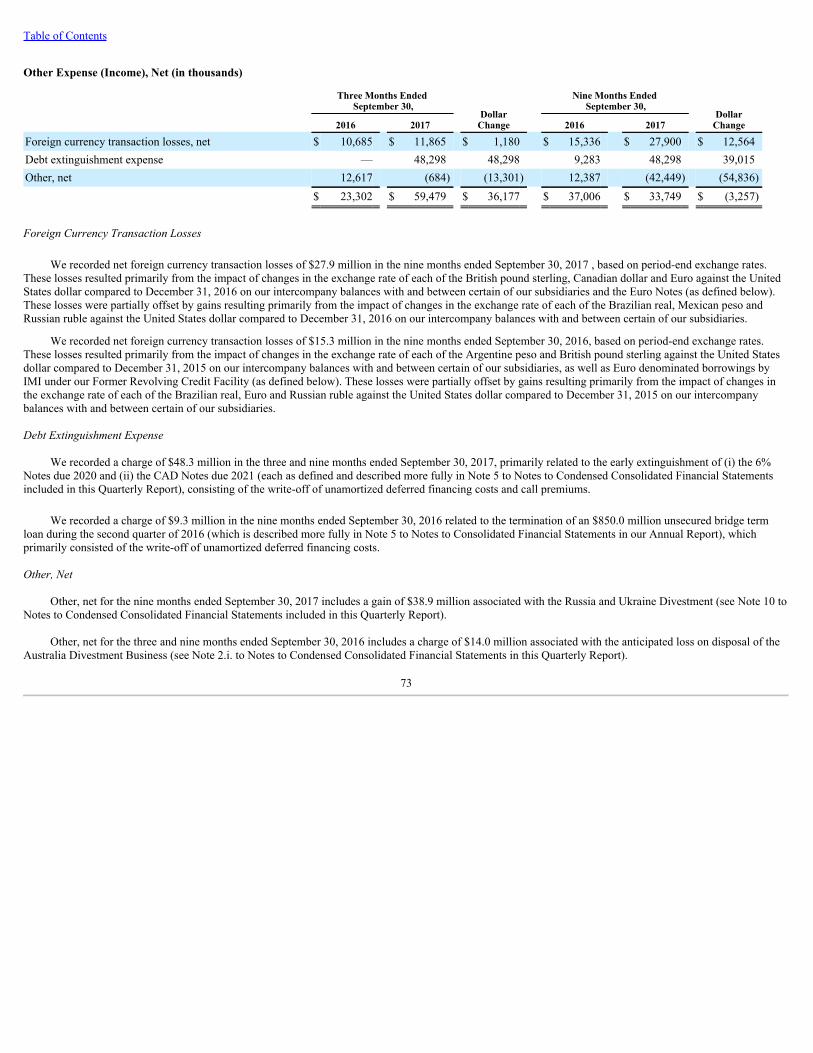
Table of Contents
Other Expense (Income), Net (in thousands)
Three Months Ended
September 30, Dollar
Change
Nine Months Ended
September 30, Dollar
Change 2016 2017 2016 2017 Foreign currency transaction losses, net $ 10,685 $ 11,865 $ 1,180 $ 15,336 $ 27,900 $ 12,564Debt extinguishment expense — 48,298 48,298 9,283 48,298 39,015Other, net 12,617 (684) (13,301) 12,387 (42,449) (54,836)
$ 23,302 $ 59,479 $ 36,177 $ 37,006 $ 33,749 $ (3,257)
Foreign Currency Transaction Losses
We recorded net foreign currency transaction losses of $27.9 million in the nine months ended September 30, 2017 , based on period-end exchange rates.These losses resulted primarily from the impact of changes in the exchange rate of each of the British pound sterling, Canadian dollar and Euro against the UnitedStates dollar compared to December 31, 2016 on our intercompany balances with and between certain of our subsidiaries and the Euro Notes (as defined below).These losses were partially offset by gains resulting primarily from the impact of changes in the exchange rate of each of the Brazilian real, Mexican peso andRussian ruble against the United States dollar compared to December 31, 2016 on our intercompany balances with and between certain of our subsidiaries.
We recorded net foreign currency transaction losses of $15.3 million in the nine months ended September 30, 2016, based on period-end exchange rates.These losses resulted primarily from the impact of changes in the exchange rate of each of the Argentine peso and British pound sterling against the United Statesdollar compared to December 31, 2015 on our intercompany balances with and between certain of our subsidiaries, as well as Euro denominated borrowings byIMI under our Former Revolving Credit Facility (as defined below). These losses were partially offset by gains resulting primarily from the impact of changes inthe exchange rate of each of the Brazilian real, Euro and Russian ruble against the United States dollar compared to December 31, 2015 on our intercompanybalances with and between certain of our subsidiaries.
Debt Extinguishment Expense
We recorded a charge of $48.3 million in the three and nine months ended September 30, 2017, primarily related to the early extinguishment of (i) the 6%Notes due 2020 and (ii) the CAD Notes due 2021 (each as defined and described more fully in Note 5 to Notes to Condensed Consolidated Financial Statementsincluded in this Quarterly Report), consisting of the write-off of unamortized deferred financing costs and call premiums.
We recorded a charge of $9.3 million in the nine months ended September 30, 2016 related to the termination of an $850.0 million unsecured bridge termloan during the second quarter of 2016 (which is described more fully in Note 5 to Notes to Consolidated Financial Statements in our Annual Report), whichprimarily consisted of the write-off of unamortized deferred financing costs.
Other, Net
Other, net for the nine months ended September 30, 2017 includes a gain of $38.9 million associated with the Russia and Ukraine Divestment (see Note 10 toNotes to Condensed Consolidated Financial Statements included in this Quarterly Report).
Other, net for the three and nine months ended September 30, 2016 includes a charge of $14.0 million associated with the anticipated loss on disposal of theAustralia Divestment Business (see Note 2.i. to Notes to Condensed Consolidated Financial Statements in this Quarterly Report).
73
Table of Contents
Provision for Income Taxes
We provide for income taxes during interim periods based on our estimate of the effective tax rate for the year. Discrete items and changes in our estimate ofthe annual effective tax rate are recorded in the period they occur. Our effective tax rate is subject to variability in the future due to, among other items: (1) changesin the mix of income between our qualified REIT subsidiaries ("QRSs") and our domestic taxable REIT subsidiaries ("TRSs"), as well as among the jurisdictions inwhich we operate; (2) tax law changes; (3) volatility in foreign exchange gains and losses; (4) the timing of the establishment and reversal of tax reserves; and (5)our ability to utilize net operating losses that we generate.
Our effective tax rates for the three and nine months ended September 30, 2017 were 8.0% and 15.1% , respectively. The primary reconciling items betweenthe federal statutory tax rate of 35.0% and our overall effective tax rate for the three months ended September 30, 2017 were the benefit derived from the dividendspaid deduction, differences in the rates of tax at which our foreign earnings are subject and a release of valuation allowances on certain of our foreign net operatinglosses of $18.5 million as a result of the merger of certain of our foreign subsidiaries. The primary reconciling items between the federal statutory tax rate of 35.0%and our overall effective tax rate for the nine months ended September 30, 2017 were the benefit derived from the dividends paid deduction, differences in the ratesof tax at which our foreign earnings are subject and a release of valuation allowances on certain of our foreign net operating losses of $26.0 million as a result ofthe merger of certain of our foreign subsidiaries. Our effective tax rates for the three and nine months ended September 30, 2016 were 81.2% and 46.2% ,respectively. The primary reconciling items between the federal statutory tax rate of 35.0% and our overall effective tax rates for the three and nine months endedSeptember 30, 2016 were the benefit derived from the dividends paid deduction, differences in the rates of tax at which our foreign earnings are subject, includingforeign exchange gains and losses in different jurisdictions with different tax rates, and the impact of the $14.0 million charge (described in Note 2.i. to Notes toCondensed Consolidated Financial Statements included in this Quarterly Report) recorded during the third quarter of 2016 related to the anticipated loss ondisposal of the Australia Divestment Business (as defined in Note 6 to Notes to Consolidated Financial Statements included in our Annual Report), which had noassociated tax benefit.
As a result of the 2016 Indefinite Reinvestment Assessment (as defined in Note 2.e. to Notes to Condensed Consolidated Financial Statements included inthis Quarterly Report), we concluded that it is our intent to indefinitely reinvest our current and future undistributed earnings of our unconverted foreign TRSsoutside the United States. Accordingly, we no longer provide incremental foreign withholding taxes on the retained book earnings of these unconverted foreignTRSs. As a REIT, future repatriation of incremental undistributed earnings of our foreign subsidiaries will not be subject to federal or state income tax, with theexception of foreign withholding taxes in limited instances; however, such future repatriations will require distribution in accordance with REIT distribution rules,and any such distribution may then be taxable, as appropriate, at the stockholder level. We continue, however, to provide for incremental foreign withholding taxeson net book over outside basis differences related to the earnings of our foreign QRSs and certain of our converted TRSs.
As a REIT, we are entitled to a deduction for dividends paid, resulting in a substantial reduction of federal income tax expense, and substantially all of ourincome tax expense will be incurred based on the earnings generated by our foreign subsidiaries and our domestic TRSs.
Gain on Sale of Real Estate, Net of Tax
Consolidated gain on sale of real estate for the nine months ended September 30, 2017 was $0.9 million , net of tax of $0.6 million , and consisted of the saleof land and a building in the United States for net proceeds of approximately $12.7 million . Consolidated gain on sale of real estate, net of tax, for the three andnine months ended September 30, 2016 was $0.3 million associated with the sale of land in the United States and Canada.
74
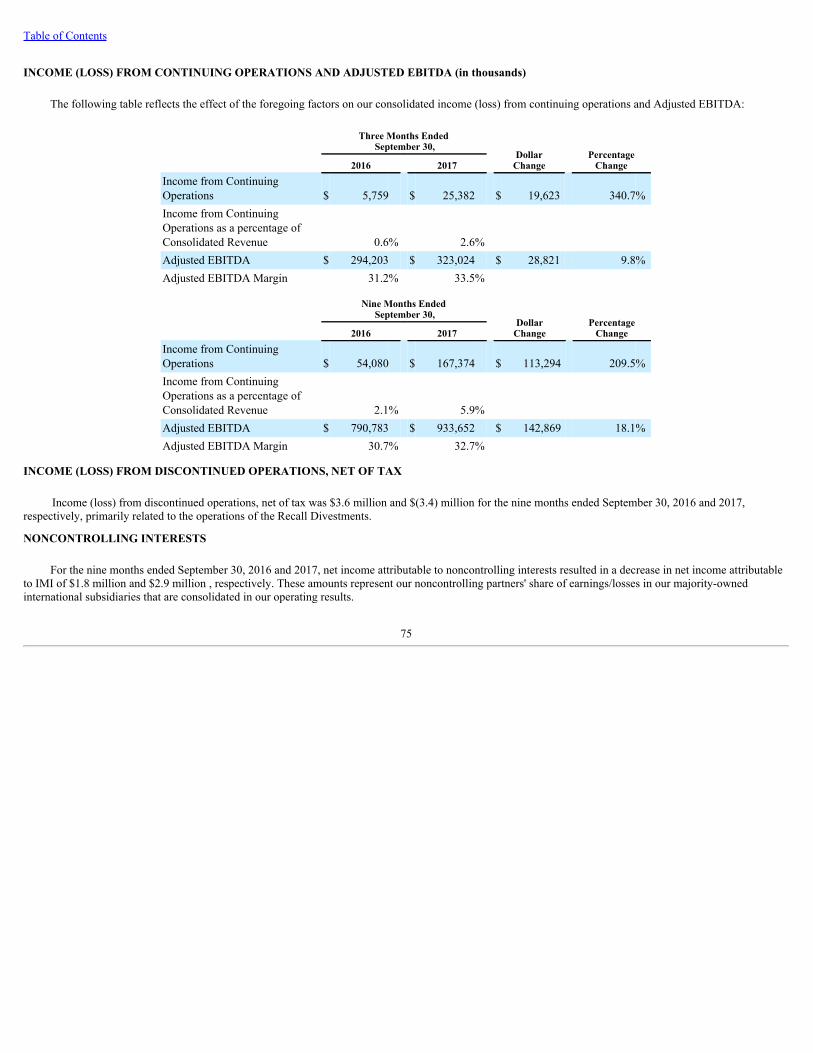
Table of Contents
INCOME (LOSS) FROM CONTINUING OPERATIONS AND ADJUSTED EBITDA (in thousands)
The following table reflects the effect of the foregoing factors on our consolidated income (loss) from continuing operations and Adjusted EBITDA:
Three Months Ended
September 30, Dollar
Change Percentage
Change 2016 2017 Income from ContinuingOperations $ 5,759 $ 25,382 $ 19,623 340.7%Income from ContinuingOperations as a percentage ofConsolidated Revenue 0.6% 2.6% Adjusted EBITDA $ 294,203 $ 323,024 $ 28,821 9.8%Adjusted EBITDA Margin 31.2% 33.5%
Nine Months Ended
September 30, Dollar
Change Percentage
Change 2016 2017 Income from ContinuingOperations $ 54,080 $ 167,374 $ 113,294 209.5%Income from ContinuingOperations as a percentage ofConsolidated Revenue 2.1% 5.9% Adjusted EBITDA $ 790,783 $ 933,652 $ 142,869 18.1%Adjusted EBITDA Margin 30.7% 32.7%
INCOME (LOSS) FROM DISCONTINUED OPERATIONS, NET OF TAX
Income (loss) from discontinued operations, net of tax was $3.6 million and $(3.4) million for the nine months ended September 30, 2016 and 2017,respectively, primarily related to the operations of the Recall Divestments.
NONCONTROLLING INTERESTS
For the nine months ended September 30, 2016 and 2017, net income attributable to noncontrolling interests resulted in a decrease in net income attributableto IMI of $1.8 million and $2.9 million , respectively. These amounts represent our noncontrolling partners' share of earnings/losses in our majority-ownedinternational subsidiaries that are consolidated in our operating results.
75
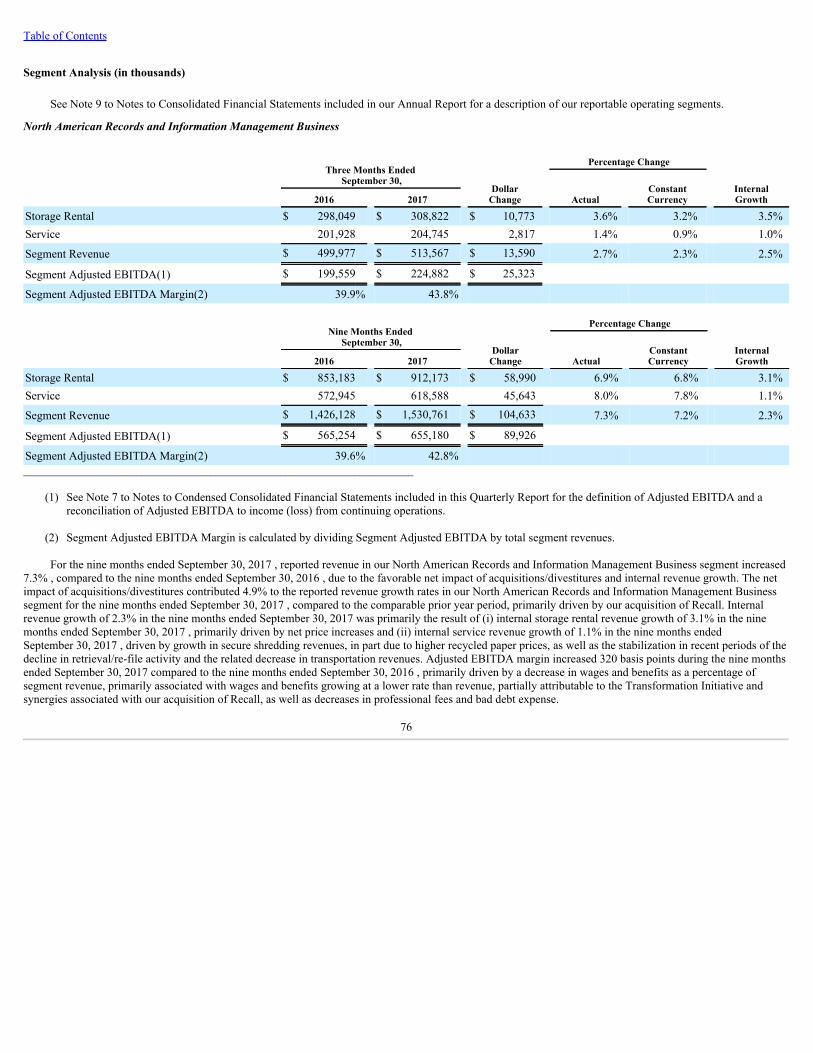
Table of Contents
Segment Analysis (in thousands)
See Note 9 to Notes to Consolidated Financial Statements included in our Annual Report for a description of our reportable operating segments.
North American Records and Information Management Business
Three Months Ended
September 30,
Percentage Change
DollarChange
Actual
ConstantCurrency
InternalGrowth 2016 2017
Storage Rental $ 298,049 $ 308,822 $ 10,773 3.6% 3.2% 3.5%Service 201,928 204,745 2,817 1.4% 0.9% 1.0%
Segment Revenue $ 499,977 $ 513,567 $ 13,590 2.7% 2.3% 2.5%
Segment Adjusted EBITDA(1) $ 199,559 $ 224,882 $ 25,323
Segment Adjusted EBITDA Margin(2) 39.9% 43.8%
Nine Months Ended
September 30,
Percentage Change
DollarChange
Actual
ConstantCurrency
InternalGrowth 2016 2017
Storage Rental $ 853,183 $ 912,173 $ 58,990 6.9% 6.8% 3.1%Service 572,945 618,588 45,643 8.0% 7.8% 1.1%
Segment Revenue $ 1,426,128 $ 1,530,761 $ 104,633 7.3% 7.2% 2.3%
Segment Adjusted EBITDA(1) $ 565,254 $ 655,180 $ 89,926
Segment Adjusted EBITDA Margin(2) 39.6% 42.8% _______________________________________________________________________________
(1) See Note 7 to Notes to Condensed Consolidated Financial Statements included in this Quarterly Report for the definition of Adjusted EBITDA and areconciliation of Adjusted EBITDA to income (loss) from continuing operations.
(2) Segment Adjusted EBITDA Margin is calculated by dividing Segment Adjusted EBITDA by total segment revenues.
For the nine months ended September 30, 2017 , reported revenue in our North American Records and Information Management Business segment increased7.3% , compared to the nine months ended September 30, 2016 , due to the favorable net impact of acquisitions/divestitures and internal revenue growth. The netimpact of acquisitions/divestitures contributed 4.9% to the reported revenue growth rates in our North American Records and Information Management Businesssegment for the nine months ended September 30, 2017 , compared to the comparable prior year period, primarily driven by our acquisition of Recall. Internalrevenue growth of 2.3% in the nine months ended September 30, 2017 was primarily the result of (i) internal storage rental revenue growth of 3.1% in the ninemonths ended September 30, 2017 , primarily driven by net price increases and (ii) internal service revenue growth of 1.1% in the nine months endedSeptember 30, 2017 , driven by growth in secure shredding revenues, in part due to higher recycled paper prices, as well as the stabilization in recent periods of thedecline in retrieval/re-file activity and the related decrease in transportation revenues. Adjusted EBITDA margin increased 320 basis points during the nine monthsended September 30, 2017 compared to the nine months ended September 30, 2016 , primarily driven by a decrease in wages and benefits as a percentage ofsegment revenue, primarily associated with wages and benefits growing at a lower rate than revenue, partially attributable to the Transformation Initiative andsynergies associated with our acquisition of Recall, as well as decreases in professional fees and bad debt expense.
76
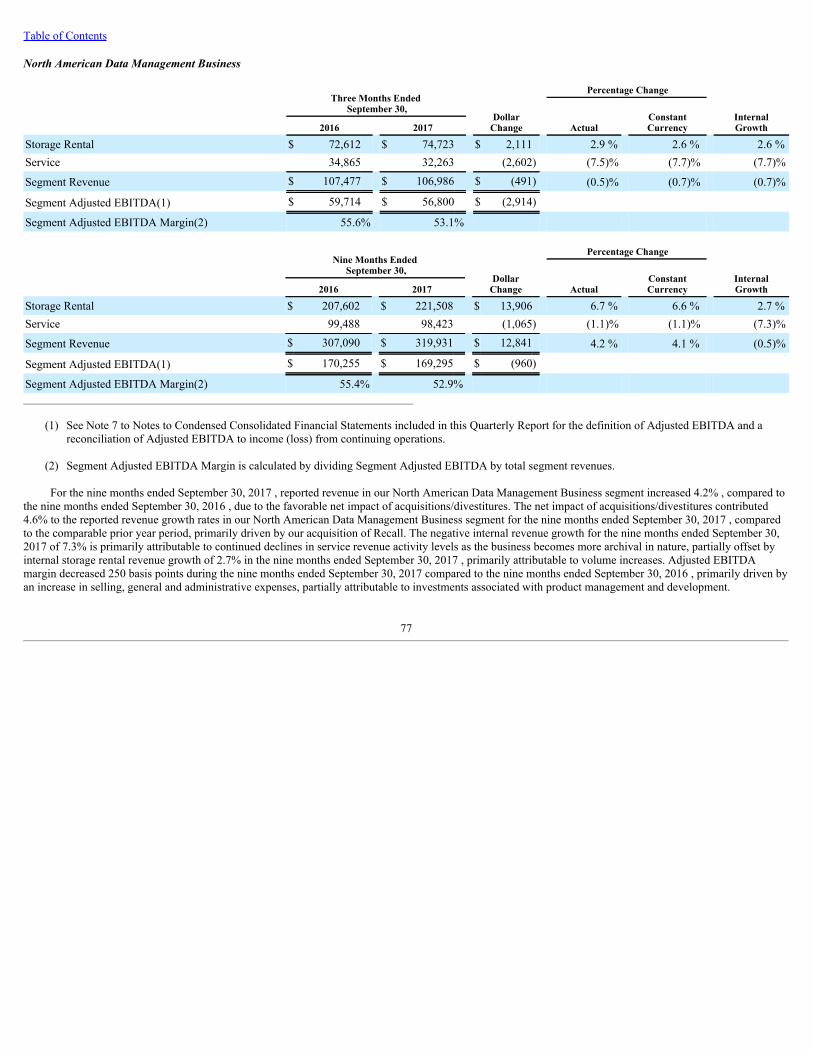
Table of Contents
North American Data Management Business
Three Months Ended
September 30,
Percentage Change
DollarChange
Actual
ConstantCurrency
InternalGrowth 2016 2017
Storage Rental $ 72,612 $ 74,723 $ 2,111 2.9 % 2.6 % 2.6 %Service 34,865 32,263 (2,602) (7.5)% (7.7)% (7.7)%
Segment Revenue $ 107,477 $ 106,986 $ (491) (0.5)% (0.7)% (0.7)%
Segment Adjusted EBITDA(1) $ 59,714 $ 56,800 $ (2,914)
Segment Adjusted EBITDA Margin(2) 55.6% 53.1%
Nine Months Ended
September 30,
Percentage Change
DollarChange
Actual
ConstantCurrency
InternalGrowth 2016 2017
Storage Rental $ 207,602 $ 221,508 $ 13,906 6.7 % 6.6 % 2.7 %Service 99,488 98,423 (1,065) (1.1)% (1.1)% (7.3)%
Segment Revenue $ 307,090 $ 319,931 $ 12,841 4.2 % 4.1 % (0.5)%
Segment Adjusted EBITDA(1) $ 170,255 $ 169,295 $ (960)
Segment Adjusted EBITDA Margin(2) 55.4% 52.9% _______________________________________________________________________________
(1) See Note 7 to Notes to Condensed Consolidated Financial Statements included in this Quarterly Report for the definition of Adjusted EBITDA and areconciliation of Adjusted EBITDA to income (loss) from continuing operations.
(2) Segment Adjusted EBITDA Margin is calculated by dividing Segment Adjusted EBITDA by total segment revenues.
For the nine months ended September 30, 2017 , reported revenue in our North American Data Management Business segment increased 4.2% , compared tothe nine months ended September 30, 2016 , due to the favorable net impact of acquisitions/divestitures. The net impact of acquisitions/divestitures contributed4.6% to the reported revenue growth rates in our North American Data Management Business segment for the nine months ended September 30, 2017 , comparedto the comparable prior year period, primarily driven by our acquisition of Recall. The negative internal revenue growth for the nine months ended September 30,2017 of 7.3% is primarily attributable to continued declines in service revenue activity levels as the business becomes more archival in nature, partially offset byinternal storage rental revenue growth of 2.7% in the nine months ended September 30, 2017 , primarily attributable to volume increases. Adjusted EBITDAmargin decreased 250 basis points during the nine months ended September 30, 2017 compared to the nine months ended September 30, 2016 , primarily driven byan increase in selling, general and administrative expenses, partially attributable to investments associated with product management and development.
77
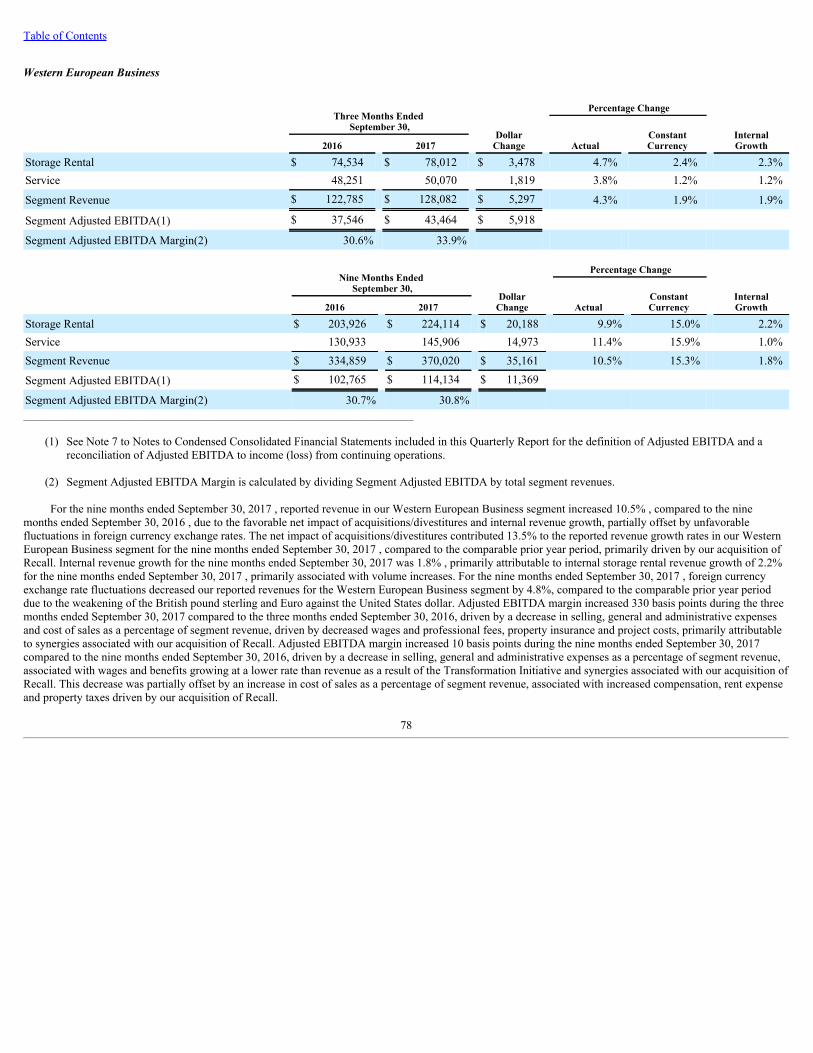
Table of Contents
Western European Business
Three Months Ended
September 30,
Percentage Change
DollarChange
Actual
ConstantCurrency
InternalGrowth 2016 2017
Storage Rental $ 74,534 $ 78,012 $ 3,478 4.7% 2.4% 2.3%Service 48,251 50,070 1,819 3.8% 1.2% 1.2%
Segment Revenue $ 122,785 $ 128,082 $ 5,297 4.3% 1.9% 1.9%
Segment Adjusted EBITDA(1) $ 37,546 $ 43,464 $ 5,918
Segment Adjusted EBITDA Margin(2) 30.6% 33.9%
Nine Months Ended
September 30,
Percentage Change
DollarChange
Actual
ConstantCurrency
InternalGrowth 2016 2017
Storage Rental $ 203,926 $ 224,114 $ 20,188 9.9% 15.0% 2.2%Service 130,933 145,906 14,973 11.4% 15.9% 1.0%Segment Revenue $ 334,859 $ 370,020 $ 35,161 10.5% 15.3% 1.8%
Segment Adjusted EBITDA(1) $ 102,765 $ 114,134 $ 11,369
Segment Adjusted EBITDA Margin(2) 30.7% 30.8% _______________________________________________________________________________
(1) See Note 7 to Notes to Condensed Consolidated Financial Statements included in this Quarterly Report for the definition of Adjusted EBITDA and areconciliation of Adjusted EBITDA to income (loss) from continuing operations.
(2) Segment Adjusted EBITDA Margin is calculated by dividing Segment Adjusted EBITDA by total segment revenues.
For the nine months ended September 30, 2017 , reported revenue in our Western European Business segment increased 10.5% , compared to the ninemonths ended September 30, 2016 , due to the favorable net impact of acquisitions/divestitures and internal revenue growth, partially offset by unfavorablefluctuations in foreign currency exchange rates. The net impact of acquisitions/divestitures contributed 13.5% to the reported revenue growth rates in our WesternEuropean Business segment for the nine months ended September 30, 2017 , compared to the comparable prior year period, primarily driven by our acquisition ofRecall. Internal revenue growth for the nine months ended September 30, 2017 was 1.8% , primarily attributable to internal storage rental revenue growth of 2.2%for the nine months ended September 30, 2017 , primarily associated with volume increases. For the nine months ended September 30, 2017 , foreign currencyexchange rate fluctuations decreased our reported revenues for the Western European Business segment by 4.8%, compared to the comparable prior year perioddue to the weakening of the British pound sterling and Euro against the United States dollar. Adjusted EBITDA margin increased 330 basis points during the threemonths ended September 30, 2017 compared to the three months ended September 30, 2016, driven by a decrease in selling, general and administrative expensesand cost of sales as a percentage of segment revenue, driven by decreased wages and professional fees, property insurance and project costs, primarily attributableto synergies associated with our acquisition of Recall. Adjusted EBITDA margin increased 10 basis points during the nine months ended September 30, 2017compared to the nine months ended September 30, 2016, driven by a decrease in selling, general and administrative expenses as a percentage of segment revenue,associated with wages and benefits growing at a lower rate than revenue as a result of the Transformation Initiative and synergies associated with our acquisition ofRecall. This decrease was partially offset by an increase in cost of sales as a percentage of segment revenue, associated with increased compensation, rent expenseand property taxes driven by our acquisition of Recall.
78
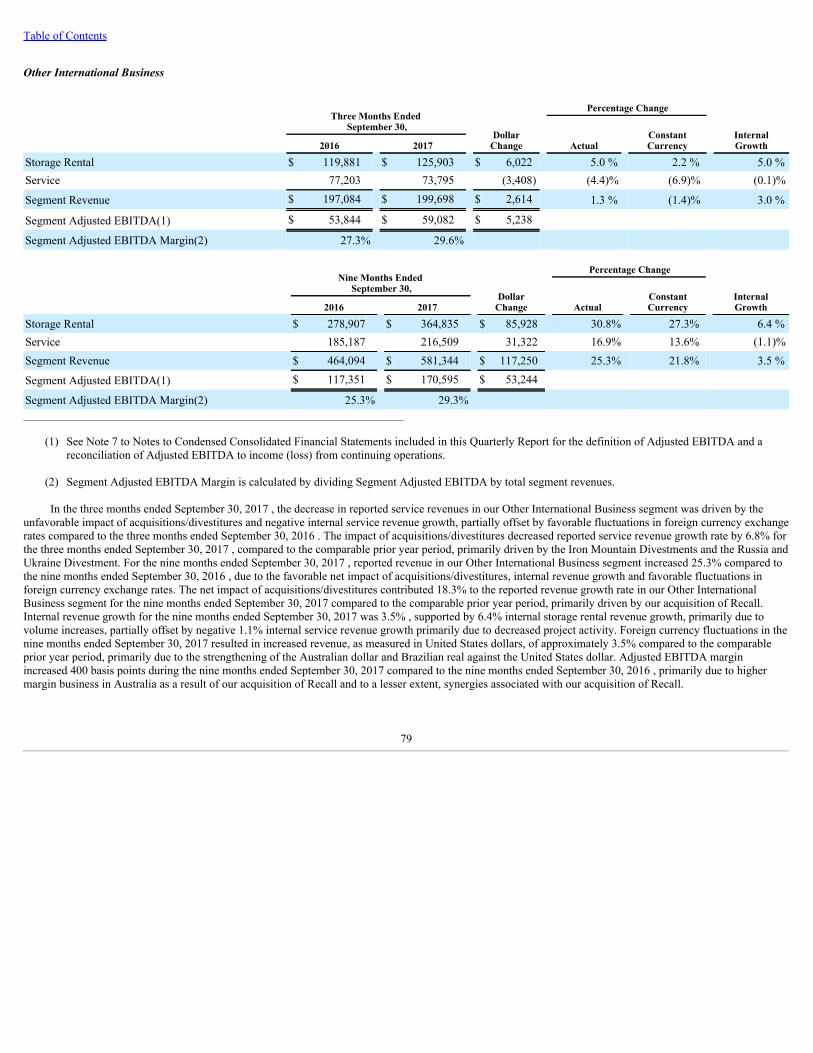
Table of Contents
Other International Business
Three Months Ended
September 30,
Percentage Change
DollarChange
Actual
ConstantCurrency
InternalGrowth 2016 2017
Storage Rental $ 119,881 $ 125,903 $ 6,022 5.0 % 2.2 % 5.0 %Service 77,203 73,795 (3,408) (4.4)% (6.9)% (0.1)%
Segment Revenue $ 197,084 $ 199,698 $ 2,614 1.3 % (1.4)% 3.0 %
Segment Adjusted EBITDA(1) $ 53,844 $ 59,082 $ 5,238
Segment Adjusted EBITDA Margin(2) 27.3% 29.6%
Nine Months Ended
September 30,
Percentage Change
DollarChange
Actual
ConstantCurrency
InternalGrowth 2016 2017
Storage Rental $ 278,907 $ 364,835 $ 85,928 30.8% 27.3% 6.4 %Service 185,187 216,509 31,322 16.9% 13.6% (1.1)%Segment Revenue $ 464,094 $ 581,344 $ 117,250 25.3% 21.8% 3.5 %
Segment Adjusted EBITDA(1) $ 117,351 $ 170,595 $ 53,244
Segment Adjusted EBITDA Margin(2) 25.3% 29.3% _____________________________________________________________________________
(1) See Note 7 to Notes to Condensed Consolidated Financial Statements included in this Quarterly Report for the definition of Adjusted EBITDA and areconciliation of Adjusted EBITDA to income (loss) from continuing operations.
(2) Segment Adjusted EBITDA Margin is calculated by dividing Segment Adjusted EBITDA by total segment revenues.
In the three months ended September 30, 2017 , the decrease in reported service revenues in our Other International Business segment was driven by theunfavorable impact of acquisitions/divestitures and negative internal service revenue growth, partially offset by favorable fluctuations in foreign currency exchangerates compared to the three months ended September 30, 2016 . The impact of acquisitions/divestitures decreased reported service revenue growth rate by 6.8% forthe three months ended September 30, 2017 , compared to the comparable prior year period, primarily driven by the Iron Mountain Divestments and the Russia andUkraine Divestment. For the nine months ended September 30, 2017 , reported revenue in our Other International Business segment increased 25.3% compared tothe nine months ended September 30, 2016 , due to the favorable net impact of acquisitions/divestitures, internal revenue growth and favorable fluctuations inforeign currency exchange rates. The net impact of acquisitions/divestitures contributed 18.3% to the reported revenue growth rate in our Other InternationalBusiness segment for the nine months ended September 30, 2017 compared to the comparable prior year period, primarily driven by our acquisition of Recall.Internal revenue growth for the nine months ended September 30, 2017 was 3.5% , supported by 6.4% internal storage rental revenue growth, primarily due tovolume increases, partially offset by negative 1.1% internal service revenue growth primarily due to decreased project activity. Foreign currency fluctuations in thenine months ended September 30, 2017 resulted in increased revenue, as measured in United States dollars, of approximately 3.5% compared to the comparableprior year period, primarily due to the strengthening of the Australian dollar and Brazilian real against the United States dollar. Adjusted EBITDA marginincreased 400 basis points during the nine months ended September 30, 2017 compared to the nine months ended September 30, 2016 , primarily due to highermargin business in Australia as a result of our acquisition of Recall and to a lesser extent, synergies associated with our acquisition of Recall.
79
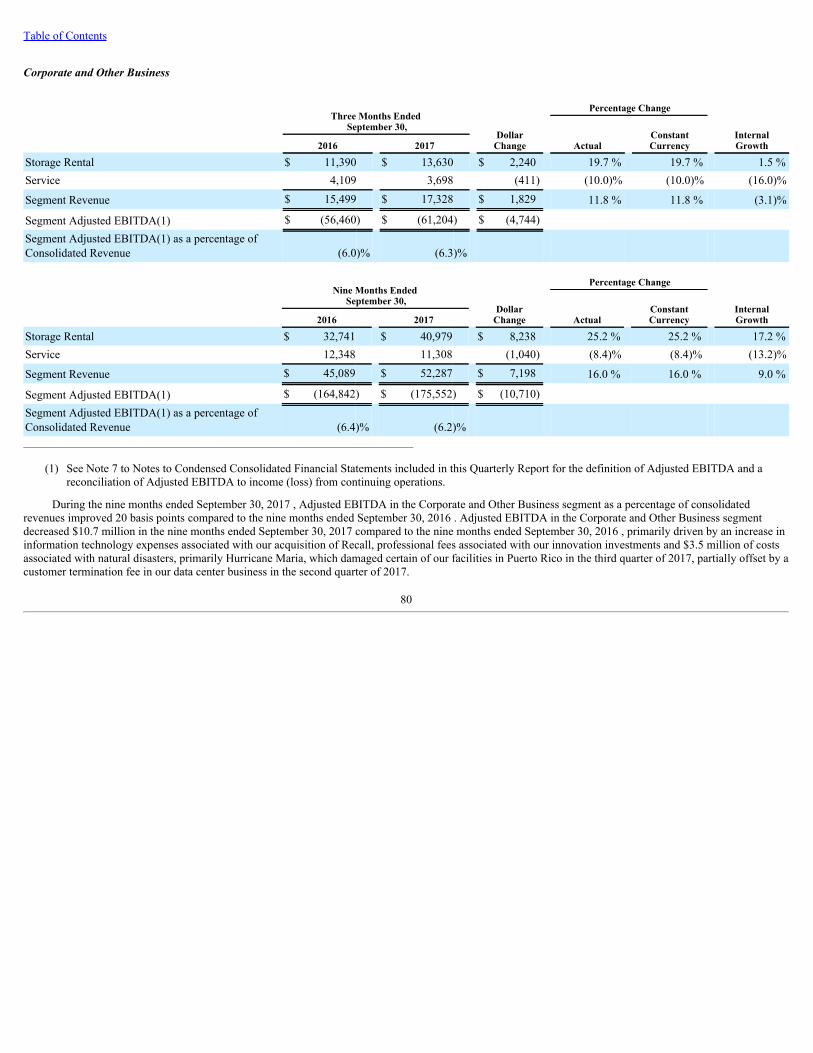
Table of Contents
Corporate and Other Business
Three Months Ended
September 30,
Percentage Change
DollarChange
Actual
ConstantCurrency
InternalGrowth 2016 2017
Storage Rental $ 11,390 $ 13,630 $ 2,240 19.7 % 19.7 % 1.5 %Service 4,109 3,698 (411) (10.0)% (10.0)% (16.0)%
Segment Revenue $ 15,499 $ 17,328 $ 1,829 11.8 % 11.8 % (3.1)%
Segment Adjusted EBITDA(1) $ (56,460) $ (61,204) $ (4,744) Segment Adjusted EBITDA(1) as a percentage ofConsolidated Revenue (6.0)% (6.3)%
Nine Months Ended
September 30,
Percentage Change
DollarChange
Actual
ConstantCurrency
InternalGrowth 2016 2017
Storage Rental $ 32,741 $ 40,979 $ 8,238 25.2 % 25.2 % 17.2 %Service 12,348 11,308 (1,040) (8.4)% (8.4)% (13.2)%
Segment Revenue $ 45,089 $ 52,287 $ 7,198 16.0 % 16.0 % 9.0 %
Segment Adjusted EBITDA(1) $ (164,842) $ (175,552) $ (10,710) Segment Adjusted EBITDA(1) as a percentage ofConsolidated Revenue (6.4)% (6.2)% _______________________________________________________________________________
(1) See Note 7 to Notes to Condensed Consolidated Financial Statements included in this Quarterly Report for the definition of Adjusted EBITDA and areconciliation of Adjusted EBITDA to income (loss) from continuing operations.
During the nine months ended September 30, 2017 , Adjusted EBITDA in the Corporate and Other Business segment as a percentage of consolidatedrevenues improved 20 basis points compared to the nine months ended September 30, 2016 . Adjusted EBITDA in the Corporate and Other Business segmentdecreased $10.7 million in the nine months ended September 30, 2017 compared to the nine months ended September 30, 2016 , primarily driven by an increase ininformation technology expenses associated with our acquisition of Recall, professional fees associated with our innovation investments and $3.5 million of costsassociated with natural disasters, primarily Hurricane Maria, which damaged certain of our facilities in Puerto Rico in the third quarter of 2017, partially offset by acustomer termination fee in our data center business in the second quarter of 2017.
80
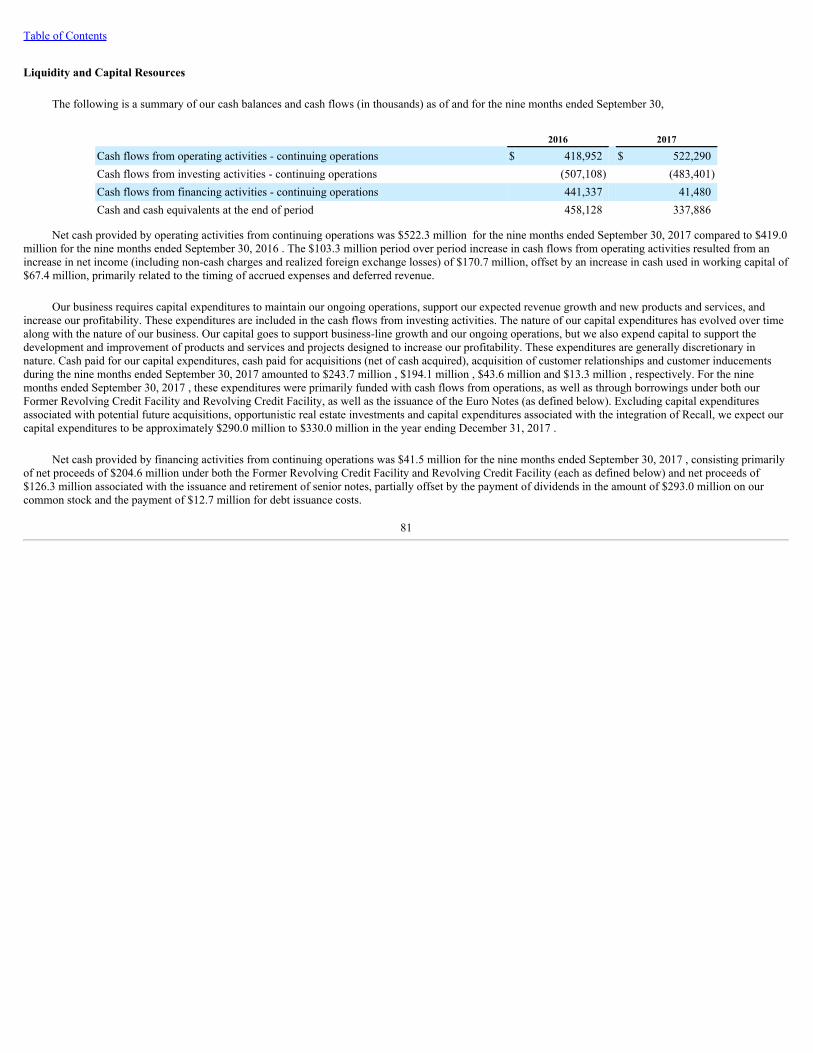
Table of Contents
Liquidity and Capital Resources
The following is a summary of our cash balances and cash flows (in thousands) as of and for the nine months ended September 30,
2016 2017
Cash flows from operating activities - continuing operations $ 418,952 $ 522,290Cash flows from investing activities - continuing operations (507,108) (483,401)Cash flows from financing activities - continuing operations 441,337 41,480Cash and cash equivalents at the end of period 458,128 337,886
Net cash provided by operating activities from continuing operations was $522.3 million for the nine months ended September 30, 2017 compared to $419.0million for the nine months ended September 30, 2016 . The $103.3 million period over period increase in cash flows from operating activities resulted from anincrease in net income (including non-cash charges and realized foreign exchange losses) of $170.7 million, offset by an increase in cash used in working capital of$67.4 million, primarily related to the timing of accrued expenses and deferred revenue.
Our business requires capital expenditures to maintain our ongoing operations, support our expected revenue growth and new products and services, andincrease our profitability. These expenditures are included in the cash flows from investing activities. The nature of our capital expenditures has evolved over timealong with the nature of our business. Our capital goes to support business-line growth and our ongoing operations, but we also expend capital to support thedevelopment and improvement of products and services and projects designed to increase our profitability. These expenditures are generally discretionary innature. Cash paid for our capital expenditures, cash paid for acquisitions (net of cash acquired), acquisition of customer relationships and customer inducementsduring the nine months ended September 30, 2017 amounted to $243.7 million , $194.1 million , $43.6 million and $13.3 million , respectively. For the ninemonths ended September 30, 2017 , these expenditures were primarily funded with cash flows from operations, as well as through borrowings under both ourFormer Revolving Credit Facility and Revolving Credit Facility, as well as the issuance of the Euro Notes (as defined below). Excluding capital expendituresassociated with potential future acquisitions, opportunistic real estate investments and capital expenditures associated with the integration of Recall, we expect ourcapital expenditures to be approximately $290.0 million to $330.0 million in the year ending December 31, 2017 .
Net cash provided by financing activities from continuing operations was $41.5 million for the nine months ended September 30, 2017 , consisting primarilyof net proceeds of $204.6 million under both the Former Revolving Credit Facility and Revolving Credit Facility (each as defined below) and net proceeds of$126.3 million associated with the issuance and retirement of senior notes, partially offset by the payment of dividends in the amount of $293.0 million on ourcommon stock and the payment of $12.7 million for debt issuance costs.
81
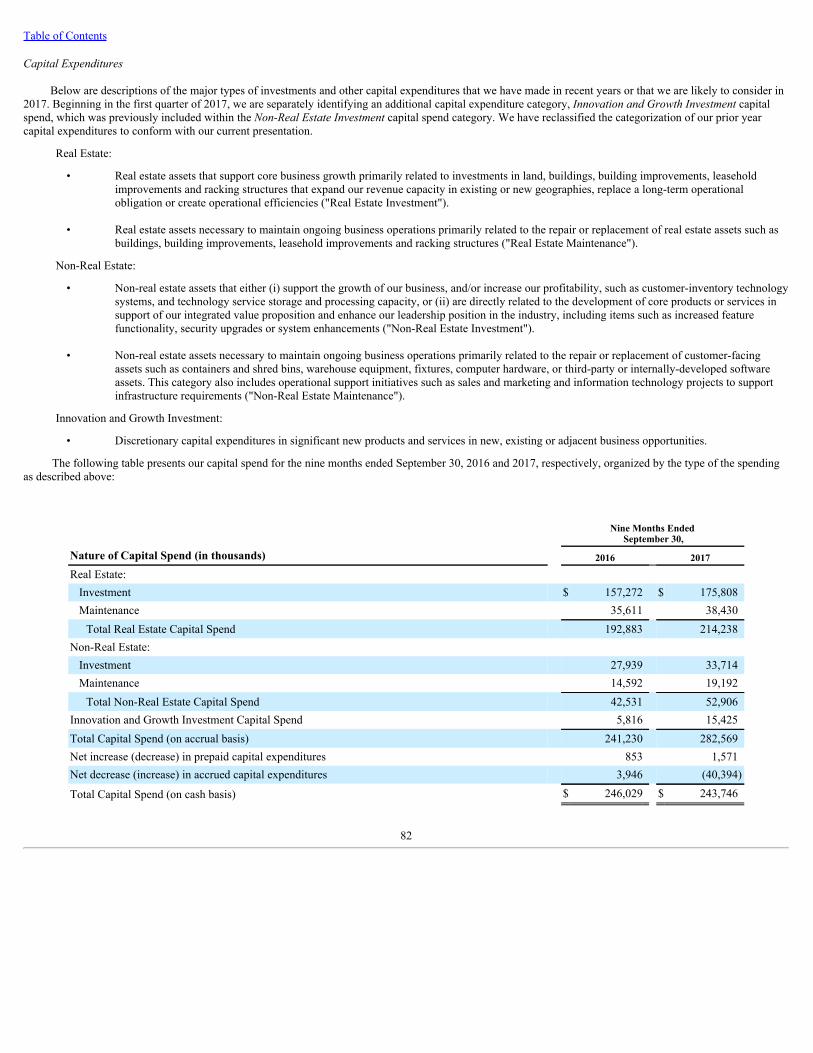
Table of Contents
Capital Expenditures
Below are descriptions of the major types of investments and other capital expenditures that we have made in recent years or that we are likely to consider in2017. Beginning in the first quarter of 2017, we are separately identifying an additional capital expenditure category, Innovation and Growth Investment capitalspend, which was previously included within the Non-Real Estate Investment capital spend category. We have reclassified the categorization of our prior yearcapital expenditures to conform with our current presentation.
Real Estate:
• Real estate assets that support core business growth primarily related to investments in land, buildings, building improvements, leaseholdimprovements and racking structures that expand our revenue capacity in existing or new geographies, replace a long-term operationalobligation or create operational efficiencies ("Real Estate Investment").
• Real estate assets necessary to maintain ongoing business operations primarily related to the repair or replacement of real estate assets such asbuildings, building improvements, leasehold improvements and racking structures ("Real Estate Maintenance").
Non-Real Estate:
• Non-real estate assets that either (i) support the growth of our business, and/or increase our profitability, such as customer-inventory technologysystems, and technology service storage and processing capacity, or (ii) are directly related to the development of core products or services insupport of our integrated value proposition and enhance our leadership position in the industry, including items such as increased featurefunctionality, security upgrades or system enhancements ("Non-Real Estate Investment").
• Non-real estate assets necessary to maintain ongoing business operations primarily related to the repair or replacement of customer-facingassets such as containers and shred bins, warehouse equipment, fixtures, computer hardware, or third-party or internally-developed softwareassets. This category also includes operational support initiatives such as sales and marketing and information technology projects to supportinfrastructure requirements ("Non-Real Estate Maintenance").
Innovation and Growth Investment:
• Discretionary capital expenditures in significant new products and services in new, existing or adjacent business opportunities.
The following table presents our capital spend for the nine months ended September 30, 2016 and 2017, respectively, organized by the type of the spendingas described above:
Nine Months Ended
September 30, Nature of Capital Spend (in thousands) 2016 2017
Real Estate: Investment $ 157,272 $ 175,808Maintenance 35,611 38,430Total Real Estate Capital Spend 192,883 214,238
Non-Real Estate: Investment 27,939 33,714Maintenance 14,592 19,192Total Non-Real Estate Capital Spend 42,531 52,906
Innovation and Growth Investment Capital Spend 5,816 15,425Total Capital Spend (on accrual basis) 241,230 282,569Net increase (decrease) in prepaid capital expenditures 853 1,571Net decrease (increase) in accrued capital expenditures 3,946 (40,394)
Total Capital Spend (on cash basis) $ 246,029 $ 243,746
82
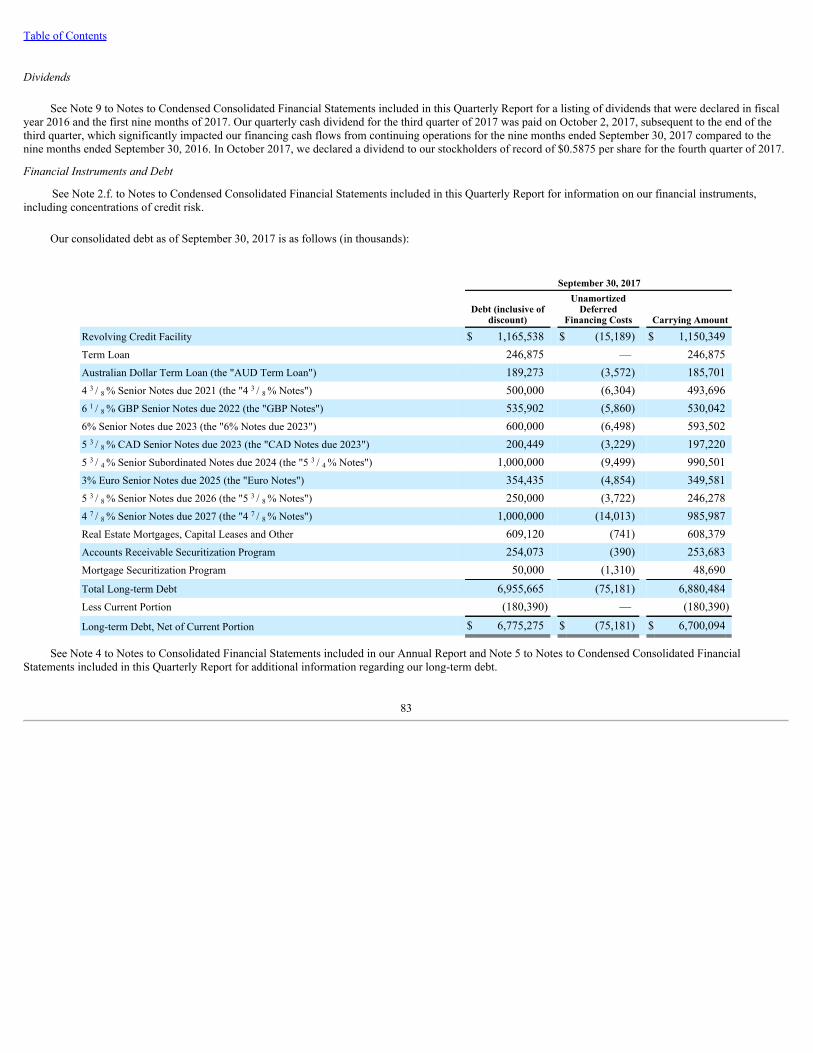
Table of Contents
Dividends
See Note 9 to Notes to Condensed Consolidated Financial Statements included in this Quarterly Report for a listing of dividends that were declared in fiscalyear 2016 and the first nine months of 2017. Our quarterly cash dividend for the third quarter of 2017 was paid on October 2, 2017, subsequent to the end of thethird quarter, which significantly impacted our financing cash flows from continuing operations for the nine months ended September 30, 2017 compared to thenine months ended September 30, 2016. In October 2017, we declared a dividend to our stockholders of record of $0.5875 per share for the fourth quarter of 2017.
Financial Instruments and Debt
See Note 2.f. to Notes to Condensed Consolidated Financial Statements included in this Quarterly Report for information on our financial instruments,including concentrations of credit risk.
Our consolidated debt as of September 30, 2017 is as follows (in thousands):
September 30, 2017
Debt (inclusive of
discount)
UnamortizedDeferred
Financing Costs Carrying Amount
Revolving Credit Facility $ 1,165,538 $ (15,189) $ 1,150,349Term Loan 246,875 — 246,875Australian Dollar Term Loan (the "AUD Term Loan") 189,273 (3,572) 185,7014 3 / 8 % Senior Notes due 2021 (the "4 3 / 8 % Notes") 500,000 (6,304) 493,6966 1 / 8 % GBP Senior Notes due 2022 (the "GBP Notes") 535,902 (5,860) 530,0426% Senior Notes due 2023 (the "6% Notes due 2023") 600,000 (6,498) 593,5025 3 / 8 % CAD Senior Notes due 2023 (the "CAD Notes due 2023") 200,449 (3,229) 197,2205 3 / 4 % Senior Subordinated Notes due 2024 (the "5 3 / 4 % Notes") 1,000,000 (9,499) 990,5013% Euro Senior Notes due 2025 (the "Euro Notes") 354,435 (4,854) 349,5815 3 / 8 % Senior Notes due 2026 (the "5 3 / 8 % Notes") 250,000 (3,722) 246,2784 7 / 8 % Senior Notes due 2027 (the "4 7 / 8 % Notes") 1,000,000 (14,013) 985,987Real Estate Mortgages, Capital Leases and Other 609,120 (741) 608,379Accounts Receivable Securitization Program 254,073 (390) 253,683Mortgage Securitization Program 50,000 (1,310) 48,690Total Long-term Debt 6,955,665 (75,181) 6,880,484Less Current Portion (180,390) — (180,390)
Long-term Debt, Net of Current Portion $ 6,775,275 $ (75,181) $ 6,700,094
See Note 4 to Notes to Consolidated Financial Statements included in our Annual Report and Note 5 to Notes to Condensed Consolidated FinancialStatements included in this Quarterly Report for additional information regarding our long-term debt.
83
Table of Contents
a. Credit Agreement
On August 21, 2017, we entered into a new credit agreement (the "Credit Agreement") which amended and restated our then existing credit agreement (the"Former Credit Agreement") which consisted of a revolving credit facility (the "Former Revolving Credit Facility") and a term loan (the "Former Term Loan") andwas scheduled to terminate on July 6, 2019. The Credit Agreement consists of a revolving credit facility (the "Revolving Credit Facility") and a term loan (the"Term Loan"). The maximum amount permitted to be borrowed under the Revolving Credit Facility is $1,750.0 million . The original amount of the Term Loan is$250.0 million . We have the option to request additional commitments of up to $500.0 million , in the form of term loans or through increased commitments underthe Revolving Credit Facility, subject to the conditions specified in the Credit Agreement. The Credit Agreement is scheduled to mature on August 21, 2022, atwhich point all obligations become due.
The interest rate on borrowings under the Credit Agreement varies depending on our choice of interest rate and currency options, plus an applicable margin,which varies based on our consolidated leverage ratio. Additionally, the Credit Agreement requires the payment of a commitment fee on the unused portion of theRevolving Credit Facility, which fee ranges from between 0.25% to 0.4% based on our consolidated leverage ratio and fees associated with outstanding letters ofcredit. As of September 30, 2017 , we had $1,165.5 million and $246.9 million of outstanding borrowings under the Revolving Credit Facility and the Term Loan,respectively, and $53.6 million of various letters of credit outstanding. The remaining amount available for borrowing under the Revolving Credit Facility as ofSeptember 30, 2017 , which is based on IMI's leverage ratio, the last 12 months' earnings before interest, taxes, depreciation and amortization and rent expense("EBITDAR"), other adjustments as defined in the Credit Agreement and current external debt, was $530.8 million (which amount represents the maximumavailability as of such date). The average interest rate in effect under the Credit Agreement was 3.2% as of September 30, 2017 . The average interest rate in effectunder the Revolving Credit Facility was 3.2% and ranged from 2.0% to 5.3% as of September 30, 2017 and the interest rate in effect under the Term Loan as ofSeptember 30, 2017 was 3.2% .
The capital stock or other equity interests of most of our United States subsidiaries, and up to 66% of the capital stock or other equity interests of most of ourfirst-tier foreign subsidiaries, are pledged to secure borrowings under the Credit Agreement, together with all intercompany obligations (including promissorynotes) of subsidiaries owed to us or to one of our United States subsidiary guarantors. In addition, Iron Mountain Canada Operations ULC ("Canada Company")has pledged 66% of the capital stock of its subsidiaries, and all intercompany obligations (including promissory notes) owed to or held by it, to secure the Canadiandollar subfacility under the Revolving Credit Facility.
b. Issuance of the Euro Notes and the 4 7 / 8 % Notes
In May 2017, IMI completed a private offering of 300.0 million Euro in aggregate principal amount of the Euro Notes, which were issued at par. The netproceeds to IMI from the Euro Notes of 296.3 million Euro (or $332.7 million , based upon the exchange rate between the Euro and the United States dollar onMay 16, 2017 (the settlement date for the Euro Notes)), after deducting discounts to the initial purchasers, were used to repay outstanding borrowings under theFormer Revolving Credit Facility.
In September 2017, IMI completed a private offering of $1,000.0 million in aggregate principal amount of the 4 7 / 8 % Notes. The 4 7 / 8 % Notes were issuedat par. The net proceeds of approximately $987.5 million from the 4 7 / 8 % Notes after deducting discounts to the initial purchasers, together with borrowings underthe Revolving Credit Facility, were used to fund the redemption of all of the 6% Senior Notes due 2020, as described below. See Note 5 to Notes to CondensedConsolidated Financial Statements included in this Quarterly Report for additional information regarding the Euro Notes and the 4 7 / 8 % Notes.
84
Table of Contents
c. Redemption of CAD Notes due 2021 and 6% Senior Notes due 2020
In August 2017, we redeemed all of the 200.0 million Canadian dollars in aggregate principal outstanding of the CAD Notes due 2021 (approximately $157.5million , based upon the exchange rate between the Canadian dollar and the United States dollar on August 15, 2017 (the redemption date for the CAD Notes due2021)) at 103.063% of par, plus accrued and unpaid interest to, but excluding the redemption date, utilizing borrowings under the Former Revolving CreditFacility. We recorded a charge of $6.4 million to other expense (income), net in the third quarter of 2017 related to the early extinguishment of this debt,representing the call premium associated with the early redemption, as well as a write off of unamortized deferred financing costs.
In September 2017, we redeemed all of the $1,000.0 million in aggregate principal outstanding of the 6% Senior Notes due 2020 at 103.155% of par, plusaccrued and unpaid interest to, but excluding, the redemption date, utilizing the net proceeds from the issuance of the 4 7 / 8 Notes and borrowings under theRevolving Credit Facility. We recorded a charge of $41.7 million to other expense (income), net in the third quarter of 2017 related to the early extinguishment ofthis debt, representing the call premium associated with the early redemption, as well as a write off of unamortized deferred financing costs.
d. Accounts Receivable Securitization Program
On July 31, 2017, we amended the Accounts Receivable Securitization Program (as defined in Note 5 to Notes to Condensed Consolidated FinancialStatements included in this Quarterly Report) to (i) increase the maximum amount available from $250.0 million to $275.0 million and (ii) to extend the maturitydate from March 6, 2018 to July 30, 2020, at which point all obligations become due. See Note 5 to Notes to Condensed Consolidated Financial Statementsincluded in this Quarterly Report for additional information regarding the Accounts Receivable Securitization Program.
e. Cash Pooling
Certain of our subsidiaries participate in cash pooling arrangements (the “Cash Pools”) with Bank Mendes Gans (“BMG”), an independently operated fully-owned subsidiary of ING Group, in order to help manage global liquidity requirements. Under the Cash Pools, cash deposited by participating subsidiaries withBMG is pledged as security against the debit balances of other participating subsidiaries, and legal rights of offset are provided and, therefore, amounts arepresented in our Condensed Consolidated Balance Sheets on a net basis. Each subsidiary receives interest on the cash balances held on deposit or pays interest onits debit balances based on an applicable rate as defined in the Cash Pools. At December 31, 2016, we had a net cash position of approximately $1.7 million (whichconsisted of a gross cash position of approximately $69.5 million less outstanding debit balances of approximately $67.8 million by participating subsidiaries).
During the first quarter of 2017, we significantly expanded our utilization of the Cash Pools and reduced our utilization of our financing centers in Europe forpurposes of meeting our global liquidity requirements. We currently utilize two separate cash pools with BMG, one of which we utilize to manage global liquidityrequirements for our QRSs (the "QRS Cash Pool") and the other pool for our TRSs (the "TRS Cash Pool"). During the second quarter of 2017, we executedoverdraft facility agreements for the QRS Cash Pool and TRS Cash Pool, each in an amount not to exceed $10.0 million. Each overdraft facility permits us to covera temporary net debit position in the applicable pool. As of September 30, 2017 , we had a net cash position of approximately $1.0 million in the QRS Cash Pool(which consisted of a gross cash position of approximately $406.3 million less outstanding debit balances of approximately $405.3 million by participatingsubsidiaries) and we had a net cash position of approximately $2.7 million in the TRS Cash Pool (which consisted of a gross cash position of approximately $223.3million less outstanding debit balances of approximately $220.6 million by participating subsidiaries). The net cash position balances as of December 31, 2016 andSeptember 30, 2017 , respectively, are reflected as cash and cash equivalents in the Condensed Consolidated Balance Sheets.
_______________________________________________________________________________
The Credit Agreement, our indentures and other agreements governing our indebtedness contain certain restrictive financial and operating covenants,including covenants that restrict our ability to complete acquisitions, pay cash dividends, incur indebtedness, make investments, sell assets and take certain othercorporate actions. The covenants do not contain a rating trigger. Therefore, a change in our debt rating would not trigger a default under the Credit Agreement, ourindentures or other agreements governing our indebtedness. The Credit Agreement uses EBITDAR-based calculations as the primary measures of financialperformance, including leverage and fixed charge coverage ratios.
85
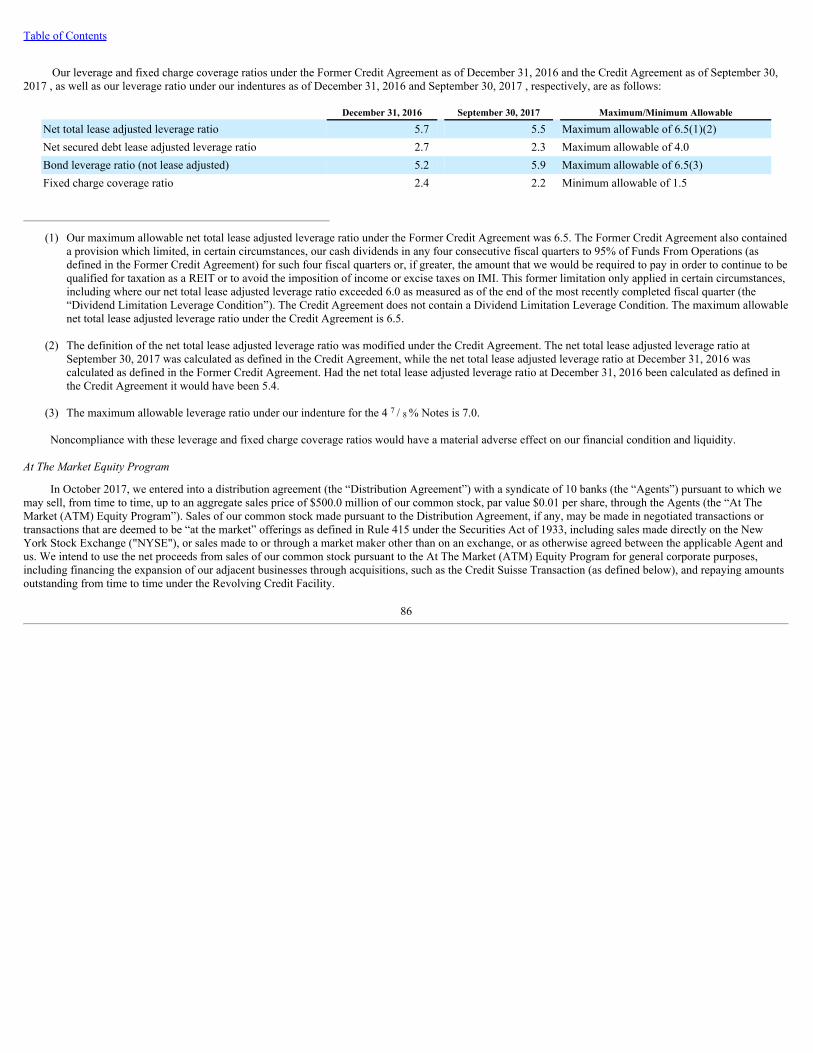
Table of Contents
Our leverage and fixed charge coverage ratios under the Former Credit Agreement as of December 31, 2016 and the Credit Agreement as of September 30,2017 , as well as our leverage ratio under our indentures as of December 31, 2016 and September 30, 2017 , respectively, are as follows:
December 31, 2016 September 30, 2017 Maximum/Minimum Allowable
Net total lease adjusted leverage ratio 5.7 5.5 Maximum allowable of 6.5(1)(2)Net secured debt lease adjusted leverage ratio 2.7 2.3 Maximum allowable of 4.0Bond leverage ratio (not lease adjusted) 5.2 5.9 Maximum allowable of 6.5(3)Fixed charge coverage ratio 2.4 2.2 Minimum allowable of 1.5
______________________________________________________________
(1) Our maximum allowable net total lease adjusted leverage ratio under the Former Credit Agreement was 6.5. The Former Credit Agreement also containeda provision which limited, in certain circumstances, our cash dividends in any four consecutive fiscal quarters to 95% of Funds From Operations (asdefined in the Former Credit Agreement) for such four fiscal quarters or, if greater, the amount that we would be required to pay in order to continue to bequalified for taxation as a REIT or to avoid the imposition of income or excise taxes on IMI. This former limitation only applied in certain circumstances,including where our net total lease adjusted leverage ratio exceeded 6.0 as measured as of the end of the most recently completed fiscal quarter (the“Dividend Limitation Leverage Condition”). The Credit Agreement does not contain a Dividend Limitation Leverage Condition. The maximum allowablenet total lease adjusted leverage ratio under the Credit Agreement is 6.5.
(2) The definition of the net total lease adjusted leverage ratio was modified under the Credit Agreement. The net total lease adjusted leverage ratio atSeptember 30, 2017 was calculated as defined in the Credit Agreement, while the net total lease adjusted leverage ratio at December 31, 2016 wascalculated as defined in the Former Credit Agreement. Had the net total lease adjusted leverage ratio at December 31, 2016 been calculated as defined inthe Credit Agreement it would have been 5.4.
(3) The maximum allowable leverage ratio under our indenture for the 4 7 / 8 % Notes is 7.0.
Noncompliance with these leverage and fixed charge coverage ratios would have a material adverse effect on our financial condition and liquidity.
At The Market Equity Program
In October 2017, we entered into a distribution agreement (the “Distribution Agreement”) with a syndicate of 10 banks (the “Agents”) pursuant to which wemay sell, from time to time, up to an aggregate sales price of $500.0 million of our common stock, par value $0.01 per share, through the Agents (the “At TheMarket (ATM) Equity Program”). Sales of our common stock made pursuant to the Distribution Agreement, if any, may be made in negotiated transactions ortransactions that are deemed to be “at the market” offerings as defined in Rule 415 under the Securities Act of 1933, including sales made directly on the NewYork Stock Exchange ("NYSE"), or sales made to or through a market maker other than on an exchange, or as otherwise agreed between the applicable Agent andus. We intend to use the net proceeds from sales of our common stock pursuant to the At The Market (ATM) Equity Program for general corporate purposes,including financing the expansion of our adjacent businesses through acquisitions, such as the Credit Suisse Transaction (as defined below), and repaying amountsoutstanding from time to time under the Revolving Credit Facility.
86
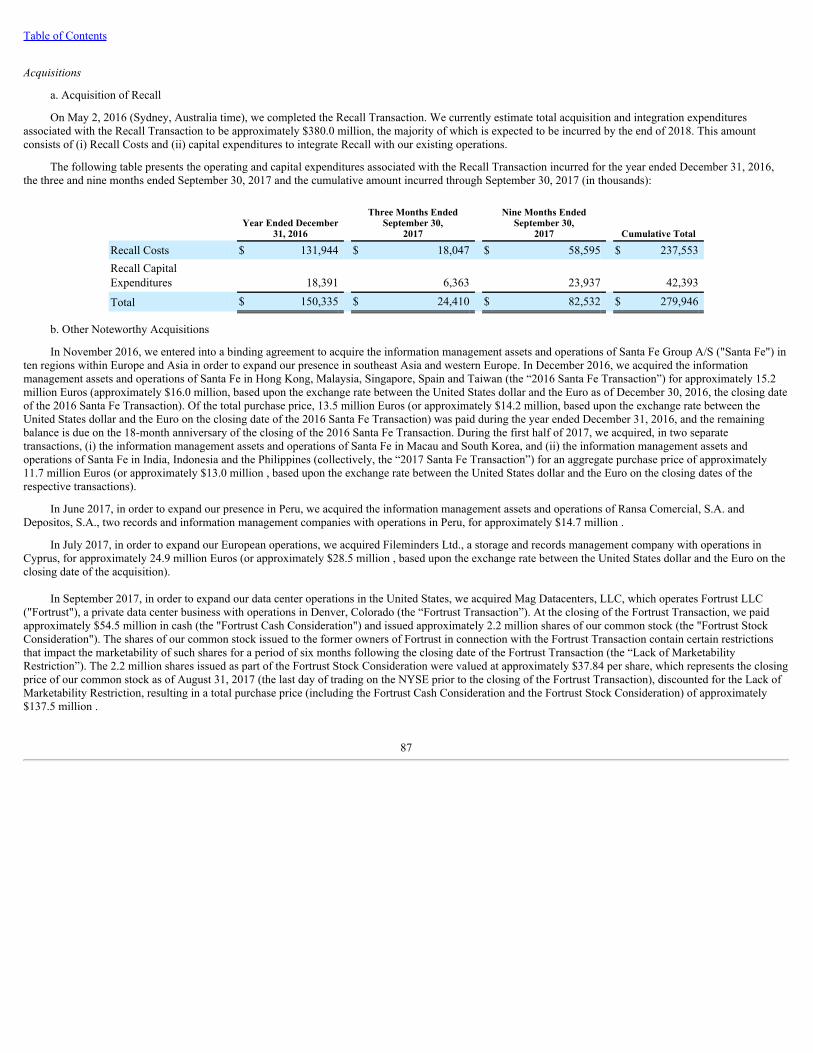
Table of Contents
Acquisitions
a. Acquisition of Recall
On May 2, 2016 (Sydney, Australia time), we completed the Recall Transaction. We currently estimate total acquisition and integration expendituresassociated with the Recall Transaction to be approximately $380.0 million, the majority of which is expected to be incurred by the end of 2018. This amountconsists of (i) Recall Costs and (ii) capital expenditures to integrate Recall with our existing operations.
The following table presents the operating and capital expenditures associated with the Recall Transaction incurred for the year ended December 31, 2016,the three and nine months ended September 30, 2017 and the cumulative amount incurred through September 30, 2017 (in thousands):
Year Ended December
31, 2016
Three Months EndedSeptember 30,
2017
Nine Months EndedSeptember 30,
2017 Cumulative Total
Recall Costs $ 131,944 $ 18,047 $ 58,595 $ 237,553Recall CapitalExpenditures 18,391 6,363 23,937 42,393
Total $ 150,335 $ 24,410 $ 82,532 $ 279,946
b. Other Noteworthy Acquisitions
In November 2016, we entered into a binding agreement to acquire the information management assets and operations of Santa Fe Group A/S ("Santa Fe") inten regions within Europe and Asia in order to expand our presence in southeast Asia and western Europe. In December 2016, we acquired the informationmanagement assets and operations of Santa Fe in Hong Kong, Malaysia, Singapore, Spain and Taiwan (the “2016 Santa Fe Transaction”) for approximately 15.2million Euros (approximately $16.0 million, based upon the exchange rate between the United States dollar and the Euro as of December 30, 2016, the closing dateof the 2016 Santa Fe Transaction). Of the total purchase price, 13.5 million Euros (or approximately $14.2 million, based upon the exchange rate between theUnited States dollar and the Euro on the closing date of the 2016 Santa Fe Transaction) was paid during the year ended December 31, 2016, and the remainingbalance is due on the 18-month anniversary of the closing of the 2016 Santa Fe Transaction. During the first half of 2017, we acquired, in two separatetransactions, (i) the information management assets and operations of Santa Fe in Macau and South Korea, and (ii) the information management assets andoperations of Santa Fe in India, Indonesia and the Philippines (collectively, the “2017 Santa Fe Transaction”) for an aggregate purchase price of approximately11.7 million Euros (or approximately $13.0 million , based upon the exchange rate between the United States dollar and the Euro on the closing dates of therespective transactions).
In June 2017, in order to expand our presence in Peru, we acquired the information management assets and operations of Ransa Comercial, S.A. andDepositos, S.A., two records and information management companies with operations in Peru, for approximately $14.7 million .
In July 2017, in order to expand our European operations, we acquired Fileminders Ltd., a storage and records management company with operations inCyprus, for approximately 24.9 million Euros (or approximately $28.5 million , based upon the exchange rate between the United States dollar and the Euro on theclosing date of the acquisition).
In September 2017, in order to expand our data center operations in the United States, we acquired Mag Datacenters, LLC, which operates Fortrust LLC("Fortrust"), a private data center business with operations in Denver, Colorado (the “Fortrust Transaction”). At the closing of the Fortrust Transaction, we paidapproximately $54.5 million in cash (the "Fortrust Cash Consideration") and issued approximately 2.2 million shares of our common stock (the "Fortrust StockConsideration"). The shares of our common stock issued to the former owners of Fortrust in connection with the Fortrust Transaction contain certain restrictionsthat impact the marketability of such shares for a period of six months following the closing date of the Fortrust Transaction (the “Lack of MarketabilityRestriction”). The 2.2 million shares issued as part of the Fortrust Stock Consideration were valued at approximately $37.84 per share, which represents the closingprice of our common stock as of August 31, 2017 (the last day of trading on the NYSE prior to the closing of the Fortrust Transaction), discounted for the Lack ofMarketability Restriction, resulting in a total purchase price (including the Fortrust Cash Consideration and the Fortrust Stock Consideration) of approximately$137.5 million .
87

Table of Contents
In September 2017, in order to expand our existing entertainment services operations in the United States and to expand our entertainment services operationsinto Canada, France, Hong Kong, the Netherlands and the United Kingdom, we acquired Bonded Services of America, Inc. and Bonded Services Acquisition, Ltd,providers of media asset management services for global entertainment and media companies (the “Bonded Transaction”), for approximately 62.0 million Britishpounds sterling (or approximately $83.0 million , based upon the exchange rate between the British pound sterling and the United States dollar on September 29,2017, the closing date of the Bonded Transaction).
In addition to the transactions noted above, during 2017, in order to enhance our existing operations in the United States, Greece and South Africa and toexpand our operations into the United Arab Emirates, we completed the acquisition of three storage and records management companies, one storage and datamanagement company and one art storage company for total consideration of approximately $15.1 million . The individual purchase prices of these acquisitionsranged from approximately $1.4 million to approximately $4.4 million .
In October 2017, we entered into agreements to acquire two Credit Suisse data centers located in London and Singapore from Credit Suisse International andCredit Suisse AG (together, "Credit Suisse") for an aggregate purchase price of approximately $100.0 million (the “Credit Suisse Transaction”). As part of theCredit Suisse Transaction, we will take ownership of both data center facilities, with Credit Suisse entering into a long-term lease with us to maintain existing datacenter operations. The completion of the Credit Suisse Transaction is subject to closing conditions; accordingly, we can provide no assurance that we will be ableto complete the Credit Suisse Transaction, that the Credit Suisse Transaction will not be delayed or that the terms will remain the same. We expect to close theCredit Suisse Transaction during the first quarter of 2018.
Contractual Obligations
We expect to meet our cash flow requirements for the next twelve months from cash generated from operations, existing cash, cash equivalents, borrowingsunder the Credit Agreement, sales of our common stock under the At The Market (ATM) Equity Program and other financings, which may include senior or seniorsubordinated notes, secured credit facilities, securitizations and mortgage or capital lease financings, and other issuances of equity. We expect to meet our long-term cash flow requirements using the same means described above. We are currently operating above our long-term targeted leverage ratio. As a REIT, we expectour long-term capital allocation strategy will naturally shift towards lower leverage, though our leverage has increased over the last several fiscal years to fund thecosts of our REIT conversion and the Recall Transaction.
Inflation
Certain of our expenses, such as wages and benefits, insurance, occupancy costs and equipment repair and replacement, are subject to normal inflationarypressures. Although to date we have been able to offset inflationary cost increases with increased operating efficiencies, the negotiation of favorable long-term realestate leases and an ability to increase prices in our customer contracts (many of which contain provisions for inflationary price escalators), we can give noassurance that we will be able to offset any future inflationary cost increases through similar efficiencies, leases or increased storage rental or service charges.
Item 4. Controls and Procedures
Disclosure Controls and Procedures
The term "disclosure controls and procedures" is defined in Rules 13a-15(e) and 15d-15(e) of the Securities Exchange Act of 1934, as amended (the"Exchange Act"). These rules refer to the controls and other procedures of a company that are designed to ensure that information is recorded, processed,accumulated, summarized, communicated and reported to management, including its principal executive and principal financial officers, as appropriate to allowtimely decisions regarding what is required to be disclosed by a company in the reports that it files under the Exchange Act. As of September 30, 2017 (the"Evaluation Date"), we carried out an evaluation, under the supervision and with the participation of our management, including our chief executive officer andchief financial officer, of the effectiveness of our disclosure controls and procedures. Based upon that evaluation, our chief executive officer and chief financialofficer concluded that, as of the Evaluation Date, our disclosure controls and procedures are effective.
Changes in Internal Control over Financial Reporting
Our management, with the participation of our principal executive officer and principal financial officer, is responsible for establishing and maintainingadequate internal control over financial reporting as defined in Rules 13a-15(f) and 15d-15(f) of the Exchange Act. Our internal control system is designed toprovide reasonable assurance to our management and board of directors regarding the preparation and fair presentation of published financial statements.
88

Table of Contents
As part of our shared service center initiative, we are centralizing certain finance, human resources and information technology functions. During the threemonths ended September 30, 2017, we implemented significant steps in this plan related to certain accounting and procure to pay functions. We have and willcontinue to align and streamline the design and operation of our financial control environment as part of the shared service center initiative.
There have been no changes in our internal control over financial reporting (as defined in Rules 13a-15(f) under the Securities Act of 1934) during the quarterended September 30, 2017 that have materially affected, or are reasonably likely to materially affect, our internal control over financial reporting.
Part II. Other Information
Item 2. Unregistered Sales of Equity Securities and Use of Proceeds
Other than the 2,193,637 shares of our common stock issued in connection with the closing of the Fortrust Transaction (as more fully described in Note 4 toNotes to Condensed Consolidated Financial Statements included in this Quarterly Report), we did not sell any unregistered equity securities during the threemonths ended September 30, 2017 , nor did we repurchase any shares of our common stock during the three months ended September 30, 2017 .
89
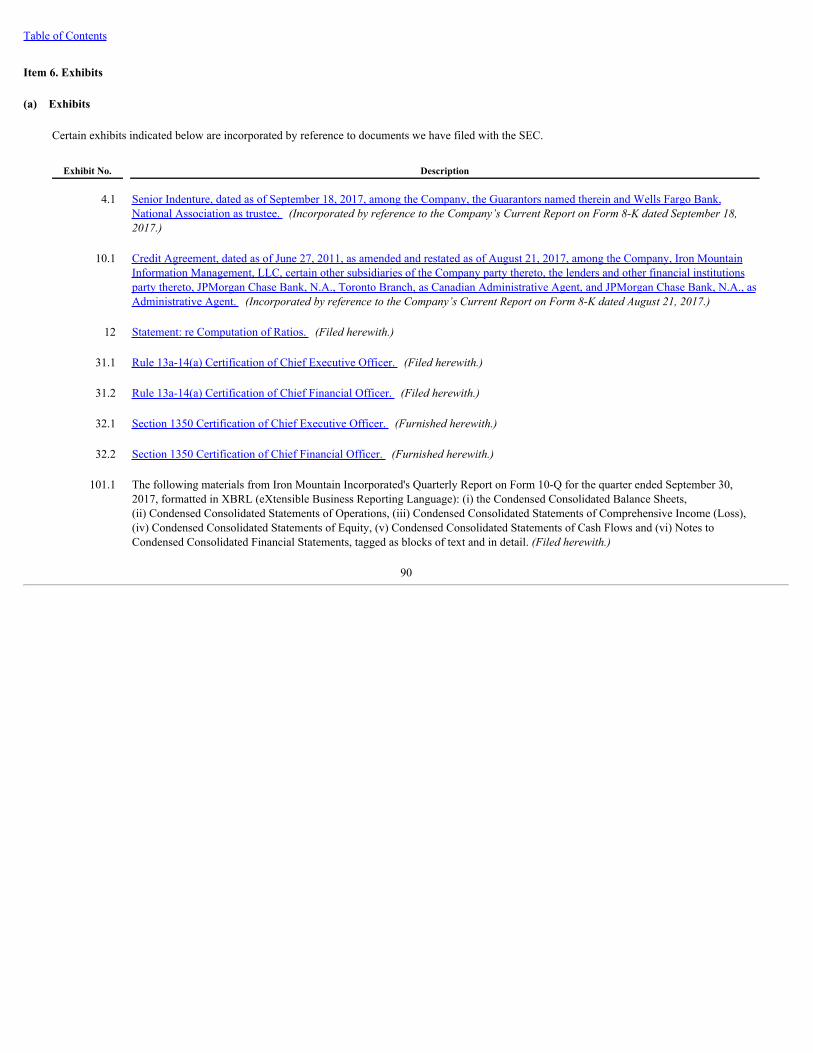
Table of Contents
Item 6. Exhibits
(a) Exhibits
Certain exhibits indicated below are incorporated by reference to documents we have filed with the SEC.
Exhibit No. Description
4.1
Senior Indenture, dated as of September 18, 2017, among the Company, the Guarantors named therein and Wells Fargo Bank,National Association as trustee. (Incorporated by reference to the Company’s Current Report on Form 8-K dated September 18,2017.)
10.1
Credit Agreement, dated as of June 27, 2011, as amended and restated as of August 21, 2017, among the Company, Iron MountainInformation Management, LLC, certain other subsidiaries of the Company party thereto, the lenders and other financial institutionsparty thereto, JPMorgan Chase Bank, N.A., Toronto Branch, as Canadian Administrative Agent, and JPMorgan Chase Bank, N.A., asAdministrative Agent. (Incorporated by reference to the Company’s Current Report on Form 8-K dated August 21, 2017.)
12 Statement: re Computation of Ratios. (Filed herewith.)
31.1 Rule 13a-14(a) Certification of Chief Executive Officer. (Filed herewith.)
31.2 Rule 13a-14(a) Certification of Chief Financial Officer. (Filed herewith.)
32.1 Section 1350 Certification of Chief Executive Officer. (Furnished herewith.)
32.2 Section 1350 Certification of Chief Financial Officer. (Furnished herewith.)
101.1
The following materials from Iron Mountain Incorporated's Quarterly Report on Form 10-Q for the quarter ended September 30,2017, formatted in XBRL (eXtensible Business Reporting Language): (i) the Condensed Consolidated Balance Sheets,(ii) Condensed Consolidated Statements of Operations, (iii) Condensed Consolidated Statements of Comprehensive Income (Loss),(iv) Condensed Consolidated Statements of Equity, (v) Condensed Consolidated Statements of Cash Flows and (vi) Notes toCondensed Consolidated Financial Statements, tagged as blocks of text and in detail. (Filed herewith.)
90
Table of Contents
SIGNATURES
Pursuant to the requirements of the Securities Exchange Act of 1934, the registrant has duly caused this report to be signed on its behalf by the undersignedthereunto duly authorized.
IRON MOUNTAIN INCORPORATED By: /s/ Daniel Borges
Daniel Borges
Vice President, Chief Accounting Officer
Dated: October 26, 2017
91
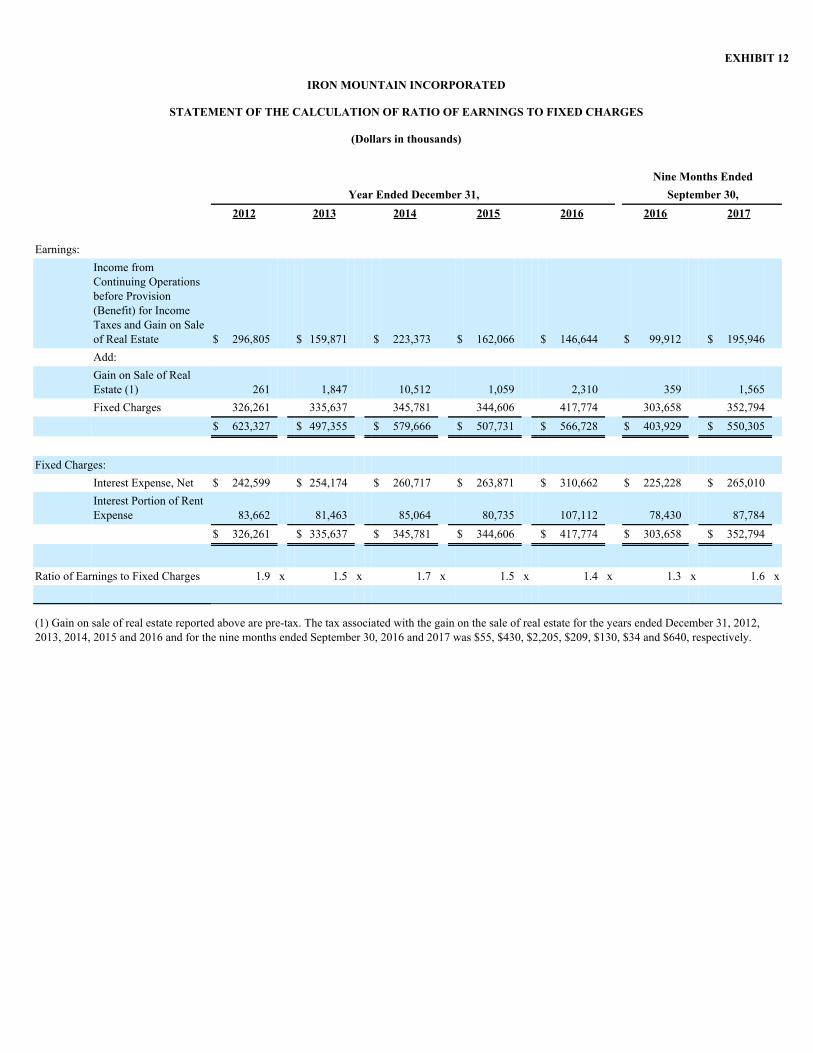
EXHIBIT 12
IRON MOUNTAIN INCORPORATED
STATEMENT OF THE CALCULATION OF RATIO OF EARNINGS TO FIXED CHARGES
(Dollars in thousands)
Nine Months Ended Year Ended December 31, September 30, 2012 2013 2014 2015 2016 2016 2017 Earnings:
Income fromContinuing Operationsbefore Provision(Benefit) for IncomeTaxes and Gain on Saleof Real Estate $ 296,805 $ 159,871 $ 223,373 $ 162,066 $ 146,644 $ 99,912 $ 195,946
Add:
Gain on Sale of RealEstate (1) 261 1,847 10,512 1,059 2,310 359 1,565
Fixed Charges 326,261 335,637 345,781 344,606 417,774 303,658 352,794 $ 623,327 $ 497,355 $ 579,666 $ 507,731 $ 566,728 $ 403,929 $ 550,305 Fixed Charges: Interest Expense, Net $ 242,599 $ 254,174 $ 260,717 $ 263,871 $ 310,662 $ 225,228 $ 265,010
Interest Portion of RentExpense 83,662 81,463 85,064 80,735 107,112 78,430 87,784
$ 326,261 $ 335,637 $ 345,781 $ 344,606 $ 417,774 $ 303,658 $ 352,794
Ratio of Earnings to Fixed Charges 1.9 x 1.5 x 1.7 x 1.5 x 1.4 x 1.3 x 1.6 x (1) Gain on sale of real estate reported above are pre-tax. The tax associated with the gain on the sale of real estate for the years ended December 31, 2012,2013, 2014, 2015 and 2016 and for the nine months ended September 30, 2016 and 2017 was $55, $430, $2,205, $209, $130, $34 and $640, respectively.
EXHIBIT 31.1
CERTIFICATIONS
I, William L. Meaney, certify that:
1. I have reviewed this quarterly report on Form 10-Q of Iron Mountain Incorporated;
2. Based on my knowledge, this report does not contain any untrue statement of a material fact or omit to state a material fact necessary to make thestatements made, in light of the circumstances under which such statements were made, not misleading with respect to the period covered by this report;
3. Based on my knowledge, the financial statements, and other financial information included in this report, fairly present in all material respects thefinancial condition, results of operations and cash flows of the registrant as of, and for, the periods presented in this report;
4. The registrant's other certifying officer(s) and I are responsible for establishing and maintaining disclosure controls and procedures (as defined inExchange Act Rules 13a-15(e) and 15d-15(e)) and internal control over financial reporting (as defined in Exchange Act Rules 13a-15(f) and 15d-15(f))for the registrant and have:
(a) Designed such disclosure controls and procedures, or caused such disclosure controls and procedures to be designed under our supervision, toensure that material information relating to the registrant, including its consolidated subsidiaries, is made known to us by others within thoseentities, particularly during the period in which this report is being prepared;
(b) Designed such internal control over financial reporting, or caused such internal control over financial reporting to be designed under oursupervision, to provide reasonable assurance regarding the reliability of financial reporting and the preparation of financial statements forexternal purposes in accordance with generally accepted accounting principles;
(c) Evaluated the effectiveness of the registrant's disclosure controls and procedures and presented in this report our conclusions about theeffectiveness of the disclosure controls and procedures, as of the end of the period covered by this report based on such evaluation; and
(d) Disclosed in this report any change in the registrant's internal control over financial reporting that occurred during the registrant's most recentfiscal quarter (the registrant's fourth fiscal quarter in the case of an annual report) that has materially affected, or is reasonably likely tomaterially affect, the registrant's internal control over financial reporting; and
5. The registrant's other certifying officer(s) and I have disclosed, based on our most recent evaluation of internal control over financial reporting, to theregistrant's auditors and the audit committee of the registrant's board of directors (or persons performing the equivalent functions):
(a) All significant deficiencies and material weaknesses in the design or operation of internal control over financial reporting which are reasonablylikely to adversely affect the registrant's ability to record, process, summarize and report financial information; and
(b) Any fraud, whether or not material, that involves management or other employees who have a significant role in the registrant's internal controlover financial reporting.
Date: October 26, 2017
/s/ WILLIAM L. MEANEY William L. Meaney President and Chief Executive Officer
EXHIBIT 31.2
CERTIFICATIONS
I, Stuart B. Brown, certify that:
1. I have reviewed this quarterly report on Form 10-Q of Iron Mountain Incorporated;
2. Based on my knowledge, this report does not contain any untrue statement of a material fact or omit to state a material fact necessary to make thestatements made, in light of the circumstances under which such statements were made, not misleading with respect to the period covered by this report;
3. Based on my knowledge, the financial statements, and other financial information included in this report, fairly present in all material respects thefinancial condition, results of operations and cash flows of the registrant as of, and for, the periods presented in this report;
4. The registrant's other certifying officer(s) and I are responsible for establishing and maintaining disclosure controls and procedures (as defined inExchange Act Rules 13a-15(e) and 15d-15(e)) and internal control over financial reporting (as defined in Exchange Act Rules 13a-15(f) and 15d-15(f))for the registrant and have:
(a) Designed such disclosure controls and procedures, or caused such disclosure controls and procedures to be designed under our supervision, toensure that material information relating to the registrant, including its consolidated subsidiaries, is made known to us by others within thoseentities, particularly during the period in which this report is being prepared;
(b) Designed such internal control over financial reporting, or caused such internal control over financial reporting to be designed under oursupervision, to provide reasonable assurance regarding the reliability of financial reporting and the preparation of financial statements forexternal purposes in accordance with generally accepted accounting principles;
(c) Evaluated the effectiveness of the registrant's disclosure controls and procedures and presented in this report our conclusions about theeffectiveness of the disclosure controls and procedures, as of the end of the period covered by this report based on such evaluation; and
(d) Disclosed in this report any change in the registrant's internal control over financial reporting that occurred during the registrant's most recentfiscal quarter (the registrant's fourth fiscal quarter in the case of an annual report) that has materially affected, or is reasonably likely tomaterially affect, the registrant's internal control over financial reporting; and
5. The registrant's other certifying officer(s) and I have disclosed, based on our most recent evaluation of internal control over financial reporting, to theregistrant's auditors and the audit committee of the registrant's board of directors (or persons performing the equivalent functions):
(a) All significant deficiencies and material weaknesses in the design or operation of internal control over financial reporting which are reasonablylikely to adversely affect the registrant's ability to record, process, summarize and report financial information; and
(b) Any fraud, whether or not material, that involves management or other employees who have a significant role in the registrant's internal controlover financial reporting.
Date: October 26, 2017
/s/ STUART B. BROWN
Stuart B. Brown
Executive Vice President and Chief Financial Officer
EXHIBIT 32.1
CERTIFICATION PURSUANT TO18 U.S.C. Section 1350, as adopted pursuant toSection 906 of the Sarbanes-Oxley Act of 2002
In connection with the filing of the quarterly report on Form 10-Q for the quarter ended September 30, 2017 (the "Report") by Iron MountainIncorporated (the "Company"), the undersigned, as the President and Chief Executive Officer of the Company, hereby certifies pursuant to 18 U.S.C. Section 1350,as adopted pursuant to Section 906 of the Sarbanes-Oxley Act of 2002, that, to my knowledge:
1. the Report fully complies with the requirements of Section 13(a) or Section 15(d) of the Securities Exchange Act of 1934; and
2. the information contained in the Report fairly presents, in all material respects, the financial condition and results of operations of the Company.
Date: October 26, 2017
/s/ WILLIAM L. MEANEY William L. Meaney President and Chief Executive Officer
EXHIBIT 32.2
CERTIFICATION PURSUANT TO18 U.S.C. Section 1350, as adopted pursuant toSection 906 of the Sarbanes-Oxley Act of 2002
In connection with the filing of the quarterly report on Form 10-Q for the quarter ended September 30, 2017 (the "Report") by Iron MountainIncorporated (the "Company"), the undersigned, as the Executive Vice President and Chief Financial Officer of the Company, hereby certifies pursuant to 18U.S.C. Section 1350, as adopted pursuant to Section 906 of the Sarbanes-Oxley Act of 2002, that, to my knowledge:
1. the Report fully complies with the requirements of Section 13(a) or Section 15(d) of the Securities Exchange Act of 1934; and
2. the information contained in the Report fairly presents, in all material respects, the financial condition and results of operations of the Company.
Date: October 26, 2017
/s/ STUART B. BROWN Stuart B. Brown Executive Vice President and Chief Financial Officer