IRI Pulse Report Alcohol - IRIWorldwide.com REPORT IRI Pulse Report Alcohol Welcome to the Pulse Q2...
20
PULSE REPORT IRI Pulse Report Alcohol Welcome to the Pulse Q2 2014 edition for alcohol. We hope you find it useful. Please do not hesitate to contact us if you have any questions or comments at [email protected]. Q2 2014 IRIworldwide.eu
-
Upload
nguyencong -
Category
Documents
-
view
213 -
download
0
Transcript of IRI Pulse Report Alcohol - IRIWorldwide.com REPORT IRI Pulse Report Alcohol Welcome to the Pulse Q2...

PULSE REPORT
IRI Pulse Report Alcohol
Welcome to the Pulse Q2 2014 edition for alcohol. We hope you find
it useful. Please do not hesitate to contact us if you have any
questions or comments at [email protected].
Q2 2014
IRIworldwide.eu

PULSE REPORT
About the Report
2
• This alcohol report is one of 10 super category reports designed to show a high-level
comparison and analysis for retail markets across major countries in Europe.
• This report contains data gathered from around Europe. This market was split into the
following categories: beer, cider, wine, spirits, fortified wines and alcoholic soft drinks.
• The report highlights key metrics, such as total sales figures, market trends, category
share and winners and losers for Europe and individual countries.
• The data has been sourced from IRI retail databases and Eurostat – the statistical branch
of administration for the European Commission.
• The countries included in the report are: France, Germany, Italy, the Netherlands, Spain
and the UK.
• The market channels used for each country in this report are as follows:
Country Channels used
UK Hypermarkets, supermarkets, drugstores and impulse outlets
ES Hypermarkets, supermarkets, hard discounters, drugstores. It includes the Canary Islands.
DE Hypermarkets, supermarkets, hard discounters and drugstores
NL Hypermarkets, supermarkets, hard discounters and drugstores
IT Hypermarkets, supermarkets, small self service, hard discounters and drugstores
FR Hypermarkets and supermarkets
• For analytical purposes the data sourced from available retail databases has been
consolidated to provide consistent results. However, for some countries it has not been
possible to source data pertaining to certain categories. Where this is the case, it has been
documented in the ‘Notes’ section found at the end of the report.

PULSE REPORT
On the Radar
3
POPULATION IN MILLIONS
UNEMPLOYMENT (%)
AVERAGE 12 MONTHS
INFLATION RATES GDP IN MILLIONS (€)
Jan. 2012
Jan. 2013
Sep. 2013
Average 2012
Sep. 2013
Average 2012 2012
2013 (Estimate)
France 65.3 65.6 11.1 10.2 +1.2 +2.5
2 032 297
2 059 358
Germany 80.3 80.5 5.2 5.5 +1.8 +2.4
2 644 200
2 694 499
Italy 59.3 59.6 12.5 10.7 +1.8 +3.5
1 565 916
1 568 388
Netherlands 16.7 16.8 7.0 5.3 +3.1 +2.8
600 638
604 459
Spain 46.8 46.7 26.6 25.0 +2.3 +2.3
1 049 525
1 051 076
United Kingdom 63.4 63.8 7.5 7.9 +2.7 +3.7
1 901 001
1 854 920
ECONOMIC FIGURES INFLUENCING CONSUMER BEHAVIOUR
Source: Eurostat, September 2013
The FIFA World Cup 2014, warmer weather and high promotional activity increased demand for alcoholic beverages across the market.

PULSE REPORT
1 162 1 369 1 557 1 351 1 201 1 472 827 897 1 064 1 005 833
919 459
532 547 511
479 569 1 029
1 092 1 243 1 269
1 032 1 155
4 108 4 545
4 753 4 905
4 179
4 842
2 581
2 868
3 277 3 222
2 705
3 049
0
2,000
4,000
6,000
8,000
10,000
12,000
14,000
31-mar-13 30-jun-13 29-sep-13 29-dic-13 30-mar-14 29-jun-14
Eu
ro
s, in
millio
ns
Period Ending
France
Germany
Italy
Netherlands
Spain
UK
GLOBAL TRENDS
4
+3.1%
+2.7%
+7.1%
TOTAL EUROPE +4.0%
VALUE SALES IN MILLIONS (€)
Total EU 47 139
DE 18 679
FR 12 253
UK 5 581*
IT 4 699
ES 3 820
NL 2 107
TOTAL ALCOHOL VALUE SALES AND % CHANGE VERSUS PRIOR YEAR
*based on an exchange rate of €1.150 to the pound
+1.2%
+5.6%
+5.6%
TOTAL ALCOHOL VALUE SALES FOR THE LAST SIX QUARTERS
Source: IRI retail databases; period ending 29 June 2014

PULSE REPORT
8271 486
15 174
10 752
18 700
1.6 6.9
0.3 9.7 2.9
Beer Wine Spirits Cider Fortified
Wines
Eu
ros,
in m
illio
ns
Total € Sales % € vs. YA
39.7%
0.4%
1.8%
22.8%
32.2%
3.2%
Beer Wine Spirits Cider Fortified Wines Alcoholic Soft Drinks
Europe
5
15 174
10 752
1 486
199
18 700
827
Eu
ros,
in m
illi
on
s
Europe includes: France, Germany, Italy, the Netherlands, Spain and the United Kingdom
TOP 5 CATEGORIES: EVOLUTION
Value sales (€) and % change versus a year ago
Source: IRI retail databases; period ending 29 June 2014
KEY TRENDS
• Beer, wine and spirits account for almost
95% of the total turnover for alcoholic
beverages in Europe.
• At the European level, all categories
showed value sales growth in the latest
quarter.
• The FIFA World Cup 2014 played an
important role in the increase of demand
for beer (up 6.9%).
• Wine also grew in all European countries,
mostly due to price increases (inflation).
• Spirits continued to grow this quarter,
driven by strong growth in France, whilst
value sales in all other European countries
are in decline.
CATEGORY VALUE SALES IN THE LAST YEAR
CATEGORY SHARE OF VALUE IN THE LAST YEAR

PULSE REPORT
Europe
6
CATEGORY INSIGHTS
• Beer was the fastest growing category in Europe, with increased demand across all countries,
particularly in France, the Netherlands and Germany (up 16.6%, 8.8% and 6.3%,
respectively). The FIFA World Cup 2014 had a significant impact on the increase in demand,
although other factors such as warmer weather, new product development (e.g. aromatized
beers) and an increase in promotions also improved sales. In addition, tax increases in
France at the start of the year drove revenues up.
• Wine sales also increased across Europe with France, Italy and the Netherlands being the
best performers (up 4.8%, 5.0% and 3.3% respectively). Inflation, a poor harvest and an
increase in demand for premium products drove prices up—a main driver for category
growth.
• Spirits sales also increased slightly in Europe due to increased demand in France, which
compensated for the decline seen in all other European countries.
Europe includes: France, Germany, Italy, the Netherlands, Spain and the United Kingdom
Source: IRI retail databases; period ending 29 June 2014
TOP LOSERS: VALUE SALES CHANGE VERSUS A YEAR AGO (€)
TOP WINNERS: VALUE SALES CHANGE VERSUS A YEAR AGO (€)
13.2
30.7
131.5
430.5
1 204.0
0 500 1 000 1 500
Beer
Wine
Cider
Spirits
Fortified
Wines
0 0 0 0 0 0
Euros, in millions Euros, in millions

PULSE REPORT
114
493
4 054
2 173
5 407
6.0 4.8 16.6 4.2 1.7
Wine Spirits Beer Fortified
Wines
Cider
Eu
ros,
in m
illio
ns
Total € Sales % € vs. YA
44.1%
0.1%
0.9%
17.7%
33.1%
4.0%
Wine Spirits Beer Fortified Wines Cider Alcoholic Soft Drinks
France
7
KEY TRENDS
• In hypermarkets and supermarkets,
beverages grew faster than total fast moving
consumer goods (FMCG) during the period of
January to June 2014.
• Alcoholic beverages continue to grow faster
than non-alcoholic drinks. Excluding spirits,
the macro alcohol category is also growing
value sales faster than FMCG (+1.9%).
• The alcohol market benefited from improved
weather conditions from January to June
compared with the same period last year.
• A value sales increase in the alcohol market
can be linked to an increase in volume sales
(excluding still wine). Beer and cider are
driven by premium products, whilst inflation
is in decline (down 0.9%). Spirits and
fortified wines dropped 0.1% in value;
inflation gains of + 1.1% are offset by the
increased popularity of flavored wine.
• Sales have increased across all segments,
driven by national brands and on-shelf sales.
Promotional sales increased only in the beer
sector.
4 054
2 173
493
12
5 407
114
Eu
ros,
in m
illi
on
s
CATEGORY VALUE SALES IN THE LAST YEAR
CATEGORY SHARE OF VALUE IN THE LAST YEAR
Source: IRI retail databases; period ending 29 June 2014
TOP 5 CATEGORIES: EVOLUTION
Value sales (€) and % change versus a year ago

PULSE REPORT
- 0.6
-1 -1 -1 0 0 0
Alcoholic Soft
Drinks
.
France
8
CATEGORY INSIGHTS
• The beer segment enjoyed the highest value sales growth among alcoholic beverages in
France, positive both on moving annual total (MAT) and year to date (YTD). In 2014, growth
has been linked to new product launches (e.g. aromatized beers) without changes in
promotional pressure; good weather and the economy are also supporting growth. After a
year of strong inflation in 2013, attributable to tax increases, the category experienced
deflation (0.9%). In the long term and YTD, the fastest growing segments remain specialty
and blonde beers.
• Wine - value and volume sales continue to grow, supported by both the still and sparkling
wine segments (MAT and YTD).
− Still wines – price increases are still driven by inflation and a low harvest level,
while a price war is strong across national brands.
− Sparkling and champagne – both champagne and other sparkling wine increased
in volume sales on YTD. Inflation is at 0.7% and premiumisation at 0.6%.
• Spirits and fortified wines – the total segment retained 1.0% inflation over the first quarter,
while the increase of flavored wine sales drives the value sales structure down (-1.2%).
For spirits (volume – YTD):
− Gin, vodka, tequila, rum and rum -based cocktails are still the main segments to
show growth.
− The whisky segment returned to stability during this latest period, thanks to the
development of bourbons that offset the decrease of blended whisky a year ago.
− Anise, fruit creams and brown alcohol (e.g., cognac and armagnac) are declining.
• Fortified wines are still driven by flavored wines, whilst traditional fortified wines, such as
port, vermouth and French appellation ,show less growth.
TOP LOSERS: VALUE SALES CHANGE VERSUS A YEAR AGO (€)
TOP WINNERS: VALUE SALES CHANGE VERSUS A YEAR AGO (€)
6.4
19.8
69.0
249.3
308.9
0 100 200 300 400
Beer
Wine
Spirits
Fortified
Wines
Cider
Source: IRI retail databases; period ending 29 June 2014
Euros, in millions Euros, in millions

PULSE REPORT
103 122
5 421
4 836
8 138
-1.2 6.3 -0.3 12.3 0.4
Beer Wine Spirits Alcoholic
Soft
Drinks
Fortified
Wines
Eu
ros,
in m
illio
ns
Total € Sales % € vs. YA
43.6%
0.3%
0.6%
25.9%
29.0%
0.7%
Beer Wine Spirits Alcoholic Soft Drinks Fortified Wines Cider
Germany
9
KEY TRENDS
• As expected, the FIFA World Cup 2014
boosted volume sales in the German beer
market. Together with stable prices, this led
to overall volume and value sales increases.
• A rainy summer did not affect the sales of
sparkling wine. An increase in volume sales
is being driven by the entry of market-
leading brands into the flavored sparkling
segment.
• Promotional activity has increased volume
and value sales of branded still wines.
Collapsed sales in the hard discounter
channel are negatively impacting the value
outcome.
• The spirits sector is in decline. Rum shows a
negative performance, whilst vodka is
recovering its volume sales.
• Branded spirit companies continue to grow
across spirit-based alcoholic soft drinks.
5 421
4 836
122 60
8 138
103
Eu
ros,
in m
illi
on
s
CATEGORY VALUE SALES IN THE LAST YEAR
CATEGORY SHARE OF VALUE IN THE LAST YEAR
TOP 5 CATEGORIES: EVOLUTION
Value sales (€) and % change versus a year ago
Source: IRI retail databases; period ending 29 June 2014

PULSE REPORT
Germany
10
CATEGORY INSIGHTS
• Promotional sales and increased demand during the FIFA World Cup drove volume sales for
beer in the second quarter of 2014. However, due to higher promotional prices versus 2013,
value sales increased as well. Value growth is also affected by increasingly popular beer
segments, such as alcohol-free beer or mixes (e.g. beer with lemonade), which are generally
sold at higher price points.
• Sparkling wine is still affected by a two-sided evolution. Classic German sparkling wine is
experiencing sharp volume sales declines, but losses are being offset by higher prices,
especially on promotion. Volume losses are also being offset by strong growth within the
flavored sparkling market. The base market/flavors are strong, but there is also a rapidly
increasing number of new products coming into the market, such as Rotkäppchen
Fruchtsecco or Jules Mumm Plus.
• In spirits, several market influencers took a negative turn in the second quarter of 2014.
Rum, which has had momentum during recent periods, is losing volume. In turn, vodka sales
have picked up, thanks to promotional efforts. Both vodka and whisky are demonstrating
high demand across most FMCG channels. In all decreasing segments, growth has come only
from flavored articles. Brandy/cognac and liquors volume losses lead to negative value sales
and can´t compensate the category drop.
• Value sales growth across alcoholic soft drinks are hailing completely from branded
businesses.
• Private label wine sales are strongly decreasing, especially in discount stores.
TOP LOSERS: VALUE SALES CHANGE VERSUS A YEAR AGO (€)
TOP WINNERS: VALUE SALES CHANGE VERSUS A YEAR AGO (€)
Source: IRI retail databases; period ending 29 June 2014
- 1.2
- 15.7
- 1.2
-20 -15 -10 -5 0
Fortified
Wines
Cider
Spirits
.
13.3
23.9
480.5
0 100 200 300 400 500 600
Beer
Wine
Alcoholic Soft
Drinks
Euros, in millions Euros, in millions

PULSE REPORT
13 48
1 402
971
2 265
-19.9 5.0 -0.3 -1.3 2.9
Wine Beer Spirits Fortified
Wines
Alcoholic
Soft
Drinks
Eu
ros,
in m
illio
ns
Total € Sales % € vs. YA
0.3% 20.7%
29.8%48.2%
1.0%
Wine Beer Spirits Fortified Wines Alcoholic Soft Drinks
Italy
11
KEY TRENDS
• In the wine category, value sales are
increasing, but volume is declining.
• Beer is experiencing a period of stable sales,
supported by the expectation of the summer
season.
• Spirits are gradually improving in both in
value and volume sales, seen in the slight
growth of aperitifs and the recovery of
bitters. Whisky, cognacs and other high
alcohol content products sales are impacted
by the Italian Government’s excise duty,
modified late in 2013.
1 402
971
13
2 265
48
Eu
ros,
in m
illi
on
s
CATEGORY VALUE SALES IN THE LAST YEAR
CATEGORY SHARE OF VALUE IN THE LAST YEAR
Source: IRI retail databases; period ending 29 June 2014
TOP 5 CATEGORIES: EVOLUTION
Value sales (€) and % change versus a year ago

PULSE REPORT
Italy
12
CATEGORY INSIGHTS
• Slow price increases are supporting volume growth in the wine category. Promotions are no
longer the key growth area within brands, as short term success related to increased
promotional pressure quickly disappears.
• In recent months, beer marketers have found success in driving growth through innovation
despite a weak trending market. One Italian company ended the year with a 9.0% increase
in value sales (+8.8% in volume sales), significantly higher than other firms in the category.
This was as a result of innovation, communication and in-store activities.
• It is a tough climate for spirits, nothing is improving sales; the aging population, busy
lifestyles and high taxes are all feeding into sales declines. Can there be any solutions to the
problem? The right promotional levels, consistency in commercial offers and products
adaptable to socio-demographic change can be put in place to overcome the sales drop.
Overall, businesses need to understand what consumers want and invest in research and
development to meet demand.
• The alcoholic soft drinks sector has been in decline since its launch two years ago.
TOP 5 LOSERS: VALUE SALES CHANGE VERSUS A YEAR AGO (€)
TOP 5 WINNERS: VALUE SALES CHANGE VERSUS A YEAR AGO (€)
Source: IRI retail databases; period ending 29 June 2014
- 3.3
- 0.6
- 2.9
-40 -30 -20 -10 0
Fortified
Wines
Spirits
Alcoholic Soft
Drinks
.
108,1
39,4
-10 40 90 140
Wine
Beer
Euros, in millions Euros, in millions

PULSE REPORT
1 53
856
80
1 118
-2.3 8.8 -6.6 1.0 3.3
Beer Wine Fortified
Wines
Alcoholic
Soft
Drinks
Cider
Eu
ros,
in m
illio
ns
Total € Sales % € vs. YA
0.1%
40.6%
53.0%
3.8%2.5%
Beer Wine Fortified Wines Alcoholic Soft Drinks Cider
The Netherlands
13
KEY TRENDS
• Despite high summer temperatures the
Dutch alcoholic beverage market shows a
decline in value of 1.4% in P8 compared to
last year.
• Total private label share in retail is at its
lowest point since 2013.
• Promotional activity has declined to 17.3%
of volume sales, yet the beer and wine
categories show a increase in promotional
share (to 39.0% and 32.0% of volume,
respectively).
• The popularity of cider has been overtaken
by product introductions within the radler
segment, mainly driven by Amstel and
Bavaria. Alcohol-free beer is also showing
growth in value and volume sales.
856
80
1
1 118
53
Eu
ros,
in m
illi
on
s
CATEGORY VALUE SALES IN THE LAST YEAR
CATEGORY SHARE OF VALUE IN THE LAST YEAR
TOP 5 CATEGORIES: EVOLUTION
Value sales (€) and % change versus a year ago
Source: IRI retail databases; period ending 29 June 2014

PULSE REPORT
The Netherlands
14
CATEGORY INSIGHTS
• Beer is showing volume growth because of the successful introduction of the radler segment,
alcohol-free beer and low alcohol beer. Both of these new segments are growing due to
increasing promotional activity.
• Wine is growing in value, but volume sales are in decline, mainly due to declines in red and
rose wine sectors. Aromatic wines (fruit flavoured) are still relatively small, but are showing
huge growth. The growing prevalence of Hugo concepts (sparkling white wine with lemon and
Elderflower flavour, originally from the north of Italy) is one of the drivers behind the growth
in this segment.
• Alcoholic soft drinks are showing a small increase in value sales, while volume sales are
slowly declining due to the introduction of mixed drinks cans, which replace higher-selling
products like Bacardi Cola and Bacardi Red Dragon.
• Fortified wines are suffering from declining sales within Dutch supermarkets, largely due to
stagnant new product development efforts.
TOP LOSERS: VALUE SALES CHANGE VERSUS A YEAR AGO (€)
TOP WINNERS: VALUE SALES CHANGE VERSUS A YEAR AGO (€)
Source: IRI retail databases; period ending 29 June 2014
- 5.7
0.0
-6 -5 -4 -3 -2 -1 0
Cider
Fortified
Wines
.
0.5
27.3
90.3
0 20 40 60 80 100
Beer
Wine
Alcoholic Soft
Drinks
Euros, in millions Euros, in millions

PULSE REPORT
33 104
1 224
892
1 567
3.3 2.6 -2.2 0.9 1.8
Beer Wine Spirits Fortified
Wines
Cider
Eu
ros,
in m
illio
ns
Total € Sales % € vs. YA
0.9%
41.0%
32.0%
23.4%
2.7%
Beer Wine Spirits Fortified Wines Cider
Spain
15
KEY TRENDS
• Fast moving consumer goods (FMCG) sales
grew by 0.7% in Spain, with beverages
performing in a similar way, expanding by
0.6%.
• Beers was the top performing alcoholic
beverage category this quarter, driven by
higher temperatures, the FIFA World Cup
and an increase in tourism (which reached
a record high in 2014).
• Wine also showed a growth in value, driven
especially by Protected Denomination of
Origin (PDO) wines and by the white wine
segment.
• Whisky, rum and vodka continued to lose
value, while gin sales carried on growing at
double digit rates, due to consumers’
affinity for gin and tonic beverages.
1 224
892
104
1 567
33
Eu
ros,
in m
illi
on
s
CATEGORY VALUE SALES IN THE LAST YEAR
CATEGORY SHARE OF VALUE IN THE LAST YEAR
TOP 5 CATEGORIES: EVOLUTION
Value sales (€) and % change versus a year ago
Source: IRI retail databases; period ending 29 June 2014

PULSE REPORT
Spain
16
CATEGORY INSIGHTS
• Signs of recovery were seen in the beer segment, particularly in FMCG, bars and restaurants.
For the first time after years of consecutive contraction, the market bounced back, driven by
demand from the FIFA World Cup, warmer weather conditions and record high levels of
foreign tourism. Despite recovery in national levels of demand, major beer manufacturers
continue to push exports.
• The wine segment also experienced positive evolution in the mass market. Consumers are
increasingly demanding higher quality products at lower prices. This is driving demand for
PDO wines (year-on-year 4.0% increase by value). Where the type of wine is concerned,
white wine has shown the highest increase year-on-year (4.0%), with Rueda PDO being the
best performer in the category (up 14.0%).
• Sales of spirits continue to decline, with contraction in all categories: whisky (down 5.0%),
rum (down 6.0%), vodka ( down 4.0%). The only exception is gin, which continues to
expand at double digit rates (+12.0%), driven by booming demand for gin and tonic.
TOP LOSERS: VALUE SALES CHANGE VERSUS A YEAR AGO (€)
TOP WINNERS: VALUE SALES CHANGE VERSUS A YEAR AGO (€)
Source: IRI retail databases; period ending 29 June 2014
- 19.9
-30 -25 -20 -15 -10 -5 0
Spirits
.
1.1
0.9
22.0
40.2
0 10 20 30 40 50
Beer
Wine
Cider
Fortified
Wines
Euros, in millions Euros, in millions

PULSE REPORT
22.9%
77.1%
Beer Cider
The United Kingdom
17
Eu
ros,
in m
illi
on
s
CATEGORY VALUE SALES IN THE LAST YEAR
CATEGORY SHARE OF VALUE IN THE LAST YEAR
TOP 5 CATEGORIES: EVOLUTION
Value sales (€) and % change versus a year ago
Source: IRI retail databases; period ending 29 June 2014
1 279
4 302
1 279
4 302
6.0 10.9
Beer Cider
Eu
ros,
in m
illio
ns
Total € Sales % € vs. YA
KEY TRENDS
• The beer and cider market continues to
grow in the long term in both value
(+7.0%) and volume (+6.3%), although in
the latest quarter (Q2) sales increases
have been driven by a later Easter versus
2013 and the build up to the FIFA World
Cup. Q2 volume increased 10.4% and
value increased 8.0%. Promotional activity
has driven the growth in volume ahead of
value.
• Lager supported Q2 growth with
promotional activity. As a result, volume
sales growth outpaced value sales growth
(+12.8% and +8.7%, respectively). Ale
and cider both enjoyed strong growth in
Q2, as well (+7.8% and+6.6% in value
sales, respectively).
• Only stout has not been able to deliver the
same level of growth in Q2. Volume sales
fell 2.0% and value sales grew +1.5%, due
to decreases in promotional support.
PULSE REPORT
The United Kingdom
18
Source: IRI retail databases; period ending 29 June 2014
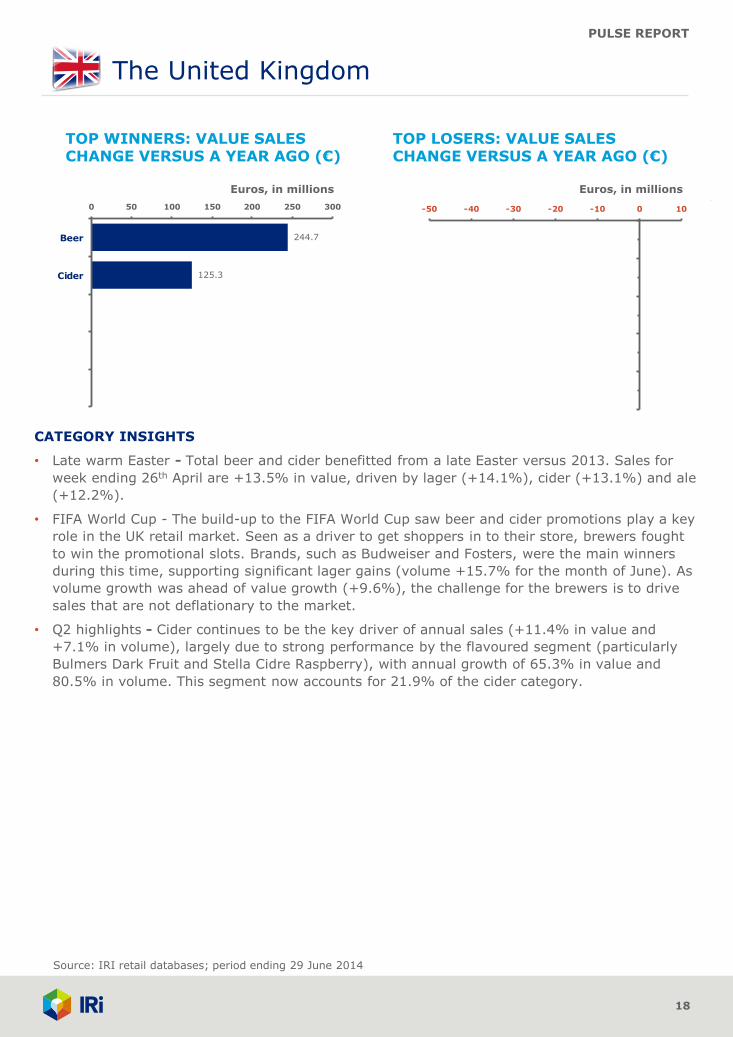
TOP LOSERS: VALUE SALES CHANGE VERSUS A YEAR AGO (€)
TOP WINNERS: VALUE SALES CHANGE VERSUS A YEAR AGO (€)
-50 -40 -30 -20 -10 0 10
.
125.3
244.7
0 50 100 150 200 250 300
Beer
Cider
Euros, in millions Euros, in millions
CATEGORY INSIGHTS
• Late warm Easter - Total beer and cider benefitted from a late Easter versus 2013. Sales for
week ending 26th April are +13.5% in value, driven by lager (+14.1%), cider (+13.1%) and ale
(+12.2%).
• FIFA World Cup - The build-up to the FIFA World Cup saw beer and cider promotions play a key
role in the UK retail market. Seen as a driver to get shoppers in to their store, brewers fought
to win the promotional slots. Brands, such as Budweiser and Fosters, were the main winners
during this time, supporting significant lager gains (volume +15.7% for the month of June). As
volume growth was ahead of value growth (+9.6%), the challenge for the brewers is to drive
sales that are not deflationary to the market.
• Q2 highlights - Cider continues to be the key driver of annual sales (+11.4% in value and
+7.1% in volume), largely due to strong performance by the flavoured segment (particularly
Bulmers Dark Fruit and Stella Cidre Raspberry), with annual growth of 65.3% in value and
80.5% in volume. This segment now accounts for 21.9% of the cider category.

PULSE REPORT
Final Notes
19
Notes on category definitions for countries
Due to the diverse products found in individual countries across this market, it was necessary
to consolidate the available data into the categories in this report. In some cases it wasn’t
possible to align products across all 6 countries. Those exceptions are listed below:
Cider
• The Italy data in this report includes cider within the fortified wines category.
• The Netherlands data in this report does not include pear cider.
Wine
• The UK data in this report does not include this category.
Spirits
• The UK data in this report does not include this category.
• The Netherlands data in this report does not include this category.
• The France data in this report includes punch and cocktails, while the other countries do not.
Fortified wines
• The UK data in this report does not include this category.
Alcoholic soft drinks
• The UK data in this report does not include this category.
• The Spain data in this report does not include this category.

PULSE REPORT
Resources
20
About IRI. IRI is a leader in delivering powerful market and shopper information, predictive analysis and the foresight
that leads to action. We go beyond the data to ignite extraordinary growth for our clients in the CPG, retail and over-
the-counter healthcare industries by pinpointing what matters and illuminating how it can impact their businesses
across sales and marketing. Move your business forward at IRIworldwide.eu
Arlington Square, Downshire Way, Bracknell, Berkshire RG12 1WA, Tel +44 (0) 1344 746000
Copyright © 2014 Information Resources, Inc. (IRI). All rights reserved. IRI, the IRI logo and the names of IRI products and services
referenced herein are either trademarks or registered trademarks of IRI. All other trademarks are the property of their respective owners.
FOR MORE INFORMATION
Please contact Leandro Chiesa, Consultant,
IRI at [email protected] or
+33 1 30 06 23 62 with questions or comments about this report.
To gain insight into opportunities across specific categories, segments, channels or retailers,
contact your IRI client service representative regarding custom analyses leveraging the
following resources:
• InfoScan Census® is a syndicated retail tracking service that enables manufacturers and
retailers to acquire industry insights used to make better business decisions. InfoScan
Census utilises the data that IRI collects from grocery, drug, and mass merchandise retailers
to provide the most comprehensive and accurate syndicated data offering in the FMCG
sector. With access to accurate, granular detail by category, geography, measure, and time
period, clients have the tools needed to develop marketing and sales strategies based on
product performance, distribution, and promotion responsiveness. All data about alcohol
comes from InfoScan Census.
• IRI Consulting provides strategic insights and advice leveraging a variety of data sources,
predictive analytics, enabling technologies, and business analyses to help FMCG
manufacturers and retailers address significant sales and marketing issues effectively.