Iranian Journal of Medical Physicsijmp.mums.ac.ir/article_10172_ec70f71bbaaca5b401d... · VEP...
10
Iranian Journal of Medical Physics ijmp.mums.ac.ir Advanced Analysis of PRVEP in Anisometropic Amblyopia Homa Hassankarimi 1 , Ebrahim Jafarzadehpur 2* , Alireza Mohamadi 2 , Seyed Mohammad Reza Noori 3 1. Department of Medical Physics, School of Medicine, Iran University of Medical Sciences, Tehran, Iran 2. Department of Optometry, School of Rehabilitation Sciences, Iran University of Medical Sciences, Tehran, Iran 3. Departments of Medical Physics and Biomedical Engineering, School of Medicine, Tehran University of Medical Sciences, Tehran, Iran A R T I C L E I N F O A B S T R A C T Article type: Original Article Introduction: to identify the pattern-reversal visual evoked potential (PRVEP) waveform descriptor by evaluating discrete wavelet transform (DWT) in order to optimize stimulus in the diagnosis of anisometropia amblyopia. Materials and Methods: The PRVEP testing was performed for 31 normal individuals and 35 patients with amblyopia. The stimuli were consisted of spatial frequencies of 1, 2, and 4 cycles per degree (cpd) and contrast levels of 100%, 50%, 25%, and 5%. The results were analyzed in the dimensions of time and time-frequency. DWT descriptor were extracted at level 7 (7P descriptor) for Haar, Daubechies 2, Daubechies 4, Symlet 5, Biorthogonal 3.5, Biorthogonal 4.4, and Coiflet 5 wavelets for 12 stimuli and compared between the two groups. The correlation between different spatial frequencies at the same contrast level and the similarities between reconstructed signals and original waveforms were evaluated. Results: There were a significant reduction in P100 amplitude and a significant elevation in latency among the patient group. In the patients with amblyopia, 7P descriptor decreased in all analysis except for the frequency of 4 cpd and the contrast of 5% using bior4.4. No significant correlation was observed between different frequencies at a special contrast; however, there was a significant correlation between reconstructed signals and the original ones. Conclusion: The 7P descriptor could be used to distinguish between normal and abnormal signals in anisometropia amblyopia. Considering the results, DWT with coif5, db4, bior4.4, and bior3.5 wavelets can be utilized as a good indicator for selecting optimum stimulus. Article history: Received: Nov 21, 2017 Accepted: Jan 18, 2018 Keywords: Anisometropia Amblyopia Wavelet Analysis Dimension of Time ►Please cite this article as: Hassankarimi H, Jafarzadehpur E, Mohamadi A, Noori Bahreyni Toossi MR. Advanced Analysis of PRVEP in Anisometropic Amblyopia. Iran J Med Phys 2018; 15: 151-160. 10.22038/ijmp.2018.27796.1298. Introduction Uni- or bilateral developmental disorder of spatial vision due to binocular vision anomalies and reduced visual acuity is defined as amblyopia. It is caused by visual deprivation, strabismus, or anisometropia (difference in the refractive error of the two eyes) [1-5]. The prevalence of amblyopia is estimated to be between 1.6% and 3.5% of the population [5]. According to the literature, amblyopia is a complicated mechanism of brain information processing deficit [6, 7]. Several methods have been used for years to localize amblyopia deficits such as positron emission tomography, functional magnetic resonance imaging, and electrophysiology study [8-11]. Regarding the results of neurological studies, amblyopia might be initiated from the malfunctioning of the primary visual cortex (V1). Nevertheless, several studies indicated that extra striate cortex is responsible for spatial visual malfunction [8]. In addition, such impairments can be observed in higher visual areas [12]. Visual evoked potentials (VEP) record electrophysiological signals of the V1 activity in response to visual stimuli [13]. The VEP is an objective and efficient diagnostic method representing visual system activity in visual cortex level that evaluates the function of the entire visual pathway [1, 14, and 15]. The investigations carried out into the use of VEP in amblyopia aimed to determine the mechanism of visual acuity reduction and localize the site of the main defects [16]. The time domain analysis of pattern VEP (PVEP) of patients with amblyopia showed its efficacy for clinical diagnosis of amblyopia [16-18]. Additionally, the analysis of amplitude and latency of PVEP in time domain can be used to predict the effectiveness of therapy in amblyopia [19, 20]. Pattern reversal is the optimum stimulus because of its simplicity, little waveform variation, and stability [21]. The PRVEP consists of N75, P100, and N135, which are designating peaks as negative, positive, and occurrence time. The P100 is the most prominent and strongest peak in VEP. It has minimal variation and high repeatability. The P100 is affected by stimulus *Corresponding Author: Department of Optometry, School of Rehabilitation Sciences, Iran University of Medical Sciences, Tehran, Iran. Tel: +982122228051; Fax: +982122220946; Email: [email protected]
Transcript of Iranian Journal of Medical Physicsijmp.mums.ac.ir/article_10172_ec70f71bbaaca5b401d... · VEP...
Iranian Journal of Medical Physics
ijmp.mums.ac.ir
Advanced Analysis of PRVEP in Anisometropic Amblyopia Homa Hassankarimi1, Ebrahim Jafarzadehpur2*, Alireza Mohamadi2, Seyed Mohammad Reza Noori3
1. Department of Medical Physics, School of Medicine, Iran University of Medical Sciences, Tehran, Iran 2. Department of Optometry, School of Rehabilitation Sciences, Iran University of Medical Sciences, Tehran, Iran 3. Departments of Medical Physics and Biomedical Engineering, School of Medicine, Tehran University of Medical Sciences, Tehran, Iran A R T I C L E I N F O A B S T R A C T
Article type: Original Article
Introduction: to identify the pattern-reversal visual evoked potential (PRVEP) waveform descriptor by evaluating discrete wavelet transform (DWT) in order to optimize stimulus in the diagnosis of anisometropia amblyopia. Materials and Methods: The PRVEP testing was performed for 31 normal individuals and 35 patients with amblyopia. The stimuli were consisted of spatial frequencies of 1, 2, and 4 cycles per degree (cpd) and contrast levels of 100%, 50%, 25%, and 5%. The results were analyzed in the dimensions of time and time-frequency. DWT descriptor were extracted at level 7 (7P descriptor) for Haar, Daubechies 2, Daubechies 4, Symlet 5, Biorthogonal 3.5, Biorthogonal 4.4, and Coiflet 5 wavelets for 12 stimuli and compared between the two groups. The correlation between different spatial frequencies at the same contrast level and the similarities between reconstructed signals and original waveforms were evaluated. Results: There were a significant reduction in P100 amplitude and a significant elevation in latency among the patient group. In the patients with amblyopia, 7P descriptor decreased in all analysis except for the frequency of 4 cpd and the contrast of 5% using bior4.4. No significant correlation was observed between different frequencies at a special contrast; however, there was a significant correlation between reconstructed signals and the original ones. Conclusion: The 7P descriptor could be used to distinguish between normal and abnormal signals in anisometropia amblyopia. Considering the results, DWT with coif5, db4, bior4.4, and bior3.5 wavelets can be utilized as a good indicator for selecting optimum stimulus.
Article history: Received: Nov 21, 2017 Accepted: Jan 18, 2018
Keywords: Anisometropia Amblyopia Wavelet Analysis Dimension of Time
►Please cite this article as: Hassankarimi H, Jafarzadehpur E, Mohamadi A, Noori Bahreyni Toossi MR. Advanced Analysis of PRVEP in Anisometropic Amblyopia. Iran J Med Phys 2018; 15: 151-160. 10.22038/ijmp.2018.27796.1298.
Introduction
Uni- or bilateral developmental disorder of spatial vision due to binocular vision anomalies and reduced visual acuity is defined as amblyopia. It is caused by visual deprivation, strabismus, or anisometropia (difference in the refractive error of the two eyes) [1-5]. The prevalence of amblyopia is estimated to be between 1.6% and 3.5% of the population [5]. According to the literature, amblyopia is a complicated mechanism of brain information processing deficit [6, 7]. Several methods have been used for years to localize amblyopia deficits such as positron emission tomography, functional magnetic resonance imaging, and electrophysiology study [8-11].
Regarding the results of neurological studies, amblyopia might be initiated from the malfunctioning of the primary visual cortex (V1). Nevertheless, several studies indicated that extra striate cortex is responsible for spatial visual malfunction [8]. In addition, such impairments can be observed in higher visual areas [12].
Visual evoked potentials (VEP) record electrophysiological signals of the V1 activity in response to visual stimuli [13]. The VEP is an objective and efficient diagnostic method representing visual system activity in visual cortex level that evaluates the function of the entire visual pathway [1, 14, and 15]. The investigations carried out into the use of VEP in amblyopia aimed to determine the mechanism of visual acuity reduction and localize the site of the main defects [16]. The time domain analysis of pattern VEP (PVEP) of patients with amblyopia showed its efficacy for clinical diagnosis of amblyopia [16-18]. Additionally, the analysis of amplitude and latency of PVEP in time domain can be used to predict the effectiveness of therapy in amblyopia [19, 20]. Pattern reversal is the optimum stimulus because of its simplicity, little waveform variation, and stability [21]. The PRVEP consists of N75, P100, and N135, which are designating peaks as negative, positive, and occurrence time. The P100 is the most prominent and strongest peak in VEP. It has minimal variation and high repeatability. The P100 is affected by stimulus
*Corresponding Author: Department of Optometry, School of Rehabilitation Sciences, Iran University of Medical Sciences, Tehran, Iran. Tel: +982122228051; Fax: +982122220946; Email: [email protected]
Homa Hassankarimi et al. New Approach in the Analysis of PR VEP in Amblyopia
152 Iran J Med Phys, Vol. 15, No. 3, July 2018
parameters such as pattern, pattern contrast, and mean luminance, etc. [4, 13, 22].
The activity of two or more parallel pathways from retina to the V1 causes VEP. The V1 receives parallel inputs from magnocellular (M) and parvocellular (P) pathways [23]. The neurons of the M pathway are sensitive to low spatial and high temporal frequencies and saturated in low contrast, whereas P pathway neurons are affected by high spatial and low temporal frequencies and saturated in high contrasts [24, 25].
Both M and P pathways are the sources of the VEP amplitude at high-luminance contrasts [26]. Anisometropia amblyopia affects both pathways; therefore, the patients suffering from this disorder have abnormal response to high and low spatial frequencies [4, 8]. The wavelet transform (WT) is a powerful time-frequency approach in biosignals processing, denoising, and compressing. It has two forms of continuous wavelet transform (CWT) and discrete wavelet transform (DWT) [27, 28]. The main advantage of wavelet is its variable window size that leads to an optimum time-frequency resolution adopted to all frequencies [29]. This modern approach was typically applied for multidimensional biosignals analysis by electromyography, electroencephalography (EEG), and electrocardiography; however, it is rarely used in visual signals analysis [27, 28]. Up until now, steady-state VEP, multifocal VEP, transient VEP (TVEP), and VEP have been denoised and analyzed using the WT [30-38]. In addition, the WT is used to denoise EEG and extract evoked potentials [38, 39].
Clinical tests demonstrated that multiresolution analysis can indicate the peak latency of VEP [33]. Sivakumar et al. in 2006 denoised TVEP and analyzed its negative and positive peaks with different wavelets. They showed that P100 (positive peak) was more apparent in denoised version of signal using Biorthogonal 3.5 (bior3.5) and Symlet 5 (sym5) wavelets [34].
Akbari and Azmi in 2011 utilized Haar, Daubechies 2 (db2), and Daubechies 4 (db4) wavelets to extract the features of VEP for classifying by k-nearest neighbor and support network machine algorithms. Their findings indicated that proper features obtained from WT of VEP can separate normal and abnormal subjects; moreover, db4 had the best accuracy in this method [35]. The CWT of VEP with Mexican hat wavelet was performed to obtain automatic processing and classification of VEP. The results showed more reliable separating normal and pathologic cases [36].
In a study conducted by Almurshedi et al.in 2015, Coiflet 5 (coif5) wavelet was utilized to denoise the VEP signals and increase signal to noise ratio (SNR). According to the results of the comparison between WT findings and principal component analysis, higher SNR in WT, as well as flexibility and capability of WT
for VEP analyzing and its sub-band decomposition were observed [37].
To the best of our knowledge, the studies carried out into VEP assessed only the time and the frequency domains for different diseases [2, 17, 18, 23, 40-44]. The WT of VEP is used for classification and /or denoising; nevertheless, there was no attempt to find descriptor by the DWT of VEP in amblyopia. This study sought to extract a descriptor from DWT of PRVEP by functional specialization of visual stimuli and scanning scalograms for various wavelets. This descriptor may detect possible deficits in visual processing pathways and find out optimum contrast and spatial frequency that lead to the diagnosis of anisometropia amblyopia.
Materials and Methods This study was conducted on 31 normal individuals
and 35 patients with amblyopia including 31 subjects with unilateral and 2 subjects with bilateral amblyopia. A total of 14 women and 21 men aged between 16 and 35 years old participated in this study. An informed consent was obtained from all the participants, and they were referred after performing eye examination by an ophthalmologist and an optometrist. Acceptable visual acuity (Log Mar) was considered to be between 0.3 and 0.1. The PRVEP signals were recorded by Metrovision Monpack one (Metrovision Company, Pérenchies, France) with gold plated cupula electrodes, which were placed according to the international 10-20 system.
All the PRVEPs were done considering the International Society for Clinical Electrophysiology of Vision protocols. Checkerboard stimulus was displayed with a contrast reversal rate of 2.5 times per second, amplification of 2000 times, and band pass filter of 1-100 Hz. In this study, the stimuli were consisted of element sizes of 30º, 15º, and 7º arc (equal to spatial frequencies of 1, 2 and 4 cycles per degree (cpd), respectively) and four contrast levels of 100%, 50%, 25%, and 5% on each spatial frequency. The VEPs were stored at a 1024 sampling frequency using 240 samples. The number of sweeps per average was 60.
Data were transported to the MATLAB software (MATLAB R2015b) to perform time and time-frequency domains analysis. After evaluating the P100 amplitudes and latencies in the time domain of all VEPs, normalization and discrete WT of VEPs were carried out using the Wavelet Toolbox software. Data Analysis
DWT is an efficient method introduced by Mallat that employs a dyadic grid (integer powers of two scaling in a and b).
(1)
New Approach in the Analysis of PR VEP in Amblyopia Homa Hassankarimi et al.
Iran J Med Phys, Vol. 15, No. 3, July 2018 153
Where Tm,n denotes localized wavelet coefficients in discrete scales m (frequency) and discrete moments n (time), x (t) represents the original signal in the time domain, and Ψ designates the wavelet function [45, 46].
After a full decomposition, the energy content of the coefficients at each scale was computed by equation.
(2)
Where Tm,n was considered as DWT, m was the scale integer, and n controlled wavelet translation. The summation of squared detail coefficients and the square of the remaining approximation coefficients (SM,0) was equal to the total energy of the input signal [46].
(3)
The wavelets used to analyze the PRVEP waveforms were Haar, db2, db4, sym5, bior3.5, bior4.4, and coif5. The frequencies covered by levels less than 7 were higher than the PRVEP frequencies; therefore, the coefficients of these bands were discarded in all cases.
The DWT scalogram was represented by three axes including x-axis (time), y-axis (frequency or scale), and z-axis (wavelet coefficient value or energy) that were demonstrated by different colors. Time intervals, frequency of signal components, and energy distribution of wavelet coefficients can be identified by scalogram analysis [47, 48]. Scalogram analysis allows selecting single coefficient related to P100 peak.
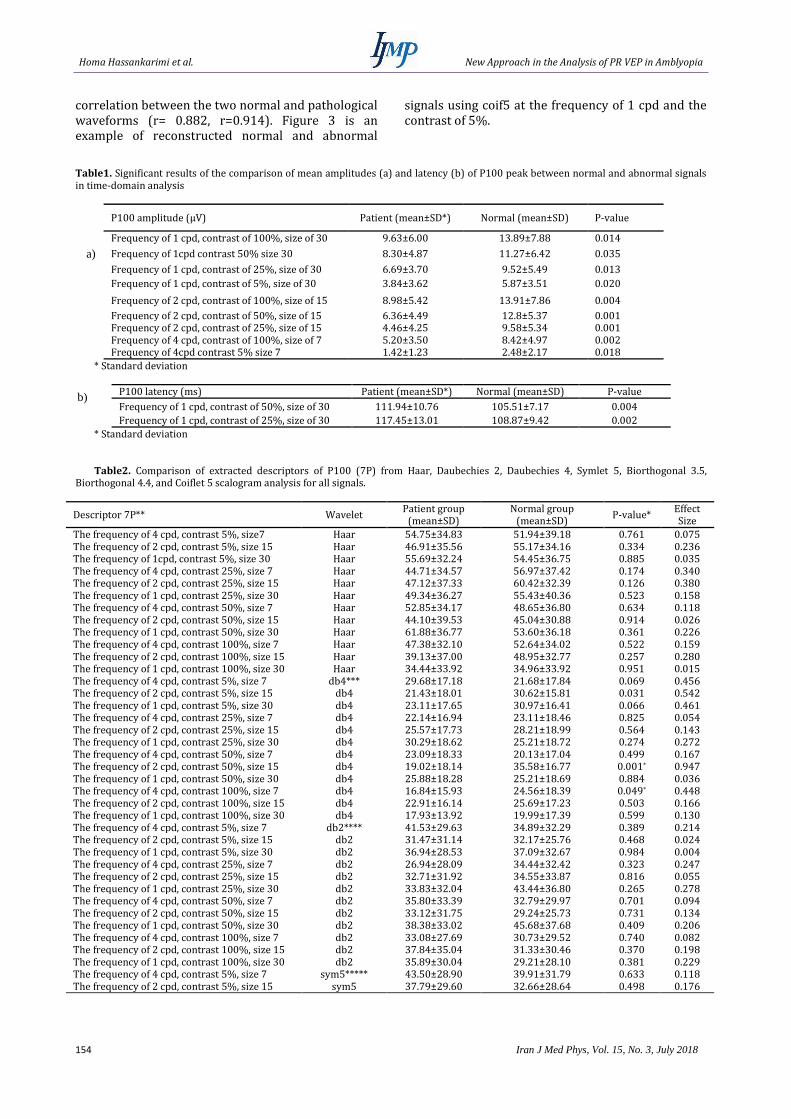
We computed the energy percentage of a single wavelet coefficient to the total energy of level 7 in predetermined time intervals in this level (low frequency level) for all above mentioned wavelets by 12 stimuli. Figures 1a and 1b show normal signals in time domain and their descriptor extraction from DWT scalogram using coif5 wavelet. Rectangle with white border shows 7P descriptor in level 7.
Regarding the results of component extracted from the DWT scalograms of normal waveforms, normal and abnormal groups were compared. Finally, signal reconstruction was done with level 7 coefficients using wavelets with significantly different descriptors.
Data analysis was performed using Kolmogorov-Smirnov and independent samples t-test with the help of SPSS software, version 22, and effect size was measured using Cohen’s d. Finally, Pearson’s correlation coefficient was applied to compare the similarities between reconstructed signals and original VEP waveforms and to evaluate the correlation between different spatial frequencies at the same contrast level. In all the measurements, P-value less than 0.05 were considered statistically significant.
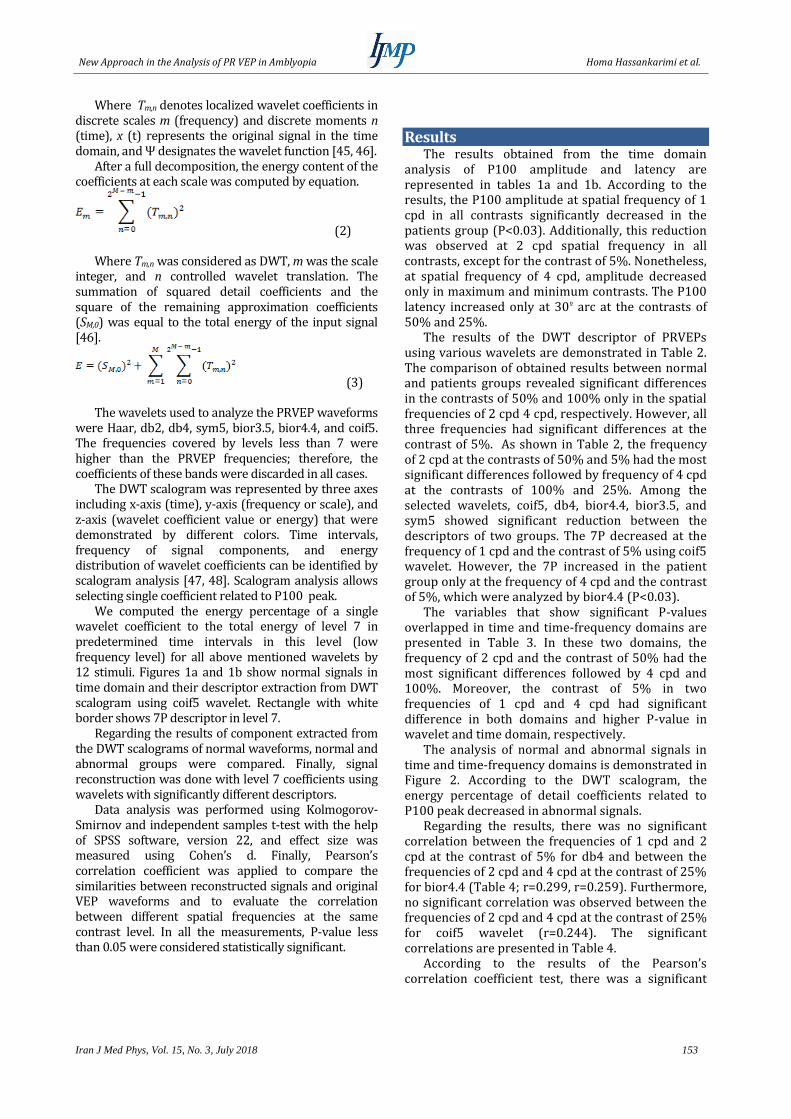
Results The results obtained from the time domain
analysis of P100 amplitude and latency are represented in tables 1a and 1b. According to the results, the P100 amplitude at spatial frequency of 1 cpd in all contrasts significantly decreased in the patients group (P<0.03). Additionally, this reduction was observed at 2 cpd spatial frequency in all contrasts, except for the contrast of 5%. Nonetheless, at spatial frequency of 4 cpd, amplitude decreased only in maximum and minimum contrasts. The P100 latency increased only at 30º arc at the contrasts of 50% and 25%.
The results of the DWT descriptor of PRVEPs using various wavelets are demonstrated in Table 2. The comparison of obtained results between normal and patients groups revealed significant differences in the contrasts of 50% and 100% only in the spatial frequencies of 2 cpd 4 cpd, respectively. However, all three frequencies had significant differences at the contrast of 5%. As shown in Table 2, the frequency of 2 cpd at the contrasts of 50% and 5% had the most significant differences followed by frequency of 4 cpd at the contrasts of 100% and 25%. Among the selected wavelets, coif5, db4, bior4.4, bior3.5, and sym5 showed significant reduction between the descriptors of two groups. The 7P decreased at the frequency of 1 cpd and the contrast of 5% using coif5 wavelet. However, the 7P increased in the patient group only at the frequency of 4 cpd and the contrast of 5%, which were analyzed by bior4.4 (P<0.03).
The variables that show significant P-values overlapped in time and time-frequency domains are presented in Table 3. In these two domains, the frequency of 2 cpd and the contrast of 50% had the most significant differences followed by 4 cpd and 100%. Moreover, the contrast of 5% in two frequencies of 1 cpd and 4 cpd had significant difference in both domains and higher P-value in wavelet and time domain, respectively.
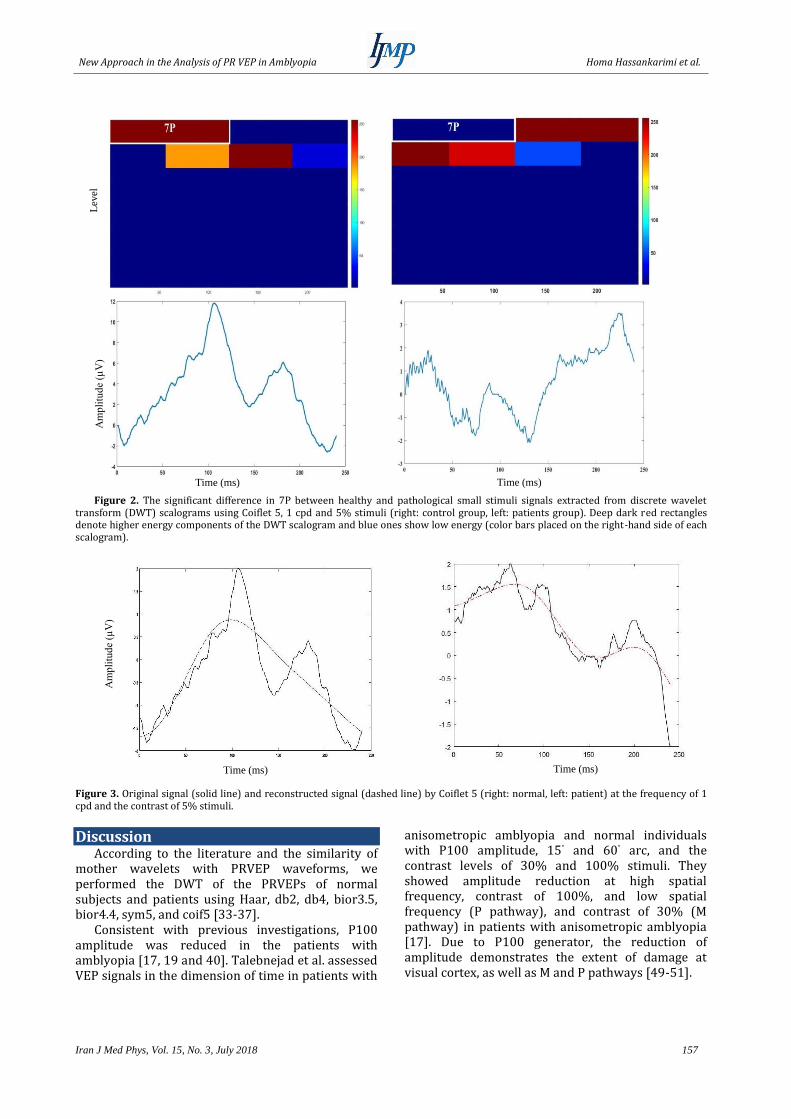
The analysis of normal and abnormal signals in time and time-frequency domains is demonstrated in Figure 2. According to the DWT scalogram, the energy percentage of detail coefficients related to P100 peak decreased in abnormal signals.
Regarding the results, there was no significant correlation between the frequencies of 1 cpd and 2 cpd at the contrast of 5% for db4 and between the frequencies of 2 cpd and 4 cpd at the contrast of 25% for bior4.4 (Table 4; r=0.299, r=0.259). Furthermore, no significant correlation was observed between the frequencies of 2 cpd and 4 cpd at the contrast of 25% for coif5 wavelet (r=0.244). The significant correlations are presented in Table 4.
According to the results of the Pearson’s correlation coefficient test, there was a significant
Homa Hassankarimi et al. New Approach in the Analysis of PR VEP in Amblyopia
154 Iran J Med Phys, Vol. 15, No. 3, July 2018
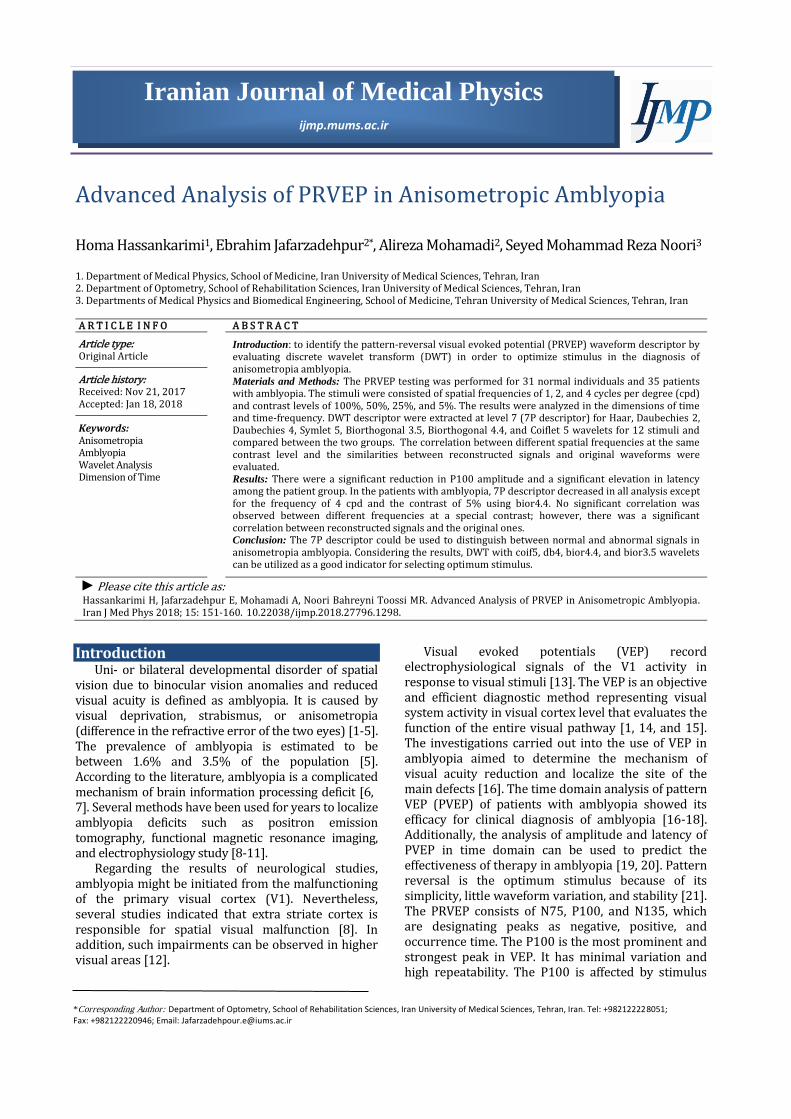
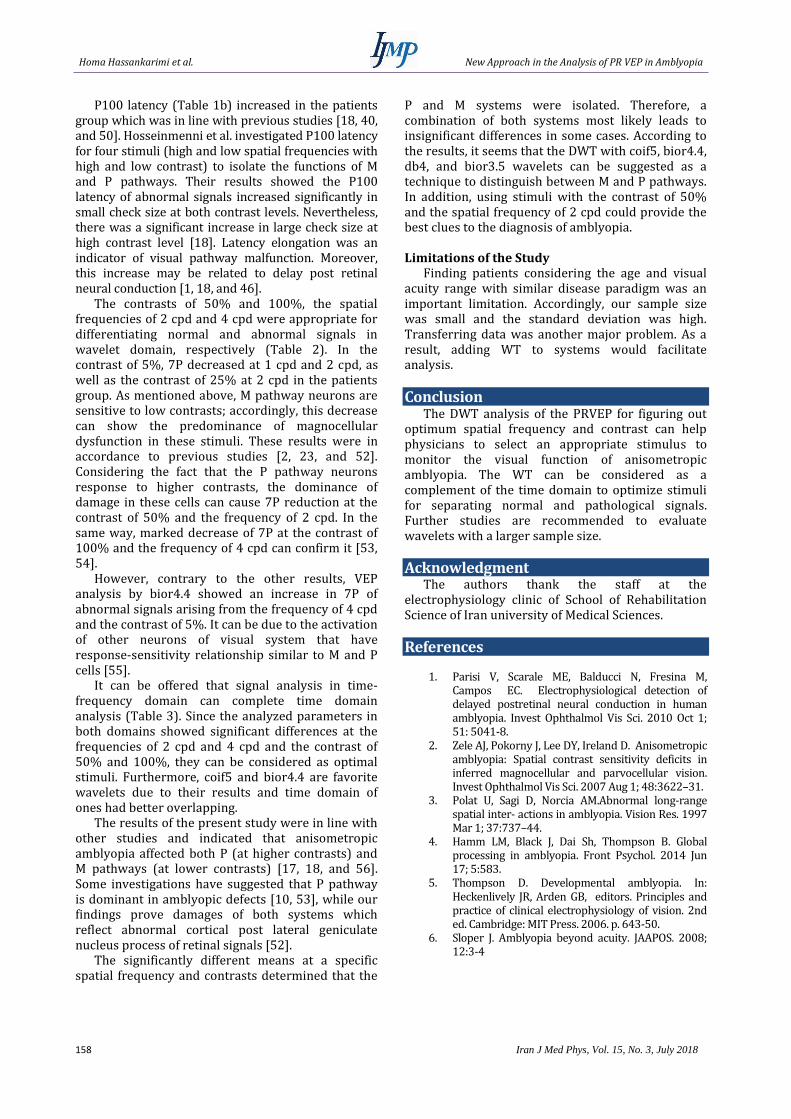
correlation between the two normal and pathological waveforms (r= 0.882, r=0.914). Figure 3 is an example of reconstructed normal and abnormal
signals using coif5 at the frequency of 1 cpd and the contrast of 5%.
Table1. Significant results of the comparison of mean amplitudes (a) and latency (b) of P100 peak between normal and abnormal signals in time-domain analysis
P-value Normal (mean±SD) Patient (mean±SD*) P100 amplitude (µV)
0.014 13.89±7.88 9.63±6.00 Frequency of 1 cpd, contrast of 100%, size of 30
0.035 11.27±6.42 8.30±4.87 Frequency of 1cpd contrast 50% size 30
0.013 9.52±5.49 6.69±3.70 Frequency of 1 cpd, contrast of 25%, size of 30
0.020 5.87±3.51 3.84±3.62 Frequency of 1 cpd, contrast of 5%, size of 30
0.004 13.91±7.86 8.98±5.42 Frequency of 2 cpd, contrast of 100%, size of 15
0.001 12.8±5.37 6.36±4.49 Frequency of 2 cpd, contrast of 50%, size of 15 0.001 9.58±5.34 4.46±4.25 Frequency of 2 cpd, contrast of 25%, size of 15 0.002 8.42±4.97 5.20±3.50 Frequency of 4 cpd, contrast of 100%, size of 7 0.018 2.48±2.17 1.42±1.23 Frequency of 4cpd contrast 5% size 7
* Standard deviation
P-value Normal (mean±SD) Patient (mean±SD*) P100 latency (ms)
0.004 105.51±7.17 111.94±10.76 Frequency of 1 cpd, contrast of 50%, size of 30
0.002 108.87±9.42 117.45±13.01 Frequency of 1 cpd, contrast of 25%, size of 30
* Standard deviation Table2. Comparison of extracted descriptors of P100 (7P) from Haar, Daubechies 2, Daubechies 4, Symlet 5, Biorthogonal 3.5,
Biorthogonal 4.4, and Coiflet 5 scalogram analysis for all signals.
Effect Size
P-value* Normal group
(mean±SD) Patient group
(mean±SD) Wavelet Descriptor 7P**
0.075 0.761 51.94±39.18 54.75±34.83 Haar The frequency of 4 cpd, contrast 5%, size7 0.236 0.334 55.17±34.16 46.91±35.56 Haar The frequency of 2 cpd, contrast 5%, size 15 0.035 0.885 54.45±36.75 55.69±32.24 Haar The frequency of 1cpd, contrast 5%, size 30 0.340 0.174 56.97±37.42 44.71±34.57 Haar The frequency of 4 cpd, contrast 25%, size 7 0.380 0.126 60.42±32.39 47.12±37.33 Haar The frequency of 2 cpd, contrast 25%, size 15 0.158 0.523 55.43±40.36 49.34±36.27 Haar The frequency of 1 cpd, contrast 25%, size 30 0.118 0.634 48.65±36.80 52.85±34.17 Haar The frequency of 4 cpd, contrast 50%, size 7 0.026 0.914 45.04±30.88 44.10±39.53 Haar The frequency of 2 cpd, contrast 50%, size 15 0.226 0.361 53.60±36.18 61.88±36.77 Haar The frequency of 1 cpd, contrast 50%, size 30 0.159 0.522 52.64±34.02 47.38±32.10 Haar The frequency of 4 cpd, contrast 100%, size 7 0.280 0.257 48.95±32.77 39.13±37.00 Haar The frequency of 2 cpd, contrast 100%, size 15 0.015 0.951 34.96±33.92 34.44±33.92 Haar The frequency of 1 cpd, contrast 100%, size 30 0.456 0.069 21.68±17.84 29.68±17.18 db4*** The frequency of 4 cpd, contrast 5%, size 7 0.542 0.031 30.62±15.81 21.43±18.01 db4 The frequency of 2 cpd, contrast 5%, size 15 0.461 0.066 30.97±16.41 23.11±17.65 db4 The frequency of 1 cpd, contrast 5%, size 30 0.054 0.825 23.11±18.46 22.14±16.94 db4 The frequency of 4 cpd, contrast 25%, size 7 0.143 0.564 28.21±18.99 25.57±17.73 db4 The frequency of 2 cpd, contrast 25%, size 15 0.272 0.274 25.21±18.72 30.29±18.62 db4 The frequency of 1 cpd, contrast 25%, size 30 0.167 0.499 20.13±17.04 23.09±18.33 db4 The frequency of 4 cpd, contrast 50%, size 7 0.947 0.001* 35.58±16.77 19.02±18.14 db4 The frequency of 2 cpd, contrast 50%, size 15 0.036 0.884 25.21±18.69 25.88±18.28 db4 The frequency of 1 cpd, contrast 50%, size 30 0.448 0.049* 24.56±18.39 16.84±15.93 db4 The frequency of 4 cpd, contrast 100%, size 7 0.166 0.503 25.69±17.23 22.91±16.14 db4 The frequency of 2 cpd, contrast 100%, size 15 0.130 0.599 19.99±17.39 17.93±13.92 db4 The frequency of 1 cpd, contrast 100%, size 30 0.214 0.389 34.89±32.29 41.53±29.63 db2**** The frequency of 4 cpd, contrast 5%, size 7 0.024 0.468 32.17±25.76 31.47±31.14 db2 The frequency of 2 cpd, contrast 5%, size 15 0.004 0.984 37.09±32.67 36.94±28.53 db2 The frequency of 1 cpd, contrast 5%, size 30 0.247 0.323 34.44±32.42 26.94±28.09 db2 The frequency of 4 cpd, contrast 25%, size 7 0.055 0.816 34.55±33.87 32.71±31.92 db2 The frequency of 2 cpd, contrast 25%, size 15 0.278 0.265 43.44±36.80 33.83±32.04 db2 The frequency of 1 cpd, contrast 25%, size 30 0.094 0.701 32.79±29.97 35.80±33.39 db2 The frequency of 4 cpd, contrast 50%, size 7 0.134 0.731 29.24±25.73 33.12±31.75 db2 The frequency of 2 cpd, contrast 50%, size 15 0.206 0.409 45.68±37.68 38.38±33.02 db2 The frequency of 1 cpd, contrast 50%, size 30 0.082 0.740 30.73±29.52 33.08±27.69 db2 The frequency of 4 cpd, contrast 100%, size 7 0.198 0.370 31.33±30.46 37.84±35.04 db2 The frequency of 2 cpd, contrast 100%, size 15 0.229 0.381 29.21±28.10 35.89±30.04 db2 The frequency of 1 cpd, contrast 100%, size 30 0.118 0.633 39.91±31.79 43.50±28.90 sym5***** The frequency of 4 cpd, contrast 5%, size 7 0.176 0.498 32.66±28.64 37.79±29.60 sym5 The frequency of 2 cpd, contrast 5%, size 15
a)
b)

New Approach in the Analysis of PR VEP in Amblyopia Homa Hassankarimi et al.
Iran J Med Phys, Vol. 15, No. 3, July 2018 155
Effect Size
P-value* Normal group
(mean±SD) Patient group
(mean±SD) Wavelet Descriptor 7P**
0.075 0.761 51.94±39.18 54.75±34.83 Haar The frequency of 4 cpd, contrast 5%, size7 0.236 0.334 55.17±34.16 46.91±35.56 Haar The frequency of 2 cpd, contrast 5%, size 15 0.035 0.885 54.45±36.75 55.69±32.24 Haar The frequency of 1cpd, contrast 5%, size 30 0.340 0.174 56.97±37.42 44.71±34.57 Haar The frequency of 4 cpd, contrast 25%, size 7 0.380 0.126 60.42±32.39 47.12±37.33 Haar The frequency of 2 cpd, contrast 25%, size 15 0.158 0.523 55.43±40.36 49.34±36.27 Haar The frequency of 1 cpd, contrast 25%, size 30 0.118 0.634 48.65±36.80 52.85±34.17 Haar The frequency of 4 cpd, contrast 50%, size 7 0.026 0.914 45.04±30.88 44.10±39.53 Haar The frequency of 2 cpd, contrast 50%, size 15 0.226 0.361 53.60±36.18 61.88±36.77 Haar The frequency of 1 cpd, contrast 50%, size 30 0.159 0.522 52.64±34.02 47.38±32.10 Haar The frequency of 4 cpd, contrast 100%, size 7 0.280 0.257 48.95±32.77 39.13±37.00 Haar The frequency of 2 cpd, contrast 100%, size 15 0.015 0.951 34.96±33.92 34.44±33.92 Haar The frequency of 1 cpd, contrast 100%, size 30 0.456 0.069 21.68±17.84 29.68±17.18 db4*** The frequency of 4 cpd, contrast 5%, size 7 0.542 0.031 30.62±15.81 21.43±18.01 db4 The frequency of 2 cpd, contrast 5%, size 15 0.461 0.066 30.97±16.41 23.11±17.65 db4 The frequency of 1 cpd, contrast 5%, size 30 0.054 0.825 23.11±18.46 22.14±16.94 db4 The frequency of 4 cpd, contrast 25%, size 7 0.143 0.564 28.21±18.99 25.57±17.73 db4 The frequency of 2 cpd, contrast 25%, size 15 0.272 0.274 25.21±18.72 30.29±18.62 db4 The frequency of 1 cpd, contrast 25%, size 30 0.167 0.499 20.13±17.04 23.09±18.33 db4 The frequency of 4 cpd, contrast 50%, size 7 0.947 0.001* 35.58±16.77 19.02±18.14 db4 The frequency of 2 cpd, contrast 50%, size 15 0.036 0.884 25.21±18.69 25.88±18.28 db4 The frequency of 1 cpd, contrast 50%, size 30 0.198 0.424 38.66±27.89 44.22±28.02 sym5 The frequency of 1 cpd, contrast 5%, size 30 0.576 0.039* 47.48±26.27 32.76±25.60 sym5 The frequency of 4 cpd, contrast 25%, size 7 0.114 0.644 36.19±29.53 39.68±31.21 sym5 The frequency of 2 cpd, contrast 25%, size 15 0.097 0.696 42.17±34.90 38.99±30.17 sym5 The frequency of 1 cpd, contrast 25%, size 30 0.002 0.991 41.11±32.26 41.02±33.35 sym5 The frequency of 4 cpd, contrast 50%, size 7 0.250 0.314 34.51±28.04 41.61±28.73 sym5 The frequency of 2 cpd, contrast 50%, size 15 0.242 0.333 46.38±35.97 38.43±29.30 sym5 The frequency of 1 cpd, contrast 50%, size 30 0.040 0.872 38.26±30.56 37.11±26.35 sym5 The frequency of 4 cpd, contrast 100%, size 7 0.340 0.172 32.23±31.07 42.81±31.01 sym5 The frequency of 2 cpd, contrast 100%, size 15 0.096 0.698 36.08±33.76 33.00±30.07 sym5 The frequency of 1 cpd, contrast 100%, size 30
0.0003 0.998 28.69±26.91 28.68±27.85 bior3.5****** The frequency of 4 cpd, contrast 5%, size 7 0.574 0.024* 37.00±24.79 23.82±20.95 bior3.5 The frequency of 2 cpd, contrast 5%, size 15 0.251 0.312 45.76±24.47 39.64±24.16 bior3.5 The frequency of 1 cpd, contrast 5%, size 30 0.106 0.434 30.49±27.75 33.44±27.90 bior3.5 The frequency of 4 cpd, contrast 25%, size 7 0.091 0.709 33.04±25.40 30.63±27.05 bior3.5 The frequency of 2 cpd, contrast 25%, size 15 0.095 0.699 41.13±26.82 38.62±25.60 bior3.5 The frequency of 1 cpd, contrast 25%, size 30 0.157 0.523 39.23±26.19 34.86±29.13 bior3.5 The frequency of 4 cpd, contrast 50%, size 7 0.448 0.042* 37.91±24.14 26.87±25.09 bior3.5 The frequency of 2 cpd, contrast 50%, size 15 0.068 0.783 40.02±30.97 37.97±28.89 bior3.5 The frequency of 1 cpd, contrast 50%, size 30 0.070 0.775 35.66±28.64 37.69±28.96 bior3.5 The frequency of 4 cpd, contrast 100%, size 7 0.110 0.656 34.83±28.64 38.09±30.43 bior3.5 The frequency of 2 cpd, contrast 100%, size 15 0.041 0.871 29.22±25.70 30.32±27.91 bior3.5 The frequency of 1 cpd, contrast 100%, size 30 0.614 0.024* 36.34±24.44 51.58±25.15 bior4.4******* The frequency of 4 cpd, contrast 5%, size 7 0.129 0.601 44.24±31.73 40.17±30.88 bior4.4 The frequency of 2 cpd, contrast 5%, size 15 0.329 0.187 49.42±33.92 38.38±33.10 bior4.4 The frequency of 1 cpd, contrast 5%, size 30 0.436 0.083 43.79±31.58 30.63±28.68 bior4.4 The frequency of 4 cpd, contrast 25%, size 7 0.203 0.410 44.32±31.96 37.41±35.79 bior4.4 The frequency of 2 cpd, contrast 25%, size 15 0.166 0.503 52.55±34.77 46.87±33.53 bior4.4 The frequency of 1 cpd, contrast 25%, size 30 0.041 0.868 41.84±33.83 40.43±34.93 bior4.4 The frequency of 4 cpd, contrast 50%, size 7 0.554 0.024* 53.73±29.53 36.67±31.96 bior4.4 The frequency of 2cpd contrast 50%, size 15 0.093 0.705 45.22±32.13 42.12±34.11 bior4.4 The frequency of 1 cpd, contrast 50%, size 30 0.863 0.005* 48.14±27.37 26.84±21.67 bior4.4 The frequency of 4 cpd, contrast 100%, size 7 0.019 0.935 33.35±30.28 33.97±31.76 bior4.4 The frequency of 2 cpd, contrast 100% size 15 0.301 0.236 38.20±34.09 28.84±27.78 bior4.4 The frequency of 1 cpd, contrast 100%, size 30 0.385 0.120 19.88±14.58 26.28±18.37 coif5******** The frequency of 4 cpd, contrast 5%, size 7 0.690 0.015* 36.76±15.20 25.64±16.94 coif5 The frequency of 2 cpd, contrast 5%, size 15 0.548 0.031* 31.70±20.60 21.27±17.27 coif5 The frequency of 1 cpd, contrast 5% size 30, 0.172 0.478 24.41±18.72 21.27±17.61 coif5 The frequency of 4 cpd, contrast 25%, size 7 0.012 0.961 25.13±18.17 24.89±21.02 coif5 The frequency of 2 cpd, contrast 25%, size 15 0.122 0.622 24.29±19.97 26.78±20.79 coif5 The frequency of 1 cpd, contrast 25%, size 30 0.186 0.449 19.40±16.25 22.80±19.97 coif5 The frequency of 4 cpd, contrast 50%, size 7 0.728 0.007* 35.20±18.37 21.97±17.94 coif5 The frequency of 2 cpd, contrast 50%, size 15 0.122 0.620 23.73±17.92 26.02±19.54 coif5 The frequency of 1 cpd, contrast 50%, size 30 0.679 0.015* 28.82±16.17 17.65±16.68 coif5 The frequency of 4 cpd, contrast 100%, size 7 0.153 0.535 24.31±16.67 21.62±18.27 coif5 The frequency of 2 cpd, contrast 100%, size 15 0.133 0.592 17.95±16.17 20.01±14.70 coif5 The frequency of 1 cpd, contrast 100%, size 30
* Significant difference (P<0.05), ** Descriptor of P100 amplitude, *** Daubechies 4, **** Daubechies 2, ***** Symlet 5, ******
Biorthogonal 3.5, ******* Biorthogonal 4.4, ******** Coiflet 5
Homa Hassankarimi et al. New Approach in the Analysis of PR VEP in Amblyopia
156 Iran J Med Phys, Vol. 15, No. 3, July 2018
Table3. Comparison of normal individuals and patients with amblyopia
Stimuli condition Amplitude coif5* db4** bior4.4*** bior3.5****
1 cpd, contrast 5% 0.02 0.015 - - - 2 cpd, contrast 50% 0.001 0.007 0.001 0.024 0.042 4 cpd, contrast 100% 0.002 0.017 0.049 0.005 - 4 cpd, contrast 5% 0.018 - - 0.024 -
* Coiflet 5, ** Daubechies 4, *** Biorthogonal 4.4, **** Biorthogonal 3.5 Table4. Significant correlations between different spatial frequencies at the same contrast
Significance Pearson Correlation Spatial frequency (cpd) Contrast Wavelet
0.036 0.259 (1,2) 5% db4* 0.015 0.299 (2,4) 25% bior4.4** 0.049 0.244 (2,4) 25% coif5***
* Daubechies 4, ** Biorthogonal 4.4, *** Coiflet 5
Discrete Wavelet Transform
Figure 1. Descriptors extracted from the discrete wavelet transform scalograms. Right: 15˚ arc, 2 cpd, 50% stimuli, Coiflet 5 (coif5) scalogram. Left: 7˚ arc, 4 cpd, 100% stimuli, coif5 scalogram. 7P in level 7 (regions with white borders) include a single wavelet coefficient and is equal to the energy percentage of single wavelet coefficient to the total energy of level 7. A jet color map is used in which the darkest red color corresponds to high wavelet coefficients and the darkest blue color denotes low wavelet coefficients (color bars are placed on the right side of each scalogram).
Lev
el
Am
pli
tud
e (µ
V)
Time (ms) Time (ms)
New Approach in the Analysis of PR VEP in Amblyopia Homa Hassankarimi et al.
Iran J Med Phys, Vol. 15, No. 3, July 2018 157
Figure 2. The significant difference in 7P between healthy and pathological small stimuli signals extracted from discrete wavelet
transform (DWT) scalograms using Coiflet 5, 1 cpd and 5% stimuli (right: control group, left: patients group). Deep dark red rectangles denote higher energy components of the DWT scalogram and blue ones show low energy (color bars placed on the right-hand side of each scalogram).
Figure 3. Original signal (solid line) and reconstructed signal (dashed line) by Coiflet 5 (right: normal, left: patient) at the frequency of 1 cpd and the contrast of 5% stimuli.
Discussion According to the literature and the similarity of
mother wavelets with PRVEP waveforms, we performed the DWT of the PRVEPs of normal subjects and patients using Haar, db2, db4, bior3.5, bior4.4, sym5, and coif5 [33-37].
Consistent with previous investigations, P100 amplitude was reduced in the patients with amblyopia [17, 19 and 40]. Talebnejad et al. assessed VEP signals in the dimension of time in patients with
anisometropic amblyopia and normal individuals with P100 amplitude, 15˚ and 60˚ arc, and the contrast levels of 30% and 100% stimuli. They showed amplitude reduction at high spatial frequency, contrast of 100%, and low spatial frequency (P pathway), and contrast of 30% (M pathway) in patients with anisometropic amblyopia [17]. Due to P100 generator, the reduction of amplitude demonstrates the extent of damage at visual cortex, as well as M and P pathways [49-51].
Lev
el
Am
pli
tud
e (µ
V)
Time (ms) Time (ms)
Am
pli
tud
e (µ
V)
Time (ms) Time (ms)
Homa Hassankarimi et al. New Approach in the Analysis of PR VEP in Amblyopia
158 Iran J Med Phys, Vol. 15, No. 3, July 2018
P100 latency (Table 1b) increased in the patients group which was in line with previous studies [18, 40, and 50]. Hosseinmenni et al. investigated P100 latency for four stimuli (high and low spatial frequencies with high and low contrast) to isolate the functions of M and P pathways. Their results showed the P100 latency of abnormal signals increased significantly in small check size at both contrast levels. Nevertheless, there was a significant increase in large check size at high contrast level [18]. Latency elongation was an indicator of visual pathway malfunction. Moreover, this increase may be related to delay post retinal neural conduction [1, 18, and 46].
The contrasts of 50% and 100%, the spatial frequencies of 2 cpd and 4 cpd were appropriate for differentiating normal and abnormal signals in wavelet domain, respectively (Table 2). In the contrast of 5%, 7P decreased at 1 cpd and 2 cpd, as well as the contrast of 25% at 2 cpd in the patients group. As mentioned above, M pathway neurons are sensitive to low contrasts; accordingly, this decrease can show the predominance of magnocellular dysfunction in these stimuli. These results were in accordance to previous studies [2, 23, and 52]. Considering the fact that the P pathway neurons response to higher contrasts, the dominance of damage in these cells can cause 7P reduction at the contrast of 50% and the frequency of 2 cpd. In the same way, marked decrease of 7P at the contrast of 100% and the frequency of 4 cpd can confirm it [53, 54].
However, contrary to the other results, VEP analysis by bior4.4 showed an increase in 7P of abnormal signals arising from the frequency of 4 cpd and the contrast of 5%. It can be due to the activation of other neurons of visual system that have response-sensitivity relationship similar to M and P cells [55].
It can be offered that signal analysis in time-frequency domain can complete time domain analysis (Table 3). Since the analyzed parameters in both domains showed significant differences at the frequencies of 2 cpd and 4 cpd and the contrast of 50% and 100%, they can be considered as optimal stimuli. Furthermore, coif5 and bior4.4 are favorite wavelets due to their results and time domain of ones had better overlapping.
The results of the present study were in line with other studies and indicated that anisometropic amblyopia affected both P (at higher contrasts) and M pathways (at lower contrasts) [17, 18, and 56]. Some investigations have suggested that P pathway is dominant in amblyopic defects [10, 53], while our findings prove damages of both systems which reflect abnormal cortical post lateral geniculate nucleus process of retinal signals [52].
The significantly different means at a specific spatial frequency and contrasts determined that the
P and M systems were isolated. Therefore, a combination of both systems most likely leads to insignificant differences in some cases. According to the results, it seems that the DWT with coif5, bior4.4, db4, and bior3.5 wavelets can be suggested as a technique to distinguish between M and P pathways. In addition, using stimuli with the contrast of 50% and the spatial frequency of 2 cpd could provide the best clues to the diagnosis of amblyopia. Limitations of the Study
Finding patients considering the age and visual acuity range with similar disease paradigm was an important limitation. Accordingly, our sample size was small and the standard deviation was high. Transferring data was another major problem. As a result, adding WT to systems would facilitate analysis.
Conclusion The DWT analysis of the PRVEP for figuring out
optimum spatial frequency and contrast can help physicians to select an appropriate stimulus to monitor the visual function of anisometropic amblyopia. The WT can be considered as a complement of the time domain to optimize stimuli for separating normal and pathological signals. Further studies are recommended to evaluate wavelets with a larger sample size.
Acknowledgment The authors thank the staff at the
electrophysiology clinic of School of Rehabilitation Science of Iran university of Medical Sciences.
References
1. Parisi V, Scarale ME, Balducci N, Fresina M, Campos EC. Electrophysiological detection of delayed postretinal neural conduction in human amblyopia. Invest Ophthalmol Vis Sci. 2010 Oct 1; 51: 5041-8.
2. Zele AJ, Pokorny J, Lee DY, Ireland D. Anisometropic amblyopia: Spatial contrast sensitivity deficits in inferred magnocellular and parvocellular vision. Invest Ophthalmol Vis Sci. 2007 Aug 1; 48:3622–31.
3. Polat U, Sagi D, Norcia AM.Abnormal long-range spatial inter- actions in amblyopia. Vision Res. 1997 Mar 1; 37:737–44.
4. Hamm LM, Black J, Dai Sh, Thompson B. Global processing in amblyopia. Front Psychol. 2014 Jun 17; 5:583.
5. Thompson D. Developmental amblyopia. In: Heckenlively JR, Arden GB, editors. Principles and practice of clinical electrophysiology of vision. 2nd ed. Cambridge: MIT Press. 2006. p. 643-50.
6. Sloper J. Amblyopia beyond acuity. JAAPOS. 2008; 12:3-4
New Approach in the Analysis of PR VEP in Amblyopia Homa Hassankarimi et al.
Iran J Med Phys, Vol. 15, No. 3, July 2018 159
7. Press L.J, Kohl P. Vision therapy for amblyopia. In: Eye care for infants and young children. USA: Butterworth-Heineman. 1997. p. 155.
8. Wang X, Cui D, Zheng L, Yang X, Yang H, Zeng Combination of blood oxygen level‑dependent functional magnetic resonance imaging and visual evoked potential recordings for abnormal visual cortex in two types of amblyopia. Mol Vis. 2012 Apr 11; 18: 909‑19.
9. Miki A, Siegfried JB, Liu CSJ, Modestino EJ, Liu GT. Magno- and parvocellular visual cortex activation in anisometropic amblyopia, as studied with functional magnetic resonance imaging. Neuro-Ophthalmology. 2008 Jun 5; 32:187–93.
10. Choi MY, Lee KM, Hwang JM, Choi DG, Lee DS, Park KH, et al. Comparison between anisometropic and strabismic amblyopia using functional magnetic resonance imaging. British Journal of Ophthalmology. 2001 Mar 28; 85:1052–6.
11. Demer JL. Positron emission tomographic studies of cortical function in human amblyopia. Neurosci Biobehav Rev. 1993 winter; 17:469 76.
12. Gharebaghi AH, Heidary F, Gharebaghi R, Heidary R. Mehdi-ODM.A modified digital monitoring of the occlusion therapy for amblyopia. Graefes Arch Clin Exp Ophthalmol. 2011 Jun 1; 249:945-6.
13. Odom JV, Bach M, Brigell M. Holder GE, McCulloch DL, Mizota A, et al . ISCEV standard for clinical visual evoked potentials: (2016 update). Doc Ophthalmol. 2016 Aug 1; 133:1–9.
14. Ridder WH, Rouse MW. Predicting potential acuities in amblyopes: predicting post therapy acuity in amblyopes. Doc Ophthalmol. 2007 May 1; 114: 135-45.
15. De Mendonça RH, Abbruzzese S, Bagolini B, Nofroni I, Ferreira EL, Odom JV. . Visual evoked potential importance in the complex mechanism of amblyopia. Int Ophthalmol. 2013 Oct 1; 33(5):515-9.
16. Elshazly AAEF, Walid MAE, Elzawahry R, Elsherbiny NE. Flash visual evoked potential versus pattern visual evoked potential in the diagnosis of strabismic amblyopia. Int J Ophthalmol Clin Res. 2016 Aug 1; 3: 061.
17. Talebnejad MR, Hosseinmenni S, Jafarzadehpur E, Mirzajani A, Osroosh E. Comparison of the Wave Amplitude of Visually Evoked Potential in Amblyopic Eyes between Patients with Esotropia and Anisometropia and a Normal Group. Iran J Med Sci. 2016 Mar 1; 41(2):94-101.
18. Hosseinmenni S, Talebnejad MR, Jafarzadehpur E, Mirzajani A, Osroosh E. P100 wave latency in anisometropic and esotropic amblyopia versus normal eyes. J Ophthalmic Vis Res. 2015 Jul-Sep; 10(3): 268-73.
19. Oner A, Coskun M, Evereklioglu C, Dogan H. Pattern VEP is a useful technique in monitoring the effectiveness of occlusion therapy in amblyopic eyes under occlusion therapy. Doc Ophthalmol. 2004 Nov 18; 109(3):223-7.
20. Chung W, Hong S, Lee JB, Han SH. Pattern visual evoked potential as a predictor of occlusion therapy for amblyopia. Korean J Ophthalmol. 2008 Dec 26; 22:251-4.
21. Fahle M, Bach M. Origin of the visual evoked potentials. In: Heckenlively JR, Arden GB, editors.
Principles and practice of clinical electrophysiology of vision. 2nd ed. Cambridge: MIT Press ; 2006. p. 207-34.
22. Kothari R, Bokariya P, Singh S, Singh R. A comprehensive review on methodologies employed for visual evoked potentials. Scientifica. 2016; 2016. Doi: 10.1155/2016/9852194.
23. Souza GS, Gomes BD, Saito CA, da Silva Filho M, Silveira LCL. Spatial luminance contrast sensitivity measured with transient VEP: comparison with psychophysics and evidence of multiple mechanisms. Invest Ophthalmol Vis Sci. 2007 Jul 1; 48(7):3396 –404.
24. Tobimatsu S, Celesia GG. Studies of human visual pathophysiology with visual evoked potentials. Clin Neurophysiol. 2006 Jul 1; 117(7):1414 –33.
25. Lalor EC, Foxe JJ. Visual evoked spread spectrum analysis (VESPA) responses to stimuli biased towards magnocellular and parvocellular pathways. Vision Res. 2009 Jan 1; 49(1):127‑33.
26. Valberg A, Rudvin I. Possible contributions of magnocellular- and parvocellular-pathway cells to transient VEPs. Vis Neurosci. 1997 Jan-Feb; 14(1):1–11.
27. Rafiee J, Rafiee MA, Prause N, Schoen MP. Wavelet basis functions in biomedical signal processing. Expert Systems with Applications. 2011 May; 38 (5):6190- 201.
28. Akay M. Time frequency and wavelets in biomedical signal processing. IEEE Press series in biomedical Engineering. 1998.
29. Chui C.K. An Introduction to Wavelets. San Diego: Academic Press;. 1992.
30. Drissi H, Regragui F, Antoine JP, Bennouna M. Wavelet transform analysis of visual evoked potentials: some preliminary results. ITBM-RBM. 2000 Apr 1; 21(2):84-91.
31. Ulyana V. Borodina, Rubin R. Aliev. Wavelet spectra of visual evoked potentials: time course of delta, theta, alpha and beta bands, Neurocomputing. 2013 Dec 1; 121:551-5.
32. Thie J, Sriram P, Klistorner A, Graham ST. Gaussian wavelet transform and classifier to reliably estimate latency of multifocal visual evoked potentials (mfVEP). Vis Res. 2012 Jan 1; 52(1): 79-87.
33. Zhang JH, Janschek K, Bohme JF, Zeng YJ. Multi-resolution dyadic wavelet denoising approach for extraction of visual evoked potentials in the brain. IEE Proc.-Vis. Image Signal Process. 2004 Jun 1; 151(3):180-6.
34. Sivakumar R, Hema B, Karir P, Nithyaklyani N. Denoising of transient VEP signals using wavelet transform. J. Eng. Appl. Sci. 2006 Oct; 1(3): 242-7.
35. Akbari M, Azmi R. Automatic classification of visual evoked potentials based on wavelet analysis and support vector machine. Proceedings of the 6th International Advanced Technologies Symposium (IATS'11); 2011 May 16-18; Elazığ, Turkey: Firat University; 2011.P 227-30.
36. Hamzaoui E, Regragui F. Discrimination of visual evoked potentials using image processing of their time-scale representations. Procedia Technology. 2014 Nov 1; 17:359-67.
37. Almurshedi A, Khamim Ismail A, Skottun BC, Skoyles JR. Signal refinement: Principal component analysis
Homa Hassankarimi et al. New Approach in the Analysis of PR VEP in Amblyopia
160 Iran J Med Phys, Vol. 15, No. 3, July 2018
and wavelet transform of visual evoked response. Res. J. App. Sci. Eng. Technol. 2015 Jan 15; 9(2): 106-12.
38. Quiroga RQ. Obtaining single stimulus evoked potentials with wavelet denoising. Physica D. 2000; 145(3-4):278-92.
39. Heidari H, Einalou Z. SSVEP extraction applying wavelet transform and decision tree with bays classification. ICNSJ. 2017 summer; 4 (3):91-7.
40. Heravian J, Daneshvar R, Dashti F, Azimi A, Ostadi Moghaddam H, et al. Simultaneous pattern visual evoked potential and pattern electroretinogram in strabismic and anisometropic amblyopia. Iran Red Crescent Med J. 2011 Jan 1; 13(1):21-6.
41. Urbuch D, Gur M, Pratt H, Peled R. Time domain analysis of VEPs detection of waveform abnormalities in multiple sclerosis. Invest Ophthalmol Vis Sci. 1986 Sep 1; 27(9):1379-84.
42. Barboni MTS, Nagy BV, Martin CMG, Bonci DMO, Hauzman E, Aher A, et al. L-/M-cone opponency in visual evoked potentials of human cortex. Journal of Vision. 2017 Aug 1; 17(9):20, 1-12
43. Regan D. Fourier analysis of evoked potentials: some methods based on Fourier analysis. In Visual Evoked Potentials in Man: New Developments, Desmedt JE. Oxford: Clarendon Press. 1997; 110-20.
44. Trick GL, Trobe JD, Dawson WW, Trick LR, McFadden C. Power spectral analysis of visual evoked potentials in multiple sclerosis. Curr Eye Res. 1984 Oct 1; 3(10):1179-86.
45. Mallat SG. A wavelet tour of signal processing the sparse way. 3rded. Houston: Academic Press. 2009.
46. Addison PS. The illustrated wavelet transform handbook: introductory theory and applications in science, engineering, medicine and finance. CRC press. 2002.
47. Gauvin M, Lina JM, Lachapelle P. Advance in ERG analysis: From peak time and amplitude to frequency, power, and energy. BioMed Res Int. 2014 Jul 1; 1-11.
48. Gauvin M, Little JM, Lina JM, Lachapelle P. Functional decomposition of the human ERG based on the discrete wavelet transform. J Vis. 2015 Dec 31; 15(16):1-22.
49. Ellemberg D, Hammarrenger B, Lepore F, Roy MS, Guillemot JP. Contrast dependency of VEPs as a function of spatial frequency: the parvocellular and magnocellular contributions to human VEPs. Spatial Vision. 2001 May 11; 15(1): 99–111.
50. Foxe JJ, Strugstad EC, Sehatpour P, Molholm S, Pasieka W, Schroeder ChE, et al. Parvocellular and magnocellular contributions to initial generators of the visual evoked potential: High-density electrical mapping of the "C1" component. Brain Topogr. 2008 Sep 11; 21:11–21.
51. Kwak HW, Kin SM. Evaluation of clinically applied visual evoked potential (VEP) in ophthalmological and neurological disease. Kor. J. Ophthalmol. 1987 Jun; 1(1):26-30.
52. Zele AJ, Wood JM, Girgenti CC. Magnocellular and parvocellular pathway mediated luminance contrast discrimination in amblyopia. Vision Research. 2010 May 12; 50:969–76.
53. Shan Y, Moster, ML, Roemer RA, Siegfried JB. Abnormal function of the parvocellular visual
system in anisometropic amblyopia. Journal of Pediatric Ophthalmology and Strabismus. 2000 March 1; 37: 73–8.
54. Skottun BC, Skoyles JR. The parvocellular system an amblyopia. Neuro-Ophthalmology. 2008; 32:177-8.
55. Skottun BC, Skoyles JR. On identifying magnocellular and parvocellular responses on the basis of contrast-response functions. Schizophrenia Bulletin. 2011 Jan 1; 37 (1): 23–6.
56. Campos EC, Prampolini MR, Gulli R. Contrast sensitivity differences between strabismic and anisometropic amblyopia: objective correlate by means of visual evoked responses. Doc ophthalmol. 1984 Aug 15; 58:45-50.