IR Corporate Presentation · IR Corp. Presentation June 2020. 3. About us. Ownership structure &...
45
1 IR Corp. Presentation November 2020 IR Corporate Presentation KSB SE & Co. KGaA Dr. Matthias Schmitz (CFO) Dieter Pott (Head of Finance and Accounting)
Transcript of IR Corporate Presentation · IR Corp. Presentation June 2020. 3. About us. Ownership structure &...

1IR Corp. Presentation November 2020
IR Corporate PresentationKSB SE & Co. KGaADr. Matthias Schmitz (CFO)Dieter Pott (Head of Finance and Accounting)

2IR Corp. Presentation November 2020
About us
KSB Group is one of the world’s leading manufacturers of pumps and valves for many applications, providing a comprehensive range of service offerings. General Industry Petrochemicals / Chemicals Water Energy Mining Building Services

3IR Corp. Presentation November 2020
About usOwnership structure & No. of shares outstanding
Key Figures (EUR million) 2018 2019
Order intake 2,303.5 2,453.8 Sales revenue 2,245.9 2,383.2
EBITDA 179.2 195.5 EBITDA margin 8.0 % 8.2 %
EBIT 74.7 113.6 EBIT margin 3.3 % 4.8 %
Equity ratio 38.2 % 37.1 %20%
80%
Preference shares: 864,712
Johannes &Jacob KleinGmbH
Freefloat
84%
16%
Ordinary shares: 886,615
Johannes &Jacob KleinGmbH
Freefloat
Future Perspectives
Global market volume ~ EUR 107 billion in 2019 Average annual growth rate 2 to 4 %

4IR Corp. Presentation November 2020
Strategy
Markets, regional presence and economic development
Outlook
Sustainability
Appendix

5IR Corp. Presentation November 2020
Our focal points
Focus on Customers in Sales and After Sales worldwide
Agility and Flexibility in Structures and Processes
Profit Orientation based on Key Performance Indicators
High Engineering Competence powered by Innovationand Excitement of Creativity

6IR Corp. Presentation November 2020
Our Mission
KSB – We shape the future of Fluid Handling
We strive to achieve greater benefits for our customers. We inspire with our expertise, innovation power and creative drive.This makes us a successful, independent and reliable partner. Since 1871.

7IR Corp. Presentation November 2020
Strategic measures
Competitive cost structures
Reducing complexity(companies, products)
Global Footprint includingoptimising Supply Chain
Shared Service Center
Reaching competitive cost structures and striving for profitable growth at the same time
Focussing on profitablegrowth Aftermarket
Expanding business in core markets
ETA-Flagship
Start Additive Manufacturing(Lasercusing) for spare parts
Uniform systems and leanprocesses PACE – Excellence in accounting
and controlling
Global SAP platform
KSBase
Cloud for Service

8IR Corp. Presentation November 2020
Strategy
Markets, regional presence and economic development
Outlook
Sustainability
Appendix

9IR Corp. Presentation November 2020
Pumps, valves and serviceA fragmented addressable market of roughly €107 billion
2019 Market size (€M) by geography
Americas
Europe
MEA
APAC
World
> 4% 2–4% <2%CAGR 2019-2025
P V
18,700
8,000
P V
17,900
8,400
P V
3,3008,700
27,200
P
14,500
V 34,200
P
72,600
V
Source: KSB estimates

10IR Corp. Presentation November 2020
Building Services
Energy
General Industry
Mining
Petrochemicals/Chemicals
Water
Centrifugal pumps in m€ Valves in m€
2,6004,300
9,300
2,400
8,0005,700
25,600
6,900
1,600
19,500
Pumps, valves and serviceSize of targetmarketsMegatrends driving growth in KSB's markets Environmentalism
− Increasing regulation− Energy efficiency
Urbanization and population growth− Need for more infrastructure
Water scarcity− Growing demand for water
reuse, treatment and efficiency Digitization
Source: KSB estimates > 4% 2–4% <2%CAGR 2019-2025
8,000
12,800

11IR Corp. Presentation November 2020
Being present in all big markets globally
KSB production sites KSB sales and service sites
Share of regions(as per 31 December 2019)
Order intake Sales
Europe 53 % 54 %
Asia 24 % 23 %
America 16 % 16 %
MEA 7 % 7 %

12IR Corp. Presentation November 2020
1.887
1.620
Order intake decreased from January – September 2020 in comparison to the prior-year figure
Q1 - Q3 2019 Q1 - Q3 2020
- 14.2 % The € 267 million decline compared with the prior-year period was influenced, in particular, by the coronavirus pandemic as well as by negative currency translation effects of € 50 million.
All Regions reported a lower order intake compared with the prior-year period.
Decline in Order Intake per segment:
Valves: - 16.1 %Pumps: - 13.1 %Service*: - 10.7 %
(EUR million)*The Service Segment figures are adjusted by the sale of four French service companies (reported – 16.2 %).

13IR Corp. Presentation November 2020
Order intake grew in 2019 by EUR 150.2 million
KSB Group Pumps Valves Service
+ 6.5 % + 7.4 % + 1.8 % + 7.3 %
2,453.8
1,617.8361.9
474.1
(EUR million)
Order intake in 2019 grew across all segments particular driven by orders in the project business.
Main segment drivers: + Energy (+ EUR 43.4 million)+ Industry (+ EUR 25.4 million) and+ Water / Waste Water 12(+ EUR 23.3 million)
Regional growth drivers:+ Asia / Pacific (+ EUR 69.5 million)+ America (+ EUR 44.2 million)

14IR Corp. Presentation November 2020
Growth of order intake in all regions in 2019
+ 1.0 %
+ 13.6 % + 12.3 %
Europe Asia / Pacific Americas Middle East /Africa
53 %
16 %
24 %
7 %
Middle East / Africa
Asia / Pacific
AmericasEurope
(in EUR + 13.1 million)
(in EUR + 69.5 million)
(in EUR + 44.2 million)
(in EUR + 23.4 million) 2019
Total order intake: EUR 2,453.8 million
+ 16.3 %

15IR Corp. Presentation November 2020
1.7671.610
Sales revenue decreased from January – September 2020 in comparison to the prior-year figure
Q1 - Q3 2019 Q1 - Q3 2020
- 8.9 % All Regions saw a decrease in sales
revenue. In particular, government-ordered closures in Asia and South Africa had a negative impact.
The revenue decrease in the Service segment was negatively influenced by the sale of four French service companies in the first half year 2020.
Change in Sales revenue per segment:
Valves: - 9.1 %Pumps: - 8.5 %Service*: - 4.9 %(EUR million)
*The Service Segment figures are adjusted by the sale of four French service companies(reported - 9.9 %).

16IR Corp. Presentation November 2020
Sales increased by EUR 137.2 million in 2019
KSB Group Pumps Valves Service
2,383.2
1,562.5364.4
456.4
+ 6.1 % + 6.3 % + 6.9 % + 4.7 %
(EUR million)
As some of the orders are part of long-term projects, sales revenue lags behind order intake
Regional growth driver:+ Asia/Pacific (+ EUR 59.5 million)+ Americas (+ EUR 41.9 million)

17IR Corp. Presentation November 2020
Focus on Asia / Pacific and Americas entities in sales in 2019
54%
16%
23 %
7 %
Europe
Middle East / Africa
Asia / Pacific
Americas
+ 3.1 %
+ 12.4 % + 12.1 %
- 1.9 %
Europe Asia / Pacific Americas Middle East /Africa
(in EUR + 38.9 million) 2019
Sales in total: EUR 2,383.2 million
(in EUR + 59.5 million)
(in EUR + 41.9 million)
(in EUR - 3.0 million)

18IR Corp. Presentation November 2020
(EUR million) 2018 2019 H1/2019 H1/2020
Sales revenue 2,245.9 2,383.2 1,141.9 1,049.2Cost of materials
% of total Sales revenue
-934.5
41.6
-984.8
41.3
-505.7
44.3
-432.4
41.2Staff costs
% of total Sales revenue
-765.5
34.1
-848.3
35.6
-420.3
36.8
-418.1
39.8
Other expenses / income (net) -383.8 -338.8 -171.7* -156.5
EBIT 74.7 113.6 45.2 15.1
Income Statement
* Change in reporting from the 2019 Half-year Financial Report, other taxes item that was previously reported separately in the income statement was included in otherexpenses.

19IR Corp. Presentation November 2020
Capital Expenditure increased by 34.4 % resp. EUR 27.4 million
66.678.9
13.0
12.9 *
2018 2019
79.6
107.0
Property, plantand equipment
Intangible assets
60 %20 %
16 %
4 %
Europe
Middle East / Africa
Asia / Pacific
Americas
2019
(EUR million)
Capex in total:EUR 107.0 million
15.2
Right of use asset *
* First-time adoption of the new IFRS 16 accounting standard.

20IR Corp. Presentation November 2020
Reasonable Equity ratio
2,253 2,242 2,327
885.4 856.8 862.6
2017 2018 2019
Equity
Balancesheet total
39,3 % 38,2 %
(EUR million)
37,1 % Equity ratio including non-controlling
interests

21IR Corp. Presentation November 2020
Lower Net financial position reflects introduction of IFRS 16 (lease accounting)
364.3333.9 347.3
-76.3 -78.9-101.1
2017 2018 2019
Financialliabilities
Availablefinancial
resources
288.0255.0
(EUR million)
246.3* Lease liabilities of € 47.1 million
were recognized as a result of the first-time adoption of IFRS 16 in 2019 as compared to the fiscal year 2018.
* Adjusted by the lease liabilities the net financial position amounts to € 293.4 million.

22IR Corp. Presentation November 2020
Lower Net financial position reflects introduction of IFRS 16 (lease accounting)
(EUR million)
- 54.3- 30.1
- 56.8
- 22.0- 48.8
2017 2018 2019
Long-termdebt
Short-termdebt
- 76.3 - 78.9
Financial liabilities
- 101.1 The increase in the financial liabilities of € 22.2 million are mainly attributable to the first-time adoption of IFRS 16 in 2019, mitigated by the repayment of a borrowers note.
The short-term debt of € 44.3 million is affected by € 15.0 million and the long-term debt of € 56.8 million is affected by € 32.0 million due to the capitalization of rights of use to leased assets under IFRS 16.
-44.3

23IR Corp. Presentation November 2020
5.501 5.501
7.501
3.002
8.501
2015 2016 2017 2018 2019
Dividend of EUR 8.50 per share for 2019
1 EUR / Preference shares: + 0.26 EUR2 EUR / Preference shares: + 0.38 EUR
24.7 % 35.5 % 47.9 % Pay out ratio Group:
Dividend per share / EPS
29.4 % 34.7 %

24IR Corp. Presentation November 2020
Strategy
Markets, regional presence and economic development
Outlook
+ Outlook for financial year 2020
+ Climb 21 Strategy Project
Sustainability
Appendix

25IR Corp. Presentation November 2020
The global business environment is being shaped by rising coronavirus infection figures. These continue to create uncertainties regarding the impact on supply chains, production and customer demand in the near future.
With that in mind, it will remain difficult in the months ahead to estimate the scope and impact of the coronavirus pandemic on the customers’ willingness to reach out and invest, and thus on the key indicators of order intake, sales and EBIT.
Given these uncertainties, KSB continues to refrain from making a forecast for the 2020 financial year.
Outlook for financial year 2020

26IR Corp. Presentation November 2020
Industry
Further slowdown ofindustrialproduction in particular ofmechanicalengineering
Weakerdemand andcontinuingconsolidation, contraction in investments
Share in KSB COI (2019)
Outlook 2020e – economic downturn and decline in manufacturingwith high degree of uncertainty
Energy supplyPetro-/Chemical MiningWater/Wastewater
Contraction in countries witheconomicrecession
Worldwide extension andrenewal of waterand wastewaterinfrastructures in particular in APAC and Africa
Slow down in investments in power plants andrenewals
Construction
Reduction in production, capital spending and global fuel demand

27IR Corp. Presentation November 202027
Efficiency and effectiveness by
adapting the organi-sational structure
Profitable growththrough focusing on
markets
Climb 21Strategy Project

28IR Corp. Presentation November 2020
Cornerstones of Company Development
Efficiency / Cost savings / Liquidity
Profitable growthStructural measures
Potential through external growth
Long-term measures
Medium-term measures
Short-term measures
OCT2018 202120202019
Q1 Q2 Q3 Q4NOV DEC
Focusing on markets Imple-mentation
Improvement of the income statement
Improvement of the balance sheet
Focused acquisitions
Development of a new organisational structure and functions
Climb 21
Climb 2128
29IR Corp. Presentation June 2020
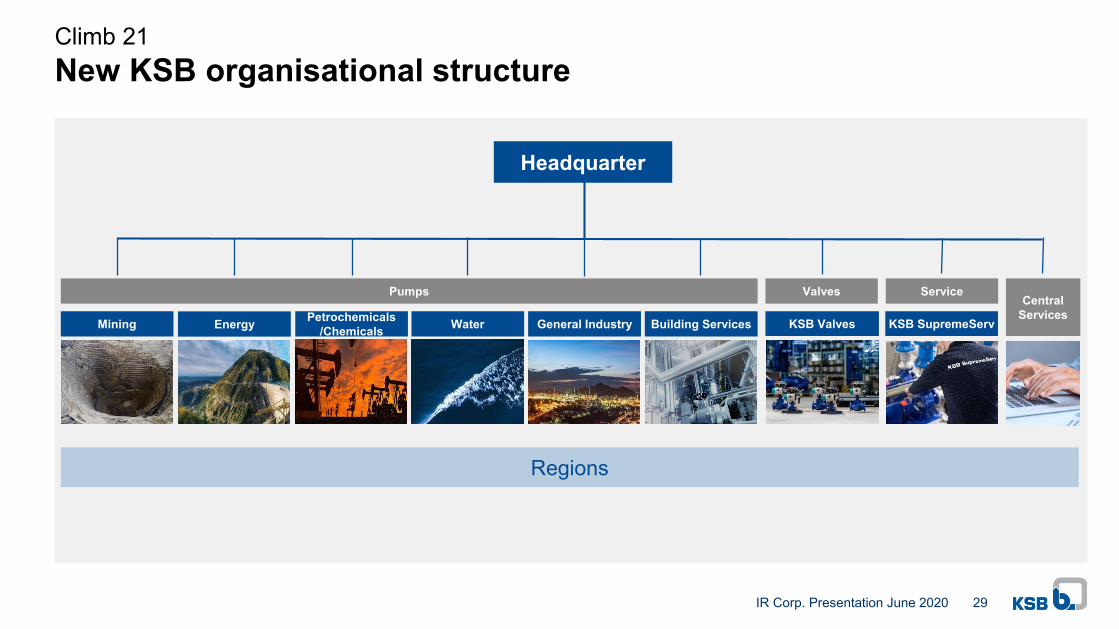
New KSB organisational structureClimb 21
Regions
Headquarter
Mining Energy Petrochemicals/Chemicals Water General Industry Building Services
Pumps Valves ServiceCentral
ServicesKSB Valves KSB SupremeServ

30IR Corp. Presentation November 2020
Strategy
Markets, regional presence and economic development
Outlook
Sustainability
Appendix

31IR Corp. Presentation November 2020
For a Better World
KSB joined the UN Global Compact in 2010.
I 31Sustainability
32IR Corp. Presentation November 2020
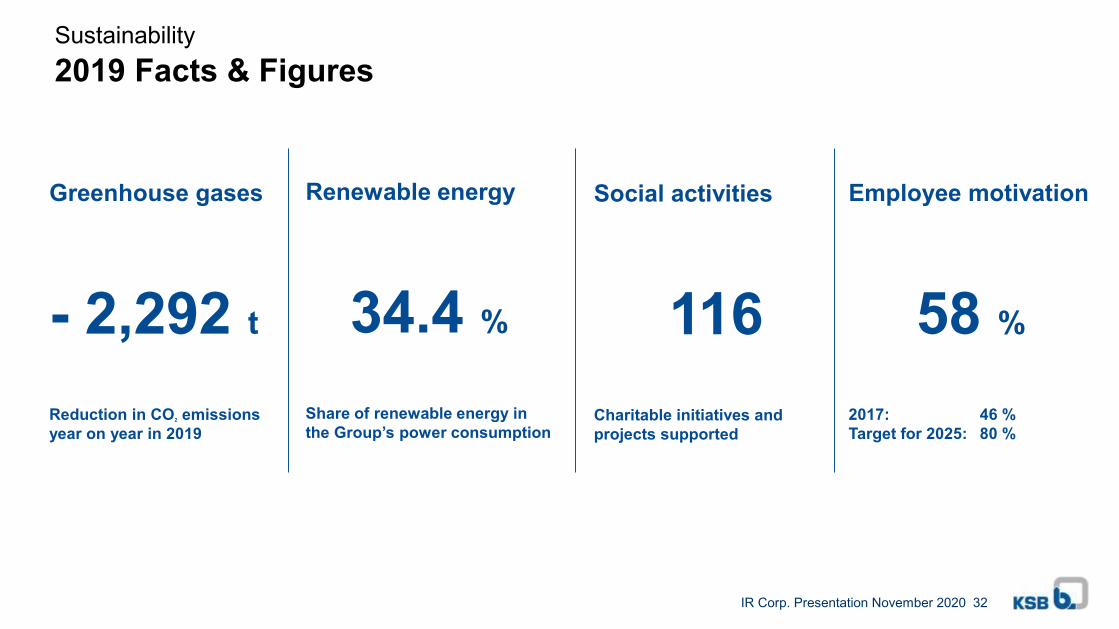
2019 Facts & Figures
32Sustainability
Greenhouse gases
- 2,292 t
Reduction in CO2 emissions year on year in 2019
Renewable energy
34.4 %
Share of renewable energy in the Group’s power consumption
Social activities
116Charitable initiatives and projects supported
Employee motivation
58 %
2017: 46 %Target for 2025: 80 %

33IR Corp. Presentation November 2020
New Binding Goals until 2025
1. CO2 emissions: - 30 %
2. KSB water pumps: Annual savings of 850,000 tonnes of CO2
3. Ecological product rating: Recyclability
4. Employee satisfaction index: 80 %
5. At least 20 % of management positions: Women
6. Reduction of days lost due to occupational accidents: < 0.3 days per employee / year
7. Professional development: At least 30 hours per employee / year
8. Sustainability performance assessment of key suppliers
9. Global commitment: 25 social projects / year
33Sustainability

34IR Corp. Presentation November 2020
Strategy
Markets, regional presence and economic development
Outlook
Sustainability
Appendix
+ Executive Board
+ Legal form
+ Financial Statements
+ Financial Calendar 2020

35IR Corp. Presentation November 2020
Dr Stephan Timmermann
Ralf Kannefass
Dr Stephan Bross Dr Matthias Schmitz
Executive Board of KSB SE & Co. KGaA

36IR Corp. Presentation November 2020
Mechanical engineeron the board since 13 November 2017appointed until 30 November 2023.
2015 – 2017 Consultant2005 – 2015 Member of the Board of MAN Diesel & Turbo SE2002 – 2005 Managing Director Schwäbische Hüttenwerke GmbH1999 – 2002 CEO MAN Logistics GmbH
Integrated engineering/business administration degreeon the board since 1 June 2017appointed until 31 May 2023
2014 – 2016 CFO H.C. Starck GmbH, Munich2007 – 2013 CFO Linde Material Handling GmbH (Kion Group)2002 – 2007 Head Controlling Mahle GmbH, Division Pistons1993 – 2002 KSB AG, last position: Head Controlling KSB Group
Dr Stephan Timmermann
Dr Matthias Schmitz
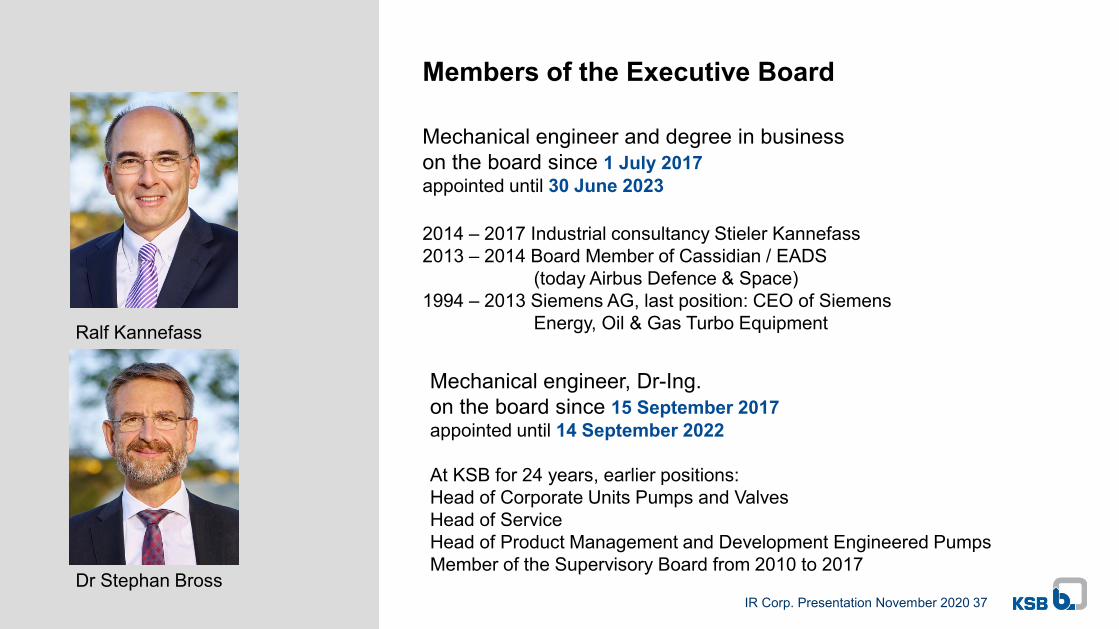
Members of the Executive Board
37IR Corp. Presentation November 2020
Ralf Kannefass
Members of the Executive Board
Mechanical engineer and degree in businesson the board since 1 July 2017appointed until 30 June 2023
2014 – 2017 Industrial consultancy Stieler Kannefass2013 – 2014 Board Member of Cassidian / EADS
(today Airbus Defence & Space)1994 – 2013 Siemens AG, last position: CEO of Siemens
Energy, Oil & Gas Turbo Equipment
Dr Stephan Bross
Mechanical engineer, Dr-Ing.on the board since 15 September 2017appointed until 14 September 2022
At KSB for 24 years, earlier positions:Head of Corporate Units Pumps and ValvesHead of ServiceHead of Product Management and Development Engineered PumpsMember of the Supervisory Board from 2010 to 2017
38IR Corp. Presentation November 2020
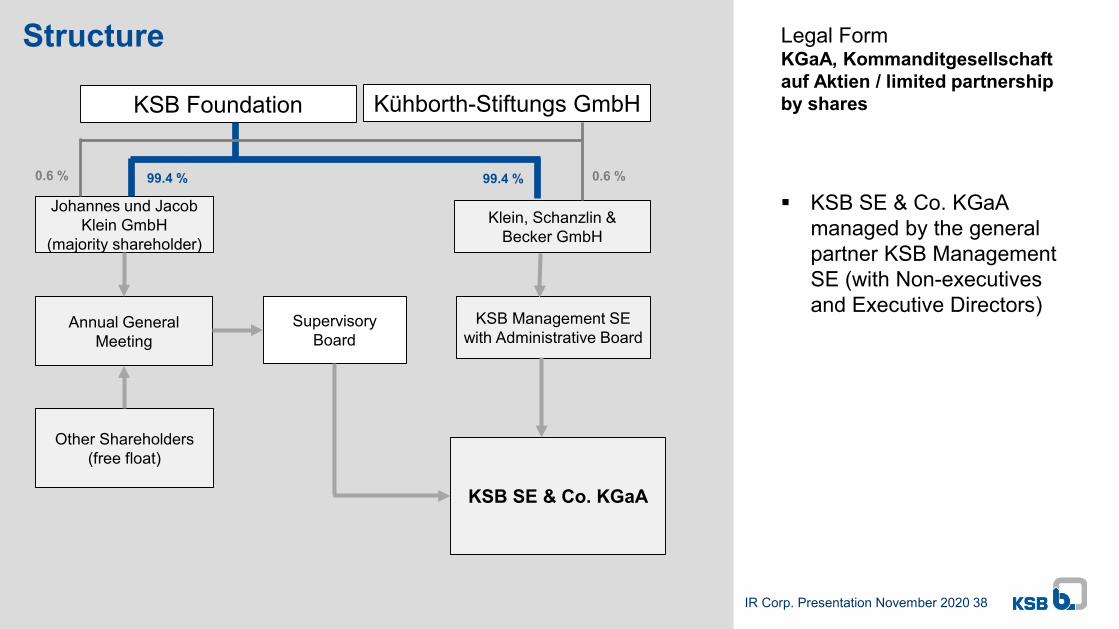
Legal FormKGaA, Kommanditgesellschaft auf Aktien / limited partnershipby sharesKSB Foundation
Johannes und Jacob Klein GmbH
(majority shareholder)
Annual General Meeting
Other Shareholders(free float)
SupervisoryBoard
Klein, Schanzlin & Becker GmbH
KSB Management SE with Administrative Board
KSB SE & Co. KGaA
Kühborth-Stiftungs GmbH
99.4 % 99.4 % 0.6 %0.6 %
Structure
KSB SE & Co. KGaA managed by the generalpartner KSB Management SE (with Non-executivesand Executive Directors)

39IR Corp. Presentation November 2020
(EUR million) 2018 2019 H1/2019 H1/2020
Sales revenue 2,245.9 2,383.2 1,141.9 1,049.2
Total output of operations 2,275.8 2,381.2 1,182.8 1,064.3Other income 33.1 33.4 19.2 15.5
Cost of materials -934.5 -984.8 -505.8 -432.4
Staff costs -765.5 -848.2 -420.3 -418.1
Depreciation and amortization expense -104.5 -81.9 -39.8 -42.3
Other expenses -416.9 -372.2 -191.0* -172.0
Other taxes -12.8 -13.9 - -
EBIT 74.7 113.6 45.2 15.1Financial income / expense (net) -11.6 -11.4 -5.6 -3.5
Income from / expense to investments accounted for using the equity method 2.5 1.2 -1.7 -1.2
EBT 65.6 103.4 37.9 10.4Taxes on income -41.6 -44.9 -18.4 -38.4
Net profit 23.9 58.5 19.5 -32.3
Income Statement
* Change in reporting from the 2019 Half-year Financial Report, other taxes item that was previously reported separately in the income statement was included in otherexpenses.

40IR Corp. Presentation November 2020
(EUR million) 2018 2019 H1/2019 H1/2020
Cash flows from operating activities 61.4 144.9 -0.2 23.1
Cash flows from investing activities -90.5 -74.0 27.0 -29.0
Cash flows from financing activities -9.4 -46.4 -12.6 -30.2
Changes in cash and cash equivalents -38.5 24.5 14.2 -35.5Effects of exchange rate changes on cash and cash equivalents 4.6 -0.4 -1.4 -3.9
Effects of changes in consolidated Group - 1.2 - -
Cash and cash equivalents at beginning of period 289.5 255.6 255.6 280.9
Cash and cash equivalents at end of period 255.6 280.9 268.3 241.6
Statement of Cash flows

41IR Corp. Presentation November 2020
Balance sheet: Assets(EUR million) 2018 2019 H1/2020
Non-current assets 696.7 782.6 677.6Intangible assets 91.1 97.1 95.9
Right-of-use assets - 50.1 43.7
Property, plant and equipment 496.6 511.3 491.5
Non-current financial assets 1.8 2.0 1.1
Other non-financial assets 2.9 2.8 2.8
Investments accounted for using the equity method 23.9 24.2 22.6
Deferred tax assets 80.4 95.1 20.0
Current assets 1,545.5 1,544.4 1,481.8Inventories 544.4 544.7 557.9
Contract assets 74.5 76.4 97.2
Trade receivables 518.1 504.1 448.3
Other financial assets 103.4 90.9 92.8
Other non-financial assets 49.5 39.6 44.1
Cash and cash equivalents 255.6 280.9 241.6
Assets held for sales - 7.8 -
Total 2,242.2 2,327.0 2,159.4

42IR Corp. Presentation November 2020
Balance sheet: Equity and Liabilities(EUR million) 2018 2019 H1/2020Equity 856.8 862.5 727.0Non-current liabilities 620.4 715.6 716.9Deferred tax liabilities 10.3 11.1 11.3
Provisions for employee benefits 578.6 646.3 650.9
Other provisions 1.4 1.4 1.4
Financial liabilities 30.1 56.8 53.4
Current liabilities 765.0 748.9 715.5Provisions for employee benefits 9.3 12.2 11.5
Other provisions 83.5 68.4 77.9
Financial liabilities 48.8 44.3 36.3
Contract liabilities 157.4 165.5 170.1
Trade payables 270.2 252.7 237.3
Other financial liabilities 32.8 31.2 27.1
Other non-financial liabilities 154.7 161.5 142.3
Income tax liabilities 8.3 9.1 13.0
Liabilities held for sales - 4.0 -
Total 2,242.2 2,327.0 2,159.4

43IR Corp. Presentation November 2020
28 January 2021 Preliminary report on financial year 2020
25 March 2021 Publication Financial Statement 2020,Financial press conference
29 April 2021 Interim report January - March 2021
6 May 2021 Annual General Meeting
12 August 2021 Half-year financial report January – June 2021
9 November 2021 Interim report January – September 2021
Financial Calendar 2021
44IR Corp. Presentation November 2020
Dieter Pott
Head of Finance and Accounting
Phone: +49 (0) 6233 86-2614
eMail: [email protected]
Investor Relations

45IR Corp. Presentation November 2020
Disclaimer
This investor presentation contains forward-looking statements that are based on current estimates, forecasts and assumptions made by KSB management to the best of its knowledge and other information currently available to KSB.
By their very nature, the forward-looking statements of this presentation are subject to various known and unknown risks, uncertainties and other factors, the non-occurrence or occurrence of which could cause material differences in future results ofoperations, financial situation, development or performance of KSB. Factors that could cause such differences include but are not limited to changes in political, business, economic and competitive environment, effects of future legal and legislative issues,fiscal, and other regulatory measures, foreign exchange rate fluctuations, interest rates, developments in raw material and personnel costs, launches of competing products or services, poor acceptance of new products or services, and changes in business strategy.
KSB does not intend and does not assume any liability whatsoever to publicly update or revise any forward-looking statements or other information contained in this presentation as a result of new information, future events or otherwise. No representation or warranty, express or implied, is made by KSB and/or its management with respect to the completeness, fairness, correctness, reasonableness or accuracy of any information, facts, expectations or opinions contained herein. Neither KSB nor any of its affiliates or representatives shall have any liability whatsoever (in negligence or otherwise) for any losses or damages arising from any use of this presentation or its content or otherwise arising in connection with the statements given herein. This presentationincludes percentage and number rounding.