IPEDS Peer Analysis System Advanced Module The place to go for IPEDS data: .
Upload
quentin-hahnCategory
view
24download
0description

IPEDS Peer Analysis System: PAS 101
Valerie Martin Conley, Ph.D.Ohio University
301
What is it?
The Peer Analysis System is a web-based tool that is designed to enable a user to easily retrieve data on a group of postsecondary institutions of the user’s choice.

System Features
Compare one institution to a group of comparison institutions.
Develop and store multiple comparison groups based on IPEDS characteristics selected by the user.
Generate reports or files using selected IPEDS variables of interest.
Navigating the System
The flow and sequence of the Peer Analysis System is designed around the following steps:1. Select a level of access
2. Identify a LinchPin institution
3. Construct a Master Variables List
4. Define a comparison group
5. Prepare your analysis

Flow and Sequence
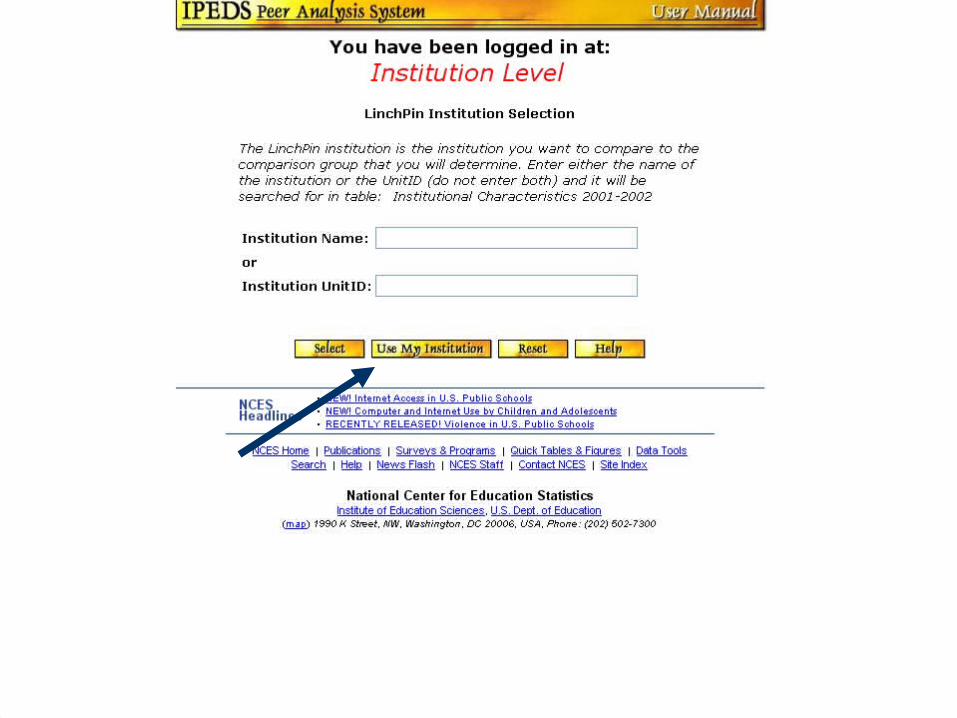
1. Select a level of access Three levels of access exist. Each level provides access to different
years of data and as a result has different levels of security.


Flow and Sequence
2. Identify a LinchPin Institution A LinchPin institution is the institution you
want to compare to other institutions In most instances the linchpin institution is
your own institution
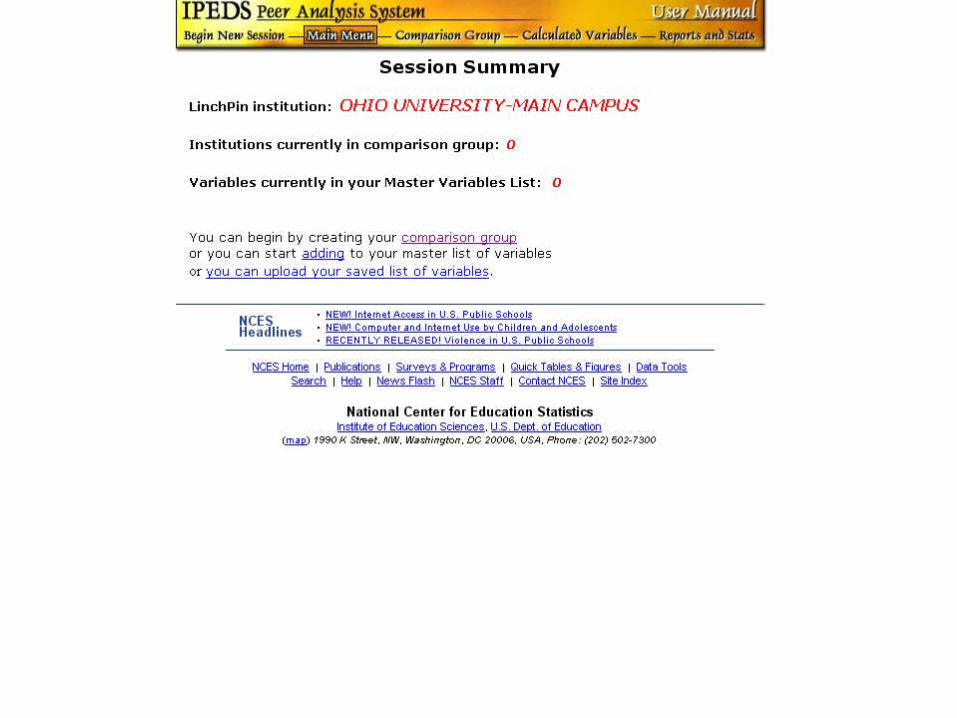

Flow and Sequence
3. Construct a Master Variables List Created by Default or you can start by
adding to your master list of variables The MVL is simply a running list of variables
you have used during your session


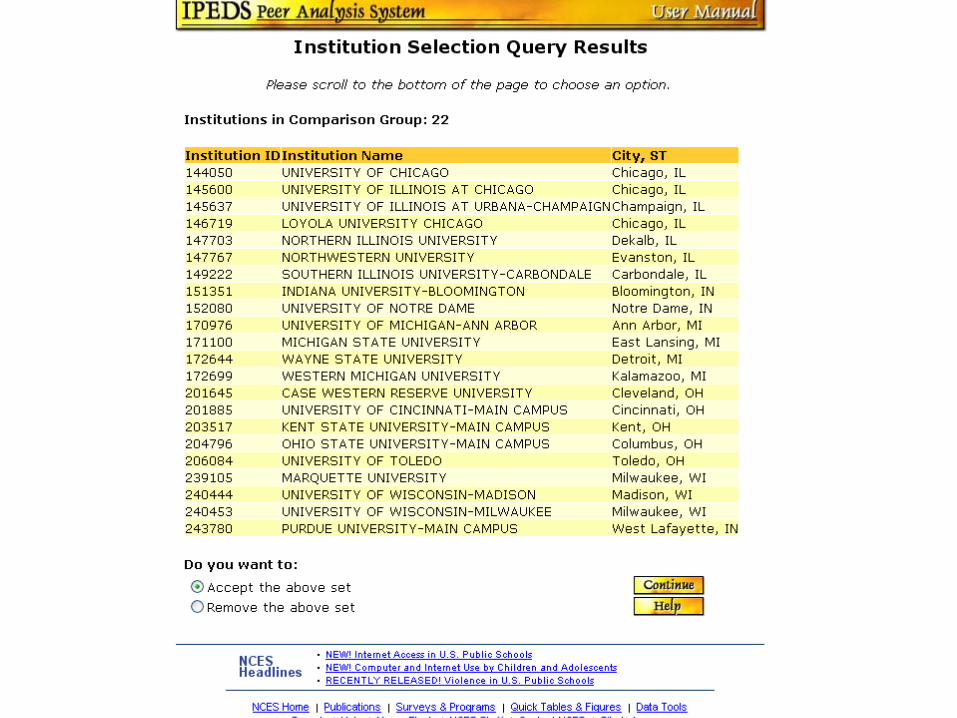
Flow and Sequence
4. Define a comparison group Auto Peer Group May be a predefined comparison group
(e.g., your peer group) that you identify by name, or
A group you construct by adding institutions to the comparison group that meet specified criteria (add by variable).


Flow and Sequence
5. Prepare your analysis Generate the report or file
– Ranking Report– Institutions Data– Statistical Summary– Report Template– Dump a data file


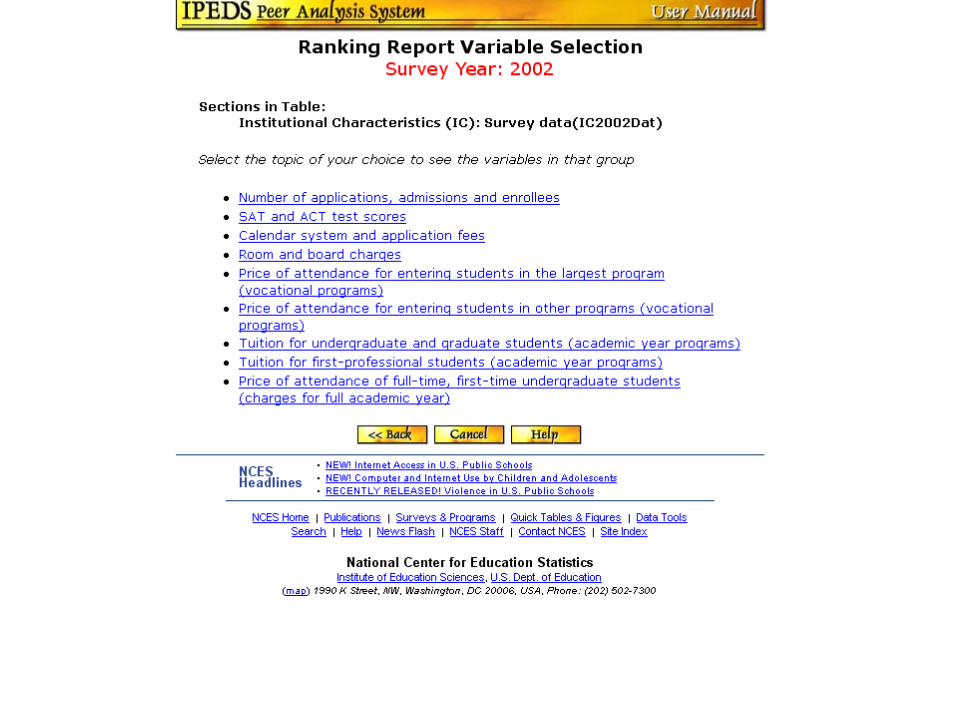


Calculated Variables
It’s easy to see the need for the calculated variables feature… We would be more likely to want to see the total number of applications (sum of men and women) or the yield rate than we would the total applicants who were women or the total applicants who were men.


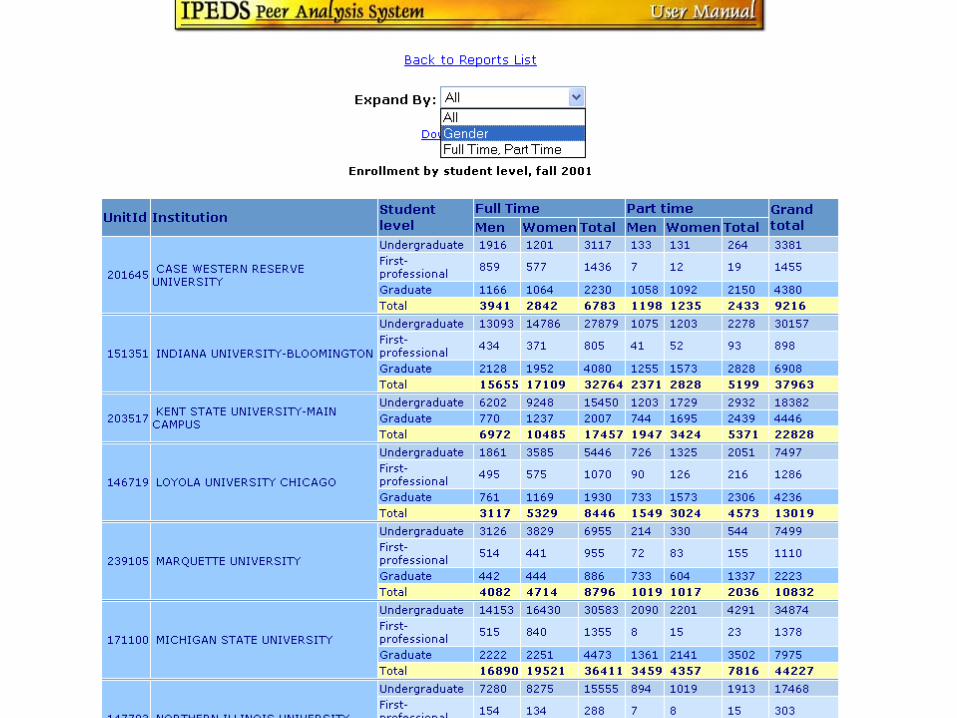
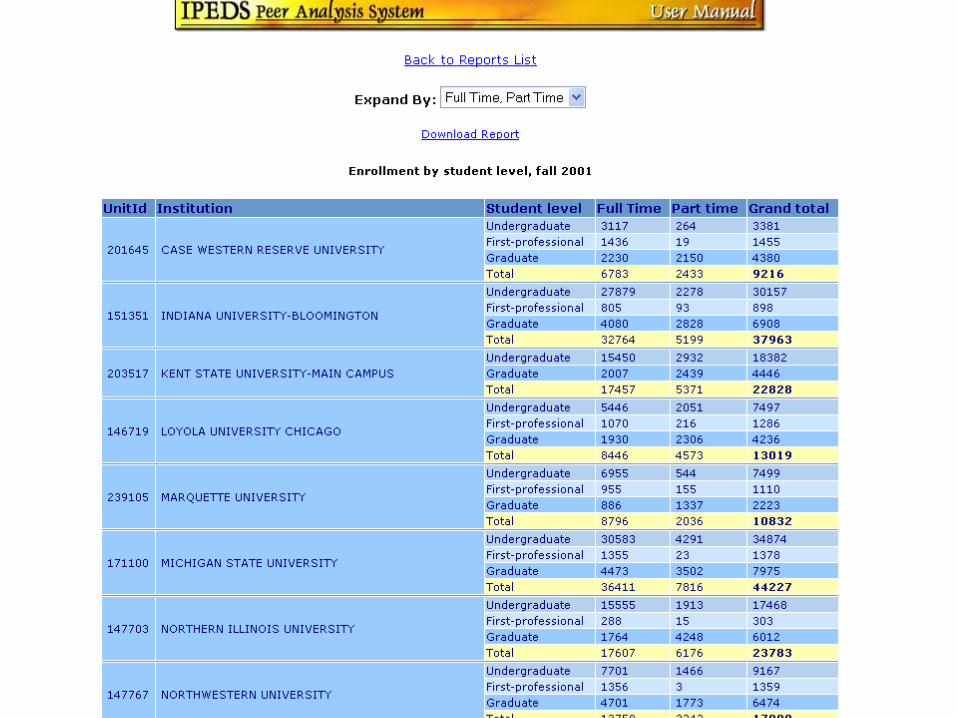
Report Templates
Enrollment by student level Total fall enrollment, selected years In this case a picture is worth a thousand
words….


Strengths and Weaknesses
The major strength of the Peer Analysis System is as a data retrieval system.
Ability to access IPEDS data “on-demand!” The major weakness of the tool is in its
limited ability to manipulate, format, summarize, or report the data.
BUT, Stay tuned…

More Strengths…
The support that is available for the Peer Analysis System is another major strength.
Support Includes:– On-line User Manual,– Help buttons on most screens,– Info buttons that define variables, – Self-guided tutorial– NCES supported training