Ion Channels in Arabidopsis Plasma Membrane1 - Plant Physiology
7
Plant Physiol. (1992) 99, 96-102 0032-0889/92/99/0096/07/$01 .00/0 Received for publication September 16, 1991 Accepted December 7, 1991 Ion Channels in Arabidopsis Plasma Membrane1 Transport Characteristics and Involvement in Light-induced Voltage Changes Edgar P. Spalding*, Clifford L. Slayman, Mary Helen M. Goldsmith, Dietrich Gradmann2, and Adam Berti Department of Biology, Kline Biology Tower, Yale University, New Haven, Connecticut 06511 (E.P.S., M.H.M.G.); and Department of Cellular and Molecular Physiology, Yale School of Medicine, New Haven, Connecticut 06510 (C.L.S., D.G., A.B.) ABSTRACT White light (25 watts per square meter) induced an increase in plasma membrane K+-channel activity and a 30- to 70-millivolt transient membrane depolarization (completed in 2-3 minutes) in Arabidopsis thaliana leaf mesophyll cells. Transport characteris- tics of three types of ion channels in the plasma membrane were determined using inside-out patches. With 220 millimolar K+ on the cytoplasmic side of the patch and 50 millimolar K+ in the pipette, (220/50 K), the open-channel current-voltage curves of these channels were sigmoidal and consistent with an enzyme kinetic model. Two channel types were selective for K+ over Na+ and CI. One (named PKC1) had a maximum conductance (Gmax) of 44 picosiemens at a membrane voltage (Vm) of -65 mV in (220/ 50 K) and is stimulated by light. The other (PKC2) had Gmax = 66 picosiemens at Vm = 60 millivolts in (220/50 K). The third channel type (PCC1) transported K and Na+ about equally well but not Cl. It had Gmax = 109 picosiemens at Vm = 55 millivolts in (250/ 50 K) with 10 millimolar Ca2+ on the cytoplasmic side. Reducing Ca2+ to 0.1 millimolar increased PCC1 open-channel currents by approximately 50% in a voltage-independent manner. Averaged over time, PKC2 and PCCI currents strongly outward rectified and PKC1 currents did so weakly. Reductants (1 millimolar dithi- othreitol or 10 millimolar O-mercaptoethanol) added to the cyto- plasmic side of an excised patch increased the open probability of all three channel types. Light can rapidly modulate electrogenic transport systems in plant cells, resulting in large changes in the voltage across the plasma membrane (10, 20, 24). Changes in activity of the H+-ATPase and voltage-gated ion channels are probably com- ponents of the mechanism (1, 25, 28). Elucidation of the details would yield results relevant to numerous physiological processes that depend on Vm3. 'This research was supported, in part, by National Science Foun- dation grant DMB-84 19759 to M.H.M.G., by Department of Energy grant 85ER 13359 to C.L.S., and by a Volkswagen-Stiftung Akademie- Stipendium 11/66 647 to D.G. 2Permanent address: Pflanzenphysiologisches Institut der Univer- sitat Gottingen, D-3400 Gottingen, Federal Republic of Germany. 3Abbreviations: Vm, membrane voltage; BTP, 1,3-bis[tris-(hy- droxymethyl)-methylamino] propane; IO, current through an open channel; I-V curve, a plot of I, versus Vm; WL, white light; PO, open probability; PKC, plasma membrane K+ channel; PCC, plasma mem- brane cation channel; EK (EcI), equilibrium voltage for K+ (Cl-); Gmax, maximum slope conductance. This study focused on plasma membrane ion channels (reviewed in ref. 27) in Arabidopsis thaliana mesophyll cells and demonstrates the involvement of one channel type in a light-induced voltage change. Mutants that are defective in photoperception and/or signal transduction will be useful in future investigations of the response of Vm to light. Thus, combinations of genetic and patch-clamp techniques, both having resolution at the molecular level, are anticipated to advance the study of membrane transport and its control. MATERIALS AND METHODS Plant Material Arabidopsis thaliana (L.) Heynh. (Landsberg genotype) plants were grown from unsterilized seeds sown on wet ver- miculite:sand (10:1 mixture) in plastic containers (100 x 100 x 85 mm) placed on an irrigation table flooded twice daily with a nutrient solution (Hyponex Co., Copley, OH). Flu- orescent and incandescent bulbs delivered light (20 W-mm2) on a 16-/8-h light/dark cycle. Rosette leaves (approximately 25 x 10 mm) from 3-week-old plants were excised, and portions of the abaxial epidermis were peeled off with forceps. The peeled areas were floated peeled side down on 2 mL of protoplast isolation medium (0.6 M sorbitol, 10 mM KCl, 5 mM Mes, 1 mm CaCl2, adjusted to pH 5.8 with BTP) contain- ing 5 mg Cellulysin (Calbiochem, San Diego, CA), 2 mg Pectinase (Sigma, St. Louis, MO), and 5 mg BSA (Sigma) in a small Petri dish (40 x 10 mm). The dish was gently shaken at 60 rpm for 1 h at 28°C. Undigested material was removed, and the protoplast suspension was centrifuged at 730g for 2 min. The pellet was resuspended in fresh medium, centri- fuged, resuspended again, and stored on ice for up to 8 h. Single-Channel Recording Apparatus Patch-clamp experiments were performed generally as de- scribed in ref. 12. Micropipettes were pulled from Kimax-5 1 capillary glass (Kimble Products, Vineland, NJ) to a tip diameter of 1 to 2 ,tm and heat polished. The resulting electrodes, when filled as described below, had resistances of approximately 10 MQ. A Ag/AgCl reference electrode con- tacted the bath by way of a salt bridge. Electrode offsets were nulled before each experiment with the correction circuitry of the amplifier (Axopatch-lA with CV-3 headstage; Axon 96 Downloaded from https://academic.oup.com/plphys/article/99/1/96/6088236 by guest on 15 February 2022
Transcript of Ion Channels in Arabidopsis Plasma Membrane1 - Plant Physiology

Plant Physiol. (1992) 99, 96-1020032-0889/92/99/0096/07/$01 .00/0
Received for publication September 16, 1991Accepted December 7, 1991
Ion Channels in Arabidopsis Plasma Membrane1
Transport Characteristics and Involvement in Light-induced Voltage Changes
Edgar P. Spalding*, Clifford L. Slayman, Mary Helen M. Goldsmith, Dietrich Gradmann2, and Adam BertiDepartment of Biology, Kline Biology Tower, Yale University, New Haven, Connecticut 06511 (E.P.S., M.H.M.G.);and Department of Cellular and Molecular Physiology, Yale School of Medicine, New Haven, Connecticut 06510
(C.L.S., D.G., A.B.)
ABSTRACTWhite light (25 watts per square meter) induced an increase in
plasma membrane K+-channel activity and a 30- to 70-millivolttransient membrane depolarization (completed in 2-3 minutes) inArabidopsis thaliana leaf mesophyll cells. Transport characteris-tics of three types of ion channels in the plasma membrane weredetermined using inside-out patches. With 220 millimolar K+ onthe cytoplasmic side of the patch and 50 millimolar K+ in thepipette, (220/50 K), the open-channel current-voltage curves ofthese channels were sigmoidal and consistent with an enzymekinetic model. Two channel types were selective for K+ over Na+and CI. One (named PKC1) had a maximum conductance (Gmax)of 44 picosiemens at a membrane voltage (Vm) of -65 mV in (220/50 K) and is stimulated by light. The other (PKC2) had Gmax = 66picosiemens at Vm = 60 millivolts in (220/50 K). The third channeltype (PCC1) transported K and Na+ about equally well but notCl. It had Gmax = 109 picosiemens at Vm = 55 millivolts in (250/50 K) with 10 millimolar Ca2+ on the cytoplasmic side. ReducingCa2+ to 0.1 millimolar increased PCC1 open-channel currents byapproximately 50% in a voltage-independent manner. Averagedover time, PKC2 and PCCI currents strongly outward rectifiedand PKC1 currents did so weakly. Reductants (1 millimolar dithi-othreitol or 10 millimolar O-mercaptoethanol) added to the cyto-plasmic side of an excised patch increased the open probabilityof all three channel types.
Light can rapidly modulate electrogenic transport systemsin plant cells, resulting in large changes in the voltage acrossthe plasma membrane (10, 20, 24). Changes in activity of theH+-ATPase and voltage-gated ion channels are probably com-ponents of the mechanism (1, 25, 28). Elucidation of thedetails would yield results relevant to numerous physiologicalprocesses that depend on Vm3.
'This research was supported, in part, by National Science Foun-dation grant DMB-84 19759 to M.H.M.G., by Department of Energygrant 85ER 13359 to C.L.S., and by a Volkswagen-Stiftung Akademie-Stipendium 11/66 647 to D.G.
2Permanent address: Pflanzenphysiologisches Institut der Univer-sitat Gottingen, D-3400 Gottingen, Federal Republic of Germany.
3Abbreviations: Vm, membrane voltage; BTP, 1,3-bis[tris-(hy-droxymethyl)-methylamino] propane; IO, current through an openchannel; I-V curve, a plot of I, versus Vm; WL, white light; PO, openprobability; PKC, plasma membrane K+ channel; PCC, plasma mem-brane cation channel; EK (EcI), equilibrium voltage for K+ (Cl-);Gmax, maximum slope conductance.
This study focused on plasma membrane ion channels(reviewed in ref. 27) in Arabidopsis thaliana mesophyll cellsand demonstrates the involvement of one channel type in alight-induced voltage change. Mutants that are defective inphotoperception and/or signal transduction will be useful infuture investigations of the response of Vm to light. Thus,combinations of genetic and patch-clamp techniques, bothhaving resolution at the molecular level, are anticipated toadvance the study of membrane transport and its control.
MATERIALS AND METHODS
Plant Material
Arabidopsis thaliana (L.) Heynh. (Landsberg genotype)plants were grown from unsterilized seeds sown on wet ver-miculite:sand (10:1 mixture) in plastic containers (100 x 100x 85 mm) placed on an irrigation table flooded twice dailywith a nutrient solution (Hyponex Co., Copley, OH). Flu-orescent and incandescent bulbs delivered light (20 W-mm2)on a 16-/8-h light/dark cycle. Rosette leaves (approximately25 x 10 mm) from 3-week-old plants were excised, andportions of the abaxial epidermis were peeled offwith forceps.The peeled areas were floated peeled side down on 2 mL ofprotoplast isolation medium (0.6 M sorbitol, 10 mM KCl, 5mM Mes, 1 mm CaCl2, adjusted to pH 5.8 with BTP) contain-ing 5 mg Cellulysin (Calbiochem, San Diego, CA), 2 mgPectinase (Sigma, St. Louis, MO), and 5 mg BSA (Sigma) ina small Petri dish (40 x 10 mm). The dish was gently shakenat 60 rpm for 1 h at 28°C. Undigested material was removed,and the protoplast suspension was centrifuged at 730g for 2min. The pellet was resuspended in fresh medium, centri-fuged, resuspended again, and stored on ice for up to 8 h.
Single-Channel Recording Apparatus
Patch-clamp experiments were performed generally as de-scribed in ref. 12. Micropipettes were pulled from Kimax-5 1capillary glass (Kimble Products, Vineland, NJ) to a tipdiameter of 1 to 2 ,tm and heat polished. The resultingelectrodes, when filled as described below, had resistances ofapproximately 10 MQ. A Ag/AgCl reference electrode con-tacted the bath by way of a salt bridge. Electrode offsets werenulled before each experiment with the correction circuitryof the amplifier (Axopatch-lA with CV-3 headstage; Axon
96
Dow
nloaded from https://academ
ic.oup.com/plphys/article/99/1/96/6088236 by guest on 15 February 2022

ION CHANNELS IN ARABIDOPSIS PLASMA MEMBRANE
Instruments, Burlingame, CA). Amplifier output was contin-uously recorded on a Toshiba M-120 videotape recorder viaa pulse-code modulator (model VR-IOA; Instrutech Corp.,Elmont, NY). Recorded data were replayed, filtered (low-pass, 8-pole Bessel filter; model 902LPF, Frequency Devices,Haverhill, MA) and sampled at a rate at least twice the filterfrequency using pCLAMP 5.51 software and a TL-1 datainterface (both from Axon Instruments). Data were also ob-tained with the apparatus described in ref. 4. Gaussian distri-butions were fitted to all-points amplitude histograms. Themean current corresponding to the closed state was subtractedfrom that of the open state to give the open-channel currentsplotted in the I-V curves.
Sealing and Experimental Conditions
Protoplasts (25-50 Aim diameter) were transferred to therecording chamber (volume = 0.5 mL) containing bathingsolution (220 or 250 mm KCI, 10 mM CaCl2, 5 mm Hepes,adjusted to pH 7.0 with BTP), and adhered to a piece of acid-washed glass coverslip on the bottom of the chamber. With50 mM KCI, 1 mm CaCl2, 250 mm sorbitol, 5 mM Hepes(adjusted to pH 7.0 with BTP) in the pipette, seals of>I0 GQformed in >50% ofthe attempts. Similar results were obtainedusing 5 mM Tris-Mes as buffer in both pipette and bath. Sealformation was aided by millimolar concentrations of CaC12,adherence of the protoplasts, and proper osmolality of thebathing solution (protoplasts swollen but safely short of theirbursting point). Inside-out patches were produced after sealformation by withdrawing the pipette and exposing it verybriefly to the air. Although a few patches were maintained for2 h after excision, many did not last long enough to obtainuseful data. High [Ca2+] on the cytoplasmic side producedmore stable seals and higher channel activity compared withpatches bathed in 1 uM free Ca2+ (10 mM EGTA + 7 mMCaC12, pH 7.0).Use of unphysiologically high [Ca2] did not seem to alter
channel selectivities or general I-V relationships, the featureson which we focused. The same characteristics obtained instudies with 1 uM cytoplasmic free Ca2+ and cell-attachedpatches. Excised patches may not retain the molecular ma-chinery for sensing physiological [Ca2+] (21).The chamber was perfused throughout each experiment at
rates up to 7 mL * min-' with a solution selected by means ofa manifold. At the fastest perfusion rates, the time betweenswitching and delivery of the new solution was about 3 s.
Measurement of Light Effects
Light-related effects on Vm were measured in excised rosetteleaves held by Plasticine at the tip of the blade and petioleand superfused with 0.1 mM KCI and 0.1 mm CaCl2. A celltwo to three cell layers from the adaxial surface was impaledwith a conventional glass microelectrode filled with 1 M KCI.The potential difference between the microelectrode and abath electrode was led to a high-impedence electrometer andthen to a chart recorder. The preparation was darkened for atleast 10 min before WL (25 W_m-2) from a 150-W projectorbulb (model EKE, General Electric, Cleveland, OH) was
directed onto the leaf with a fiberoptic. (The same lighttreatment was used in the channel-activation experiments.)The change in Vm followed the onset of illumination by lessthan the approximately 1 s of resolution obtainable withmanual switching of the light. Irradiating submerged elec-trodes alone had no effect, ruling out possible artifacts due tolight sensitivity of Ag/AgCl electrodes.
Notation and Sign Convention
Vm is defined as the electric potential of the cytoplasmminus that of the extracellular space. Currents through anopen channel, IO, are taken to be positive when they carrypositive charge out of the cytoplasm (outward current). Posi-tive currents and voltages are plotted above or to the right ofa reference. In this report, the term "I-V curve" refers to aplot of I,, versus Vm. Important ion concentrations at the twosides of an inside-out patch are given in millimolars in theform jcytoplasmic/extracellularl. For example, (250/50 K)indicates that there was 250 mM K+ at the cytoplasmic side(bath) and 50 mM K+ at the extracellular side (pipette). (200Na + 50 K/50 K) means the bath contained 200 mM Na+ +50 mM K+ and the pipette contained 50 mM K+.
Kinetic Modeling
A cyclic two-state model with four apparent rate constants(units of s-') was used to describe the I-V curves (1 1, 13). Onevoltage-dependent pair of rate constants (kio, and koi) standsfor the reversible transition of the charge between the cyto-plasm (inside, i) and the outside (o): kio,= k%ifand koi=k=,ilf The superscript 0 denotes the value at zero voltage andf=exp(VVmze/2kT). z, e, k, and T have their usual thermody-namic meanings. The factor 2 reflects the assumption thatthe Eyring (energy) barrier is symmetric. The second pair ofrate constants (Koi and Ki,) stands for the remaining, voltage-independent part of the reaction cycle. The current-voltagerelationship of this model reads:
(ki, + koi + Kio + Koi) (1)
A three-state model is appropriate to describe two I-V curvesobtained with different inside substrate concentrations. Thethree states correspond to the (sole) binding site loaded withthe charge z facing inside (1) or outside (2) and the empty,neutral binding site inside (3). The voltage-dependent step isnow k12 = k012f and k21 = k°2/f Substrate binding to, anddebinding from, the inward-oriented binding site is describedby k3 = k%3I[S]i (c03 being the rate constant with 1 M insidesubstrate concentration) and k13, respectively. A pair offormalrate constants (k23 and k32) stands for the unaffected part ofthe reaction cycle. The I-V relationship of the three-statemodel reads:
Io(Vm) = ze (k l2k23k3I - k2lkl3k32)(k2lk3 + k32k21 + k23k3l + k,2k32 + k,3k32
+ k3ikl2 + kl3k23 + kl2k23 + k2lkl3)
(2)
In the I-V diagrams presented below, the solid curves areleast-squares fits of Equations 1 or 2 to the plotted data.
97
Dow
nloaded from https://academ
ic.oup.com/plphys/article/99/1/96/6088236 by guest on 15 February 2022

Plant Physiol. Vol. 99, 1992
> -100
ECZ.0S
5 -200
light off
light on
5 minlight on B
5 pA|
30 s
ClOpAI 5
500 ms
Figure 1. Vm, ion channels, and the effects of light. A, WL (25 W.m-2) induced a transient membrane depolarization in mesophyll cellsof an intact Arabidopsis leaf. Hyperpolarization followed light off. B,WL-stimulated K+ channel activity in a plasma membrane cell-at-tached patch. K+ concentrations were 250 mm in the bath and 10mm in the pipette. Pipette-holding voltage was -50 mV, and filterfrequency was 50 Hz. C, Cell-attached patch containing three differ-ent types of channels. Differences between open-channel currents(amplitudes of individual pulses) distinguish the different channeltypes. K+ concentrations were 250 mm in the bath and 50 mm in thepipette. Pipette-holding voltage was -80 mV, and filter frequencywas 400 Hz.
RESULTS
Effects of Light on Vm and Channel Activity
Figure IA displays transient shifts in Vm that began uponthe onset ofWL (25 W. m-2). The peak change in Vm rangedfrom 30 to 70 mV. The shoulder during the depolarizationwas a usual feature. The repolarization usually proceededbeyond the initial Vm and then settled at a slightly morenegative voltage 5 to 10 min after the "light-on" condition.Transient hyperpolarizations (approximately 20 mV) wereinduced without a detectable lag by the "light-off' condition.The return to a new steady Vm following the hyperpolarizationalso included a transient overadjustment.
Figure lB shows a recording ofcurrents from a cell-attachedpatch containing at least two channels. Within the first 1 s ofWL, the activity of the channel increased. Analysis of thisexperiment revealed an approximately fourfold increase inthe P. of the channels after the onset ofWL. The lag betweenlight-on and the onset of channel activation ranged between<1 and 20 s (n = 6). This lag may reflect the time for diffusionto the channel of an (unknown) activator produced by illu-minated chloroplasts. We could not demonstrate an effect oflight on channels in excised patches.The cell-attached recording shown in Figure 1C displays
three distinct amplitudes ofsingle open-channel currents. Thissuggests the presence of three types of channels in the patch.Using excised inside-out patches, we characterized three cor-responding types of channel in detail. Two proved to beselective for K+ over Na+ and Cl- and were assigned acronymsPKC 1 and PKC2. The third channel type was a nonselective
cation channel named PCC 1. The different channel typeswere encountered at the following approximate frequencies:PKC1, 60%; PKC2, 20%; and PCC1, 20%.
Plasma Membrane K+ Channel, PKC1
Figure 2 (top) shows examples of channel currents throughPKC1 recorded from an inside-out patch at different mem-brane voltages. The two-state reaction-kinetic model was fit-ted to data obtained from four patches with 1220/50 K}, andthe result is displayed in Figure 2 (bottom). The sigmoidalcurve intersects the voltage axis at V1=0 = -40 mV. This isclose to EK (-38 mV) and far from ECI (39 mV), indicating ahigh selectivity for K+ over CI-. Gmax was 44 pS at -65 mV.This demonstrates inward rectification of the open-channelcurrents, despite the outward K+ concentration gradient. On
Figure 2. Voltage dependence of single PKC1 currents across an
inside-out patch. Conditions were 1220/50 K}. Top, Single-channelrecordings. --, Closed-channel current. Filter frequency = 500 Hz.Bottom, Open-channel I-V plot for PKC1 with fit of two-state reactionkinetic model (solid curve). Each symbol represents data from a
separate patch. Original recordings shown (top) are from the experi-ment marked by 0 in the bottom panel. Parameters (x 106 s-1) forthe fitted curve (Eq. 1 ) are ki, = 75, koi = 8.4, Kjo = 19, Ko, = 38.
Vm/mV 80ms
40 A.1AA 1 J4PAi'# 44!',,, 4),*o,J l, ,A--
30 WJ*C'4 W Vy,04l1N --
-100 ' m C
-120'1t 1^l t r_3- -
10/pA 5
EoogS_&0 0
/ Vm/mV
-150 50 150
-2.5,-o
-5
98 SPALDING ET AL.
Dow
nloaded from https://academ
ic.oup.com/plphys/article/99/1/96/6088236 by guest on 15 February 2022

ION CHANNELS IN ARABIDOPSIS PLASMA MEMBRANE
the basis of conductance (data not shown), the light-inducedchannel currents shown in Figure 1B probably correspond toPKC 1. High selectivity of PKC1 for K+ over Na+ is demon-strated by Figure 3. In 1250/50 K} the reversal voltage was-40 mV (EK= -41 mV) and in 1200 Na + 50 K/50 K} itwas 3 mV (EK = 0, if differences in activity coefficients arenot considered). No positive currents could be detected afterthe K+ on the cytoplasmic side was completely replaced withNa+, even at Vm = 120 mV. The single-channel traces shownin Figure 3, top left inset, were obtained with 1 ,M cytoplasmicfree Ca2`.
Plasma Membrane K+ channel, PKC2
Figure 4 (top) displays sample recordings ofPKC2 currentsat several voltages. The curve in Figure 4 (bottom) wasobtained by fitting the two-state model (Eq. 1) to data fromthree patches in 1220/50 K}. The currents reverse sign at -40mV (compare with EK = -38 mV), indicating that PKC2does not transport Cl- at detectable rates. PKC2 differs fromPKC1 in that Gmax (66 pS) occurs at Vm = 60 mV in 1220/50K}; thus, the open channel is an outward rectifier. This featureand a lower P0 when VJm was more negative than EK (data notshown) produce a strong outward rectification in the timeaverage. The selectivity of PKC2 for K+ over Na+ is demon-strated in Figure 5 (one of three equivalent experiments) byshowing a progressive reduction in IO as the 220 mm K+ inthe bath was replaced by 220 mM Na+ (top four continuoustraces). After the Na+ was replaced with K+ (bottom trace), I,returned to its original amplitude. One of the two channels inthe patch apparently lost activity during exposure to Na+.
10/pA r5120 _71J hm Ar?^
20
Vm/mV
-150/ i
/A' -2.5-
-5
-O.-o- a-0-
~- -50 150
-100
4--1 20d4L~M-120
0.5s l
Figure 3. Selectivity of PKC1 for K+ over Na+ as demonstrated by I-
V analysis under different conditions: 0 and O, (250/50 K); O and A,(200 Na + 50 K/50 K); V, (250 Na/50 K); all with 10 mm cytoplasmicside Ca2+ except O, which was 1 uM Ca2'. 0, El, and V were fromthe same patch. Insets, Examples of single-channel recordings in1250/50 K} with 1 gM Ca2+ (top left) and 10 mm Ca2+ (bottom right)on the cytoplasmic side. Parameters (x 106 s-1, except k%31: x 106S-1 M-1) for the fitted curves (Eq. 2) are k,2 = 1 131; k2. = 12.5; k23 =75; k32 = 54.4; k°31 = 162.5; k,3 = 1000. The curve through the 1 JiMCa2+ I-V data was obtained by multiplying these parameters by 1.2.
Figure 4. Voltage dependence of single PKC2 currents across aninside-out patch with 1220/50 K}. Top, Single channel recordings.--, Closed-channel current. Filter frequency = 500 Hz. Bottom,Open-channel I-V plot for PKC2 with fit of two-state reaction kineticmodel (solid curve) to data from three separate patches. Originalrecordings shown (top) are from the experiment marked by Theparameters (x 106 s-1) of the fitted curve (Eq. 1) are ki, = 22; k1 =
50; K,o = 70; Ko = 6.8.
Plasma Membrane Cation Channel, PCC1
Examples of current recordings from a third type ofchannelare shown in Figure 6 (top). A synopsis of I-V data for thischannel (Fig. 6, bottom) shows V1=0 = -40 mV (EK= -41mV) whether the bath contained 250 mm K+ or 250 mm Na+.Gmax (at VI/r = 55 mV) under these two conditions was 109and 92 pS, respectively. Figure 6 (bottom) shows that reducingcytoplasmic-side Ca2, from 10 to 0.1 mm increased IO byapproximately 50% in a voltage-independent manner. Thenonselectivity of PCC 1 was observed in all of four tests.
Effects of Reductants
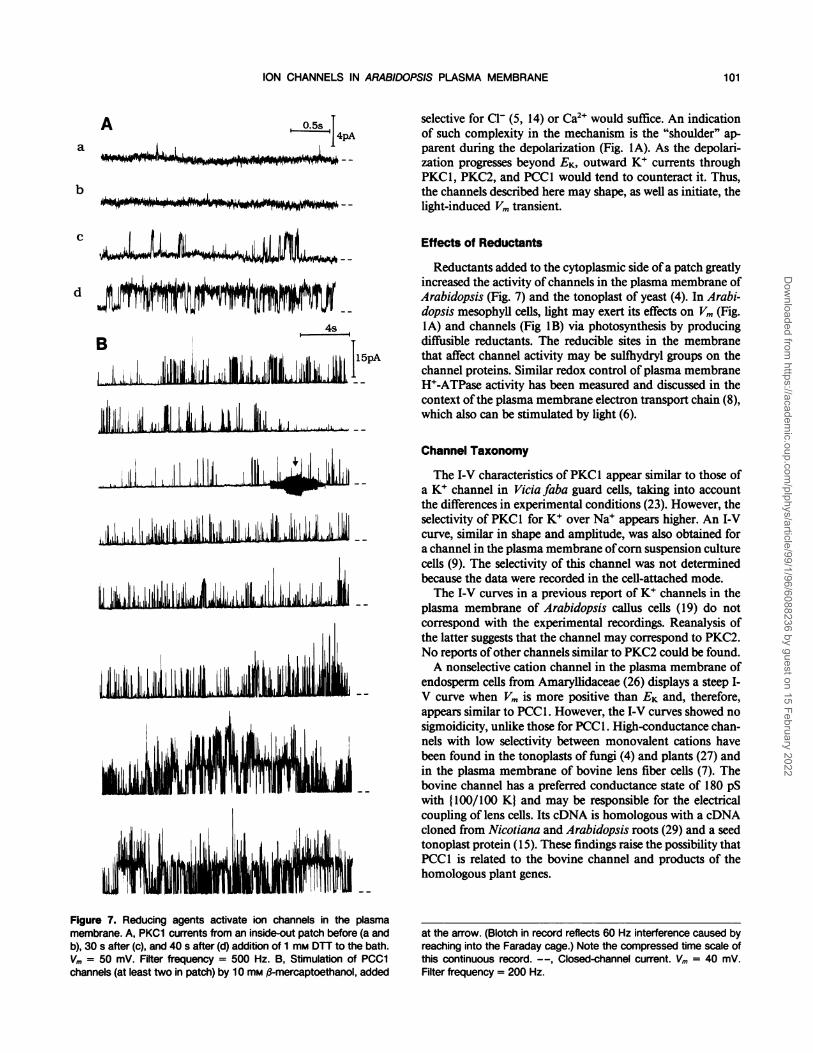
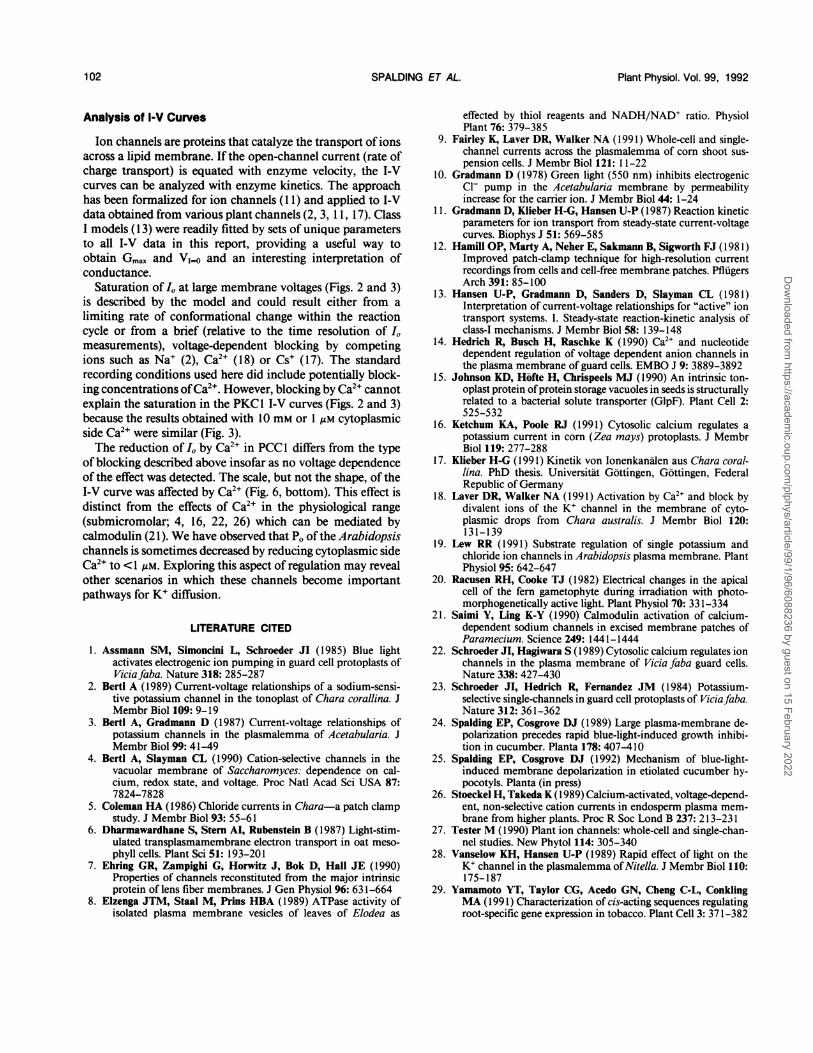
Figure 7 shows the effects of reductants on PKC1 (A) andPCC1 (B) channels. The traces in Figure 7A are each 3-s
Vm/mV 80ms
3 C~~~~~~~~fE4PA
20 --
10 *4 - -
-10 _ - -
-80 -
I./pA
15050
-5
I -
99
Dow
nloaded from https://academ
ic.oup.com/plphys/article/99/1/96/6088236 by guest on 15 February 2022

Plant Physiol. Vol. 99, 1992
0.5s
I l 11i
Figure 5. Selectivity of PKC2 demonstrated by replacing the 220mM K+ in the bath with 220 mm Na+. Open-channel amplitude (I.) ofboth channels in the patch decreased progressively to nondetectablelevels as the cytoplasmic-side K+ was replaced by Na+ (top fourcontinuous traces). Original IO was observed after changing the bathback to 220 mm K+ (bottom trace, not continuous with previous).--, Closed-channel current. Vm = 30 mV. Filter frequency = 500 Hz.
segments of recordings obtained from the same inside-outpatch before (a and b) and after (c and d) treatment with 1
mM DTT. Figure 7B is a continuous record (note compressedtime scale) showing increased activity ofPCCl induced by 10
mM ,3-mercaptoethanol. Both reducing agents were capableofstimulating the activity of all three channel types. However,they often lowered seal resistance, precluding measurementof channel stimulation. A related observation was that gi-gaohm seals were very difficult to obtain using protoplastspretreated with reducing agents.Whether PO was high or low, the mean open times (for all
three channel types) were in the range of tens of milliseconds.Thus, changes in P0 induced by light or reductants appearedto reflect changes in the durations of the closed states.
DISCUSSION
Light-Related Changes in Vm
Activation of K+ channels by light (Fig. I B) could depolar-ize the membrane as far as EK, but the light-induced depolar-izations in situ probably proceed beyond this point (Fig. IA).Therefore, activation of a conductance having a reversalvoltage more positive than EK must also occur. Channels
Figure 6. Nonselectivity, voltage dependence, and inhibition by Ca2+of PCC1. Top, Conditions were (250 K + 10 Ca/50 K). --, Closed-channel current. Filter frequency = 500 Hz. Bottom, Open-channelI-V plots for PCC1 under the following conditions: A, (250 K + 10Ca/50 K); B, (250 Na + 10 Ca/50 K); C, (250 K + 0.1 Ca/50 K).Original recordings shown (top) are from 0. The two-state reactionkinetic model (Eq. 1) was fit to I-V data in A (solid curve) with thefollowing parameters (x 106 s1): k, = 44; ko= 42; Kxo= 120; Kd= 25.The solid curves in B and C were obtained by multiplying theparameters by 0.85 and 1.5, respectively.
Vm/mV ,80ms,
80 15JiSPA
60 1
40 l i
20 LL%Ut= -
-10 _ -
-80 ; - -
10/pA -15 c A
0 l0
10 /*0
o
-150 *,-~5 0 Vm/m
1.1Now -AL LiL-ii.L AwLa&--im-ALJmLhi&.- -.",A Aux rr
100 SPALDING ET AL.
1. I 11 .1 II .l
Dow
nloaded from https://academ
ic.oup.com/plphys/article/99/1/96/6088236 by guest on 15 February 2022
ION CHANNELS IN ARABIDOPSIS PLASMA MEMBRANE
A 0.45S
r..;:41- -LW i'rJ.L
117 ~ t;$2*~~,-; ;';--2-I,2r ,;?; ~ -
c
4s
1. d. I I I ill iLI ||la ,, IAl l IU ii L
A&JILdLkILLiLLALLIJLi.A --
I11 i,,
selective for Cl- (5, 14) or Ca2" would suffice. An indicationof such complexity in the mechanism is the "shoulder" ap-parent during the depolarization (Fig. IA). As the depolari-zation progresses beyond EK, outward K+ currents throughPKC1, PKC2, and PCC1 would tend to counteract it. Thus,the channels described here may shape, as well as initiate, thelight-induced Vm transient.
Effects of Reductants
Reductants added to the cytoplasmic side ofa patch greatlyincreased the activity of channels in the plasma membrane ofArabidopsis (Fig. 7) and the tonoplast of yeast (4). In Arabi-dopsis mesophyll cells, light may exert its effects on Vm (Fig.IA) and channels (Fig 1B) via photosynthesis by producingdiffusible reductants. The reducible sites in the membranethat affect channel activity may be sulfhydryl groups on thechannel proteins. Similar redox control of plasma membraneH+-ATPase activity has been measured and discussed in thecontext of the plasma membrane electron transport chain (8),which also can be stimulated by light (6).
Channel Taxonomy
The I-V characteristics of PKCl appear similar to those ofa K+ channel in Vicia faba guard cells, taking into accountthe differences in experimental conditions (23). However, theselectivity of PKCl for K+ over Na+ appears higher. An I-Vcurve, similar in shape and amplitude, was also obtained fora channel in the plasma membrane ofcorn suspension culturecells (9). The selectivity of this channel was not determinedbecause the data were recorded in the cell-attached mode.The I-V curves in a previous report of K+ channels in the
plasma membrane of Arabidopsis callus cells (19) do notcorrespond with the experimental recordings. Reanalysis ofthe latter suggests that the channel may correspond to PKC2.No reports of other channels similar to PKC2 could be found.A nonselective cation channel in the plasma membrane of
endosperm cells from Amaryllidaceae (26) displays a steep I-V curve when Vm is more positive than EK and, therefore,appears similar to PCC1. However, the I-V curves showed nosigmoidicity, unlike those for PCC1. High-conductance chan-nels with low selectivity between monovalent cations havebeen found in the tonoplasts of fungi (4) and plants (27) andin the plasma membrane of bovine lens fiber cells (7). Thebovine channel has a preferred conductance state of 180 pSwith $100/100 K) and may be responsible for the electricalcoupling of lens cells. Its cDNA is homologous with a cDNAcloned from Nicotiana and Arabidopsis roots (29) and a seedtonoplast protein (15). These findings raise the possibility thatPCC1 is related to the bovine channel and products of thehomologous plant genes.
Figure 7. Reducing agents activate ion channels in the plasmamembrane. A, PKC1 currents from an inside-out patch before (a andb), 30 s after (c), and 40 s after (d) addition of 1 mm DTT to the bath.Vm = 50 mV. Filter frequency = 500 Hz. B, Stimulation of PCC1channels (at least two in patch) by 10 mm #-mercaptoethanol, added
at the arrow. (Blotch in record reflects 60 Hz interference caused byreaching into the Faraday cage.) Note the compressed time scale ofthis continuous record. --, Closed-channel current. Vm = 40 mV.Filter frequency = 200 Hz.
a
b
.. 11, i [ ..J,
1111 11 11 [III III II .A li
JU I', 'I LIl , I Ij I J 1.111 LI
AL
101
Dow
nloaded from https://academ
ic.oup.com/plphys/article/99/1/96/6088236 by guest on 15 February 2022
Plant Physiol. Vol. 99, 1992
Analysis of I-V Curves
Ion channels are proteins that catalyze the transport of ionsacross a lipid membrane. If the open-channel current (rate ofcharge transport) is equated with enzyme velocity, the I-Vcurves can be analyzed with enzyme kinetics. The approachhas been formalized for ion channels ( 11) and applied to I-Vdata obtained from various plant channels (2, 3, 11, 17). ClassI models (13) were readily fitted by sets of unique parametersto all I-V data in this report, providing a useful way toobtain Gmax and V1=o and an interesting interpretation ofconductance.
Saturation of I, at large membrane voltages (Figs. 2 and 3)is described by the model and could result either from alimiting rate of conformational change within the reactioncycle or from a brief (relative to the time resolution of IO,measurements), voltage-dependent blocking by competingions such as Na+ (2), Ca2+ (18) or Cs' (17). The standardrecording conditions used here did include potentially block-ing concentrations ofCa2+. However, blocking by Ca2+ cannotexplain the saturation in the PKC 1 I-V curves (Figs. 2 and 3)because the results obtained with 10 mm or 1 ,uM cytoplasmicside Ca2+ were similar (Fig. 3).The reduction of I, by Ca2+ in PCC 1 differs from the type
of blocking described above insofar as no voltage dependenceof the effect was detected. The scale, but not the shape, of theI-V curve was affected by Ca2+ (Fig. 6, bottom). This effect isdistinct from the effects of Ca2+ in the physiological range(submicromolar; 4, 16, 22, 26) which can be mediated bycalmodulin (21). We have observed that P0 ofthe Arabidopsischannels is sometimes decreased by reducing cytoplasmic sideCa2+ to <1 juM. Exploring this aspect of regulation may revealother scenarios in which these channels become importantpathways for K+ diffusion.
LITERATURE CITED
1. Assmann SM, Simoncini L, Schroeder JI (1985) Blue lightactivates electrogenic ion pumping in guard cell protoplasts ofViciafaba. Nature 318: 285-287
2. Berti A (1989) Current-voltage relationships of a sodium-sensi-tive potassium channel in the tonoplast of Chara corallina. JMembr Biol 109: 9-19
3. Berti A, Gradmann D (1987) Current-voltage relationships ofpotassium channels in the plasmalemma of Acetabularia. JMembr Biol 99: 41-49
4. Bertl A, Slayman CL (1990) Cation-selective channels in thevacuolar membrane of Saccharomyces: dependence on cal-cium, redox state, and voltage. Proc Natl Acad Sci USA 87:7824-7828
5. Coleman HA (1986) Chloride currents in Chara-a patch clampstudy. J Membr Biol 93: 55-61
6. Dharmawardhane S, Stern Al, Rubenstein B (1987) Light-stim-ulated transplasmamembrane electron transport in oat meso-phyll cells. Plant Sci 51: 193-201
7. Ehring GR, Zampighi G, Horwitz J, Bok D, Hall JE (1990)Properties of channels reconstituted from the major intrinsicprotein of lens fiber membranes. J Gen Physiol 96: 631-664
8. Elzenga JTM, Staal M, Prins HBA (1989) ATPase activity ofisolated plasma membrane vesicles of leaves of Elodea as
effected by thiol reagents and NADH/NAD+ ratio. PhysiolPlant 76: 379-385
9. Fairley K, Laver DR, Walker NA (1991) Whole-cell and single-channel currents across the plasmalemma of corn shoot sus-pension cells. J Membr Biol 121: 11-22
10. Gradmann D (1978) Green light (550 nm) inhibits electrogenicCl- pump in the Acetabularia membrane by permeabilityincrease for the carrier ion. J Membr Biol 44: 1-24
11. Gradmann D, Klieber H-G, Hansen U-P (1987) Reaction kineticparameters for ion transport from steady-state current-voltagecurves. Biophys J 51: 569-585
12. Hamill OP, Marty A, Neher E, Sakmann B, Sigworth FJ (1981)Improved patch-clamp technique for high-resolution currentrecordings from cells and cell-free membrane patches. PflugersArch 391: 85-100
13. Hansen U-P, Gradmann D, Sanders D, Slayman CL (1981)Interpretation of current-voltage relationships for "active" iontransport systems. I. Steady-state reaction-kinetic analysis ofclass-I mechanisms. J Membr Biol 58: 139-148
14. Hedrich R, Busch H, Raschke K (1990) Ca2" and nucleotidedependent regulation of voltage dependent anion channels inthe plasma membrane of guard cells. EMBO J 9: 3889-3892
15. Johnson KD, Hofte H, Chrispeels MJ (1990) An intrinsic ton-oplast protein ofprotein storage vacuoles in seeds is structurallyrelated to a bacterial solute transporter (GlpF). Plant Cell 2:525-532
16. Ketchum KA, Poole RJ (1991) Cytosolic calcium regulates apotassium current in corn (Zea mays) protoplasts. J MembrBiol 119: 277-288
17. Klieber H-G (1991) Kinetik von lonenkan31en aus Chara coral-lina. PhD thesis. Universitat Gottingen, Gottingen, FederalRepublic of Germany
18. Laver DR, Walker NA (1991) Activation by Ca2" and block bydivalent ions of the K+ channel in the membrane of cyto-plasmic drops from Chara australis. J Membr Biol 120:131-139
19. Lew RR (1991) Substrate regulation of single potassium andchloride ion channels in Arabidopsis plasma membrane. PlantPhysiol 95: 642-647
20. Racusen RH, Cooke TJ (1982) Electrical changes in the apicalcell of the fern gametophyte during irradiation with photo-morphogenetically active light. Plant Physiol 70: 331-334
21. Saimi Y, Ling K-Y (1990) Calmodulin activation of calcium-dependent sodium channels in excised membrane patches ofParamecium. Science 249: 1441-1444
22. Schroeder JI, Hagiwara S (1989) Cytosolic calcium regulates ionchannels in the plasma membrane of Vicia faba guard cells.Nature 338: 427-430
23. Schroeder JI, Hedrich R, Fernandez JM (1984) Potassium-selective single-channels in guard cell protoplasts of Viciafaba.Nature 312: 361-362
24. Spalding EP, Cosgrove DJ (1989) Large plasma-membrane de-polarization precedes rapid blue-light-induced growth inhibi-tion in cucumber. Planta 178: 407-4 10
25. Spalding EP, Cosgrove DJ (1992) Mechanism of blue-light-induced membrane depolarization in etiolated cucumber hy-pocotyls. Planta (in press)
26. Stoeckel H, Takeda K (1989) Calcium-activated, voltage-depend-ent, non-selective cation currents in endosperm plasma mem-brane from higher plants. Proc R Soc Lond B 237: 213-231
27. Tester M (1990) Plant ion channels: whole-cell and single-chan-nel studies. New Phytol 114: 305-340
28. Vanselow KH, Hansen U-P (1989) Rapid effect of light on theKN channel in the plasmalemma of Nitella. J Membr Biol 110:175-187
29. Yamamoto YT, Taylor CG, Acedo GN, Cheng C-L, ConklingMA (1991) Characterization of cis-acting sequences regulatingroot-specific gene expression in tobacco. Plant Cell 3: 371-382
102 SPALDING ET AL.
Dow
nloaded from https://academ
ic.oup.com/plphys/article/99/1/96/6088236 by guest on 15 February 2022