ION BEAM DEPOSITION OF NITROGEN DOPED DIAMOND-LIKE CARBON...
86
ION BEAM DEPOSITION OF NITROGEN DOPED DIAMOND-LIKE CARBON THIN FILMS FOR ENHANCED BIOLOGICAL PROPERTIES A Thesis Submitted to the College of Graduate Studies and Research In Partial Fulfillment of the Requirements For the Degree of Master of Science In the Department of Mechanical Engineering University of Saskatchewan Saskatoon By SRINIVASAN SETHURAMAN © Copyright Srinivasan Sethuraman August 2009. All rights reserved.
Transcript of ION BEAM DEPOSITION OF NITROGEN DOPED DIAMOND-LIKE CARBON...

ION BEAM DEPOSITION OF NITROGEN DOPED DIAMOND-LIKE CARBON THIN
FILMS FOR ENHANCED BIOLOGICAL PROPERTIES
A Thesis Submitted to the College of
Graduate Studies and Research
In Partial Fulfillment of the Requirements
For the Degree of Master of Science
In the Department of Mechanical Engineering
University of Saskatchewan
Saskatoon
By
SRINIVASAN SETHURAMAN
© Copyright Srinivasan Sethuraman August 2009. All rights reserved.

i
Permission to Use
In presenting this thesis in partial fulfillment of the requirements for a Postgraduate degree from
the University of Saskatchewan, I agree that the Libraries of this University may make it freely
available for inspection. I further agree that permission for copying of this thesis in any manner,
in whole or in part, for scholarly purposes may be granted by the professor (Dr. Qiaoqin Yang)
who supervised my thesis work or, in her absence, by the Head of the Department or the Dean of
the College in which my thesis work was done. It is understood that any copying or publication
or use of this thesis or parts thereof for financial gain shall not be allowed without my written
permission. It is also understood that due recognition shall be given to me and to the University
of Saskatchewan in any scholarly use which may be made of any material in my thesis.
Requests for permission to copy or to make other use of material in this thesis in whole or part
should be addressed to:
Head of the Department of Mechanical Engineering
Department of Mechanical Engineering
University of Saskatchewan
57 Campus Drive
Saskatoon, Saskatchewan.
Canada. S7N 5A9.

ii
ABSTRACT
Artificial cardiovascular implants are now made mainly from extruded polytetrafluroethylene
(PTFE). However, the limited haemocompatibility of PTFE causes blood clotting and results in
early replacement. Many techniques are being developed to improve the haemocompatibility of
such devices. One of the most promising techniques is to coat the devices with nitrogen-doped
diamond-like carbon (NDLC) thin films. However, the structure of NDLC and its effect on the
haemocompatibility of the coated devices have not been fully investigated as required for
practical applications. In this thesis, ion beam deposited DLC and Nitrogen doped thin films on
PTFE were investigated in order to have a better understanding of the relationships between the
structure and biomedical properties of the DLC thin films.
DLC and NDLC thin films were synthesized using ion beam deposition. Commercially available
PTFE sheets, which are similar to the material used for vascular grafts, were used as substrates
for the DLC thin films. Silicon wafers were also utilized as substrates for condition optimization
and property comparison. Raman spectroscopy, atomic force microscopy, X-ray photo emission
spectroscopy and scanning electron microscopy were used to study the structural and
morphological properties of the coated surface. The results show that the ion beam deposited thin
films have a very smooth surface and exhibit low coefficient of friction and high adhesion to the
substrate. Low concentration of nitrogen doping in DLC improved surface hardness and reduced
surface roughness. Higher concentration of sp3 hybridized bonds was observed in the DLC thin
films on Si than those on PTFE. DLC coating decreased the surface energy and improved the
wettability of PTFE films.

iii
The haemocompatibility of the pristine and DLC coated PTFE sheets were evaluated by platelet
adhesion technique. The platelet adhesion results showed that the haemocompatibility of DLC
coated PTFE, especially NDLC coated PTFE, was considerably improved as compared with
uncoated PTFE. SEM observations showed that the platelet reaction on the coated PTFE was
minimized as the platelets were much less aggregated and activated.

iv
ACKNOWLEDGEMENTS
I would like to thank Dr. Qiaoqin Yang for giving me the exciting opportunity to carry out this
research at the University of Saskatchewan and directing and supervising my work throughout
this period of my career. Also, I would like to thank Dr. Thomas Haas, without whom this work
would not have been possible. Thanks to Dr. Chris Zhang and Dr. Ike Oguocha who offered
many useful pieces of advice and discussions. The training and assistance provided by J. Maley
at the Saskatchewan Structural Science Center was valuable for the success of this project.
The author’s final acknowledgement and his sincere appreciation go to his wife, daughter,
parents, and in-laws for their constant support and encouragement.
The research was funded by Natural Sciences and Engineering Research Council of Canada
(NSERC), Canada Research Chair program and a grant from Canada Foundation for Innovation
(CFI).

v
DEDICATION
This work is dedicated to my wife Saradha Srinivasan, daughter Shweta Srinivasan
&
beloved parents Vijayalakshmi and Sethuraman.

vi
TABLE OF CONTENTS
PERMISSION TO USE……. ……………………………………………………………………..i
ABSTRACT….……….………………………………………………………………………......ii
ACKNOWLEDGEMENTS….…………………………………………………………………..iv
DEDICATION…….. ………………………………………………………………………….....v
TABLE OF CONTENTS…... ………………………………………………………………........vi
LIST OF TABLES…. …………………………………………………………………………....ix
LIST OF FIGURES... ……………………………………………………………………...…......x
LIST OF ABBREVIATIONS …….. ……………………………………………………..…....xiii
1. INTRODUCTION……...……………………………………………………..…………..1
1.1. Motivation ............................................................................................................................ 1
1.2. Objective .............................................................................................................................. 3
1.3. Organization of thesis ........................................................................................................... 3
2. LITERATURE REVIEW……...………………………………………………………….4
2.1. Structure, property and growth of diamond-like carbon thin films ..................................... 4
2.1.1. Hybridization and allotropes of carbon ........................................................................ 4
2.1.2. Structure and properties of diamond-like carbon ......................................................... 6
2.1.3. Deposition of diamond-like carbon thin films ........................................................... 11
2.1.4. Formation process of diamond-like carbon thin films ................................................ 14
2.1.5. Diamond-like carbon thin films on Polytetrafluroethylene ........................................ 20
2.2. Structural characterization of diamond-like carbon thin films .......................................... 22

vii
2.2.1. Raman spectroscopy ................................................................................................... 22
2.2.2. Scanning electron microscopy and Atomic force microscopy .................................... 25
2.2.3. X-ray photo emission spectroscopy ........................................................................... 28
2.3. Property characterization of diamond-like carbon thin films ............................................ 29
2.3.1. Mechanical properties ................................................................................................ 29
2.3.2. Wettability and contact angle ...................................................................................... 31
2.3.3. Haemocompatibility ................................................................................................... .32
3. EXPERIMENTAL METHODS…….…………………………………………………...35
3.1. Ion beam deposition of diamond-like carbon thin films .................................................... 35
3.2. Structural characterization .................................................................................................. 38
3.3. Mechanical property characterization ................................................................................ 40
3.4. X-ray photoemission spectroscopy .................................................................................... 42
3.5. Haemocompatibility testing ............................................................................................... 43
4. RESULTS AND DISCUSSIONS….. …………………………………………………...44
4.1. Raman spectra .................................................................................................................... 44
4.2. SEM and AFM observation ................................................................................................ 47
4.3. XPS surface characterization ............................................................................................. 50
4.4. Mechanical properties ........................................................................................................ 54
4.5. Surface energy .................................................................................................................... 56
4.6. Biocompatibility ................................................................................................................. 60
4.6.1 Platelet adsorption and activation…………………………………………..………....60

viii
5. CONCLUSIONS AND FUTURE WORK… …………………………………………...65
REFERENCES……........………………………………………………………………………..67

ix
LIST OF TABLES
Table 2.1. Properties of various forms of carbon
Table 2.2. Range of DLC structure, composition and properties
Table 3.1. Deposition parameters on Si (100)
Table 3.2. Deposition parameters on PTFE
Table 4.1. Elemental composition based on XPS analysis
Table 4.2. Contact angle and surface energy of DLC coatings
Table 4.3. Summary of platelets adsorbed

x
LIST OF FIGURES
Figure 2.1. Bonding configurations of carbon atom
Figure 2.2. Carbon allotropes
Figure 2.3. 2-D representation of diamond-like carbon film structure
Figure 2.4. Ternary phase diagram showing various forms of DLC
Figure 2.5. Atom number density vs. atom fraction of hydrogen
Figure 2.6. Carbon-Nitrogen bonding configurations
Figure 2.7. (a) Ion beam assisted EB-evaporation; (b) Ion beam assisted ion beam sputtering; (c)
Ion beam assisted dual ion beam sputtering; (d) Ion source.
Figure 2.8. Effect of energetic ion flux on surface atoms
Figure 2.9. Penetration, relaxation and knock-on
Figure 2.10. Kaufman type gridded ion source
Figure 2.11. Ion beam energy and compressive stresses
Figure 2.12. PTFE molecules
Figure 2.13. Raman energy levels
Figure 2.14. Raman spectra of carbon materials
Figure 2.15. Operation of SEM
Figure 2.16. Atomic force microscope operation
Figure 2.17. Atomic sub shell photoionization cross-sections for carbon and nitrogen

xi
Figure 2.18. Loading – unloading curve of nanoindentation
Figure 2.19. Human blood cells (Erythrocyte, Thrombocytes and Leukocytes)
Figure 3.1. Ion-beam deposition system
Figure 3.2. Raman spectroscope – Renishaw model 2000
Figure 3.3. Scanning electron microscope – Hitachi S3000N
Figure 3.4. Atomic force microscope
Figure 3.5. UMT Nanohardness tester
Figure 3.6. Scratch test
Figure 4.1. Raman spectra of DLC on Si
Figure 4.2. Raman spectra of Nitrogen doped DLC on Si
Figure 4.3. Raman spectra of DLC on PTFE
Figure 4.4. Raman spectra of Nitrogen doped DLC on PTFE
Figure 4.5. SEM image of DLC
Figure 4.6. AFM image of virgin PTFE
Figure 4.7. AFM image of DLC coated PTFE
Figure 4.8. AFM image of NDLC coated PTFE
Figure 4.9. XPS spectrum of NDLC film
Figure 4.10. XPS spectrum of C 1s in NDLC
Figure 4.11. XPS spectrum of N 1s in NDLC

xii
Figure 4.12. XPS spectrum of Si 2p coated with NDLC
Figure 4.13. Nanohardness of DLC and NDLC
Figure 4.14. Young’s modulus of DLC and NDLC
Figure 4.15. Coefficient of friction of thin films
Figure 4.16. Critical load of thin films
Figure 4.17. Contact angles of various conditions of PTFE
Figure 4.18. Results of radio labelled platelet adsorption
Figure 4.19. Platelets on bare PTFE
Figure 4.19a. Platelet activated on bare PTFE
Figure 4.20. Platelets on DLC coated PTFE
Figure 4.21. Platelets on nitrogen-doped DLC coated PTFE

xiii
LIST OF ABBREVIATIONS
a-C – Amorphous carbon
a-CN – Amorphous carbon doped with nitrogen
C-N – Carbon nitride films
AFM – Atomic force microscopy
PVD – Physical vapor deposition
COF – Coefficient of friction
CVD – Chemical vapor deposition
CLS – Canadian Light Source
DC – Direct current
DLC – Diamond-like carbon
MSIB – Mass selected ion beam deposition
N-DLC – Nitrogen doped DLC
ePTFE – Expanded polytetrafluoroethylene
IBD – Ion beam deposition
IBAD – Ion Beam Assisted deposition
PTFE – Polytetrafluoroethylene
PLD – Pulsed laser deposition
RIPA – Relative index of platelet adsorption

xiv
SEM – Scanning electron microscopy
SGM – Sphercial Grating Monochromator
ta-C – Tetrahedraly-bonded amorphous carbon
TFY – Total fluorescence yield
UMT – Universal Mechanical Tester
XPS – X ray photoelectron spectroscopy

1
CHAPTER 1
INTRODUCTION
1.1 Motivation
Diamond-like carbon (DLC) thin films exhibit many good properties such as high hardness, high
chemical inertness, high wear and corrosion resistance, excellent biocompatibility and very low
coefficient of friction, which make this material ideal as protective, corrosion resistant and anti-
wear coatings for a variety of applications including bearings, automotive components and
biomedical implants (Ali Erdemir et al., 2006). There has been keen interest in using various
forms of DLC as coatings on artificial hip joints, heart valves, stents and grafts due to their low
coefficient of friction and excellent biocompatibility (Geoffrey et al., 2005).
Synthesized vascular grafts are now made mainly from extruded polytetrafluroethylene (PTFE).
The artificial small-vessels constructed from PTFE are the only alternative to autologous
implants for more than 500,000 patients requiring coronary artery bypass surgery and more than
150,000 patients in need of lower limb surgical replacement operations. However, due to their
limited haemocompatibility, blood clotting caused by blood-cell adhesion to PTFE becomes a
serious problem when the diameter of vascular grafts made from PTFE is less than 6 mm
(Srinivasan et al., 2008). Thus, one of the most urgent problems to be resolved for wider
applications of PTFE vascular grafts, and to avoid the need for patients to undergo repetitive
surgery, is to improve heamocompatibility of PTFE-based prosthetic components.
2
DLC have been demonstrated to be biocompatible in vitro and in vivo in orthopedic applications.
Coating polymer- based biomedical devices such as blood vessels, heart valves, and coronary
stents with DLC thin films is expected to significantly improve their haemo, bio-compatibility,
tribological performance and lifetime (Narayan, 2005). However, DLC films are always
accompanied by a high internal compressive stress due to the ion bombardment during the
deposition, which limits their possible applications.
The study of nitrogen doped diamond-like carbon thin films was primarily focused on to
synthesize a new form of carbon nitride phase (cubic beta carbon nitride) as proposed by Liu and
Cohen, 1990. This phase exhibits higher hardness and bulk modulus than natural diamond. Apart
from this, most of the NDLC films deposited so far have been proven to be amorphous in
structure. The nitrogen incorporation into DLC in higher percentages has been found to form N-
H, C=N and C≡N bonds, which decrease the sp3 bonds, obstruct the carbon-carbon cross links
and form voids resulting in matrix of softer NDLC (Takadoum et al., 2003).
Silva et al., 1994 investigated the effects of nitrogen doping on properties of DLC films and
showed a clear reduction of the internal compressive stress without significant changes in other
properties upon nitrogen doping. Therefore, nitrogen-doped DLC (NDLC) films are more
promising to be used as coating on PTFE to improve its haemocompatibility. However, the
structure of NDLC and its effect on the haemocompatibility of the coated devices has not been
fully investigated as required for practical applications.

3
1.2 Objective
The objective of this work was to develop ion beam deposition process to synthesize NDLC thin
films on PTFE in order to enhance the haemocompatibility of artificial vascular graft made from
PTFE.
1.3 Organization of Thesis
The thesis consists of five chapters. Chapter 1 contains an overview of the research motivation
and research objectives. Chapter 2 gives a detailed literature review of the structure, the
properties, the deposition techniques, the characterization techniques, and the growth mechanism
of DLC thin films. Chapter 3 describes the experimental details regarding the deposition and
characterization of DLC thin films. The results and discussion of the studies, including the
bonding structure, the surface roughness, surface energy and surface morphology, mechanical
and biological properties of the coatings, are presented in chapter 4. Chapter 5 provides
conclusions drawn from the results, and suggestions for the future work.

4
CHAPTER 2
LITERATURE REVIEW
2.1 Structure, property and growth of diamond-like carbon thin films
2.1.1 Hybridization and allotropes of carbon
Pure carbon can form different allotropes in various bonding configurations as shown in Figure
2.1. Carbon atoms in diamond have sp3 hybridization and form four tetrahedral symmetric σ
bonds with each other. All carbon bonds are strong and equivalent in diamond. Carbon atoms in
graphite have sp2 hybridization and form trigonal planar configuration, containing both σ and π
bonds. The three planar bonds are strong and equivalent. Carbon atoms in many polymers have
sp1 hybridization and linear geometry, containing both σ and π bonds.
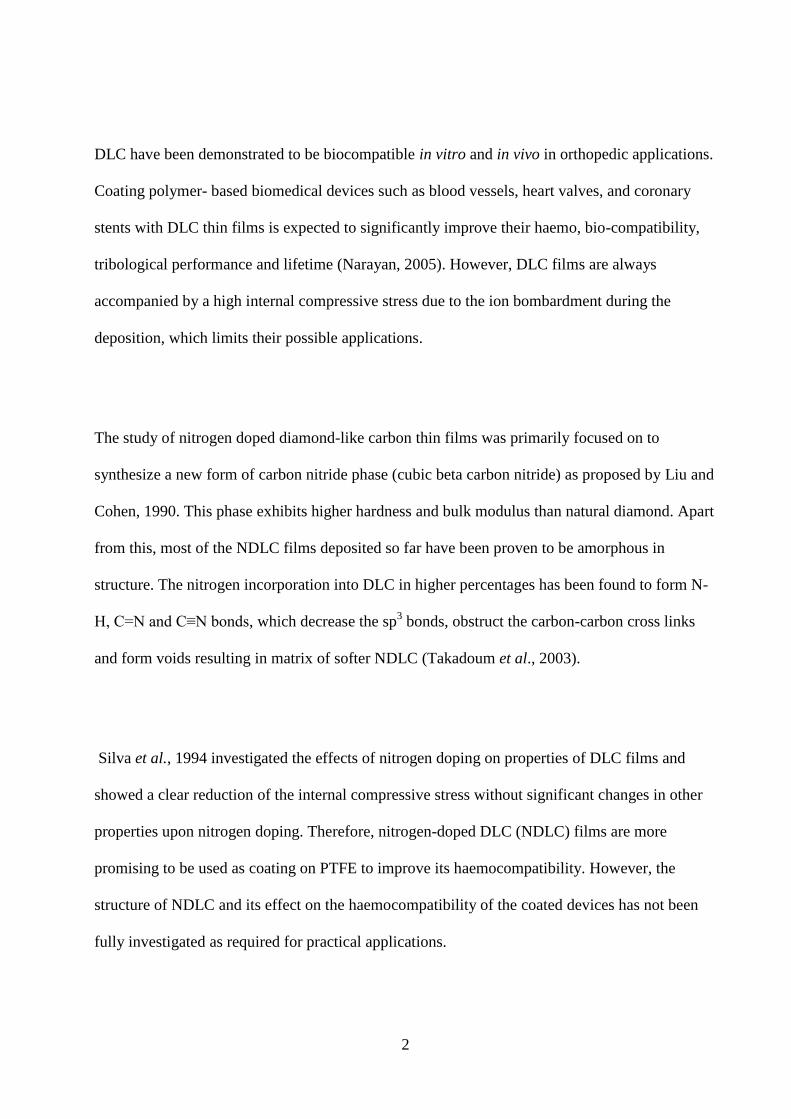
Pure carbon usually exists as crystalline structures including diamond and graphite. Carbon also
exists as amorphous and nanostructures including C60, carbon nanotubes. Diamond has face-
centered cubic crystal lattice as shown in Figure 2.2a. Graphite has hexagonal structure shown in
Figure 2.2b. C60 is a perfect ball consisting of sixty carbon atoms with hexagonal and
pentagonal rings linked together as shown in Figure 2.2c.
5
Figure 2.1. Bonding configurations of carbon atom (Robertson, 2002)
(a) Diamond (b) Graphite (c) C60
Figure 2.2. Carbon allotropes (Foursa, 2007)
Carbon atoms in amorphous carbon materials have no long-range order and may have different
hybridizations. Graphite-like amorphous carbon dominates with sp2-bonded carbon and exhibits
properties similar to graphite, whereas diamond-like carbon contains high amount of sp3 bonded
carbon and exhibits properties similar to diamond (Robertson, 1986). Properties exhibited by
various forms of carbon are listed in Table 2.1.

6
Table 2.1. Properties of various forms of carbon (Robertson, 2002)
Material Density
g/cm3
Band
gap(eV)
Hard
ness
(GPa)
sp3(%) H (%) Reference
Diamond 3.515 5.5 100 100 0 Field, 1993
Graphite 2.267 0.0 - 0 0 Kelly, 1981
Glassy carbon 1.3 - 1.55 0.01 3 0 0 Robertson, 1986
Evaporated C 1.9 0.4 - 0.7 3 0 0 Robertson, 1986
Sputtered C 2.2 0.5 1 5 0 Pharr et al., 1996
ta-C 3.1 2.5 80 80 - 88 0 Pharr et al., 1996
Hard a-C:H 1.6 - 2.2 1.1 - 1.7 10 - 20 40 30 - 40 Koidl et al., 1990
Soft a-C:H 1.2 - 1.6 1.7 - 4.0 <10 60 40 - 50 Koidl et al., 1990
ta-C:H 2.4 2.0 - 2.5 50 70 30 Weiler et al., 1994
2.1.2 Structure and properties of diamond-like carbon
DLC is an amorphous, metastable carbon with high content of sp3 hybridization. However, its
detailed structure has not been completely determined and various models have been proposed
with ambiguity in each of them. McKenzie et al., 1983 described DLC as nanocrystalline two-
phase structure consisting of polycyclic aromatic hydrocarbon interconnected by tetrahedral
carbon. Angus et al., 1991 proposed their model based on a random covalent network (RCN)
consisting of sp3 and sp
2 carbon sites and the ratio of this coordination is a function of atomic
fraction of hydrogen in film shown in Figure 2.3. As per Robertson, 1993 the structure of DLC is
a network of covalently bonded carbon atoms in different hybridization.

7
Figure 2.3. 2-D representation of diamond-like carbon film structure (Angus and Wang, 1991)
Amorphous carbon (a-C) and hydrogenated amorphous carbon (a-C:H) can be categorized into
different forms based on the content of hydrogen as shown in Figure 2.4. DLC films usually
contain high sp3 content and are termed tetrahedral amorphous carbon (ta-C) or diamond like
hydrogenated amorphous carbon (DLCH) or tetrahedral hydrogenated amorphous carbon (ta-
C:H), whereas films with low sp3 content are termed graphitic C or graphite like hydrogenated
carbon (GLCH).
Angus and Hayman, 1988 proposed a classification of hydrogenated amorphous carbon based on
the atom number density and hydrogen content as shown in Figure 2.5. DLC films (a-C:H and a-
C in Figure 2.5) have much higher atom number density than conventional polymers.

8
Figure 2.4. Ternary phase diagram showing various forms of DLC (Casiraghi, Ferrari and
Robertson, 2005)
Figure 2.5. Atom number density vs. atom fraction of hydrogen
(Angus and Hayman, 1988)
(Expressed in gram atom/cm3. Symbols used are, AC- oligomers of acetylene, AD- adaman-
tanes, AL –nalkanes, AM- amorphous carbon, AR – polynuclear aromatics, DI - diamond and
GR – graphite)
9
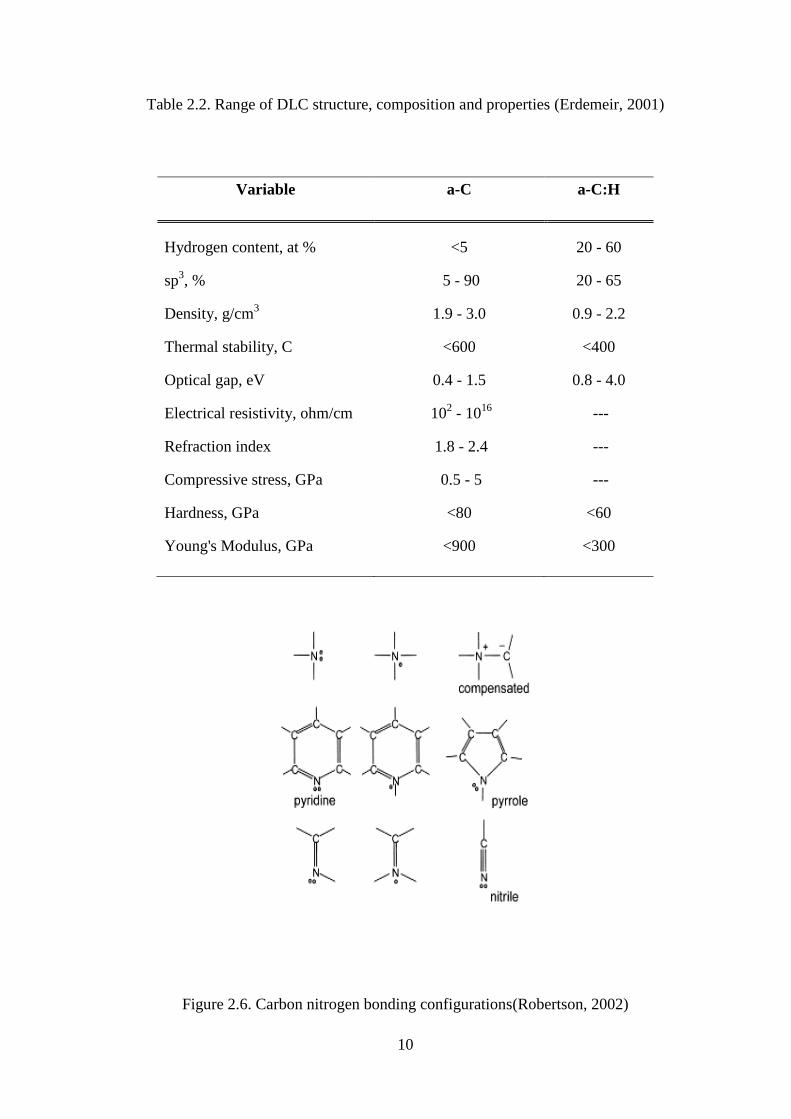
Table 2.2 illustrates the structure, composition and properties of a-C and a-C:H films. As the
hydrogen content increases in hydrogenated films, there is a decrease in hardness, Young’s
modulus, coefficient of friction, compressive stresses, density and refractive index.
DLC’s amorphous nature make it feasible to be doped with small amounts of different elements
like N, O, F, Si and their combinations to improve and control their mechanical, tribological and
biological properties.
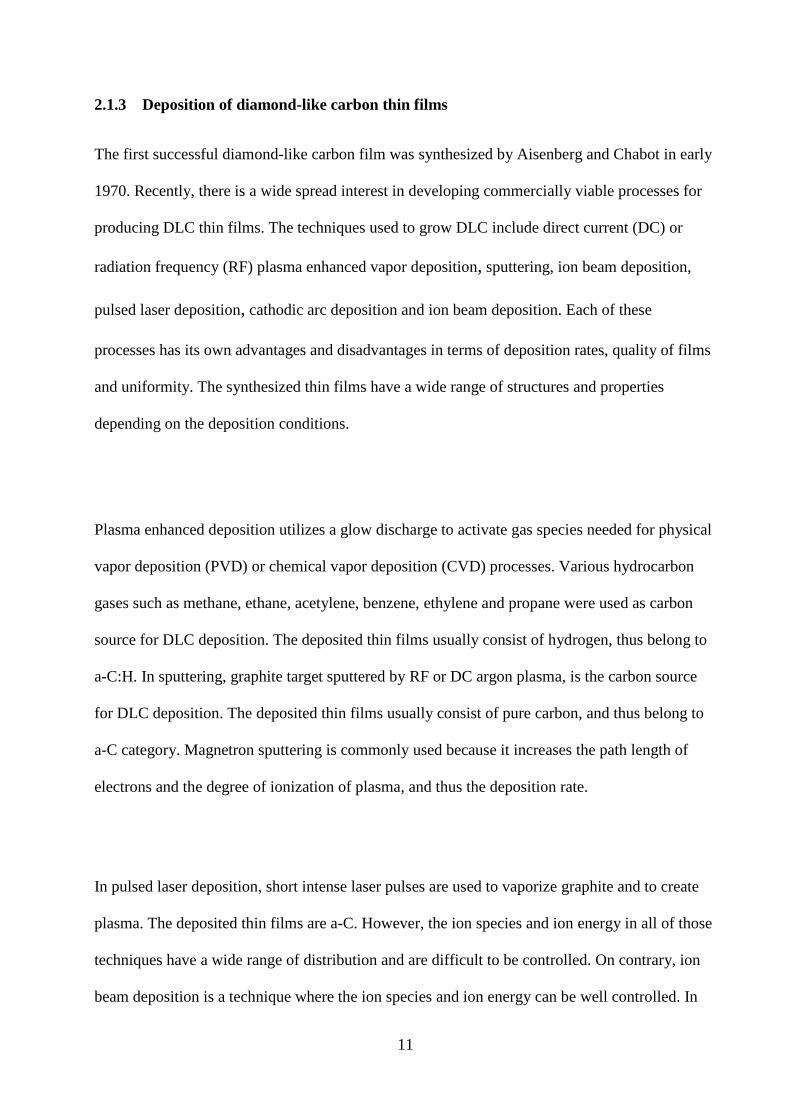
Efficiency of doping nitrogen (N) in DLC to form solid solution is very poor. N can take any
bonding configuration shown in Figure 2.6. N atoms can occupy sp3 substitutional sites or sp
2
substitutional sites as a result of doping. They can also form pyridine, pyrrole and nitrile instead
of forming solid solution.
The incorporation of nitrogen promotes the formation of pentagonal rings and facilitates cross-
linking between the planes (Hellgren et al., 1999), making the films highly elastically
deformable and thus improving the toughness of the films. N atoms incorporated into DLC may
also form N-H, C=N, C≡N bonds which decrease the sp3 carbon bond content, obstruct the
carbon-carbon links and form voids and result in softer a-C:H:N films (Kusano et al., 1998 ).
High concentration of N up to 34% has been reported to be doped into DLC and the doping
reduced the internal stresses without affecting the hardness and wear resistance (Koskinen et al.,
1996). However, the work that has been performed in this area is insufficient to develop an in-
depth understanding of the effect of nitrogen doping on the structure and properties of DLC.
10
Table 2.2. Range of DLC structure, composition and properties (Erdemeir, 2001)
Variable a-C a-C:H
Hydrogen content, at % <5 20 - 60
sp3, % 5 - 90 20 - 65
Density, g/cm3 1.9 - 3.0 0.9 - 2.2
Thermal stability, C <600 <400
Optical gap, eV 0.4 - 1.5 0.8 - 4.0
Electrical resistivity, ohm/cm 102 - 10
16 ---
Refraction index 1.8 - 2.4 ---
Compressive stress, GPa 0.5 - 5 ---
Hardness, GPa <80 <60
Young's Modulus, GPa <900 <300
Figure 2.6. Carbon nitrogen bonding configurations(Robertson, 2002)
11
2.1.3 Deposition of diamond-like carbon thin films
The first successful diamond-like carbon film was synthesized by Aisenberg and Chabot in early
1970. Recently, there is a wide spread interest in developing commercially viable processes for
producing DLC thin films. The techniques used to grow DLC include direct current (DC) or
radiation frequency (RF) plasma enhanced vapor deposition, sputtering, ion beam deposition,
pulsed laser deposition, cathodic arc deposition and ion beam deposition. Each of these
processes has its own advantages and disadvantages in terms of deposition rates, quality of films
and uniformity. The synthesized thin films have a wide range of structures and properties
depending on the deposition conditions.
Plasma enhanced deposition utilizes a glow discharge to activate gas species needed for physical
vapor deposition (PVD) or chemical vapor deposition (CVD) processes. Various hydrocarbon
gases such as methane, ethane, acetylene, benzene, ethylene and propane were used as carbon
source for DLC deposition. The deposited thin films usually consist of hydrogen, thus belong to
a-C:H. In sputtering, graphite target sputtered by RF or DC argon plasma, is the carbon source
for DLC deposition. The deposited thin films usually consist of pure carbon, and thus belong to
a-C category. Magnetron sputtering is commonly used because it increases the path length of
electrons and the degree of ionization of plasma, and thus the deposition rate.
In pulsed laser deposition, short intense laser pulses are used to vaporize graphite and to create
plasma. The deposited thin films are a-C. However, the ion species and ion energy in all of those
techniques have a wide range of distribution and are difficult to be controlled. On contrary, ion
beam deposition is a technique where the ion species and ion energy can be well controlled. In

12
this technique, the precursor’s carbon or hydrogenated carbon ions are extracted from the plasma
to form an ion beam, and are accelerated to desired ion energy toward substrate at high vacuum,
whereas neutrals are filtered and decelerated. This technique provides a highly controlled ion
species with controlled energy for DLC deposition, thus the structure and property of deposited
DLC thin films are well controlled. Therefore, the use of ion beams for DLC film deposition has
been expanding in the past decade.
Ion beam deposition is principally an ion implantation deposition, in which the energetic ion
bombardment is used to synthesize high quality films (Xiaoming He et al., 1996). There are
different types of ion beam deposition methods as shown in Figure 2.7. They use either solid
graphite targets or ionized hydrocarbon gases as carbon source.
As mentioned before, the main advantage of ion-beam deposition process is the high degree
control of DLC coating property as a result of the accurate control of critical parameters such as
gas flow rate, ion-beam energy and ion beam current. Ion beam deposition also allows for very
low temperature growth and simple fixturing. The equipment usually operates at very low
pressure, which reduces the potential film contamination. The main limitation with this method
is that the hardest films are obtained under conditions of low power and low gas pressure, which
results in low deposition rate.
High efficiency ion sources are often employed to make ion-substrate interaction to occur at low
pressures of 1*10-4
torr or less. Operation in high vacuum results in control over fluxes of
energetic ion species (Kaufman, 1990).

13
(a) (b)
(c) (d)
Figure 2.7. (a) Ion beam assisted EB-evaporation; (b) Ion beam assisted ion beam sputtering; (c)
Ion beam assisted dual ion beam sputtering; (d) Ion source (University of Cambridge-
eng.cam.ac.uk).

14
2.1.4 Formation processes and mechanisms of diamond-like carbon thin films
1eV of energy corresponds to a temperature of 11,606 K. The impact of ions may enhance
surface atom mobility, diffusion, chemical reaction, the formation of metastable phases, and thus
modifies the deposited thin films with desired properties. Ion beam at energies of tens of eV
usually cause preferential sputtering and thus are used to clean the surface. Ion beams over 40 eV
can induce formation of interfacial structure and thus pre-deposition low energy ion
bombardment can improve film to substrate adhesion. Ions in the range of 50 – 1000 eV produce
lattice movements in the top layer of solids. The motion is isolated and described as non-
equilibrium and not steady state. Ions with this moderate energy can also result in shallow
implantation into a growing film. However, ions at hundreds of eV energies can also cause
significant atomic displacement and damage to the surface below. To minimize the structural
damage of the deposited film the ion beams are to be kept at less than 400 eV in direct deposition
processes (Aisenberg and F.M.Kimock, 1990). The effect of energetic ion flux on surface atoms
is illustrated in Figure 2.8.
Figure 2.8. Effect of energetic ion flux on surface atoms (Aisenberg and Kimock, 1990)
1. Impinging ions providing energy for lateral motion of surface atom into advantageous site.
2. Sputtering of impurity gas atoms from surface

15
3. Sputtering of loosely bonded solid atoms from surface
4. Solid atoms or ions depositing on surface.
5. Gas atoms contaminating surface.
Cuomo et al., 1991 described the formation of DLC films by non-equilibrium process that
involves ion bombardment or condensation of energetic species on the substrate, resulting in
metastable phase. The ion bombardment also gives rise to highly dense films resulting in good
vapor and liquid barrier properties. Lifshitz, 1999 and Lifshitz et al., 1990 proposed that sp3 sites
are created by preferential displacement of sp2 sites and the growth of DLC started from
subsurface, thus termed it as low energy subsurface implantation. As per Robertson, 1993
subplantation results in an increase in the density and causes local bonding to change to sp3.
Carbon ions lose their energy due to collision with target atoms. The energy at which the ion can
pass through the interstice and surface is called the penetration threshold Ep. Displacement
threshold, Ed, is the minimum energy needed by the incident ion to displace an atom and create
vacancy. Eb is the surface binding energy acting as barrier, then the net penetration threshold for
free ions is given by
Ep ~ Ed - Eb ................................................................................................................................(2.1)
When an ion does not have sufficient energy to penetrate the surface, it sticks to the surface and
remains at low energy state of sp2. When the ion energy is greater than Ep, it penetrates into the
subsurface and increases the density. During the film growth, if there is high energy ion
bombardment, the densities of carbon films are high, resulting in sp3 hybridization. On contrary,
if there is no energetic ion bombardment, the densities of carbon films are low, resulting in sp2
hybridization. The entire process is divided into three stages namely (a) collision stage, (b)
thermalisation stage and (c) relaxation stage.

16
In an incident beam of flux f and a fraction of energetic ions with energy Ep, the fraction of ion
below the surface is given by
…………………………………………………………………………………….(2.2)
and this gives …………………………………………………………………....….(2.3)
where n is the fraction of sub-planted atoms in the film
1 – n is the fraction of atoms left on surface as sp2 sites
is the constant.
The increase in the density by sub plantation is given by
…………………………………………………………………………….…………(2.4)
Substituting the value of n, then we have
…………………………………………………………….……………...….…..(2.5)
where is the density of sp2 carbon, is the increase in density
Ziegler et al., 1985 explained the probability of penetration of ions in terms of energy to be
= )……………………………………………………………………...…..(2.6)
Ep is the penetration threshold and Es is a constant.
They also proposed that penetration could occur either directly or indirectly by knock-on and, in
the case of ion beam deposition, it is only knock-on.

17
With a relaxation rate of ~ 0.016 and thermal spike of ~10
12 s,
the sub- plantation
density becomes
……………………………………………………………………...(2.7)
where Eo is the diffusion activation energy.
The schematic of sub-plantation by direct penetration, knock-on and relaxation is shown in
Figure 2.9
.
Figure 2.9. Penetration, relaxation and knock-on (Robertson, 2002)
The gridded Kaufman type ion source provides the most independent control of the process
parameters. The filament cathode is heated up by a voltage to emit thermionic electrons. When a
voltage is applied between a filament cathode and anode (“discharge voltage”) the electrons
accelerate toward the positive anode, ionize the gas, and initiate plasma. The emitted electrons
are usually magnetically confined to increase plasma density, and thus the ion-beam current. A

18
positive beam voltage is applied to the anode and negative voltage to the accelerator grid to
extract positive ions from plasma and form a beam. This beam is neutralized by thermal emitted
electrons from a hot filament to eliminate any charge build-up on the substrates. The applied
discharge voltage and the gas flow rate into the ion source control the ion species in the plasma,
and the beam voltage controls the ion energy impacting the deposition surface.
The ion beams for depositing DLC are generated from methane (CH4) or other hydrocarbon
gases. The gases pass through the ion source and were ionized, and the positive ions are
extracted as shown in Figure 2.10. The positive ions extracted from CH4 plasma form an ion
beam and are directed onto the substrate to form a DLC coating and the deposition rate is
controlled by the ion-beam current density.
The ion-beam energy is the key parameter in determining the DLC properties and a relationship
between hardness, compressive stress and ion-beam energy is shown in Figure 2.11 for a
methane source gas. Maximum hardness of 20 GPa is achieved at beam energy in the range of
100 ~ 250 eV, which correlates with maximum compressive stresses. Increasing beam energy
results in reduced hydrogen concentration, and thus reduced electrical resistivity, and increased
refractive index and absorption coefficient. DLC formed at lower beam energies are usually less
dense, softer and more transparent.

19
Figure 2.10. Kaufman type gridded ion source (Kimock et al)
Figure 2.11. Ion beam energy and compressive stresses (Kimock et al)

20
2.1.5 Diamond-like carbon thin films on Polytetrafluroethylene
PTFE is a synthetic fluropolymer obtained as a result of polymerization of tetrafluroethylene
molecules and its chemical formula is
It has a complete outer shell and becomes one of the most inert and stable materials due to its
strong carbon-fluorine covalent bonds. The main chain of the polymer is twisted and becomes
tightly wrapped by fluorine atoms (Figure 2.12).
Polymers possess many desirable properties for biomedical applications, including a density
comparable to human tissues, good fracture toughness, resistance to corrosion, and ease of
forming by molding or machining and are increasingly chosen as a material in a variety of
implants for widespread applications. However, polymers do not possess good
heamocompatibility and often result in thrombus formation when in contact with blood. In order
to resolve the problems, diamond like carbon coatings on PTFE has been investigated.
Zheng et al., 2005 showed that DLC and C-N films deposited by ion beam assisted deposition
(IBAD) possessed better heamocompatibility compared to bio metallic materials like NiTi and

21
316L, and that platelet adhesion increased by increasing surface roughness and was affected by
surface energy.
Figure 2.12. PTFE molecules (Foursa, 2007)
Huang yan, 2008 reported less number of platelets adhering to PIID (Plasma Immersion and Ion
Deposition) synthesized DLC surface compared to Ti bio material. The results were attributed to
the rough surface of Ti materials. However, the platelets on DLC were aggregated.
Hasebe et al., 2006 proved that surface roughness of DLC films did not show any effect on
platelet adhesion and activation. Other factors such as wettability, free energy and chemical
characteristics of the surface played a major role in determining the platelet adhesion. They
reported that the DLC films deposited by plasma enhanced chemical vapor deposition did not
show any significant change in platelet adhesion and activation, for roughness ranging from 2nm
to 100nm. However, fluorine in DLC inhibited platelet adhesion and activation.
Roy, 2008 investigated the effect of O2 and N2 plasma treatment on platelet adhesion and
reported hydrophilic DLC surface exhibited improved haemocompatibility by inhibiting
fibrinogen and platelet adhesion.

22
Up to now, there is no relevant research done to explore the heamocompatibility of ion beam
synthesized DLC or doped DLC on PTFE. In this research, commercially available PTFE of
0.05mm thick in the form of thin sheet was used as substrate for DLC coating.
2.2 Structural characterization of diamond-like carbon thin films
2.2.1 Raman spectroscopy
Raman spectroscopy is a powerful technique for distinguishing different C-C bonds in diamond,
graphite, carbon nanotubes, fullerenes, amorphous carbon and DLC. It has been widely used to
analyze the bonding structure of carbon materials. The technique is based on Raman Effect:
inelastic scattering or Raman scattering of monochromatic light from a laser source. Light may
be in the visible, near infrared or ultraviolet range and interact with phonons (quantized mode of
vibration in a rigid crystal lattice) resulting in a shift of energy. Raman shifted photons of light
can be either of higher or lower energy depending on vibrational state of molecules and gives
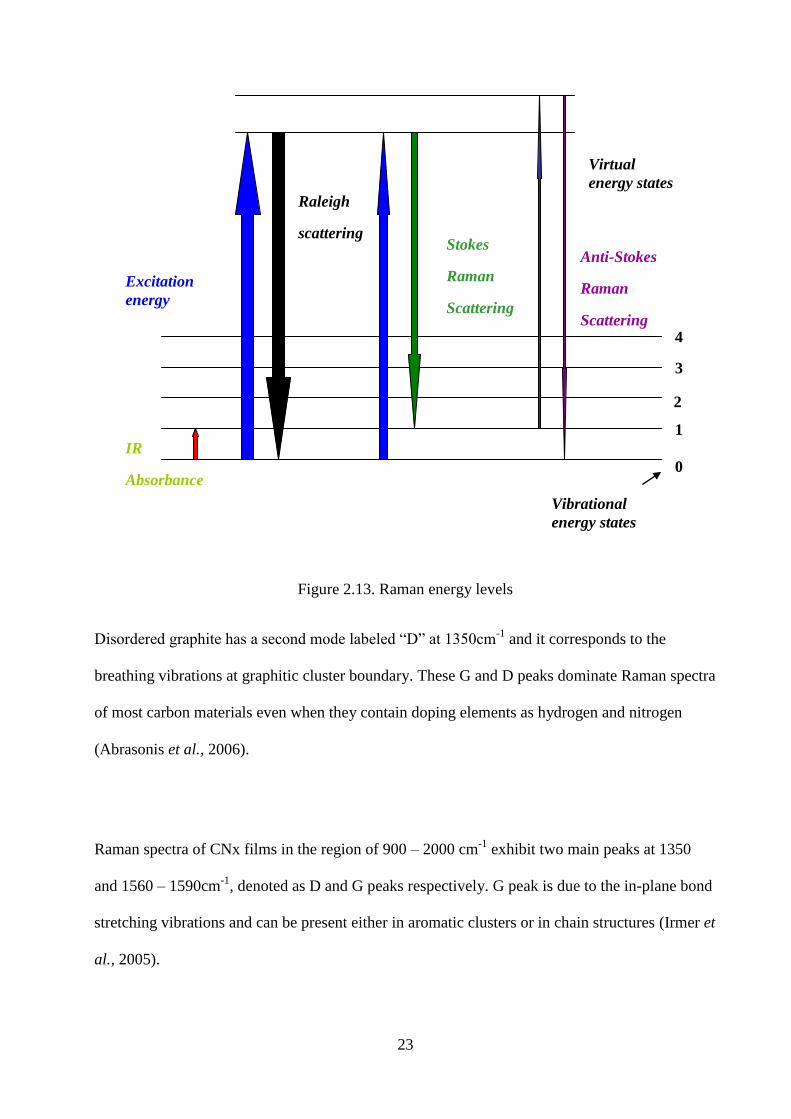
information about the modes of phonons in the system. Raman energy levels are shown in Figure
2.13. The sample is illuminated by a laser beam and the light from the illumination is collected
by lens and transmitted through a monochromator and collected by a detector.
Raman spectra of different carbon structures are shown in Figure 2.14. Diamond has a single
Raman active mode at 1332cm-1
that corresponds to the Brillouin zone center and created from
the stretching vibrations of C-C pair. Graphite single crystal has an active Raman band at
1580cm-1
and is termed “G”, originating from the inter plane vibrations.
23
Figure 2.13. Raman energy levels
Disordered graphite has a second mode labeled “D” at 1350cm-1
and it corresponds to the
breathing vibrations at graphitic cluster boundary. These G and D peaks dominate Raman spectra
of most carbon materials even when they contain doping elements as hydrogen and nitrogen
(Abrasonis et al., 2006).
Raman spectra of CNx films in the region of 900 – 2000 cm-1
exhibit two main peaks at 1350
and 1560 – 1590cm-1
, denoted as D and G peaks respectively. G peak is due to the in-plane bond
stretching vibrations and can be present either in aromatic clusters or in chain structures (Irmer et
al., 2005).
Excitation
energy
Raleigh
scattering Stokes
Raman
Scattering
Anti-Stokes
Raman
Scattering
Virtual
energy states
Vibrational
energy states
IR
Absorbance 0
1
2
3
4

24
Figure 2.14. Raman spectra of carbon materials (Robertson, 2002)
The disorder peak D is related to the breathing vibrations of aromatic rings. The D peak intensity
is sensitive to the cluster size and it decreases as the cluster size decreases with respect to that of
G peak (Debdulal Roy et al., 2004). They can be only present in ring structures and hence not
seen in complete amorphous C films. Due to the amorphous structure, both D and G peaks for
DLC thin films are very broad and overlapped each other. Thus the Raman spectra of DLC are
usually fitted with a symmetric Lorentzian D peak and an asymmetric Breit-Wigner-Fano (BWF)
G peak. Ferrari, 2000 classified the Raman spectra of all disordered carbons in a three-stage
model. Stage 1 is where aromatic rings are maintained with progressive reduction in grain size of
ordered graphite layers. Stage 2 corresponds to pure sp2 network, disordering of graphite layer
25
and results in loss of aromatic bonding. Stage 3 is where sp3 increases towards 100% with
change of sp2 rings to short chains. If I (D)/I (G) ratio is nearing zero then it corresponds to stage
3. This relationship gives valuable information to quantify the sp3 fraction in Raman spectrum.
However, Wilmer et al., 2006 proposed that the incorporation of nitrogen changes the bonding
length compared to pure carbon and enhances the ordering process in disordered carbon network.
Nitrogen promotes the cross-linking between adjacent planes and stops the cluster formation.
2.2.2 Scanning electron microscopy and Atomic force microscopy
Atomic force microscopy (AFM) and scanning electron microscopy (SEM) are the two most
commonly used techniques for surface morphology investigations. When a voltage is applied to
a filament in SEM, it results in emission of electrons from the filament at a high vacuum of 10-4
to 10-6
Torr. Electromagnetic lenses guide the electrons in the electron column to the sample.
The interaction of electrons with the sample, ranging from a few nanometers to a micrometer
depending on the beam properties and sample types, results in back scattered and emitted
secondary electrons. The secondary electrons from the sample surface are detected through
scintillator-photomultiplier. The image is formed due to the intensity of secondary electron
emission from the sample at each (X,Y) data point during scanning of electron beam across the
surface. The large depth of focus in SEM makes it possible to image rough surfaces of samples
as well as in two-dimension. The operation of scanning electron microscope is shown in Figure
2.15.
AFM is highly suitable for producing three-dimensional high-resolution surface topography and
can be used both on conductors and insulator materials. Sharp tip at the end of flexible

26
cantilever, usually made of silicon, is scanned across the sample surface with a constant
interaction force. The interaction between the tip and sample is monitored by the laser beam
reflecting off the back of cantilever and collected by photodiode detector. The operation of
atomic force microscope is shown in Figure 2.16.
Contact and tapping mode are the most commonly used AFM modes. In contact mode, the tip
makes soft physical contact with the sample as it scans the surface to monitor changes in the
cantilever deflection. The constant force of the scanner tracing the tip across the sample causes
the cantilever to bend with the changes in topography. In contact mode, the feed back circuit
maintains a constant cantilever deflection by the moving scanner to maintain constant signal to
photoelectric detector. The image is generated by the scanner’s motion.
In contact mode, the force between the tip and the surface is kept constant during scanning and
cantilever drags across the surface and can result in surface damage. In tapping mode the
cantilever is driven to oscillate up and down by a small piezoelectric element mounted in the
AFM tip holder. Tapping mode is gentle enough even for the visualization of smaller single
molecules.
Scanning electron microscope provides two-dimensional image of conductive sample and is
operated under a vacuum environment whereas AFM provides a true three-dimensional surface
profile and the samples viewed by AFM do not require any special treatments. AFM modes can
work well in ambient air and can provide higher resolution than SEM.

27
Figure 2.15. Operation of SEM (www.purdue.edu)

28
Figure 2.16. Atomic force microscope operation (http://www.Agilent.com)
However, area on the order of millimeters by millimeters with a depth of field on the order of
millimeters can be imaged by SEM, whereas AFM can only image a maximum height on the
order of micrometers and a maximum scanning area of around 150 by 150 micrometers. SEM
can scan in real time while AFM has slow rate of scanning.
2.2.3 X-ray photo emission spectroscopy
X-ray photo emission spectroscopy (XPS) is a technique for measuring elemental composition in
the surface based on photo electric effect. The energy of x-ray photons is greater than 1000 eV in

29
XPS systems. Absorption of such energetic photons leads to removal of an electron from the
core or other subshell atomic orbital. The kinetic energy of an escaped free electron is less than
the energy of the absorbed photon by some value and is considered the binding energy of the
electrons - Einstein's law. The escaping electrons can be analyzed by their kinetic energies and in
combination with Einstein’s law gives us an idea of elements present in the surface.
Calculated atomic subshell photoionization cross-sections for carbon and nitrogen at different
photon energies by Yeh & Lindau, 1985 are given in Figure 2.17. The ionization of 1s orbitals of
carbon and nitrogen requires 285 eV and 400 eV with an incident photon energy of 1000 eV.
Figure 2.17. Atomic sub shell photoionization cross-sections for carbon and nitrogen (Yeh and
Lindau, 1985)
2.3 Property Characterization of Diamond-like Thin Films
2.3.1 Mechanical properties

30
The mechanical properties of DLC films are of great interest due to its application as protective
coatings such as disks and recording heads. Many of the mechanical properties are often
measured by nano-indentation. Nano-indentation tester is a high precision instrument for the
determination of local mechanical properties of a surface layer. The force-displacement curve
was measured when a diamond tip was forced into and unloaded from a surface. The hardness is
the pressure under tip and calculated by the ratio of force to the projected area of plastic
deformation.
Hardness H = 0.0378 Lmax / h2p .................................................................................................(2.8)
where Lmax is the maximum load
hp is the plastic deformation and is the intercept drawn by a tangent to the unloading curve as
shown in Figure 2.18.
Figure 2.18. Loading – unloading curve of nanoindentation
and the Young’s modulus is given by Equation 2.9.
………………………………………………………………….……(2.9)

31
where (hmax – hp) is the elastic deformation (length from the intercept hp to the maximum indent
hmax , ν is the poisson ratio.
Hardness is related to the yield stress Y and Young’s Modulus E by the relationship
) (Robertson, 2002)…………………………….....…………………(2.10)
H/Y 1.8 for a material like diamond with a low Y/E ratio
In this study, mechanical properties (hardness and Young’s modulus) of DLC films coated on Si
substrates were measured by Berkovich nanoindenter manufactured by the Centre for Tribology
Inc.
There are numerous techniques known for adhesion and delamination testing, some of the most
common being a tape test, stud-pull test, scratch test and an indentation test. Scratch test is the
most widely used techniques for hard coatings. In the scratch test, where an indenter moves in
both vertical (loading) and horizontal (sliding) directions, and an acoustic emission sensor allows
for detection of the initiation of fracture, while the scratch pattern indicates the type of failure.
2.3.2 Wettability and contact angle
The surface energy of a material is a parameter that determines the adsorption, wetting and
adhesion properties of the material. It is usually characterized by contact angle measurements.
When the surface energy is low, the contact angle is high. A surface is said to be hydrophobic
when the contact angle is above 90°.
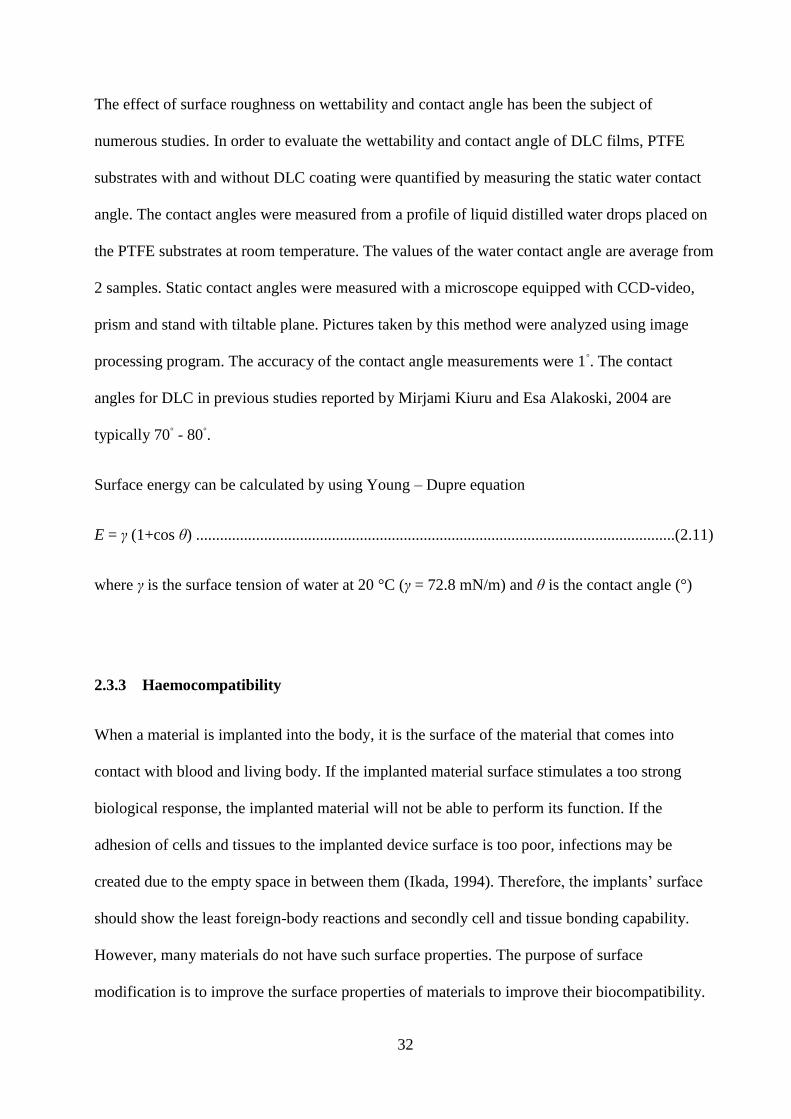
32
The effect of surface roughness on wettability and contact angle has been the subject of
numerous studies. In order to evaluate the wettability and contact angle of DLC films, PTFE
substrates with and without DLC coating were quantified by measuring the static water contact
angle. The contact angles were measured from a profile of liquid distilled water drops placed on
the PTFE substrates at room temperature. The values of the water contact angle are average from
2 samples. Static contact angles were measured with a microscope equipped with CCD-video,
prism and stand with tiltable plane. Pictures taken by this method were analyzed using image
processing program. The accuracy of the contact angle measurements were 1◦. The contact
angles for DLC in previous studies reported by Mirjami Kiuru and Esa Alakoski, 2004 are
typically 70◦ - 80
◦.
Surface energy can be calculated by using Young – Dupre equation
E = γ (1+cos θ) ........................................................................................................................(2.11)
where γ is the surface tension of water at 20 °C (γ = 72.8 mN/m) and θ is the contact angle (°)
2.3.3 Haemocompatibility
When a material is implanted into the body, it is the surface of the material that comes into
contact with blood and living body. If the implanted material surface stimulates a too strong
biological response, the implanted material will not be able to perform its function. If the
adhesion of cells and tissues to the implanted device surface is too poor, infections may be
created due to the empty space in between them (Ikada, 1994). Therefore, the implants’ surface
should show the least foreign-body reactions and secondly cell and tissue bonding capability.
However, many materials do not have such surface properties. The purpose of surface
modification is to improve the surface properties of materials to improve their biocompatibility.

33
Interaction of blood with foreign material can result in blood coagulation (thrombosis) and blood
tissue damage (cell death and release of contents – hemolysis). Thrombus formation includes
interaction between blood proteins, cells and artificial material surface (Courtney et al., 1994).
The rapid adsorption of proteins onto material surface is the first major reaction induced by
blood-material interaction. The absorption and adhesion of proteins and platelets greatly affect
the thrombogenicity of artificial surfaces. Features like platelet activation, intrinsic, extrinsic
coagulation, control systems participating in thrombus inhibition and fibrinolysis contribute to
blood coagulation. Another important feature of blood – material interaction is that blood contact
with material surface generally induces adhesion and aggregation of platelets. Human blood cells
consist of platelets called thrombocytes along with red blood cells (erythrocytes) and white blood
cells (leukocytes) as shown in Figure 2.19.
The adsorbed protein layer is a controlling factor of platelet response and the platelet adhesion is
followed by platelet release reaction and platelet aggregation on the surface. Platelet adhesion,
aggregation and activation with thrombin release are the sequential steps involved in thrombus
formation (Vasilets et al., 2005). A possible way to improve haemocompatibility is to enhance
albumin adsorption. Several research works are being carried out in this area.
The blood compatibility, haemocompatibility, includes the analysis of proteins and platelets in
contact with blood. Quantification of amount of platelets adhered to surface can be done by
radiolabelling (Cui et al., 2000).

34
Figure 2.19. Human blood cells (From left Erythrocyte, thrombocytes and leukocyte)
(http://en.wikipedia.org)
Scanning electron microscopy provides information about total amount as well as the degree of
aggregation and activation of platelets. Thrombus formation is complicated and a series of
reactions including precipitation of proteins (fibrinogen, albumin etc), cells (red blood cells,
white blood cells and platelets) from blood occurs (Tirrell et al., 2002).
In a recent study by Zheng et al., 2005, it is found that the blood clotting time decreases as the
surface roughness of the DLC coatings increases. An increase in nitrogen concentration of the
film has resulted in decrease in the platelet adhesion.
PTFE and other fluorocarbon polymers are strongly hydrophobic and result in a net attraction of
hydrophobic proteins. Hydrophobicity is to be reduced by means of surface modification.
Surface roughness is also critical to minimize the cell adhesion on blood contacting biomaterial
surface for enhanced haemocompatibility (Black, 1999)

35
CHAPTER 3
EXPERIMENTAL METHODS
3.1 Ion Beam Deposition of Diamond-like Carbon Thin Films
DLC thin films were synthesized by ion beam deposition. This deposition system was
manufactured by 4wave and its schematic view is shown in Figure 3.1. It consists of a high
vacuum chamber, a high vacuum pumping system with a turbo and a mechanical pump, a
Kaufman ion source with a tungsten filament neutralizer for direct ion beam deposition, a
rotating substrate holder that can be inclined from 0° to 90°, a constant water cooled stage, a
6-target assemble, and a sputtering ion source. The deposition system can be used for
deposition of DLC thin films either by ion beam deposition or by ion beam assisted
sputtering deposition. Ion beam assisted sputtering deposition uses sputtered graphite as
carbon source, thus hydrogen free DLC (a-C) thin films are deposited, whereas direct ion
beam deposition uses methane as carbon source, thus hydrogenated DLC (a-C:H) thin films
are deposited.
The essential features of the direct ion beam deposition are
1. Source of ion deposition with energies in range of 40 eV to hundreds of eV.
2. High vacuum region between ion source and substrate to reduce charge exchange and
energy loss due to collisions between ion beam and background gases.
3. Substrate in a high vacuum region in vicinity of ion beam.

36
4. Heat sink to eliminate excess energy from surface of substrate.
5. Thermionic filament or hollow cathode, to neutralize the ion beam and avoid net charge
building up, by injecting electrons.
Figure 3.1. Ion-beam deposition system
In this thesis, only ion beam deposition technique was used to deposit DLC thin films. The DLC
thin films were synthesized with energies of 250 eV and 300 eV and a beam current of 75 mA.
Prior to commencing the deposition, the substrates (PTFE sheets and Si wafers of 0.1 mm and
Sputtering ion source
Sputtering targets
4”round substrate
High vacuum
pump
Ion source Ar+CH4+N2

37
0.5 mm thickness, respectively) were Ar+
ion sputter cleaned with beam energy of 800 eV for 15
minutes. During the DLC deposition, high purity methane and argon were ionized
simultaneously in the ion source and directed toward the substrate, whereas nitrogen delivered
directly into the deposition chamber for synthesizing NDLC thin films. N2 flow rates equal to 0,
2 and 5 SCCM of the gas flow rate were used and the corresponding samples were identified by
DLC, NDLC and 5-NDLC. All the films were deposited for a time period of 4 hours to ensure
sufficient thin film thickness for investigations of structures and properties including
haemocompatibility. The deposition parameters followed for DLC synthesis on Si and PTFE
substrates are shown in Tables 3.1 and 3.2 respectively.
Table 3.1. Deposition parameters on Si (100)
Parameters Si (100)
Wafer 1
Si (100)
Wafer 2
Si (100)
Wafer 3
Si (100)
Wafer 4
Base Pressure (Pa) 4.85 E- 07 5.0 E- 07 4.30 E- 07 4.0 E- 07
Working Pressure (Pa) 7.08 E- 04 5.39 E- 04 5.0 E- 04 5.35 E- 04
Ion Energy (eV) 300 250 250 300
Ion Current (mA) 75 75 75 75
Total gas (sccm)
(Ar+CH4+N2)
32 32 34 34
Argon 24 24 24 24
Methane 8 8 8 8
Nitrogen 0 0 2 2
Deposition time (h) 4 4 4 4
Deposition
temperature °C
25 25 25 25
Coating thickness
(nm)
550 550 500 500

38
Table 3.2. Deposition parameters on PTFE
Parameters PTFE 1 PTFE 2
Base Pressure (Pa) 2.80 E- 06 2.00 E- 06
Working Pressure (Pa) 7.08 E- 04 7.08 E- 04
Ion Energy (eV) 250 250
Ion Current (mA) 75 75
Total gas (sccm)
(Ar+CH4+N2)
32 34
Argon 24 24
Methane 8 8
Nitrogen 0 2
Deposition time (h) 4 4
Deposition temperature °C 25 25
3.2 Structural Characterization
Raman spectra were measured on samples using a Renishaw system (model 2000) operated at
514 nm Ar ion laser with a spot size of approximately 2 µm at the Saskatchewan Structural
Science Centre. A picture of the Raman spectroscope is shown in Figure 3.2. Si and PTFE
samples 1cm x 1cm square were placed underneath the microscope and three spots were chosen
to obtain Raman spectra for each sample.
Hitachi S-3000N variable pressure SEM was used to observe the samples surface. It was
operated at an accelerating voltage of 15 kV. A picture of the SEM is shown in Figure 3.3.

39
5 mm round discs were cut from PTFE substrates and were gold sputtered to make them
conductive before examination under SEM.
Figure 3.2. Raman Spectroscope - Renishaw model 2000
Figure 3.3. Scanning Electron Microscope – Hitachi S3000N

40
Surface roughness measurements were done using a contact mode Atomic Force Microscopy
(AFM) at the Saskatchewan Structural Science Center (SSSC), University of Saskatchewan.
Typical AFM equipment is shown in Figure 3.4.
Figure 3.4. Atomic Force Microscopy
3.3 Mechanical Property Characterization
Mechanical properties of DLC films coated on Si substrates were measured by nanoindentation
using a Universal Mechanical Tester (UMT) manufactured by Center for Tribology Inc. A
Berkovich indenter tip was used for the Nanoindentation Testing. The indenter was normal to the
surface and was driven into the sample by applying an increasing load up to a preset value. The
load was then gradually decreased until partial or complete relaxation of the sample has
occurred. The load and displacement were recorded continuously throughout this process to
produce a load-displacement curve from which the nano-mechanical properties such as hardness,
Young’s modulus, stress-strain relationship, plastic & elastic energy of the sample material were

41
calculated. The tester applies forces ranging from 0.1 µN to 1 kN, senses depth ranging from 0.1
nm to 100 mm, and uses indenters with sizes ranging from 50 nm Berkovich tips to 12.7 mm
balls. Multiple indents on a specific sample area can be obtained automatically with a lateral
resolution of 0.5 µm. The UMT tester is shown in Figure 3.5.
Figure 3.5. UMT Nanohardness tester
In this thesis, the Nanoindentation Testing was conducted in three different locations for each
sample. For each loading/unloading cycle on each spot, the applied load value was plotted with
respect to the corresponding position of the indenter. The resulting load/displacement curves
provided data specific to the mechanical nature of the sample under examination. Inbuilt
software using established models were used to calculate the quantitative hardness and modulus
values for such data. For all samples, the maximum load was 45 mN, loading and unloading
speed was 10 mN/min.

42
The UMT purchased from The Center of Tribology Inc. can perform scratching test to measure
the adhesion of the thin films. Specimens in a wide variety of shapes and dimensions can be
tested using UMT. Acoustic emission and the sudden changes of electrical resistance and friction
coefficient are used to sense the adhesion failure of the thin films. In this work, scratch test was
performed in fully computerized UMT with Tungsten carbide blade as scratching object. A load
was applied via a closed-loop servo-mechanism and was programmed to increase linearly from
0.1 mN to 1 kN. Friction force (Fx), normal load (Fz), electrical contact resistance (ECR), and
contact acoustic emission (AE) were measured and recorded for analysis of critical loads. The
sample size was 5cm x 5cm and the testing configuration is shown in Figure 3.6.
Figure 3.6. Scratch test
3.4 X-ray Photoemission Spectroscopy
XPS measurements were performed at SGM beam line at Canadian Light Source (CLS),
University of Saskatchewan, using synchrotron X-ray source simulated to Mg K-α at 1260 eV

43
photon energy. Peak areas were measured, and divided by the atomic sensitivity factors to
calculate elemental composition (Moulder et al., 1995). The data was measured and reported
by beam line scientist Robert Blyth.
3.5 Haemocompatibility testing
Blood was collected from a healthy donor who was under no medication for at least 10 days
prior to the donation and was collected in tubes containing anticoagulants. Small amount of
blood was centrifuged in one 50 ml tube, for 15 min at 890 rpm and room temperature. Platelet-
rich plasma (PRP) was obtained from upper solution. Small amount of platelets was labelled at
room temperature. The suspension was incubated for 2 hours at 37 ºC and rinsed before
measuring adhered platelets using fluorescent gamma scintillation counter. Platelet rich plasma
from blood and experiments with platelets were done by Dr. Haas from Department of Health
Sciences, University of Saskatchewan.
Platelets obtained by centrifugation of human blood were used to study adsorption on 5mm
round disks. 50 ml of PRP were placed on the bare PTFE, DLC coated PTFE and nitrogen doped
DLC on PTFE for 15 minutes and 60 minutes at room temperature. Platelet activation was
studied using SEM.

44
CHAPTER 4
RESULTS AND DISCUSSION
In this chapter results obtained from Raman Spectroscopy, surface roughness, XPS analysis,
nanohardness, critical loads, coefficient of friction and platelet adhesion are presented and
discussed. All characterizations were done on DLC and Nitrogen doped DLC. NDLC mentioned
hence forth corresponds to doping of nitrogen with 2 sccm N2 and 5-NDLC corresponds to
doping of nitrogen in DLC with 5 sccm N2.
4.1 Raman Spectra
Raman spectra of film samples deposited on Si and PTFE substrates with different nitrogen
doping levels are shown in Figures 4.1 - 4.4. A wide band ranging from 1100 to 1800 cm-1
,
typically attributed to DLC thin films, appears for all samples. According to Wagner’s model
developed for Raman scattering of carbon, peaks at 1575 cm-1
and 1360 cm-1
are assigned to G
and D bands, respectively. Both peaks are very broad and are typical for amorphous carbon
structures. It has been reported that Id / Ig, the ratio of integral area under D and G bands are
closely related to sp3/sp
2 ratio in film. The sp
3/ sp
2 ratio is the most important factor in
determining the feature of Raman spectra.
Id / Ig values are 0.58 and 0.61 for DLC and NDLC coatings on Si, respectively, whereas Id / Ig
increases to 0.79 and 0.78 for DLC and NDLC coatings on PTFE sheets, respectively. The

45
relative Raman peak intensities do not change much with nitrogen doping, suggesting that the
carbon substituted by a small amount of nitrogen did not change the vibration modes
significantly. However, the Id / Ig ratio for coatings on PTFE is much higher than those on Si,
indicating that the sp3 concentration in the coatings on PTFE is lower than those on Si. This is
also evident from the shift of G band (1553 and 1547 cm-1
for coatings on Si against 1582 and
1585 cm-1
for coatings on PTFE (Sui and Cai, 2006).
Weaker peaks at about 2200cm-1
, corresponding to the carbon-carbon or carbon-nitrogen triple
bonds, were also observed.
Figure 4.1. Raman spectra of DLC on Si

46
Figure 4.2. Raman spectra of nitrogen-doped DLC on Si
Figure 4.3. Raman spectra of DLC on PTFE
2000
6000
8000

47
Figure 4.4. Raman spectra of nitrogen-doped DLC on PTFE
4.2 SEM and AFM Observation
The SEM image of the DLC thin films is shown in Figure 4.5. It reveals that the films are dense,
smooth, uniform, and amorphous with no pores and discontinuity. None of the special features
such as grains were observed in SEM. AFM pictures of virgin, DLC coated and NDLC coated
PTFE are shown in Figures 4.6 - 4.8 respectively.
Uncoated virgin PTFE exhibited a complex fibril-like structure with an average surface
roughness of about 75 nm. Coating of DLC on PTFE increased the surface roughness to about
197 nm. However, doping with nitrogen makes the surface much smoother and the average
roughness was found to be 135 nm. The surface roughness tends to be lower with low nitrogen
content in the film as per the results published by Prioli et al., 1996.

48
Figure 4.5. SEM image of DLC
Figure 4.6. AFM image of virgin PTFE

49
The surface morphology of DLC and NDLC films showed good homogeneity. The DLC film
contained fine asperities due to large percentage of sp3 bonded carbon formed due to the high
energy ion bombardment during deposition. The nitrogen doping caused the surface to appear
aggregated and this may be due to the clustering of sp2 sites (Liu et al., 1999). The observation
clearly shows that nitrogen doping helps to smoothen the surface.
Figure 4.7. AFM image of DLC coated PTFE
The non equilibrium surface atoms have higher average energy than the substrate and this energy
corresponds to high free surface energy and that is equivalent to high surface tension. The
system tends to reach lowest energy state and according to principal of virtual work, the drive to
minimum energy corresponds to drive to minimum area. The surface tension of non equilibrium
atoms is unusually large and produces a strong driving force to minimize surface area. This
surface area includes the surface irregularities, pinholes and this strong drive to minimize area

50
helps to produce surfaces with fewer irregularities, less pinholes and makes the film smoother
than the substrate.
Figure 4.8. AFM image of NDLC coated PTFE
4.3 XPS surface Characterization
XPS was used to determine the chemical composition NDLC on Si. Figure 4.9 shows the XPS
spectrum of deposited NDLC. As seen from the spectrum, a small amount of oxygen was
observed in the films due to the exposure of the samples in ambient air before XPS
measurement. The surface concentrations calculated from the measured integral intensities of the
XPS peaks are: 60 at.% C, 10 at.% N and 17 at.% O and are shown in Table 4.1.

51
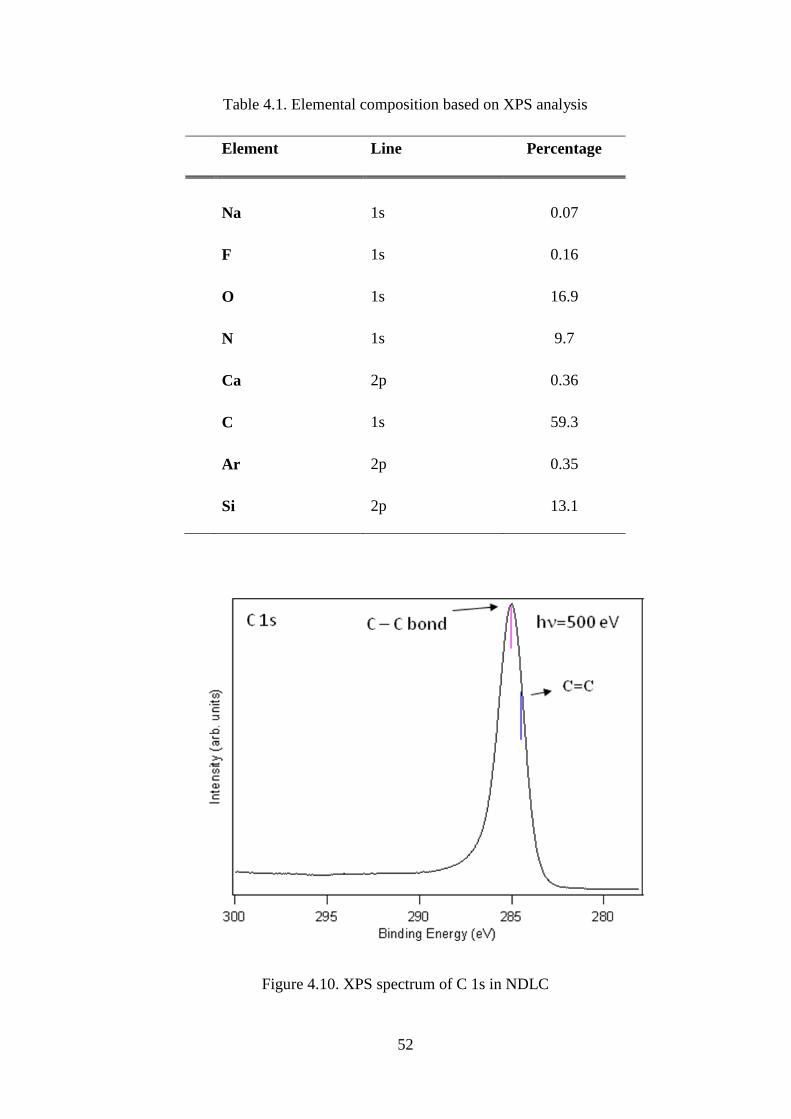
The XPS spectrum of C 1s is shown in Figure 4.10, denoting the presence of a large peak at
285.1 eV that corresponds to sp3 C-C bond on the surface and also sp
2 C=C bond at 284.4 eV.
Another peak at 292.7 eV is attributed to π-excitation, which appears in all carbon-based
materials having double bonds (Bourgoin et al., 1999, Merel et al., 1998).
The XPS spectrum of N 1s in NDLC (Figure 4.11) shows the presence of two peaks at 398.2
and 400.2 that correspond to the presence of sp3 CN and sp
2 CN bonds (Junying et al., 2006).
The peak of O1s is located at 530.4 eV, which is attributed to C–O bonding (Baba, 2006).
Figure 4.9. XPS spectrum of NDLC film
The XPS spectrum of Si 2p in Figure 4.12 shows the presence of SiO (102.3 eV) and SiO2 (103.4
eV), which probably due to the contamination. A very weak peak at 99.1 eV was also observed
that corresponds to pure Si. The presence of pure Si is probably due to ion sputtering of the
substrate during the deposition.
52
Table 4.1. Elemental composition based on XPS analysis
Element Line Percentage
Na 1s 0.07
F 1s 0.16
O 1s 16.9
N 1s 9.7
Ca 2p 0.36
C 1s 59.3
Ar 2p 0.35
Si 2p 13.1
Figure 4.10. XPS spectrum of C 1s in NDLC

53
Figure 4.11. XPS spectrum of N1s in NDLC
Figure 4.12. XPS spectrum of Si 2p coated with NDLC

54
4.4 Mechanical Properties
The data of hardness and elastic modulus value are the average values from indentation testing at
different locations and are presented in Figures 4.13 - 4.14. The average nanohardness of DLC
coated on Si wafers was 18 GPa, whereas that of NDLC is 21 GPa at 45 mN load. It is generally
accepted that the hardness of the DLC films have a close relationship with their sp3/sp
2 ratio,
That is, the higher sp3/sp
2 ratio, the higher the hardness. The lower hardness value of DLC
comparing to diamond is due to the existence of sp2 carbon and hydrogen in the DLC films
(Robertson, 1992). From several published results, the doping of nitrogen leads to higher sp2
content thus lower hardness (Liu et al., 1999). It is reasonable that the doping of nitrogen in this
study increased the hardness of the film, because there is no obvious change of the sp2 content in
the films as shown in the Raman spectrum in Figure 4.2. The higher hardness of NDLC is
probably due to the effect of doping nitrogen into film.
The hardness value during the measurement is not affected by the hardness value of the
substrate, as long as the indentation depth is limited to within 10% of the total film thickness,
whereas the measurement of Young’s modulus is uncertain and needs certain degree of
modeling. If the tip penetration is deeper than 10 % of the thickness of film, the hardness of the
substrate will influence the hardness measurement value.
Liu et al., 1999 reported that at low nitrogen contents, nitrogen doping results in forming N4+
configuration in the tetrahedral networks without changing the bonding state of carbon whereas
high levels of nitrogen results in graphitization of the films, which leads to low hardness and low
modulus of the thin films.

55
Coefficient of friction was determined with reciprocal pin-on-disc testing at normal ambient air,
where chrome steel pin was slid on the films, coated on Si substrates. The load was increased
gradually from 50 g to 500 g and the friction coefficient obtained for different conditions of
films are shown in Figure 4.15. Friction coefficients (COF) were 0.07 and 0.09 for DLC and low
concentration of nitrogen doping, respectively. However, the COF was high as nitrogen
concentrations were increased to 5 sccm. Low COF obtained on our samples is consistent with
the COF value in the work of Won Seok Choi et al., 2007. Low friction coefficient and low
wear rates for low nitrogen content films were also reported by Koskinen et al., 1996.
Figure 4.13. Nanohardness of DLC and NDLC
Critical loads for the films were also obtained by acquiring the acoustic emission values in
scratch testing. The emission levels jumped to 100% as there was delamination of the films. The
results are shown in Figure 4.16. The critical load for DLC, NDLC, and 5-NDLC films is 3.5 N,
17
17.5
18
18.5
19
19.5
20
20.5
21
21.5
20 25 30 35 40 45 50
Hard
nes
s in
GP
a
Load in grams
NDLC DLC

56
3.75 and 2.0 N, respectively. The results indicate that low nitrogen doping increases the adhesion
of the film but higher doping concentration decreases the film adhesion.
Figure 4.14. Young’s modulus of DLC and NDLC
4.5 Surface Energy
Elements like silicon, fluorine, oxygen and nitrogen influence the contact angle. Fluorine has a
great influence in polymers and PTFE and is reported to reduce surface energies to as low as
18mN/m (Grischke and Hieke et al., 1997). The contact angle of extruded PTFE used in our
study was 89° and the surface energy was 75mN/m. Any increase in the concentration of these
elements in the DLC network changes the contact angle of water. Nitrogen, hydrogen and
oxygen were reported to reduce the contact angle and increase the surface energy of DLC
coating (Wen et al., 2008).
210
215
220
225
230
235
20 25 30 35 40 45 50
You
ngs
mod
ulu
s
Load in grams
NDLC DLC

57
Figure 4.15. Coefficient of friction of thin films
The contact angle on DLC coated PTFE increased to 130° on DLC. Nitrogen doping decreased
the contact angle to 111° and thus increased the surface energy to 47mN/m from 27mN/m. The
decrease in contact angle and increase in the surface energy corresponds to the decrease in the
fluorine content and increase in the nitrogen functional group. The decrease of fluorine and
increase of strong nitrogen polar functional group such as C N, C N and C_N_F group on
PTFE surface contributes to the increase of the surface energy (Chen Jie-Rong et al., 1997).
Surface roughness has a major effect on the contact angle of DLC, as the drop gets pinned on the
surface. The contact line of the water droplet can have a complex shape due to the surface
geometry and chemical heterogeneity and has an effect on the contact angle (K.Ozeki and
K.K.Hirakuri, 2007). The contact angles reported in the literature for DLC are typically in the
0.070.09
0.26
0.13
0.16
0.26
0
0.05
0.1
0.15
0.2
0.25
0.3
0 1 2 3 4 5 6
Co
effi
cien
t o
f fr
icti
on
Nitrogen (sccm)
Load 50 grams Load 500 grams

58
range of 70° - 80° (Mirjami Kiuru and Esa Alakoski, 2004). We obtained contact angle of 130°
by coating DLC on PTFE.
Figure 4.16. Critical load of thin films
Surface energy results obtained for various conditions are reported in Table 4.2. The contact of
water droplets on PTFE are shown in Figure 4.17.
Table 4.2. Contact angle and surface energy of DLC coatings
Contact angle (Degrees) Surface energy
(mN/m)
PTFE 89 88
75
DLC PTFE 124 135
27
NDLC PTFE 113 109
47
3.5
3.75
2
1
1.5
2
2.5
3
3.5
4
4.5
5
0 1 2 3 4 5
Cri
tica
l lo
ad
(N
)
Nitrogen (sccm)
Critical load

59
(a)
(b)
(c)
Figure 4.17. Contact angles on various conditions of PTFE
(a) Uncoated PTFE, (b) DLC coated PTFE, (c) NDLC coated PTFE

60
4.6 Biocompatibility
4.6.1 Platelet adsorption and activation
Results of adsorbed platelets counted on the DLC coated PTFE surface is shown in Figure 4.18.
From this figure it is clear that the number of platelets adsorbed on the coated surface is higher
than that on the bare PTFE.
Data expressed in Table 4.3 are platelets adsorbed in each disc of PTFE. Two experiments of
platelet adsorption were carried out for 15 and 60 minutes and they were performed by washing
the disks with 1 vol.% SDS.
SEM micrographs showing the results of platelets activation are presented in Figures 4.19-4.21.
It can be clearly seen from these micrographs that the total number of platelets adhered is
different among the three samples. More platelets adhered to the DLC and NDLC coated PTFE
disks than bare PTFE. But the platelets on coated surface were much less aggregated and much
less activated. There are less platelets adhered to the virgin PTFE. However, these platelets are
highly aggregated and activated.
The degree of aggregation and activation was analyzed from the morphology of the platelets
adhered. Adhesion of platelets is believed to run in four stages and can be classified as:
(1) Single non-activated
(2) Slightly activated
(3) Spread

61
(4) Aggregated (two or more aggregates)
Most of the platelets adhered to bare PTFE are aggregated in groups of two or more as shown in
Figure 4.19. Highly activated platelet is also shown in Figure 4.19a whereas, most of the
platelets on DLC coated PTFE are single and spread and only a few platelets are activated, as
shown in Figure 4.20. On the contrary, only single non-spread platelets are seen on the nitrogen-
doped DLC surfaces as shown in Figure 4.21. The results show that the NDLC can improve
haemocompatibility of PTFE.
Figure 4.18. Results of radio labelled platelet adsorption

62
Table 4.3. Summary of platelets adsorbed
Diamond like carbon PTFE
15 Min 60 Min 15 Min 60 Min
Experiment 1
Mean 3627 6633 2911 3503
St dev 83 1734 16 2.9
Experiment 2
Mean 3227 6683 1587 2505
St dev 366 1055 2776 2058
Figure 4.19. Platelets on bare PTFE

63
Figure 4.19a. Platelet activated on bare PTFE
Figure 4.20. Platelets on DLC coated PTFE

64
Figure 4.21. Platelets on NDLC coated PTFE

65
CHAPTER 5
CONCLUSIONS AND FUTURE WORK
Diamond-like carbon thin films were successfully deposited on to silicon and PTFE substrates
using ion beam deposition technique with a mixture of Argon and Methane gases. The results are
concluded as follows:
1. Ion beam deposited films showed very smooth surface, exhibited high adhesion to the
substrate as revealed by critical loads, and low coefficient of friction.
2. Nitrogen was successfully doped into DLC in concentrations up to 10% to form nitrogenated
diamond like carbon as analyzed by X-ray photo emission spectroscopy.
3. Nanohardness measurements showed that the low concentrations of nitrogen doping in DLC
improved film adhesion without decreasing the hardness.
4. Ion beam deposition of both DLC and NDLC coatings on PTFE increased the surface
roughness of PTFE; however, nitrogen doping decreased the roughness of DLC.
5. Both DLC and NDLC coatings increased the water contact angle of PTFE, thus lowering the
surface energy and improving the wettability of PTFE; however, nitrogen doping decreased the
water contact angle of DLC, thereby increasing the surface energy of DLC.
6. Blood platelet adhesion and reaction shows that both DLC and NDLC increased platelet
adsorption but decreased platelet reaction, thus improving the haemocompatibility of PTFE.
Nitrogen doping further reduced platelet reaction and improved haemocompatibility of DLC
coatings.

66
The results have demonstrated that DLC coatings, especially NDLC coatings, are able to
improve the mechanical and biological performance of PTFE.
Although the results obtained in the recent work strongly suggest that DLC coating by IBD
improves the haemocompatibility of PTFE, further studies on the effect of nitrogen concentration
and carbon structure on the biocompatibility is desirable to have a deep understanding of the
relationships between the structure and biomedical properties of the DLC thin films.
67
LIST OF REFERENCES
Abrasonis, G., Gayo, R., Vinnichenko, M., Kreissig, U., Kolitsch, A., and Moller,W. (2006).
Sixfold ring clustering in sp2-dominated carbon and carbon nitride thin films a Raman
spectroscopy study. Physical Review, B73, 125427.
Aisenberg, S., Chabot, R., Ion-beam deposition of thin films of diamond-like carbon. (1971).
Journal of Applied Physics, 42 (7), 2953-2958.
Aisenberg & Kimock, F.M. (1990). Properties and characterization of amorphous carbon
coatings. Materials Science Forum, 52-53, 1-39.
Angus, J.C., Hayman, C.C. (1988). Low-pressure, metastable growth of diamond and diamond
like phase. Science, 241, 913-921.
Angus, J.C., Wang, Y. (1991). Diamond and Diamond-like films and Coatings, edited by
Clausing, R.E., Angus, J.C., Horton, L.L., Koidl, P. (1991). Springer-Voriag, New york LLC,
173.
Ali Erdemir., Christophe Donnet. (2006). Tribology of diamond-like carbon films: recent
progress and future prospects. Journal of Applied Physics. D, 39, R311 – R327.
Baba, K., Hatada, R. (2006). Deposition of diamond like carbon films on polymers by plasma
source ion implantation. Thin Solid Films, 506-507, 55-58.
Black, J. (1999). Biological performance of materials: Fundamentals of biocompatibility. New
York: Marcel Dekker.
Bourgoin, D., Turgeon, S., Ross, G.G. (1999). Characterization of hydrogenated amorphous
carbon films produced by plasma-enhanced chemical vapor deposition with various chemical
hybridizations. Thin Solid Films, 357, 246-253.
Casiraghi, C., Ferrari, A.C., & Robertson, J. (2005). Raman spectroscopy of hydrogenated
amorphous carbons. Physical Review, B 72, 085401.
Chen Jie-Rong., Wakida, T. (1998). Studies on the surface free energy and surface structure of
PTFE film treated with low temperature plasma. Journal of Applied Polymer Science, 63 (13),
1733-1739.
Courtney, J.M., Lamba, N.M.K., Sundaram, S., and Forbes, C.D. (1994). Biomaterials for blood-
contacting applications. Biomaterials, 15 (10), 737-744.
Cui, F.Z., Li, D.J. (2000). A review of investigations on biocompatibility of diamond-like carbon
and carbon nitride films. Surface & Coatings Technology, 131, 481-487.
Cuomo, J.J., Pappas, D.L., Bruley, J., Doyle, J.P., Saenger, K.L. (1991). Vapor deposition
processes for amorphous carbon films with sp3 fractions approaching diamond. Journal of
Applied Physics, 70, 1706.

68
Debdulal Roy., Manish Chhowalla., Niklas Hellgren., Clyne, T.W., & Amaratunga,
G.A.J.(2004). Probing carbon nanoparticles in CNx thin films using Raman spectroscopy.
Physical Review, B70, 035406.
Erdeimer, A., Donnet, C. (2001). Tribology of diamond, diamond-like carbon and related films.
In modern tribology handbook, Edited by Bhushan, CRC press, Boca Ralton, FL, 2, 871-906.
Ferrari, A.C., Robertson, J., Interpretation of Raman spectra of disordered and amorphous
carbon. (2000). Physical Review, BV61, 20.
Field, J.E. (1993). Properties of Diamond. Academic Press, London.
Foursa, M., Plasma- assisted deposition of nitrogen doped amorphous carbon films onto
polytetrafluroethylene for biomedical applications. (2007). Ph.D Thesis, University of
Saskatchewan.
Geoffrey Dearnaley., James H, Arps. (2005). Biomedical applications of diamond-like carbon
(DLC) coatings: A review. Surface & Coatings Technology, 200, 2518-2524.
Grischke, M., Hieke, A., Morgenweck, F., Dimigen, H. (1998). Variation in wettability of DLC-
coatings by network modification using silicon and oxygen. Diamond and Related Materials, 7,
454-458.
Hasebe, T., Ishimaru, T., Kamijo, A., Yoshimoto, Y., Yoshimura, T., Yohena, S., Kodamaa, H.,
Hotta, A., Takahashi, K., Suzuki, T. (2007). Effects of surface roughness on anti-
thrombogenicity of diamond-like carbon films. Diamond & Related Materials, 16, 1343-1348.
Hellgren, N., Johansson, M.P., Broitman, E., Hultman, L., Sundgren, J.E. (1999). Role of
nitrogen in the formation of hard and elastic CNx thin films by reactive magnetron sputtering.
Physical Review B, 59, 5162-5177.
Huang Yana, Lu., Xiaoyinga., Ma Jingwu a., Huang Nanb. (2008). In vitro investigation of
protein adsorption and platelet adhesion on inorganic biomaterial surfaces. Applied Surface
Science, 255, 257-259.
Ikada, Y. (1994). Surface modification of polymers for medical applications. Biomaterials, 15
(10), 725-736.
Irmer, G., & Dorner-Reisel, A. (2005). Micro-Raman Studies on DLC Coatings. Advanced
Engineering Materials, 7 (8), 694-705.
Jiehe Sui & Wei Cai. (2001). Mechanical properties and anti-corrosion behavior of the
diamond-like carbon films. Surface and Coatings Technology, 3-4, 1323-1327.
Junying Hao., Weimin Liu., Qunji Xue. (2007). Effect of N2/CH4 flow ratio on microstructure
and composition of hydrogenated carbon nitride films prepared by a dual DC-RF plasma system.
Journal of Non-Crystalline Solids, 353, 136-142.
Kaufman,H. (1990). Broad beam ion sources. Rev. Science Instrum, 61, 230.
Kelly, B.T. (1981). Physics of Graphite. Applied Science Publishers, London.
69
Kimock, Fred, D.M., David W, Brown., Steven J. Finke & Edward G. Thear. Diamonex, Inc,
Allentown, PA, USA, data tech, 69-76.
Koidl, P., Wild, Ch., Dischler, B., Wagner, J., Ramsteiner, M. (1990) Properties and
Characterization of Amorphous Carbon Films. Materials Science Forum, 52 (53), 41-70.
Koskinen, J.P., Hirvonen, J., Levoska and P. Torri. (1996). Tribological characterization of
carbon-nitrogen coatings deposited by using vacuum arc discharge. Diamond and Related
Materials, 5, 669-673.
Kusano, Y., Evetts, J.E., Somekh, R.E., and Hurchings, I.M. (1998). Properties of carbon nitride
films deposited by magnetron sputtering. Thin Solid Films, 332, 56-61.
Lifshitz, Y. (1999). Diamond-like carbon- Present status. Diamond and Related Materials, 8,
1659-1676.
Lifshitz, Y., Kasi, S.R., & Rabalis, J.W. (1990). Subplantation model for film growth from
hyperthermal species. Physical Review B, 41 (15), 10468-10480.
Liu.E, X.Shi., H.S.Tan., L.K.Cheah., Z.Sun., Tay, B.K., Shi, J.R. (1999). The effect of nitrogen
on mechanical properties of tetrahedral amorphous carbon films deposited with a filtered
cathodic vacuum arc. Surface and Coatings Technology, 120 -121, 601-606.
Liu, A.Y., Cohen, M.L. (1990). Structural properties and electronic structure of
lowcompressibility materials-beta Si3N4 and hypothetical beta-C3N4. Physical Review B, 41,
10727-10734.
McKenzie, D.R., Mcphedran, R.C., Savvides, N., Botten, I.C. (1983). Properties and structure of
amorphous hydrogenated carbon films. Philosophical Magazine B, 48, 341-364.
Merel, P., Tabbal, M., Chaker, M., Moisa, S., Margot, J. (1998). Direct evaluation of the sp3
content in diamond-like-carbon films by XPS. Applied Surface Science, 136, 105-110.
Mirjami Kiuru., Esa Alakoski. (2004). Low sliding angles in hydrophobic and oleophobic
coatings prepared with plasma discharge method. Materials Letters, 58, 2213-2216.
Moulder et al., (1995). Handbook of X-ray Photoelectron Spectroscopy. Physical Electronics
Inc.
Narayan. Roger, J. (2005). Nanostructured diamond-like carbon thin films for medical
applications. Material Science and Engineering, C25, 405-416.
Ozeki, K & Hirakuri, K.K. (2008). The effect of nitrogen and oxygen plasma on the wear
properties and adhesion strength of the diamond-like carbon film coated on PTFE. Applied
Surface Science, 254 (6), 1614-1621.
Pharr, G.M., Callahan, D.L., McAdams, S.D., Tsui, T.Y., Anders, S., Anders, A., Ager III, J.W.,
Robertson, J. (1996) . Hardness, elastic modulus and structure of very hard carbon films
produced by cathodic-arc deposition with substrate pulse biasing. Applied Physics
Letters, 68 (6), 779-781.
Prioli, S.I., Zanette, A.O., Caride, D.F., Franceschini & Freire Jr, F.L. (1996). Atomic force
microscopy of amorphous hydrogenated carbon–nitrogen films deposited by radiofrequency-
70
plasma decomposition of methane–ammonia gas mixtures. Journal of Vacuum Science and
Technology A, 14, 2351-2355.
Robertson, J. (1986). Amorphous carbon. Advances in Physics, 35, 317-374.
Robertson, J. (1993). Deposition mechanisms for promoting sp3 binding in diamond-like carbon.
Diamond and Related Materials, 2, 984-989.
Robertson, J. (2002). Diamond-like amorphous carbon. Materials Science and Engineering R,
37, 129-281.
Roy, P.K., Choi, H.W., Yi, J.W., Moon, M-W., Lee, K-R., Han, D.K., Shin, J.H., Kamijo, A.,
Hasebe, T. (2009). Hemocompatibility of surface–modified, silicon-incorporated, diamond–like
carbon films. Acta Biomaterialia, 5, 249-256.
Silva, S.R.P., Amaratunga, G. (1994). Use of space-charge-limited current to evaluate the
electronic density of states in diamond-like carbon thin films. Thin Solid Films, 253, 146.
Srinivasan, S., Yang, Q. (2007). Nitrogen Doped Diamond like Carbon Thin Films for Enhanced
Biological Properties. Proceedings of the 2007 Joint International Conference of the 3rd
International Conference on SISE and SEIA, 1-8
Takadoum, J., Raunch, J.Y., Cattenot, M.J., Martin, N. (2003). Comparative study of
mechanical and tribological properties of CNx and DLC films deposited by PECVD technique.
Surface and Coatings Technology, 74-175, 427-433.
Tirrell, M., Kokkoli, E., Biesalski, M. (2002). The role of surface science in bioengineered
materials. Surface Science, 61–83.
Vasilets, V.N., Hirose, A., Yang, Q., Singh, A., Sammynaiken, R., Shulga, Yu.M A.,
Kuznetsov, V., Sevastianov, V.I. (2005). Hot-wire plasma deposition of doped DLC films on
fluro carbon polymers for biomedical applications. Plasma Processes and Polymers, 65-76.
Weiler, M., Sattel, S., Jung, K., Ehrhardt, H., Veerasamy, V.S., Robertson, J. (1994).
Highly tetrahedral, diamond-like amorphous hydrogenated carbon prepared from a plasma beam
source. Applied Physics Letters, 64 (21), 2797-2799.
Wena, F., Huang, N., Leng, Y.X., Zhao, A.S., Jing, F.J. (2008). Study on wettabilities and
platelet adhesion behavior of C:H and C:N:H films prepared by DC-MFCVA. Applied Surface
Science , 255, 469–472.
Wilmer Sucasine., Masco matsuoka., Karina C.Lopes et al. (2006). Raman and Infrared
spectroscopy studies of carbon nitride films prepared on Si (100) substrates by ion assisted
deposition. J.Braz, Chem Soc, 17 (6), 1163-1169.
Won Seok Choi ., Mungi Park ., Byungyou Hong. (2007). An examination of trace surface on
diamond-like carbon film after ball-on disk measurement Thin Solid Films, 515, 7560-7565.
Xiaoming He., Wenzhi Li., and Hengde Li. (1996). Diamond-like carbon film synthesized by ion
beam assisted deposition and its tribological properties. Journal of Vacuum Science and
Technology. A, 14(4), 2039-2047.
Yeh, J.-J., Lindau, I. (1985). Atomic subshell photoionization cross sections and asymmetry
parameters: 1 < Z < 103. At. Data Nucl. Data Tables, 32, 1.

71
Zheng, C.L., Cui, F.Z., Meng, B., Ge, J., Liu, D.P., & Lee, I-S. (2005). Hemocompatibility of C-
N films fabricated by ion beam assisted deposition. Surface and Coatings Technology, 193(1-3),
361-365.
Ziegler, J.F., Biersack, J.P., Littmark, U. (1985). The Stopping and Range of Ions in Solids.
Pergamon Press, Oxford.


![OPTICAL CHARACTERIZATION OF RARE EARTH …ecommons.usask.ca/bitstream/handle/10388/etd-07292009-064945/Go... · ... Dr. S. O. Kasap, ... Photon Amplification [13] ... Er3+ ion energy](https://static.fdocuments.in/doc/165x107/5abdc1f17f8b9aa3088c06d3/optical-characterization-of-rare-earth-dr-s-o-kasap-photon-amplification.jpg)