
A NOVEL APPROACH TO EMERGENCY MANAGEMENT...
185
A NOVEL APPROACH TO EMERGENCY MANAGEMENT OF WIRELESS TELECOMMUNICATION SYSTEM A Thesis Submitted to the College of Graduate Studies and Research In Partial Fulfillment of the Requirements For the Degree of Master of Science In the Department of Mechanical Engineering University of Saskatchewan Saskatoon, Saskatchewan Canada By YONG HE © Copyright Yong He, June 2008. All rights reserved.
Transcript of A NOVEL APPROACH TO EMERGENCY MANAGEMENT...

A NOVEL APPROACH TO EMERGENCY MANAGEMENT OF
WIRELESS TELECOMMUNICATION SYSTEM
A Thesis Submitted to the College of
Graduate Studies and Research
In Partial Fulfillment of the Requirements
For the Degree of Master of Science
In the Department of Mechanical Engineering
University of Saskatchewan
Saskatoon, Saskatchewan
Canada
By
YONG HE
© Copyright Yong He, June 2008. All rights reserved.

i
PERMISSION TO USE
In presenting this thesis in partial fulfilment of the requirements for a Postgraduate degree from
the University of Saskatchewan, I agree that the Libraries of this University may make it freely
available for inspection. I further agree that permission for copying of this thesis in any manner,
in whole or in part, for scholarly purposes may be granted by the professor or professors who
supervised my thesis work or, in their absence, by the Head of the Department or the Dean of the
College in which my thesis work was done. It is understood that any copying or publication or
use of this thesis or parts thereof for financial gain shall not be allowed without my written
permission. It is also understood that due recognition shall be given to me and to the University
of Saskatchewan in any scholarly use which may be made of any material in my thesis.
Requests for permission to copy or to make other use of material in this thesis in whole or part
should be addressed to:
Head of the Department of Mechanical Engineering
University of Saskatchewan
Saskatoon, Saskatchewan S7N 5A9 CANADA

ii
ABSTRACT
The survivability concerns the service continuity when the components of a system are damaged.
This concept is especially useful in the emergency management of the system, as often
emergencies involve accidents or incident disasters which more or less damage the system. The
overall objective of this thesis study is to develop a quantitative management approach to the
emergency management of a wireless cellular telecommunication system in light of its service
continuity in emergency situations – namely the survivability of the system. A particular wireless
cellular telecommunication system, WCDMA, is taken as an example to ground this research.
The thesis proposes an ontology-based paradigm for service management such that the
management system contains three models: (1) the work domain model, (2) the dynamic model,
and (3) the reconfiguration model. A powerful work domain modeling tool called Function-
Behavior-Structure (FBS) is employed for developing the work domain model of the WCDMA
system. Petri-Net theory, as well as its formalization, is applied to develop the dynamic model of
the WCDMA system. A concept in engineering design called the general and specific function
concept is applied to develop a new approach to system reconfiguration for the high survivability
of the system. These models are implemented along with a user-interface which can be used by
emergency management personnel. A demonstration of the effectiveness of this study approach
is included.
There are a couple of contributions with this thesis study. First, the proposed approach can be
added to contemporary telecommunication management systems. Second, the Petri Net model of
the WCDMA system is more comprehensive than any dynamic model of the telecommunication
systems in literature. Furthermore, this model can be extended to any other telecommunication
system. Third, the proposed system reconfiguration approach, based on the general and specific
function concept, offers a unique way for the survivability of any service provider system.
In conclusion, the ontology-based paradigm for a service system management provides a total
solution to service continuity as well as its emergency management. This paradigm makes the

iii
complex mathematical modeling of the system transparent to the manager or managerial
personnel and provides a feasible scenario of the human-in-the-loop management.

iv
ACKNOWLEDGMENTS
Upon completion of this thesis, I would like to express my sincere gratitude to my supervisor
Professor Chris W. J. Zhang, who provided me with invaluable guidance, constructive discussion,
encouragement, and inspiration throughout my whole research.
My appreciation is extended to the members of the Advisory Committee: Professor R. T. Burton,
Professor D. Chen, and Professor R. Deters (the external examiner) for their valuable
suggestions, constructive advice to the present work.
This research is made possible by the financial support from the Precarn and National Sciences
and Engineering Council of Canada (NSERC) joint critical infrastructure program.

v
Dedicated to
My parents and my family

vi
TABLE OF CONTENTS
PERMSSION TO USE……………………………………………………………………i
ABSTRACT………………………………………………………………………………ii
ACKNOWLEDGMENTS………………………………………………………………..iv
DEDICATION…………………………………………………………………………….v TABLE OF CONTENT…………………………………………………………………..vi LIST OF TABLES.........................................................................………………………..x
LIST OF FIGURES ........................................................................................................... xi
ACRONYMS................................................................................................................... xiv
CHAPTER 1 INTRODUTCION .........................................................................................1
1.1 Background..........................................................................................................1
1.2 Motivation............................................................................................................2
1.3 Research goal and objectives...............................................................................3
1.4 General research methodology ............................................................................4
1.5 Organization of the thesis ....................................................................................5
CHAPTER 2 BACKGROUND AND LITERATURE REVIEW .......................................6
2.1 Introduction..........................................................................................................6
2.2 Wireless cellular system ......................................................................................6
2.2.1 History ......................................................................................................6
2.2.2 Standard of the 3G wireless system..........................................................9
2.2.3 Architecture of the WCDMA wireless cellular system ..........................10
2.2.4 Telecommunication management network (TMN) ................................11
2.3 Definition ...........................................................................................................13
2.4 Impact of the emergency to wireless telecommunication systems and related

vii
work ..................................................................................................................15
2.5 Service continuity management and related work.............................................18
2.6 The FBS framework...........................................................................................20
2.6.1 Concept of FBS model and the implementation .....................................20
2.6.2 FCBPSS framework................................................................................22
2.7 FBS modeler and knowledge base system.........................................................25
2.8 Decision making system in emergency situations .............................................27
2.9 Conclusion .........................................................................................................28
CHAPTER 3 AN EXAMPLE WCDMA SYSTEM ..........................................................30
3.1 Introduction........................................................................................................30
3.2 Background........................................................................................................30
3.2.1 History of the WCDMA development ....................................................30
3.2.2 Services of the WCDMA system............................................................32
3.2.3 Architecture of the WCDMA system .....................................................34
3.2.4 Features of Wideband Code Division Multiple Access (WCDMA) ......37
3.2.5 Protocols of the WCDMA system ..........................................................38
3.3 The example WCDMA system..........................................................................41
3.3.1 Architecture of the example WCDMA system.......................................41
3.3.2 Configuration of the example WCDMA system ....................................43
3.3.3 Management of the example WCDMA system ......................................44
3.3.4 Threaten scenarios of the example system .............................................50
3.4 Summary ............................................................................................................51
CHAPTER 4 WCDMA SYSTEM DOMAIN MODEL ....................................................53
4.1 Introduction........................................................................................................53
4.2 The concept of the domain model......................................................................53
4.3 The domain model of the example WCDMA system........................................56
4.3.1 Domain objects of the example WCDMA system..................................56
4.3.2 The example WCDMA system – Function ............................................58

viii
4.3.3 The example WCDMA system - Structure.............................................61
4.3.4 The example WCDMA system - Principle .............................................64
4.3.5 The example WCDMA system – Behavior and State ............................66
4.3.6 The example WCDMA system - Context ..............................................69
4.4 Conclusion with discussion ...............................................................................70
CHAPTER 5 RECONFIGURABLE WCDMA SYSTEM................................................71
5.1 Introduction........................................................................................................71
5.2 A new system reconfiguration approach ...........................................................71
5.2.1 The general and specific function concept ............................................71
5.2.2 System reconfiguration based on the G-S concept ................................74
5.3 WCDMA reconfigurable (G-S) model .............................................................77
5.3.1 The WCDMA domain model: revisited..................................................77
5.3.2 Reconfiguration of the WCDMA system based on the (G-S) model .....82
5.4 A Knowledge Based System to support system reconfiguration.......................86
5.4.1 System function knowledge base............................................................86
5.4.2 System structure knowledge base ...........................................................95
5.4.3 System principle knowledge base.........................................................101
5.5 Conclusion with discussion .............................................................................110
CHAPTER 6 PETRI NET MODELING OF SURVIVABLE WCDMA SYSTEM .......113
6.1 Introduction......................................................................................................113
6.2 Petri Net theory................................................................................................113
6.2.1 Petri Net ................................................................................................113
6.2.2 Colored Petri Net ..................................................................................116
6.3 CPN modeling of the example WCDMA system ............................................119
6.3.1 Modeling the function of the example WCDMA system .....................120
6.3.2 Modeling the structure of the example WCDMA system ....................123
6.3.3 Modeling the principle of the example WCDMA system ....................125
6.3.4 Modeling the threaten of the example WCDMA system......................127
ix
6.3.5 Modeling the demand of the example WCDMA system......................129
6.4 CPN simulation of the WCDMA system.........................................................130
6.4.1 MSC and histogram chart of the WCDMA system ..............................131
6.4.2 System block rate and capacity.............................................................135
6.5 Related Work…………………………………………………………………137
6.6 Conclusion with discussion .............................................................................139
CHAPTER 7 DECISION SUPPORT SYSTEM .............................................................140
7.1 Introduction......................................................................................................140
7.2 Architecture of Decision Making Support System (DMSS) ...........................140
7.3 Interface module development.........................................................................141
7.3.1 Interface 1 .............................................................................................141
7.3.2 Interface 2 .............................................................................................145
7.3.3 Interface 3 .............................................................................................146
7.4 Operation of DMSS .........................................................................................147
7.5 Conclusion with discussion .............................................................................148
CHAPTER 8 CONCLUSION..........................................................................................149
8.1 Overview of the Thesis ....................................................................................149
8.2 Major contributions..........................................................................................151
8.3 Limitations and future Work............................................................................152
8.3.1 Limitations ............................................................................................152
8.3.2 Future work...........................................................................................153
LIST OF REFERENCES………………………………………………………………..155
APPENDIX A CPN model of WCDMA system .……………………………………....166
APPENDIX B Interface 2 for decision making support system..……………………….167

x
LIST OF TABLES
Table page Table 2.1 Vulnerability of wireless network components ..............................................…..16
Table 2.2 Effects of the failures of wireless components and mitigation strategies.............17
Table 4.1 Components of the WCDMA system…………………………………………… 58
Table 5.1 Impacts, failures and recovery strategies of the WCDMA components ........…..81
Table 5.2 Definition of function prototype...........................................................................86
Table 5.3 WCDMA system structure knowledge base.........................................................96
Table 5.4 WCDMA system principle knowledge base.......................................................103
Table 6.1 Basic definition of Petri Nets..............................................................................114
Table 6.2 Notations of the function model .....................................................................…121
Table 6.3 Notations of the structure model.........................................................................124

xi
LIST OF FIGURES
Figure page
Figure 2.1 A simple architecture of wireless cellular network ..........................................9
Figure 2.2 IMT-2000 architecture with interfaces...........................................................10
Figure 2.3 General relationship of a TMN with a telecommunications network ............11
Figure 2.4 TMN functional architecture ..........................................................................12
Figure 2.5 Unbalance between Service supplier and demands........................................19
Figure 2.6 FBS model ......................................................................................................21
Figure 2.7 Architecture of FCBPSS framework ..............................................................22
Figure 2.8a The crank-slider linkage .................................................................................23
Figure 2.8b Stress state ......................................................................................................23
Figure 2.8c Displacement state ..........................................................................................24
Figure 2.9 FBS modeler...................................................................................................26
Figure 2.10 Decision making system.................................................................................28
Figure 3.1 WCDMA Network Architecture ....................................................................36
Figure 3.2 Typical protocol architecture of the 3G WCDMA.........................................39
Figure 3.3 Radio interface protocol reference model.......................................................40
Figure 3.4 An example WCDMA system........................................................................42
Figure 3.5 Soft handover of WCDMA ............................................................................46
Figure 3.6 Coverage range of Different AMR Bit rate....................................................48
Figure 3.7 Capacity of Different AMR Bit rate ...............................................................49
Figure 4.1 Meeting Room................................................................................................54
Figure 4.2a Aggregate relationship....................................................................................55
Figure 4.2b Assembly relationship ....................................................................................55
Figure 4.2c Connectivity relationship................................................................................56
Figure 4.3 Holistic structure of the WCDMA wireless cellular system ..........................58
Figure 4.4 Function and context based WCDMA system………………………………61
Figure 4.5 Structure of the example WCDMA system....................................................62
Figure 4.6 UMTS R4 logical architecture........................................................................65

xii
Figure 4.7 Principles of WCDMA system.......................................................................66
Figure 4.8 Downlink Power Control of WCDMA systems.............................................68
Figure 4.9 Behaviors of the example WCDMA system ..................................................69
Figure 5.1a Sewing machine..............................................................................................72
Figure 5.1b General-Specific function of sewing machine ...............................................73
Figure 5.1c Compressor machine ......................................................................................73
Figure 5.2a Original table ..................................................................................................74
Figure 5.2b A reconfigured table (method 1) ....................................................................75
Figure 5.2c A reconfigured table (method 2) ....................................................................75
Figure 5.3 A new system reconfiguration method...........................................................76
Figure 5.4 Structure of the example WCDMA system....................................................78
Figure 5.5 A typical overall function of WCDMA system..............................................83
Figure 5.6 Generalized reconfigurable WCDMA system................................................85
Figure 5.7 Holistic system hierarchy function architecture.............................................88
Figure 5.8a Decomposition of speech function .................................................................93
Figure 5.8b Network Reconfiguration of Speech function................................................94
Figure 5.9 Design procedures for the structure knowledge base.......................................99
Figure 5.10 Configuration of network components.........................................................100
Figure 5.11 Typical protocol architecture of the 3G WCDMA.......................................102
Figure 5.12 Principle VoCS for managing the mobile originated call ............................104
Figure 5.13 A simple VoIP protocol stack ......................................................................106
Figure 5.14 Principle of SIP- based protocols .................................................................107
Figure 5.15 An example of Power Control......................................................................110
Figure 6.1a A marked PN before firing ...........................................................................116
Figure 6.1b A marked PN after firing transition “call” ...................................................116
Figure 6.2 A simple transport protocol ..........................................................................118
Figure 6.3 Architecture of the simulation engine ..........................................................120
Figure 6.4 Function layer...............................................................................................122
Figure 6.5 Structure layer ..............................................................................................123
Figure 6.6 RRC Principle layer .....................................................................................127
Figure 6.7 Threaten Scenario ........................................................................................129

xiii
Figure 6.8 Demand generator ........................................................................................130
Figure 6.9 MSC and histogram chart.............................................................................132
Figure 6.10a Voice over CS (VoCS) ...............................................................................134
Figure 6.10b Voice over IP (VoIP)..................................................................................135
Figure 6.11a Block Rate of WCDMA system .................................................................136
Figure 6.11b Capacity of WCDMA system.....................................................................136
Figure 7.1 A framework of the DMSS system...............................................................140
Figure 7.2 Interface 1 – for system designer .................................................................141
Figure 7.3 Integration of the animation tool with CPN Tools .......................................142
Figure 7.4a A CPN example model of runners................................................................143
Figure 7.4b MSC model...................................................................................................143
Figure 7.5 Interface 2 – for emergency manager...........................................................145
Figure 7.6 Interface 3- CPN to FBS model....................................................................146

xiv
LIST OF MAJOR ACRONYMS
AAA Authentication, Authorization and Accounting
AMPS Advanced Mobile Phone Service
AMR Adaptive Multi-rate Voice codec
AuC Authentication Centre
BS Base Station
BSC BS Controller
BMC Broadcast/multicast Control
CAC Call Admission Control
CDMA Code Division Multiple Access
CM Communication Management
CN Core Network
CPN Coloured Petri Net
CS Circuit Switch
D-AMPS Digital AMPS
DFO Disaster Field Office
DMSS Decision Making Support System
EIR Equipment Identity Register
ETSI European Telecommunications Standards Institute
FCBPSS Function Context Behavior Principle Structure State
FEBPSS Function Effect Behavior Principle Structure State
FBS Function Behavior Structure
FDD Frequency Division Duplex
GGSN Gateway GPRS Support Node

xv
GMSC Gateway MSC
GPRS General Packet Radio Service
G-S General- Specific function
GSM Global Systems Mobile
GUI Graphical User Interface
HITLP Human In The Loop
HLR Home Location Registers
IMT-2000 International Mobile Telecommunications-2000
IP Internet Protocol
ITU International Telecommunications Union
ITU-T ITU Telecommunication Standardization Sector
MAC Medium Access Control
MSC Mobile Switch Center
MGw Media Gateway
MM Mobility Management
MMS Multimedia Messaging Service
MT Mobile Terminal
O&M Operation and Management System
OSI Open System Interconnection
PDCP Packet Data Convergence Protocol
PLMN Public Land Mobile Network
PNs Petri Nets
PS Packet Switch
PSTN Public Switching Telephone Network

xvi
QoS Quality of Service
QPAS Qualitative Process Abduction system
RAN Radio Access Network
RLC Radio Link Control
RNC Radio Access Controller
RRC Radio Resource Control
RRM Radio Resource Management
SGSN Serving GPRS Support Node
SMS Short Messaging Service
SS7 Signaling System #7
TDD Time Division Duplex
TDMA Time Division Multiple Access
TMN Telecommunication management network
UE User Equipment
UIM User Identity Module
UMTS Universal Mobile Telecommunications System
UTRA UMTS Terrestrial Radio Access
UTRAN UMTS Terrestrial Radio Access Network
VLR Visiting Location Register
VoIP Voice over IP
WCDMA Wideband Code Division Multiple Access
1G First Generation of Mobile System Standard
2G Second Generation of Mobile System Standard
3G Third Generation of Mobile System Standard

1
Chapter 1
Introduction
1.1 Background
Telecommunication is a critical infrastructure which consists of telephone, data lines, cellular
and personal communication service (PCS) wireless system, pager, satellite, cable, wireless
broadband, radio and television. Among all the critical infrastructures, the telecommunication
infrastructure system plays an important role in the functioning of our society. Moore et al.
(2001) defined the critical infrastructures as physical and information technology facilities which
have a serious impact on the health, safety, security, economic well-being of citizens, or the
effective functioning of governments. Failure of telecommunication infrastructure will cause
coordination capabilities disable and significantly hinder rescue and recovery operations
(Samarajiva 2001). In the absence of telecommunication infrastructure, it is hard to conduct the
repair and recovery of other critical infrastructures which may dysfunction due to incidences or
accidents. Harrop (2002) examined the relationship of communications networks with other
Canadian critical infrastructures and concluded that other critical infrastructures highly depend
on the telecommunication network.
In 2006, the Canadian mobile and broadband sectors continued rapid growth. During 2006,
mobile subscribers increased by approximately 10%, compared with a 17% increase during 2005.
By the end of 2006, Canada’s wireless carriers offered coverage more than 98% of the
population (Report Information 2007). Canadian wireless offerings include a number of different
services and technologies. In particular, available services include cellular and digital cellular
service in the 800 MHz band, Enhanced Specialized Mobile Radiotelephony (ESMR) in the 800
MHz band and Personal Communications Services (PCS) in the 1.9 GHz frequency band. These
services are made possible by the technologies such as Advanced Mobile Phone Service (AMPS),
Code Division Multiple Access (CDMA), Time Division Multiple Access (TDMA) and Global

2
System for Mobile communications (GSM), high-speed fixed wireless, and satellite services
(Harrop 2002).
Subscribers in a disaster area can easily connect to network at anytime and from anywhere via
the radio waves. In general, a wireless or mobile network consists of a number of components,
including Base Stations (BSs), BS Controllers (BSCs), Mobile Switch Centers (MSCs), Home
Location Registers (HLRs), Visiting Location Registers (VLRs), Signaling System 7 (SS7), and
high-capacity trunks. The impact of a failure can be measured in terms of the number of users
affected and the duration of the outage indicated by (Chu and Lin 2006).
1.2 Motivation
To date, most of studies are on service continuity in wired networks. For wireless networks,
there have been only a few studies on the reliability and survivability of a wireless network in
emergency or disaster situations. However, because of the complexity of the wireless system,
these studies are usually focused on a specific part of the entire system. Jaimes-Romero et al.
(1997) analyzed the handoff function of Radio Base Station (RBS); Mendiratta and Witschorik
(2003) examined the survivability of the Public Switching Telephone Network (PSTN) based on
the network structure; and Varshney et al. (2001) presented an approach to modeling and
simulating of the wireless network. Most of studies today are in essence at the level of the
architecture of a telecommunication system (Jaimes-Romero et al. 1997, Mendiratta and
Witschorik 2003, Varshney et al. 2001) - i.e. what architecture will make a telecommunication
system more reliable, survivable and high Quality of Service (QoS).
Meanwhile, telecommunication system management is a very important function in each system.
Normally the management system is called as Operation and Management system (O&M). Due
to differences presented between any two different telecommunication systems, the management
system may reasonably be assumed to be different. Furthermore, differences may also be brought
to the manager of a particular telecommunication service provider company due to different
vendors for the same product function. There is a huge amount of work for a network manager to
get familiar with different O&M systems which may stay in a region. Thus, the problem appears

3
to be the lack of a management tool which can present and examine the different systems from
different product suppliers to conduct the management decisions efficiently.
The lack of the tool to support system management is especially serious when the
telecommunication system is in emergency caused by natural accidents, incidents, or the both. It
is reasonable to assume that when in emergency, the survivability of a telecommunication
system becomes an important issue, which can be caused by the damage of the system
components, the damage of the human operators who control the system to provide services, or
the both.
There is a great need to study the survivability of a telecommunication system especially from a
more fundamental perspective and in a more quantitative way. The study described in this thesis
fulfills these needs. Without the loss of generality as well as for the nature of such a type of
research, the study took a particular wireless telecommunication system as an example
throughout the whole study.
1.3 Research goal and objectives
The goal of this study was to develop a new approach for the telecommunication system
management in emergency situations. The approach may not only be useful to
telecommunication systems but also to other critical infrastructure such as physical facilities,
electric power generation, transportation, and water supplier system. The new approach should
be superior to the common “checklist” based paradigm of approach for the infrastructure
management system in practice. To achieve this goal, four research objectives were defined and
they are described as follows:
Objective1: Develop a general domain model of the wireless telecommunication system which
captures the service demand, function requirement, operation constraint, structure, and behavior.
Objective 2: Develop an effective system reconfiguration model for the wireless system to
achieve high survivability or service continuity in emergency situations.

4
Objective 3: Develop a dynamic model of the WCDMA (UMTS) system which can be used for
the verification of management decisions.
Objective 4: Develop a human-in-the-loop decision making system framework for the
emergency management of the service provider system.
These objectives are interdependent and will be carried out by following a stepwise process. The
first objective is to develop a general domain model. The second objective is to reconfigure the
component based on the general domain model. The study on the third objective was motivated
by the observation that the disaster management decision process is a human-in-the-loop (HITLP)
process. The operation of the disaster system may be highly unpredictable; therefore, the
simulation may be useful for managers to validate the decisions made in emergency situations.
The fourth objective gathers all the knowledge to implement a conceptual-based tool which can
be used by the emergency manager.
1.4 General research methodology
The new configuration approach is based on the function-behavior-structure paradigm called
FCBPSS framework (Lin and Zhang 2004) and the concept of general function and specific
function (Pahl and Beitz 1996). The FCBPSS comprises a set of core concepts: (1) structure, (2)
context, (3) state, (4) behavior, (5) function, and (6) principle. With the FCBPSS framework, the
domain model of an example wireless telecommunication system is established. This will
address objective 1.
A concept called General function and Specific function (G-S, for short) proposed by Pahl and
Beitz (1996) will be taken to study objective 2. General function in the G-S concept means the
function that can be achieved by a structure without being constrained in a particular
environment or context, while a specific function refers to the general function but constrained in
a particular environment. With the G-S concept, the specific functions are represented along with
the general function of a component and system. As a matter of fact, the general function, as

5
mentioned by Pahl and Beitz (1996), correspond to the behavior concept in the FCBPSS
framework.
With respect to objective 3, this thesis study applies the Petri Net theory to the model of the
system, as the Petri Net theory can capture all the characteristics of the dynamics of a wireless
service system.
With respect to objective 4, the whole system is implemented through a human-computer
interface so that decision makers can interact with simulation model and observe the system state
and behavior on the condition of various nature disasters.
1.5 Organization of the thesis
The remainder of the thesis will be organized as follows. Chapter 2 provides a literature review
to give further justification of the proposed work, particularly with respect to the research
objectives and methodologies described in Chapter 1 as well as key concepts and definitions of
the work intended. Chapter 3 presents an example WCDMA system that is used for the purpose
of illustration and preliminary verification of the research developed. Chapter 4 presents a
domain model of the WCDMA system. Chapter 5 presents a knowledge-base system for system
reconfiguration for high survivability of the system. Chapter 6 presents a Petri Net model of the
WCDMA system. Chapter 7 describes the design of Decision Making Support System (DMSS)
for the telecommunication network management in emergency situations. Chapter 8 presents
general conclusions of the work. In addition, it also discusses limitations of the present work and
further work which may overcome these limitations.
6
Chapter 2
Background and Literature Review
2.1 Introduction
This chapter is to provide a background of knowledge for the proposed work. It also serves as
further justification of the needs of the proposed objectives for this thesis study. In this regard,
there are comments and critiques on related work. In the remainder of this chapter, Section 2.2
gives a brief overview of the wireless telecommunication system. Section 2.3 discusses concepts
closely relevant to emergency,disaster,reliability, and survivability in the context of the
wireless telecommunication system. Section 2.4 discusses the service continuity of the WCDMA
system. Section 2.5 discusses service continuity management along with related work. Section
2.6 discusses the FBS framework which is an important tool for work domain analysis – one of
the general ideas underlying the approach of this thesis study to emergency management (see
Chapter 1). Section 2.7 presents a scheme of the knowledge base which is based on the FBS
framework. Section 2.8 discusses a decision making system for emergency and disaster
situations. Section 2.9 is a conclusion of this chapter along with discussion.
2.2 Wireless cellular system
2.2.1 History
In the 1990s, the second generation (2G) wireless networks emerged based on digital
transmission techniques. 2G systems aimed at providing a better spectral efficiency with a more
satisfied Quality of Service (QoS) in wireless communication, voice, low-speed data services,
and high security and authentication capabilities. Three major 2G network systems are: Global

7
System for Mobile communications (GSM), Digital AMPS (D-AMPS), and CDMA
(TIA/EIA/IS-95A).
GSM is a wireless telephone standard in Europe and widely used in Europe and other countries
today. The cellular network developed based on this standard is called GSM network. GSM
system uses Time Division Multiple Access (TDMA) technology to provide the radio access for
the mobile users. It allows several users to share the same frequency channel by dividing the
signal into different timeslots (GSM 2008).
Digital AMPS (D-AMPS) is another kind of the 2G mobile phone systems. It is used throughout
the North America, particularly in the United States and Canada. It adopts the same radio access
technique, TDMA, as used by GSM (Digital AMPS 2008). D-AMPS replace AMPS (first
generation analog mobile phone system). D-AMPS reuses the radio channel resources of AMPS
channels, allows for smooth transition between digital and analog systems in the same area, and
improves the network capacity and security.
CDMA is the abbreviation for Code Division Multiple Access communication. CDMA is a form
of spread spectrum communications. In 1989 the Telecommunications Industry Association (TIA)
adopted TDMA technology as the radio interface standard. Qualcomm, Inc., in 1990 proposed a
digital cellular telephone system based on CDMA technology. In July 1993, TIA voted on and
accepted IS-95 as the CDMA air interface standard (radio specifications). In 1998 a new revision
of the standard is called TIA/EIA-95. CDMA systems based on the IS-95 standard and related
specifications are referred to as CDMA (TIA/EIA/IS-95A). The standard defines the modulation
scheme, power control, call processing, handoffs, and registration techniques. A CDMA network
includes the same basic subsystems as other wireless systems, including a switching network,
controller, Base Station (BS), and Mobile Station (MS) (Harte 1999).
With the emergence of the Internet, high speed and large data service are the trend of
telecommunication system today. The third generation (3G) systems are designed for the support
of the multimedia communication, such as data, image and video. The concept of the 3G wireless

8
systems is defined by the International Mobile Telecommunications-2000 (IMT-2000) under the
auspices of the International Telecommunications Union (ITU).
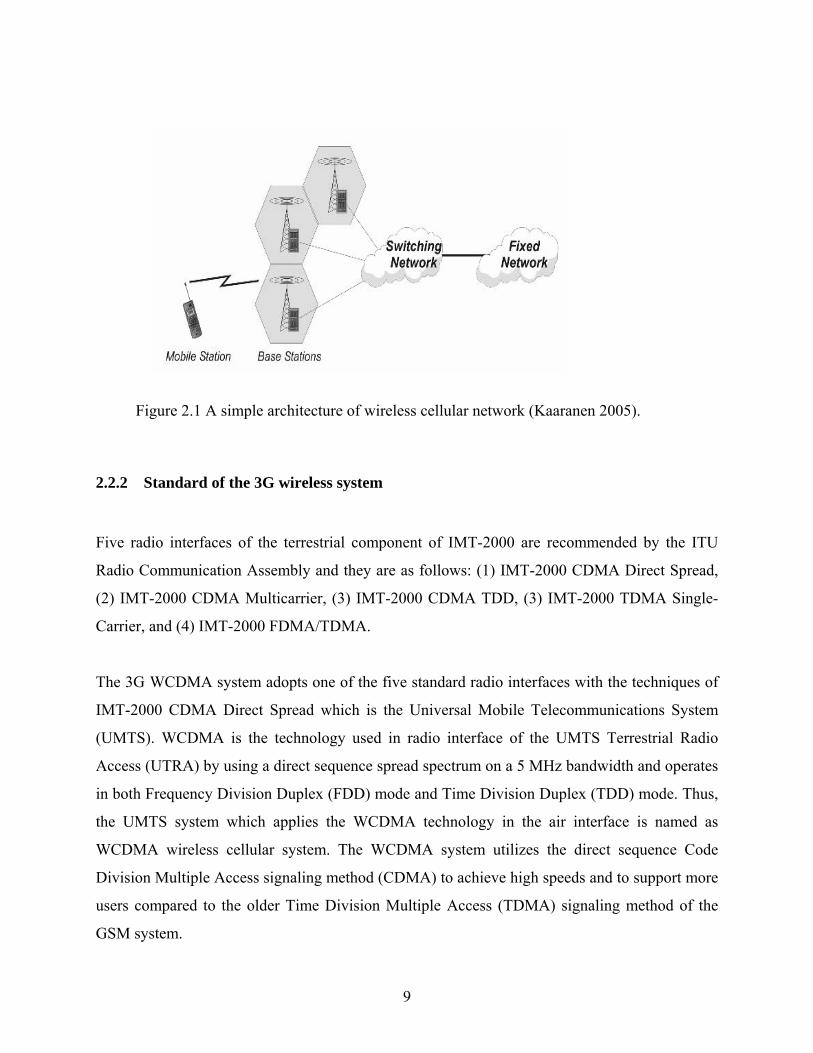
Figure 2.1 shows the general architecture of the wireless cellular system which provides various
services (voices, date, video, etc) to the mobile users (Kaaranen 2005). In this figure, the basic
architecture of any advanced cellular system consists of Mobile Station (i.e. Mobile phone), Base
Stations, a switching network and fixed network functionality for traffic backbone transmission.
The Base Station, called Node B in WCDMA system, performs wideband radio signal receiving
and transmitting (Rx and Tx), signal filtering and amplifying, signal modulation and
demodulation, and transport the service data from mobile station to network component, Radio
Access Controller (RNC) in the switching network.
The switching network comprises all the control and switching functional components except for
the Mobile Station and Base Station mentioned above. Theses components are interconnected by
the circuit groups such as Radio Access Controller (RNC), Mobile Switching Center (MSC),
Media Gateway (MGw), and Home Location Register (HLR). The detailed information about
these components will be described in Chapter 3. The user may originate a call by keying the
called number, and then depress the “send” button of the Mobile Station. The Base Station
receives the signal and delivers it to the switch network. The components of the switch network
receive the information, then and establish the successful connection among the selected circuits
group. Thus, the traffic data can be transmitted through these nodes following the routing or
switching schemes to the receivers. The receiver may be within the same switch network or may
exist in another network like the fixed network. The fixed networks can be the traditional public
telephony network, other mobile wireless networks (i.e. GSM, CDMA, WCDMA, etc.), or
Internet network.
9
Figure 2.1 A simple architecture of wireless cellular network (Kaaranen 2005).
2.2.2 Standard of the 3G wireless system
Five radio interfaces of the terrestrial component of IMT-2000 are recommended by the ITU
Radio Communication Assembly and they are as follows: (1) IMT-2000 CDMA Direct Spread,
(2) IMT-2000 CDMA Multicarrier, (3) IMT-2000 CDMA TDD, (3) IMT-2000 TDMA Single-
Carrier, and (4) IMT-2000 FDMA/TDMA.
The 3G WCDMA system adopts one of the five standard radio interfaces with the techniques of
IMT-2000 CDMA Direct Spread which is the Universal Mobile Telecommunications System
(UMTS). WCDMA is the technology used in radio interface of the UMTS Terrestrial Radio
Access (UTRA) by using a direct sequence spread spectrum on a 5 MHz bandwidth and operates
in both Frequency Division Duplex (FDD) mode and Time Division Duplex (TDD) mode. Thus,
the UMTS system which applies the WCDMA technology in the air interface is named as
WCDMA wireless cellular system. The WCDMA system utilizes the direct sequence Code
Division Multiple Access signaling method (CDMA) to achieve high speeds and to support more
users compared to the older Time Division Multiple Access (TDMA) signaling method of the
GSM system.

10
2.2.3 Architecture of the WCDMA wireless cellular system
This thesis focuses on the WCDMA wireless cellular system. The WCDMA system consists of a
number of logical network elements which are connected through open interfaces or access
points. These elements are grouped into the Radio Access Network (RAN) and the Core
Network (CN). The RAN handles all radio-related functions and Radio Resource Management
and Mobility Management (RRM and MM). The CN is responsible for switching and routing
calls and data connections to external networks, at the same time, to manage session and
mobility information, and Communication Management and Mobility Management (CM and
MM). The system is terminated by the component called User Identity Module (UIM), Mobile
Terminal (MT). UIM and MT interface with the user and the radio interface. Figure 2.2 depicts
the architecture of the WCDMA system. In this figure, the circles represent the functional
subsystems and the squares represent the physical platforms where the respective functional
subsystems reside (ITU-T Rec. Q.1711 1999, Yacoub 2002). The vertical bars between the
squares in Figure 2.2 indicate the physical interfaces between the respective physical platforms.
The two-sided arrows between the functional subsystems represent the functional interfaces
between the respective functional subsystems. The detailed information about these interfaces
can be found from Yacoub (2002).
Figure 2.2 IMT-2000 architecture with interfaces (Yacoub 2002).
11
2.2.4 Telecommunication Management Network (TMN)
TMN is a set of international standards for managing telecommunications networks. According
to ITU-T Recommendation M.3100 (1995), TMN is conceptually a separate network that
interfaces a telecommunication network at various different points to send or receive information
to or from it and to control its operations of the network. In other words, the principal idea of
TMN is to use an independent management network to manage a telecommunications network
via well-defined and standardized interfaces. Standards are required because telecommunication
networks typically consist of network elements of different technologies supplied by different
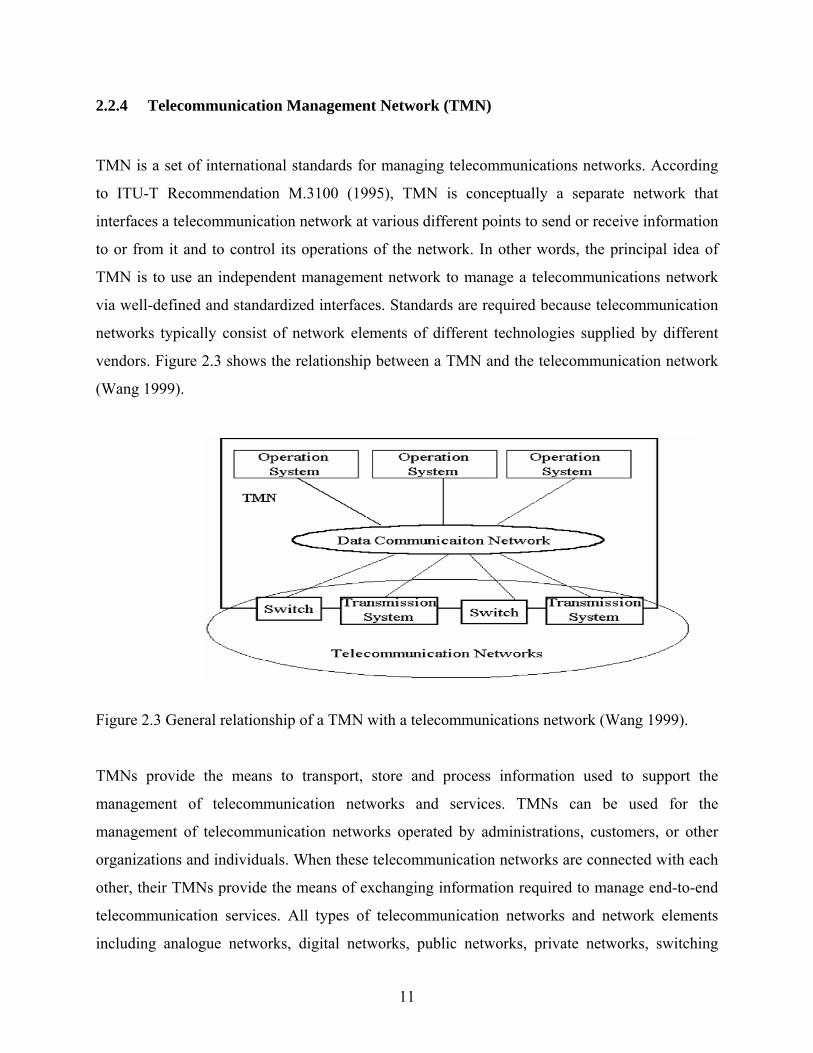
vendors. Figure 2.3 shows the relationship between a TMN and the telecommunication network
(Wang 1999).
Figure 2.3 General relationship of a TMN with a telecommunications network (Wang 1999).
TMNs provide the means to transport, store and process information used to support the
management of telecommunication networks and services. TMNs can be used for the
management of telecommunication networks operated by administrations, customers, or other
organizations and individuals. When these telecommunication networks are connected with each
other, their TMNs provide the means of exchanging information required to manage end-to-end
telecommunication services. All types of telecommunication networks and network elements
including analogue networks, digital networks, public networks, private networks, switching

12
systems, transmission systems, telecommunication software systems, and logical resources (such
as a circuit, path, and telecommunication services supported by the resources) are managed by
the TMN.
In Figure 2.4, the TMN functional architecture consists of a set of functional blocks, a set of
reference points, and a set of functional components. A functional block is a logical entity that
performs a prescribed management function. A reference point separates a pair of functional
blocks, and two functional blocks must communicate via a reference point. One or more
functional components make up a functional block (Wang 1999).
Figure 2.4 TMN functional architecture (Wang 1999).
TMN categorizes the management network into physical entities, functional entities, interfaces
and reference points. It structures various management services and offers a specification
methodology for interfaces according to the Open Systems Interconnection (OSI) system
management paradigm (Wang 1999).
However, the deployment of TMN is slow due primarily to its complexity and the inertia of
legacy systems (Glitho and Hayes 1995). Sidor (1995) said that the model of TMN in the future
should support the network and service layer management functionality.

13
The proposed research of this thesis works on building a Petri Net model based human-in-the-
loop (HITLP) management framework which is a useful supplement to the contemporary TMN.
Especially, the proposed HITLP management framework can support the network managers to
examine the dynamic system characteristics through a realistic simulation.
2.3 Definition
Emergency is defined as a situation which leads to an immediate risk to life, health, property or
environment (Emergency 2007). The criterion to judge a damage situation as emergency or not
is based on three conditions: (1) immediate threaten to life, health, property or environment, (2)
loss of life, health detriment, property damage or environmental damage, and (3) probability that
damage is escalated to cause an immediate danger to life, health, property or environment. A
narrow and working definition of emergency was also given by Redmond Fire Department,
located in City of Redmond, in Washington; emergency is defined as a condition that lasts 3-5
hours and is handled by calling 911. An example of the emergency would be a car accident or a
residential fire.
Disaster is defined as the impact of a natural or man-made hazard that negatively affects society
or environment (Disaster 2007). Disasters occur when hazards strike in vulnerable areas.
Hazards that occur in areas with low vulnerability do not result in a disaster. Hazards are
routinely divided into two types: natural and human-made. A natural disaster is the
consequence of when a potential natural hazard becomes a physical event (e.g., volcanic eruption,
earthquake, landslide, etc) that affects those vulnerable areas of human activities. A natural
hazard will hence never result in a disaster in areas without vulnerability, for example strong
earthquakes in uninhabited areas. Disasters having an element of human intent, negligence, or
error that involves the failure of a system are called man-made disasters. Although the term
disaster is subjective, it is often used in the developed world to refer to situations where local

14
emergency management resources are inadequate to counter-act the negative effects of the event
(Ezell et al. 2000, Samarajiva 2001).
Emergencies and disasters are co-existed, and emergencies may evolve to be a disaster. Contrast
to the emergency, the disaster causes serious negative effects and leads to huger damages to
society and environment (Disaster 2007). For example, the natural disaster is a kind of
emergency which can threaten lives and cause a large amount of infrastructures damage. In this
thesis, the emergency situation covers man-made incidents, emergencies and disasters. In other
words, the proposed work does not differentiate between these situations. As such, theories and
methodologies developed through this study can be equally applied to all these three situations.
For wireless networks, a network’s service ability to cope with emergencies is measured in three
ways (Snow et al. 2000, Baliga et al. 2004): reliability, availability and survivability.
Reliability (Stafford et al. 2004) is a network’s ability to perform a designated set of functions
under certain conditions for specified operational times. A reliable network is a network that
functions normally the vast majority of the time.
Availability (Stafford et al. 2004) is a network’s ability to perform its functions at any given
instant under certain conditions. Average availability is a function of how often something fails
and how long it takes to recover from a failure.
Survivability (Baker et al. 2004, Houck et al. 2003) is a network’s ability to perform its
designated set of functions given network infrastructure component failures, resulting in a
service outage, which can be described by the number of services affected, the number of
subscribers affected, and the duration of the outage.
Among the three ways as defined above, Baker et al. (2004) further distinguished the
survivability and reliability. Survivability can be viewed as a special case of reliability, where
survivability is defined in terms of specific threats or faults, while reliability is defined in terms
of general threats or faults.

15
A survivability network (Baker et al. 2004) is one that can continue to function at reduced
capability, even if disastrous things happen to isolated components with the network. Satfford et
al. (2004) addressed that today’s telephone networks are extremely reliable. Typically,
PSTN/PLMN infrastructure is designed for 99.999% availability; this means that the network is
able to complete calls, as in a normal operation, 99.999% of the time. Core network equipment
designs incorporate redundancy through the means such as dual power supplies, backup storage,
backup processors, working and protecting switching fabrics, working or protect port pairs on
line cards, and so on. To implement a survivable network, it is important to avoid a single point
of failure within a critical system (Baker et al. 2004, Ezell et al. 2000, Stafford et al. 2004).
2.4 Impact of the emergency to wireless telecommunication systems and related work
Moore et al. (2001) elaborated the potential vulnerability of the mobile telecommunications
infrastructure in Canada to natural hazards and indicated a number of concerns relevant to
emergency preparedness and management. Moore et al. (2001) also identified the specific
components of the telecommunications infrastructure to natural hazards in order to support the
emergency managers to make a reasonable assessment of vulnerability on a case-by-case basis
and to help the emergency managers be aware of the various components of a
telecommunications infrastructure they rely on and on their survivability in a disaster scenario.
Moor et al. (2001) listed the main components of a telecommunications infrastructure as well as
their impact to the telecommunication service in their report to Canadian Office of Critical
Infrastructure Protection and Emergency Preparedness. Refer to Table 2.1.

16
Table 2.1 Vulnerability of wireless network components.
Components of a telecommunications infrastructure
Components of wireless system included
The natural hazards affecting the components
Impact to services
Physical buildings - Switching equipment, controllers, and other radio equipment
- Dispatch facilities of first responders
- Antennas on roofs of buildings
- Blowing snow, rain, or hail
- Earthquakes, hurricanes, floods, and tornadoes
Service outage to mass users
Power supply - Switching or RF, equipment, dispatch centers
- Earthquakes, hurricanes, floods, and tornadoes
Service outage to mass users
Transmission links - Landlines (Coaxial and Copper) - Fibre optic - Microwave - UHF
- Breaks - Water damage
Service outage to partial users
Telecommunications towers
- Self supporting tower - Guyed tower
- Ice load - Wind load
Service outage to partial users
Antennas - Antennas - Hurricanes - Wind more than
140km/h
Service outage to partial users
There are a few studies on the survivability of the mobile network. Park et al. (2006) merely
studied the reliability of the radio access component, and Base Station. Snow et al. (2000) and
Chu et al. (2006) presented the impact of the different network components failures to the
services as well as the ways to improve the network survivability (see Table 2.2).
17
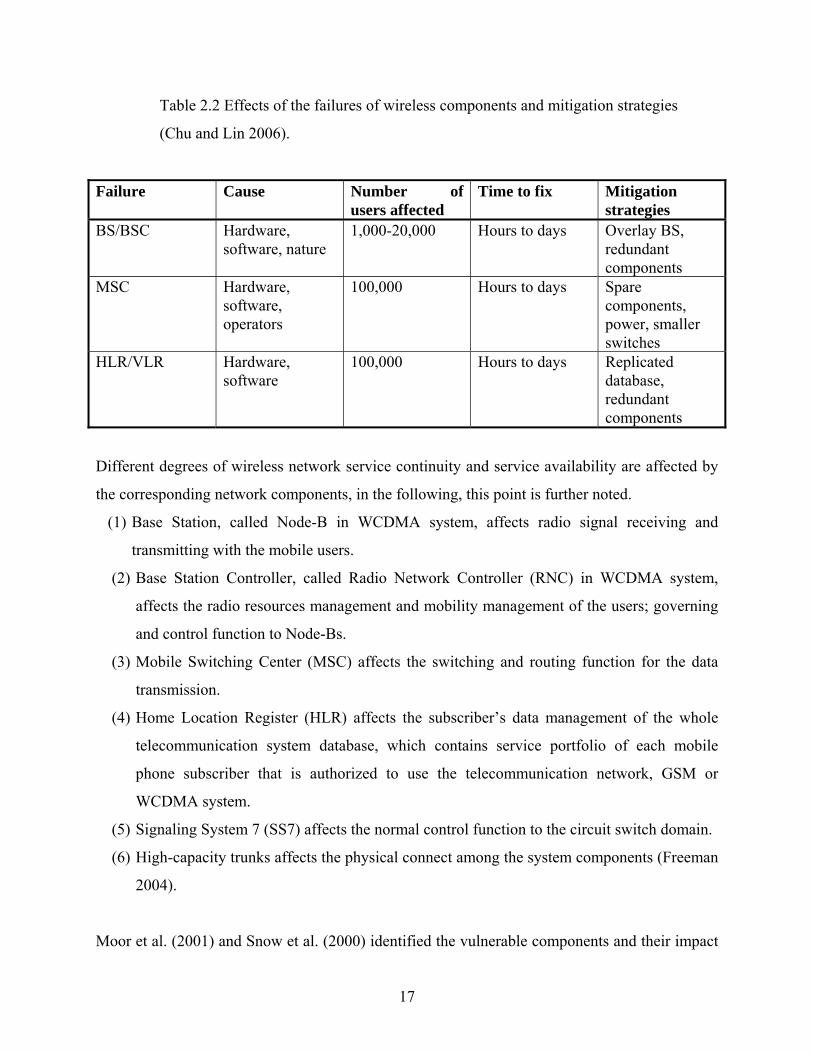
Table 2.2 Effects of the failures of wireless components and mitigation strategies
(Chu and Lin 2006).
Failure Cause Number of users affected
Time to fix Mitigation strategies
BS/BSC Hardware, software, nature
1,000-20,000 Hours to days Overlay BS, redundant components
MSC Hardware, software, operators
100,000 Hours to days Spare components, power, smaller switches
HLR/VLR Hardware, software
100,000 Hours to days Replicated database, redundant components
Different degrees of wireless network service continuity and service availability are affected by
the corresponding network components, in the following, this point is further noted.
(1) Base Station, called Node-B in WCDMA system, affects radio signal receiving and
transmitting with the mobile users.
(2) Base Station Controller, called Radio Network Controller (RNC) in WCDMA system,
affects the radio resources management and mobility management of the users; governing
and control function to Node-Bs.
(3) Mobile Switching Center (MSC) affects the switching and routing function for the data
transmission.
(4) Home Location Register (HLR) affects the subscriber’s data management of the whole
telecommunication system database, which contains service portfolio of each mobile
phone subscriber that is authorized to use the telecommunication network, GSM or
WCDMA system.
(5) Signaling System 7 (SS7) affects the normal control function to the circuit switch domain.
(6) High-capacity trunks affects the physical connect among the system components (Freeman
2004).
Moor et al. (2001) and Snow et al. (2000) identified the vulnerable components and their impact
18
to the services of the wireless network in an emergency situation. They, however, have not
accounted for the Mobile Station (i.e. Mobile phone) which interfaces with the user and the radio
interface. The mobility of the mobile equipment is affected by the location of the users and the
service continuity is related to the dynamic position of the users and their mobile phone on
condition they are moving to another Node B’s service area or far away from the available Node.
Bs. Jorstsad (2004) analyzed the service continuity of mobile services and stated that when the
user is moving and is accessing services from different places, the location of a service and its
components relative to the user’s location will have great influence on its availability, quality,
continuity and personalization.
2.5 Service continuity management and related work
Telecommunication provides the transmission or reception of signs, images, sound or
intelligence of any kind over wires, by radio waves or other technical systems. In emergency
situations, infrastructure damage, loss of power, congestion and other forms of service degraded
the performance in mobile telephone systems. A failure of these components or links further
affects the service provision.
Barker and Maxwell (1995) listed the major shortfalls to disaster areas:
Inadequate voice services;
Limited sharing of information among the emergency support functions in the Disaster
Field Office (DFO);
Limited access to distributed information sources;
Inability to send and receive e-mail messages among users and regional offices;
Unknown or difficult procedures for addressing e-mail users;
Congested wireline and wireless services;
Lack of service provision for telecommunication equipment and capabilities; and
Unknown radio frequencies and excessive radio interference.
Such shortfalls indicate the challenges in providing communication capabilities to emergency

19
users in the disaster area. Users demand the exchange of information among other responders,
technical experts, analysts, and emergency managers. These communication capabilities include
network access, information processing capabilities and applications, and wireline and wireless
telecommunications equipment.
The essence to the telecommunication service in emergency situations is to balance the service
demands and supplied services as shown in Figure 2.5. The requirement for balance is the core
issue for many studies on the telecommunication network reliability and survivability.
ServicesDemands more
Figure 2.5 Unbalance between Service supplier and demands.
To explore the balance between service demands and supplies, Hong et al. (2005) presented a
service continuity mechanism based on applying IPv6 at a mobile station for CDMA/WLAN
inter-working. Jorstad and Dustdar (2004) studied a new function layer to support service
continuity within heterogeneous networks and heterogeneous devices. Turina and Furuskar
(2005) proposed a new mechanism to shorten the interruptions for the packet date service
continuity between GSM and WCDMA changeover, and suggested developing middleware
components to control a network. Snow et al. (2000) proposed the SONET Rings to interconnect

20
Base Station and MSC, use of multifunction and multimode phones, and use of an overlay
network to improve network survivability for service continuity. The nature of these studies is to
design a more flexible system, especially at the level of system architecture. However, the
benefit achieved by the technology must be balanced against the acceptable reliability and
survivability to the network. Actually, they are generally based on a fixed configuration of the
telecommunication system and proposed to improve the network service capability by changing
the structure and deploying new functions into the system.
It is noted that approach of this thesis study to maintain service continuity for the survivable
telecommunication system is different from these studies. Certainly, these studies are
complementary to this thesis study because this thesis studies are built upon a particular
architecture of the telecommunication system such as WCDMA system.
In this study, the emphasis on reconfiguration implies a new paradigm in emergency
management, that is, the first priority of emergency management is to turn attention to a system
itself, instead of requesting a help from other systems. This new paradigm could provide the
most rapid response. This new paradigm is based on the following assumptions: (1) A system
will not run at its full capacity, and (2) The system capacity can be achieved by several different
configurations.
2.6 The FBS framework
2.6.1 Concept of FBS model and the implementation
Design theory and methodology for general systems has been extensively studied in the past
decades. Several well-known proposals of design theory and methodology include: Systematic
Design Methodology (Pahl et al. 1996), Axiomatic Design Theory (Suh 1990). This thesis study
pursued the direction of approaches which were based on the notions such as the structure,
behaviour, and function. The FBS framework was initially developed for increasing intelligence
of computer program systems for fault diagnosis and reasoning (Kuipers 1984, De Kleer 1984).

21
The knowledge representation along this direction is called Function-Behaviour-State (FBS)
model as showed in Figure 2.6. Pioneer studies on this model of design refer to the work by
Ulrich and Seering (1988, 1990).
Figure 2.6 FBS model (Umeda et al. 1995).
FBS modeling defines a function as “a description of behavior abstracted by human through
recognition of the behavior in order to utilize it” (Umeda et al. 1990) and represents it as an
association of two concepts: human intention represented in the form of to do something and
behavior that can exhibit the input and output relation function.
Umeda et al. (1990) indicated the wide usefulness of the FBS model for function, behaviour, and
structure of machines and its application in the context of various applications, such as computer
aided design, simulation, and diagnosis such as in building CAD systems, simulation systems,
and diagnosing systems which interact with users and simulate human reasoning.
Umeda and Tomiyama (1995) and Umeda et al. (1990) addressed a modeling scheme of the FBS
concept design. Umeda et al. (2005) employed the FBS modeling scheme to the product upgrade
design; Kruchen (2005) proposed the FBS framework into the software engineering to direct the

22
software design activities in large system engineering projects. Gero et al. (2003) showed the
methods that FBS view can be useful to support the interaction of situated design agents. To
support the FBS conceptual design, Umeda and Tomiyama (1995) presented a functional design
support system called “FBS modeler” to implement the FBS framework.
2.6.2 FCBPSS framework
The FCBPSS Framework is proposed by Lin and Zhang based on these previous studies of FBS
(2004, 2005). The FCBPSS framework modified and extended the Function-Behavior-State
(FBS) Model to have more elaborated layers. The FCBPSS framework contains a set of core
concepts, including: (1) structure, (2) state, (3) behavior, (4) principle, (5) function, (6) context,
(7) relationship among concepts (1)–(6), and (8) system decomposition. Figure 2.7 shows these
concepts and their relations.
Figure 2.7 Architecture of FCBPSS framework.
Structure and state. A system has a structure that is a set of entities which are connected in a
meaningful way. Entities are represented by a set of properties, and these properties are
called the states. The states are given a name. The name of the state is the state variable.
23
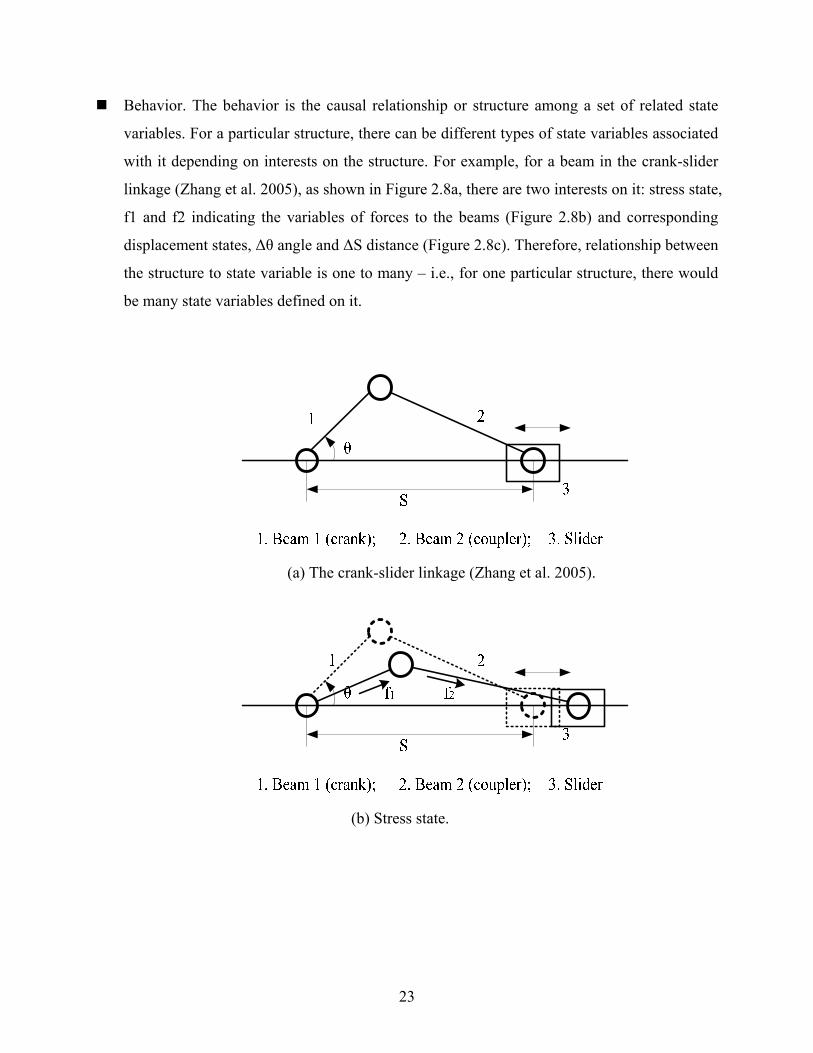
Behavior. The behavior is the causal relationship or structure among a set of related state
variables. For a particular structure, there can be different types of state variables associated
with it depending on interests on the structure. For example, for a beam in the crank-slider
linkage (Zhang et al. 2005), as shown in Figure 2.8a, there are two interests on it: stress state,
f1 and f2 indicating the variables of forces to the beams (Figure 2.8b) and corresponding
displacement states, Δθ angle and ΔS distance (Figure 2.8c). Therefore, relationship between
the structure to state variable is one to many – i.e., for one particular structure, there would
be many state variables defined on it.
(a) The crank-slider linkage (Zhang et al. 2005).
(b) Stress state.

24
(c) Displacement state.
Figure 2.8 The concept of behavior.
Principle. The principle governs or accounts for the behavior in such a way that the causal
relationship is derived from the principle.
Function and Context. The function is defined as a purpose in the mind of human users
and can be realized by the system (structure) owing to certain behaviors existing in the
structure. The function has two aspects: (1) general and (2) specific. The general function
is derived from the behavior of the system which is not tied to a particular application.
The specific function is function of the system which is under a particular interest or
concern and is thus governed by a particular context. The context is the particular
environment where the particular system operates or works or makes sense.
System Decomposition: A system can be decomposed into subsystems and components
within the system domain. The system structure, the behavior, the principle, the states,
and the function concepts follow system decomposition. This means that it makes sense to
speak of the behavior and states of a system (or subsystem, component)
These concepts are related to each other – see Figure 2.8. In particular, the structure concept is
located at the bottom, followed by the state, the behavior, and the function concepts. The

25
principle concept is situated between the state concept and behavior concept in order to give
rationale for constraint equations such that given a set of values of the active state variables, the
passive states are found through the evaluation of the constraint equations. The context concept
is situated between the behavior and the function, which gives the rationale from the behavior to
the function (Lin and Zhang 2004).
However, different application domains may use the FBS concept in their domain specific ways.
Kruchen (2005) examined the obstacles between the manufacture design and software design,
which hinder the design methodologies developed for one domain used for another domain. For
instance, software developers’ use of the term “design” differs from that of engineers in other
disciplines, making some of comparisons and analogies somewhat skewed or simply invalid.
Qian and Gero (1996) presented formalism for cross-domain design via FBS paths and provided
the mapping approach to fill in the gap to the definition of the functions, behaviors and structures
in different domain.
2.7 FBS modeler and knowledge base system
To support the FBS conceptual design, Umeda and Tomiyama (1995) presented a functional
design support system called ‘FBS modeler’ to implement the FBS framework in Figure 2.9. To
support functional design in the FBS modeler, the modeler has two kinds of knowledge bases: a
function knowledge base and a behavior knowledge base.

26
Figure 2.9 FBS modeler (Umeda et al. 1995).
The function knowledge base stored all function prototypes. The function prototype is
the functions from existing design results. The function can be decomposed into sub-
functions by tasks decomposition. Tasks decomposition means that the implementations
of the functions are not casually related with each other; they can occur independently
(Umeda and Tomiyama 1995). The sub-functions can be divided, and so on, until the
level where physical behaviors perform such sub-functions. Subsequently, the
functional structure is copied to the physical structure.
The behavior knowledge base is a building block consisting of three kinds of elements:
entities, relations among entities, and physical phenomena. Each physical feature is
constructed by the designer in order to be a meaningful block for representing a function.
In the architecture of the FBS modeler, there are three subsystems which cooperate with the two
databases to implement the FBS concept model.
The Qualitative Process Abduction system (QPAS) is to support the casual
decomposition, derived from physical phenomena that realize the given state transition.
Casual decomposition means that behavior resulting from this decomposition is casually
related with each other and their interaction.
The Function Redundancy (FR) designer is designed to implement the function
redundancy. In this context, a function that can be realized by other physical features
than the feature that realizes the function in its normal state.

27
The Qualitative Reasoning System (QRS) gives representational scheme of behaviors
and states and executes the behavioral simulation.
2.8 Decision making system in emergency situations
The network manager (decision maker) acquires the system status and makes the decision to
enable or disable associated events to meet the required specifications, typically safety
requirements. The human operator performs the enabled events to control the system. Lee and
Hsu (2003) presented a supervisory based human-in-the-loop remote control system. The Petri
Net approach is used to model, design, and verify the supervisory system. Fales et al. (2005)
presented dynamic modeling, controller design, and Virtual Reality (VR)-based human-in-the-
loop real-time simulation for a wheel loader control system. Based on their approach, this thesis
study further develops the decision making system in Figure 2.10 to manage the WCDMA
system in emergency situations. In Figure 2.10, the system works under the management from
the control model in the decision making system. The information of the system states is
feedback and stored in the system database as the input variants of the control model. Meanwhile,
network manager can observe the system states through Human Monitor and make the corrective
action so as to have the system work as desired (see Figure 2.10).
Figure 2.10 Decision making system.

28
It is noted that in this thesis study, Petri Net theory and Coloured Petri Net (CPN) design tool
was used to model the WCDMA system and take the role of the Control Model when either a
human or a computer makes decisions to reconfigure the system resources if necessary. Because
the state and behavior of the “new” system are usually not easily predictable to the human
decision makers, simulation of the state and behavior of the “new” system become necessary.
2.9 Conclusion
Building models to enhance the service continuity of the wireless system in emergency situations
involves the domains of threaten scenarios, system infrastructure, system and decision
management. This chapter systematically navigates through the literature streams of continuous
service and emergency situations to understand the current state of knowledge for maintaining
the service in the disaster environment. Among all the existing studies reviewed, it appears that
the FBS concepts can bring research from a new aspect rather than the conventional design
theory in telecommunication domain. This implies that it is novel to apply the FBS to the domain
modeling of the telecommunication system, which is the first objective of this thesis study.
Lee and Hsu (2003) presented a Petri Net model in the human-in-the-loop design. In their work,
the Petri Net model was mainly used to verify a supervisory system which prevents human errors.
The proposed work in this thesis, especially objective 2 goes beyond the scope of their work. In
objective 3, a general Petri Net model which describes the dynamics of the telecommunication
system will be developed. Such a model can be used for all management related issues including
design verification issue as Lee and Hsu (2003) did.
With respect to objective 2 described in Chapter 1, there appears no work in the area of the
telecommunication system. In the area of general manufacture systems, reconfiguration is well
studied; yet the existing reconfiguration approach is mostly based on the condition that the
system is reconfigured to meet new tasks; there is no consideration that components are damaged.

29
With respect to objective 4, contemporary TMN has not considered the survivability and its
management. As far as disaster management, the existing paradigm is based on the redundancy
in design - simply put some spare components in stock prepared for emergency.

30
Chapter 3
An example WCDMA system
3.1 Introduction
This chapter describes an example WCDMA system for the purpose of emergency situations.
Section 3.2 presents the detailed background of the WCDMA. It introduces the history of the
development of the WCDMA system, the service the system can provide, the architecture of the
system, and network management. Section 3.3 describes the example WCDMA system which
will be used throughout discussions in subsequent chapters. Section 3.4 is the summary of this
chapter.
3.2 Background
3.2.1 History of the WCDMA development
The first generation (1G) is analogical system with limited roaming capacity, and only allowed
low quality voice calls. Advanced Mobile Phone System (AMPS) is the analog mobile phone
system standard developed by Bell Labs and was the main standard (1982-1992) for the first
generation system.
The second generation (2G) systems is digital, and it increases the network capacity and
improves roaming capacities. The 2G system includes the Global System for Mobile
Communications (GSM), CdmaOne and Digital version of AMPS (D-AMPS).
The third generation (3G) system is an upgrading version of the 2G system. It is based on the
International Telecommunication Union (ITU) family of standards and International Mobile

31
Telecommunications-2000 (IMT-2000). IMT-2000 is a global standard for the 3G wireless
communication as defined by the International Telecommunication Union in 1999.
The 3G system provides access to telecommunications services offered by the fixed networks
and to other specific services of the mobile users. The 3G terminals, i.e. Mobile phone for 3G
network, can be connected to earth or satellite networks, and they can be designed for mobile or
fixed uses, for public or private networks. The 3G system provides very efficient
communications with a high speed and QoS.
Universal Mobile Telecommunications System (UMTS) is the European vision of the 3G
systems of the family of IMT-2000 standards. UMTS is the logical evolution of the community
GSM to the third generation. In January 1998, European Telecommunications Standards Institute
(ETSI) adopted the WCDMA technology (Wideband CDMA) in particular Frequency Division
Duplex (FDD) or Time Division Duplex (TDD) for the radio access (Kara et al. 2006).
UMTS, in the terrestrial components, has three types of cells: Macro Cell, Micro Cell, and Pico
Cell. The Macro Cell has radios from 1 km to 35 km and it is destined to offer rural coverage and
highways for vehicles or other objects that move at high speed (114 Kbit/s). The Micro Cell has
radios range from 50 m to 1 Km .It offers service to fixed users or who move slowly with a high
density of traffic (urban) with 384 Kbit/s speeds. The Pico Cells has radios until 50 m, and offers
located coverage and interior coverage, with speeds of the 2 Mbit/s.
Wideband Code Division Multiple Access (WCDMA) is a UMTS 3G mobile network
technology that is used in Europe in the new IMT-2000 frequency bands. WCDMA was
designed to provide efficient capacity for modern mobile multimedia applications and mobile
telephone services. The WCDMA has a bandwidth around 5 MHz. This wide bandwidth
supports high data transfer rates and also provides performance benefits due to the diversity of
the broadcast frequency. In addition, a new technology called HSDPA will bring even higher
downlink speeds over WCDMA radio access networks (Mishra 2004).

32
3.2.2 Services of the WCDMA system
The services are what a network, operators or service providers, offers to its customers
(Kaaranen 2005). At the start of the WCDMA system era, almost all traffics were about voice.
With the development of the Internet technology, WCDMA systems provide the new function
through the Internet. This new function is about the TCP/UDP/IP traffic in the WCDMA
network. At the same time, the transition from voice to data occurred; the telecommunication
traffic system moved from circuit-switched connections to packet-switched connections in order
to support high speed data services. Meanwhile, the WCDMA system takes the Quality of
Service (QoS) as a general guideline. Therefore, the delay-critical applications such as speech
and video telephony will be carried on both circuit-switched bearers and packet-switch bearers
(Hernandez-Valencia and Chuah 2000, Zhang 2002, Zheng et al. 2003).
The best known new service feature of the WCDMA system is its higher user bit rates on the
circuit-switched connections with 384 Kbps and on packet-switched connections with up to 2
Mbps. Higher bit rates naturally facilitate some new services, such as video telephony and quick
downloading of data with the required QoS. There is a brief introduction of the two categories of
services as follows.
(1) Services and QoS
In general, applications and services can be divided into different groups, depending on how they
are considered. Like new packet-switched protocols, UMTS/WCDMA attempts to fulfill QoS
requests from the application or the user. In 3G WCDMA (UMTS) system, four traffic service
classes have been identified. The main distinguishing factor between these classes is how delay-
sensitive the traffic is: the conversational class is meant for very delay-sensitive traffic, while the
background class is the most delay-insensitive. They are listed as below.
Conversational:
The best-known application of this class is speech service over circuit-switched bearers.
With Internet and multimedia, a number of new applications will require this type, for

33
example voice over IP and video telephony. This is the only type of the four services
where the required characteristics are strictly imposed by human perception.
Streaming:
Multimedia streaming is a technique for transferring data such that it can be processed as
a steady and continuous stream. Streaming technologies are becoming increasingly
important with the growth of the Internet, for instance, (1) Web broadcast and (2) video
streaming on demand.
Interactive:
When the end-user, either a machine or a human, is on line requesting data from remote
equipment (e.g. a server), this scheme applies. Examples of human interaction with the
remote equipment are Web browsing, database retrieval, and server access.
Background classes:
Data traffic of applications such as e-mail delivery, SMS, downloading of databases and
reception of measurement records can be delivered background since such applications
do not require immediate action. The delay may be seconds, tens of seconds or even
minutes. Background traffic is one of the classical data communication schemes that are
broadly characterized by the fact that the destination is not expecting the data within a
certain time, e.g. E-mail, Multimedia Messaging Service (MMS), and Short Messaging
Service (SMS).
Corresponding to the different service demands above and the relevant QoS, WCDMA terminals
set up connection with larger set of parameters indicating the radio access capabilities of the
particular terminal. These capabilities determine what is the maximum user data rate supported
in particular radio configuration and given independently for the uplink and downlink directions.
32 kbps class: this is intended to provide basic speech service, including Adaptive Multi
rate(AMR) speech as well as some limited data rate capabilities up to 32 kbps,
64 kbps class: this is intended to provide speech and data service, with also simultaneous
data and AMR speech capability,
128 kbps class: this class has the air interface capability to provide for example video
telephony or various other data services,

34
384 kbps class is being further enhanced from 128 kbps to support advanced packet data
methods provided in WCDMA,
768 kbps class has been defined as an intermediate step between 384 kbps and 2 Mbps
class, and
2 Mbps class: This is the state of the art class and has been defined for downlink
direction only.
(2) Location services
Location-based services and applications are one of the new functions in 3G WCDMA (UMTS)
system. A location-based service is provided either by a telecommunication operator or by a
third party service provider that utilizes available information on the terminal location. For
instance, before traveling to an unknown city abroad, one may download information such as a
map and other data through WCDMA mobile phone. By clicking the icon on the map, one gets
information from the point. In emergency situations, the service may provide important location
information to the victims so that they can arrange the evacuations routes.
3.2.3 Architecture of the WCDMA system
The cellular network is a complex system that includes architecture, procedures and services
both on user, network and management levels. Figure 3.1 shows a general architecture of the
WCDMA network, which consists of three interacting domains: the User Equipment (UE),
UMTS Terrestrial Radio Access Network (UTRAN) and Core Network (CN). The WCDMA
connects to the external network: Public Switching Telecommunication Network (PSTN) and
Internet network. These elements are interconnected by transmission links – wired or wireless.
The UE is the mobile phone that communicates with UTRAN via the air-interface. The radio
link is the duplex communication channel from the Base Station to each mobile user and from
user to Base Station. UTRAN provides the air-interface access method for the UE. CN provides
switching, routing and transit for the user traffics. It also stores databases and provides network
management functions. From the specification and standardization point of view, both UE and

35
UTRAN consist of completely new protocols; they are developed with the needs of the new
WCDMA radio technology.
The definition of CN is adopted from GSM network and upgrade by following 3GPP R4
standard. In 3GPP R4, the CS domain structure was given an alternative implementation method,
CS domain architecture defines MSC/VLR division, where call control functionality and the
VLR are brought into an entity called the ‘MSC server’. Respectively, user plane connectivity
and related items (e.g., network inter-working) are brought into an entity called the ‘Media
Gateway’ (MGw).
In 3GPP R4 and R5 UMTS standards (3GPP TR 25. 931 2004, 3GPP TS 23.002 2003), the
Gateway MSC server replaces the GMSC in the 3GPP Release 99. The GMSC server mainly
comprises the call control and mobility control parts of a GMSC. The Gateway MSC (GMSC)
server may be used to interface with external circuit-switched networks. A GMSC is responsible
for routing a circuit witched call to its final destination in external networks.
When the separation of the two components, MSC server and CS-MGw, is implemented, it
opens up a few new interfaces within the CS domain such as the Mc, Nc, Nb, E, G, which
defined the information control and transmission mechanism among MSC servicers and CS-
media gateway. The detailed information is described by Kaaranen (2005) and Yacoub (2002).
In the PS domain, the General Packet Radio Service (GPRS) subsystem transmits IP packets.
GPRS consists of two sub components: the SGSN for data packet delivery and the GGSN for
gateway to Internet or Intranet.
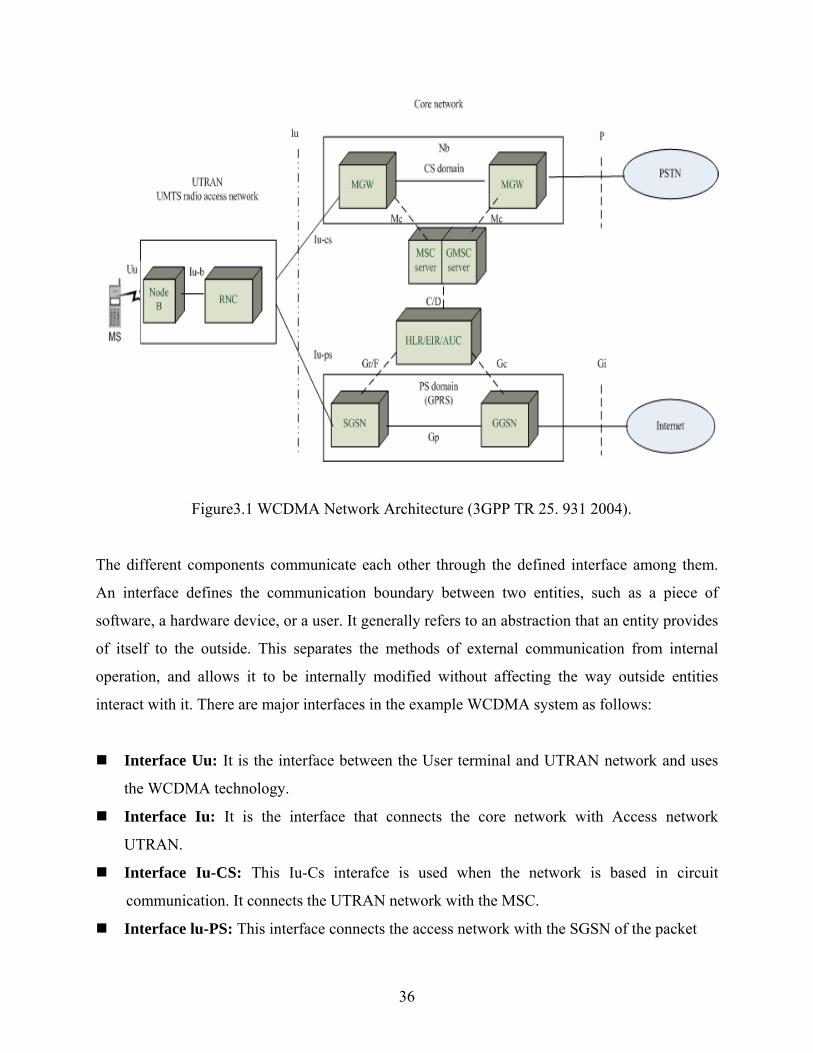
36
Figure3.1 WCDMA Network Architecture (3GPP TR 25. 931 2004).
The different components communicate each other through the defined interface among them.
An interface defines the communication boundary between two entities, such as a piece of
software, a hardware device, or a user. It generally refers to an abstraction that an entity provides
of itself to the outside. This separates the methods of external communication from internal
operation, and allows it to be internally modified without affecting the way outside entities
interact with it. There are major interfaces in the example WCDMA system as follows:
Interface Uu: It is the interface between the User terminal and UTRAN network and uses
the WCDMA technology.
Interface Iu: It is the interface that connects the core network with Access network
UTRAN.
Interface Iu-CS: This Iu-Cs interafce is used when the network is based in circuit
communication. It connects the UTRAN network with the MSC.
Interface lu-PS: This interface connects the access network with the SGSN of the packet

37
network.
Interface Iu-B: This interface connects the RNC with Node Bs.
Interface Mc: This interface connects the MGw with the MSC server.
Interface Nb: This interface connects MGw with another MGw.
Interface Gp: This interface connects the SGSN with GGSN.
3.2.4 Features of the Wideband Code Division Multiple Access (WCDMA)
WCDMA is the radio access technique used for third generation wireless cellular systems.
UMTS 3G network uses WCDMA as its air interface. The main system design parameters of the
WCDMA are described as follows.
WCDMA is a wideband Direct-Sequence Code Division Multiple Access (DS-CDMA)
system, i.e. user information bits are spread over a wide bandwidth by multiplying the user
data with quasi-random bits, called chips, derived from CDMA spreading codes. In order to
support very high bit rates (up to 2 Mbps), the use of a variable spreading factor and multi
code connections are supported.
The chip rate of 3.84 Mcps used leads to a carrier bandwidth of approximately 5 MHz. The
inherently wide carrier bandwidth of WCDMA supports high user data rates and also has
certain performance benefits, such as increased multi-path diversity.
WCDMA supports highly variable user data rates. Each user is allocated frames of 10 ms
duration, during which the user data rate is kept constant. However, the data capacity among
the users can change from frame to frame.
WDCMA supports two basic modes of operation: Frequency Division Duplex (FDD) and
Time Division Duplex (TDD). In the FDD mode, separate 5 MHz carrier frequencies are
used for the uplink and downlink respectively, whereas in the TDD mode only one 5 MHz is
time-shared between uplink and downlink. Uplink is the connection from the mobile to the
base station, and downlink is that from the base station to the mobile.

38
WCDMA supports the operation of asynchronous base stations. There is no need for a
global time reference, such as a GPS. Deployment of indoor and micro base stations is easier
when no GPS signal needs to be received.
WCDMA air interface has been designed in such a way that advanced CDMA receiver
concepts, such as multi-user detection and smart adaptive antennas can be deployed by the
network operator as a system option to increase capacity and coverage.
WCDMA is designed to be deployed in conjunction with GSM. Therefore, handovers
between GSM and WCDMA are supported in order to be able to leverage the GSM
coverage for the introduction of WCDMA system.
3.2.5 Protocols of the WCDMA system
From the functions of the network components mentioned above, WCDMA wireless cellular
system provides three major functions to manage the traffic transmission: (1) Communication
Management; (2) Mobility Management; (3) and Radio Resource Management.
Communication Management (CM) covers all of the functions and procedures related to the
management of user connections, such as call handling for CS connections, session management
for PS connections, as well as handling of supplementary services and short-message services.
Mobility Management (MM) covers all of the functions and procedures needed for mobility and
security (e.g., connection security procedures and location update procedures). Most of the MM
procedures occur within the CN and its elements, but in the 3G part of the MM functions are also
performed in UTRAN for PS connections.
Radio Resource Management (RRM) is a collection of algorithms UTRAN uses for management
of radio resources. These algorithms handle, for instance, the power control for radio
connections, different types of handovers, system load and admission control. RRM is an

39
integral part of UTRAN.
In order to achieve such functions, the network elements need to communicate among each other
under the control of the defined standards. These control duties are then refined into a set of
protocols. A protocol (Protocol 2008) is the rules governing the syntax, semantics, and
synchronization of communication. Protocols may be implemented by hardware, software, or a
combination of the two. In the field of telecommunications, a communications protocol is the set
of standard rules for data representation, signaling, authentication and error detection required to
send information over a communications channel.
At the lowest level, a protocol defines the behavior of a hardware connection. The interface is
different from different elements pair and the corresponding protocols guiding the data
transmission along the interface link between components and control the execution of network
functions in a coordinated manner across system interfaces (Holma and Toskala 2002, Yacoub
2002.). A simplified view of the 3G WCDMA protocol architecture is showed in Figure 3.2.
Figure 3.2 Typical protocol architecture of the 3G WCDMA (García et al. 2002).

40
WCDMA is the key radio access technique used in air- interface (Uu) of UMTS 3G wireless
system. The Radio Interface Protocol Reference Model is taken for instance (Holma and Toskala
2002, Yacoub 2002.) which has three-layer protocol reference model illustrated in Figure 3.3.
Three layers of protocols are, respectively, denoted as L1, L2, and L3, and their domain specific
names are given as follows:
L1 – radio physical layer of protocols.
L2 – radio link layer of protocols.
L3 – radio network layer of protocols
Figure 3.3 Radio interface protocol reference model (Kaaranen 2005)
L1 provides mapping functions between transport channels and WCDMA physical channels. L2
provides mechanisms for dynamic sharing of capacity in the WCDMA radio interface. This layer
(L2) allows the upper layer to see only a set of radio bearers (channels), along which different
kinds of traffic can be transmitted over the radio link. Further in L2, the Medium Access Control
(MAC) sub-layer controls the use of the transport block capacity by ensuring that capacity
allocation decisions are executed promptly at both ends of the radio interface. The Radio Link
Control (RLC) sub-layer then adds regular link layer functions onto the logical channels

41
provided by the MAC sub-layer. Due to the characteristics of radio transmission some special
ingredients have been added to RLC sub-layer functionality. The Packet Data Convergence
Protocol (PDCP) makes the UMTS radio interface applicable to carry Internet Protocol (IP) data
packets. Another Convergence protocol (e.g. BMC) has been specified for message broadcast
and multicast domains.
L3 contain protocols for interfaces over an entire network. It provides a control of all the
protocols at L2 and L1 (see Figure 3.3, links from RRC to all other protocols below). L3 is
logically applied to all devices of EU and UTRAN when they interact with any other device over
the network.
3.3 The example WCDMA system
The WCDMA system to be used throughout subsequent chapters is also called the example
WCDMA system. This system is constructed based on what is mentioned in Section 3.2.3.
3.3.1 Architecture of the example WCDMA system
In the case WCDMA system, there are the listed functional nodes: 3 Node Bs, 2 RNC, 2 MGw, 1
GPRS(including 1 SGSN and 1 GGSN), 1 HSS(including ,1 HLR, 1 EIR and 1 AuC), 1 MSC
server (including VLR), 1 PSTN/PLMN network, 1 IP network and n UEs in Figure 3.4. The
solid line between the nodes stands for the traffic flow (voice or data) transmitting from one
component to the other. The relevant interface is indicated for each line. The dotted line stands
for the control signaling among the components so that the components in the WCDMA system
can operate in a managed way. In order to simplify the system, the interface type for the control
signaling links is not indicated.

42
Figure 3.4 An example WCDMA system.
The function of these nodes is to provide a voice transmission through WCDM wireless network
by WCDMA radio access network and traditional circuit switch network or the IP based packet
switch Internet. The control mechanisms govern the behaviors of these WCDMA network
components. The communication or reporting information among these components is
transmitted through the interfaces and following the protocols mentioned above.

43
3.3.2 Configuration of the example WCDMA system
The variables and parameters for the WCDMA system are also need to be defined. Because
models of telecommunication system have a large set of parameters, e.g. speed of users, size of
cell, bandwidth requirements of user, etc., and there are not standard values for these parameters,
it is difficult to define the parameters for the modeling and simulation of WCDMA wireless
system. The system parameters are defined in a simple and easy to understand way which can
simplify the system simulation and effectively provide enough insight to the research objectives.
Such parameter can be general enough and suitable to any telecommunication system in the
context of emergency or disasters.
The capacity of the each network component is defined by the Maximum quantity of user in
a time interval unit, i.e. per hour in a normal operation.
(1) The maximum capacity of Node B1 is 30 users/per hour, Node B2 is 35 users/per hour,
and Node B3 is 40 users/per hour.
(2) The capacity of the other nodes is assumed to be always enough. It can smoothly switch
and route the traffic from Node Bs to other network components.
Each Node B can increase its 30% capacity within a time unit (e.g. an hour) above its
normal capacity through the radio resource control mechanisms such as power control and
AMR described in the Section 3.3.3. The whole network processing capacity is determined
by total nodes capacity as 150 users/per hour.
The rate of the user requests for voice service from UE to Node B follows the Poisson
process. The detailed information is described in Section 6.3.5.
The service continuity of the wireless network is expressed by the rate of serviced users
divided by the total users at a discrete time, i.e., Psc= Ms/Ts (where: Psc= probability of
service continuity, Ms= Number of served users, Ts= Total subscribers of the WCDMA
network.)

44
In emergency situations, this thesis study only focused on the basic service, i.e., voice traffic.
The voice traffic is transmitted through the Circuit Switching network via the Node B, RNC,
MGw. The VoIP, Non-real time voice, is transferred from UE, through Node B, RNC, GRPS
network, Internet network to the receivers. Other components for signaling control and database
management, including MSC servers, HLR, EIR and AUC, are not under consideration in this
thesis, because the network components for signaling control are highly reliable and resilient in
accident (Freeman 2004, Stafford 2004).
3.3.3 Management of the example WCDMA system
In order to effectively evaluate the performance of the WCDMA system survivability, the
principle model only focus on the voice service and the typical principles. The capacity of the
function in core network is assumed to be infinite. The capacity restriction is determined by the
radio frequency bandwidth which is controlled by the Node B and RNC. In order to simplify the
analysis, some complicated scenarios like Authentication, Authorization and Accounting (AAA),
location updating are not dealt with.
The WCDMA logical network elements connect through open interfaces or access points.
Functionally, the RAN network handles all radio-related functionality, Radio Resource
Management and Mobility Management (RRM and MM). The CN is responsible for switching
and routing calls and data connections to external networks at the same time as managing session
and mobility information, Communication Management and Mobility Management (CM and
MM). User Identity Module (UIM) and Mobile Terminal (MT) interfaces with the user and the
radio interface.
In the example WCDMA system, the typical control mechanisms are applied in the RAN
network and CN network. The first control mechanism is the RAN control. It is based on the
knowledge of MM and RRC. Typically based on the control mechanism of Soft Handover,
Power Control, Call Admission Control (CAC). The dynamic network capacity is governed by
these radio control mechanisms. The second control mechanism is for the switching function of

45
the Core Network (CN). This thesis study simply defines the routing and switching control
mechanism in the Circuit Switch (CS) domain and Packet Switch (PS) domain. The capacity of
CN components is estimated to be always sufficient before and after disasters.
(1) Radio Resource Control of Radio Access Network (RAN)
There are three typical radio access control mechanisms: Soft handover, Power control, Call
Admission Control (CAC) and Adaptive Multi-rate Voice codec (AMR).
Soft handover:
It allows mobile users to be reachable anywhere and anytime. Keeping the moving
device connected to the network and managing its mobility. It is one of the three
handover ways, i.e. hard handover, soft handover and softer handover (Kaaranen 2005).
Hard handover occurs on condition that the old connection during the handover process
is released before making the new connection. A softer handover is a handover as a result
of which a new signal is either added to or deleted from the active set, or replaced by a
stronger signal within the different sectors that are under the control of the same Node Bs.
Soft handover occurs when a new connection is established before the old connection is
released. Soft handover is performed between two cells belonging to different Node Bs
but not necessarily to the same RNC.
The soft handover function is adopted in network survivability analysis; because it is
estimated that single point failure occurs after disaster, namely, the function node fail
completely. For instance in Figure 3.5, when Node B1 fails in emergency situations, a
predefined parameter is set at the point where the signal strength of the neighboring cell
(Node B2) has started to exceed the signal strength of current cell (Node B1) by a certain
amount and/or for a certain time. The UE set up a new radio connection to Node B2 and
the traffic service are handover from Node B1 to Node B2.
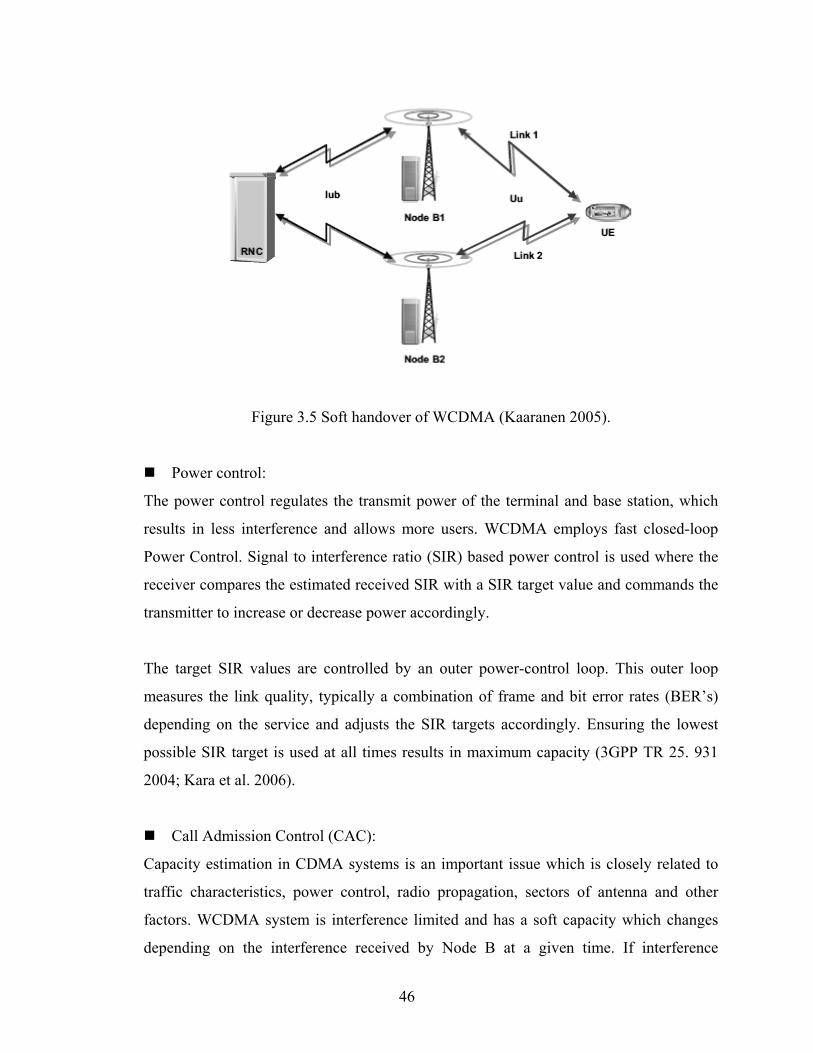
46
Figure 3.5 Soft handover of WCDMA (Kaaranen 2005).
Power control:
The power control regulates the transmit power of the terminal and base station, which
results in less interference and allows more users. WCDMA employs fast closed-loop
Power Control. Signal to interference ratio (SIR) based power control is used where the
receiver compares the estimated received SIR with a SIR target value and commands the
transmitter to increase or decrease power accordingly.
The target SIR values are controlled by an outer power-control loop. This outer loop
measures the link quality, typically a combination of frame and bit error rates (BER’s)
depending on the service and adjusts the SIR targets accordingly. Ensuring the lowest
possible SIR target is used at all times results in maximum capacity (3GPP TR 25. 931
2004; Kara et al. 2006).
Call Admission Control (CAC):
Capacity estimation in CDMA systems is an important issue which is closely related to
traffic characteristics, power control, radio propagation, sectors of antenna and other
factors. WCDMA system is interference limited and has a soft capacity which changes
depending on the interference received by Node B at a given time. If interference

47
increases beyond an acceptable level the system becomes unstable and may lead to call
dropping. Admitting a new call always increases the interference level in the system.
Hence, Call Admission Control (CAC) technique is required to accept or block potential
users. The basic strategy is to protect ongoing calls by denying a new user access to the
system under heavy congestion. Node B implements Admission Control algorithms and
make admission decisions.
Adaptive Multirate voice codec (AMR) :
AMR is used in both GSM and WCDMA system. AMR voice codec supports 8 different
speech codec rates with bit rates ranging from 4.75 kbps to 12.2 kbps. The AMR-WB
speech codec consists of nine speech coding modes with bit-rates of 12.2kbit/s, 10.2kbit/s,
7.95kbit/s, 7.40kbit/s, 6.7kbit/s, 5.9kbit/s, 5.15kbit/s, 4.75kbit/s (Holma and Toskala,
2002). The bit rate is dynamically controlled by the radio network according to the
WCDMA system load. The AMR-WB codec adapts the bit-rate allocation between
speech and channel coding, enhancing speech quality to prevailing radio channel
conditions. While providing superior voice quality over the existing narrowband
standards, AMR-WB is also very robust against transmission errors due to the multi-rate
operation and adaptation.
All the four typical mechanisms are used to efficiently utilize of the air interface resources,
guarantee QoS, maintain the planned coverage area, and to offer high capacity. There are more
research studying increasing the capacity and coverage of RAN. Holma et al. (2002) studied the
power control algorithm and states that increasing the power available will permit more users
before cell loading is close to approximately 90% downlink loaded. After that, increasing the
Node B power capability will not increase system capacity. Smith and Collins (2002) and
Kaaranen (2005) addressed the item and parameters which are used for the handover algorithm,
such as upper threshold and lower threshold for signal strength, handover margin, active list.
Holma and Priyan (2005) showed that CAC and AMR technology can add network coverage and
capacity. AMR dynamically adapts to changing radio conditions. It allows individual Node B
cell sizes to be increased by about 30% reducing the number of Node B’s needed to cover a
given area. With AMR speech codec it is possible to switch to a lower bit rate if the mobile is

48
moving out of the cell coverage area. Different AMR bit rates leads to relative different cell
ranges, meanwhile the voice capacity can be increased by using a lower bit rate AMR mode.
Figure 3.6 and Figure 3.7 shows the improvement of capacity and coverage by the AMR.
Figure 3.6 Coverage range of Different AMR Bit rates (Holma and Priyan 2005).
AMR 12.2 kbps AMR 7.95 kbps AMR 4.75 kbps
Eb/No
7.0 dB
7.5 dB
8.0 dB
Capacity 66 users 90 users 134 users
Figure 3.7 Capacity of Different AMR Bit rates (Holma and Priyan 2005).

49
(2) Switching and routing function Core Network (CN)
The main function of the CN is for data switching and routing over the Circuit Switch (CS) and
Packet Switch (PS) network.
In principle, circuit switching and packet switching both are used in high-capacity networks. In
circuit-switched networks, network resources are static. A physical path is obtained for and
dedicated to a single connection between two end-points (sender and receiver) in the network for
the duration of the connection. The telephone company reserves a specific physical path. During
that time, no one else can use the physical lines involved (Circuit switching 2008). In the circuit
domain, the MSC server control and maintains connection of the Medium Gateway through the
control signaling to the Media Gateway (MGw). MGw thus takes care of all physical connection
set-up matters for the voice traffic. The MSC Server and CS-MGw have a one-to-many
relationship, i.e., one MSC server could control numerous CS-MGws.
In packet-switched networks, the message is broken into packets, each of which can take a
different route to the destination where the packets are recompiled into the original message.
Packets are routed to their destination as determined by a routing algorithm. The routing
algorithm can create paths based on various metrics and desirable qualities of the routing path.
For example, low latency time may be of paramount concern and everything else is secondary.
Once a route is determined for a packet, it is entirely possible that the route may change for the
next packet, thus leading to a case where packets from the same source headed to the same
destination could be routed differently (Packet switching 2008).
In the packet switch (PS) domain, the Serving GPRS Support Node (SGSN) handles all packet
switched data within the network, e.g. the mobility management and authentication of the users.
The SGSN handles the protocol conversion from the IP used in the backbone network to the
Sub-Network-Dependent Convergence Protocol (SNDCP) and Logical Link Control (LLC)
protocols used between the SGSN and the mobile users. These protocols handle compression and
ciphering. The SGSN performs the same functions as the MSC for voice traffic. The SGSN is

50
the service access point to the GPRS network for the mobile user. SGSN relays the data between
the SGSN and relevant Gateway GPRS Support Node (GGSN). A GGSN is a network node that
acts as a gateway between a GPRS wireless data network and other networks such as the Internet
or private networks.
3.3.4 Threaten scenarios of the example system
In a network, devices or nodes are interconnected via some medium through which data can be
transmitted. Transmission can occur through wires or through wireless channels. The threaten
scenarios is designed based on the impact of emergency and disaster to the network components
and its severity.
Bhagyavati (2001) stated that a failure is any deviation from the expected behavior of the
network. A fault is an observed or externally visible failure, which is defined as an abnormal
condition that adversely affects network services. For instance, the MSC does not work or can
not operate in a normal condition. The fault of the MSC is observed by the symptoms (voice
traffic congestion or disconnection), and these symptoms are failures.
Emergency or disaster normally causes serious damages to the system functional nodes. The
fault management of network survivability in emergency situations mainly referred to the nodes
failure. It is estimated that the function nodes and the links fail together. Bhagyavati (2001)
indicated that a classification of the types of faults is indispensable. The faults are classified from
three dimensions:
(1) Location of faults: hardware faults, software faults, resource faults
(2) Severity of faults: High, medium, low
(3) Components affected by faults: link faults, equipments faults, nodes faults.
This thesis study research anchors on the vulnerable network nodes faults. It examines the
system service continuity under the condition of the failure of some nodes. These selected nodes
are UE, Node B, Mgw, GPRS, SGSN and GGSN for the user traffic transmission and QoS

51
guarantee. Other nodes for the signaling control or database function are considered to be always
available because of their highly redundancy and reliability, like MSC server, HLR, EIR and
SS7 system nodes. Threatens are defined at three levels of based severity.
The low severity is the failure of Node B.
The users within the radio area of the Cell of this Node B are disconnected from the
WCDMA network. The UEs (User Equipment) have to handover to other available Node
Bs in order to maintain the service continuity. UE is normally called mobile phone which
provides the radio access functions for users to the WCDMA network.
The medium severity is the failure of one RNC.
Due to root of Tree network topology, all the Node Bs controlled by the RNC loses the
connection to the WCDMA network. All the impacted UEs have to hand over to the
available Nodes controlled by a working RNC.
The high severity is the failure of one switch node MGw.
When one MGw is damaged, all the RNC connecting to it can not transmit the traffic
through it. All users served by those Node Bs controlled by such RNC can not continue
their service through Circuit Domain. In order to maintain the service, RNC will switch
to the other interface to IP network through SGSN/GGSN instead of the CS network
through MGw.
The occurrence of the node failure is simulated by a Poisson distribution. The failure of low
severity takes place most frequently. The failure of high severity takes the least. The failure of
the medium severity takes place middle- frequently.
3.4 Summary
This chapter shows the construction of an example WCDMA system in emergency situations. It
introduces the evolution of the wireless cellular system and the advanced feature of the
WCDMA system over the previous system. The service, the architecture, control mechanism of

52
the WCDMA system is introduced so that an example survivable WCDMA system is built up. In
the context of the emergency environment, the example WCDMA is built from the service,
structure and control mechanism. The goal of the example WCDMA system is to support the
conceptual design in the research study. Therefore, the design of the example WCDMA system
is more general other than the detailed and specified system design. By examining it, the system
performance in certain environments may be examined so as to build the decision making system
in subsequent chapters.

53
Chapter 4
WCDMA domain model
4.1 Introduction
In this chapter, the domain model of the WCDMA will be described in detail. Since the domain
model is relatively new in engineering systems development field, the notion of the domain
model is first discussed by using a meeting room as an example (Section 4.2). Then the domain
model of the example WCDMA system (Section 4.3) is presented. Finally, Section 4.4 concludes
this chapter with some discussion.
4.2 The concept of the domain model
Figure 4.1 shows a meeting room, where there are a table, a few chairs, windows, a projector,
and a door. For the meeting room to make sense, the components or subsystems are identified as
listed. Figure 4.2a shows a representation of the semantics which is called Aggregate
relationship. It is noted that the assembly relationship is the same as the decomposition
relationship. Further looking at Figure 4.2b, the relationship among four legs and the top plate of
table is identified; a kind of relationship existed among these components is different from
Aggregate relationship - in this particular case, the legs are connected with the top plate but the
legs are not connected to each other directly. The relationship among the legs and the top plate of
Figure 4.2b is called Assembly relationship (see Figure 4.2b).

54
Figure 4.1 Meeting Room (Rentacomputer 2008).
Further exploring the two categories of relationships reveals the following. The assembly or
aggregate relationship results in a novel concept that is not existed in its composing components.
For example, the meaning of a meeting room is more than the meaning of a room. The meeting
room is more than a special semantics on the physical system; as such the meeting room
aggregates the concept or objects: room, table, chair, and so on (see Figure 4.2a). The
connectivity relationship results in a usable system; for example, there must be a sufficient
space between the chair and table so that the attendants of a meeting are able to sit on the chair
beside table (Figure 4.2c). People will be also considered as a kind of objects in the domain
model in this case.

55
(a) Aggregate relationship.
(b) Assembly relationship.

56
Table ChairProjector
WindowDoor
Meeting Room
Pencils
Papers
Wall
space
(c) Connectivity relationship.
Figure 4.2 Objects relationship within domain model.
After having identified domain objects, the FCBPSS framework is applied to the domain objects.
This means to further identify the structure, state, behavior, principle, function, and context of
the domain objects and subsystems. In this way, the domain model of the meeting room is
completed.
4.3 The domain model of the example WCDMA system
4.3.1 Domain objects of the example WCDMA system
The holistic WCDMA network system comprises of the telecommunications network and the
management network. The telecommunications network has the function to transport the
information between the ends. The management network has the function of invoicing, pricing,
registering, managing the security, detecting and resolving failures or anomalies and of the
disabled operation after disconnection or the recovery periods of some of these components. The

57
WCDMA network system comprises of four basic components: (1) Core Network (CN), (2)
UMTS Terrestrial Radio Access Network (UTRAN), (3) User Terminal/Mobile Equipment
(UE/ME), and (4) Transmission Network (i.e., physical mediums). Figure 4.3 shows the
assembly relationship of an entire WCDMA system. The components and sub-systems which
construct the example WCDMA system are listed in Table 4.1.

58
Fi
gure
4.3
Hol
istic
stru
ctur
e of
the
WC
DM
A w
irele
ss c
ellu
lar s
yste
m.

58
Table 4.1 Components of the WCDMA system.
Components Description Components Description MS ME USIM UTRAN RNS Node B CN CS subsystem PS subsystem Common subsystem MSC MSC server
Mobile Station Mobile Equipment Universal Subscriber Identity Module UMTS Terrestrial Radio Access Network Radio Network subsystem Base Transceiver Station in WCDMA Core Network Circuit Switch subsystem Packet Switch subsystem Subsystem shared by CS and PS subsystemMobile Switching Centers Mobile Switching Center Server
MGw HLR EIR VLR SGSN GGSN PCM IP network ATM network SDH/SONET Other Physical Medium
Media Gateway Home Location Registration Equipment Identity Register Visitor Location Register Serving GPRS Support Node Gateway GPRS support node Pulse Code ModulationInternet protocol(IP) network Asynchronous Transfer Mode network Synchronous Digital Hierarchy/Synchronous Optical Network Copper, optical, twist cables; and Radio frequencies
4.3.2 The example WCDMA system - Function
In the telecommunication domain, the services of the system refer to the functions in the
FCBPSS domain. Because of the different words ‘service’ and ‘function’, it makes some
confusion to study the function of telecommunication system from engineering domain.
Kaaranen et al. (2005) indicate that ‘Service’ is a word that suffers from inflation in the
telecommunication business area as the businesses seem to use it in almost any context. In the
telecommunication domain, the term ‘service’ is used in its original meaning: the services that a
network/operator/service provider offers to its customers. The service function can be
decomposed into several more specific functions. The function is directly associated with a set of
behaviors of the system structure.

59
In the WCDMA system, the function of a system is derived from the service request from the
users. Based on the QoS request from the user or applications, there are four service classes (1)
conversational, (2) streaming, (3) interactive, (4) and background classes. The detailed
introduction of the four services was discussed in Chapter 3 – especially Section 3.2.2.
Each service class comprises a set of sub-functions. For example, the conversational service
function comprises the speech traffic transmission, video telephony transmission, Voice
transmission over IP and video games. The interactive service function comprises the Web
browsing function and net games function. Among the sub-functions, some functions are primary,
others are secondary. Primary functions determine the name and the concept of the design
product to achieve the service in normal situations, while secondary functions are supportive,
realized or user interpreted to play the similar role as primary function. For example, the
traditional real-time voice/speech function is primary function while the VoIP is the secondary
functions instead.
This thesis study focused on the function of voice service in the WCDMA system. Voice
function is divided into the sub-functions such as (1) Speech function- provided by the circuit
switching system, (2) VoIP which is provided by the packet switching system, and (3)
Videophone- provided by both circuit and packet switching system.
In order to support the target function, the WCDMA system has sub-functions which are
associated with the behavior of the components in the WCDMA structure, and they are in
particular:
Transmission / reception radio signal - Node B,
Control radio resources -RNC,
Mobility management - RNC, MSC-server, VLR,
User’s data handling routing in Circuit Switch domain –MGw,
Mobile subscribers information and portfolio management -HLR,
Call control -MSC server,

60
Data packet switch and delivery –SGSN,
Gateway to Internet/enterprise network –GGSN, and
Authority management to users/equipment -AUC/EIR.
For instance, in order to provide the speech function, the speech analogy signals have to be
received by the Mobile phone. Mobile phone coded the analogy signal into digital signals, and
sends the digital signals to the Node B after convolution, correlation and modulation function;
the Node B receives the signals from Mobile equipment via radio frequency. After speech
procession, transcoding (Transcode, 2008) and Rate Adaptation, signals are transmitted to the
RNC, RNC collects a group of the Node B and transmits the data traffic from Node B to the
MGw. MGw then selects the routing to forward the signals to the destination within the
WCDMA network or external network such as the PSTN network or other PLMN network. The
relations among the functions and the context are described in Figure 4.4. Furthermore, the
effects are derived from the context where the system exists, especially to the service system.

61
Figure 4.4 Function and context based WCDMA system.
4.3.3 The example WCDMA system - Structure
In the WCDMA system, the various subsystem or components are grouped according to the state
variables and their interdependency. The structure is divided into two parts: the traffic
transmission structure and the system process/control structure. The traffic transmission structure
represents that the components receive and transport the traffic data to destination under the
control of the components in operation/process structure. The system process/control structure
represents that the components inside follow the rules or operation standards to control the
behaviors of the components in the traffic transmission structure to provide the communication
resources and to allocate traffic channels to the end-user.

62
The transmission links (physical medium) connect the different network components and
integrate the entire network. To simplify the system structure, all the transmission links which
spread within the system network are considered to be as a single link with sufficient capacity
between any two connected components, i.e., the physical transmission link (radio wave, copper
cable and optical fibers, etc) connecting each two network components in the traffic transmission
structure and the operation/process structure is represented by a single cable.
The components in Figure 4.5 are related if they are joined by an arc. Each arc between two
components is the transmission link to delivering the signals and data. The components in the
operation/process are related to the controlled components in the traffic transmission structure
with dotted lines.
Figure 4.5 Structure of the example WCDMA system.
When the WCDMA system is in operation and transmitting the signals between the sender and
receiver, the states of the components in the process/control structure are perceived when the

63
components are monitoring the system performance by collecting the state information of the
components in the traffic transmission structure. Before and after the call or session, the
components will also detect the information from outside environment and active/deactivate the
components in the traffic transmission structure to take the correct actions corresponding to the
outside demand. The components in the traffic transmission structure will take action under the
command of the components in the process/operation structures so as to achieve the correct
behavior. For instance, the component, UTRAN, is responsible for functions that relate to access,
radio mobility and resource utilisation. It consists of two components, RNC and Node B. Node
B’s radio coverage range can be increase or decrease; data throughput can be changed depending
on the number of users, the height of the antenna and the transmitting power can be adjusted by
the control parameter of Node B itself. Meanwhile, the RNC has three states. The RNC
controlling the Node B is known as Controlling RNC (CRNC), which manages the radio
resources provided by its controlled Node Bs. After the communication channel is connected
between UE and CN, the RNC controlling the UE is known as Serving RNC (SRNC). While
during soft handover, a UE could be communication with a Node B which is under control of the
RNC which is not the SRNC. Such a RNC is called Drift RNC (DRNC). DRNC does not
perform any user data processing. The user data is handled by SRNC while passed transparently
through DRNC. Thus, the SRNC is responsible for the logical connection between the UE and
the CN. The DRNC provides additional radio resources for a UE that is in a dedicated
connection and a soft-handover state. Node B that is attached to the DRNC will provide the
physical resource to the UE, and the information on the uplink and the downlink is routed
towards the SRNC.
There are static structure and dynamic structure. In a static structure, the states and their
relationships are fixed, and no active component or process is included. Dynamic structure
means that components, states, and their relationship to one another can be changed in capacity,
location, and hardware / software adjustment. For example, the capacity of the RNC or MGw
can increase or decrease when system is upgraded or in fault. Some substructures or components
are detached from the main body of the designed system.

64
4.3.4 The example WCDMA system - Principle
In the example WCDMA system, the components in the network communicate and interact with
each other through the signaling. They are defined through standard interfaces and protocols for
signaling between any two components. The standard of the interface and protocol for signaling
and other telecommunication technology are defined and specified by telecommunications
associations such as 3rd Generation Partnership Project (3GPP).
Signaling traffic is transported between the interfaces of two network components and conforms
to the specific protocols between the two communication components. In the field of
telecommunications, a communication protocol is the set of standard rules for data
representation, signaling, authentication and error detection required to send information over a
communications channel.
In short, a protocol is the rules governing the syntax, semantics, and synchronization of
communication. Protocols are implemented by hardware, software, or a combination of the two.
At the lowest level, a protocol defines the behavior of a hardware connection. The interface is
different from different component pairs and the corresponding protocols guiding the data
transmission along the interface link. Holma and Toskala (2002) elaborated the various interface
within the network components in the WCDMA network in Figure 4.6. The Uu interface is used
between the User terminal and UTRAN network. The IuCs interface is used when the network is
based on circuit commutation; it connects the UTRAN network with the MSC. The Iur interface
is used for the connection between two RNCs to provide the soft handover function. The
interface IuPS connects the access network with the SGSN of the core network in packet
communication, etc. In Figure 4.7, this study simplifies the interfaces and protocols of the
complicate WCDMA system and map them into the FCBPSS based WCDMA system structure.
The dotted line is used to indicate the principles which govern the network components. It is
further noted that the principles of the WCDMA system are about the protocols and controls of

65
the WCDMA system, and they were discussed in Chapter 3 – especially Section 3.2.5 and
Section 3.3.3, respectively.
Figure 4.6 UMTS R4 logical architecture (3GPP TS 23.002 2003).

66
Figure 4.7 Principles of WCDMA system.
4.3.5 The example WCDMA system – Behavior and State
The behavior can be generalized into two classes. (1) Spatial behavior describes the behavior of
ordered objects in 2D or 3D space. For example, in WCDMA system, Node B increases its
transmission power through its antenna to cover large area under the control of the closed loop
power control operation. (2) Temporal behavior obeys time constraints. Events can happen
sequentially, overlap one another, be simulations, or be of specific duration. The effects of these
events are states in different times or intervals (Qian and Gero 1996).
The behavior has two types of state variables. (1) The structural behavior variable is system or
components actual behavior derived from the structure and software codes without any external
effect. For example, the state of RNC may be receiving the report from Node B about the radio
resource information or responding to the Node B with the commands. (2) The indirect behavior
variable is shown when an external object is applied to a structure. For example, in the WCDMA

67
system, the system throughput and data rate are indirect behavior states which will change
depend on the external effect such as noise interferences to the signals, the different service
requirements to the radio bandwidth, etc.
The components behavior in the WCDMA system can be inferred by the ways that the system
operates. For example, in WCDMA system, power control is an essential feature of any CDMA-
based cellular system. Without utilizing an accurate power control mechanism, these systems
cannot operate. The main reasons for implementing power control are the near–far problem, the
interference-dependent capacity of WCDMA and the limited power source of the User
Equipment (UE). Whatever the radio environment, power received should be at an acceptable
level, e.g., at the BS for the uplink to support the requested QoS. The target of power control is
to adjust the power to the desired level without any unnecessary increase in UE transmits power.
This ensures that transmit power is just within the required level, neither higher nor less
(Kaaranen 2005).
The detailed illustration about the relationship between structure and behaviors is shown by the
example of power control of the example WCDMA system as shown in Figure 4.8. Figure 4.8
shows the example of the WCDMA system downlink power control procedure. Power control is
employed in both uplink and downlink directions. Downlink power control is basically for
minimizing interference with other cells and compensating for the interference from other cells,
as well as achieving an acceptable Signal to Interference Ratio (SIR). Uplink power control is to
mitigate the near–far problem by making the transmission power level received from all
terminals as equal as possible at the home cell for the same QoS (3GPP TR 25. 931 2004).

68
MS-1 RNC-1 (drift)
RNC-2 (serving)
NodeB-2 (serving)
Node B-1 (drift)
RRC
RRC
NBAP
NBAP
RNSAP
NBAP
RRC
RRC
NBAP
3. decision to perform power control
1. Measurement control
2. Measurement report
4. DL power control request
5. DL power control request
6. DL power control request
RNSAP
Behaviors of RNC-2
Figure 4.8 Downlink Power Control of WCDMA systems.
(1) RNC-2 sends to MS-1 a Radio Resource Control (RRC) Measurement Control message to
setup a quality measure.
Parameters: Measurement ID number, Measurement type, Measurement command; this
message is optional in the described flow.
(2) MS-1 after having performed the measure, send towards RNC-2 the report in Measurement
Report.
(3) RNC-2 decides to request NodeB-1, 2 lower levels (L1) to change power in Down Link
(DL).
(4) RNC-2 sends the NBAP message DL Power Control Request to the controlled Node B-2
Parameters: RL ID, RL Reference power, Max Adjustment Step, Adjustment Period,
Adjustment Ratio.
(5) RNC-2 sends the RNSAP message DL Power Control Request to the RNC-1

69
Parameters: RL ID, RL Reference power, Max Adjustment Step, Adjustment Period,
Adjustment Ratio.
(6) RNC-1 sends the NBAP message DL Power Control Request to the controlled Node B-1
Parameters: RL ID, RL Reference power, Max Adjustment Step, Adjustment Period,
Adjustment Ratio.
Figure 4.9 shows the behaviors of the WCDMA system components in downlink power control
procedure. Each component has its own set of behavior. For example, the RNC-2 has its
temporal behavior in the dotted line rectangle frame. The behavior of the all components
involved in the power control event is described in the different time intervals as shown in
Figure 4.8.
Figure 4.9 Behaviors of the example WCDMA system.
4.3.6 The example WCDMA system - Context
The context impacts behaviors of the system through two factors: internal and external effects.
In the thesis study, the context mainly refers to the external effects due to the emergency

70
situation. The external effect can be a human action or any environmental effect applied to the
design such as man-made failure or natural disaster. Many engineering designs, such as
mechanical design and electronic equipment design, require external operations to change the
structure status to reach a goal.
Although the external effect does not belong to the design, it affects the design structure, lead to
the changed behavior as well as function outage. An exogenous variable applied to a structure
variable may cause a change in the structure if the structure variable is dynamic. For instance, in
the WCDMA system, the emergencies or the natural disaster such as earthquake or flood may
affect the system structure. The structure components like Node B, RNC, SGSN maybe damaged
and outage of the functions.
4.4 Conclusion with discussion
This chapter presented the domain model of the WCDMA system which has captured the most
important semantics of the system. The use of the tool called FCBPSS framework described in
Chapter 2 is extremely helpful; the FCBPSS framework is a semantic or natural tool to model the
domain of a system. In comparison with the method of Umeda and Tomiyama (1995), the
FCBPSS framework provides the most complete definition of all the fundamental concepts. In
contrast, in the method of Umeda and Tomiyama (1995), the structure and state appear to be
interchangeable in use, which is not true from the viewpoint of the FCBPSS framework. Further,
they have never explicitly included the principle and context in their FBS model. It will be
shown in later chapters that are absent of an explicit representation of the principle concept will
be unable to do the operational management of the system.

71
Chapter 5
Reconfigurable WCDMA system
5.1 Introduction
In Chapter 4, a domain model of the example WCDMA system was presented. This model is
expected to address what the WCDMA system is; in particular, the model has provided a
backbone of the WCDMA system. This chapter will present a reconfigurable WCDMA system
which is based on the backbone (i.e. the domain model of the WCDMA). The remainder of this
chapter will present a new approach to achieve this goal. In particular, Section 5.2 discusses the
basis of this new approach. Section 5.3 illustrates this new approach to the WCDMA system to
make the approach more visible and presents a concrete reconfiguration WCDMA system along
with a procedure to perform reconfiguration in emergency situations. Section 5.4 presents a
knowledge base which supports this new reconfiguration approach. Section 5.5 provides a
conclusion.
5.2 A new system reconfiguration approach
Reconfiguration of a system means to change the connectivity of the system as well as its
components for the purpose of changing the behaviors of the system. In this thesis, a new
approach to reconfigure the system is proposed which is based on the concept of general and
specific function in engineering design proposed by Pahl and Beitz (1996).
5.2.1 The general and specific function concept
Pahl and Beitz (1996) introduced a concept in engineering design called “general function and
specific function”. A general function is defined as an abstract function of the system which

72
plays its role independent of any particular environment. A specific function is defined as a
concrete function with task-specific or service-specific environment where the system entities
are to play their role. From these definitions, the general function can be concluded as the
function without any context; while the specific function is the function with context. The
following is presented an example to illustrate this concept further.
In Figure 5.1a, the needle mechanism is within the context of the sewing machine to play the role
of carrying the upper thread into and through the cloth. Figure 5.1b is a schematic diagram of the
needle mechanism which removes the context of the sewing machine. The system shown with
this schematic diagram may be called crank-slider mechanism, and it demonstrates a kind of
general function. Further in Figure 5.1c, the crank-slider mechanism is put in the context of the
compressor machine, where the gas in the chamber is pressured by the piston which is in fact the
slider of the system shown in Figure 5.1b. Thus the structure shown in Figure 5.1b has two
specific functions: one is the needle mechanism in the context of the sewing machine (see Figure
5.1a) and the other is the pressing mechanism in the context of the compressor machine (see
Figure 5.1c).
(a) Sewing machine (Needle machine n.d.).
Needle h i

73
(b) General function of sewing machine (Zhang et al. 2005).
(c) Compressor machine (Slider-crank mechanism 1994).
Figure 5.1 General and specific function concept
Hereafter, the general and specific function concept are called G-S concept for short. Further, the
general function concept may correspond to the behavior concept in the FBS framework; while
the specific function concept to the function concept in the FBS framework. This understanding
of the general function and specific function concept seems to extend the understanding
described by Pahl and Beitz (1996).
Compressed air

74
5.2.2 System reconfiguration based on the G-S concept
System reconfiguration in this thesis is for enhancing the survivability of a service system. As
such, there is always an assumption that a couple of components of a system are damaged and
their functions are lost. The goal of system reconfiguration is then to find out ways upon the
existing system (including those damaged components) to remedy the lost functions and
maintain a satisfactory level of QoS for all the services or functions of the survivable service
provider system.
There are three ways to achieve this goal and they are: (1) Reconfiguring the remaining system
(excluding the damaged one), (2) Exploring the damaged components, and (3) Exploring the
capacity of the existing system under the assumption that the existing system usually does not
run to its full capacity.
The first way can be demonstrated using the example of the table (see Figure 5.2). In Figure 5.2a,
there is a table which has four legs and a top plate. In Figure 5.2b, one leg (e.g. Leg A) of the
table is broken; yet by adjusting one existing leg to the somewhat middle part of the top plate,
the table can still function which is also affected by the load on the top plate and its location(see
Figure 5.2b).
L e g A
L e g B
L eg C
T o p p la te
L e g D
(a) Original table
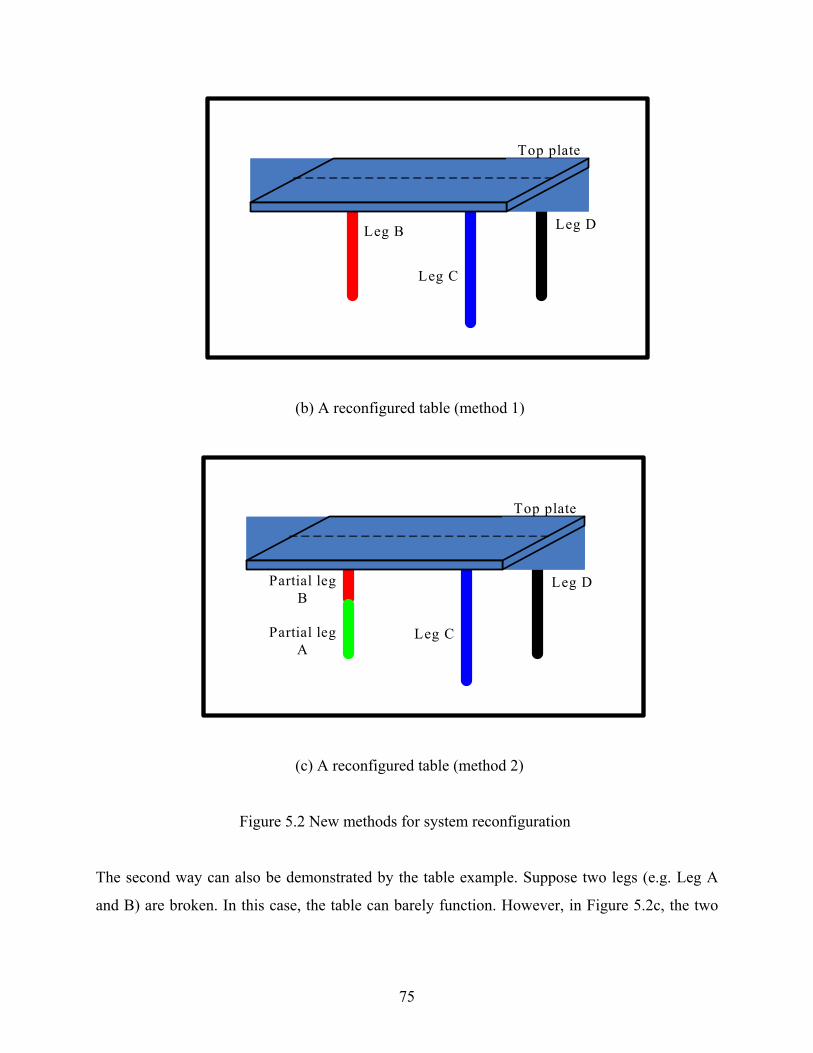
75
Leg B
Leg C
Top plate
Leg D
(b) A reconfigured table (method 1)
Partial leg B
Leg C
Top plate
Leg D
Partial leg A
(c) A reconfigured table (method 2)
Figure 5.2 New methods for system reconfiguration
The second way can also be demonstrated by the table example. Suppose two legs (e.g. Leg A
and B) are broken. In this case, the table can barely function. However, in Figure 5.2c, the two

76
broken legs are assembled together to become a functional leg and which is further assembled
somewhere in the middle of the top plane (see Figure 5.2c), so the table can still function.
The third way can be demonstrated by a particular transportation system. In some rush hour, the
routes are adjusted to accommodate an increase of traffic in a particular direction. Figure 5.3a
shows a normal operation situation where the transportation capacity in the direction from the
south to north has not been fully utilized. Figure 5.3b shows that the route direction is changed to
give some capacity of transportation from the north to south.
N orth
South
N orth
S ou th
(a) Normal traffic (b) Emergency traffic
Figure 5.3 A new system reconfiguration method
The above three ways of system reconfiguration can be explained with the G-S concept. In the
case of the first method, the two configurations of the table: the four leg table (see Figure 5.2a)
and the three leg table (see Figure 5.2b) are considered two specific functions of the table. In the
case of the second method, for one damaged leg, its reuse is based on its general function, i.e.,

77
the leg services as a column, subject to a certain workload, and the assembly of two damaged
legs into one is based on the fact that a new specific function of the leg (i.e.; the new leg
assembled with two damaged legs) is established. In the case of the third method, the general
function of a physical route system is to transport substances from one direction to another. The
specific function of the route is established when a set of traffic rules is imposed on it – leading
to the “south to north” route or the “north to south” route.
For the simplicity of discussion but without loss of generality, in this thesis hereafter, only two
specific functions of a component (subsystem, or system) along with its general function are
considered; in particular, one specific function is called ‘primary function’, while the other is
called ‘secondary function’. This thesis study does not explicitly present the general function in
the context for the WCDMA system.
5.3 WCDMA reconfigurable (G-S) model
In this section, a reconfigurable WCDMA system is described by applying the G-S model as
described before.
5.3.1 The WCDMA domain model: revisited
The example WCDMA system in the Section 3.3.1 is revisited and shown in Figure 5.4. The
overall architecture of UMTS includes three basic blocks: User Equipment (UE), UMTS
Terrestrial Radio Access Network (UTRAN), and Core Network (CN). These elements are
connected among themselves and to external networks. In the following, these blocks are
explained in details.

78
Figure 5.4 Structure of the example WCDMA system.
(1) User Equipment (UE 1…n). The UE provides means for the user to access the WCDMA
system. It consists of the Mobile Equipment (ME) and UMTS Subscriber Identity Module
(USIM). ME supports the radio access to the system; USIM supports the user security and
user service.

79
(2) UMTS Terrestrial Radio Access Network (UTRAN). The UTRAN performs functions to
support communication with the Mobile Terminal (MT) and with the Core Network (CN). It
provides means for exchanging information between MT and CN, acting as a bridge, router,
or gateway. It consists of a set of Radio Network Subsystems (RNS), each of which contains
a Radio Network Controller (RNC) and one or more entities known as Node B. Node B is an
entity supporting radio frequency transmission, reception, system access, and information
broadcast. The RNC supports radio access control, connection control, geographic
positioning, and access link relay management.
(3) Core Network (CN). The CN performs functions to support communication with the
UTRAN and with other CNs. It provides means to support user mobility and user service. It
comprises the elements for circuit-switched services and the elements for packet-switched
services. The basic elements of a CN are the Mobile Switching Center/Visitor Location
Register (MSC/VLR), Home Location Register (HLR), Gateway MSC (GMSC), Serving
GPRS Support Node (SGSN), and Gateway GPRS Support Node (GGSN). In the following,
these elements are explained further.
The MSC performs the switching functions and coordinates the calls and routing
procedures within the network. The VLR is a database containing a copy of the service
profile of the visiting subscriber as well as information on the location of the subscriber
within the system. In 3GPP R4, the CS domain structure was given an alternative
implementation method; in particular the CS domain architecture defines MSC division,
where the call control functionality and the VLR are brought into an entity called the
‘‘MSC server’’. Respectively, the maintenance of the CS connection and establishment
of all physical connection sets up are brought into an entity called the ‘‘Media
Gateway’’ (MGw). The operation of MSC server and MGw opens up a few new
interfaces within the CS domain such as Mc, Nc, Nb, E, G, which define the information
control and transmission mechanism among the MSC server and CS-Media Gateway.
The detailed information about them is referred to (Kaaranen 2005, Yacoub 2002)

80
The HLR is a database residing within the home system and contains a list of home
subscribers with their respective service profiles.
The Gateway MSC Server (GMSC server) replaces the Gateway MSC (GMSC) in the
3GPP Release 99. A GMSC is responsible for routing a call from circuit witch network to
its final destination in external networks. The GMSC server mainly comprises the call
control and mobility control parts of a GMSC, and it may be used to interface with
external circuit-switched networks. In many cases, an MSC server can support the
function of a GMSC server (Smith and Collins 2002). Thus, in this thesis study, the
function of GMSC server is embedded in the MSC server.
The SGSN acts as a logical interface to the UTRAN responsible for the delivery of
packets to the correct Node B.
The GGSN acts as a logical interface to the external Packet Data Network (PDN), which
includes the IP PDN or X.25/X.75 packet-switched PDN. For an external IP network,
GGSN is seen as an ordinary IP router.
The typical and simplest infrastructure of the example WCDMA system (see Figure 5.4)
includes one MSC server, two MGws, associated HLR, VLR, Auc, EIR, two RNCs, and three
Node Bs homed to RNC. A Node B serves hundreds of mobile users in a given area (Cell) by
allocating radio resources for making new calls or for users to continue their calls. A RNC
provides switching support for several neighboring base stations (Node B) and thus can serves
thousands of users. The link between Node B and RNC and also between RNC and Media
Gateway (MGw) are typically wireline, although the use of radio or microwave links to connect
these components has been increasing. The MGw is a larger switch and can serve tens of
thousand of users. HLR, VLR, MSC-server keep track of users who permanently register or
temporarily visit the service area.
In a wireless system, a Node B that communicates directly with MEs is a critical facility. If more
Node Bs are deployed, the coverage as well as the system’s capacity can be enhanced, but there
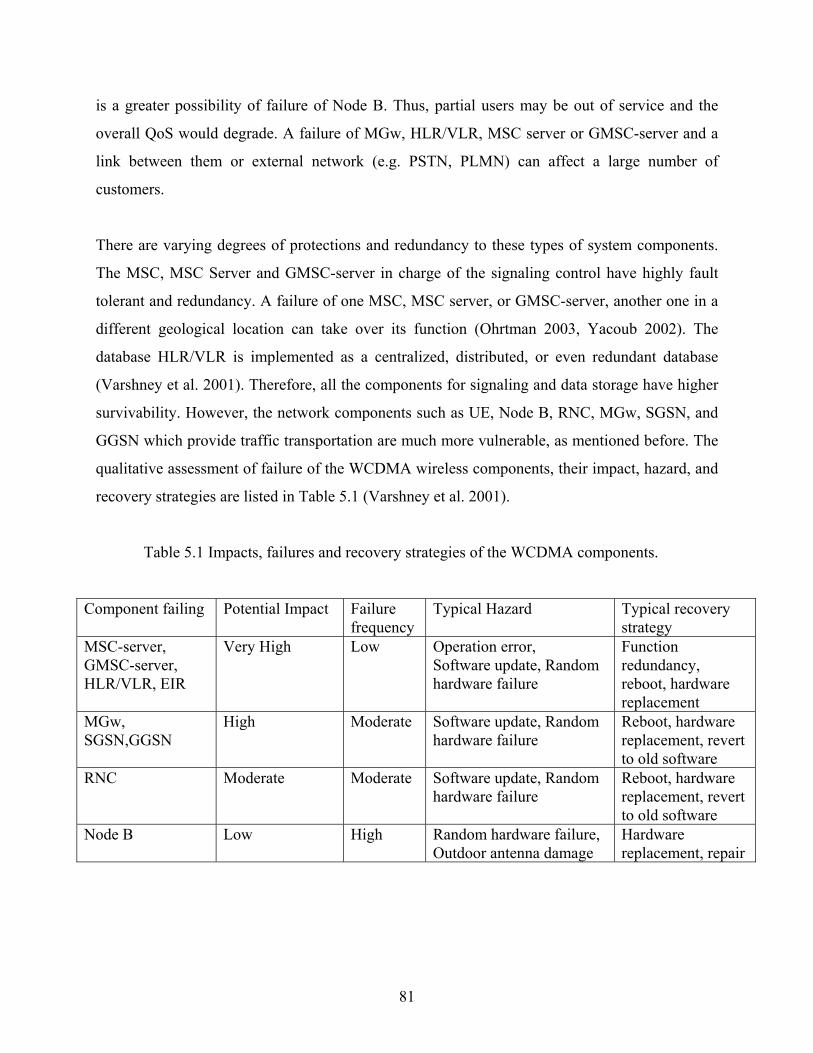
81
is a greater possibility of failure of Node B. Thus, partial users may be out of service and the
overall QoS would degrade. A failure of MGw, HLR/VLR, MSC server or GMSC-server and a
link between them or external network (e.g. PSTN, PLMN) can affect a large number of
customers.
There are varying degrees of protections and redundancy to these types of system components.
The MSC, MSC Server and GMSC-server in charge of the signaling control have highly fault
tolerant and redundancy. A failure of one MSC, MSC server, or GMSC-server, another one in a
different geological location can take over its function (Ohrtman 2003, Yacoub 2002). The
database HLR/VLR is implemented as a centralized, distributed, or even redundant database
(Varshney et al. 2001). Therefore, all the components for signaling and data storage have higher
survivability. However, the network components such as UE, Node B, RNC, MGw, SGSN, and
GGSN which provide traffic transportation are much more vulnerable, as mentioned before. The
qualitative assessment of failure of the WCDMA wireless components, their impact, hazard, and
recovery strategies are listed in Table 5.1 (Varshney et al. 2001).
Table 5.1 Impacts, failures and recovery strategies of the WCDMA components.
Component failing Potential Impact Failure frequency
Typical Hazard Typical recovery strategy
MSC-server, GMSC-server, HLR/VLR, EIR
Very High Low Operation error, Software update, Random hardware failure
Function redundancy, reboot, hardware replacement
MGw, SGSN,GGSN
High Moderate Software update, Random hardware failure
Reboot, hardware replacement, revert to old software
RNC Moderate Moderate Software update, Random hardware failure
Reboot, hardware replacement, revert to old software
Node B Low High Random hardware failure, Outdoor antenna damage
Hardware replacement, repair
82
5.3.2 Reconfiguration of the WCDMA system based on the (G-S) model
In the WCDMA system, the functions of the system can be categorized into four service classes:
conversational, streaming, interactive, and background. Each service class comprises a set of
sub-functions. For example, the conversational service function comprises the speech traffic
transmission, video telephony transmission, and voice transmission over IP, and video games.
The interactive service function comprises the web browsing and net games. The four services
are generalized and categorized into two overall functions: (1) function for voice transmission,
and (2) function for data transmission. The overall function can be decomposed into more
specific functions including the primary function and secondary function.
A component or subsystem may have a primary function as well as a secondary function. For
example, the TCP/IP Internet network system has the primary function for non-real time data
routing, download for web browsing, network games, and E-mail. Its secondary function is to
transmit the voice and speech data. The primary function as voice and speech transmission is
normally provided by the conventional telecommunication network (e.g., the circuit switch
network). In the case of emergency situations, the conventional telecommunication networks are
damaged, the Internet can take over the voice and speech transmission service through its
secondary function. This thesis study focused on the voice service, so in the following, it is
discussed on how to keep the voice service for a high continuity based on the G-S model.
The voice function is further divided into the sub-functions: (1) Speech function which is
provided by the circuit switching system, (2) Voice over IP (VoIP) which is provided by the
packet switching system, and (3) Videophone which is provided by both the circuit and packet
switching systems. Further, since the videophone is at a higher service level, and it only works in
the normal condition of the network and need more radio resources and bandwidths, it is thus out
of the scope of this study. This study focuses on the speech function provided by circuit switch
and the VoIP function by packet switch.
The WCDMA system function, behavior, structural components are shown in Figure 5.5, and
they are explained as follows.

83
UTRAN for connectivity between the UE (user equipment) and the core network. It
includes the RNC component for the radio resource control and component Node B for
the transmission and reception radio signals.
MSC-server for the call control, mobility management
MGw for the User’s data handling
GPRS subsystem for transmitting IP packets. It consists of SGSN for data packet
delivery and GGSN for gateway to Internet/enterprise.
UE for the user to access the WCDMA wireless system.
In the following, it is assumed that all users are legal and have the authority. In other words,
these components are not included, such as: (1) AUC/EIR for Authority to users/equipment, and
(2) HLR for Mobile subscribers’ management.
Figure 5.5 A typical overall function of WCDMA system.

84
Figure 5.5 lists two overall functions in the WCDMA system: one is the speech function for the
voice service and the other is the data function for the data packet transportation. For the speech
service function, the speech analog signal is received by the mobile phone, i.e. UE. UE codes the
analog signal into digital signals which are sent to UTRAN after the convolution, correlation,
and modulation function via radio frequency. After speech procession, transcoding (Transcode
2008) and Rate Adaptation, signals are transmitted to the MGw. MGw handles the circuit switch
connection in CN by selecting the traffic route to forward the signals to the destination within the
WCDMA network or external network such as the PSTN network or PLMN network. MGw is
under the control of the MSC server which controls MGw to accomplish the transforming of the
traffic bearer in circuit-switching network. The MSC Server and MGw have a one-to-many
relationship (i.e., one MSC server could control multiple MGws).
For the data service function, the UE sends the subscriber's session information to the UTRAN
by the Packet Data Protocol (PDP) context when the subscriber has an active session. A Radio
Access Bear (RAB) is allocated by SGSN and GGSN for packet data transfer. When the packet
session is open, the UE can transmit uplink or downlink data packets. The downlink data packet
first arrives at the UTRAN over the radio links forming a radio bearer for this session. Packet
traffic is then tunneled between the UTRAN and the SGSN by means of the GTP-U protocol.
The tunnel ends at the GGSN, from where user data packets are further routed to an external
packet data network, according to the method described in the connection-type parameter of the
PDP context.
When the system is in failure, there are three levels of failure scenarios which are defined in this
thesis study in accord with the telecommunication system: (1) Radio frequency access layer:
failure of Nodes B, (2) Radio access control subsystem layer: failure of RNC, and (3) Transport
layer: failure of MGw in CS domain, and failure of SGSN/GGSN in PS domain. A complete
failure scenario is described in Chapter 3 where the example WCDMA system was presented. In
the following, Media Gateway (MGw) in the circuit switching domain is supposed to be failed in
order to demonstrate the application of the G-S model for system reconfiguration to enhance the
survivability of the system. The following steps are applied:

85
The first step is to analyze the lost function by decomposition it into a tree until to the
component level. The function tree will include the particular function whose components (MGw)
is damaged. The second step is to find a secondary function of any component including the one
(MGw) which is damaged. For the example, the third method of system reconfiguration is
considered; in particular, the PS route is considered for providing unused capacity, in the form of
its secondary function to make this reconfiguration idea work. The third step is to explore the
principle which is implicitly represented by the new-reconfigured structure.
Figure 5.6 shows this reconfiguration solution. The overall function, ‘speech’, can be realized by
primary function ‘Voice over CS’. The ‘speech’ function is mainly realized by the behaviors of
Figure 5.6 Generalized reconfigurable WCDMA

86
‘CS switching’ and ‘Radio Access Bear (RAB)’. Both behaviors are generated by the structural
functional entities: MGw, MSC server, UTRAN and ME1. Now, the lost primary function
‘Voice over CS’ has be replaced by the secondary function through the component or subsystem
such as: GPRS, UTRAN and ME1. Thus, the original overall function ‘Speech’ can be recovered.
5.4 A Knowledge Based System to support system reconfiguration
For the discussion above, it is clear that it is necessary to develop a knowledge base for
supporting the G-S concept of reconfiguration. The knowledge base should contain function,
structure, and principle of a particular system (WCDMA in this case). Therefore, this knowledge
base consists of three parts: (1) function knowledge base, (2) structure knowledge base, and (3)
principle knowledge base. They are described in separate sections in the following.
5.4.1 System Function knowledge base
The system function knowledge base collects and describes the functions of the existing system.
The function may be called function prototype. The scheme of the function prototype is shown in
Table 5.2 (Umeda et al. 1996).
Table 5.2 Definition of function prototype.
Item Contents
Name Verb+objects+modifies
Decomposition Function tree
The item ‘Name’ is used to represent a designer’s intention in the form of ‘to verb objectives
modifiers’. Objects represent entities and things related to the function such as ‘Voice’ and
‘Data’. Modifiers qualify a function and include such terms as ‘stability’ and ‘reliability’. When
the general function and specific function are described, normally the Verb ‘transmit’ is omitted
in the name ‘transmit data’, ‘transmit speech’ or ‘transmit voice’ as the fundamental function of
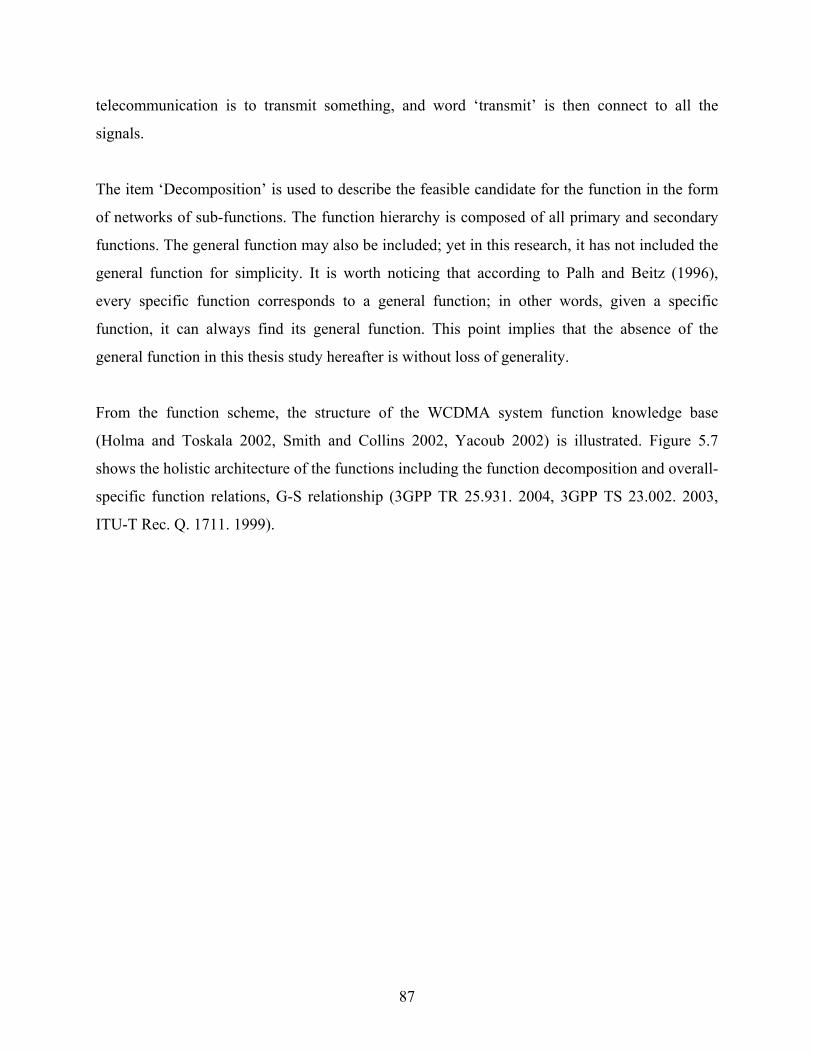
87
telecommunication is to transmit something, and word ‘transmit’ is then connect to all the
signals.
The item ‘Decomposition’ is used to describe the feasible candidate for the function in the form
of networks of sub-functions. The function hierarchy is composed of all primary and secondary
functions. The general function may also be included; yet in this research, it has not included the
general function for simplicity. It is worth noticing that according to Palh and Beitz (1996),
every specific function corresponds to a general function; in other words, given a specific
function, it can always find its general function. This point implies that the absence of the
general function in this thesis study hereafter is without loss of generality.
From the function scheme, the structure of the WCDMA system function knowledge base
(Holma and Toskala 2002, Smith and Collins 2002, Yacoub 2002) is illustrated. Figure 5.7
shows the holistic architecture of the functions including the function decomposition and overall-
specific function relations, G-S relationship (3GPP TR 25.931. 2004, 3GPP TS 23.002. 2003,
ITU-T Rec. Q. 1711. 1999).

88
Figure 5.7 Holistic architecture of the function.

89
In Figure 5.7, there are two overall functions of the WCDMA system, the speech and data
transmission. The ‘speech’ function can be realized mainly by three specific function services:
the Voice over Circuit Switch, Vice over IP by Internet or Video conference service. The ‘data’
function is realized mainly by other three specific functions: Video conference for imagine,
Audio/Video streaming, Web-browsing, etc. Such specific functions are also grouped into the
four types of service class based on the QoS standards, (1) conversational, (2) streaming, (3)
interactive, (4) and background (Holma and Toskala 2002, Kaaranen 2005).
In the following, a detailed description of the function decomposition for the example WCDMA
system is given. Three steps to decompose the functions are devised.
Step 1: the specific functions (service) are decomposed into a set of sub-functions (system). In
the WCDMA system, there are two functions: Circuit data Support Function (CSF) and Packet
data Support Function (PSF). The CSF further consists of a set of functions to transfer the signal
via dedicated circuit (or channel) between nodes and terminals with real time service. The PSF
consists of a set of functions transferring data packet over a shared network.
Step 2: the CSF and PSF specific functions are further decomposed into the functions. The CSF
function is realized by the three specific functions. The three functions are ‘User Access
Function (UAF)’, ‘Radio Access Function (RAF)’ and ‘Circuit Switch Domain function (CSD)’
in Figure 5.7.
The UAF provides means for the user to access the WCDMA wireless system through
radio frequency.
The RAF provides means for exchanging information between Mobile Terminal (MT)
and Core Network (CN), acting as a bridge, router, and gateway, as required.
The CSD means that the set of all the CN entities offering "CS type of connection" for
user traffic as well as all entities supporting the related signaling. A "CS type of
connection" is a connection for which dedicated network resources are allocated at the
connection establishment and released at the connection release. The entities specific to
the CS domain are: MSC, GMSC, VLR, etc.

90
The PSD means the set of all the CN entities offering "PS type of connection" for user
traffic as well as all the entities supporting the related signaling. A "PS type of
connection" transports the user information using autonomous concatenation of bits
called packets: each packet can be routed independently from the previous one. The
entities specific to the PS domain are the GPRS specific entities, i.e. SGSN and GGSN.
Step 3: the above subsystem specification function can be decomposed into sub sub-system or
component specific function entities. In Figure 5.7, the CSD function is decomposed into the
specific function group which constitutes the system functional component-MSC -server/MGw
(ITU-T Rec Q. 1711. 1999, Yacoub 2002).
Service Control Function (SCF): it contains the overall Intelligence Network (IN) service
control functionality in the IMT-2000. Service logic can be triggered by call processing,
mobility management, or non-call associated events.
Packet Service Control Function (PSCF): it provides the packet service control
functionality in the IMT-2000 Core Network for updating, network control, updating and
routing contexts.
Connection Control Function (CnCF): it provides connection processing control.
Enhanced Call Control Function (CCF): it is based on the Call Control Function defined
in Recommendation Q.1224 (IN CS-2). It has been enhanced for mobile communications.
It provides call/connection processing control.
Service Switching Function (SSF): it is associated with the CCF. It provides the set of
functions required for the interaction between the CCF and SCF.
Service Access Control Function (SACF): it provides both call-related and call-unrelated
processing and control (e.g. in relation to mobility management).
Access link Relay Function (ARF): it handles the overall control for the transit of a
branch of the BS approach link between two instances of the Radio Access Control
Function (RACF). RACF exists in the RNC subsystem.
The UAF function is decomposed into the specific function group which constitutes the system
functional component-User Equipment (UE) (ITU-T Rec Q. 1711. 1999, Yacoub 2002).

91
Mobile Geographic Position Function (MGPF): it provides the overall control for the
geographic position finding function on the mobile terminal side.
User Identification Management Function (UIMF): it provides the means to identify both
the IMT-2000 user and the mobile terminal to the network and/or to the service provider,
and contains processing capability for authentication and service handling in the UIM.
Packet Service Control Agent Function (PSCAF): it provides the packet service control
agent functionality in the IMT-2000 mobile terminal.
Connection Control Agent Function (CnCAF): it provides connection control functions
for users.
Mobile Control Function (MCF): it provides the overall service access control logic and
processing at the mobile side of the radio interface. Specifically, it interacts with the
network for mobility management.
Radio Access Control Agent Function (RACAF): it handles the mobile side of the
association and access link control between the mobile terminal and the network.
Mobile Radio Transmission and Reception (MRTR): it controls the interconnection and
adaptation of the access radio link to the rest of the mobile terminal.
The RAF function is decomposed into two specific function groups. One group constitutes the
system functional component - Node B; the other group constitutes the system functional
components- RNC (ITU-T Rec Q.1711.1999, Yacoub 2002).
(1) The first group further consists of the following functions:
System access Information Broadcast Function (SIBF): it handles the overall control of
system access information broadcasting. The information to be broadcast may be made
available to the function via an operation and maintenance function.
Radio Frequency Transmission and Reception (RFTR): it controls the interconnection
and adaptation of the access radio link corresponding to the BS approach link. This
includes radio channel error protection coding and decoding.
(2) The second group further consists of the following functions:

92
Geographic Position Function (GPF): it handles the tasks associated with geographic
positioning in the radio access side.
Access link Relay Function (ARF): it handles the overall control for the transit of a
branch of the BS approach link between two instances of the RACF.
Radio Access Control Function (RACF): it handles the overall control of the association
and access link(s) between a mobile terminal and the network.
Satellite Network Control Function (SNCF): it dynamically controls the configuration of
radio network resources, in response to demands for connections to and from mobile
terminals. In particular, in satellite networks, optimal use of scarce communication
resources requires these dynamic behaviors.
Connection Control Function (CnCF): it provides connection processing control.
Step 4: the PSD function is decomposed into the specific function group which is embodied with
a combined SGSN/GGSN network component, mainly for packet traffic service (ITU-T Rec.
Q.1711.1999, Yacoub 2002). The group consists of the following functions.
Packet Service Gateway Control Function (PSGCF): it provides the packet service
gateway control functionality in the IMT-2000 Core Network.
Packet Service Control Function (PSCF): it provides the packet service control
functionality in the IMT-2000 Core Network.
Location Management Function (LMF): it contains the basic terminal mobility logic. It
supports location management, mobility management, activation status management, and
identity management. The LMF interacts with other functions to access additional logic
or share information. It also handles storage and access to subscriber mobility data.
Authentication Management Function (AMF): it handles storage and access to
authentication data. It also provides the authentication function and confidentiality
control.
Service Control Function (SCF): it contains the overall IN service control functionality in
the IMT-2000. Service logic can be triggered by call processing, mobility management,
or non-call associated events. The SCF interacts with other functions to access additional

93
logic or to obtain information (service, user or network data) required processing a
service logic instance.
The function knowledge base mentioned above supports the emergency manager to realize the
function reconfiguration in different contexts. Figure 5.8a and Figure 5.8b show the snapshot of
the function decomposition and function reconfiguration by the G-S concept in disaster
situations. Figure 5.8a shows that the speech service is provided by the primary specific function
(i.e. circuit switch network) to transport the voice signals. The secondary specific function for
speech function (i.e. VoIP) is depicted with dotted line in Figure 5.8b. It describes the function
reconfiguration.
(a) Decomposition of speech function.
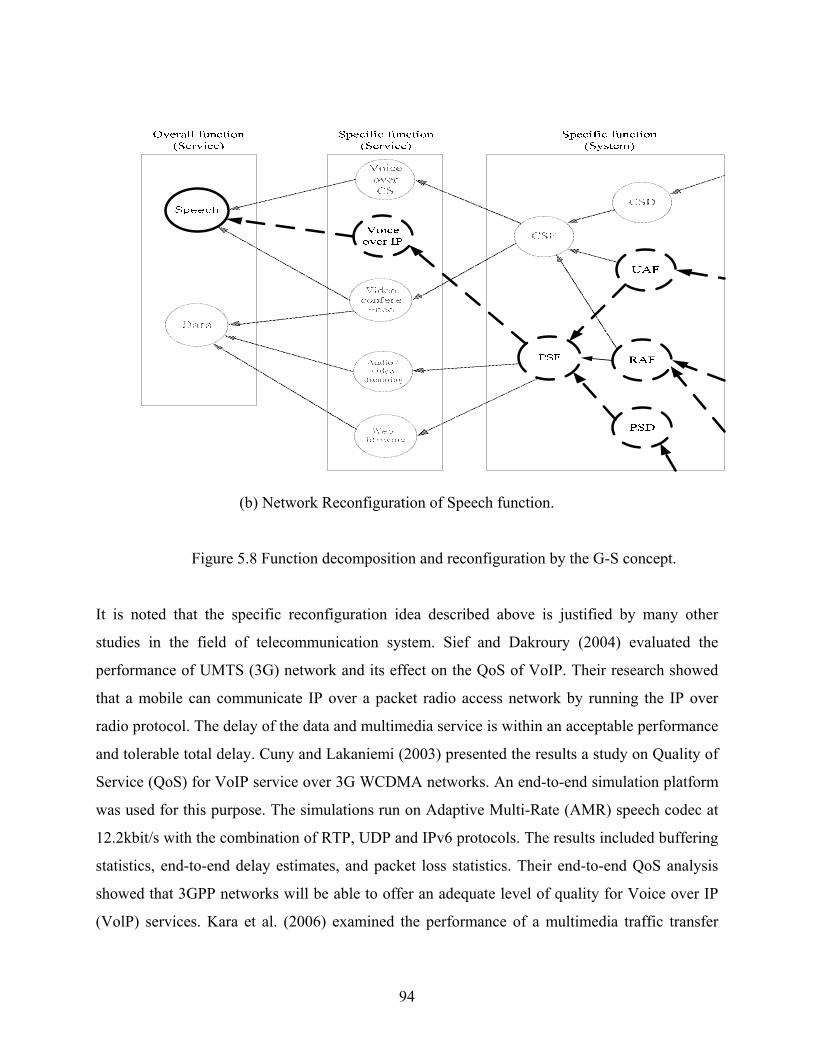
94
(b) Network Reconfiguration of Speech function.
Figure 5.8 Function decomposition and reconfiguration by the G-S concept.
It is noted that the specific reconfiguration idea described above is justified by many other
studies in the field of telecommunication system. Sief and Dakroury (2004) evaluated the
performance of UMTS (3G) network and its effect on the QoS of VoIP. Their research showed
that a mobile can communicate IP over a packet radio access network by running the IP over
radio protocol. The delay of the data and multimedia service is within an acceptable performance
and tolerable total delay. Cuny and Lakaniemi (2003) presented the results a study on Quality of
Service (QoS) for VoIP service over 3G WCDMA networks. An end-to-end simulation platform
was used for this purpose. The simulations run on Adaptive Multi-Rate (AMR) speech codec at
12.2kbit/s with the combination of RTP, UDP and IPv6 protocols. The results included buffering
statistics, end-to-end delay estimates, and packet loss statistics. Their end-to-end QoS analysis
showed that 3GPP networks will be able to offer an adequate level of quality for Voice over IP
(VolP) services. Kara et al. (2006) examined the performance of a multimedia traffic transfer

95
over real 3G WCDMA mobile network. They identified the 3G WCDMA mobile network
performance to carry widespread multimedia services of video or audio streaming, FTP, HTTP,
and VoIP based on the TCP and UDP protocols. The testing result of VoIP showed that the VoIP
tests all passed successfully on the 3G network even though there was one-way delay and the
delay variation (jitter) were measured on the uplink and the downlink directions for voice
transfer. An acceptable voice quality was obtained using the QoS profile.
5.4.2 System structure knowledge base
The structure of the WCDMA system is divided into two parts: the traffic transmission structure
and the system control structure. The traffic transmission structure includes the entities that
receive and transport the traffic data to destination, while the system control structure includes
the entities that follow the rules or operation standards to manipulate the entities in the traffic
transmission structure.
Theses components are further categorized into five groups: (1) User interface, (2) Radio signal
Access, (3) Signaling control (4) Data transportation, and (5) System database. Table 5.3 shows
the typical constitution of the structure of 3G WCDMA network and the states or properties of
the components (Mishra 2004, Smith and Collins 2002).
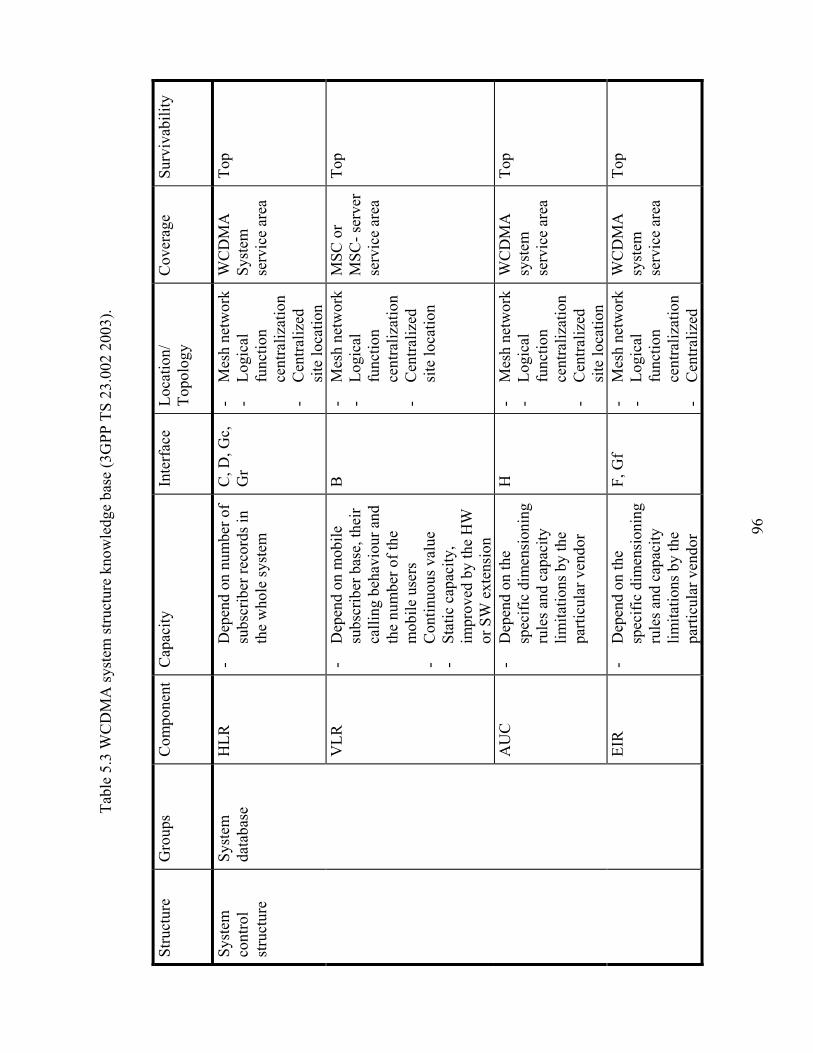
96
Tabl
e 5.
3 W
CD
MA
syst
em st
ruct
ure
know
ledg
e ba
se (3
GPP
TS
23.0
02 2
003)
.
Stru
ctur
e G
roup
s C
ompo
nent
C
apac
ity
Inte
rfac
e Lo
catio
n/
Topo
logy
C
over
age
Su
rviv
abili
ty
HLR
-
Dep
end
on n
umbe
r of
subs
crib
er re
cord
s in
the
who
le sy
stem
C, D
, Gc,
G
r -
Mes
h ne
twor
k
- Lo
gica
l fu
nctio
n ce
ntra
lizat
ion
- C
entra
lized
si
te lo
catio
n
WC
DM
A
Syst
em
serv
ice
area
Top
VLR
-
Dep
end
on m
obile
su
bscr
iber
bas
e, th
eir
calli
ng b
ehav
iour
and
th
e nu
mbe
r of t
he
mob
ile u
sers
-
Con
tinuo
us v
alue
-
Stat
ic c
apac
ity,
impr
oved
by
the
HW
or
SW
ext
ensi
on
B
- M
esh
netw
ork
-
Logi
cal
func
tion
cent
raliz
atio
n-
Cen
traliz
ed
site
loca
tion
MSC
or
MSC
-ser
ver
serv
ice
area
Top
AU
C
- D
epen
d on
the
spec
ific
dim
ensi
onin
g ru
les a
nd c
apac
ity
limita
tions
by
the
parti
cula
r ven
dor
H
- M
esh
netw
ork
-
Logi
cal
func
tion
cent
raliz
atio
n-
Cen
traliz
ed
site
loca
tion
WC
DM
A
syst
em
serv
ice
area
Top
Syst
em
cont
rol
stru
ctur
e
Syst
em
data
base
EIR
-
Dep
end
on th
e sp
ecifi
c di
men
sion
ing
rule
s and
cap
acity
lim
itatio
ns b
y th
e pa
rticu
lar v
endo
r
F, G
f -
Mes
h ne
twor
k
- Lo
gica
l fu
nctio
n ce
ntra
lizat
ion
- C
entra
lized
WC
DM
A
syst
em
serv
ice
area
Top

97
site
loca
tion
GM
SC-
serv
er
- D
epen
d on
subs
crib
er
base
, the
ir ca
lling
be
havi
or a
nd th
e nu
mbe
r of R
NC
s, M
Gw
-
Con
tinuo
us v
alue
-
Stat
ic v
aria
ble,
im
prov
ed b
y H
W a
nd
SW e
xten
sion
C, M
c,
Nc
- M
esh
netw
ork
-
Logi
cal
func
tion
cent
raliz
atio
n-
Cen
traliz
ed
site
loca
tion
Exte
rnal
PS
TN o
r PL
MN
ne
twor
k to
th
e M
SC
serv
ice
area
Top
Sign
alin
g co
ntro
l
MSC
-se
rver
-
Dep
end
on su
bscr
iber
ba
se, t
heir
calli
ng
beha
viou
r and
the
num
ber o
f RN
Cs,
MG
w
- C
ontin
uous
val
ue
- St
atic
cap
acity
, im
prov
ed b
y th
e H
W
or S
W e
xten
sion
Iu-C
S,
D,F
, G, E
, M
c, N
c
- M
esh
netw
ork
-
Logi
cal
func
tion
cent
raliz
atio
n-
Cen
traliz
ed
site
loca
tion
MSC
se
rvic
e ar
ea
Top
MG
w
- D
epen
d on
subs
crib
er
base
, the
ir ca
lling
be
havi
our a
nd th
e nu
mbe
r of R
NC
s -
Con
tinuo
us v
alue
-
Stat
ic c
apac
ity,
impr
oved
by
the
HW
or
SW
ext
ensi
on
Iu-C
S,
Nb,
Mc
- Tr
ee n
etw
ork
to R
NC
- M
esh
netw
ork
to o
ther
s -
Logi
cal
func
tion
cent
raliz
atio
n-
Dis
tribu
ted
site
loca
tion
MG
w
serv
ice
area
H
igh
Traf
fic
trans
mis
sion
st
ruct
ure
Dat
a tra
nspo
rtatio
n
SGSN
-
Dep
end
on th
e nu
mbe
r of a
ttach
ed
subs
crib
ers o
r the
to
tal t
hrou
ghpu
t.
Iu-P
S,
Gn,
Gf,
Gp,
Gr,
Gs
- Tr
ee n
etw
ork
to R
NC
- M
esh
netw
ork
to o
ther
s
SGSN
se
rvic
e ar
ea
Hig
h

98
- Lo
gica
l fu
nctio
n ce
ntra
lizat
ion
- D
istri
bute
d si
te lo
catio
n G
GSN
-
Dep
end
on th
e to
tal
thro
ughp
ut a
nd th
e nu
mbe
r of
sim
ulta
neou
s PD
P co
ntex
ts
Gn,
Gc,
G
i -
Mes
h ne
twor
k to
oth
ers
- Lo
gica
l fu
nctio
n ce
ntra
lizat
ion
- D
istri
bute
d si
te lo
catio
n
Exte
rnal
IP
netw
ork
to
the
MSC
se
rvic
e ar
ea
Hig
h
RN
C
- D
epen
d on
RF
netw
ork
elem
ents
(s
uch
as si
tes,
sect
ors,
and
TRX
s) a
nd Iu
b in
terf
ace
capa
city
-
Con
tinuo
us v
alue
-
Stat
ic c
apac
ity,
impr
oved
by
the
HW
ex
tens
ion
Iu-C
S, Iu
-PS
, Iu-
r,Iu-
b
- Tr
ee n
etw
ork
to M
Gw
or
SGSN
- D
istri
bute
d si
te lo
catio
n
RN
C
loca
tion
serv
ice
area
Mod
erat
e R
adio
sign
al
Acc
ess
Nod
e B
-
Dep
end
on th
e up
link
and
dow
nlin
k ca
paci
ty
Iu-b
, Uu
- Tr
ee n
etw
ork
to R
NC
-
Dis
tribu
ted
site
loca
tion
Rad
io
acce
ss a
rea
(Cel
l)
Low
Use
r int
erfa
ce
UE
- D
iscr
ete
valu
e -
Dyn
amic
cap
acity
by
diff
eren
t ser
vice
s po
rtfol
io
Uu
- Tr
ee n
etw
ork
to R
NC
-
Dyn
amic
and
di
strib
uted
si
te lo
catio
n
Rad
io
acce
ss a
rea
(Cel
l)
Ver
y Lo
w

99
The emergency manager searches the knowledge base by following the procedure (see Figure
5.9). It starts from the structures (either control structural part or traffic transmission structural),
then the groups of each structure, then the components, and finally the attributes of the selected
components.
Figure 5.9 Design procedures for the structure knowledge base.
Figure 5.10 shows a simple example of applying the above procedure for the voice function in
the circuit switch domain. The manager starts with the transmission structure in the User
Equipment (UE) layer. The UE supports the UMTS service with the Uu interface and within the
radio coverage area of Node B, the Cell of Node B. The components in other groups such as
Radio signal access, data transportation, are identified to provide the circuit switch function. All
the selected components have their own state variables. The relation between the components is
determined by the state variables (e.g. capacity and interfaces). When the state variables of the
two different components can match each other, they can interact. For instance, the UE-1 is only
related with the Node B because the Node B has the same Un interface. Their interfaces match
each other. Meanwhile the capacity of the Node B also impacts the relation with the UE.

100
Meanwhile, if the Node B-1 does not have enough capacity to process the service request from
the UE, the UE has to request other node (e.g. Node B-2), which has enough capacity. The Node
B-2 will transmit the traffic to the RNC-2 through the Iu-b interface between them. If the RNC-2
does not have enough capacity, UE-1 has to hand over to another Node B which can find an
available traffic channel from RNC and CN. The RNC-2 is assumed to have enough capacity and
MGw can allocate enough channels to the call services. Then the voice traffic can be transported
from the RNC-2 to the MGw through the Iu-CS interface and forwarded to users in local
network or other PLMN/PSTN network. Figure 5.10 shows the selected components and their
provision of the WCDMA CS domain voice function. Similar to the Voice function realization,
the VoIP function can be provided by the network components UE-1, Node B-2, RNC-2 and
GPRS, etc. These components transport the packet Voice data to the IP network and relay to the
users in other PSTN/PLMN networks.
Figure 5.10 Configuration of network components.

101
5.4.3 System principle knowledge base
The principle of telecommunication system (e.g. 3G WCDMA system) refers to standard
interfaces or protocols. Protocols may be implemented by hardware, software, or a combination
of the two. At the lowest level, a protocol defines the behavior of a hardware connection. The
UMTS protocols are used to control the execution of network functions in a coordinated manner
across system interfaces (Kaaranen 2005). At a higher level, protocols are grouped in stacks,
which are standard interfaces. There are three reference protocols and they are: (1) The Radio
Interface Protocol Reference Model; (2) UTRAN Protocol Reference Model; and (3) The CN
Protocol Reference Model. The architecture of each model consists of the protocol stacks
(Kaaranen 2005). A view of the 3G WCDMA protocol architecture is shown in Figure 5.11
(García et al. 2002). In this figure, the protocols are grouped under the three reference models;
the detailed knowledge about all these protocols is beyond the scope of this thesis. Further, these
protocols are classified into access stratum and non-access stratum. The non-access stratum
concerns the user service request, while the access stratum concerns the processing of radio
signals.
Table 5.4 is a schema of the principle knowledge base. In this table, the first column shows two
operation levels, namely non-access stratum and access stratum. The second column shows the
functions of the components which are governed by the protocols. The third column shows the
components involved. The fourth column shows the protocols that are applied to the components
(in the third column) to play the functions as shown in the second column. In the following, three
examples are presented to further explain how the protocol works.
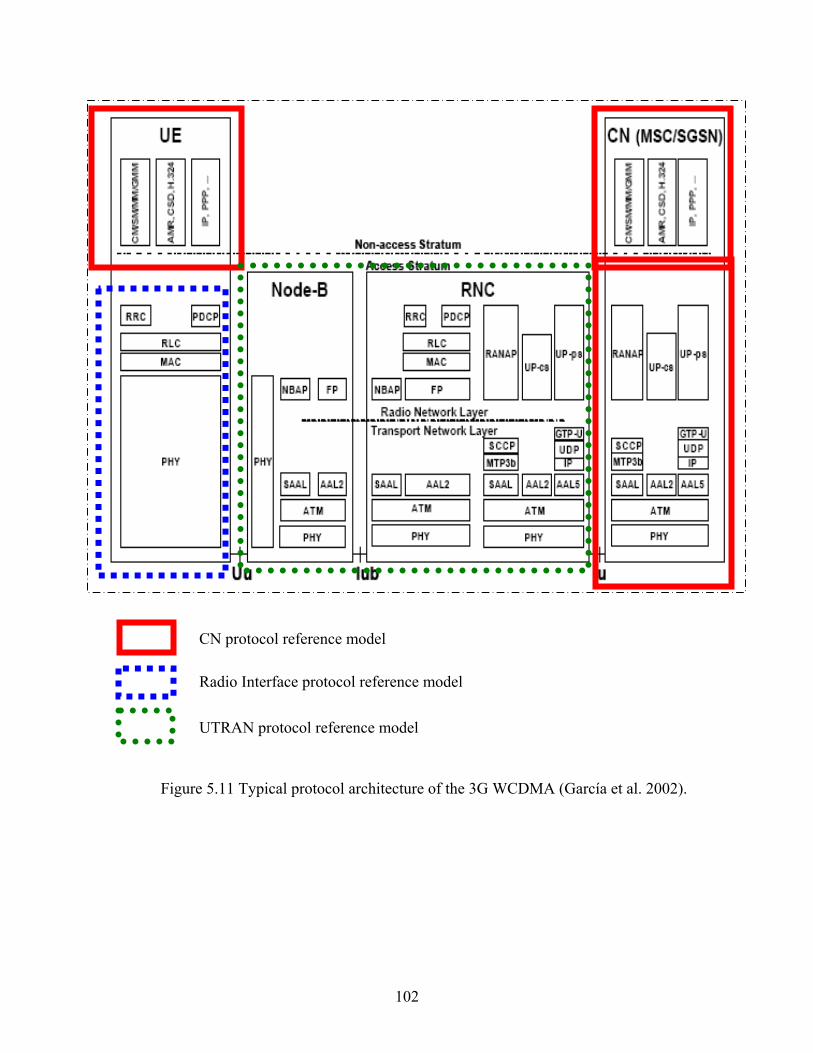
102
CN protocol reference model
Radio Interface protocol reference model
UTRAN protocol reference model
Figure 5.11 Typical protocol architecture of the 3G WCDMA (García et al. 2002).

103
Table 5.4 WCDMA system principle knowledge base.
Operation level Function Components Protocols VoCS UE, Node B, RNC, MSC
server, MGw, HLR, EIR Call Control (CC) protocol in non-access stratum (refer to the horizontal axis in Figure 5.11); All the protocols in Access stratum (refer to the vertical axis in Figure 5.11)
VoIP UE, Node B, RNC, SGSN,GGSN, HLR, EIR
Session Management (SM) protocol in non- access stratum (refer to the horizontal axis in Figure 5.11); All the protocols in Access stratum (refer to the vertical axis in Figure 5.11)
Non-access stratum
MM UE, Node B, RNC, MSC server, MGw, SGSN,GGSN, HLR, EIR
Mobility Management (MM) and GPRS Mobility Management (GMM) protocols in non- access stratum(Refer to the horizontal axis in Figure 5.11); All the protocols in Access stratum (refer to the vertical axis in Figure 5.11)
PC UE, Node B, RNC RRC and PDCP protocols and other lower support protocols (Figure 5.11)
Access stratum
CAC UE, Node B, RNC RRC and PDCP protocols and other lower support protocols (Figure 5.110
Example 1: Principle of Voice over Circuit Switch domain
In Figure 5.12, the Voice over Circuit Switch domain (VoCS) principle and the interaction
between the protocols and components are described. It shows how the principle governs the
behavior and procedure of each component under control. This example shows an example of a
voice originated call establishment on 3G WCDMA circuit switch domain. The principle
identified the required components (i.e. UE, UTRAN, MSC server, MGw) for the target function
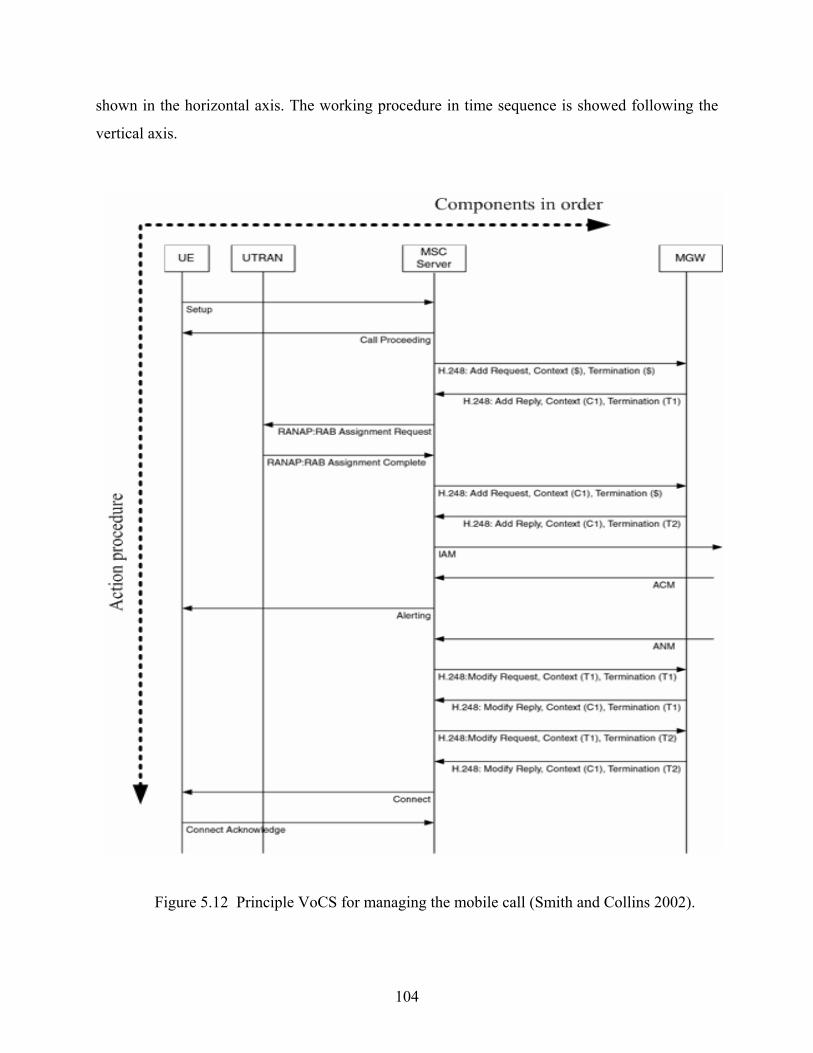
104
shown in the horizontal axis. The working procedure in time sequence is showed following the
vertical axis.
Figure 5.12 Principle VoCS for managing the mobile call (Smith and Collins 2002).
105
When the Setup message arrives from the UE, the MSC server performs a call-routing
determination. It then responds with a ‘Call Proceeding message’ to the UE. Based on the call-
routing determination, the MSC server chooses a MGw to handle the call. It instructs (Add
Request) the MGw to establish a new context and places a termination in that context. The
termination in question (T1) will be on the network side of the MGw. Once the new context is
established by the MGw, the MSC server requests the RAN to establish a RAB to handle the call.
Once the RAB has been assigned, the MSC server is in a position to establish a media
connection between the RNC and the MGw. Therefore, it requests the MGw to add a new
termination to the context that has just been established. This new termination (T2) will face
towards the RNC. Because the new termination is in the same context as termination T1, a path
is created from one side of the MGw to the other.
The MSC server then sends the ISUP Initial Address Message (IAM) to the called network (such
as the PSTN). Upon the receipt of an Address Complete Message (ACM) from the far end, the
MSC server sends an Alerting message to the UE. Typically, the called user will answer, which
causes an ISUP Answer Message (ANM) to be received at the MSC server. At this point, the
MSC server may optionally modify the context established on the MGw. Specifically, when the
terminations were established in the new context, they may have been configured to not provide a
complete through-connection. For example, one or both of the terminations could have been
configured to allow only a one-way media path (from the far end to UE for the purposes of
receiving a ring-back tone). In such a case, the MSC server requests the MGw to modify the
configuration so that a full two-way media path is established. Finally, the MSC server sends a
Connect message to the UE and the UE responds with a Connect acknowledge (Smith and Collins,
2002).
Example 2: Principle of VoIP
VoIP is the routing of voice traffic over the Internet or any other IP-based network. Using the
Internet’s packet-switching capabilities, VoIP technology has been implemented to provide
telephone services. In the IP world, there are two main methods of providing call-control
functionality: ITU-T Recommendation H.323, and the IETF Session Initiation Protocol (SIP).

106
The basic components of the voice service are two user terminals with IP-based voice
applications and a network that provides end-to-end transport between the terminals. The two IP-
based terminals exchange voice samples that have been encapsulated in RTP over the IP network.
The terminals exchange control signaling between them and maintain communication sessions
through the network according to either the H.323 or SIP paradigm (Eriksson et al. 2000).
There are two protocol families which is conjunction with H.323 and SIP protocols by
supporting the data transportation and control. The Real-Time Transport Protocol (RTP), along
with its associated Real-Time Control Protocol (RTCP). They constitute the technical foundation
of the Voice over IP industry. The detailed information about the protocols is addressed in (He
2007). Figure 5.13 shows the protocol stacks of RTP and RTCP.
RTP, RTCP
Transport Layer (UDP/TCP)
Network layer (IP)
Datalink Layer
Physical layer
Figure 5.13 A simple VoIP protocol stack.
The mobile terminal supports cellular access (UMTS/WCDMA or EDGE) and a complete VoIP
application that is based on either SIP or H.323. The principle which governs the operation of the
system to achieve the VoIP function is embodied by the interactive protocols to control the
bevaiour of the structural components.

107
Figure 5.14 gives the typical example of the SIP-based telephone protocol stacks, which shows
how the principle works. In this figure, SIP stands for Session Initiation Protocol. It is an
application-layer control (signaling) protocol for initiating, manipulating, and tearing down
sessions. These sessions include Internet telephone calls, multimedia distribution, and
multimedia conferences. SIP’s main purpose is to help session originators deliver invitations to
potential session participants. It is an alternative to H.323.
The SIP lies in the application layer and must be used in conjunction with other protocols in
order to provide real-time services. When a SIP signaling session is successfully set up, an Real-
Time Transport Protocol (RTP) media session is opened and the virtual session begins. The
digitally encoded voice stream is carried over an IP network by using the Real-Time Transport
Protocol. The RTP Control Protocol (RTCP) is a companion protocol of RTP and is used for
providing quality-related feedback. The Resource Reservation Protocol (RSVP) is an optional
protocol that will manage the resources being reserved at each node along the data path to meet
Figure 5.14 Principle of SIP-based protocols (Zhang 2002).

108
the quality-of-service requirements of particular application data streams. The Real-Time
Streaming Protocol (RTSP) functions as a network remote control for on-demand delivery of
real-time data. The Media Gateway Control Protocol (MGCP) or Megaco is used for media
gateway control when interoperating with traditional circuit-switched networks.
Example 3: Principle of Power Control process
A typical infrastructure of a cellular network consists of a number of components. A failure of
one component may affect nearly all customers covered. In a wireless system, a Node B that
communicates directly with UEs is a critical facility. If more Node Bs are deployed, the coverage
as well as the system’s capacity can be enhanced, but there is a higher possibility of Node B
failure. Thus, partial users may be out-of-service and the overall QoS would be degraded. In
terms of operating, if some of the failed Node Bs could be recovered, it would enhance Node Bs
and provide survivable service. Accordingly, Node Bs recovery is one of the most important
approaches for minimizing the total system Call Blocking Rate (CBR). It is important to find the
way to provides network survivability by allocating redundant resources. Power control process
of WCDMA system plays a vital role in adjusting the transmission power of all
available/workable Node Bs, reduces the impact of Node B failures. It has a direct impact on the
coverage and capacity of the network. Air-interface capacity in the downlink is more critical and
is dependent on the transmitted interference. If the required transmitted power can be reduced to
a bare minimum, the capacity can be increased. However, in the uplink, both the transmitted and
received power will increase interference to, respectively, adjacent cells and users of the same
cell. The better the isolation between the cells, the higher the capacity, and decreasing power
levels to the minimum required can increase this isolation. Therefore, efficient and fast power
control is the key to system capacity and service maintenances of WCDMA technology. Power
control is based on the SIR. Both uplink and downlink power control is necessary, with
downlink control being the more critical. Power control of the common channels is necessary,
the most important ones being the CPICH, AICH, PICH and CCPCH (Mishra 2004).
A rather simple mathematic model of PC is shown in Equations (5.1) (Nuaymi et al. n.d.).

109
bm,γ =∑
≠=
+M
mjjbjbj
mbm
npg
pg
;1
(5.1)
At a given instant, M mobiles are transmitting information sharing a Common Radio Channel
(CDMA). Each mobile should communicate with one of the Node Bs, “b”. The index of the
Node B to which mobile m is assigned as mb . A mobile is connected to the best received power
level of Node B, which is not always the closest one due to fadings. Mobile m transmitted power
is mp and the link gain from mobile m to base b is noted as bmg , so matrix G = ( bmg ) is of size
(B x M). Mobile m received SIR on Node B, noted mb, where bn is the receiver noise, also
called thermal noise, at Node B. The received SIR of mobile m on its assigned Node B is noted
as bmγ . A mobile is outage of the service when the SIR is below the defined threshold.
Figure 5.15 shows an example of three Node-BS (Node B0, B1, B2) and six Mobile equipments,
MEs, (M 0–5), where two MEs are covered by each Node Bs. In Figure 5.15a, all Node Bs work
normally (no failures) within power radius R. M0 and M1 are served by Node B0; M2 and M3
are served by Node B1. M4 and M5 are served by Node B2, respectively. In Figure 5.15b, Node
B2 is failed. Thus, both the Node B0 and Node B1 adjust transmission power within R’ to serve
the impacted M4 and M5, respectively by deploying the power control process and algorithms
for power management. Figure 5.15b shows alternative ways of recovering Node B2. M4 is
recovered within the coverage area R’ of Node B1, while M5 is outage of the service due to the
far distance beyond the Maximum coverage area of Node B0 and B1.

110
((
(a) Normal situation. (b) Node B2 Failure.
Figure 5.15 An example of Power Control.
5.5 Conclusion with discussion
This chapter presented a new approach to system reconfiguration. The approach is based on the
General-Specific (G-S) concept and thus the approach is also called G-S model. The essential
point with the G-S model is that every component, subsystem, and system has two aspects:
general function and specific function. To facilitate the modeling of the general and specific
function, the general function can be thought of being context insensitive, while the specific
function can be though of being context sensitive or context specific. In theory, there will be
many specific functions. It is reasonable to assume that a system usually does not run in its full
capacity in its normal operation situation; in particular, if it is composed of a set of components
(A, B, C, etc.), it is likely that A, B, and/or C may not operate in their full capacities. This further
means that a part of A, B, and/or C may possibly be used for another specific function when a
specific context is given.

111
To simplify the demonstration of the application of this general and specific function concept to
system reconfiguration, it is considered that each system (or component or subsystem) has two
specific functions which are called primary function and secondary function, respectively. A
particular component or subsystem plays its primary function in one specific situation which
may be called the named situation. When some components or subsystems are damaged,
implying that they can no longer perform their primary functions, they will be replaced by other
components or subsystem in the same system or in its relevant systems through their secondary
functions which are not made available in their corresponding named situations.
There are some related works in a broader area of system engineering and management, notably
the work of Umeda and Tomiyama (1995) and the work of Ulrich and Seering (1988). Umeda
and Tomiyama (1995) illustrated a design methodology called function redundancy for highly
reliable machines. They proposed that function redundancy is achieved by using the potential
functions of the existing parts in a slightly different way from the original design. They illustrate
this idea using a simple example. In case of emergency when the engine stops, a car with a
manual transmission can run for a while. This function redundancy is achieved depending on the
car system in redirecting power flow - in particular changing from function ‘to start the engine’
to the function ‘to generate driving force’. This idea is essentially similar to the idea which was
presented in Figure 5.3 (transportation system reconfiguration) in the sense that in their case the
motor is idle after its function to start the engine is completed, and later the motor is reused.
However, their approach is not of coverage of the method which is shown in Figure 5.2b and
Figure 5.2c, respectively, which are in essence to employ the damaged components or
subsystems.
Ulrich and Seering (1988) proposed a concept called function sharing as a kind of design method
for general product design. The function sharing is defined as a correspondence between several
functional elements and one structural element or physical property of the design. In essence,
whenever a single structural element can map to more than one functional element, then the
device shows the function sharing. In a more general sense, one can imagine that their design
methodology tries to build a many-to-many relation between the design features and functions.

112
The function sharing concept is close to the function redundancy concept and seems to be
restricted to a single component only in their original description. The function sharing concept
has not been applied to the survivability of a system.
In comparison with these two methods in engineering design, the approach based on the G-S
model is the most general one. The other two approaches are at most useful to the reliability of
the system but not to the survivability of the system. This point is noted with a special reference
to the first two methods of Figure 5.2b and Figure 5.2c (respectively), which are a part of the
approach described in the thesis.
113
Chapter 6
Petri Net Dynamic Modeling and Simulation of WCDMA
6.1 Introduction
This chapter presents a dynamic model of the WCDMA system using Petri Net theory, in
particular Colored Petri Net (CPN). There are a couple of purposes of having such a dynamic
model. First, with the dynamic model, the emergency manager can validate his or her particular
decision through the simulation of the system behavior. Second, the emergency manager can
study the system vulnerability through a fault or damage engine which generates system damage
scenarios to be applied to the system. Further, this Petri Net model is integrated with the domain
model of the WCDMA system, which leads to a new way to apply the Petri Net theory to a
complex service system. As such, the proposed dynamic model has a close relation with the FBS
framework which was used to develop the domain model of the WCDMA system (see Chapter
4). In the remainder of this chapter, Section 6.2 discusses the basic concepts of Petri Net theory.
Section 6.3 presents an integrated FBS and Petri Net modeling approach to the WCDMA system.
The code of the Petri Net model is shown in Appendix A. Section 6.4 presents an interface which
is used to examine the dynamics of a service provider system - the example WCDMA system in
this thesis study case. Section 6.5 concludes this chapter with some discussion.
6.2 Petri Net theory
6.2.1 Petri Net
Ordinary Petri Net, or simply Petri Net (PN), was initially developed by Carl A. Petri in 1962. It
is a powerful tool for modeling discrete event systems. The definitions about Petri Nets are
summarized in Table 6.1 (Murata 1989).

114
Table 6.1 Basic definitions of Petri Nets.
A Petri Net is a 5-tuple, PN = (P, T, F, W, M0) where:
P = }{ mppp ,,2,1 L is a finite set of places,
T = }{ nttt ,,2,1 L is a finite set of transitions,
F ⊆ (P x T) ∪(T x P) is a set of arcs (flow relation),
W: F→ (1, 2, 3, . . .} is a weight function,
M0: P →(0, 1, 2, 3, . . .} is the initial marking,
P ∩ T = Ø and P ∪ T ≠Ø.
A Petri Net structure N = (P, T, F, W) without any specific initial marking is
denoted by N.
A Petri Net with the given initial marking is denoted by (N, M0).
The dynamic behavior of systems can be described with system states and their changes. In Petri
Net, the state corresponds to the marking. A state or marking in a Petri Net is changed according
to the following transition (firing) rule:
(1) A transition ‘t’ is said to be enabled if each input place ‘p’ is marked with at least w(p, t)
tokens, where w(p, t) is the weight of the arc from ‘p’ to ‘t’.
(2) An enabled transition may or may not fire, depending on whether or not the event actually
takes place.
(3) The firing of an enabled transition t removes w(p, t) tokens from each input place ‘p’ of ‘t’,
and adds w(p, t) tokens to each output place ‘p’ of ‘t’, where w(p, t) is the weight of the arc
from ‘p’.
The above transition rule is illustrated in Figure 6.1a and Figure 6.1b using a simple example
which describes a call process from set up to finish through using one cell of Node B in
WCDMA system. The model of the call procedure with Petri Net is defined as follows:

115
Token: The black dot means the traffic channels in the single radio cell or each call of
users.
Place ‘Capacity’: There are 3 tokens inside the place, which means 3 available channels
in this radio cell now (initial marking).
Place ‘Usage’: There is an empty token, which means Zero channel is being used (initial
marking).
Place ‘Idle (User A)’: There is one token, which means User A is in idle status (initial
marking).
Place ‘Idle (User B)’: There is one token, which means User B is in idle status (initial
marking).
Place ‘Busy (User A)’: There is one token, which means User A is on-line for a call.
Place ‘Busy (User B)’: There is one token, which means User B is on-line for a call.
Transition ‘call’: It means the user makes a call.
Transition ‘handoff’: It means the user terminates a call.
Figure 6.1a shows that user A and B are in idle status, and there are three available channels in
radio cell. Figure 6.1b shows ‘User A’ makes a call to ‘User B’ so that the transition ‘Call’ is
fired. ‘User A’ and ‘User B’ are in busy status with one token in each place ‘busy’ for ‘User A’
and ‘User B’, respectively. Meanwhile, the cell capacity is reduced to 2 available traffic channels
while one change is in a used status. After the user completes the call, transition will ‘handoff’
fire. The status of user and radio cell will change back to the status in Figure 6.1a.

116
(a) A marked PN before firing. (b) A marked PN after firing transition ‘call’.
Figure 6.1 An example of the Petri Net model.
6.2.2 Colored Petri Net
A major weakness of basic Petri Nets discussed above is the complexity in writing up a PN
model. Petri-net-based models become too large for analysis even for a modest-size system
(Murata 1989, Zhang et al. 2000). Because of this, different modifications of PN high-level and
higher-order PN modelling have been attempted although with irregular results. Janneck and
Esser (2002) indicated that one key extension to the basic Petri Net is the High-level Petri Nets
such as colored Petri Net (Jensen 1992), which make the basic Petri Net more useful for practice.
Jensen (1992) extended PN into a colored, hierarchical, and temporized PN (CHTPN) network.
According to Jensen (1992), Colored Petri Net (CPN) is defined as a tuple
),,,,,,,,( IEGCNATPCPN ∑= , where ∑ is a finite set of non-empty types called color sets;
P is a finite set of places; T is a finite set of transitions; A is a finite set of arcs such that:
Φ=== ATAPTP III ; N is a node function defined from A into PTTP ×× U ; C is a
color function which is defined from P into ∑ ; G is a guard function which is defined from T
into expressions so that: ∀t∈T: [Type(G(t))={false, true}∧ Type (Var(G(t))) Σ⊆ ]; E is an arc
expression function which is defined from A into expressions so that: ∀ a ∈A: [Type(E(a)) =

117
C(p(a))MS ∧Type (Var(E(a))) Σ⊆ ], where p(a) is the place of N(a), MS denotes multi-set, and
Var denotes a set of variables; I is an initialization function defined from P into closed
expressions so that: ∀ p∈P: [Type(I(p))=C(p) MS]. For CHTPN, each page is a non-hierarchical
CPN, where S is used to denote the finite set of pages, so for each page s ∈ S and
),,,,,,,,( ssssssssss IEGCNATPCPN ∑= , where USs
s∈
∑=∑ , USs
sPP∈
= , USs
sTT∈
= , USs
sAA∈
= .
It should be noted that the color sets always have the common elements,
i.e., )()(:, pCpCPpSs ss =∈∀∈∀ , while the sets of net elements are disjointed, i.e.,
∩∪∪⇒≠∈∀ )(21[:2,1 111 sss ATPssSss ])( 222 φ=∪∪ sss ATP . A hierarchical CPN is
defined as a tuple ),,,,,,,,( PPFTFSPAPTPNSASNSHCPN = . Jensen (1992) proved that
given a HCPN, the equivalent non-hierarchical CPN could be derived.
The CPN Tool is a software program, developed by the University of Aarhus, Denmark, for
modeling, simulating and analyzing Colored Petri Nets. The CPN Tool can define the color sets
of Unit, Integers, Real, Boolean, String Enumerated Value etc. The CPN Tool also provides
three kinds of type constructors which can construct new and complex data type, namely product,
record, and list.
A CPN model can be created as a graphical drawing and Figure 6.2 contains a simple example of
the CPN model. This model is used to simulate a simple transport process. The left part models
the sender, the middle part models the network, and the right part models the receiver
(Kristensen et al. 1998). The CPN model shown in Figure 6.2 is composed of seven places
(drawn as ellipses or circles), five transitions (drawn as rectangular boxes), a number of directed
arcs connecting places and transitions, and some inscriptions next to the places, transitions, and
arcs.

118
Figure 6.2 A simple transport protocol (Kristensen et al. 1998).
The places are used to represent the state variables of the system. Each place contains a set of
markers called tokens. In contrast to Classic Petri Nets, each of these tokens carries a data value,
which belongs to a given type. These types are called the colour set of the place and written
below the place, e.g. the places ‘NextSend’, ‘C’ and ‘D’ have the colour set NO; the places ‘A’,
‘B’ and ‘Packets to send’ have the colour set NO × DATA. The inscription at the upper right
side of place ‘NextSend’ specifies that the initial marking of this place consists of one token with
the value 1. It indicates that data packet number 1 is the first data packet going to be sent.
The inscription at the upper left side of place ‘Packets To Send’:
1‘(1,"COL") ++
1‘(2,"OUR") ++
1‘(3,"ED ") ++
1‘(4,"PET") ++
1‘(5,"RI ") ++
1‘(6,"NET")
specifies that the initial marking of this place consists of six tokens with the data values:
(1,"COL"), (2,"OUR"), (3,"ED "), (4,"PET"), (5,"RI "), (6,"NET").

119
The transitions represent the events that can take place in the system. When a transition occurs, it
removes tokens from its input place and adds tokens to its output places. The same as the
ordinary Petri Net, one transition can only occur when all of its input places have at least one
token. The arcs describe how the state of the CPN changes when the transitions occur. These arc
expressions are written in the CPN ML programming language and are built from variables,
constants, operators, and functions.
6.3 CPN modeling of the example WCDMA system
From the inspiration of the work done by Zimmermann and Hommel (1999) and the FBS domain
model, a three layers CPN model of the WCDMA system is proposed, namely function, structure
and principle. Because the WCDMA wireless system is a complex system, there are many
standards and rules. In the following, the thesis study focuses on the voice service of the
WCDMA system and they are described as follows.
There are two additional components associated with the three layers as mentioned: (1) demand
generator which model the traffic load, call attempt behavior, the voice calls or VoIP calls by
using the Poisson process, and (2) threaten scenario which will simulate the disturbances to the
system such as failing some of the functional components and links at a given time and the
recovery of the failed components.
Figure 6.3 shows the architecture of the simulation engine with all major system components. In
this figure, the left column indicates the two inputs: demands and threaten. The middle column is
the CPN model of the telecommunication system. The right column is the outputs of the
simulation which include various service performances. On the right column, the decision
making is put in the context; in particular, decisions need to be taken in response to the provided
service, and the decisions are affecting the structure of the telecommunication system. In the
following, the detailed information of the three layers are discussed as shown in Figure 6.3.

120
Figure 6.3 Architecture of the simulation engine.
6.3.1 Modeling the function of the example WCDMA system
The function of the CPN model is depicted in Figure 6.4. It can express the whole working
process of the systematic functions layer based on the function knowledge base described in
Section 5.4. The structure of the function layer is composed of 8 sorts of places and 5 sorts of
transitions. The corresponding notations in the model are described in Table 6.2.

121
Table 6.2 Notations of the function model.
Place Description Transition Description
Demand(Voice) Voice data to be transmitted RA Radio signals access to system
RR Radio Resource CS Circuit Switch
VoCS Voice data in the Circuit Switch domain PS Packet Switch
VoIP Voice data in the Packet Switch domain, i.e. Internet TCS Data Transmit through CS
domain
Service Services provided from system TIP Data Transmit through PS
domain System
Capacity Data of system capacity
Connected call Data of connected calls Blocked call Data of blocked calls
The place ‘Demands (Voice)’ contains the information about the demand as one single token of a
color set. A list of color sets is defined as a different volume of traffic demands from different
groups of users. It is assumed that the voice service is the priority for the user in a disaster area
contrast to the data service.
The place ‘RR’ contains complete information about the resource of the radio frequency
bandwidth. The ‘RR’ means the maximum radio resource capacity i.e. the service to meet the
maximum amount of the users at some time intervals (e.g. one hour). The limited radio
bandwidth is a bottleneck problem which restricts the capacity of the radio access system.
The place ‘VoCS’ contains color set tokens which show the dedicated users using the circuit
channels for the voice traffic.
The place ‘VoIP’ contains color set tokens which show the dedicated users occupying
corresponding data bandwidth of the Internet.
The place ‘Services’ contains color set tokens which shows the amount of the users who can get
the services from either CS network or IP network.
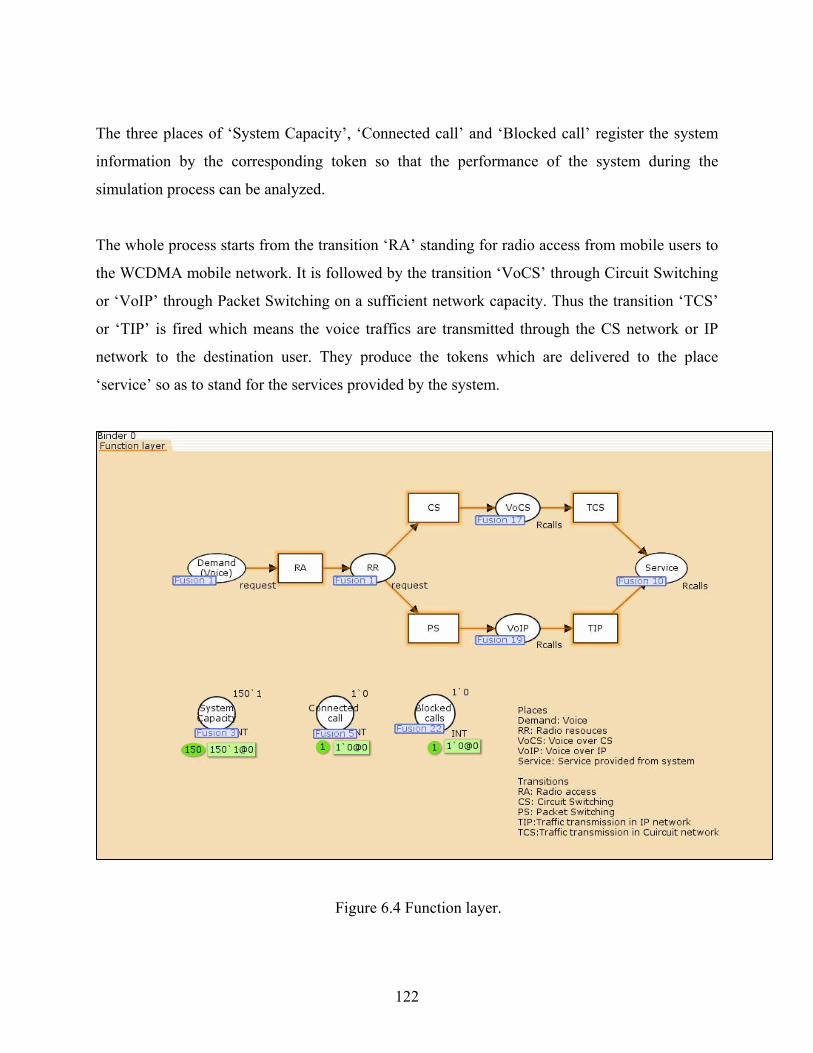
122
The three places of ‘System Capacity’, ‘Connected call’ and ‘Blocked call’ register the system
information by the corresponding token so that the performance of the system during the
simulation process can be analyzed.
The whole process starts from the transition ‘RA’ standing for radio access from mobile users to
the WCDMA mobile network. It is followed by the transition ‘VoCS’ through Circuit Switching
or ‘VoIP’ through Packet Switching on a sufficient network capacity. Thus the transition ‘TCS’
or ‘TIP’ is fired which means the voice traffics are transmitted through the CS network or IP
network to the destination user. They produce the tokens which are delivered to the place
‘service’ so as to stand for the services provided by the system.
Figure 6.4 Function layer.

123
6.3.2 Modeling the structure of the example WCDMA system
The structure layer of the CPN model is depicted in Figure 6.5. The CPN structure model of the
example WCDMA system is constructed based on the structure knowledge base described in
Section 5.4. Because the model follows the layout of the practical WCDMA network system, it
is not only understandable but can also be derived easily from a layout sketch of the wireless
mobile network. The functional components (e.g. Node B, RNC) of the WCDMA mobile
network structure are modeled with transition and the capacity of each component is described as
place. The tokens of each place stand for the traffic channels used by each user. The maximum
system capacity for the mobile user is considered in this thesis study, so that each user is
supposed to be allocated with one traffic channel for the voice service.
Figure 6.5 Structure layer.

124
The structure layer of the WCDMA system consists of 10 kinds of places and 11 kinds of
transitions. The corresponding notations are described in Table 6.3. The structure layer of the
CPN model describes the system structure and the state variables. Each of the transitions shows
the behavior of the system and each place shows the system state after the corresponding event is
fired.
Table 6.3 Notations of structure model.
Place Description Transition Description Senders (UEs)
Mobile users for demanding services UE Transmit voice signal
between users and network
Uu Radio signals governed by air Interfaces protocol RAB Establish Radio Access
Bearer B (1..3), RNC1, MGw
Working status of Node B, RNC1,MGw Node B (1...3) Transmit/receive radio
signal from/to mobile users
Iu-b (1…2) Formatted data governed by the Iu-b protocols RNC (1...2) Control radio access and
allocate radio resource
Iu-r Formatted data governed by the Iu-r protocols Mgw
Establish traffic bearer and allocate the resource in CS domain
Iu-CS Formatted data governed by the Iu-CS protocols
GPRS (SGSN/GGSN)
Establish traffic bearer and allocate the resource in PS domain
Iu-PS Formatted data governed by the Iu-PS protocols RCS Transmit and rout the data
through CS network
PSTN/PLMN External telecommunication network RIP
Transmit and rout the data through IP (internet) network
Internet External computer data network
Receivers The mobiles users being called
The structure comprises the components for traffic bear services in a tree root for the network
topology. The traditional real time voice traffic is transmitted through the circuit switching
network via the Node B, RNC, MGw under the control of the signaling nodes. The VoIP, Non-

125
real time voice, is transferred from UE through Node B, RNC, GRPS network, IP network to the
receivers.
Other components such as MSC server, HLR, EIR, and SS #7 for signaling control and database
management are not shown in the structure layer. Those components are highly reliable and
resilient under accidents. Therefore, these components are supposed to function even in the
emergency situations. Their functions are applied in the principle layer to control the network
components for data transmission (i.e. the components in the structure layer).
6.3.3 Modeling the principle of the example WCDMA system
After modeling the structure layer of the example WCDMA system, the principle to govern the
behavior of the system structure is modeled for the functional subsystems. The principle layer of
the CPN model is constructed based on the control mechanism of the example WCDMA system
described in Section 3.3.3 and the principle knowledge base described in Section 5.4,
respectively. Thus, the CPN principle layer is designed from two aspects: the Radio Resource
Control (RRC) and Switching and Routing Control.
(1) Modeling the principle of the CPN model based on RRC control rules
Based on the handover rule, when one of the Node Bi (i=1…3) is failed, the impacted call
services will be taken over by other available Node Bi. The handover principle to the example
WCDMA system is simply defined as follows.
If Node B1 fails, Node B2 takes over the service from Node B1.
If Node B2 fails, Node B3 takes over the service from Node B2.
If Node B1 and B2 fail, Node B3 takes over their services.
If Node B3 fails, Node B2 takes over the services from Node B3.
If RNC 1 fails, RNC 2 take over the service from RNC1.

126
Based on the PC, CAC and AMR rules, the maximum capacity and coverage of the Node Bs are
considered to support the continuous services in the event of system failure. As the coverage
range is also related with the capacity of the Cell of each Node B, coverage is simply considered
as part of the capacity of each Node B. It is estimated that each node can reach its potential
capacity to 30% after the disaster occurs. The control mechanism was designed in the principle
layer for radio access (see Figure 6.6). The capacity of a WCDMA network is defined as the
maximum number of simultaneous users for all services.
(2) Modeling the principle of the CPN model based on Switching and Routing function
Since the main function of the Core Network (CN) is for data switching and routing over the
Circuit Switch (CS) and Packet Switch (PS) network. It is assumed that the traffic capacity of
CN components is always sufficient before and after disasters. The switch function of CN
network as the routing table is simply defined as follows.
In normal operation of the example WCDMA system, the rules are generalized as follows:
RNC 1 route the real time voice traffic through MGw to Receivers
RNC 1 route the Non-real time traffic through GPRS to receivers
RNC 2 route the real time voice traffic through MGw to Receivers
RNC 2 route the Non-real time traffic through GPRS to receivers
In partial failures of the system, the rules are generalized as follows:
If MGw failure, RNC 1 route the real time voice traffic through GPRS to Receivers
If MGw failure, RNC 2 route the real time voice traffic through GPRS to Receivers
The failure of GPRS network is not considered, as the GPRS network is considered as a node of
Internet. Internet is a mesh network with highly redundant routing node such as routers, switch,
and bridges. Meanwhile, the IP backbone based PS network is the trend for the communication
network which is under the way to replace and cover an entire heterogeneous network including
the CS network. The state of the place ‘MGw’ in Figure 6.5 controls the handover function
above. The state of the places is the output from the threaten scenarios to the WCDMA system.

127
Figure 6.6 RRC principle layer.
6.3.4 Modeling the threaten of the example WCDMA system
The model of the threaten scenario was designed based on the impact of emergency to the
network components and the severity of impact to the service continuity when the relevant
components are damaged due to emergency or disasters.
The example threaten scenario is represented by the color set of token and corresponding places
in Figure 6.7. The occurrence of the node failure is simulated by a random time of Poisson
128
distribution. The failure of system components with low severity to services takes place most
frequently. The failure of the components with high severity to service takes the least time. The
failure of the medium severity takes place in frequency between the preceding two situations.
After the components are damaged, the network manager will take decisions to recover the failed
components. There can be more solutions to recover the failed components. For instance, new
equipment can be delivery to replace the failed ones; the recovery team can be sent to fix and
restore the failed equipments, emergency telecommunication vehicles can run to the site and take
over the function temporarily, or satellite communication can be deployed to solve the service
outage, etc. In this model, all the recovery actives are represented by the repair time.
Therefore, the failure frequency and recovery time are defined to different system components
based on their roles in the system as follows.
The system components, Node Bs, have low severity to services, highest failure frequency,
and shortest repair time. The failure frequency is defined to follow Poisson random process
with the expected number of occurrences with time unit 3.0 to 5.0. The time unit can be day,
hour, or seconds by the designers. The Mean Time to Repair (MTR) is relatively short and
the repaired mean time is defined with time unit 10.
The system components, RNCs, have middle severity to services, middle failure frequency,
and middle repair time. Thus the failure frequency is defined to follow Poisson random
process with the expected number of occurrences with time unit 4.0 to 6.0. The Mean Time
to Repair (MTR) is relatively longer than Node Bs, and the repaired mean time is defined
with time unit 20.
The system components, MGw and GPRS, have highest severity to services, least failure
frequency, and longest repair time. Thus the failure frequency is defined to follow Poisson
random process with the expected number of occurrences with time unit 6.0 to 8.0. The
Mean Time to Repair (MTR) is relatively longer than Node Bs and the repaired mean time
is defined with time unit 30.

129
Figure 6.7 Threaten scenario of the WCDMA system.
6.3.5 Modeling the demand of the example WCDMA system
The model of the demand was designed based on the service request from the mobile users. The
demands of call service follow the Poisson process. In Figure 6.8, the average service demands
of each radio cell and the maximum capacity of the each Node B are simply defined as follows:
The average service demands to the Node B1 are within 10 to 20 in the time unit; the
maximum capacity of the Node B1 is 30.

130
The average service demands to the Node B2 are within 10 to 20 in the time unit; the
maximum capacity of the Node B2 is 35.
The average service demands to the Node B3 are within 20 to 30 in the time unit; the
maximum capacity of the Node B3 is 40.
Figure 6.8 Demand generator.
6.4 The performance of the WCDMA PN model
The PN model of the WCDMA system can be coded into a simulation system for the dynamics
of the WCDMA system to analyze the system performance. There are several applications along
with the dynamic model simulation system. First, with the dynamic model, the emergency
manager can validate his or her particular decision through the simulation of the system behavior
when he or she has made a decision on the system. Second, the emergency manager can study
the system vulnerability through the demand generator and threaten generator engines to test the
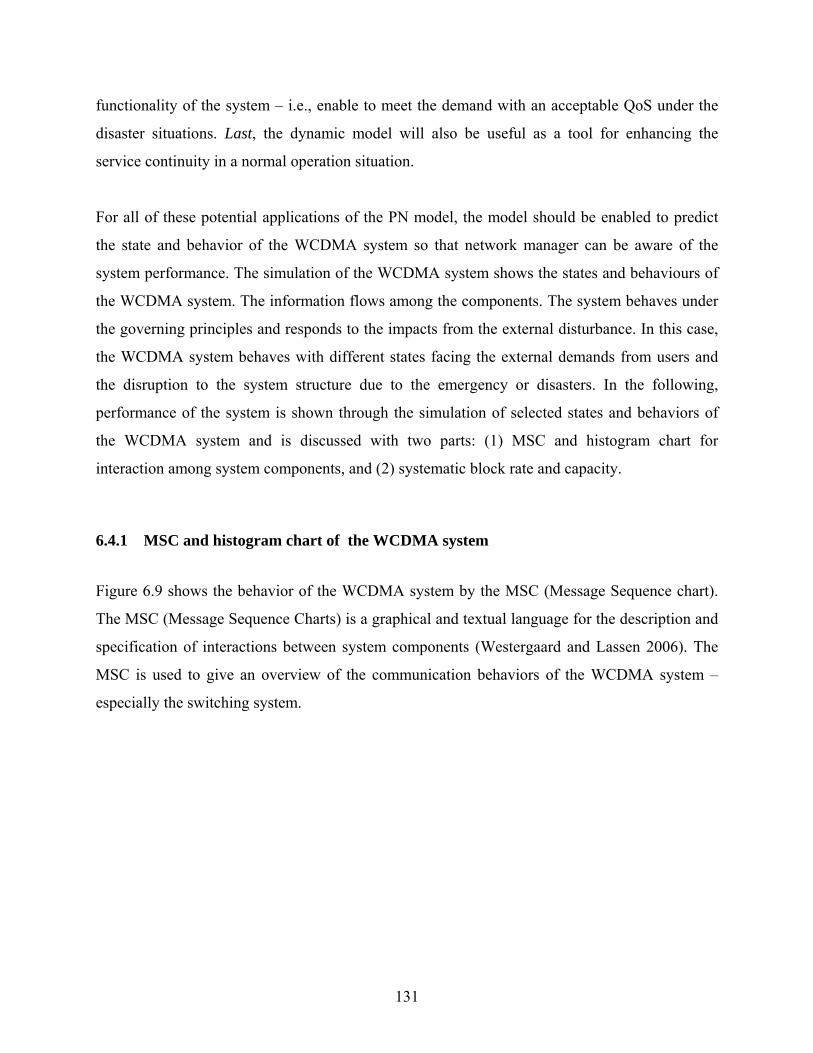
131
functionality of the system – i.e., enable to meet the demand with an acceptable QoS under the
disaster situations. Last, the dynamic model will also be useful as a tool for enhancing the
service continuity in a normal operation situation.
For all of these potential applications of the PN model, the model should be enabled to predict
the state and behavior of the WCDMA system so that network manager can be aware of the
system performance. The simulation of the WCDMA system shows the states and behaviours of
the WCDMA system. The information flows among the components. The system behaves under
the governing principles and responds to the impacts from the external disturbance. In this case,
the WCDMA system behaves with different states facing the external demands from users and
the disruption to the system structure due to the emergency or disasters. In the following,
performance of the system is shown through the simulation of selected states and behaviors of
the WCDMA system and is discussed with two parts: (1) MSC and histogram chart for
interaction among system components, and (2) systematic block rate and capacity.
6.4.1 MSC and histogram chart of the WCDMA system
Figure 6.9 shows the behavior of the WCDMA system by the MSC (Message Sequence chart).
The MSC (Message Sequence Charts) is a graphical and textual language for the description and
specification of interactions between system components (Westergaard and Lassen 2006). The
MSC is used to give an overview of the communication behaviors of the WCDMA system –
especially the switching system.

132
Figure 6.9 MSC and histogram chart.
The MSC chart in Figure 6.9 captures a scenario in which there are requests from users who
need the services of the WCDMA system. The WCDMA system supplies the service to meet the
demands. The information 1’(47,”Bw2”, “ RNC1 VoCS”) between the two functions “Request”
and” Service” shows that 47 users connect to the WCDMA system through Node B 2 radio
channel, Node B2 is under the control of RNC 1, and the traffic data are transported through the
circuit switch network backbone from the sender to the receivers. The function “Capacity” (47’1)
means that 47 traffic channels are assigned to the users. The system still has enough capacity
available so no any traffic is blocked. The vertical lines represent the life-lines of the processes
taking the four function parts in the scenario. As usual, time is assumed to flow downwards
along each life-line. The directed arrows going across the life-lines represent the causal link from
a send event (the source of the arrow) to the corresponding receive event (the target of the arrow)
with the label on the arrow denoting the message being transmitted.

133
The histogram chart (Westergaard and Lassen 2006) on the right side of Figure 6.9 shows the
system capacity states in a different time and under a different system structure failure. For
instance, at the time of 2.5 hours, the capacity of the system is 105. At the time of 7.5 hour, the
capacity of the system in the normal operation is 140, but the actually available capacity is 110,
because Node B2 failed (which causes the outage of 30 of the capacity). The damaged state of
Node B2 is shown on the bottom of the histogram chart as “B2- failure” (see Figure 6.9). The
corresponding states of the components can also be shown in the places in the threaten layer and
structure layer. In the structure layer, we can view the token in the Petri Net places ‘B (1..3)’,
place ‘RNC1’, and place ‘MGw’. The tokens fired into these places are from the places in the
layer of the threaten scenario such as place ‘B1 status’, ‘B2 status’, ‘RNC1 status’ (see the red
rectangle box shown in Figure 6.9).
The corresponding status of the reconfiguration is shown in the structure layer by the token flow.
For example, the tokens which indicate the voice traffic are transmitted through the Circuit
Switch network (see Figure 6.10a). The meanings of a part of tokens are shown as well (see
tokens highlighted with a red rectangle in Figure 6.10a). For example, the color token 1’(40, “B
w2”, “RNC1 VoCS” @11) means that at the time 11 hours from the beginning of system
operation, there are 40 users who have got the services from the system component Node B1. “B
w2” stands for Node B2 working, “RNC1 VoCS” means that “RNC1” and “MGw” are available
for the CS function. To provide these functions, the corresponding components are Node B2,
Node B1, RNC1 and MGw.
Suppose that at the time 25 hour, the component Media Gateway (MGw) failed. The tokens
which indicate the voice traffic are thus transmitted through the Packet Switch network (see
Figure 6.10b). The meanings of the relevant tokens are shown as well (see tokens highlighted
with a red rectangle in Figure 6.10b). For example, the color token 1’”Mgw down” means that
the component “Media Gateway” was outage. The color token 1’(67, “B w3”, “RNC2 VoCS to
VoIP” @25) means that at the time of 25 hours from the beginning of system operation, there are
67 users who get the services from the system component Node B3. “B w3” stands for Node B3
working, “RNC2 VoCS to VoIP” means that RNC2 is working and voice traffics are transferred

134
through the Packet Switch (PS) network and Internet. The component “GPRS” which provides a
packet switching function takes over the backbone role in replace of the damaged component
“MGw”. To provide the PS function, the involved components are Node B3, RNC2, and GPRS.
(a) Voice over CS (VoCS).
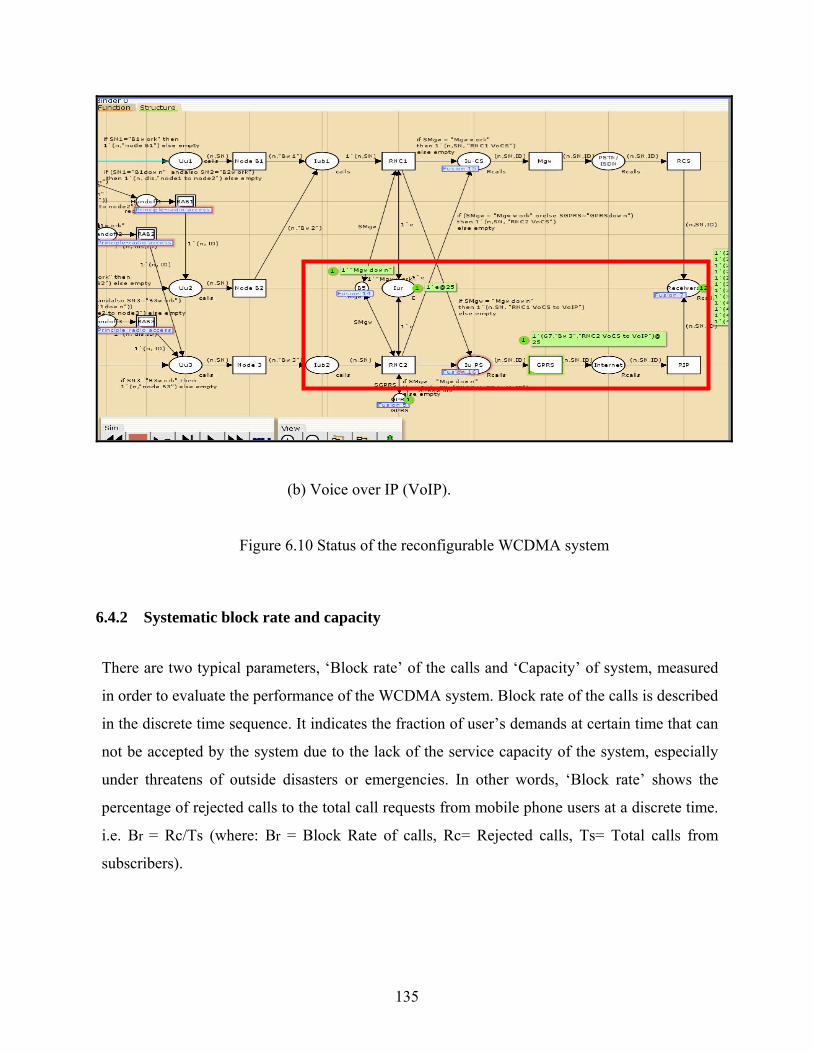
135
(b) Voice over IP (VoIP).
Figure 6.10 Status of the reconfigurable WCDMA system
6.4.2 Systematic block rate and capacity
There are two typical parameters, ‘Block rate’ of the calls and ‘Capacity’ of system, measured
in order to evaluate the performance of the WCDMA system. Block rate of the calls is described
in the discrete time sequence. It indicates the fraction of user’s demands at certain time that can
not be accepted by the system due to the lack of the service capacity of the system, especially
under threatens of outside disasters or emergencies. In other words, ‘Block rate’ shows the
percentage of rejected calls to the total call requests from mobile phone users at a discrete time.
i.e. Br = Rc/Ts (where: Br = Block Rate of calls, Rc= Rejected calls, Ts= Total calls from
subscribers).
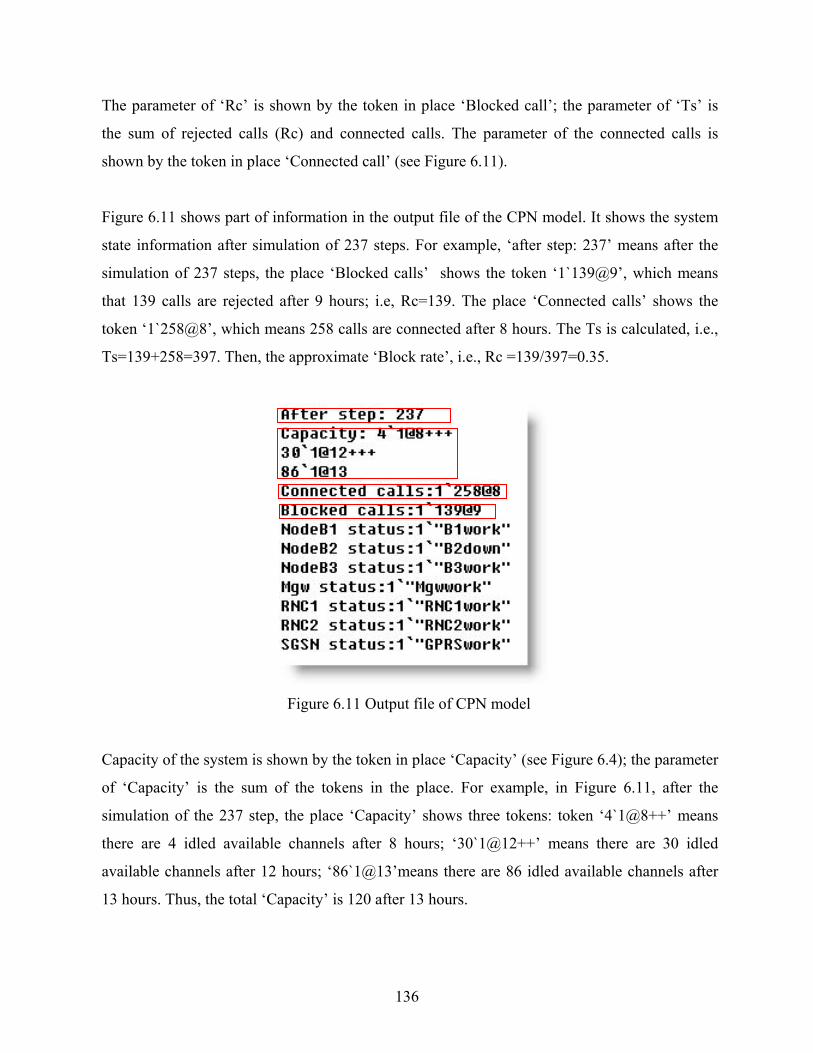
136
The parameter of ‘Rc’ is shown by the token in place ‘Blocked call’; the parameter of ‘Ts’ is
the sum of rejected calls (Rc) and connected calls. The parameter of the connected calls is
shown by the token in place ‘Connected call’ (see Figure 6.11).
Figure 6.11 shows part of information in the output file of the CPN model. It shows the system
state information after simulation of 237 steps. For example, ‘after step: 237’ means after the
simulation of 237 steps, the place ‘Blocked calls’ shows the token ‘1`139@9’, which means
that 139 calls are rejected after 9 hours; i.e, Rc=139. The place ‘Connected calls’ shows the
token ‘1`258@8’, which means 258 calls are connected after 8 hours. The Ts is calculated, i.e.,
Ts=139+258=397. Then, the approximate ‘Block rate’, i.e., Rc =139/397=0.35.
Figure 6.11 Output file of CPN model
Capacity of the system is shown by the token in place ‘Capacity’ (see Figure 6.4); the parameter
of ‘Capacity’ is the sum of the tokens in the place. For example, in Figure 6.11, after the
simulation of the 237 step, the place ‘Capacity’ shows three tokens: token ‘4`1@8++’ means
there are 4 idled available channels after 8 hours; ‘30`1@12++’ means there are 30 idled
available channels after 12 hours; ‘86`1@13’means there are 86 idled available channels after
13 hours. Thus, the total ‘Capacity’ is 120 after 13 hours.

137
Figure 6.12a shows a snapshot of the ‘Blocked rate’ and ‘Capacity’ from the beginning of the
operation up to100 hours based on the output file from CPN dynamic model. The block rate to
the user’s demands is Zero at the beginning of the system operation. It means the WCDMA
system is in a normal operation state, which can provide necessary services to all users. At the
time (17 hrs), there is the peak block rate that shows the system can not provide enough services
to the user and the system performance severely degraded. Figure 6.12b also shows the system
capacity change following the state change in a different time when the structure of the system
is changed due to the impacts from external factors.
(a) Block rate of WCDMA system. (b) Capacity of WCDMA system.
Figure 6.12 Statistic of Systematic block rate and capacity.
6.5 Related work
There are other works in which the Petri Net are used in the telecommunication system. In
general, these works only examine system dynamics partially or in one angle of view. For
System Performance
0
0.1
0.2
0.3
0.4
0.5
0.6
0.7
0.8
0.9
1
0 20 40 60 80 100
Time (hrs)
Blo
ck R
ate
System Performance
0
20
40
60
80
100
120
140
160
0 20 40 60 80 100
Time (hrs)
Capacity
(Users/hur)

138
instance, Kurt et al. (2007) only applied Colored Petri Net to model a data transmission protocol
of the telecommunication system to verify the reliability of the system. Klaric et al. (2001) only
applied Petri Net in the ISDN to model call set up and the charging process. Boubour et al.
(1997) limited to examine the faults detection and alarm observation. Bruno et al. (1994)
proposed to apply Hierarchy Petri Net in develop the telecommunication software to supervise a
railway network; the essence of the approach is still limited to examining the reliability of the
protocol and rule to control the railway system. There are few works to study an entire
telecommunication system; there are few works to examine the survivability of the
telecommunication system.
There are works in which the Hierarchy Petri Net are used to study the dynamics of the
manufacturing system. For instance, Bruno et al. (1994) proposed to apply Hierarchy Petri Net in
develop the telecommunication software to supervise a railway network. Each individual
hierarchy layer models the different functions (i.e., ground processor function, and radio
processor). The two functions are modeled in different layers, and they interact with each other.
The Hierarchy Petri Net Model presents a relationship among different functions, but it does not
represent an entire system in terms of the function, structure, and principle. Zimmermann and
Hommel (1999) applied Hierarchy Petri Net to model a complex manufacturing system. The
manufacture system is modeled by the hierarchical structure, process, behavior, and work plan
(states) separately. The work of Zimmermann and Hommel (1999) seems better to represent a
system; but we argue that their model still lacks an explicit system design concept and lacks a
concrete methodology to make the system design method more practical. Their approach may be
limited only to their specific work domain (i.e., manufacture system).
Our proposed FCBPSS framework based PN approach provides a complete view of system
dynamics as it brings the constituent elements (structure, behavior, principle) together under one
framework. The approach may not only be useful to telecommunication systems but also to other
critical infrastructure system such as physical facilities, electric power generation, transportation,
and water supplier system.

139
6.6 Conclusion with discussion
This chapter presents a dynamic model of the example WCDMA system. Since the example
WCDMA system is a typical system that has the major features of the WCDMA system, the
modeling approach presented in this paper can be applied to other telecommunication systems
and other complex dynamic systems as well. The proposed modeling approach has the following
unique features: (1) Hierarchy CPN modeling structure (2) Integration of CPN tool with the FBS
framework. With these two features, the bottle-neck problem with a PN model, for whatever
types of Petri Nets, can be further tackled; in other words, the complexity of a PN model can be
reduced with the FBS-PN approach. This benefit is extremely significant to modeling complex
dynamic systems with PN and making the PN model more practical for large systems.
In conclusion, integration of the FBS and PN in structuring the PN model into three layers,
namely the function layer, structure layer, and principle layer, is naturally representing the
dynamics of a complex system. Such a division allows for the implementation of a paradigm
called total system modeling. The proposed modeling approach demonstrates a highly promising
way to model the complex dynamics of a service system aiming to be further used in the control
and management system for the complex service systems.

140
Chapter 7
Decision making support system
7.1 Introduction
In this chapter, it will be discussed how the models and systems that were described in the
preceding chapters can be integrated into a high level system that can be useful for the
managerial team or manager in emergency situations. Such a system is called Decision Making
Support System (DMSS). The architecture of such a system will be developed. With this in the
mind, the remainder of this chapter is organized as follows. In Section 7.2, the concept of DMSS
and its system architecture is presented. Section 7.3 shows detailed information of the system
components. Section 7.4 shows the operation of DMSS through an example. Section 7.5 is a
conclusion with discussion.
7.2 Architecture of Decision Making Support System (DMSS)
DMSS assumes that the emergency manager should not be required to know the Petri Net model;
instead they should focus on the semantics of the system and making decisions which are
expressed in a meaningful way to the manager. In particular, the DMSS should be able to
provide the manager with the following pieces of information: (1) a summary of system
behaviors and performances, (2) a throughput of the traffic passing through the switch node, and
(3) reconfigured alterative routes to cope with faults which cause damages of the system. Further,
the DMSS should provide an interface for the manager to cast his or her decision into the system.
To meet the above requirement, the architecture of the DMSS is proposed as shown in Figure 7.1.
In this figure, there are four modules: WCDMA domain model (Chapter 4) with which a
particular WCDMA system is rooted, WCDMA PN model (Chapter 6) which represents the

141
dynamics of a particular WCDMA system, and WCDMA reconfiguration knowledge base which
supports system reconfiguration (Chapter 5). There are two kinds of humans involved in DMSS:
emergency manager and system designer. The system has three interfaces covering human-
human interface, human-computer interface, and computer-computer interface. The
reconfiguration knowledge base system is also called Human Assistance System (HAS) which
can be viewed as a machine decision maker; yet it is only an “assistant” to the manager. More
generally, the HAS and human manager work together to manage emergency situations. This
thesis study focused on Interface 1, Interface 2, and Interface 3 (partial) only.
7.3 Interface Module Development
7.3.1 Interface 1
Interface 1 is a graphic user interface (GUI) for constructing a CPN model of a dynamic system,
and it was developed using CPN Tools version 2.2.0 (Copyright © 1999-2004 CPN Group,
University of Aarhus). Figure 7.2 shows a screenshot of CPN Tools (Kurt et al. 2005). The
rectangular area on the left is the index window. It includes the Tool box for a CPN model.
Additionally, it contains tools for manipulating the graphical layout and the appearance of the
CPN model. The index window also contains tool for model which shows a variety of
WCDMA PN model WCDMA domain model
WCDMA reconfiguration knowledge system (G-S model)
System designer and analyst Emergency manager
Interface 1 Interface 2
Interface 3
Interface 4
HAS
Human-computer interface
Human-human interface
Computer-computer interface
HAS: human assistance system
Figure 7.1 A framework of the DMSS system
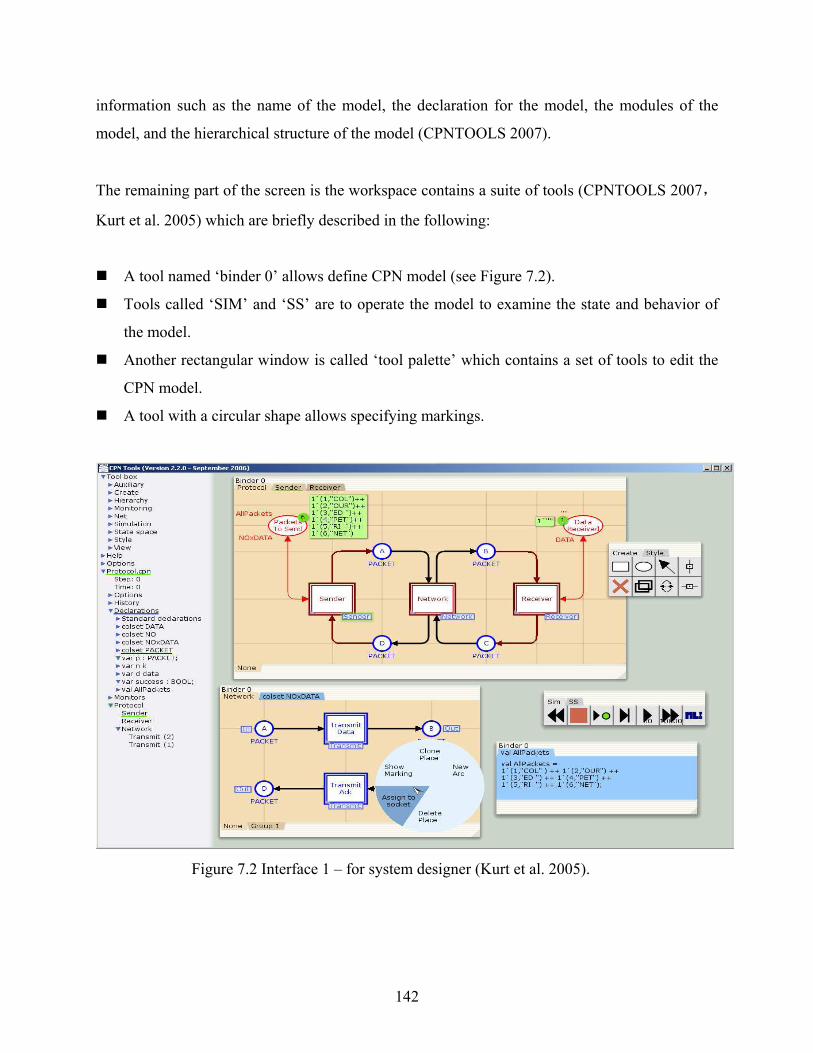
142
information such as the name of the model, the declaration for the model, the modules of the
model, and the hierarchical structure of the model (CPNTOOLS 2007).
The remaining part of the screen is the workspace contains a suite of tools (CPNTOOLS 2007,
Kurt et al. 2005) which are briefly described in the following:
A tool named ‘binder 0’ allows define CPN model (see Figure 7.2).
Tools called ‘SIM’ and ‘SS’ are to operate the model to examine the state and behavior of
the model.
Another rectangular window is called ‘tool palette’ which contains a set of tools to edit the
CPN model.
A tool with a circular shape allows specifying markings.
Figure 7.2 Interface 1 – for system designer (Kurt et al. 2005).

143
The state and behavior of a CPN model are further examined by a program called ‘BRITNeY
Suite’. BRITNeY Suite provides access to the data structures and a simulator for Colored Petri
Nets via a powerful scripting language and plug-in-mechanism, thus making it easy to perform
customized simulations and visualizations of CPN model (Westergaard n.d. ).
Figure 7.3 shows the relationship between the BRITNeY suite with CPN Tools (Westergaard
and Lassen 2006). CPN Tool is split into two components, an editor and a simulator. The
BRITNeY suite animation tool, in the right part of the figure, communicates with CPN Tools
using a standard remote procedure call protocol, called XML-RPC, in order to allow vendors of
other tools to directly integrate their tools with BRITNeY suite. BRITNeY suite uses plug-ins to
make the actual visualizations and animations. BRITNeY animation tool works together with
CPN Tools to make different views on the CPN model. Examples of such views are Message
Sequence Charts (MSC), gantt charts, or SceneBeans animations; all of them show the state of
the system.
Figure 7.3 Integration of the animation tool with CPN Tools (Westergaard and Lassen 2006).
In the following, a simple example is used to show how the animation tools work with the CPN
model (Westergaard and Lassen 2006, Westergaard 2006) in Figure 7.4a and Figure 7.4b,
respectively.

144
The CPN model of Figure 7.4a describes that two runners are competing to win a race. It
captures the behavior of the two runners modeled by tokens runner (1) and runner (2). Initially
the runners are at the start of the race, and they can then continue to the end of the race. During
the race, the runners pass a drink stand. When the first runner passes the finish-line, he is
declared the winner of the race, and a flag is lowered to celebrate. When the other runner crosses
the finish-line, he is declared the loser of the race. Figure 7.4b present the execution of the CPN
(a) A CPN example model of runners (Westergaard and Lassen 2006).
(b) MSC model (Westergaard and Lassen 2006)
Figure 7.4 An example of CPN model.

145
model and shows the behavior of the two simulated runners using Message Sequence Charts
(MSC).
7.3.2 Interface 2
Interface 2 (i.e., the interface between the manager and the domain model as well as the
knowledge based system) was implemented with visual basic languages. The design of interface
2 followed the FBS interface design framework (Lin and Zhang 2004, Lin et al. 2006).
According to the FBS methodology, the first step is to develop a domain model, the WCDMA
domain model in this thesis study case; the WCDMA domain model (see Chapter 4) serves for
the purpose. The second step is to develop a task model which describes what the operator is
supposed to do; the emergency manager is the operator in this case. In the emergency
management practice, the task of the manager is of cognitive kind- i.e., making decisions
according to the actual performance of the system (e.g., WCDMA) in emergency with faults or
damages. The task in the physical sense is that the emergency manager communicates with
various bodies of emergency management personnel to implement the (cognitive) decision made
by the manager, which will then take effect on the real system. The interface, particularly display
interface in this case, should have the attributes to allow facilitating the communication of the
manager with various personnel. Quite obviously, the state of the system in emergency situations
needs to be provided on the interface.
Figure 7.5 is an example interface for the WCDMA system. This interface has three parts: left,
middle and right. The left part provides the information about (1) what part of the WCDMA
system is currently being investigated, (2) what system function is being examined (e.g. capacity,
connected calls, etc.), and (3) the point of the time that the current state of the system in
emergency is being examined. The middle part shows the system state and performance which
are primary sources for the manager to evaluate the situation, which can further lead to his or her
decision. On the right part of the interface, there are control commands for the manager to use to
cast his or her decision. One of them is the recovery solution command which will allow the
manager to put his or her decision on to the system. It is noted that the manager’s decision may

146
not be directly and automatically taking effect on the physical system. The decision may need to
be reviewed by another person or so on; however, this is not a part of scope of this thesis study.
A further detailed explanation of this display will be provided in Section 7.3.4. The Visual Baisc
(VB) code of implementing this interface can be found in Appendix B.
7.3.3 Interface 3
Interface 3 lies in between the WCDMA model and its CPN model, and it has two models: ‘PN
to FBS’ (the semantics transfer from a PN model to a FBS model) and ‘FBS to PN’ (the
semantics transfer from a FBS model to a PN model). This thesis study has done a preliminary
implementation of the ‘PN to FBS’ model. The general idea in the implementation of the ‘PN to
Figure 7.5 Interface 2 – for emergency manager

147
FBS’ module is to develop a computer program to interpret the output of a CPN model which
includes the states and their changes into the semantics expression of the WCDMA system
which can be meaningful to the network managers (see Figure 7.6).
7.4 Operation of DMSS
Firstly, revisit the Figure 7.5. In this figure, the window of ‘System Performance’ indicates the
capacity and block rate of the WCDMA system in certain times. The window of ‘system status’
indicates the status of the each component in certain times. It shows the states of the components,
their normal or failed status, and the impact to the system capacity. The window of ‘Simulation
engine state’ shows the performances of the underlying system. The window of ‘Recovery
Solutions’ shows the specific information of the damaged components as well as the proposed
solutions to recover their function.
For instance, in Figure 7.5, the information in the window ‘System performance’ shows that the
performance state of the WCDMA system after working 17 hours. At that time, the system has
CPN model (output file)
Figure 7.6 Interface 3- CPN to FBS model
FBS model (interpreted file)
148
the capacity to service 30 more Mobile users. The extra user will not get the service due to the
current system capacity. In addition, the windows also shows that system has provided services
to total 388 demands from users within the past 17 hours, while the 262 demands for service
from the users are rejected when the demand is more than the service provision from the
WCDMA system.
Further, the information in the window ‘System Status’ shows that the state of each system
components after 17 hours. The window shows that a disaster occurring after 17 hours. It leads
to the damage of Radio Base Station No.1 and Radio Base Station No.2. Thus, they lost the
service to about 250 users within its radio coverage area. Only Radio Base No.3 is still working
and keeps providing services in its service area. The other components such as Radio Network
controller No.1 and No.2, Media Gateway GPRS are still available to provide the Circuit Switch
and Packet S witch functions. The information in the window ‘Recovery solution’ shows the
proposed solutions to recovery the system function or to re-arranges the victims in the disaster
area. In this window, it provides the information of the damaged component and their location,
design parameters. Then it provides a recovery solution such as increasing the transmission
power of Node B No.3, or delivering emergency telecommunication vehicles to the damaged site,
or asking the evacuated crowd to move to the service area of Node B No.3.
7.5 Conclusion with discussion
This chapter described a decision making system for emergency management. The system
integrates the domain model, reconfiguration and dynamic model of the WCDMA system. The
implementation of the system was preliminary at this point of time. Based on the concept
formulation and the preliminary implementation it can be concluded that (1) emergency
managers only needs to focus on the semantics of the WCDMA system; they do not model the
dynamics of the WCDMA system, (2) the transfer of information from the PN model to the FBS
model of the WCDMA system is possible, and (3) a simulation-based emergency management
can help the manager know about the information in a rapid time.

149
Chapter 8
Conclusion
8.1 Overview of the Thesis
This thesis study concerns the survivability or resilience of a complex service provider system. A
preliminary literature analysis began with this study. This analysis has led to the goal of the
thesis – i.e.; to develop a general methodology for managing the telecommunication system to
achieve a high survivability. The wireless telecommunication system, 3G WCDMA (UMTS)
system, was taken as an example system to ground this research for the purpose of illustration
and validation of the proposed methodology. To achieve this goal, the following specific
objectives were proposed:
Objective 1: Develop a general domain model for the wireless telecommunication system which
captures the service demand, function requirement, operation constraint, structure, and behavior.
Objective 2: Develop an effective system reconfiguration model for the wireless system to
achieve high survivability or service continuity in emergency situations.
Objective 3: Develop a dynamic model of the WCDMA (UMTS) system which can be used for
verification of the management decisions.
Objective 4: Develop a human-in-the loop decision making framework for emergency
management in emergency situations.
These objectives have been achieved. In particular, it begins with the discussion of some basic
concepts in Chapter 2 that underlie the entire work, such as the definition of survivability, and
emergency management. The domain modeling tool called FBS framework is introduced to

150
support one of the basic ideas in conducting this thesis work - i.e., ontology based management
system. Here, the purpose of domain modeling is to capture the ontology of a system in interest.
An example system called WCDMA system is presented to ground the research. The intention of
this thesis study was to make use of the example WCDMA system to illustrate and validate the
ideas. To follow the ontology-based system, a domain model of the WCDMA system is
developed by using the FBS framework in Chapter 4.
Subsequently, in Chapter 5, a new configuration approach is developed, which is based on the
General function and Specific function (G-S) concept. The G-S concept was proposed by Pahl
and Beitz in 1996 in engineering design, which is a methodology to represent the function of a
complex dynamic system. In the development of this approach, especially to the survivability of
a system, the idea of ontology-based system is further demonstrated in the sense that the
relationship between the domain model and the system reconfiguration method are exhibited.
In Chapter 6, it began with the development of a dynamic model of the WCDMA system. Petri
Net theory was employed for this purpose. A Petri Net dynamic model was successfully built for
the WCDMA system, and the simulation of the dynamic behaviors of the WCDMA system was
demonstrated. The use of this simulation system in the areas of vulnerability analysis and
decision making for emergency management were explored.
In Chapter 7, decision making support system was further detailed based on the Petri Net model
and simulation engine by preliminarily implementing a computer-based emergency management
system. This system was based on the integration of several models and systems that were
described in the preceding Chapters, in particular the domain model, dynamic model,
reconfiguration system and human decision maker. The implementation of several interfaces
among these models and systems (including human decision makers) was demonstrated, such as
the interface between the emergency management and simulation system, the interface between
the Petri Net model and domain model of the WCDMA system (from the former to latter).
The following major conclusions can be drawn from this thesis study:

151
The telecommunication system is a complex service provider system. The work domain
model approach to cope with this complexity is necessary. In the presence of the domain
model in an emergency management system, the decisions can be made on the system
structure and resource level and can be further made effect to the system behavior and
performance level.
The survivability of a service provider system always depends on the contexts. The current
emergency management method in telecommunication industry normally treats the damaged
system as a static and fixed network configuration. As such, the traditional recovery
solutions are normally limited to the use of backup resources, spare parts of the vulnerable
components, or the repair of the failure parts, or asking for help from others. The new
approach proposed in this thesis opens an avenue to increase the degree of the survivability
of a complex dynamic system such as the WCDMA system by exploring the structure of the
complex service provider system, including both its damaged components and left
undamaged components, for a solution to recover the lost function through the
reconfiguration of all components including damaged ones.
Telecommunication system management is a very important function in each system.
Normally, the management system is called as Operation and Management system (O&M).
At present, the O&M operation systems are proprietary, a situation that may hinder an
effective management of emergency for high survivability, because in reality it is highly
demand on an integrated approach to such management. The approach developed in this
thesis study appears to provide an integrated solution to management, as the entire system is
highly modularized with focuses on the construction of interface among them including
human-computer interface.
8.2 Major contributions
The main contributions of the thesis are described as follows:

152
This study develops a new approach for emergency management, which is adaptable to all
service systems. The study has realized the similar function as the work of the Bell Lab
(Houck et al. 2003) to analyze the survivability of the telecommunication in disaster or
emergency situations; however, the approach developed from this thesis study is much more
general than that of Bell Lab.
This study provides a new methodology for system reconfiguration which is more
sophisticated than the existing approaches based on the concept of function redundancy and
sharing. In the case of the WCDMA wireless cellular system, the methodology provides a
cost effective and quick response solution to enhance a service system on the condition
when the system is partly damaged due to the natural disasters or incidents. Furthermore,
this new methodology implies a new paradigm for emergency management, that is, the first
priority of emergency management is to turn attention to the system itself. This new
paradigm will provide the most rapid response to emergency.
This study provides a new Petri Net approach to model complex dynamic system based on
the idea of integrating Petri Net theory and FBS framework. This approach provides a
complete view of system dynamics as it brings the constituent element (structure, behavior,
principle) together under one framework. In comparison, the contemporary approach only
examines system dynamics partially or in one angle of view. For instance, Kurt et al. (2007)
only applied Coloured Petri Net to model a data transmission protocol of the
telecommunication system. Klaric et al. (2001) only applied Petri Net in the ISDN to model
call set up and the charging process. Boubour et al. (1997) limited to examine the faults
detection and alarm observation.
8.3 Limitations and future Work
8.3.1 Limitation
The major limitation with this research is that it addresses only one type of service system,

153
namely the 3G WCDMA wireless cellular system only. WCDMA is a wideband spread-spectrum
mobile air interface that utilizes the direct sequence CDMA techniques to achieve higher speeds
and support more users. The extension of this research beyond WCDMA to other wireless
cellular system such as CDMA2000, GSM or PCS can not be directly established, because of
different network air interface technologies used in these systems. Another limitation to this
research is that it focuses on the general network architecture. However, the nature of this
research would refine the network elements on some detailed levels.
8.3.2 Future work
The first future work concerns a practical implementation by users (e.g., Sasktel) to evaluate the
feasibility of the developed model. Meanwhile, the company can also obtain a better support to
this study and improve their service in terms of system survivability in emergency situation as
well as service continuity optimization in normal situations.
The second future work is to develop a model transfer from the FBS to PN of the underlying
system. This study supposed that the information communication between the network manager
and system designer is transparent and always established. The communication methods can be
in manual ways such as oral, fax, or automation by software agents. Software agents can be
designed in the future to automate communication between network manager interface and
designer interface.
The third future work concerns the study of vulnerability of the service system in facing
attackers. An extended study is to exploit the way to enhance the resilience of various service
system in any threaten from outside environments. The interdependency of various service
infrastructures with the telecommunication system in disaster or emergency situations can be
further analyzed.
The fourth future work concerns the security of the telecommunication system. In the disaster
and emergency situations, the damaged system is vulnerable facing the attackers. Unauthorized

154
users may gain access to agency systems and information, corrupt the agency’s data, consume
network bandwidth, and degrade network performance. Sensitive data may be lost due to the
damaged components as well.

155
LIST OF REFERENCES
3GPP TR 25.931. (2004). Technical specification version 6.0.0 release 6, universal mobile
telecommunications system (UMTS); UTRAN functions, examples on signalling procedures.
3GPP TS 23.002. (2003). Technical specification group services and systems aspects; network
architecture (release 5).
Baker, M. C., Witschorik, C. A., Tuch, J. C., Hagey-Espie, W., and Mendiratta, V. B. (2004).
Architectures and disaster recovery strategies for survivable telecommunications services. Bell
Labs Technical Journal, Vol. 9(2), pp: 125-145.
Baliga, G., Graham, S., Sha, L., and Kumar, P. (2004). Service continuity in networked control
using etherware. IEEE Distributed Systems Online, Vol. 5(9), pp: 1 – 15.
Barker, L., and Maxwell, S. (1995). Telecommunications resource management for disaster
response and recovery. IEEE Military Communications Conference, MILCOM '95, Conference
Record, Vol. 2(3), pp: 853 – 857.
Bhagyavati. (2001). Automated fault management in wireless and mobile networks. Ph.D.
University of Louisiana, Lafayette, California.
Billinton, R., and Allan, R. N. (1983). Reliability evaluation of engineering systems: Concepts
and techniques. New York: Plenum Press.
Boubour, R., Jard, C., Aghasaryan, A., Fabre, E., and Benveniste, A. (1997). A petri net
approach to fault detection and diagnosis in distributed systems. I. application to
telecommunication networks, motivations, and modelling. Proceedings of the 36th IEEE
Conference on Decision and Control, Vol. 1, pp: 720 – 725.

156
Chu, K., and Lin, F. Y. (2006). Survivability and performance optimization of mobile wireless
communication networks in the event of base station failure. Computers and Electrical
Engineering, Vol. 32(1), pp: 50-64.
Circuit switching. (2008). Wikipedia, the free encyclopedia. Retrieved 03/08, 2008, from
http://en.wikipedia.org/wiki/Circuit_switching.
CPNTOOLS. (2007). Computer tool for coloured petri nets. Retrieved 09/18, 2007, from
http://wiki.daimi.au.dk/cpntools/cpntools.wiki.
Cuny, R., and Lakaniemi, A. (2003). VoIP in 3G networks: An end-to-end quality of service
analysis. The 57th IEEE Semiannual on Vehicular Technology Conference, VTC 2003-Spring.,
Vol. 2, pp:930 – 934.
De Kleer, J. (1984). How circuits work. Artificial Intelligence, Vol. 24, pp: 205-280.
Digital AMPS. (2008). Wikipedia, the free encyclopedia. Retrieved 03/08, 2008, from
http://en.wikipedia.org/wiki/Digital_AMPS.
Disaster. (2007). Wikipedia, the free encyclopedia . Retrieved 08/01, 2007, from
http://en.wikipedia.org/wiki/Disaster.
Emergency. (2007). Wikipedia, the free encyclopedia. Retrieved 08/01, 2007, from
http://en.wikipedia.org/wiki/Emergency.
Eriksson, G. A. P., Olin, B., Svanbro, K., and Turina, D. (2000). Challenges of voice over IP
over wireless. ERICSSON REV (ENGL ED), Vol. 77(1), pp: 20-31.
Ezell, B. C. (2005). Quantifying vulnerability to critical infrastructure. Ph.D, Old Dominion
University, Norfolk, Virginia.

157
Ezell, B. C., Farr, J. V., and Wiese, I. (2000). Infrastructure risk analysis model. Journal of
Infrastructure Systems, Vol. 6(3), pp: 114-117.
Fales, R., Spencer, E., Student, G., Chipperfield, K., Wagner, F., and Kelkar, A. (2005).
Modeling and control of a wheel loader with a human-in-the-loop assessment using virtual
reality. ASME Journal of Dynamic Systems, Measurement, and Control, Vol. 127(3), pp: 415-
423.
Freeman, R. L. (2004). Telecommunication system engineering (4th ed.). Hoboken, N.J: Wiley-
Interscience.
García, A. B., Alvarez-Campana, M., Vázquez, E., and Berrocal, J. (2002). Quality of service
support in the UMTS terrestrial radio access network. Proceedings of the 9th HP Openview
University Association Workshop (HPOVUA 2002), pp: 11-13.
Gero, J. S., and Kannengiesser, U. (2003). A Function–Behaviour–Structure view of social
situated design agents. Retrieved 7/25, 2007, from
http://web.arch.usyd.edu.au/~john/publications/2003/03oGeroKannengoCAADRIA03.pdf.
Glitho, R., and Hayes, S. (1995). Telecommunications management network: Vision vs. reality.
Communications Magazine, IEEE, Volume 33, Issue 3, March, Page(s):47 – 52.
GSM. (2008). Wikipedia, the free encyclopedia. Retrieved 03/12, 2008, from
http://en.wikipedia.org/wiki/GSM.
Harrop, M. (2002). Creating trust in critical network infrastructures: Canadian case study. ITU
Workshop on Creating Trust in Critical Network Infrastructures, pp: 1-51.
Harte, L., Hoening, M., Mclaughlin, D., and Kikta, R.(1999). CDMA IS-95 for cellular and PCS.
New York: McGraw-Hill.

158
He, Q. (2007). Analysing the characteristics of VoIP traffic. M.Sc. University of Saskatchewan,
Saskatoon, Saskatchewan.
Hernandez-Valencia, E., and Chuah, M. (2000). Transport delays for UMTS VoIP. 2000 IEEE
Wireless Communications and Networking Conference, 2000. WCNC., Vol. 3, pp: 1552 – 1556.
Holma, H., and Toskala, A. (2002). WCDMA for UMTSradio access for third generation mobile
communications, second edition (2nd ed. ed.). West Sussex, England, J. Wiley and Sons.
Hong, Y. G., Park, J. S., Kim, H. J., and Lee, H. H. (2005). A service continuity mechanism
based on IPv6 at mobile station for CDMA/WLAN interworking. IEEE 62nd on Vehicular
Technology Conference. VTC-2005-Fall., Vol. 2, pp: 1207 – 1211.
Houck, D. J., Kim, E., and Gerard, P. (2003). A network survivability model for critical national
infrastructure. Bell Labs Technical Journal, Vol. 8(4).
International Telecommunication Union. (2008). ITU-T: ITU telecommunication standardization
sector. Retrieved 03/01, 2008, from
http://www.itu.int/net/home/index.aspx.
ITU-T Rec. Q.1711. (1999). Network functional model for IMT-2000. Retrieved 09/20, 2007,
from http://www.itu.int/rec/T-REC-Q.1711-199903-I/en.
ITU-T Rec. M.3100 (2005). Generic network information model. Retrieved 09/23, 2007, from
http://www.itu.int/rec/T-REC-M.3100-200504-I/en.
Jaimes-Romero, F. J., Munoz-Rodriguez, D., Molina, C., and Tawfik, H. (1997). Modeling
resource management in cellular systems using petri nets. IEEE Transactions on Vehicular
Technology, Vol. 46(2), pp: 298 - 312.

159
Jensen, K. K. (1992). Coloured petri nets: Basic concepts, analysis methods and practical use.
Berlin ; New York : Springer-Verlag.
Jorstad, I., and Dustdar, S. (2004). An analysis of service continuity in mobile services. 13th
IEEE on Enabling Technologies: Infrastructure for Collaborative Enterprises, WET ICE 2004.
International Workshops, pp: 121 – 126.
Kaaranen, H. (2005). UMTS networks: Architecture, mobility and services. Hoboken, NJ : J.
Wiley & Sons.
Kara, N., Issa, O., and Byette, A. (2005). Real 3G WCDMA networks performance analysis. 30th
Anniversary IEEE Conference on Local Computer Networks, pp: 586 – 592. .
Klaric, K., Pudar, K., and Puksec, J. (2001). ISDN call analysis by using petri net model.
EUROCON'2001, Trends in Communications, International Conference, Vol.2, pp: 408 – 411.
Koren, Y., Heisel, U., Jovane, F., Moriwaki, T., Pritschow, G., Ulsoy, G., et al. (1999).
Reconfigurable manufacturing systems. Annals of the CIRP, Vol. 48(2), pp: 527-540.
Kristensen, L. M., Christensen, S., and Jensen, K. (1998). The practitioner's guide to coloured
petri nets. International Journal on Software Tools for Technology Transfer (STTT), Vol. 2(2),
pp: 98-132.
Kruchten, P. (2005). Casting software design in the function-behavior-structure framework.
IEEE Software,Vol. 22(2), pp: 52 – 58.
Kuipers, B. (1984). Commonsense Reasoning about causality: deriving behavior from structure.
Artificial Intelligence, Vol. 24, pp. 169-203.

160
Kurt, J., Lars, M. K., and Lisa, W. (2007). Coloured petri nets and CPN tools for modelling and
validation of concurrent systems. Retrieved 09/18, 2007, from
http://www.daimi.au.dk/~kris/VPSM06/STTT.pdf.
Lee, J. S., and Hsu, P. L. (2003). Remote supervisory control of the human-in-the-loop system by
using petri nets and java. IEEE Transactions on Industrial Electronics, Vol. 50(3), pp: 431-439.
Lin, Y., and Zhang, W. J. (2004). Towards a novel interface design framework: Function-
behavior-state paradigm. International Journal of Human-Computer Studies, Vol. 61(3), pp:
259-97.
Lin, Y., and Zhang, W. J. (2004). A function-behavior-state approach to designing human-
machine interface. 2004 ASME Design Engineering Technical Conferences and Computers and
Information in Engineering Conference, Vol. 3(21), pp: 231-239.
Lin, Y., and Zhang, W. J. (2005). A function-behavior-state approach to designing human-
machine interface for nuclear power plant operators. IEEE Transactions on Nuclear Science,
Vol. 52(1), pp: 430-439.
Mendiratta, V. B., and Witschorik, C. A. (2003). Telephone service survivability. Fourth
International Workshop on the Design of Reliable Communication Networks (DRCN 2003),
pp: 413-433.
Mishra, A. R. (2004). Fundamentals of cellular network planning and optimization: 2g/2.5 g/3g...
evolution to 4g. Hoboken, NJ : J. Wiley & Sons.
Moore, A., Hancock, K., Stacey, R. and Stacey, P. (2001). The vulnerability of mobile
telecommunications to natural hazards. Retrieved 08/01, 2007, from
http://ww3.ps-sp.gc.ca/research/resactivites/CI/climatechg/2001-D004_e.asp.
161
Murase, I., Murano, M., and Ohno, H. (2004). Standardization activity on emergency
telecommunication system in ITU-T. 2004 International Symposium on Applications and the
Internet Workshops, pp: 217-239.
Murata, T. (1989). Petri Nets: Properties, analysis and applications. Proceedings of the IEEE,
Vol. 77(4), pp: 541-580.
National Health and Safety Performance Standards. (2004). Emeregncy/disaster preparedness
for child care prorams. Retrieved 08/01, 2007, from
http://nrc.uchsc.edu/SPINOFF/EMERGENCY/Emergency.pdf.
Needle machine. (n.d.). Retrieved 03/18, 2008, from
http://www.singera1sewing.com/image/basic%20sewing%20machine%20parts.jpg.
Nuaymi, L., Lagrange, X., and Godlewski, P. (n.d.). A Power Control Algorithm for 3G
WCDMA System. Retrieved 03/01, 2008, from http://www2.ing.unipi.it/ew2002/proceedings/177.pdf.
Ohrtman, F. D. (2003). Softswitch: Applications, protocols and platforms. McGraw-Hill
Professional.
OSI model. (2008). Wikipedia, the free encyclopedia. Retrieved 03/26, 2008, from
http://en.wikipedia.org/wiki/OSI_Reference_Model.
Pahl, G., Beitz, W., and Wallace, K. (1996). Engineering design : A systematic approach (2nd
ed.). London; New York: Springer-Verlag.
Packet switching. (2008). Wikipedia, the free encyclopedia. Retrieved 03/08, 2008, from
http://en.wikipedia.org/wiki/Packet_switching.
Park, S., Song, J., and Kim, B. (2006). A survivability strategy in mobile networks. IEEE
Transactions on Vehicular Technology, Vol. 55(1), pp: 328-340.

162
Protocol. (2008). Wikipedia, the free encyclopedia. Retrieved 2/16, 2008, from
http://en.wikipedia.org/wiki/Protocol_(computing).
Qian, L., and Gero, J. S. (1996). Function-behavior-structure paths and their role in analogy-
based design. Artificial Intelligence for Engineering Design, Analysis and Manufacturing, Vol.
10(4), pp: 289-312.
Ratzer, A. V., Wells, L., Lassen, H. M., Laursen, M., Qvortrup, J. F., Stissing, M. S., et al.
(2003). CPN tools for editing, simulating, and analysing coloured petri nets. Applications and
Theory of Petri Nets, 2003, 24th.
Redmond Fire Department. (2001). Disaster preparedness. Retrieved 08/01, 2007, from
http://www.redmond.gov/insidecityhall/fire/disasterprep/welcome.asp.
Rentacomputer. (2008). Typical screen and projector rental setup in hotel conference room.
Retrieved 03/08, 2008, from http://www.rentacomputer.com/PR/Save-50-Percent-off-Hotel-AV-
Rental-Rates.asp.
Report Information. (2007). 2007 north america - telecoms, broadband and mobile statistics.
Paul Budde Communication Pty Ltd. Retrieved 11/12, 2007, from
http://www.marketresearch.com/product/display.asp?productid=1556016&xs=r.
Samarajiva, R. (2001). Disaster preparedness and recovery: A priority for telecom regulatory
agencies in liberalized environments. ITU Telecom Africa 2001 Policy & Development Summit,
Johannesburg, South Africa. Retrieved, from
http://www.itu.int/TELECOM/aft2001/cfp/auth/4858/pap_4858.pdf.
Semantics. (2007). Wikipedia, the free encyclopedia. Retrieved 09/18, 2007, from
http://en.wikipedia.org/wiki/Semantics.
Sidar, D. (1995). Managing telecommunications networks using TMN interface standards.
Communications Magazine, IEEE, Vol. 33(3), pp: 54-60.

163
Sief, M. A., and Dakroury, Y. (2004). Improvement the performance of voice quality over UMTS
system in packet switching networks. Fifth IEE International Conference on 3G Mobile
Communication Technologies (3G 2004) the Premier Technical Conference for 3G and Beyond,
pp: 537-542.
Slider-crank mechanism. (1994). Slider-crank mechanism. Encyolopaedia Britannica, Inc.
Retrieved 03/08, 2008, from http://www.britannica.com/eb/art/print?id=7447&articleTypeId=0.
Smith, C., and Collins, D. (2002). 3G wireless networks. New York: McGraw-Hill.
Snow, A. P., Varshney, U., and Malloy, A. D. (2000). Reliability and survivability of wireless
and mobile networks. Computer, Vol. 33(7), pp: 49-55.
Stafford, M. (2004). Signaling and switching for packet telephony. Boston: Artech House.
Steven P. M, and Racine, W. (2004). Internally mounted radial flow intercooler for a rotary
compressor machine. Retrieved 03/08, 2008,
http://www.patentdebate.com/PATAPP/20040062644.
Suh, N. P. (1990). The principles of design. New York: Oxford University Press.
Transcode. (2008). Wikipedia, the free encyclopedia. Retrieved 09/18, 2007, from
http://en.wikipedia.org/wiki/Transcoding.
Turina, D., and Furuskar, A. (2005). Traffic steering and service continuity in GSM-WCDMA
seemless networks. Proceedings of the 8th International Conference on Telecommunications,
ConTEL 2005.Vol. 1, pp: 77-82.
Tutsch, D. (2006). Performance analysis of network architectures. New York: Springer-Verlag.

164
Ulrich, K. T., and Seering, W. P. (1988). Function sharing in mechanical design. The Seventh
National Conference on Artificial Intelligence, Vol. 1, pp: 342-370.
Umeda, Y., and Tomiyama, T. (1995). FBS modeling: Modeling scheme of function for
conceptual design. Workshop on Qualitative Reasoning, pp: 271–278.
Umeda, Y., Ishii, M., Yoshioka, M., Shimomura, Y., and Tomiyama, T. (1996). Supporting
conceptual design based on the function-behavior-state modeler. Artificial Intelligence for
Engineering Design, Analysis and Manufacturing, Vol.10(4), pp: 275-288.
Umeda, Y., Kondoh, S., Shimomura, Y., and Tomiyama, T. (2005). Development of design
methodology for upgradable products based on function–behavior–state modeling. Artificial
Intelligence for Engineering Design, Analysis and Manufacturing, Vol. 19(03), pp: 161-182.
Umeda, Y., Takeda, H., Tomiyama, T., and Yoshikawa, H. (1990). Function, behaviour, and
structure. In Applications of Artificial Intelligence in Engineering, V, (Gero, J.S.,Ed.),
Computational Mechanics Publications and Springer-Verlag, pp: 177-193.
Varshney, U., Snow, A. P., and Malloy, A. D. (2001). Measuring the reliability and survivability
of infrastructure-oriented wireless networks. 26th Annual IEEE Conference on Local Computer
Networks, 2001. Proceedings LCN 2001, pp: 611 – 618.
Wang, H. J. (1999). Telecommunications network management. New York: McGraw-Hill.
Westergaard, M.(n.d.). The BRITNeY suite: A platform for experiments. Retrieved 09/18, 2007,
from http://www.daimi.au.dk/CPnets/workshop06/cpn/papers/Paper06.pdf.
Westergaard, M., and Lassen, K. B. (2006). The BRITNeY suite animation tool. Proceedings of
27th International Conference on Application and Theory of Petri Nets. Turku, Finland, pp: 431–
440.
165
Westergaard, M., and Lassen, K. B.(n.d.). Building and deploying visualizations of coloured
petri net models using BRITNeY animation and CPN tools. Retrieved 09/18, 2007, from
http://klafbang.eu/personlig/publications/britney2.pdf.
Yacoub, M. D. (2002.). Wireless technology protocols, standards, and techniques. Boca Raton,
Fla.: CRC Press.
Zhang, W. J., Lin, Y. and Sinha, N. (2005). On the function-behavior-structure model for design.
Retrieved 07/20, 2007, from http://www.cden.ca/2005/2ndCDEN-conference/data/10194.pdf.
Zhang W.J., Li,Q., Bi, Z.M., and Zha, X.F. (2000). A generic Petri Net model for flexible
manufacturing systems and its use for FMS control software testing. Int. J. of Production
Research, 38(5), February, pp. 1109-1132.
Zhang, Y. (2002). SIP-based VoIP network and its interworking with the PSTN. Electronics and
Communication Engineering Journal, Vol.14(6), pp: 273-282.
Zheng, H., Rittenhouse, G., and Recchione, M. (2003). The performance of voice over IP over
3G downlink shared packet channels under different delay budgets. 2003 IEEE 58th on
Vehicular Technology Conference, VTC 2003-Fall, Vol. 4, pp: 2501 – 2505.
Zimmermann, A., and Hommel, G. (1999). Modelling and evaluation of manufacturing systems
using dedicated petri nets. The International Journal of Advanced Manufacturing Technology,
Vol. 15(2), pp: 132-138.
Zimmermann, A., Bode, S., and Hommel, G. (1996). Performance and dependability evaluation
of manufacturing systems using petri nets. Workshop Manufacturing Systems and Petri Nets at
the 17th Int. Conf. on Application and Theory of Petri Nets, pp: 235-250.
166
Appendix A
Code of the WCDMA CPN model
* The completed coded is stored in CD-ROM
The code comprises the 5 typical models within different layers, which are listed as follows:
(1) Dynamic model of the demands,
(2) Dynamic model of the functions,
(3) Dynamic model of the structure,
(4) Dynamic model of the principles, and
(5) Dynamic model of the threaten scenarios
The descriptions of each model and the relations among them are mentioned in Chapter 6. The
complete list of codes is stored in the attached CD-ROM with a file called ‘CPN model of
WCDMA system’.

167
Appendix B
Code of the interface 2 for decision making support
* The completed code is stored in CD-ROM
The program is to realize the function of interface 2 to translate information from the WCDMA
PN model to the WCDMA domain model.
The code comprises two parts, which are listed as follows:
(1) Main program to realize the control windows for interfaces 2, and
(2) Module sub-program to archive the database and realize the translation function.
Detailed descriptions of Interface 2 are mentioned in Chapter 7. The complete list of codes is
stored in the attached CD-ROM with a file called ‘Interface 2 for decision making support
system’.


![LIKE PILGRIMS TO THIS MOMENT: MYTH, HISTORY, …ecommons.usask.ca/bitstream/handle/10388/etd-12192008-183920/... · I would like to acknowledge the guidance of ... No poet [ … ]](https://static.fdocuments.in/doc/165x107/5aee5b387f8b9ac57a8bd7aa/like-pilgrims-to-this-moment-myth-history-would-like-to-acknowledge-the-guidance.jpg)


![OPTICAL CHARACTERIZATION OF RARE EARTH …ecommons.usask.ca/bitstream/handle/10388/etd-07292009-064945/Go... · ... Dr. S. O. Kasap, ... Photon Amplification [13] ... Er3+ ion energy](https://static.fdocuments.in/doc/165x107/5abdc1f17f8b9aa3088c06d3/optical-characterization-of-rare-earth-dr-s-o-kasap-photon-amplification.jpg)


