Investor Relations - DistributionNOW
33
© 2021 COPYRIGHT DISTRIBUTIONNOW Fourth Quarter and Full-Year 2020 Investor Relations
Transcript of Investor Relations - DistributionNOW
© 2021 COPYRIGHT DISTRIBUTIONNOW
Fourth Quarter and Full-Year 2020
Investor Relations

© 2021 COPYRIGHT DISTRIBUTIONNOW
Disclosure Statement
▪ Statements made in the course of this presentation that state the Company's or management's intentions, hopes, beliefs, expectations or predictions of the future are forward-looking statements. It is important to note that the Company's actual results could differ materially from those projected in such forward-looking statements. Additional information concerning factors that could cause actual results to differ materially from those in the forward-looking statements is contained from time-to-time in the Company's filings with the U.S. Securities and Exchange Commission (SEC). Any decision regarding the Company or its securities should be made upon careful consideration of not only the information here presented, but also other available information, including the information filed by the Company with the SEC. Copies of these filings may be obtained by contacting the Company or the SEC.
▪ In an effort to provide investors with additional information regarding our results as determined by U.S. Generally Accepted Accounting Principles (GAAP), we disclose various non-GAAP financial measures in our quarterly earnings press releases and other public disclosures. We use these non-GAAP financial measures internally to evaluate and manage the Company’s operations because we believe it provides useful supplemental information regarding the Company’s ongoing economic performance. The non-GAAP financial measures include: (i) earnings before interest, taxes, depreciation and amortization (EBITDA) excluding other costs (sometimes referred to as “EBITDA”), (ii) net income (loss) excluding other costs and (iii) diluted earnings (loss) per share excluding other costs. Each of these financial measures excludes the impactof certain other costs and therefore has not been calculated in accordance with GAAP. A reconciliation of each non-GAAP financial measure to its most comparable GAAP financial measure can be found in our quarterly earnings press release.
Fourth Quarter and Full-Year 20202

© 2021 COPYRIGHT DISTRIBUTIONNOW
VisionDistributionNOW will be recognized as the market Leader in Supply Chain Management through superior customer service by leveraging the strengths of our employees, processes, suppliers, technology and information.
3 Fourth Quarter and Full-Year 2020

© 2021 COPYRIGHT DISTRIBUTIONNOW
Fourth Quarter and Full-Year Investment Highlights
▪ Management focused on top line growth by flexing new strategy from a structurally transformed and lower WSA baseline, with more adjustments as needed
▪ Continue to pursue end market diversification, centralized fulfillment and digitization to better position DNOW to capture market share and improve incremental margins
▪ Evolving DigitalNOW® customer ecosystem gaining traction with additional eCommerce customer implementations and registered users for our eSpec product configurator
▪ FCF for full year $181M, ending the quarter with $387M in cash, zero debt and total liquidity of $584M
▪ Completed a small acquisition to expand U.S. Process Solutions engineering, design and construction capabilities targeted for midstream growth
4 Fourth Quarter and Full-Year 2020

© 2021 COPYRIGHT DISTRIBUTIONNOW
▪ Activity increase in North America, resulting from revenue growth in Canada, with the U.S. being relatively flat as order pipeline improved offset by seasonality and declines Internationally
▪ Gross margins down sequentially due to elevated inventory charges attributed to structural and customer preference changes resulting in non-cash inventory charges of $24M during the quarter
▪ Expanding maintenance capex revenue from select E&P customers with few to no drilling rigs
▪ Retain market share on several contract renewals and expand with a notable midstream contract win
▪ Completed small acquisition in February 2021
▪ Expands DNOW’s engineering, design and construction services capability based in West Texas with midstream customers
▪ Reporting under U.S. Process Solutions
▪ M&A pipeline active, proactively evaluating opportunities
▪ Approximately $584 million in total liquidity
▪ Working capital, excluding cash, was 16% of fourth quarter 2020 annualized revenue
▪ Inventory turns at 4.2x
▪ Cash balance at December 31, 2020 of $387M
▪ Zero debt
▪ Structural change towards a more centralized fulfillment model with smaller branches and reduced personnel and vehicles, square footage and inventory
▪ Reduced discretionary and infrastructure costs and headcount from approximately 4,400 to 2,500 during the year
▪ Kitting and shipments of large project orders from Houston based super center
▪ Focused on cost transformation to better adapt to market demand and preserve balance sheet
▪ Leveraging technology to enhance employee productivity and increase operational efficiencies
DNOW Strategy to Unlock Value
Deliver
Margin
Optimize
Operations
Maximize Working
Capital
Velocity
Drive Growth
Through
Acquisitions
5 Fourth Quarter and Full-Year 2020

© 2021 COPYRIGHT DISTRIBUTIONNOW
▪ WTI avg $43 per barrel for 4Q20
▪ U.S. avg rig count of 310, up 22% sequentially, down 62% YOY
▪ Canada avg rig count 92, up 92% sequentially, down 34% YOY
▪ International avg rig count 663, down 9% sequentially, and 40% YOY
▪ December ended with a DUC count of 7,298 wells in EIA DPR regions
▪ 7,449 4Q20 avg
▪ Down 6% sequentially and down 8% YOY
▪ December ended with 518
▪ 502 avg for 4Q20
▪ Up 31% sequentially
▪ Down 58% YOY
4Q20 Key Market Indicators
WTI/Rig Counts U.S. DUCs U.S. Completions
DUCs are future revenue opportunities for DNOW
DNOW annualized revenue per rig at$1.2M for 4Q20
Presents an immediate opportunity for DNOW U.S. sales as tank
batteries and gathering systems are constructed after completions
6 Fourth Quarter and Full-Year 2020

© 2021 COPYRIGHT DISTRIBUTIONNOW
4Q20 Highlights – United States
4Q Highlights
▪ Revenue represents 19% of U.S. revenue
▪ Experienced an uptick in quoting activity and influx of
order pipeline from a 3Q bottom
▪ Expanded midstream terminal solutions with pump
rental fleet, tank mixers and horizontal multi-stage
pumps
▪ Expanded aftermarket pump maintenance program
with large E&P in the Permian
▪ Vessels shipped to Powder River Basin, Bakken,
Permian and Eagle Ford for E&P and Midstream
customers
▪ Launched eSpec™ digital product configurator for
customers to configure and obtain quotes on process
and production equipment
U.S. Process Solutions
Fourth Quarter and Full-Year 20207
4Q Highlights
▪ Revenue represents 81% of U.S. revenue
▪ Activity increased with increase in rig count,
completions and orders from natural gas operators
▪ Expanded revenue from operators and workover
rigs providing MRO product and services
▪ Expanded midstream market with a three year
well connect program in the Rockies for a large
midstream NGL and gas company including
eCommerce implementation of an eCatalog
▪ Expanding end markets with PVF orders for water
management and gas utility customers
▪ Renewed MRO and safety services contract for
major refinery
U.S. Energy

© 2021 COPYRIGHT DISTRIBUTIONNOW
4Q20 Highlights – Canada & International
4Q Highlights
▪ Revenue $47M, down $9M or 16% sequentially on
lower rig count ending the period at a yearly low
▪ Experience lower activity, project holds and increased
lockdowns in oil production areas
▪ Implemented our valve asset management solution
and DigitalNOW eCatalog for major IOC in Egypt
▪ In Latin America, awarded orders from offshore rigs
from a contact won in 3Q20
▪ In UK, won multi-year contracts with IOC operators
for electrical products and consumables
▪ In Australia, secured long term MRO and electrical
contract for major LNG operator and MRO agreement
from IOC natural gas producer
International
Fourth Quarter and Full-Year 20208
4Q Highlights
▪ Revenue of $48M, up $6M or 14% sequentially on
improved rig count and completions activity
▪ Expanded valve and actuation sales to EPCs, IOC
and midstream pipeline customers
▪ Expanded PVF market share with new natural gas
E&P customer
▪ Expanded composite piping system product line
share in Manitoba region with contract award
▪ Opened new location in northern Alberta to capture
market share
Canada

© 2021 COPYRIGHT DISTRIBUTIONNOW
Technology Investments for Reduced IT Service Costs and to Boost Productivity
9
▪ Boost Productivity:▪ Order Management System (OMS+) grows with higher
adoption globally delivering higher efficiency▪ Advanced Quoting Systems (AQ) to provide seamless
experience to faster responding quotes (Q1/Q2)▪ Process Analytics allows new automation opportunities
and disciplines to streamline operations further
▪ IT reduced cost, productivity boost, and digital foundation: ▪ Upgrading Enterprise Warehouse Management system
to standardize Distribution Center and Branches operations
▪ Migrating multiple data centers to cloud for application modernization and cost saving
▪ Upgrading Process Solutions ERPs to cloud-based solution to enhance manufacturing functionality across business units
Fourth Quarter and Full-Year 2020
DigitizedSystems

© 2021 COPYRIGHT DISTRIBUTIONNOW
Ecommerce platform continues to grow
▪ Customer implementations completed during the quarter accompany previous contract wins
▪ Majority of new implementations in the midstream space targeting revenue accretive MRO day-to-day spend
▪ User registrations continue to increase
▪ Focus on customer training and adoption
System Enhancements
▪ Improved viewing, added recommendations and complementary products
▪ Added strategic third party drop ship partner
Ecommerce channel continues to expand
10
Your Business Shop or Browse Purchase
Spend reporting 160,000+ products Order on account terms
Order history and tracking Catalog searchPunchout via ERP integration
Approval workflowView inventory availability andlead-times to fulfill
Electronic purchasing (EDI/XML)
Personalized catalogPersonalized saved carts & favorites
Customized checkout processes
Account pricing Shop by equipment compatibility Request a quote
Configurable delivery & pickup options
Shop by your part numbers Non catalog buy outs
Summary billing Product details and specifications Visa / Mastercard
Ecommerce features at a glance
Fourth Quarter and Full-Year 2020

© 2021 COPYRIGHT DISTRIBUTIONNOW
Driving Supply Chain Innovation through Speed, Efficiency and Technology
11
▪ Legacy 150+ years operating
▪ Support major land and offshore operations for all the key energy producing regions around the world
▪ Comprehensive network of energy centers, supply chain services and process solutions locations complemented with an online commerce channel
▪ Key markets: Europe, Former Soviet Union, Latin America, Middle East, North America, Southeast Asia
2020 Revenue by Segment
78%
22%US. Energy
U.S. ProcessSolutions
2020 United States Revenue by Channel
NYSE Ticker DNOWCountries 20+Locations ~195Employees ~2,450ERP System SAP™
13%
71%
16%
Canada
United States
International
Fourth Quarter and Full-Year 2020

© 2021 COPYRIGHT DISTRIBUTIONNOW
Valves20%
Fittings and Flanges18%
Mill Tool, MRO, Safety and Other
22%
Drilling and Production
26%
Pipe14%
Comprehensive Product Offering and Balanced Revenue Mix
12
DNOW carries a
broad range ofproducts and services
to meet
RAPID and CRITICAL deliveries
to customers in local and
remote areas
- Honing our last-mile focus
- Retaining proximity to customers
- Using technology and centralized distribution to drive productivity
Fourth Quarter and Full-Year 2020
2020 Product Mix

© 2021 COPYRIGHT DISTRIBUTIONNOW
Global Presence and Reach (blue)
13
USA
CANADA
COLOMBIA
BRAZIL
CHINA
INDIA
AUSTRALIA
RUSSIA
KAZAKHSTAN
AZERBAIJAN
NORWAY
UK
NETHERLANDS
MEXICO
Estevan
Edmonton Aberdeen
Houston
Beulah
OMAN
EGYPT
SAUDIARABIA
KUWAIT
Company Locations
Locations and Reach
Distribution Centers
Distribution Centers:
United StatesHouston, TXBeulah, NDCasper, WY
CanadaEdmonton, AlbertaEstevan, Saskatchewan
EuropeAberdeen, Scotland
MENAJebel Ali, U.A.E.
AsiaJurong, Singapore
UAEJebel Ali
SINGAPORE INDONESIA
Jurong
Casper
Fourth Quarter and Full-Year 2020

© 2021 COPYRIGHT DISTRIBUTIONNOW
Blue-Chip Suppliers and Customers Across the Globe
14
Supporting Customer Operations in ~80 countries
Downstream & Industrial
Thousands of Suppliers in ~40 countries
Midstream
Drilling Contractors
Exploration & Production
Fourth Quarter and Full-Year 2020

© 2021 COPYRIGHT DISTRIBUTIONNOW
DNOW is a Critical Link from Drilling to Distribution
15
Upstream Midstream Downstream / Industrial
Fourth Quarter and Full-Year 2020

© 2021 COPYRIGHT DISTRIBUTIONNOW
Providing Value-Add Solutions Across All Channels
16
Rotating and process equipment solutions in the form of engineering, design, installation, fabrication and
service
Meets demand for turnkey tank battery production
(facilities) solution
On-site model offering customizable products to upstream and
downstream energy, industrial and manufacturing markets
Reduces customers’ total costs including operational and
invested capital
Global branch network model supplying products locally to upstream
& midstream energy customers
Provides wide array of products & value locally in major oil and gas regions
ENERGY CENTERS U.S. SUPPLY CHAIN U.S. PROCESS SOLUTIONS
Fourth Quarter and Full-Year 2020

© 2021 COPYRIGHT DISTRIBUTIONNOW
Driving Growth through Acquisitions
17
Track Record of Success
Clearly Defined
Acquisition Strategy
- Seek high value-add solutions that bring sustainable competitive advantages- Leverage product lines acquired through acquisitions to gain organic share- Utilize strong customer relationships that present new opportunities - Increase barriers to entry- Promote cross-selling from U.S. Energy to U.S. Process Solutions
May 30, 2014Spinoff
from NOV
20192014
Tradingon NYSE
June 2014
Oct 2014• Caprock Supply Company• Colorado Valve & Controls
ProgressiveSupply
Nov 2014
Feb 2015OAASISGroup
MachineTools Supply
Jan 2015
MacLeanElectrical
March 2015
May 2015North Sea
Cables
• Inline Valves• Odessa PumpsJuly 2015
Nov 2015Challenger Industries
UpdikeSupply
Dec 2015
June 2016Power Service
May 2019Piping Specialties
Company
AcceleratedProcess Systems
June 2019
Fourth Quarter and Full-Year 2020
202120162015
Feb 2021Master Corporation
2017 2018 2020

© 2021 COPYRIGHT DISTRIBUTIONNOW
Industry Dynamics

© 2021 COPYRIGHT DISTRIBUTIONNOW
Key Market Indicators
19
OIL PRICES & RIGS TRENDING
DNOW is positioned to benefit from industry recovery
Average Rig Count
Source: Baker Hughes, Inc.
(number of rigs)
Average Oil Prices
Source: EIA, Europe Brent and Cushing, OK WTI Spot Price FOB
(per barrel)
$109
$99
$52
$44
$54
$71
$64
$50
$30
$43 $44
$98
$93
$49
$43
$51
$65
$57
$46
$28
$41 $42
2013 2014 2015 2016 2017 2018 2019 1Q20 2Q20 3Q20 4Q20
Brent WTI
Quarterly Quarterly
1761 1862
977
510
8751032 944
785
396254 310
355380
193
128
207191
135195
2548
92
12961336
1167
955
948988
10981074
834
731663
3412
3578
2337
1593
2030
2211 21772054
1255
1033 1065
2013 2014 2015 2016 2017 2018 2019 1Q20 2Q20 3Q20 4Q20
United States Canada International Total
Fourth Quarter and Full-Year 2020

© 2021 COPYRIGHT DISTRIBUTIONNOW
Pipe Price Trends, U.S. dollar per ton
20
Source: Pipe Logix
Fourth Quarter and Full-Year 2020
-
500
1,000
1,500
2,000
2,500
3,000
Seamless
Smls Domestic Smls Foreign
-
200
400
600
800
1,000
1,200
1,400
1,600
1,800
2,000
ERW
ERW Domestic ERW Foreign

© 2021 COPYRIGHT DISTRIBUTIONNOW
Financial Update

© 2021 COPYRIGHT DISTRIBUTIONNOW
CFO Highlights: Selected Quarterly Results (Unaudited)Gross Profit and Margin %($ in millions)
EBITDA Excl. Other Costs (Non-GAAP)($ in millions)
Net Income (Loss) Excl. Other Costs (Non-GAAP)($ in millions)
$125
$62 $45
19.6% 19.0%
14.1%
4Q19 3Q20 4Q20
Revenue($ in millions)
Fourth Quarter and Full-Year 202022
$639
$326 $319
4Q19 3Q20 4Q20
$5
($15)
($29)
4Q19 3Q20 4Q20 $(6)
$(17)
$(28)
4Q19 3Q20 4Q20

© 2021 COPYRIGHT DISTRIBUTIONNOW
Cash Generation & Working Capital Management
Free Cash Flow (“FCF”) is defined as net cash provided by (used in) operating activities, less purchases of property, plant and equipment
$69
$57 $55
4Q19 3Q20 4Q20
Working Capital Excluding Cash($ in millions)
Free Cash Flow
($ in millions)
23 Fourth Quarter and Full-Year 2020
$488
$289
$202
19.1%
22.2%
15.8%
4Q19 3Q20 4Q20
Working Capital Excluding Cash % Annualized Qtr Sales

© 2021 COPYRIGHT DISTRIBUTIONNOW24
Structural Transformation
$638 $619
$567 $542
$557 $541
$391
$324
$200
$250
$300
$350
$400
$450
$500
$550
$600
$650
$700
2014 2015 2016 2017 2018 2019 2020 4Q20
Warehousing, selling & administrative (WSA) expense trends
($ in millions)
▪ Headcount reductions approximate 1,900, down 43% during the year
▪ Implementing consolidation measures combined with redesigning network of facilities to maximize coverage while leveraging the benefits of centralized fulfillment
▪ Efficiency and productivity▪ Deploy technology to augment labor content
▪ Designing express centers, supercenters and regional fulfillment network, with a bias towards centralized structure
▪ Eliminate waste and least valuable activity
▪ Offshore lower-level back office labor
Revenue grew $1Bfrom ‘16 to ‘18
Fourth Quarter and Full-Year 2020
4Q20 annualized: Other items, including bad debt, severance and acquisition expenses, as well as WSA for potential acquisitions will influence actual results.
Annualized
© 2021 COPYRIGHT DISTRIBUTIONNOW
Liquidity and Capital Resources
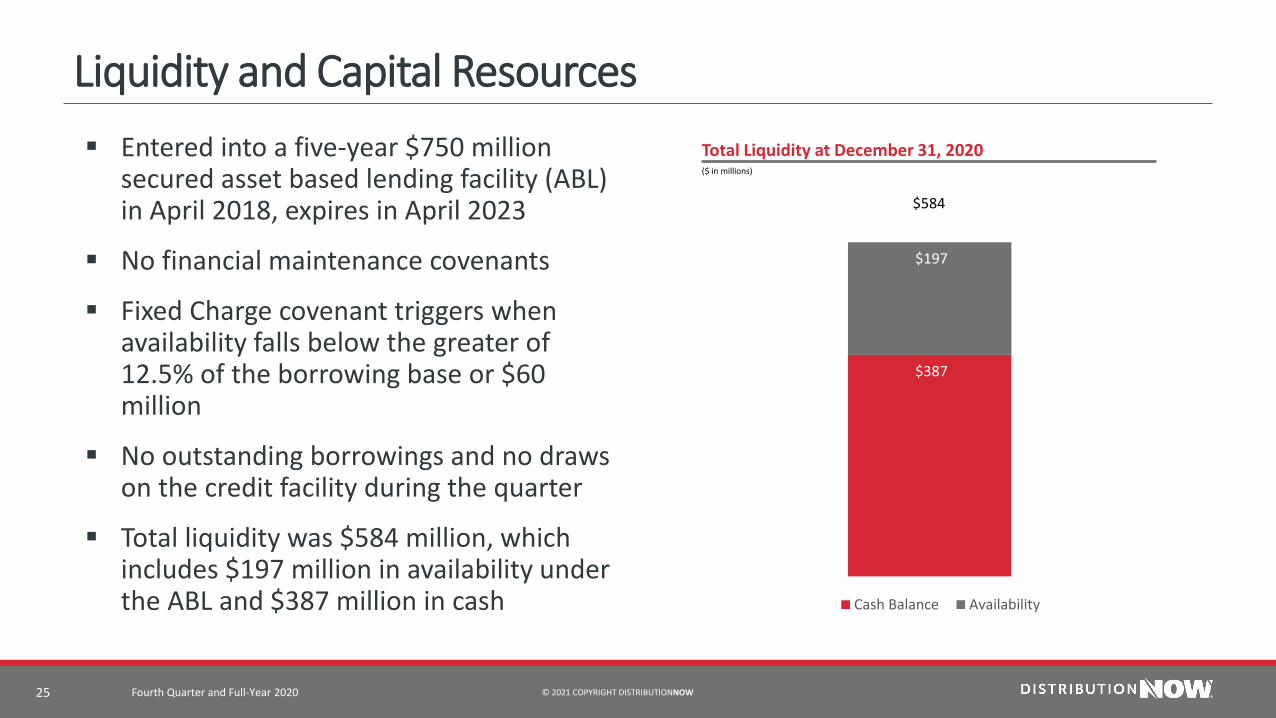
▪ Entered into a five-year $750 million secured asset based lending facility (ABL) in April 2018, expires in April 2023
▪ No financial maintenance covenants
▪ Fixed Charge covenant triggers when availability falls below the greater of 12.5% of the borrowing base or $60 million
▪ No outstanding borrowings and no draws on the credit facility during the quarter
▪ Total liquidity was $584 million, which includes $197 million in availability under the ABL and $387 million in cash
25
$387
$197
Cash Balance Availability
Total Liquidity at December 31, 2020($ in millions)
$584
Fourth Quarter and Full-Year 2020

© 2021 COPYRIGHT DISTRIBUTIONNOW
Select Balance Sheet Metrics
($ in millions)
26
4Q20($ in millions)
Cash and cash equivalents 387$
Receivables, net 198 57 DSOs
Inventories, net 262 4.2 Turn rates
Accounts payable 172 57 DPOs
Long-term debt − No outstanding debt
Comments
Fourth Quarter and Full-Year 2020

© 2021 COPYRIGHT DISTRIBUTIONNOW
Environmental, Social & Governance

© 2021 COPYRIGHT DISTRIBUTIONNOW
Response to COVID-19▪ Remained connected to our customers communicating impacts on product
availability and accessibility, as DNOW designated as an “essential” business
▪ Corporate COVID-19 response team coordinating policies and guidelines
▪ Continuous communication through our HSE onsite champions on COVID updates and CDC / WHO information
▪ Implemented recurring survey to ensure employees have access to necessary PPE and cleaning supplies
▪ Provided masks, signage and disinfecting cleaners at locations
▪ Employees working remotely are able to leverage technology to connect with co-workers, customers and suppliers
▪ Decreased third party access to business locations and increased reliance on video and teleconferencing
28 Fourth Quarter and Full-Year 2020

© 2021 COPYRIGHT DISTRIBUTIONNOW
Released Inaugural Sustainability Report
29 Fourth Quarter and Full-Year 2020
▪ Increase ESG reporting transparency to shareholders
▪ Followed SASB (Sustainability Accounting Standards Board) and TCFD (Task Force on Climate Related Financial Disclosures) standards and guidance
▪ Aligned with business strategy
▪ Established ESG management committee
▪ 2020 sustainability report release targeted for mid-year 2021

© 2021 COPYRIGHT DISTRIBUTIONNOW
Appendix
30

© 2021 COPYRIGHT DISTRIBUTIONNOW
Example Tank Battery Installation
31
LACT
Vapor Recovery Unit (VRU)
ASME Separators
Gas Meter
Water Disposal Skid
Pipe, Valves, & Fittings (PVF)
Water Transfer Skid
Does not include utilities
ASME Heater Treaters
ASME Bulk Separator
Fourth Quarter and Full-Year 2020
© 2021 COPYRIGHT DISTRIBUTIONNOW
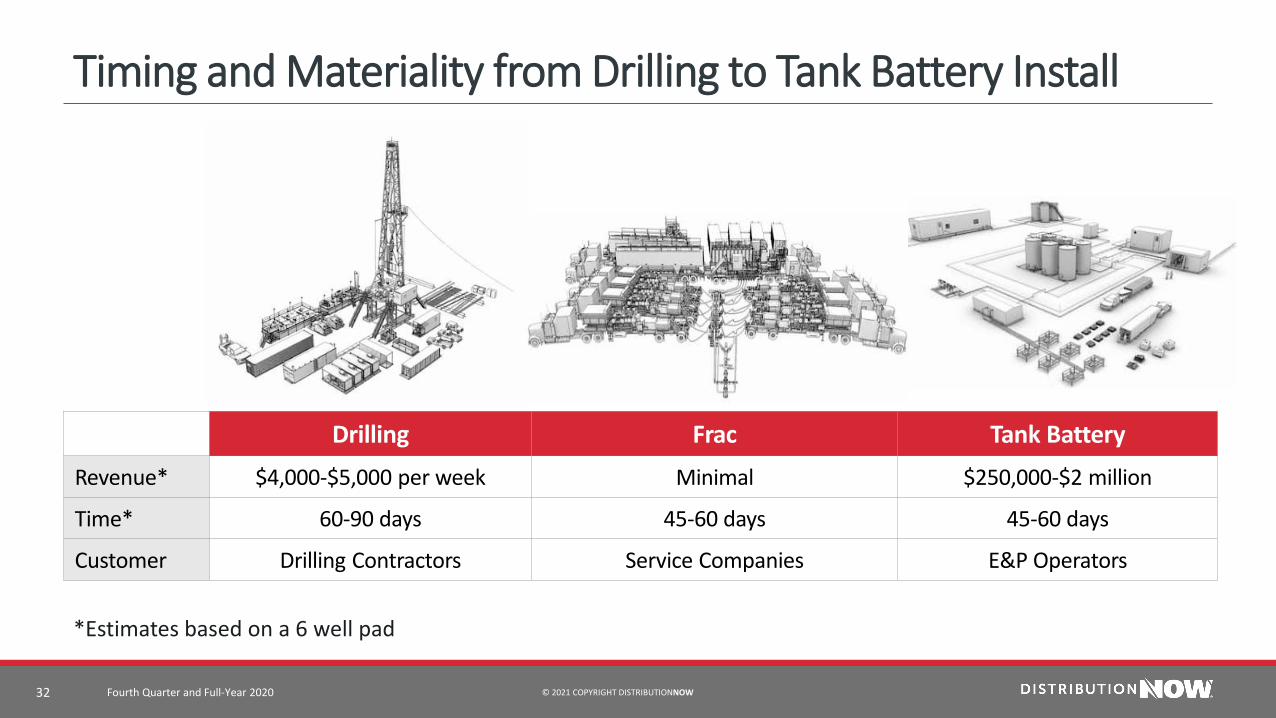
Timing and Materiality from Drilling to Tank Battery Install
32
Drilling Frac Tank Battery
Revenue* $4,000-$5,000 per week Minimal $250,000-$2 million
Time* 60-90 days 45-60 days 45-60 days
Customer Drilling Contractors Service Companies E&P Operators
*Estimates based on a 6 well pad
Fourth Quarter and Full-Year 2020

© 2021 COPYRIGHT DISTRIBUTIONNOW
Investor Relations Brad Wise, Vice President, Marketing & Investor Relations
ir.distributionnow.com, contact us at: [email protected]
33