Investor Presentation, September ‘14
49
Our Projects create unique value for our stock holders… And ultimately for life! Investor Presentation, September ‘14
Transcript of Investor Presentation, September ‘14

Our Projects create unique value for our stock holders… And ultimately for life!
Investor Presentation, September ‘14

Agenda
Projects page8
Appendix page41
Ozak Group page 2
Financial Review page25
Projections page37
Ozak REIT page5
1

2
Ozak Group

3
Ozak Group
Textile • OZAK Textile • Founded in 1995 • 57.000 m2 enclosed space in
separate factories • Competition-driven winning
strategies Design and model development
appropriate to clients’ needs R&D team of specialists adept in
spotting future fashion trends well in advance
Collaboration with local and international authorities when dealing with social responsibility and occupational health and safety issues
• Contract manufacturer for the Armani, Prada,Hugo Boss, Zara, Guess, Massimo Dutti, Replay and Esprit labels
• 2.200 employees • High added-value production, 95%
of which is intended for export • Consistent, stable growth since
inception
Construction • Int-Er Yapi • Founded in 1995 • Undertakes and
carries out the Ozak Group’s construction projects
• Provides project management, procurement management, quality management and cost&process management services in the fullfillment of Ozak REIT projects
• Professional team of 210 specialists
• 1.500 construction site personnel (including subcontractor staff)
Tourism • Entered the tourism
industry 2007 with Ela Quality Resort Hotel through its stakes in the Aktay Turizm and Aktay Otel firms
• Competition-driven winning strategies
- Family/child priority concept; kids’ reception & monitoring systems; teen club - Superior - quality rooms, personalized villas, each villa serviced by a specialized team helicopter and VIP transfer services - 9 separate a la carte and snack restaurants/ food service team directed by celebrated chefs/quality management under the supervision of a full-time staff of food engineers - Up to 100% occupancy during the high season
REIT • OZAK REIT • Founded in 2009 • Real estate and real estate
investment projects, tourism activities
• Team of specialist in business development, zoning laws and regulations, feasibility studies&market research, property appraisals,architectural concept formulation
• Distinguished «down town» projects that have been recognized and cited for awards by leading European organizations
• Independently audited by Earnst & Young
OZAK REIT Subsidiaries • Aktay Tourism (100.0%) • Aktay Otel Isletmesi (95%) • Arstate Yatirim (100%)
Snapshot

Ozak Group
4
History
1995 Int-Er Yapi
construction company established
2009 «Ozak REIT
founded» Ela Resort Hotel moved into REIT portfolio Mahmutbey
Land, Istanbul
2010 Gunesli Is
Istanbul 34 Project, Istanbul
Ikitelli 34 Portall Project,
Istanbul
2011 Bayrampasa Land, Istanbul (Hayattepe and Metro Gross Market Projects)
2012 Ozak REIT
launched its «IPO» and was listed on the BIST
Bulvar 216 Project, Istanbul
Metro Gross Market Project, Istanbul
Hayattepe Project, Istanbul
2013 Izmir
Alsancak Project, Izmir
2014 Kazlicesme
Coastal Road Project, Istanbul
Gokturk Land, Istanbul
Demre Land, Antalya
Didim Land, Aydın
Ozak Group’s
20-year real estate
experience was initiated by Inter-Yapi in 1995
92% NAV
CAGR bw ’09-’14
2007 Ela Resort Hotel, Antalya

5
Ozak REIT

6
Ozak REIT • Profound sector expertise accumulated since
1995 and further enhanced by Int-Er Yapi (Ozak Group construction company)
• Portfolio of Grade A office assets, leased to established corporate tenants across various business sectors
• Predictable and well-diversified cash flow via mixed-use projects (industry, commercial, tourism)
• Average 18.9% steady rental yield and TL43.6mn annual rent income in 2014
• Ongoing projects located in the prime CBDs of Istanbul promising to increase NAV by 48% in a year
• Total portfolio value of TL 1,5 bn as of Q3’14
Snapshot

7
Ozak REIT Shareholder Structure
8.5% 31,4%
54.0%
5.0%
1%
Ozak Tekstil Urfi Akbalık
Ahmet Akbalık Effective Free Float
Other Family Members
Shareholders Nominal Share (mn) Share
Ahmet Akbalık 84.8 54.0%
Urfi Akbalık 49.3 31.4%
Other Family Members 1.7 1.0%
Ozak Tekstil 13.4 8.5%
Effective Free Float 7.8 5.0%
Total 157.0 100.0%
TL 300 mn Capital Ceiling

8
Projects

Ozak REIT
9
Izmir, Alsancak
Ela Hotel Resort, Antalya, Belek
Projects in Istanbul
Projects in Turkey
Project Spread in Turkey
Marmara Sea
34 Portall Ikitelli
Is Istanbul 34 Gunesli
Kazlıcesme Coastal Road
Hayattepe, Bayrampasa
Metro Gross, Bayrampasa
Bulvar 216, Atasehir
Completed Projects Newly Completed Ongoing Projects Upcoming Projects

10
3Q 2014 Key Portfolio Highlights Ozak REIT
Ongoing Projects
Completed Projects &
Hayattepe Residence, Istanbul, TL335mn expected income
Bulvar 216, Istanbul, TL275mn expected income
Total Portfolio Value of TL1.5 bn as of 3Q’14
Current Portfolio Average Occupancy Rate remained at 96%
Completed Bulvar 216 Project -Robust revenue generation of USD45mn from newly sold office units -Proactive leasing strategy with 90% of occupancy ratio with average 5 year tenants in retail shopping area -Recently received the Best Office Award by Sign of the City Awards
Completed Hayattepe Residence Project, pre-sales ratio increased to %72 from 57% in1H’14 and started to deliver first units
Applied to CMB for merging procedure of subsidiary company Aktay Tourism

Ozak REIT
11
53,0
188,7
Land &Development
Cost
AppraisalValue
21,8
86,9
Land &Development
Cost
AppraisalValue
34,5
82,4
Land &Development
Cost
AppraisalValue
123,9
297,7
Land &Development
Cost
Appraisal Value
Facts and Figures
Completion Date 2010
Occupancy Rate 100%
Annual Rent Income TL11.5mn
Rental Yield Ratio 21.7%
Completed Projects
Facts and Figures
Completion Date 2010
Occupancy Rate 85%
Annual Rent Income TL4.7mn
Rental Yield Ratio 21.5%
Facts and Figures
Completion Date 2012
Occupancy Rate 100%
Annual Rent Income TL5.1mn
Rental Yield Ratio 14.8%
Facts and Figures
Completion Date 2007
Occupancy Rate 65%
Annual Rent Income TL22.3mn
Rental Yield Ratio 17.9%
34 Portall Plaza, Istanbul Is Istanbul 34, Istanbul
Metro Gross Market, Istanbul Ela Quality Resort Hotel , Antalya
Value Creation Value Creation
Value Creation Value Creation
3.6X 4.0X
2.4X 2.7X
TLm
n
TLm
n
TLm
n
TLm
n
*90% of rent contracts are based on foreign currency **Appraisal values as of December 21,2013, US$/TL rate @2.03

Ozak REIT
12
34 Portall Plaza, Istanbul Project Details
Ownership Ozak REIT (100%)
Project Type Industrial Office Building
Location Istanbul, Ikitelli
Distance to Major Locations
• Istanbul Ataturk Airport - 16 km
• Levent - 24 km
• Taksim - 23 km
Aquisition & Development Cost
TL53.0mn
Appraisal Value TL188.7mn
Rental Yield Ratio 21.7%
Occupancy Rate 100%
Annual Rent Increase LIBOR+2%
Operational Date 2010
Land Area 25,371 m²
Leasable Area 77,291 m²
Major Tenants Aras Kargo, LC Waikiki, Coats Turkiye
Ozak Tekstil, Intem Triko
Ataturk Airport
TL11.5mn
Annual Rent Income
3.6x
Value Creation
• Located strategicaly in Ikitelli Industry Zone
• Long-term renting method
• Reputable tenant portfolio
Ozak REIT
13
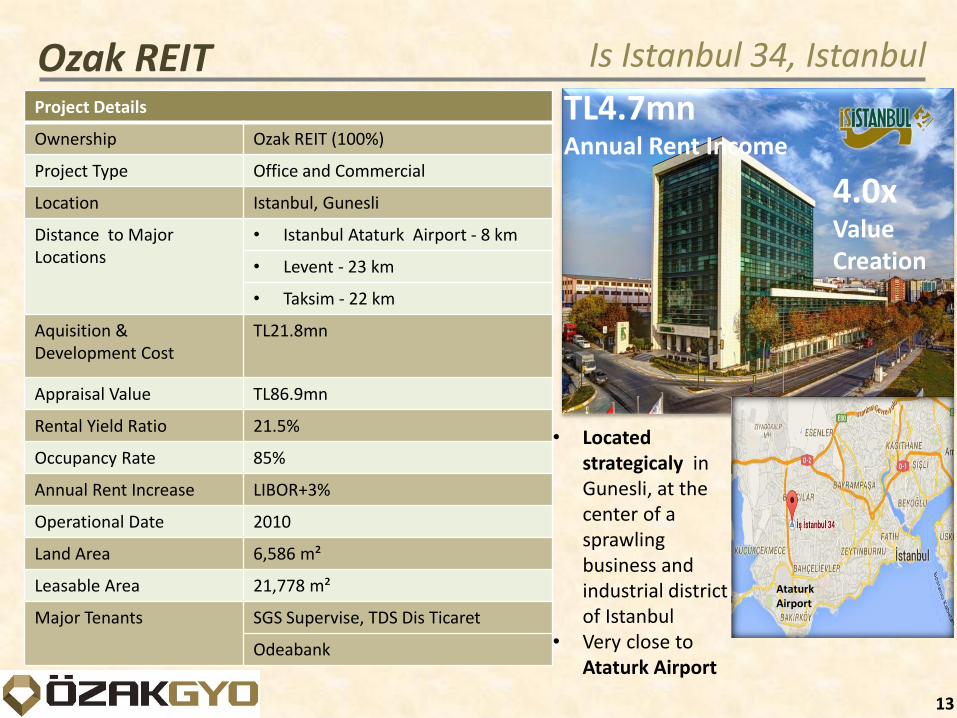
Is Istanbul 34, Istanbul Project Details
Ownership Ozak REIT (100%)
Project Type Office and Commercial
Location Istanbul, Gunesli
Distance to Major Locations
• Istanbul Ataturk Airport - 8 km
• Levent - 23 km
• Taksim - 22 km
Aquisition & Development Cost
TL21.8mn
Appraisal Value TL86.9mn
Rental Yield Ratio 21.5%
Occupancy Rate 85%
Annual Rent Increase LIBOR+3%
Operational Date 2010
Land Area 6,586 m²
Leasable Area 21,778 m²
Major Tenants SGS Supervise, TDS Dis Ticaret
Odeabank
• Located strategicaly in Gunesli, at the center of a sprawling business and industrial district of Istanbul
• Very close to Ataturk Airport
TL4.7mn
Annual Rent Income
4.0x Value Creation
Ataturk Airport
Ozak REIT
14
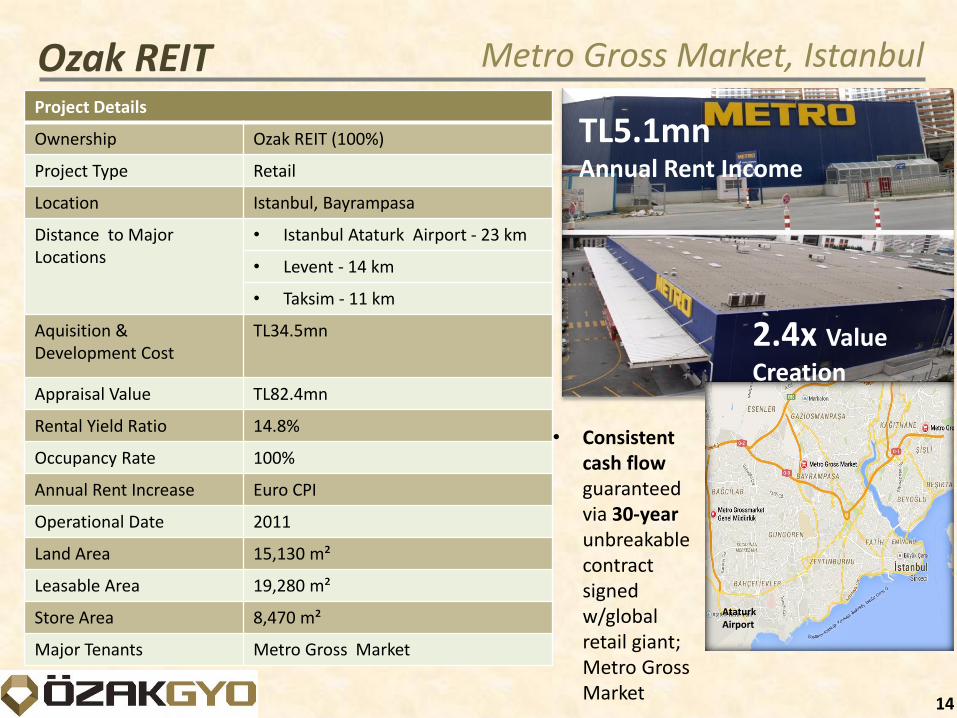
Metro Gross Market, Istanbul Project Details
Ownership Ozak REIT (100%)
Project Type Retail
Location Istanbul, Bayrampasa
Distance to Major Locations
• Istanbul Ataturk Airport - 23 km
• Levent - 14 km
• Taksim - 11 km
Aquisition & Development Cost
TL34.5mn
Appraisal Value TL82.4mn
Rental Yield Ratio 14.8%
Occupancy Rate 100%
Annual Rent Increase Euro CPI
Operational Date 2011
Land Area 15,130 m²
Leasable Area 19,280 m²
Store Area 8,470 m²
Major Tenants Metro Gross Market
• Consistent cash flow guaranteed via 30-year unbreakable contract signed w/global retail giant; Metro Gross Market
Ataturk Airport
TL5.1mn Annual Rent Income
2.4x Value
Creation

Ozak REIT
15
Ela Resort Hotel, Antalya Project Details
Ownership Tru Affiliates (Aktay Otel & Aktay Turizm)
Project Type Tourism
Location Antalya, Belek
Distance to Major Locations
• Antalya Airport - 25 km
• Antalya City Center - 35 km
• Belek - 2 km
Hotel Capacity 1500 Beds / 650 Rooms
Aquisition & Development Cost
TL123.9mn
Appraisal Value TL333.9mn
Rental Yield Ratio 17.9%
Annual Avg.Occupancy Rate
65%
Occupancy Rate 100%
Annual Rent Increase CPI Turkey
Operational Date 2007
Land Area 98,712 m²
• Premium segment services w high occupancy rates
• Certificate of Excellence 2014 winner
• Agreements signed w/globally well-known travel groups; TUI, TEZ, Odeon
TL22.3mn
Annual Rent Income
2.7x Value
Creation

Ozak REIT Newly Completed Ongoing Projects
16
Facts and Figures
Start Date 2012
Location Bayrampasa
Saleable Area 78,533 m²
Pre-Sales TL172.0mn
Pre-Sales Ratio 71%
IRR 34%
Hayattepe Residences, Istanbul
210,0
335,0
Land &Development
Cost
Expected TotalIncome
Facts and Figures Office Retail
Start Date 2012 2012
Location Atasehir Atasehir
Saleable/Leaseable Area 10,650 m² 11,250 m²
Pre-Sales/Pre-Lease TL95.4mn TL13.0mn
Pre-Sales/Pre-Lease Ratio 100% 90%
IRR 69%
125,0
275,0
Land & DevelopmentCost
Expected TotalIncome
Bulvar 216, Istanbul
‘’ Revenues Promising to Contribute P&L as of 2014’’
Value Creation
Value Creation
TLm
n
TLm
n
1.6X
2.2X

Ozak REIT Hayattepe Residences, Istanbul
17
Project Details
Ownership Ozak REIT (100%)
Project Type Residence
Location Istanbul, Bayrampasa
Distance to Major Locations • Istanbul Ataturk Airport - 23 km
• Levent - 14 km
• Taksim - 11 km
Aquisition & Development Cost
TL210.0mn
Total Expected Sales Income TL335.0mn
Portfolio Value TL174.7mn
Average Sale Price per m² TL4,265
Project Start Date 2013
Project Completion Date November,2014
Project Completion Ratio 98%
Land Area 16,698 m²
Saleable Area 78,533 m²
Total Housing Units 614
TL335mn Expected Sales Income
34% IRR
• Expected Sales Income to be realized in Q4 2014
• 34% IRR
Atatürk Airport
71% Pre-Sales
Ratio

Ozak REIT Bulvar 216, Istanbul Project Details
Ownership Ozak REIT (100%)
Project Type Office & Retail
Location Istanbul, Atasehir
Distance to Major Locations • Sabiha Gokcen Airport - 27 km
• Levent - 18 km
• Taksim - 20 km
Appraisal Value (Retail Area) TL126.0mn
Total Expected Sales Income TL275.0mn
Average Sale Price per m² TL8,970
Avg.Rent Income TL13.0mn (Starting to be realized in Q4’14)
Average Rental Price per m² TL92.0
Project Start Date 2013
Project Completion Date October, 2014
Project Completion Ratio 100%
Land Area 5,873m²
Leaseable/Saleable Area 34,300 m²
Office (Saleable ) Area 10,650 m²
Retail (Leaseable ) Area 11,250m²
18
TL266.0mn Expected Sale Income
69% IRR
• Expected Sales Income to be realized in Q4' 2014
• Aquisition & Development Costs already covered
• Winner of ‘’European Property Awards’’ in 6 different areas*
100% Office
Pre-Sales Ratio
90% Retail
Pre-Lease Ratio
*Best Office Architecture Turkey, Highly Commended Retail Architecture Turkey, Highly Commended Office Development Turkey, Highly Commended Retail Development Turkey

Ozak REIT Upcoming Projects
19
Facts and Figures
Start Date 2015
Completion Date 2019
Leaseable/Saleable Area 315,000 m²
Expected Avg. Sale Price per m² TL13,370
IRR 48%
Kazlicesme Coastal Road, Istanbul
Facts and Figures
Start Date 2015
Completion Date 2020
Leaseable/Saleable Area 330,000 m²
Expected Avg. Sale Price per m² TL6,645
IRR 35%
2.768
4.240
Land &Development Cost
Total ExpectedIncome
1.755
2.200
Land &Development Cost
Total ExpectedIncome
TLm
n
TLm
n
Value Creation
Value Creation
1.5x
1.3X
‘’Forthcoming Projects to Uplift NAV Significantly’’
Izmir Alsancak, Izmir

20
Ozak REIT Kazlicesme Coastal Road Project, Istanbul Project Details
Ownership Ozak REIT (55%)
Ziylan Gayrimenkul (30%)
Yenigun Insaat (15%)
Project Type Mixed Use
Location Istanbul, Kazlicesme
Distance to Major Locations • Istanbul Ataturk Airport - 14 km
• Levent - 16 km
• Taksim -11 km
Expected Start Date 2015
Expected Completion Date 2019
Land Area 111,200 m²
Leaseable / Saleable Area 315,000 m² • 185,000 m² Residence • 85,000 m² Office & Home Office • 20,000 m² Hotel • 25,000 m² Retail
Expected Project Development Cost TL1.2bn
Expected Sale Income TL4.2bn
Expected Profit (Ozak REIT Share) TL800.0mn
Expected Avg. Sale Price per m² TL13,370
TL4.2bn Expected Sale Income
48% IRR
• Revenue Sharing Model (RSM) project w/Emlak Konut REIT (EKGYO) - Emlak Konut REIT holds 37% stake
• 37% of expected sale income (approx. TL1.6bn) will be paid to Emlak Konut REIT
• Peer Projects Sale Price per m²
• Yali Atakoy - TL20,900 - TL24,200 • Sea Pearl - TL15,950 - TL23,100 • Ottomare - TL12,320 - TL17,150

Ozak REIT Kazlicesme Coastal Road Project, Istanbul
21

Izmir Alsancak Project, Izmir Ozak REIT
22
Project Details
Ownership Ozak REIT (100%)
Project Type Mixed Use
Location Izmir, City Center -Alsancak
Distance to Major Locations • Izmir Adnan Menderes Airport - 21 km
• Izmir Port - 6 km
• Izmir International Fair Center - 3 km
Expected Start Date 2015
Expected Completion Date Phase 1 in 2008- Phase 2 in 2020
Land Area 133,630 m²
Leaseable / Saleable Area 330,000 m² • 120,000 m² Residence • 110,000 m² Office & Home Office • 15,000 m² Hotel • 80,000 m² Shopping Mall • 5,000 m² Retail
Expected Project Development Cost TL941mn
Expected Sale Income TL2.2bn
Expected Profit (Ozak REIT Share) TL450.0mn
Expected Avg. Sale Price per m² TL6,645
• Revenue Sharing Model (RSM) project w/state-owned Emlak Planlama Proje (EPP)
- EPP holds 37% stake • 37% of expected sale income (approx.
TL814mn) will be paid to EPP • Peer Projects Sale Price per m² • Ege Perla - TL5,500 – TL8,400 • Mistral - TL6,600 – TL8,800 • Folkart Towers - TL5,900 – TL7,000

Ozak REIT
23
Izmir Alsancak Project, Izmir

Ozak REIT Other Upcoming Projects
24
Facts and Figures
Location Istanbul
Project Type Hotel & Residence
Land Area 8,349 m²
Appraisal Value TL76.4mn*
Balmumcu Land
Facts and Figures
Location Aydin
Project Type Hotel
Land Area 164,000 m²
Appraisal Value -
Facts and Figures
Location Antalya
Project Type Hotel
Land Area 71,000 m²
Appraisal Value -
Facts and Figures
Location Istanbul
Project Type Residence
Land Area 17,403 m²
Appraisal Value TL35.5mn
Facts and Figures
Location Istanbul
Project Type Business Center
Land Area 6,680 m²
Appraisal Value TL22.7mn Gokturk Land
Didim Land Demre Land
Mahmutbey Land
‘’At the high-end residential
convergence point’’
‘’At a vantage point right at the city center, nearby Park Hotel, with full Bosphorus view’’
‘’Ozak REIT retains its portfolio of valuable assets, benefiting from their steady capital appreciation; and paving the way for other value-added projects’’
*Appraisal value through full-owned subsidiary Arstate

Financial Review
25

26
Financial Review Net Asset Value
30,0%
28,0%
27,0%
8,0% 7,0%
Tourism
Office
Project
Retail
Land
Portfolio Breakdown by NAV
TL460.0mn MCAP
41% Discount
TLmn Portfolio Value June. 30, 2014 Sep.30,2014 2015 Year-end
Lands
Mahmutbey, Istanbul 22.7 22.7 24.7
Gokturk, Istanbul 35.6 35.6 38.8
Balmumcu, Istanbul 6.8 6.8 7.4
Total 65.1 65.1 70.9
Buildings
34 Portall, Istanbul 188.7 188.7 205.7
Is Istanbul 34, Istanbul 86.9 86.9 94.7
Metro Gross Market, Istanbul 82.4 82.4 84.9
Bulvar 216, Istanbul - 126.0 157.5
Total 358.0 484.0 542.8
Ongoing Projects
Hayattepe, Istanbul 167.0 - -
Hayattepe - Residance, Istanbul - 12.7 -
Bulvar 216, Istanbul 100.4 - -
Other - 15.9 -
(-)Pre Sales 180.4 - -
Total 87.0 28.6 -
Completed Projects (Inventory)
Hayattepe, Istanbul - 174.7 102.0
Hayattepe - Residance, Istanbul - - 8.5
(-)Pre Sales - 172.0 -
Total - 2.7 110.5
Subsidiaries
421.0 432.1 437.8
Total Portfolio Value 931.1 1,012.5 1.162,0
(+)Cash 48.9 73.8 15.3
(+)Other Assets 292.5 284.7 256.7
(-)Other Liabilities 204.2 215.8 204.2
(-)Loans 399.4 373.2 242.8
Net Asset Value 668.9 782.0 987.0

27
3Q 2014 Key Financial Highlights Ozak REIT
Positive contribution of total TL15.7mn achieved over preceeding contracted rental rates and TL73.7mn from tourism operations
Revenue generation of TL192.7mn -TL95.4mn from Bulvar 216 office area -TL8mn from Hayattepe Residence units’ sales figures
TL144.8mn Operating Profit, 134% Gross Margin based on TL93mn other income.. -TL61.9mn Bulvar 216 & TL6.3mn Gokturk Land revaluation
Net Income of TL124.0mn -TL49.7mn Bulvar 216 & TL3.2mn Hayattepe Residence sales’ contribution
Strong EBITDA figure of TL79.3mn with 41% EBITDA Margin
Net Debt of TL297.5mn
Weighted Average Term to Maturity of Loans unchanged at 1.4 years
Net FX position decreased by 49% to TL70.2mn
28
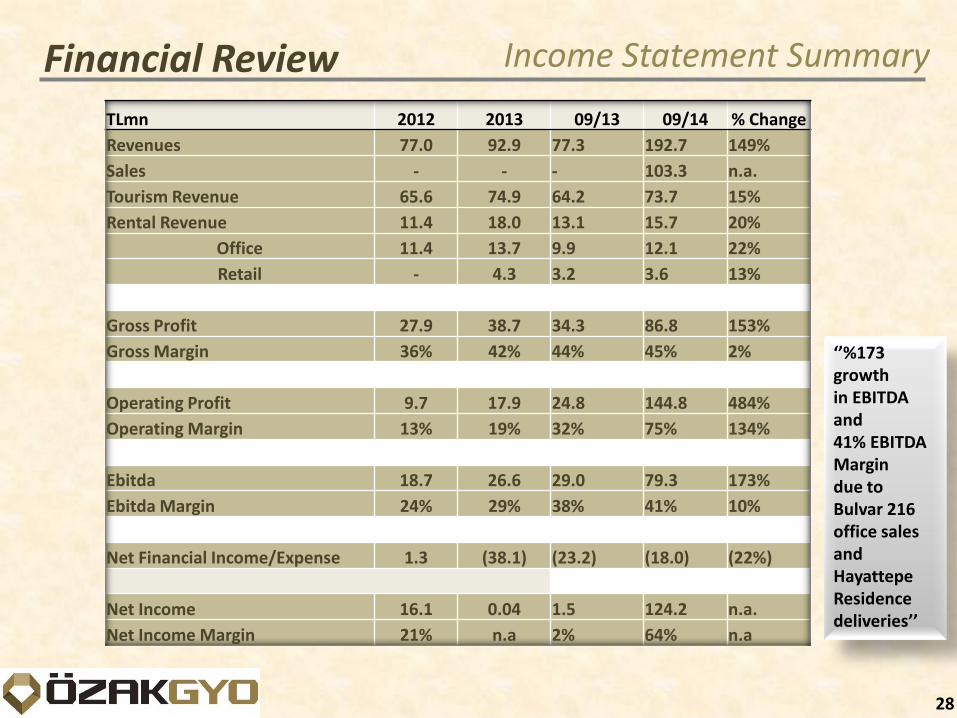
Financial Review Income Statement Summary
TLmn 2012 2013 09/13 09/14 % Change
Revenues 77.0 92.9 77.3 192.7 149%
Sales - - - 103.3 n.a.
Tourism Revenue 65.6 74.9 64.2 73.7 15%
Rental Revenue 11.4 18.0 13.1 15.7 20%
Office 11.4 13.7 9.9 12.1 22%
Retail - 4.3 3.2 3.6 13%
Gross Profit 27.9 38.7 34.3 86.8 153%
Gross Margin 36% 42% 44% 45% 2%
Operating Profit 9.7 17.9 24.8 144.8 484%
Operating Margin 13% 19% 32% 75% 134%
Ebitda 18.7 26.6 29.0 79.3 173%
Ebitda Margin 24% 29% 38% 41% 10%
Net Financial Income/Expense 1.3 (38.1) (23.2) (18.0) (22%)
Net Income 16.1 0.04 1.5 124.2 n.a.
Net Income Margin 21% n.a 2% 64% n.a
‘’%173 growth in EBITDA and 41% EBITDA Margin due to Bulvar 216 office sales and Hayattepe Residence deliveries’’

29
Financial Review Balance Sheet Summary
TLmn 2012 2013 09/13 09/14 % Change
Cash&Cash Equivalents 41.9 125.2 45.4 98.9 118.0%
Total Assets 872.3 1,277.9 1,124.7 1,511.5 34.4%
Current Assets 140.0 412.9 280.8 360.7 28.5%
Non-Current Assets 732.4 865.0 843.9 1,150.8 36.4%
Total Liabilities 202.7 610.8 467.2 803.1 71.9%
ST Liabilities* 63.6 339.8 213.5 501.5 134.9%
LT Liabilities 139.1 271.0 253.7 301.6 18.9%
Total Financial Debt 109.8 303.3 259.0 395.3 52.6%
ST Financial Debt 38.2 150.3 112.1 256.3 128.6%
LT Financial Debt 71.6 153.1 146.9 140.0 (4.7%)
Net Debt 67.9 178.1 213.7 297.5 39.2%
Shareholders' Equity 539.4 532.8 528.8 707.2 33.7%
Net Debt/Equity 13% 33% 40% 42% 4.1%
Net Debt/Total Assets 8% 14% 19% 20% 3.6%
*including TL172mn Hayattepe Residence Pre-Sales Worth to note that ST liabilities should be considered as TL329mn inQ4’14 following the deliveries…

Financial Review
30
Revenue vs.EBITDA
66.0 65.6 74.9 91.0
10.5 11.4 13.7
377.0
4.3
2011 2012 2013 2014E
Retail Real Estate Tourism
76.5
5.0X
77.0 92.9
468.1 Revenues (Yearly)
TLm
n
20.0 10.0 18.0 32.0
8.0 9.0 5.0
144.0
4.0
2011 2012 2013 2014E
Retail Real Estate Tourism
TLm
n
28.0
6.5X
19.0 27.0
176.0 EBITDA (Yearly)
TLm
n
‘’Expected impact of Bulvar 216 and Hayattepe Projects deliveries’’
150%
77.2
192.7
TLm
n
09/14 09/13
Revenues (09/14 vs 09/13)
29.0
79.3 173%
09/14 09/13
EBITDA (09/14 vs 09/13)
‘’Strong steady growth in all segments ’’

Financial Review
31
EBITDA & EBITDA Margin
18.7
15.9
Margin 24%
Margin 28%
(5.2)
1.7 (4.5)
26.6
2013 vs. 2012
EBITDA 2012
in Revenue
in COGS*
in G&A*
in S&M*
EBITDA 2013
EBITDA 42%
116
(62.8)
(4.4)
(0.6)
79.3
29.0
09/14 vs 09/13
Margin 38%
Margin 41%
EBITDA 09/13
in Revenue
in COGS*
in G&A*
in S&M*
EBITDA 09/14
EBITDA 173%
TLm
n
TLm
n
*Excluding depreciation and amortization

32
Net Income & Net Income Margin
Margin 2%
Margin 64%
Net Income 09/13
in Operating Profit
in Other Expense
in Financial Expense
in Other Income
Net Income 09/14
Net Income & Net Income Margin (09/14 vs 09/13)
in Financial Income
in Taxation
Ozak REIT
1.5
47.3
(5.3)
124.2
(1.9) 10.4
-Bulvar 216 & Gokturk Land revaluation of TL68mn -Izmir Project downpayment’s İnterest
TL12mn GA and S&M expense for Bulvar 216 & Hayattepe Projects
- TL0.8mn in Interest Expense - TL1.8mn in FX expense
- TL2.7mn in Interest Income
- TL7.8mn in FX Income
(5.5) 78.0
TLm
n
- TL14.3mn in Interest Expense
- TL9.0mn in FX expense

Financial Review
33
Balance Sheet Components
Assets Liabilities
TL1.5bn Total Balance Sheet Size as of 09/2014
Cash&CashEquivalents
Other CurrentAssets
Inventories
Other Fixed Assets
InvestmentProperty
6,5%
3,7%
13,6%
35,2%
40,9%
Other FixedLiabilities
Other CurrentLiabilities
ST FinancialLiabilities
LT FinancialLiabilities
Equity
15,4%
11,5%
17,0%
9,3%
46,9%

Financial Review
34
Debt Profile Bank Loan Repayment Schedule
35%
38.2 38.7 32.9
As of December 31, 2012
35% 30%
1 Year 1-2 Years 2 Year
As of December 31, 2013 As of September 30, 2014
149.6 153.1
1 Year 1-2 Years
51% 49%
TLm
n
TLm
n
TLm
n 255.3 140.0
35% 65%
1 Year 1-2 Years
82.5
178.0 220.0
82.5
135.0
TLm
n
%share
87.0 68.0
302.5
395.3
2011 2012 2013 3Q’14
Total Debt Development Debt Split by Project Type
45%
21%
34%
Other Izmir Project Kazlicesme ProjectOther Izmir Project Kazlicesme Project

35
Net Debt Dynamics
Net Debt QoQ
Change in Net Debt , 09/14 vs 09/13
221.8
213.7
53.6
144.2
297.5
TLm
n
TLm
n
Net Debt 09/13 in S.T. Financial Debt
in Cash Net Debt 09/14
6.8
in L.T. Financial Debt
‘’YoY Net Debt increased mainly due to loans of upcoming projects; Izmir & Kazlicesme’’
1Q’14 2H’14 09/14
361.4 297.5
297.5 213.7
Net Debt 09/14 vs 09/13
TLm
n
‘’QoQ Net Debt decreased 6% due to USD25mn loan down payments of Hayattepe & Bulvar216 ’’
Ozak REIT
6% 18% 39%
09/14 09/13

Financial Review
36
FX Exposure
121.7 USD 94.5 Net USD 74.2 Net USD 32.6 Net
95.8 74.6
27.1 41.9 21.6 1Q’14 3Q’14 1H’14
1Q’14 3Q’14 1H’14
7.4 4.0 1.2
1.4 0.2 0.3
EUR 6.0 Net EUR 3.7 Net EUR 1.0 Net
USD Short Position
Liabilities US$mn
Assets US$mn
Liabilities EURmn
Assets EURmn
EUR Long Position
Balance Sheet Items (in mn) USD EUR USD EUR USD EUR Cash&Cash Equivalents 27.1 1.4 16.5 2.4 31.9 0.2 Trade Receivables - - 5.1 1.6 6.3 1.0
Total Assets 27.1 1.4 21.6 4.0 41.9 1.2
Trade Payebles - 0.2 1.9 0.3 7.3 0.2 S.T. Fin. Liabilities 62.0 - 82.4 - 61.1 - L.T. Fin. Liabilities 36.4 0.7 11.6 - 6.2 -
Other Liabilities 23.2 6.5 - - - - Total Liabilities 121.7 7.4 95.8 0.3 74.6 0.2
Net FX Position (94.5) (6.0) (74.2) 3.7 (32.6) 1.0

Projections
37

38
Cash Flow Projections Projections TLmn 2014 2015 2016 2017 2018 2019 2020 Cash at the Beginning of the Term 83.1 8.5 9.3 244.5 475.1 745.7 988.5
Revenues 259.3 422.6 775.6 815.5 653.9 461.4 676.3
Home Sales Revenue 108.9 244.8 160.8 256.3 203.5 99.1 43.8
Office Sales Revenue 116.8 11.1 89.3 91.4 60.4 65.7 26.3
Home-Office Sales Revenue - 6.0 119.1 148.8 168.4 131.4 41.0
Residence Sales Revenue - 99.2 172.1 178.5 90.1 20.3 -
Store and Retail Sales Revenue 31.4 5.0 188.8 83.5 45.1 1.4 448.8
Store and Mall Rental Revenue 2.2 11.0 - - 5.1 49.9 21.7
Office Rental Revenue - 19.5 19.5 19.5 19.5 19.5 19.5
Hotel Rental Revenue - 26.0 26.0 37.5 61.8 74.1 75.2
Loans 137.5 79.2 - - - - -
Hayattepe VAT Receivables - 13.1 - - - - -
Total Cash Inflow 396.8 514.9 775.6 815.5 653.9 461.4 676.3
Construction Costs 114.1 200.3 521.8 713.7 352.4 191.3 16.2
Operational Expenses 13.9 16.1 27.1 30.5 26.3 27.5 23.6
Loan and Interest Payments 144.4 277.7 79.2 - - - -
Other (Payments)/Collections (199.1) (19.9) 87.8 103.2 (4.6) - -
Total Cash Outflow 73.3 474.2 715.9 847.4 374.1 218.8 39.8
Total Cash at the end of the Term 8.5 9.3 244.5 475.1 745.7 988.5 1,625.1

39
CAPEX Projections Projections
TLmn Projects Before 2014 2014 2015 2016 2017 2018 2019 2020
Total Budget
Completed Projects
34 Portall Plaza 53.0 53.0
Is Istanbul 34 21.8 21.8
Metro Gross Market 34.5 34.5
Ela Quality Resort 123.9 123.9
Ongoing Projects
Hayattepe Project 132.1 68.1 9.8 210.0
Bulvar 216 Project 95.1 29.9 125.0
Upcoming Projects
Izmir Project 109.1 183.1 260.8 187.5 184.4 16.1 941.0
Kazlicesme Project 102.7 330.0 471.0 286.1 10.2 1,200.0
Balmumcu Project 1.5 71.7 82.7 155.9
Demre Project 30.4 56.3 86.7
Didim Project 48.4 89.5 137.9
TOTAL 460.4 98.0 223.1 633.2 934.4 529.9 194.6 16.1 3,089.7
98.0 223.1
633.2 934.4
529.9 194.6
16.1
Capex and Capex/Sales Ratio
TLm
n
Capex Capex/Sales
22.0%
101.4%
260.6%
321.1%
23.6%
16.6%
6.9%
• As of 2020, TL3.1bn CAPEX will have been registered since inception
• Starting from 2015, CAPEX will amount to TL2.5bn by 2020
• 54% CAPEX/Sales Ratio bw ‘14-20’
2014 2017 2016 2019 2018 2015 2020

40
Revenue & EBITDA Projections Projections Revenue Projections
EBITDA Projections
EBITDA Margin Projections
2014 2017 2016 2019 2018 2015 2020
377
2,072 91
127
93
147
96
160
131 968
205
24
211
176
Kazlicesme &
Alsancak TL944.2mn
Kazlicesme &
Alsancak TL963.7mn 468
220 243 291
2.248
291
1.173 Real Estate Tourism
Real Estate Tourism
144
911 32
50
32
81
33
72
49 419
75
21
77
65
176
82 114 121
976
98
494
2014 2017 2016 2015 2019 2018 2020
Kazlicesme &
Alsancak TL399.5mn
Kazlicesme &
Alsancak TL857.6mn
2014 2017 2016 2015 2019 2018 2020
38% 37% 47% 42% 34% 43% 42%
‘’Significant jump in 2018 &
2019 stems from the
completion of upcoming
projects; Istanbul
Kazlicesme & Izmir
Alsancak’’
TLm
n
TLm
n

Appendix
41

42
Appendix REIT Sector Benchmarking
REITs’ NAV Breakdown by Business Profile REITs’ NAV Breakdown by Asset Type
Project Developer REITs by Mcap*
TLm
n
1.530 800
510 460 195 150 110 33 63
Torunlar Is Sinpas OZAK Alarko Nurol Ozderici Yapi Kredi Koray
Pera
*As of 09/14
34%
25%
2%
39%
Portfolio REITs
Project DeveloperREITs
OZAK Reit
Emlak Konut
33%
24%
2%
41%
OngoingProjects
Land Bank
Subsidiaries
CompletedProjects

43
Appendix Istanbul Office Market 3Q‘14 2
3.0
%
13
.7%
13
.5%
6.4
%
21
.8%
10
.5%
CBD out of CBD-Europe out of CBD-Asia
General Vacancy Rates
38
.5
33
.1
28
.6
31
.5
33
.5
30
.0
25
.0
15
.6
22
.5
22
.5
18
.0
22
.0
20
.1
23
.2
15
.4
16
.0
19
.6
25
.6
14
.0
11
.0
17
.5
16
.2
13
.1
14
.5
Levent Etiler Maslak Zincirlikuyu/Esentepe/
Gayrettepe
Beşiktaş/Balmumcu
Taksim/Nişantaşı
Şişli/ FulyaOtim
Airport Area Kozyatağı Altunizade Kavacık Ümraniye
CBD Out of CDB-Europe Out of CBD-Asia
Average Rent Rates By Districts
US
$ m
²/ m
on
th
Class A Office Buildings Class B Office Buildings
Class A Office Buildings Class B Office Buildings
Besiktas/ Balmumcu
Zincirlikuyu/ Esentepe/ Gayrettepe
Levent Etiler Maslak Taksim/ Nisantasi
Sisli/ Fulya Otim
Airport Area Kozyatagi Altunizade Kavacik Umraniye
CBD Out of CBD-Europe Out of CBD-Asia
Class A Office Buildings Class B Office Buildings
Class A Office Buildings Class B Office Buildings
Distribution of Total Office Space by Region
33%
8% 40%
19% Out of CBD -Asia
Emerging Districts
CBD
Out of CBD - Europe
Source : Propin

44
Appendix Sector Outlook
İstanbul 20%
Ankara 11%
İzmir 6%
Antalya 5%
Residential Sales Breakdown by Province
141 154 169 167 235 175 162
104
35
105
40
138
72
105
55
95
51
118
45
106
46
2009 09/14 09/13 2013 2012 2011 2010
555 708 702 1157 862 831 607
Istanbul Ankara Izmir Turkey Total
Other 58%
Residential Sales(‘000)
Mortgage Loans (mnTL) and Interest Rates (%)
141 169 167 235
110 115
39 45 61
75 86
2009 2011 2010
32
119
2008 2012 2013 1H’14 09/14 2007
21%
10%
11% 12%
14%
14% 10%
12%
22%
TLm
n

Appendix Income Statement
45
TLmn 2012 2013 09/13 09/14
Net Sales 77.0 93.0 77.3 192.7 Cost of Sales (49.2) (54.2) (42.9) (105.8) Gross Profit/Loss 27.9 38.7 34.3 86.9
Operational Expenses (18.1) (20.8) (13.2) (18.3) G & A (8.1) (6.3) (4.4) (13.3)
S & M (10.0) (14.5) (8.8) (5.0) Operational Income 9.8 17.9 21.1 68.6 Other Income 15.9 29.7 15.2 93.3
Other Expenses (10.1) (5.2) (11.5) (17.0) Net Financial Expenses 1.3 (38.1) (23.2) (18.0)
Profit/Loss Before Tax 16.9 4.4 1.7 126.8 Tax Expenses (0.8) (4.3) 0.3 (2.2) Minority Share 1.7 4.3 3.5 0.2
Net Profit 14.5 (4.2) 1.9 124.2
Earnings per Share 0.092 (0.027) (0.010) 0.79

Appendix Balance Sheet
46
TLmn 2012 2013 09/13 09/14 Cash and Cash Equivalents 41.9 125.2 45.3 98.9
Trade & Other Receivables 6.3 25.6 23.3 23.1
Inventory 83.0 221.4 191.3 205.5 Prepaid Expenses 2.1 7.0 6.6 7.3
Other Current Assets 6.8 33.8 14.1 25.9
Current Assets 140.1 413.0 280.6 360.7
Trade & Other Receivables 0.0 0.1 0.1 0.1 Equity Investments 28.8 0.0 0.0 0.0
Investment Property 374.0 457.3 450.2 618.9
Tangible Fixed Assets 299.9 296.7 282.9 294.4
Intangible Fixed Assets 14.6 23.7 14.4 15.3
Prepaid Expenses 11.0 82.6 75.0 221.5
Other Non-Current Assets 4.1 4.6 5.0 0.3
Non-Current Assets 732.4 864.9 827.5 1,150.4 Total Assets 872.3 1,277.9 1,124.7 1,511.2
Financial Debt 24.6 34.2 37.5 89.2
Short-term proportion of long-term debt 13.6 116.1 74.6 167.2
Trade & Other Payables 12.1 23.6 26.0 69.7 Deferred Revenues 11.9 163.7 73.1 173.7
Other Current Liabilities 1.4 2.2 2.3 1.5
Current Liabilities 63.6 339.8 213.4 501.3
Financial Debt 71.6 153.1 146.9 140.0
Trade & Other Payables 50.2 42.5 92.3
Other Non-Current Liabilities 67.5 67.7 64.3 69.4
Non-Current Liabilities 139.1 271.0 253.7 301.7 Equity 657.8 667.1 657.3 708.2
Total Liabilities 872.3 1,277.9 1,124.7 1,511.2

47
Appendix Share Performance & Data
Stock Data
Price at 09.30.2014 TL2.92
Mcap as of 09.30.14 TL460.0mn
Effective Free Float Mcap TL22.7mn
Price/Book 0.64
Price/Earnings 3.71
1.25
1.50
1.75
2.0
2.25
2.50
2.75
3.0
3.25
Feb
-12
Ap
r-1
2
Jun
-12
Sep
-12
De
c-1
2
Sep
-1
4
Jun
-1
4
Mar
-1
4
De
c -1
3
Sep
-1
3
Jun
-1
3
Mar
-1
3
Ozak REIT
BIST-100
REIT Sector

Appendix Disclaimer
48
Certain statements contained herein should be construed solely as "forward-looking” manifestations. Such expressions most often than not are denoted via words such as "estimate," "project, "predict," "believe," "expect," "anticipate," "potential," "plan," "goal," “will” or any other explicit term implying uncertainty and ambiguity of future events. Hence, such vocabulary pertaining to an imprecise point in time-horizon are based on our current expectations, estimates and assumptions, and are inherently exposed to specific risks and improbabilities. Although OZAK REIT purports that the evaluation inputs incorporated into such proclamations are deemed reasonable at this time, actual results could differ materially from those originally projected or assumed. Owing to a plethora of variables, therefore, OZAK REIT disclaims any obligation to update such statements, as we also caution against undue reliance on such material.