Investor Presentation - · PDF fileInvestor Presentation ... details on RM million 1Q FY2017...
58
0 www.maybank.com Investor Presentation Financial Results First Quarter FY2017 ended 31 March 2017 25 May 2017 Humanising Financial Services
-
Upload
trinhxuyen -
Category
Documents
-
view
216 -
download
0
Transcript of Investor Presentation - · PDF fileInvestor Presentation ... details on RM million 1Q FY2017...
0www.maybank.com
Investor Presentation
Financial ResultsFirst Quarter FY2017 ended 31 March 2017
25 May 2017
Humanising Financial Services
1
Table of Contents
Executive Summary 2
Results Overview 5
Prospects & Outlook 20
Appendix:
1. Financial Performance 23
2. Community Financial Services 31
3. Global Banking 36
4. Maybank Singapore 41
5. Maybank Indonesia 45
6. Other segments 50
7. Affiliates 55
Financial Results: 1Q FY2017 ended 31 March 2017
2
Improved earnings
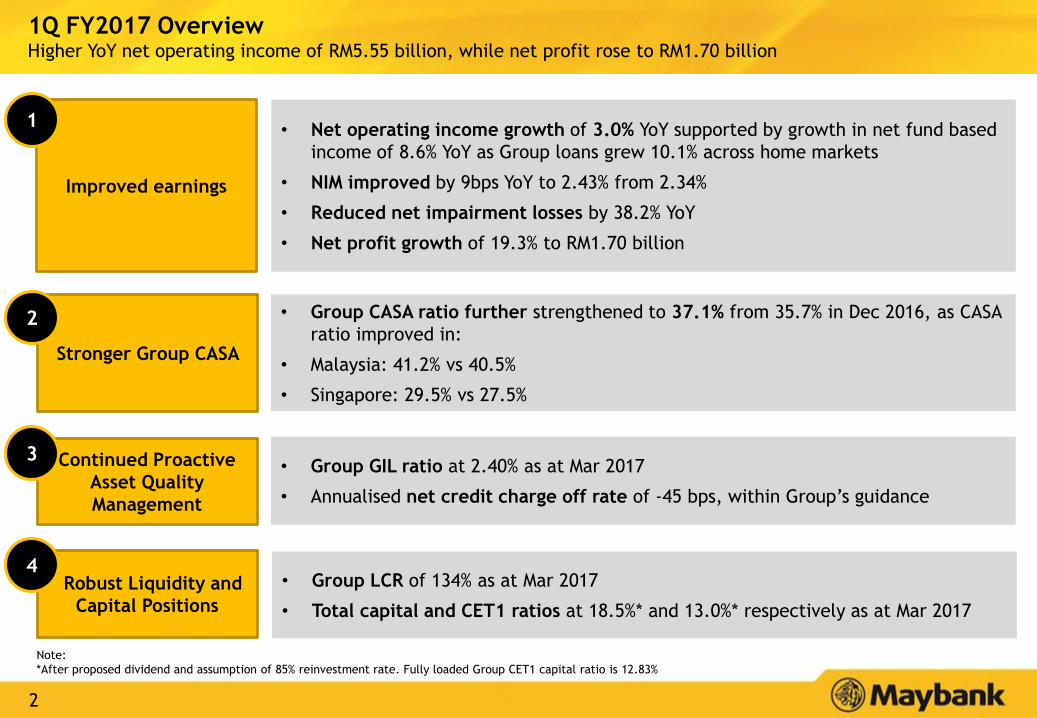
1Q FY2017 OverviewHigher YoY net operating income of RM5.55 billion, while net profit rose to RM1.70 billion
• Net operating income growth of 3.0% YoY supported by growth in net fund based
income of 8.6% YoY as Group loans grew 10.1% across home markets
• NIM improved by 9bps YoY to 2.43% from 2.34%
• Reduced net impairment losses by 38.2% YoY
• Net profit growth of 19.3% to RM1.70 billion
1
• Group GIL ratio at 2.40% as at Mar 2017
• Annualised net credit charge off rate of -45 bps, within Group’s guidance
Continued Proactive
Asset Quality
Management
• Group LCR of 134% as at Mar 2017
• Total capital and CET1 ratios at 18.5%* and 13.0%* respectively as at Mar 2017
Robust Liquidity and
Capital Positions
4
Stronger Group CASA
2 • Group CASA ratio further strengthened to 37.1% from 35.7% in Dec 2016, as CASA
ratio improved in:
• Malaysia: 41.2% vs 40.5%
• Singapore: 29.5% vs 27.5%
3
Note:
*After proposed dividend and assumption of 85% reinvestment rate. Fully loaded Group CET1 capital ratio is 12.83%
3
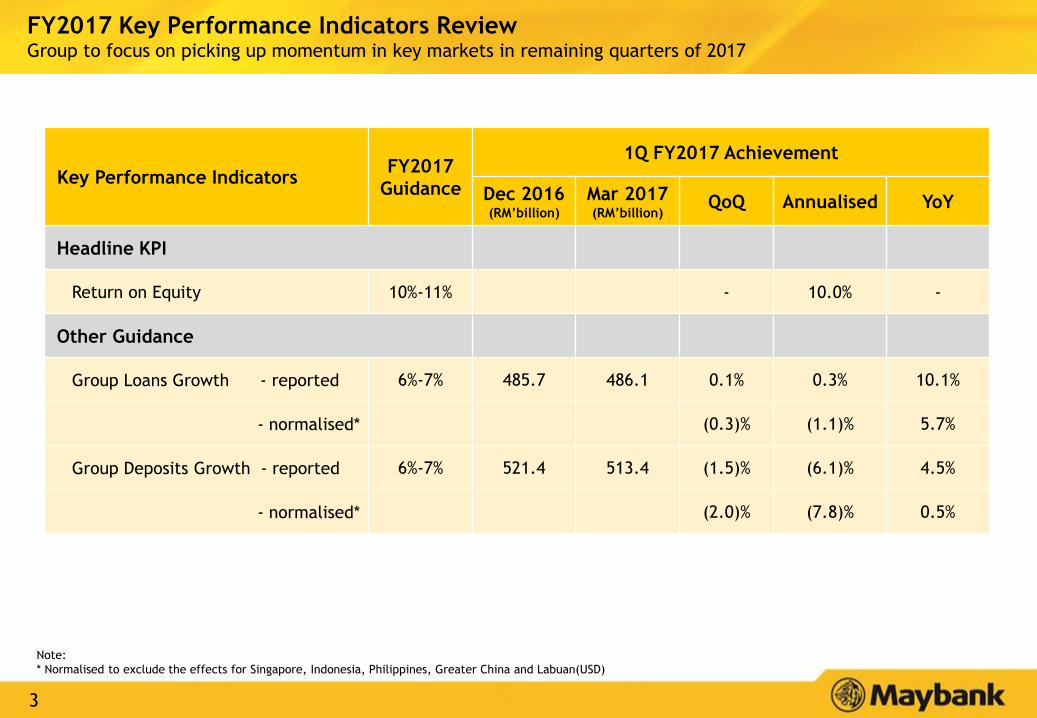
FY2017 Key Performance Indicators ReviewGroup to focus on picking up momentum in key markets in remaining quarters of 2017
Key Performance IndicatorsFY2017
Guidance
1Q FY2017 Achievement
Dec 2016(RM’billion)
Mar 2017(RM’billion)
QoQ Annualised YoY
Headline KPI
Return on Equity 10%-11% - 10.0% -
Other Guidance
Group Loans Growth - reported 6%-7% 485.7 486.1 0.1% 0.3% 10.1%
- normalised* (0.3)% (1.1)% 5.7%
Group Deposits Growth - reported 6%-7% 521.4 513.4 (1.5)% (6.1)% 4.5%
- normalised* (2.0)% (7.8)% 0.5%
Note:
* Normalised to exclude the effects for Singapore, Indonesia, Philippines, Greater China and Labuan(USD)
4
Table of Contents
Executive Summary 2
Results Overview 5
Prospects & Outlook 20
Appendix:
1. Financial Performance 23
2. Community Financial Services 31
3. Global Banking 36
4. Maybank Singapore 41
5. Maybank Indonesia 45
6. Other segments 50
7. Affiliates 55
Financial Results: 1Q FY2017 ended 31 March 2017
5
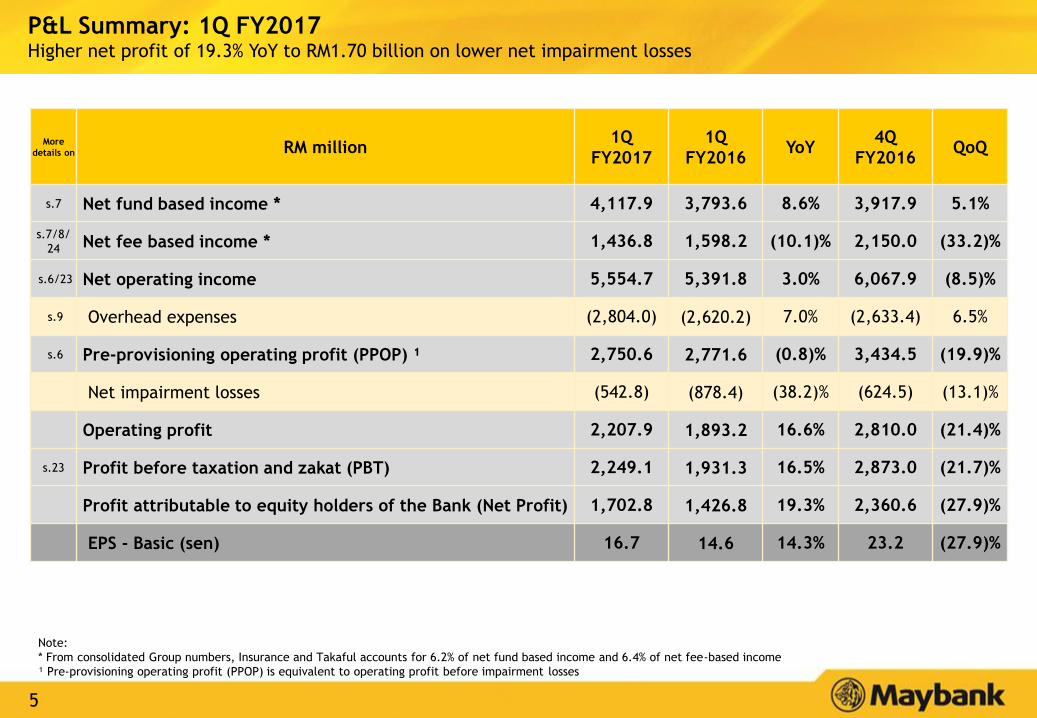
P&L Summary: 1Q FY2017Higher net profit of 19.3% YoY to RM1.70 billion on lower net impairment losses
More
details on RM million1Q
FY2017
1Q
FY2016YoY
4Q
FY2016QoQ
s.7 Net fund based income * 4,117.9 3,793.6 8.6% 3,917.9 5.1%
s.7/8/
24 Net fee based income * 1,436.8 1,598.2 (10.1)% 2,150.0 (33.2)%
s.6/23 Net operating income 5,554.7 5,391.8 3.0% 6,067.9 (8.5)%
s.9 Overhead expenses (2,804.0) (2,620.2) 7.0% (2,633.4) 6.5%
s.6 Pre-provisioning operating profit (PPOP) ¹ 2,750.6 2,771.6 (0.8)% 3,434.5 (19.9)%
Net impairment losses (542.8) (878.4) (38.2)% (624.5) (13.1)%
Operating profit 2,207.9 1,893.2 16.6% 2,810.0 (21.4)%
s.23 Profit before taxation and zakat (PBT) 2,249.1 1,931.3 16.5% 2,873.0 (21.7)%
Profit attributable to equity holders of the Bank (Net Profit) 1,702.8 1,426.8 19.3% 2,360.6 (27.9)%
EPS - Basic (sen) 16.7 14.6 14.3% 23.2 (27.9)%
Note:
* From consolidated Group numbers, Insurance and Takaful accounts for 6.2% of net fund based income and 6.4% of net fee-based income
¹ Pre-provisioning operating profit (PPOP) is equivalent to operating profit before impairment losses
6
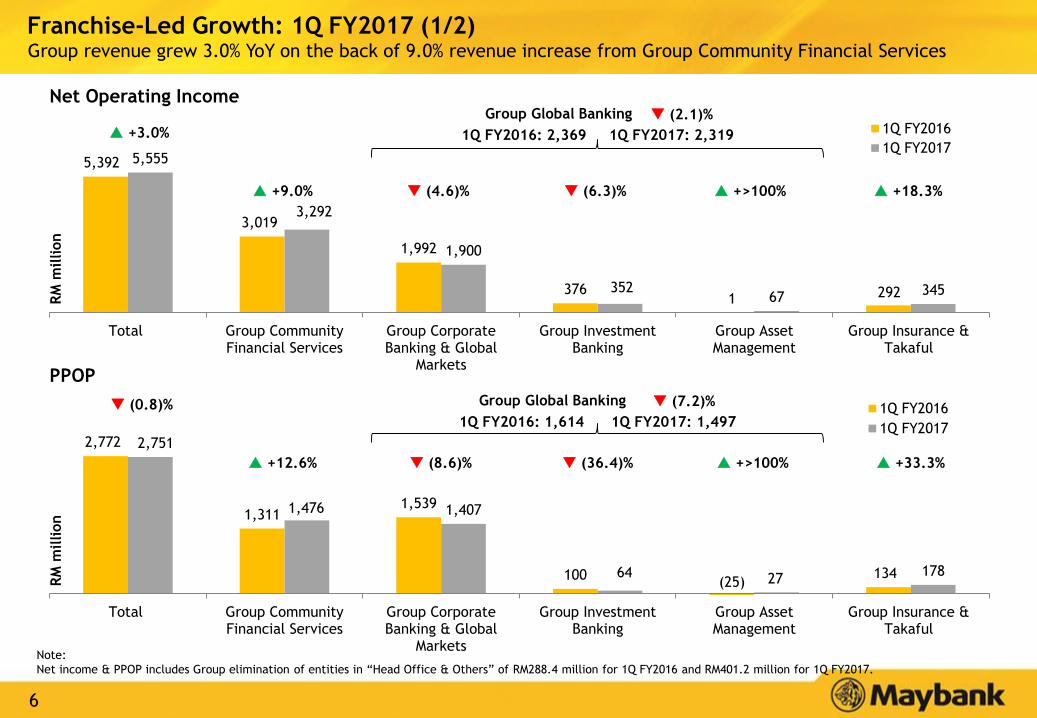
2,772
1,3111,539
100(25)
134
2,751
1,476 1,407
64 27178
Total Group CommunityFinancial Services
Group CorporateBanking & Global
Markets
Group InvestmentBanking
Group AssetManagement
Group Insurance &Takaful
1Q FY2016
1Q FY2017
5,392
3,019
1,992
3761 292
5,555
3,292
1,900
35267
345
Total Group CommunityFinancial Services
Group CorporateBanking & Global
Markets
Group InvestmentBanking
Group AssetManagement
Group Insurance &Takaful
1Q FY2016
1Q FY2017
Franchise-Led Growth: 1Q FY2017 (1/2)Group revenue grew 3.0% YoY on the back of 9.0% revenue increase from Group Community Financial Services
Net Operating Income
RM
million
RM
million
PPOP
+3.0%
+9.0% (4.6)% (6.3)% +18.3% +>100%
Group Global Banking (7.2)%
1Q FY2016: 1,614 1Q FY2017: 1,497
Group Global Banking (2.1)%
1Q FY2016: 2,369 1Q FY2017: 2,319
(0.8)%
+12.6% (8.6)% (36.4)% +33.3% +>100%
Note:
Net income & PPOP includes Group elimination of entities in “Head Office & Others” of RM288.4 million for 1Q FY2016 and RM401.2 million for 1Q FY2017.
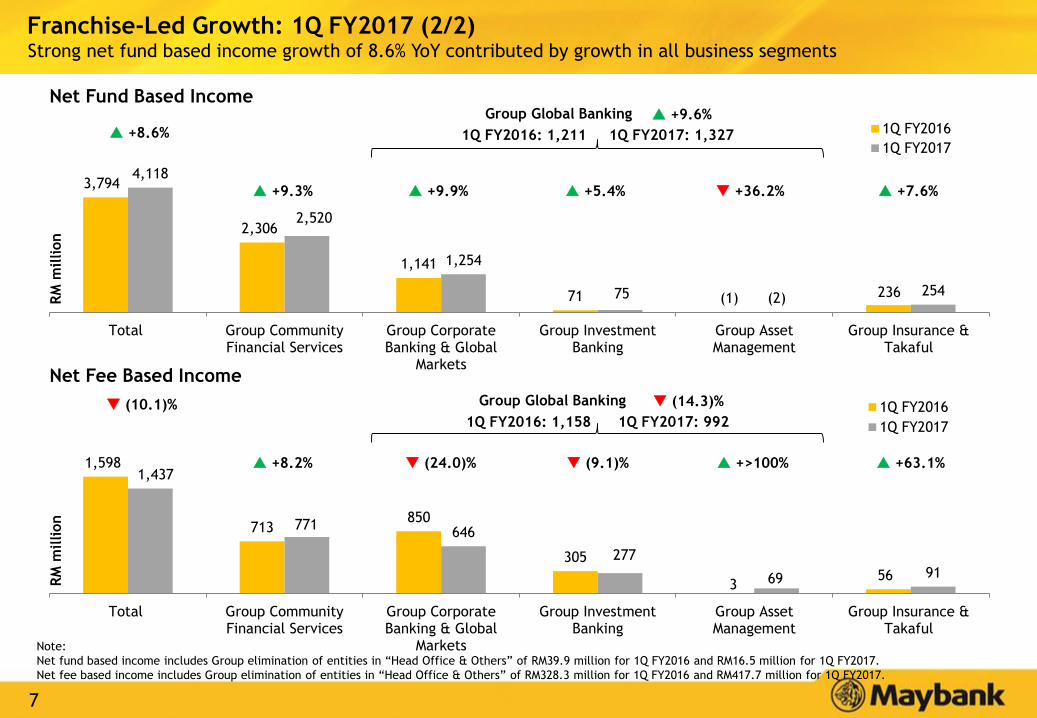
7
1,598
713850
305
356
1,437
771646
277
69 91
Total Group CommunityFinancial Services
Group CorporateBanking & Global
Markets
Group InvestmentBanking
Group AssetManagement
Group Insurance &Takaful
1Q FY2016
1Q FY2017
3,794
2,306
1,141
71 (1) 236
4,118
2,520
1,254
75 (2)254
Total Group CommunityFinancial Services
Group CorporateBanking & Global
Markets
Group InvestmentBanking
Group AssetManagement
Group Insurance &Takaful
1Q FY2016
1Q FY2017
Net Fund Based Income
RM
million
RM
million
Net Fee Based Income
+8.6%
+9.3% +9.9% +5.4% +7.6% +36.2%
Group Global Banking (14.3)%
Group Global Banking +9.6%
1Q FY2016: 1,211 1Q FY2017: 1,327
(10.1)%
+8.2% (24.0)% (9.1)% +63.1% +>100%
Franchise-Led Growth: 1Q FY2017 (2/2)Strong net fund based income growth of 8.6% YoY contributed by growth in all business segments
1Q FY2016: 1,158 1Q FY2017: 992
Note:
Net fund based income includes Group elimination of entities in “Head Office & Others” of RM39.9 million for 1Q FY2016 and RM16.5 million for 1Q FY2017.
Net fee based income includes Group elimination of entities in “Head Office & Others” of RM328.3 million for 1Q FY2016 and RM417.7 million for 1Q FY2017.
8
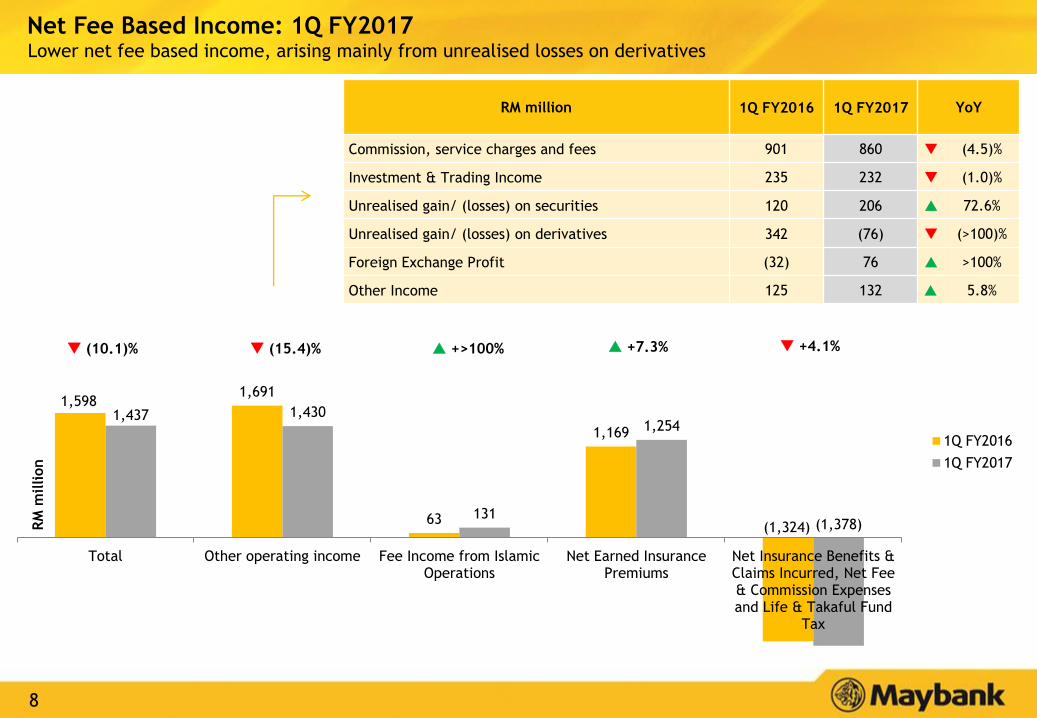
1,598 1,691
63
1,169
(1,324)
1,437 1,430
131
1,254
(1,378)
Total Other operating income Fee Income from IslamicOperations
Net Earned InsurancePremiums
Net Insurance Benefits &Claims Incurred, Net Fee& Commission Expensesand Life & Takaful Fund
Tax
1Q FY2016
1Q FY2017
RM
million
RM million 1Q FY2016 1Q FY2017 YoY
Commission, service charges and fees 901 860 (4.5)%
Investment & Trading Income 235 232 (1.0)%
Unrealised gain/ (losses) on securities 120 206 72.6%
Unrealised gain/ (losses) on derivatives 342 (76) (>100)%
Foreign Exchange Profit (32) 76 >100%
Other Income 125 132 5.8%
Net Fee Based Income: 1Q FY2017Lower net fee based income, arising mainly from unrealised losses on derivatives
(10.1)% (15.4)% +>100% +7.3% +4.1%
9
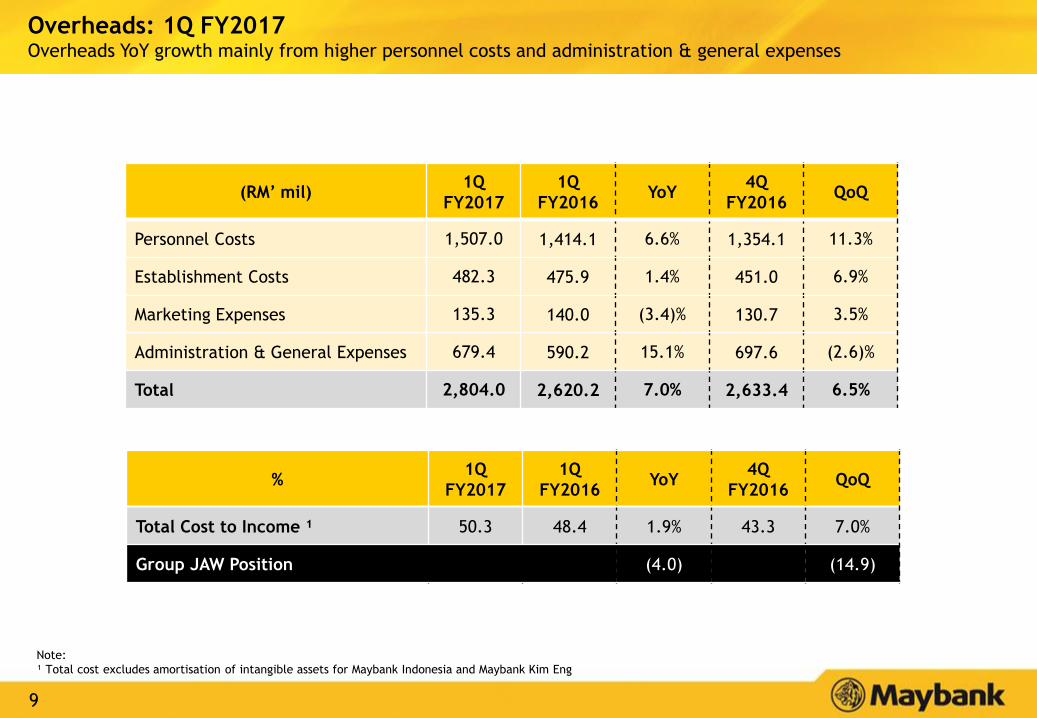
(RM’ mil)1Q
FY2017
1Q
FY2016YoY
4Q
FY2016QoQ
Personnel Costs 1,507.0 1,414.1 6.6% 1,354.1 11.3%
Establishment Costs 482.3 475.9 1.4% 451.0 6.9%
Marketing Expenses 135.3 140.0 (3.4)% 130.7 3.5%
Administration & General Expenses 679.4 590.2 15.1% 697.6 (2.6)%
Total 2,804.0 2,620.2 7.0% 2,633.4 6.5%
%1Q
FY2017
1Q
FY2016YoY
4Q
FY2016QoQ
Total Cost to Income ¹ 50.3 48.4 1.9% 43.3 7.0%
Group JAW Position (4.0) (14.9)
Overheads: 1Q FY2017Overheads YoY growth mainly from higher personnel costs and administration & general expenses
Note:
¹ Total cost excludes amortisation of intangible assets for Maybank Indonesia and Maybank Kim Eng
10
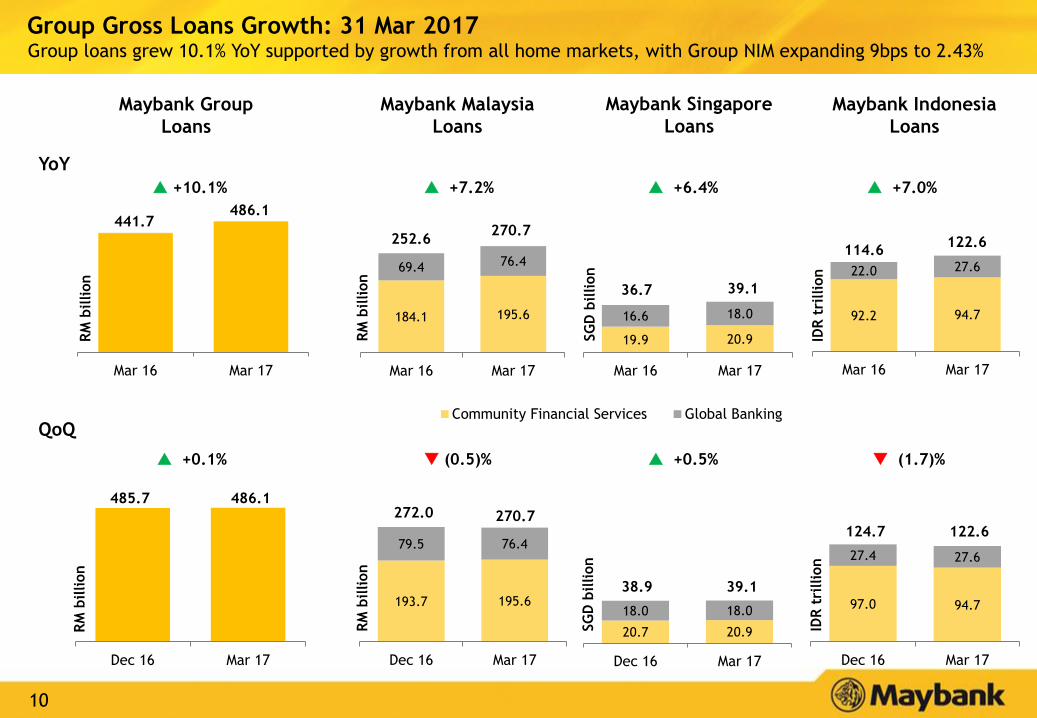
193.7 195.6
79.5 76.4
Dec 16 Mar 17
Community Financial Services Global Banking
485.7 486.1
Dec 16 Mar 17
441.7486.1
Mar 16 Mar 17
Group Gross Loans Growth: 31 Mar 2017Group loans grew 10.1% YoY supported by growth from all home markets, with Group NIM expanding 9bps to 2.43%
184.1 195.6
69.4 76.4
Mar 16 Mar 17
19.9 20.9
16.6 18.0
Mar 16 Mar 17
92.2 94.7
22.0 27.6
Mar 16 Mar 17
Maybank Group
Loans
270.7252.6
39.136.7
122.6114.6
20.7 20.9
18.0 18.0
Dec 16 Mar 17
97.0 94.7
27.4 27.6
Dec 16 Mar 17
270.7272.0
39.138.9
122.6124.7
QoQ
RM
billion
SG
D b
illion
IDR
tri
llio
n
RM
billion
RM
billion
SG
D b
illion
IDR
tri
llio
n
YoY
Maybank Malaysia
Loans
Maybank Singapore
Loans
Maybank Indonesia
Loans
(0.5)% +0.5% (1.7)% +0.1%
+7.2% +6.4% +7.0% +10.1%
RM
billion
11
521.4 513.4
Dec 16 Mar 17
121.9 124.4
163.5 159.5
15.9 18.5
Dec 16 Mar 17
CASA Fixed Deposits Others
12.5 12.9
32.0 29.4
1.1 1.3
Dec 16 Mar 17
46.0 43.7
73.3 74.3
Dec 16 Mar 17
115.7 124.4
163.5 159.5
14.9 18.5
Mar 16 Mar 17
9.3 12.9
35.4 29.4
1.0 1.3
Mar 16 Mar 17
42.9 43.7
72.3 74.3
Mar 16 Mar 17
491.5 513.4
Mar 16 Mar 17
Group Deposits Growth: 31 Mar 2017Continued focus by Group on CASA growth across home markets
+ 0.3% (4.2)% (1.1)% (1.5)%
RM
billion
RM
billion
SG
D b
illion
IDR
tri
llio
n
302.3301.3
43.745.6118.0119.3
Maybank Group
Deposits
Maybank Malaysia
Deposits
Maybank Singapore
Deposits
Maybank Indonesia
Deposits
+2.8% (4.6)% + 2.5% +4.5%
RM
billion
RM
billion
SG
D b
illion
IDR
tri
llio
n
302.3294.1
43.745.8
118.0115.2
YoY
QoQ
12
89.9% 88.5% 90.9% 93.2% 94.7%
33.3% 33.4% 34.5%35.7%
37.1%
31.8% 32.0% 32.9%34.3% 35.4%
25.0%
30.0%
35.0%
40.0%
45.0%
50.0%
Mar 16 Jun 16 Sep 16 Dec 16 Mar 17
LDR CASA CASA (without IA)
90.2% 89.1%96.0% 91.3% 90.6%
39.4% 38.2% 40.2% 40.5% 41.2%
36.9% 35.9% 37.5% 38.0% 38.3%
20.0%
30.0%
40.0%
50.0%
60.0%
70.0%
80.0%
0.0%
10.0%
20.0%
30.0%
40.0%
50.0%
60.0%
70.0%
80.0%
90.0%
100.0%
Mar 16 Jun 16 Sep 16 Dec 16 Mar 17
LDR and CASA RatioGroup CASA ratio improved YoY and QoQ, driven by CASA growth in Malaysia and Singapore
SingaporeIndonesia
Group Malaysia
100.1% 104.8% 102.8% 104.5% 103.9%
37.7% 39.3% 38.1% 38.6% 37.0%
87.6% 90.3% 88.0% 88.9% 88.4%
Mar 16 Jun 16 Sep 16 Dec 16 Mar 17
LDR (Bank Level)
80.3% 79.4% 79.1%85.3% 89.5%
20.4% 22.5% 24.5% 27.5% 29.5%
Mar 16 Jun 16 Sep 16 Dec 16 Mar 17
Note:
LDR is based on gross loans over customer deposits, a methodology adopted by Maybank effective January 2016
13
Strong LiquidityGroup LCR of 134% above BNM minimum requirement of 80% for 2017
Objective
Short-term resilience – Adequate level
of high-quality liquid assets to meet
liquidity need for next 30 days under
significant stress scenario
Stock of high quality liquid assets
Net cash outflows over 30-day period
Ratio
BNM Minimum
Requirement
Year LCR
1 Jun 2015 60%
1 Jan 2016 70%
1 Jan 2017 80%
1 Jan 2018 90%
1 Jan 2019 & thereafter
100%
141148
136
152
134
Mar 16 Jun 16 Sep 16 Dec 16 Mar 17
Group Liquidity Coverage Ratio (%)
Liquidity Coverage Ratio
BNM min
requirement
of 80%
14
865.1
981.7
370.3
615.7
542.5
1Q FY2016 2Q FY2016 3Q FY2016 4Q FY2016 1Q FY2017
Allowances for losses on loans
70.1% 70.5%
74.8%
72.0%71.2%*
Loan loss coverage
Allowance for losses on loans
Asset QualityLower YoY and QoQ allowances for loan losses
RM
million
*Loan loss coverage including Regulatory Reserve is 92.3%
GIL Ratio ComponentsMar
2017
Dec
2016
Sep
2016
Jun
2016
Mar
2016
Non Performing Loans
(NPL)1.77% 1.64% 1.35% 1.32% 1.39%
Restructured &
Rescheduled (R&R)0.33% 0.39% 0.52% 0.67% 0.33%
Performing Loans
Impaired Due to
Judgmental/ Obligatory
Triggers (IPL)
0.30% 0.25% 0.35% 0.35% 0.39%
GIL Ratio 2.40% 2.28% 2.22% 2.34% 2.11%
Group Gross Impaired Loans (GIL) Ratio Composition
8,5559,337
11,055 11,658
Dec 2015 Mar 2016 Dec 2016 Mar 2017
Slower QoQ growth in Group GIL volume from a year ago
RM
million
+9.1% +5.4%
15
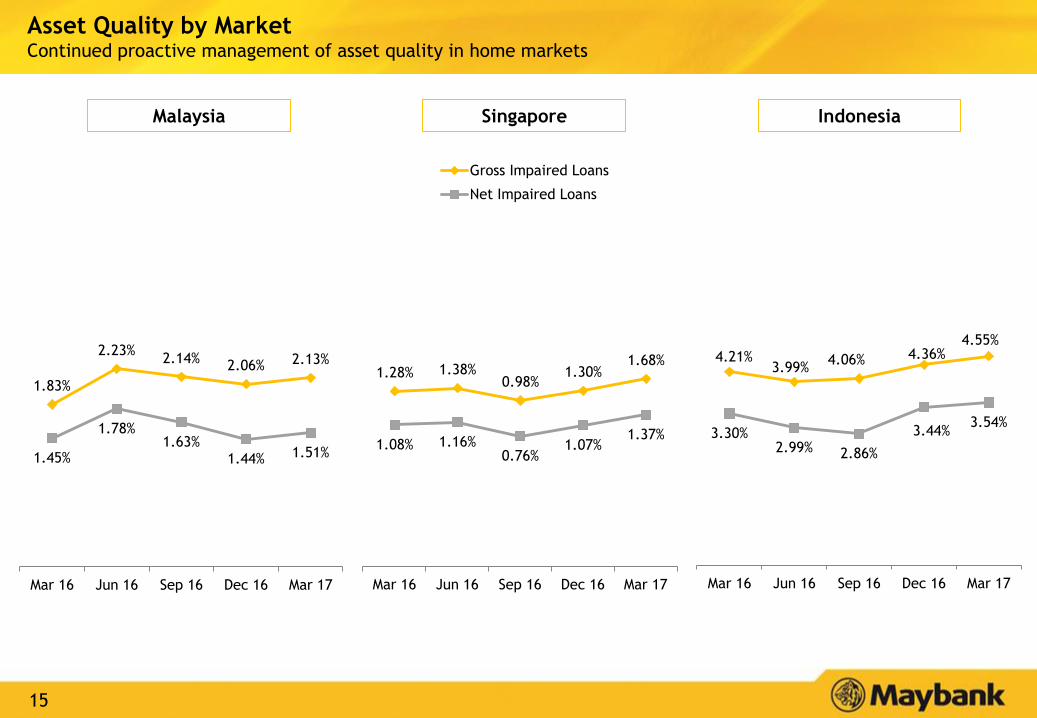
Mar 16 Jun 16 Sep 16 Dec 16 Mar 17
Gross Impaired Loans
Net Impaired Loans
1.28% 1.38%0.98%
1.30%1.68%
1.08% 1.16%0.76%
1.07%1.37%
Asset Quality by MarketContinued proactive management of asset quality in home markets
4.21%3.99%
4.06% 4.36%4.55%
3.30%2.99% 2.86%
3.44%3.54%
Mar 16 Jun 16 Sep 16 Dec 16 Mar 17
1.83%
2.23%2.14%
2.06% 2.13%
1.45%
1.78%1.63%
1.44% 1.51%
Mar 16 Jun 16 Sep 16 Dec 16 Mar 17
Malaysia Singapore Indonesia
16
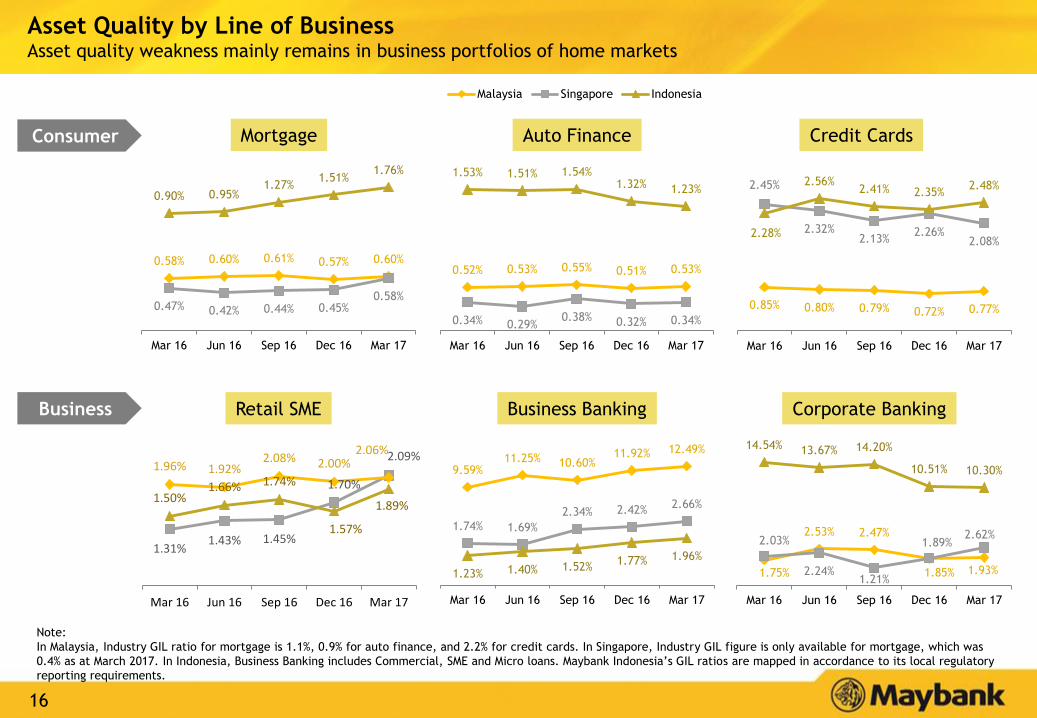
Asset Quality by Line of BusinessAsset quality weakness mainly remains in business portfolios of home markets
Mortgage Auto Finance Credit Cards
Retail SME Business Banking Corporate Banking
Consumer
Business
Note:
In Malaysia, Industry GIL ratio for mortgage is 1.1%, 0.9% for auto finance, and 2.2% for credit cards. In Singapore, Industry GIL figure is only available for mortgage, which was
0.4% as at March 2017. In Indonesia, Business Banking includes Commercial, SME and Micro loans. Maybank Indonesia’s GIL ratios are mapped in accordance to its local regulatory
reporting requirements.
0.58% 0.60% 0.61% 0.57% 0.60%
0.47% 0.42% 0.44% 0.45%0.58%
0.90% 0.95%1.27%
1.51%1.76%
-3.00%
-2.00%
-1.00%
0.00%
1.00%
2.00%
3.00%
0.00%
0.50%
1.00%
1.50%
2.00%
Mar 16 Jun 16 Sep 16 Dec 16 Mar 17
0.52% 0.53% 0.55% 0.51% 0.53%
0.34% 0.29%0.38% 0.32% 0.34%
1.53% 1.51% 1.54%1.32% 1.23%
-1.00%
-0.50%
0.00%
0.50%
1.00%
1.50%
2.00%
0.00%
0.50%
1.00%
1.50%
2.00%
Mar 16 Jun 16 Sep 16 Dec 16 Mar 17
Malaysia Singapore Indonesia
0.85% 0.80% 0.79% 0.72% 0.77%
2.45%
2.32%2.13%
2.26%2.08%
2.28%
2.56%2.41% 2.35%
2.48%
0.00%
0.50%
1.00%
1.50%
2.00%
2.50%
3.00%
0.00%
0.50%
1.00%
1.50%
2.00%
2.50%
3.00%
Mar 16 Jun 16 Sep 16 Dec 16 Mar 17
1.74% 1.69%
2.34% 2.42%2.66%
1.23% 1.40% 1.52%1.77% 1.96%
9.59%11.25% 10.60%
11.92% 12.49%
-4.00%
1.00%
6.00%
11.00%
16.00%
0.00%
1.00%
2.00%
3.00%
4.00%
5.00%
6.00%
Mar 16 Jun 16 Sep 16 Dec 16 Mar 17
1.75%
2.53% 2.47%
1.85% 1.93%
2.03%
2.24%1.21%
1.89%2.62%
14.54% 13.67% 14.20%
10.51% 10.30%
-6.00%
-1.00%
4.00%
9.00%
14.00%
0.00%
1.00%
2.00%
3.00%
4.00%
5.00%
6.00%
7.00%
8.00%
9.00%
10.00%
Mar 16 Jun 16 Sep 16 Dec 16 Mar 17
1.31%1.43% 1.45%
1.70%
2.09%
1.50%1.66% 1.74%
1.57%
1.89%
1.96% 1.92%2.08% 2.00%
2.06%
Mar 16 Jun 16 Sep 16 Dec 16 Mar 17
17
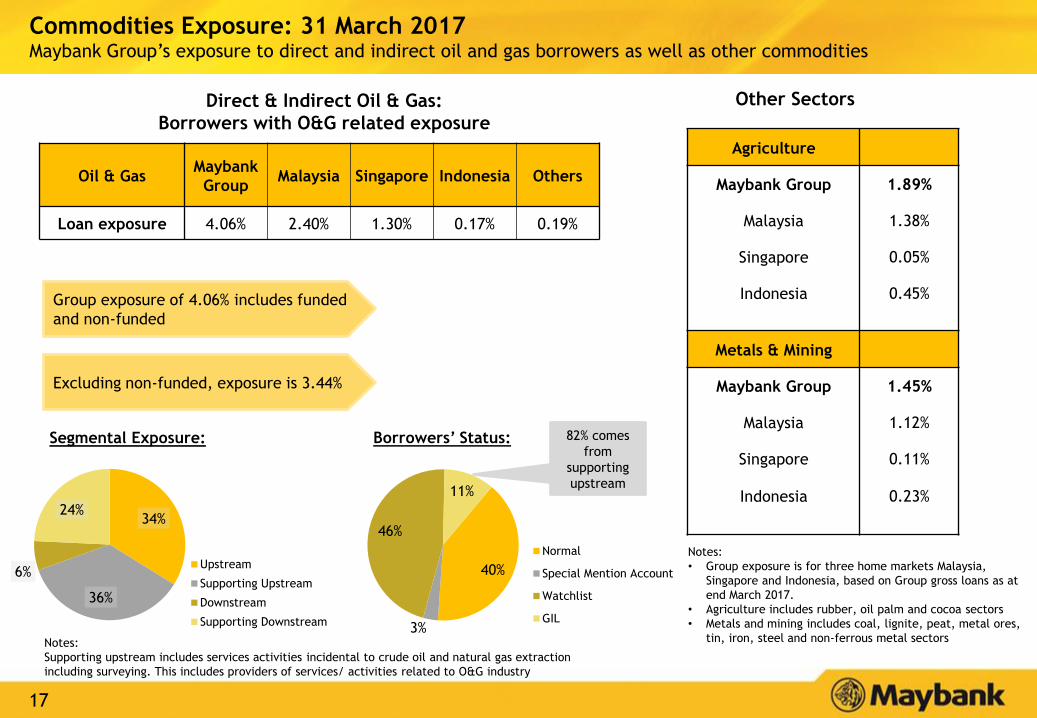
40%
3%
46%
11%
Normal
Special Mention Account
Watchlist
GIL
82% comes
from
supporting
upstream
Commodities Exposure: 31 March 2017Maybank Group’s exposure to direct and indirect oil and gas borrowers as well as other commodities
Notes:
• Group exposure is for three home markets Malaysia,
Singapore and Indonesia, based on Group gross loans as at
end March 2017.
• Agriculture includes rubber, oil palm and cocoa sectors
• Metals and mining includes coal, lignite, peat, metal ores,
tin, iron, steel and non-ferrous metal sectors
Agriculture
Maybank Group 1.89%
Malaysia 1.38%
Singapore 0.05%
Indonesia 0.45%
Metals & Mining
Maybank Group 1.45%
Malaysia 1.12%
Singapore 0.11%
Indonesia 0.23%
Oil & GasMaybank
GroupMalaysia Singapore Indonesia Others
Loan exposure 4.06% 2.40% 1.30% 0.17% 0.19%
Borrowers’ Status:Segmental Exposure:
Direct & Indirect Oil & Gas:
Borrowers with O&G related exposure
Other Sectors
Group exposure of 4.06% includes funded
and non-funded
34%
36%
6%
24%
Upstream
Supporting Upstream
Downstream
Supporting Downstream
Notes:
Supporting upstream includes services activities incidental to crude oil and natural gas extraction
including surveying. This includes providers of services/ activities related to O&G industry
Excluding non-funded, exposure is 3.44%
18
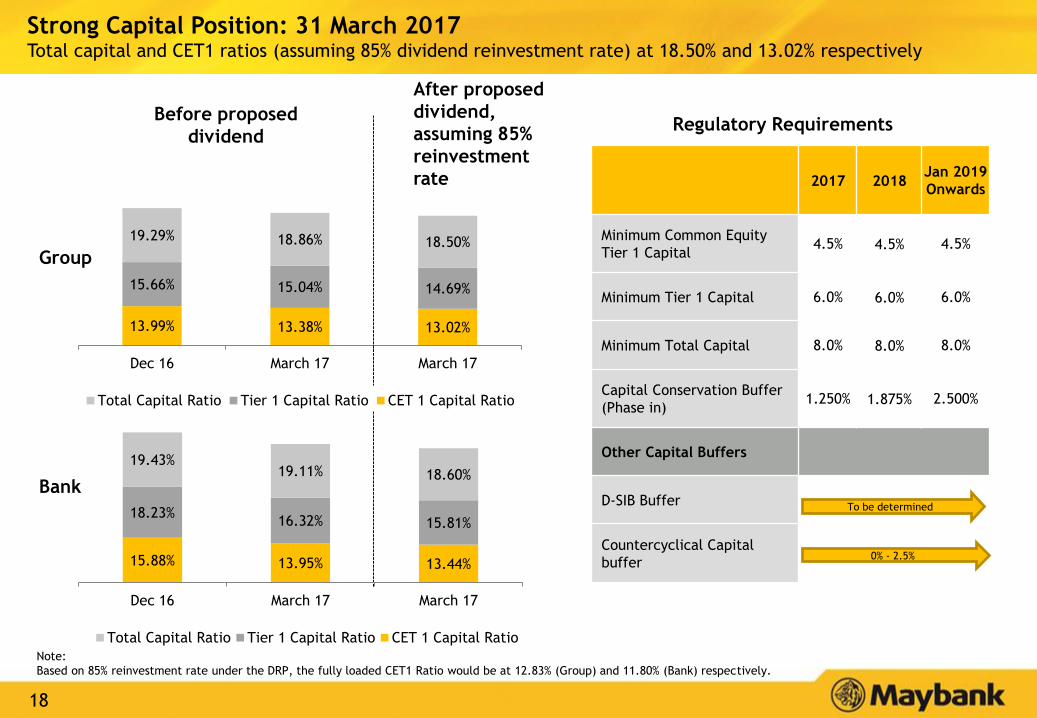
13.99% 13.38% 13.02%
15.66% 15.04% 14.69%
19.29% 18.86% 18.50%
Dec 16 March 17 March 17
Total Capital Ratio Tier 1 Capital Ratio CET 1 Capital Ratio
Group
Bank
Strong Capital Position: 31 March 2017Total capital and CET1 ratios (assuming 85% dividend reinvestment rate) at 18.50% and 13.02% respectively
Before proposed
dividend
After proposed
dividend,
assuming 85%
reinvestment
rate 2017 2018Jan 2019
Onwards
Minimum Common Equity
Tier 1 Capital4.5% 4.5% 4.5%
Minimum Tier 1 Capital 6.0% 6.0% 6.0%
Minimum Total Capital 8.0% 8.0% 8.0%
Capital Conservation Buffer
(Phase in)1.250% 1.875% 2.500%
Other Capital Buffers
D-SIB Buffer
Countercyclical Capital
buffer
Regulatory Requirements
To be determined
0% - 2.5%
Note:
Based on 85% reinvestment rate under the DRP, the fully loaded CET1 Ratio would be at 12.83% (Group) and 11.80% (Bank) respectively.
15.88% 13.95% 13.44%
18.23%16.32% 15.81%
19.43%19.11% 18.60%
Dec 16 March 17 March 17
Total Capital Ratio Tier 1 Capital Ratio CET 1 Capital Ratio
19
Table of Contents
Executive Summary 2
Results Overview 5
Prospects & Outlook 20
Appendix:
1. Financial Performance 23
2. Community Financial Services 31
3. Global Banking 36
4. Maybank Singapore 41
5. Maybank Indonesia 45
6. Other segments 50
7. Affiliates 55
Financial Results: 1Q FY2017 ended 31 March 2017
20
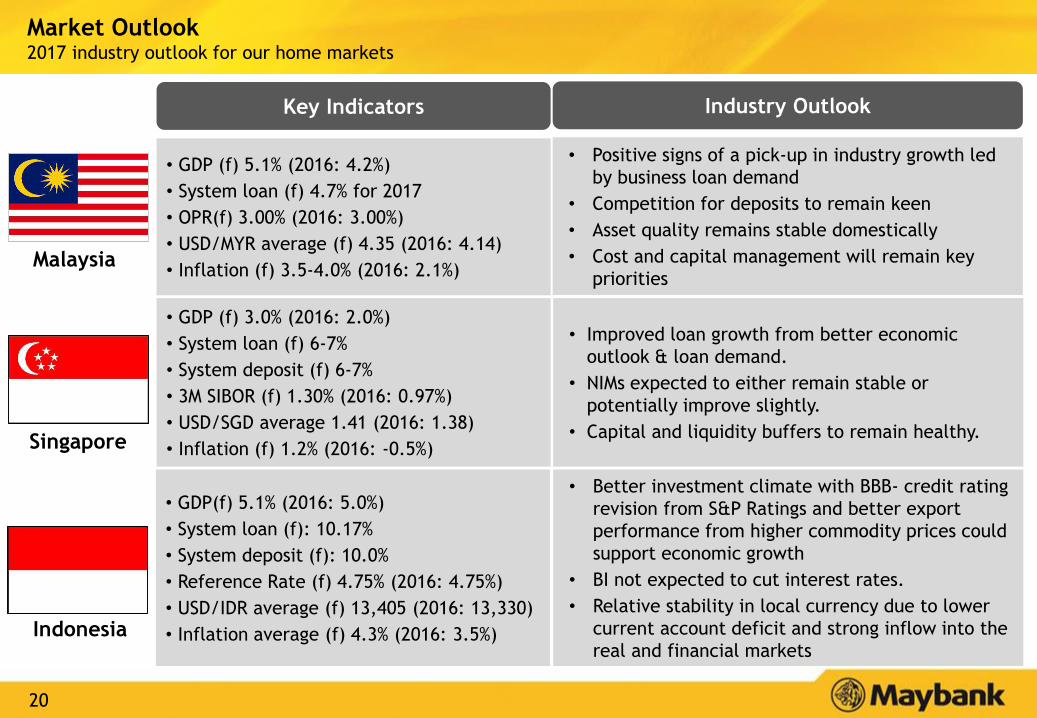
Market Outlook2017 industry outlook for our home markets
Key Indicators Industry Outlook
Singapore
Malaysia
Indonesia
• GDP (f) 5.1% (2016: 4.2%)
• System loan (f) 4.7% for 2017
• OPR(f) 3.00% (2016: 3.00%)
• USD/MYR average (f) 4.35 (2016: 4.14)
• Inflation (f) 3.5-4.0% (2016: 2.1%)
• GDP (f) 3.0% (2016: 2.0%)
• System loan (f) 6-7%
• System deposit (f) 6-7%
• 3M SIBOR (f) 1.30% (2016: 0.97%)
• USD/SGD average 1.41 (2016: 1.38)
• Inflation (f) 1.2% (2016: -0.5%)
• GDP(f) 5.1% (2016: 5.0%)
• System loan (f): 10.17%
• System deposit (f): 10.0%
• Reference Rate (f) 4.75% (2016: 4.75%)
• USD/IDR average (f) 13,405 (2016: 13,330)
• Inflation average (f) 4.3% (2016: 3.5%)
• Better investment climate with BBB- credit rating
revision from S&P Ratings and better export
performance from higher commodity prices could
support economic growth
• BI not expected to cut interest rates.
• Relative stability in local currency due to lower
current account deficit and strong inflow into the
real and financial markets
• Improved loan growth from better economic
outlook & loan demand.
• NIMs expected to either remain stable or
potentially improve slightly.
• Capital and liquidity buffers to remain healthy.
• Positive signs of a pick-up in industry growth led
by business loan demand
• Competition for deposits to remain keen
• Asset quality remains stable domestically
• Cost and capital management will remain key
priorities
21
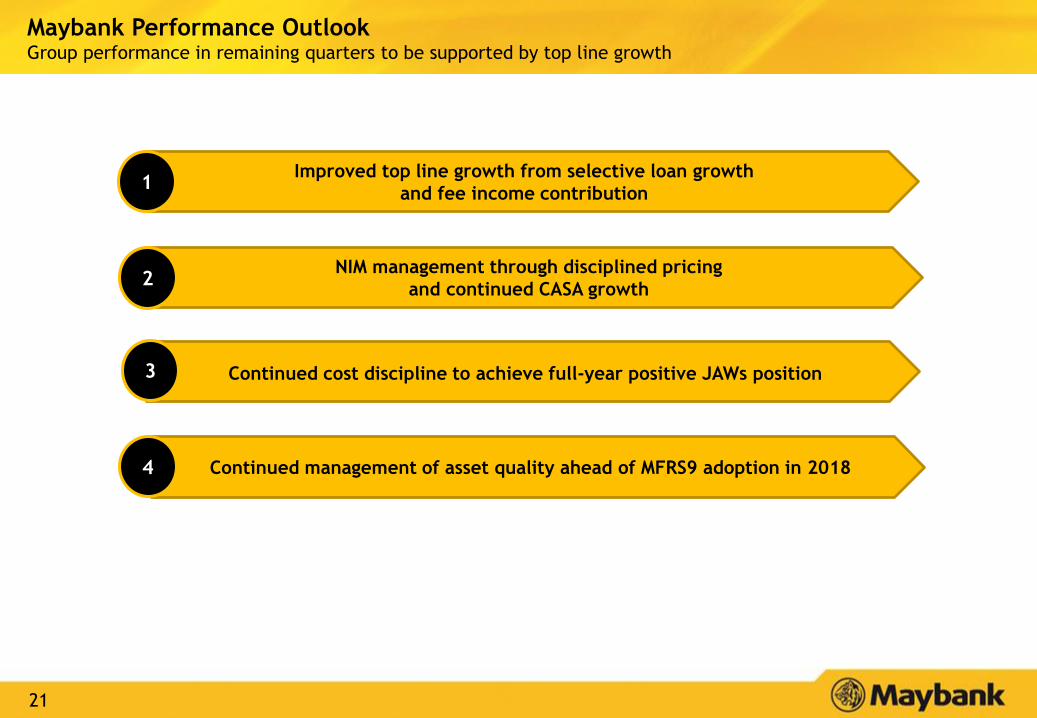
Continued cost discipline to achieve full-year positive JAWs position
NIM management through disciplined pricing
and continued CASA growth
Continued management of asset quality ahead of MFRS9 adoption in 2018
Maybank Performance OutlookGroup performance in remaining quarters to be supported by top line growth
2
4
Improved top line growth from selective loan growth
and fee income contribution1
3
22
Table of Contents
Executive Summary 2
Results Overview 5
Prospects & Outlook 20
Appendix:
1. Financial Performance 23
2. Community Financial Services 31
3. Global Banking 36
4. Maybank Singapore 41
5. Maybank Indonesia 45
6. Other segments 50
7. Affiliates 55
Financial Results: 1Q FY2017 ended 31 March 2017
23
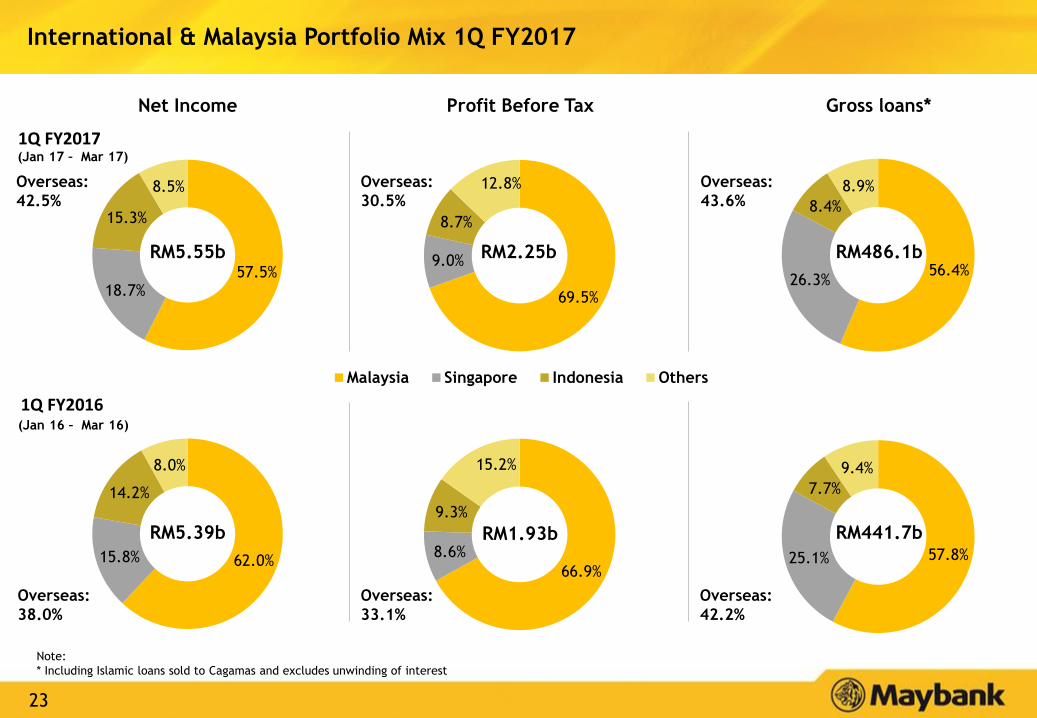
57.8%25.1%
7.7%
9.4%
66.9%
8.6%
9.3%
15.2%
57.5%18.7%
15.3%
8.5%
69.5%
9.0%
8.7%
12.8%
Malaysia Singapore Indonesia Others
International & Malaysia Portfolio Mix 1Q FY2017
Overseas:
42.2%
1Q FY2016
Net Income Profit Before Tax
1Q FY2017
Overseas:
38.0%
Overseas:
33.1%
Gross loans*
(Jan 16 – Mar 16)
56.4%26.3%
8.4%
8.9%Overseas:
43.6%
Overseas:
42.5%
Overseas:
30.5%
(Jan 17 – Mar 17)
62.0%15.8%
14.2%
8.0%
RM2.25b RM486.1b
RM1.93b RM441.7bRM5.39b
RM5.55b
Note:
* Including Islamic loans sold to Cagamas and excludes unwinding of interest
24
2,150
1,394
159
1,192
(595)
1,437 1,430
131
1,254
(1,378)
Total Other operating income Fee Income from IslamicOperations
Net Earned InsurancePremiums
Net Insurance Benefits &Claims Incurred, Net Fee& Commission Expensesand Life & Takaful Fund
Tax
4Q FY2016
1Q FY2017
RM
million
RM million 4Q FY2016 1Q FY2017 QoQ
Commission, service charges and fees 982 860 (12.4)%
Investment & Trading Income 625 232 (62.8)%
Unrealised gain/ (losses) on securities (373) 206 >100%
Unrealised gain/ (losses) on derivatives (570) (76) 86.6%
Foreign Exchange Profit 308 76 (75.3)%
Other Income 423 132 (68.8)%
Net Fee Based Income: QoQ
(33.2)% +2.6% (17.4)% +5.1% +>100%
25
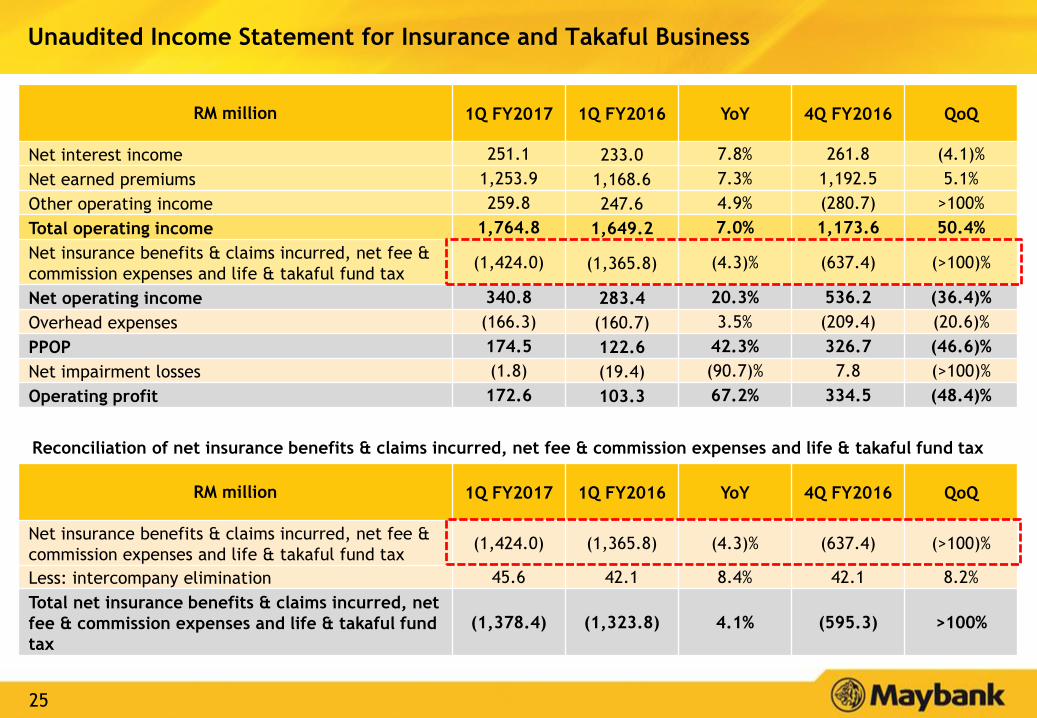
Unaudited Income Statement for Insurance and Takaful Business
RM million 1Q FY2017 1Q FY2016 YoY 4Q FY2016 QoQ
Net interest income 251.1 233.0 7.8% 261.8 (4.1)%
Net earned premiums 1,253.9 1,168.6 7.3% 1,192.5 5.1%
Other operating income 259.8 247.6 4.9% (280.7) >100%
Total operating income 1,764.8 1,649.2 7.0% 1,173.6 50.4%
Net insurance benefits & claims incurred, net fee &
commission expenses and life & takaful fund tax(1,424.0) (1,365.8) (4.3)% (637.4) (>100)%
Net operating income 340.8 283.4 20.3% 536.2 (36.4)%
Overhead expenses (166.3) (160.7) 3.5% (209.4) (20.6)%
PPOP 174.5 122.6 42.3% 326.7 (46.6)%
Net impairment losses (1.8) (19.4) (90.7)% 7.8 (>100)%
Operating profit 172.6 103.3 67.2% 334.5 (48.4)%
RM million 1Q FY2017 1Q FY2016 YoY 4Q FY2016 QoQ
Net insurance benefits & claims incurred, net fee &
commission expenses and life & takaful fund tax(1,424.0) (1,365.8) (4.3)% (637.4) (>100)%
Less: intercompany elimination 45.6 42.1 8.4% 42.1 8.2%
Total net insurance benefits & claims incurred, net
fee & commission expenses and life & takaful fund
tax
(1,378.4) (1,323.8) 4.1% (595.3) >100%
Reconciliation of net insurance benefits & claims incurred, net fee & commission expenses and life & takaful fund tax
26
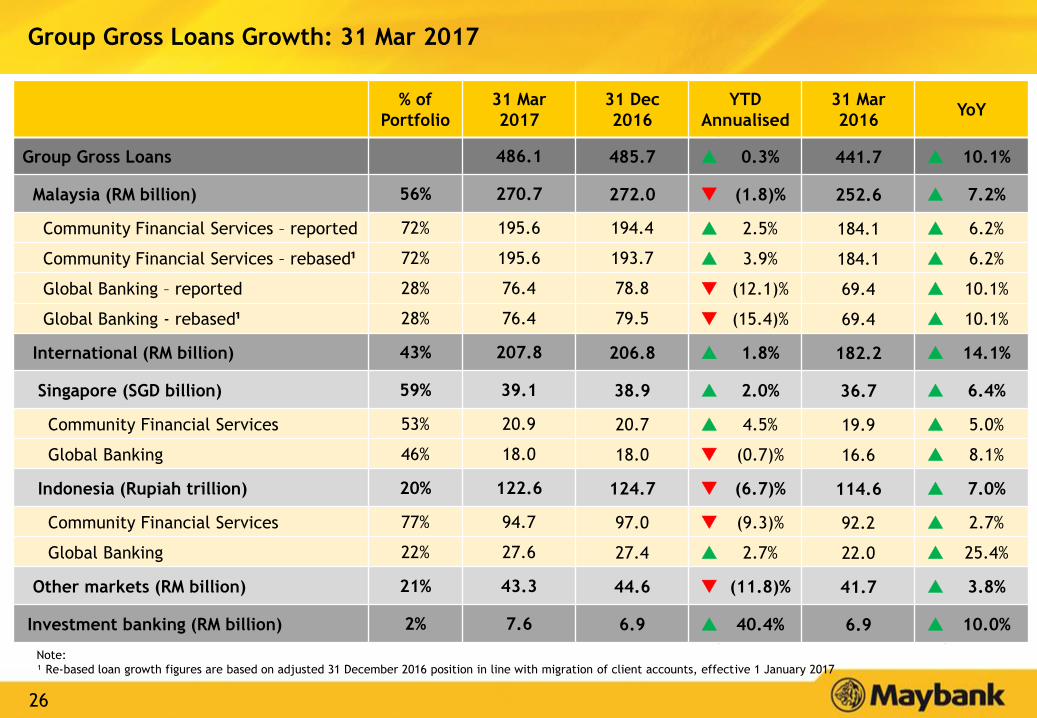
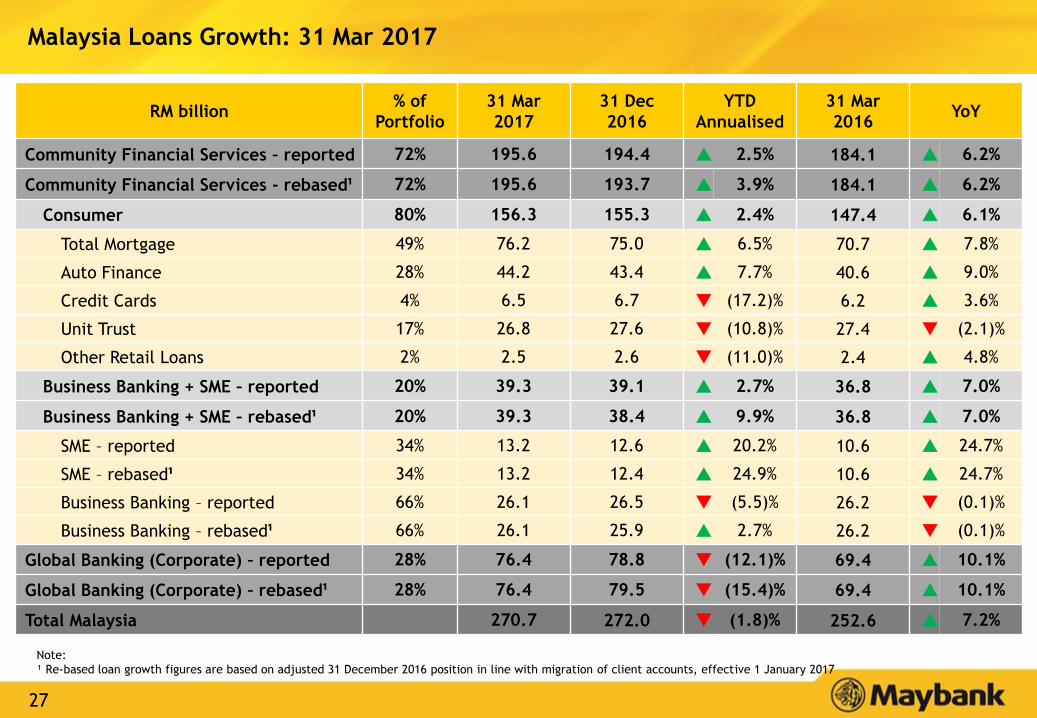
Group Gross Loans Growth: 31 Mar 2017
% of
Portfolio
31 Mar
2017
31 Dec
2016
YTD
Annualised
31 Mar
2016YoY
Group Gross Loans 486.1 485.7 0.3% 441.7 10.1%
Malaysia (RM billion) 56% 270.7 272.0 (1.8)% 252.6 7.2%
Community Financial Services – reported 72% 195.6 194.4 2.5% 184.1 6.2%
Community Financial Services – rebased¹ 72% 195.6 193.7 3.9% 184.1 6.2%
Global Banking – reported 28% 76.4 78.8 (12.1)% 69.4 10.1%
Global Banking - rebased¹ 28% 76.4 79.5 (15.4)% 69.4 10.1%
International (RM billion) 43% 207.8 206.8 1.8% 182.2 14.1%
Singapore (SGD billion) 59% 39.1 38.9 2.0% 36.7 6.4%
Community Financial Services 53% 20.9 20.7 4.5% 19.9 5.0%
Global Banking 46% 18.0 18.0 (0.7)% 16.6 8.1%
Indonesia (Rupiah trillion) 20% 122.6 124.7 (6.7)% 114.6 7.0%
Community Financial Services 77% 94.7 97.0 (9.3)% 92.2 2.7%
Global Banking 22% 27.6 27.4 2.7% 22.0 25.4%
Other markets (RM billion) 21% 43.3 44.6 (11.8)% 41.7 3.8%
Investment banking (RM billion) 2% 7.6 6.9 40.4% 6.9 10.0%
Note:
¹ Re-based loan growth figures are based on adjusted 31 December 2016 position in line with migration of client accounts, effective 1 January 2017
27
RM billion% of
Portfolio
31 Mar
2017
31 Dec
2016
YTD
Annualised
31 Mar
2016YoY
Community Financial Services – reported 72% 195.6 194.4 2.5% 184.1 6.2%
Community Financial Services - rebased¹ 72% 195.6 193.7 3.9% 184.1 6.2%
Consumer 80% 156.3 155.3 2.4% 147.4 6.1%
Total Mortgage 49% 76.2 75.0 6.5% 70.7 7.8%
Auto Finance 28% 44.2 43.4 7.7% 40.6 9.0%
Credit Cards 4% 6.5 6.7 (17.2)% 6.2 3.6%
Unit Trust 17% 26.8 27.6 (10.8)% 27.4 (2.1)%
Other Retail Loans 2% 2.5 2.6 (11.0)% 2.4 4.8%
Business Banking + SME – reported 20% 39.3 39.1 2.7% 36.8 7.0%
Business Banking + SME – rebased¹ 20% 39.3 38.4 9.9% 36.8 7.0%
SME – reported 34% 13.2 12.6 20.2% 10.6 24.7%
SME – rebased¹ 34% 13.2 12.4 24.9% 10.6 24.7%
Business Banking – reported 66% 26.1 26.5 (5.5)% 26.2 (0.1)%
Business Banking – rebased¹ 66% 26.1 25.9 2.7% 26.2 (0.1)%
Global Banking (Corporate) – reported 28% 76.4 78.8 (12.1)% 69.4 10.1%
Global Banking (Corporate) – rebased¹ 28% 76.4 79.5 (15.4)% 69.4 10.1%
Total Malaysia 270.7 272.0 (1.8)% 252.6 7.2%
Malaysia Loans Growth: 31 Mar 2017
Note:
¹ Re-based loan growth figures are based on adjusted 31 December 2016 position in line with migration of client accounts, effective 1 January 2017
28
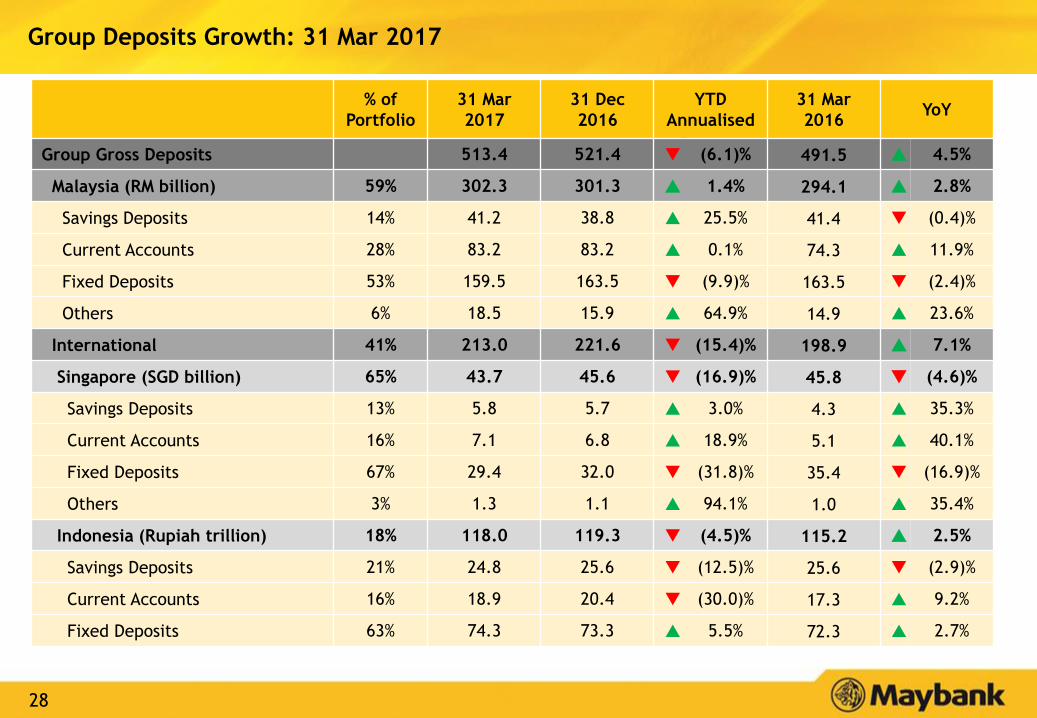
Group Deposits Growth: 31 Mar 2017
% of
Portfolio
31 Mar
2017
31 Dec
2016
YTD
Annualised
31 Mar
2016YoY
Group Gross Deposits 513.4 521.4 (6.1)% 491.5 4.5%
Malaysia (RM billion) 59% 302.3 301.3 1.4% 294.1 2.8%
Savings Deposits 14% 41.2 38.8 25.5% 41.4 (0.4)%
Current Accounts 28% 83.2 83.2 0.1% 74.3 11.9%
Fixed Deposits 53% 159.5 163.5 (9.9)% 163.5 (2.4)%
Others 6% 18.5 15.9 64.9% 14.9 23.6%
International 41% 213.0 221.6 (15.4)% 198.9 7.1%
Singapore (SGD billion) 65% 43.7 45.6 (16.9)% 45.8 (4.6)%
Savings Deposits 13% 5.8 5.7 3.0% 4.3 35.3%
Current Accounts 16% 7.1 6.8 18.9% 5.1 40.1%
Fixed Deposits 67% 29.4 32.0 (31.8)% 35.4 (16.9)%
Others 3% 1.3 1.1 94.1% 1.0 35.4%
Indonesia (Rupiah trillion) 18% 118.0 119.3 (4.5)% 115.2 2.5%
Savings Deposits 21% 24.8 25.6 (12.5)% 25.6 (2.9)%
Current Accounts 16% 18.9 20.4 (30.0)% 17.3 9.2%
Fixed Deposits 63% 74.3 73.3 5.5% 72.3 2.7%
29
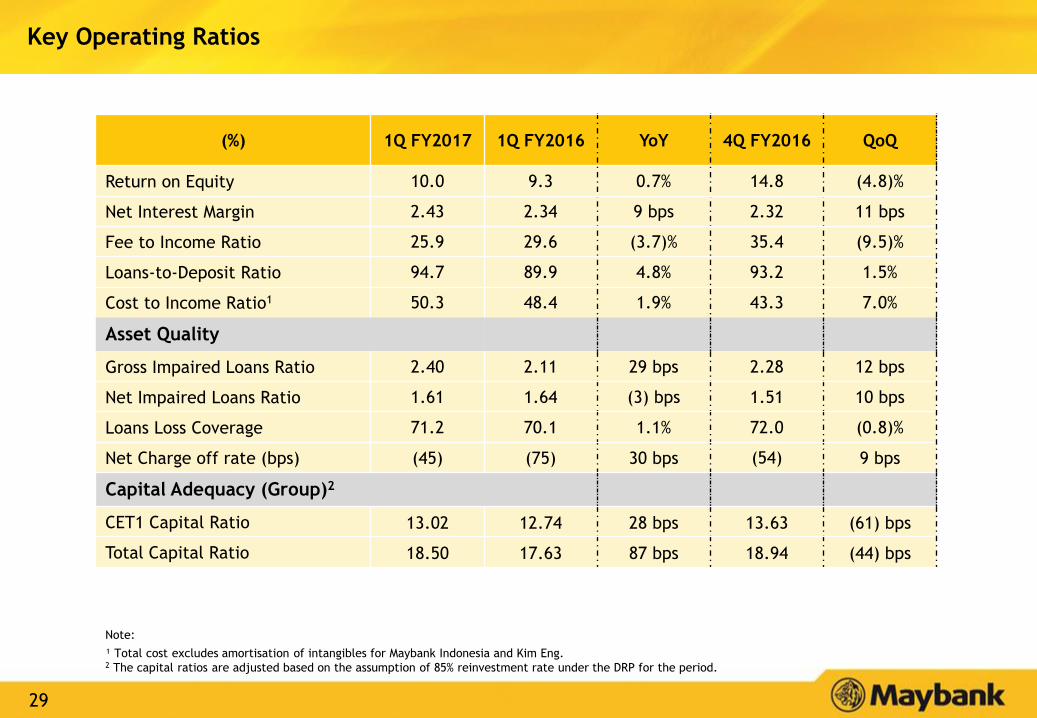
Key Operating Ratios
(%) 1Q FY2017 1Q FY2016 YoY 4Q FY2016 QoQ
Return on Equity 10.0 9.3 0.7% 14.8 (4.8)%
Net Interest Margin 2.43 2.34 9 bps 2.32 11 bps
Fee to Income Ratio 25.9 29.6 (3.7)% 35.4 (9.5)%
Loans-to-Deposit Ratio 94.7 89.9 4.8% 93.2 1.5%
Cost to Income Ratio1 50.3 48.4 1.9% 43.3 7.0%
Asset Quality
Gross Impaired Loans Ratio 2.40 2.11 29 bps 2.28 12 bps
Net Impaired Loans Ratio 1.61 1.64 (3) bps 1.51 10 bps
Loans Loss Coverage 71.2 70.1 1.1% 72.0 (0.8)%
Net Charge off rate (bps) (45) (75) 30 bps (54) 9 bps
Capital Adequacy (Group)2
CET1 Capital Ratio 13.02 12.74 28 bps 13.63 (61) bps
Total Capital Ratio 18.50 17.63 87 bps 18.94 (44) bps
Note:
¹ Total cost excludes amortisation of intangibles for Maybank Indonesia and Kim Eng.2 The capital ratios are adjusted based on the assumption of 85% reinvestment rate under the DRP for the period.
30
Table of Contents
Executive Summary 2
Results Overview 5
Prospects & Outlook 20
Appendix:
1. Financial Performance 23
2. Community Financial Services 31
3. Global Banking 36
4. Maybank Singapore 41
5. Maybank Indonesia 45
6. Other segments 50
7. Affiliates 55
Financial Results: 1Q FY2017 ended 31 March 2017
31
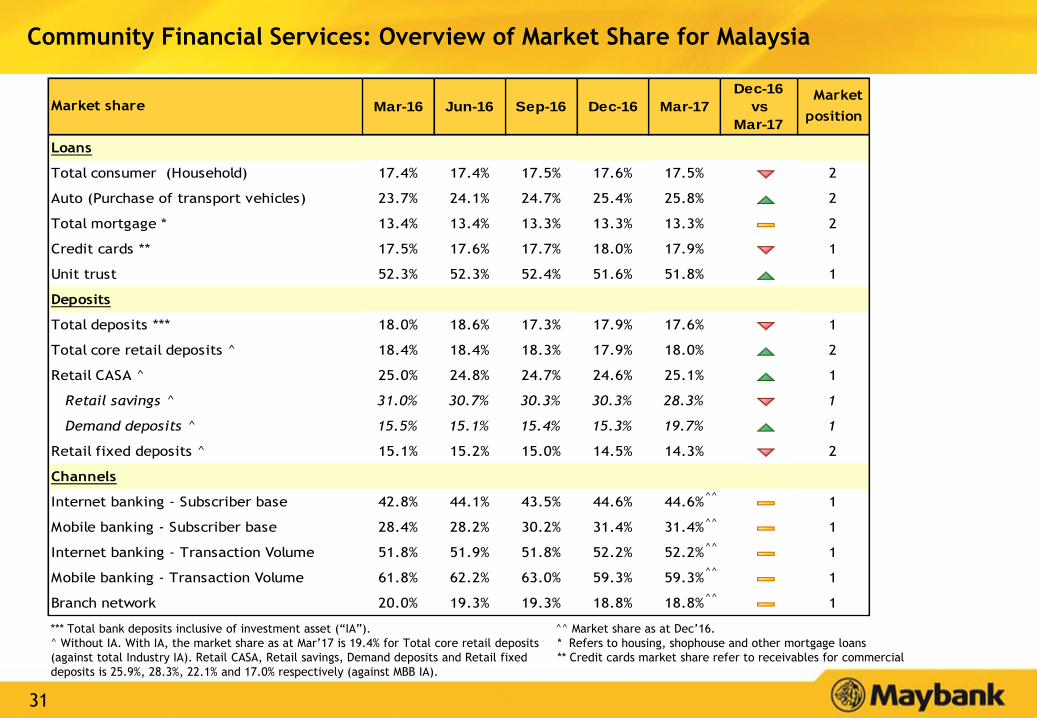
Community Financial Services: Overview of Market Share for Malaysia
Loans
Total consumer (Household) 17.4% 17.4% 17.5% 17.6% 17.5% # 2
Auto (Purchase of transport vehicles) 23.7% 24.1% 24.7% 25.4% 25.8% # 2
Total mortgage * 13.4% 13.4% 13.3% 13.3% 13.3% # 2
Credit cards ** 17.5% 17.6% 17.7% 18.0% 17.9% # 1
Unit trust 52.3% 52.3% 52.4% 51.6% 51.8% # 1
Deposits
Total deposits *** 18.0% 18.6% 17.3% 17.9% 17.6% # 1
Total core retail deposits ^ 18.4% 18.4% 18.3% 17.9% 18.0% # 2
Retail CASA ^ 25.0% 24.8% 24.7% 24.6% 25.1% # 1
Retail savings ^ 31.0% 30.7% 30.3% 30.3% 28.3% # 1
Demand deposits ^ 15.5% 15.1% 15.4% 15.3% 19.7% # 1
Retail fixed deposits ^ 15.1% 15.2% 15.0% 14.5% 14.3% # 2
Channels
Internet banking - Subscriber base 42.8% 44.1% 43.5% 44.6% 44.6% # 1
Mobile banking - Subscriber base 28.4% 28.2% 30.2% 31.4% 31.4% # 1
Internet banking - Transaction Volume 51.8% 51.9% 51.8% 52.2% 52.2% # 1
Mobile banking - Transaction Volume 61.8% 62.2% 63.0% 59.3% 59.3% # 1
Branch network 20.0% 19.3% 19.3% 18.8% 18.8% # 1
Dec-16
vs
Mar-17
Market
positionMar-16 Dec-16 Mar-17Sep-16Market share Jun-16
*** Total bank deposits inclusive of investment asset (“IA”).
^ Without IA. With IA, the market share as at Mar’17 is 19.4% for Total core retail deposits
(against total Industry IA). Retail CASA, Retail savings, Demand deposits and Retail fixed
deposits is 25.9%, 28.3%, 22.1% and 17.0% respectively (against MBB IA).
^^ Market share as at Dec’16.
* Refers to housing, shophouse and other mortgage loans
** Credit cards market share refer to receivables for commercial
^^
^^
^^
^^
^^
32
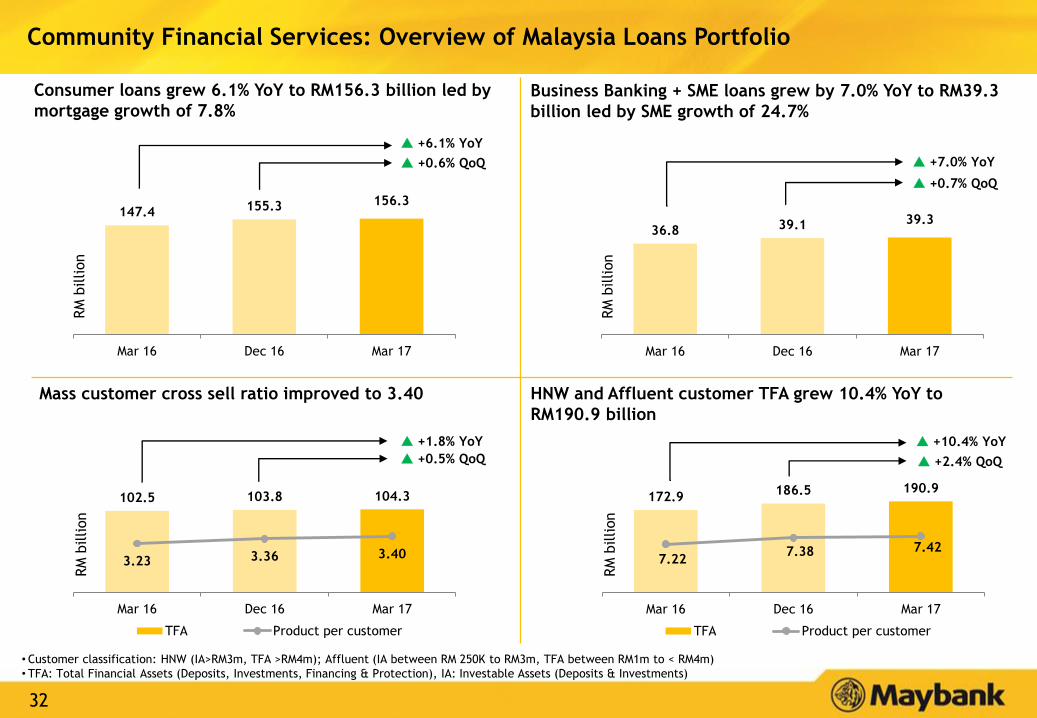
Community Financial Services: Overview of Malaysia Loans Portfolio
172.9186.5 190.9
7.227.38 7.42
Mar 16 Dec 16 Mar 17
TFA Product per customer
102.5 103.8 104.3
3.23 3.36 3.40
Mar 16 Dec 16 Mar 17
TFA Product per customer
36.8 39.1 39.3
0
10
20
30
40
50
60
Mar 16 Dec 16 Mar 17
147.4 155.3 156.3
020406080
100120140160180200
Mar 16 Dec 16 Mar 17
+6.1% YoY
Consumer loans grew 6.1% YoY to RM156.3 billion led by
mortgage growth of 7.8%
• Customer classification: HNW (IA>RM3m, TFA >RM4m); Affluent (IA between RM 250K to RM3m, TFA between RM1m to < RM4m)
• TFA: Total Financial Assets (Deposits, Investments, Financing & Protection), IA: Investable Assets (Deposits & Investments)
+0.6% QoQ
HNW and Affluent customer TFA grew 10.4% YoY to
RM190.9 billion
Mass customer cross sell ratio improved to 3.40
RM
billion
RM
billion
+7.0% YoY
+0.7% QoQ
RM
billion
+1.8% YoY
RM
billion
+10.4% YoY
+0.5% QoQ +2.4% QoQ
Business Banking + SME loans grew by 7.0% YoY to RM39.3
billion led by SME growth of 24.7%
33
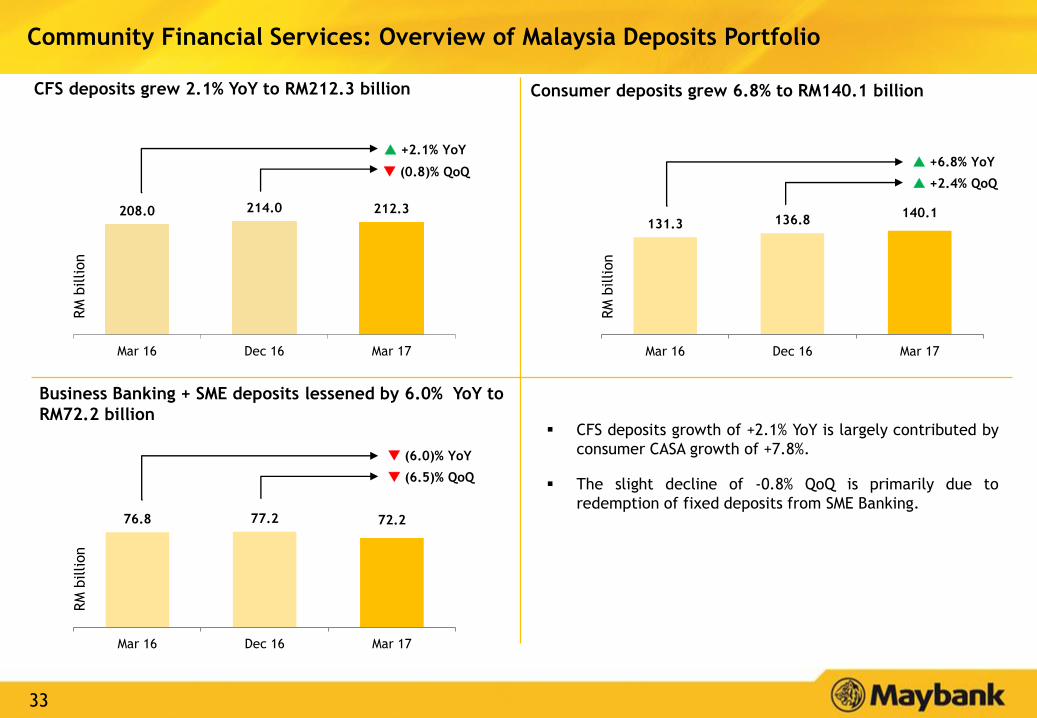
Community Financial Services: Overview of Malaysia Deposits Portfolio
208.0 214.0 212.3
0
50
100
150
200
250
Mar 16 Dec 16 Mar 17
(0.8)% QoQ
131.3 136.8140.1
020406080
100120140160180200
Mar 16 Dec 16 Mar 17
+2.1% YoY
RM
billion
RM
billion
+6.8% YoY
+2.4% QoQ
CFS deposits growth of +2.1% YoY is largely contributed by
consumer CASA growth of +7.8%.
The slight decline of -0.8% QoQ is primarily due to
redemption of fixed deposits from SME Banking.76.8 77.2 72.2
0
20
40
60
80
100
120
Mar 16 Dec 16 Mar 17
(6.0)% YoY
(6.5)% QoQ
RM
billion
CFS deposits grew 2.1% YoY to RM212.3 billion
Business Banking + SME deposits lessened by 6.0% YoY to
RM72.2 billion
Consumer deposits grew 6.8% to RM140.1 billion

34
Community Financial Services: Overview of CFS Malaysia Asset Quality
Total GIL ratio for consumer financing portfolio
remained stable at 0.5%.
Combined GIL ratio for Business Banking + SME showed
an increase to 9.0%, due to impairment from Business
Banking.
708.1 739.0 783.7
0.5 0.5 0.5
Mar 16 Dec 16 Mar 17
GIL (RM'm) GIL (%)
3,415.2
4,134.3
1.9 2.1 2.2
Mar 16 Dec 16 Mar 17
GIL (RM'm) GIL (%)
2,707.1
3,395.2 3,517.9
2.0 2.0 2.1
7.48.7 9.0
Mar 16 Dec 16 Mar 17
GIL (RM'm) GIL for SME (%) GIL for SME + BB (%)
4,301.6
CFS GIL increased marginally to 2.2% due to a slight uptick
in Business Banking GIL
Business Banking + SME GIL increased to 9.0%
Consumer GIL remained stable at 0.5%, lower than the
industry average of 1.0%
35
Table of Contents
Executive Summary 2
Results Overview 5
Prospects & Outlook 20
Appendix:
1. Financial Performance 23
2. Community Financial Services 31
3. Global Banking 36
4. Maybank Singapore 41
5. Maybank Indonesia 45
6. Other segments 50
7. Affiliates 55
Financial Results: 1Q FY2017 ended 31 March 2017
36
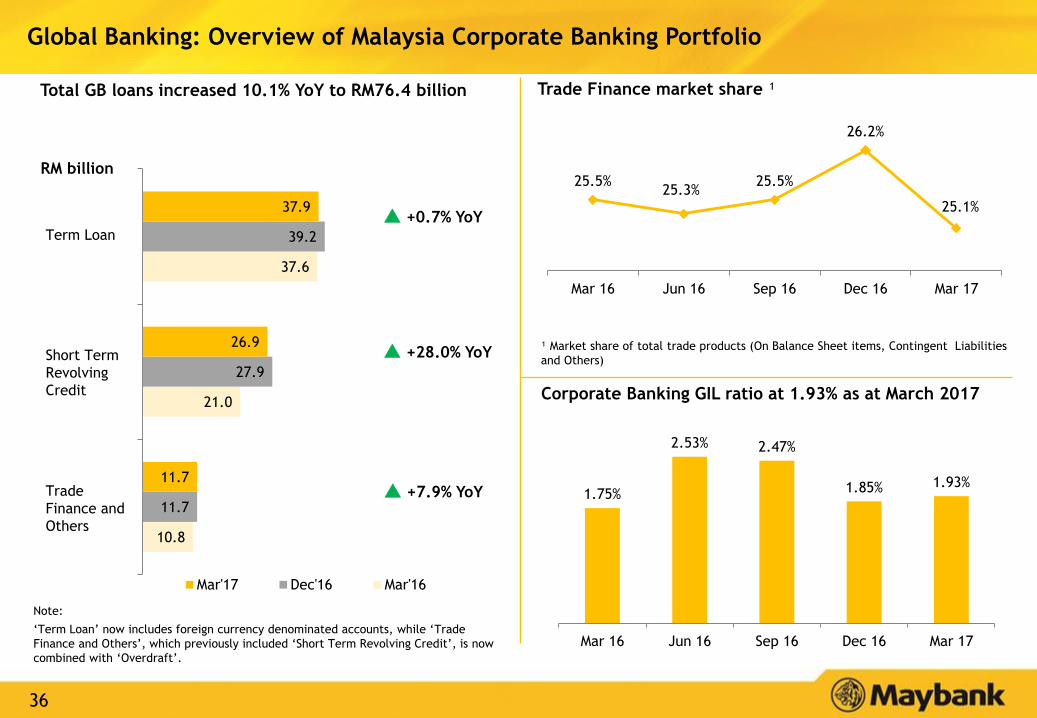
10.8
21.0
37.6
11.7
27.9
39.2
11.7
26.9
37.9
Mar'17 Dec'16 Mar'16
RM billion
Note:
‘Term Loan’ now includes foreign currency denominated accounts, while ‘Trade
Finance and Others’, which previously included ‘Short Term Revolving Credit’, is now
combined with ‘Overdraft’.
Term Loan
Global Banking: Overview of Malaysia Corporate Banking Portfolio
Trade Finance market share ¹Total GB loans increased 10.1% YoY to RM76.4 billion
Corporate Banking GIL ratio at 1.93% as at March 2017
Short Term
Revolving
Credit
Trade
Finance and
Others
¹ Market share of total trade products (On Balance Sheet items, Contingent Liabilities
and Others) +28.0% YoY
+7.9% YoY
+0.7% YoY
25.5%25.3%
25.5%
26.2%
25.1%
Mar 16 Jun 16 Sep 16 Dec 16 Mar 17
1.75%
2.53% 2.47%
1.85% 1.93%
Mar 16 Jun 16 Sep 16 Dec 16 Mar 17
37
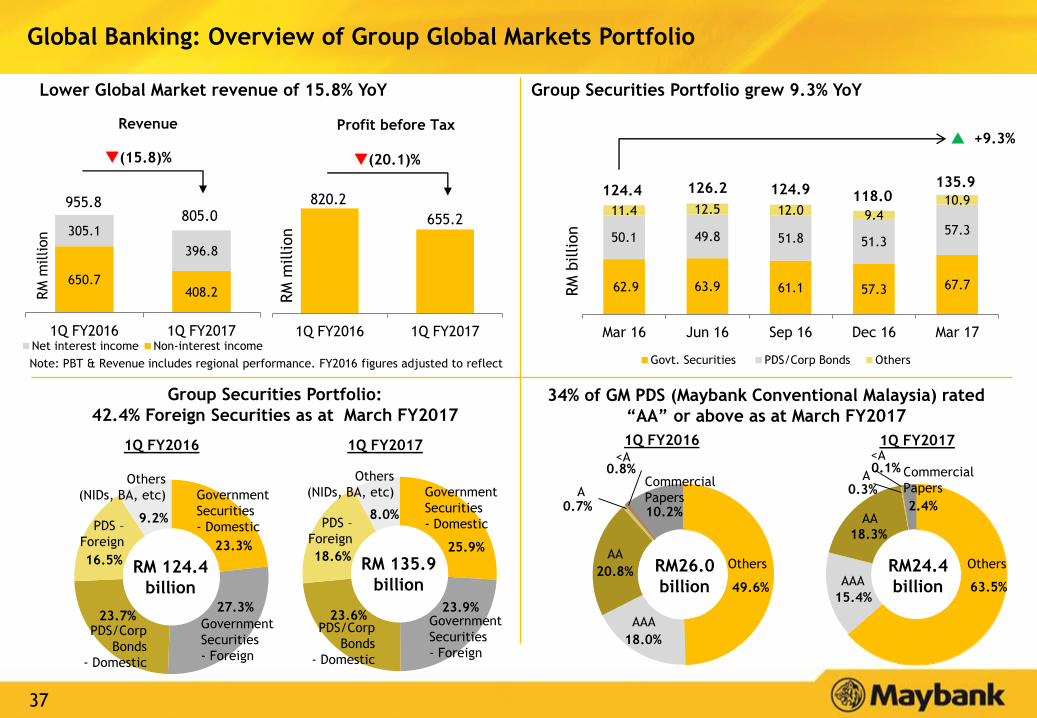
650.7408.2
305.1
396.8
1Q FY2016 1Q FY2017Net interest income Non-interest income
Group Securities Portfolio:
42.4% Foreign Securities as at March FY2017
Group Securities Portfolio grew 9.3% YoY Lower Global Market revenue of 15.8% YoY
34% of GM PDS (Maybank Conventional Malaysia) rated
“AA” or above as at March FY2017
Global Banking: Overview of Group Global Markets Portfolio
820.2
655.2
1Q FY2016 1Q FY2017
(20.1)%
RM
million
Note: PBT & Revenue includes regional performance. FY2016 figures adjusted to reflect
Revenue Profit before Tax
(15.8)%
955.8
RM
million
805.0
1Q FY20171Q FY2016
23.3%
27.3%23.7%
16.5%
9.2%
RM 124.4
billion
Government
Securities
- Domestic
Government
Securities
- Foreign
PDS/Corp
Bonds
- Domestic
PDS –
Foreign
Others
(NIDs, BA, etc)
25.9%
23.9%23.6%
18.6%
8.0%
RM 135.9
billion
Government
Securities
- Domestic
Government
Securities
- Foreign
PDS/Corp
Bonds
- Domestic
PDS –
Foreign
Others
(NIDs, BA, etc)
1Q FY2016
49.6%
18.0%
20.8%
0.7%
0.8%
10.2%
RM26.0
billion
Commercial
Papers
Others
AAA
AA
A
<A
1Q FY2017
63.5%15.4%
18.3%
0.3%
0.1%
2.4%
RM24.4
billion
Commercial
Papers
Others
AAA
AA
A
<A
62.9 63.9 61.1 57.3 67.7
50.1 49.8 51.8 51.357.3
11.4 12.5 12.0 9.410.9
Mar 16 Jun 16 Sep 16 Dec 16 Mar 17
Govt. Securities PDS/Corp Bonds Others
+9.3%
RM
billion
124.4 126.2 124.9 118.0135.9
38
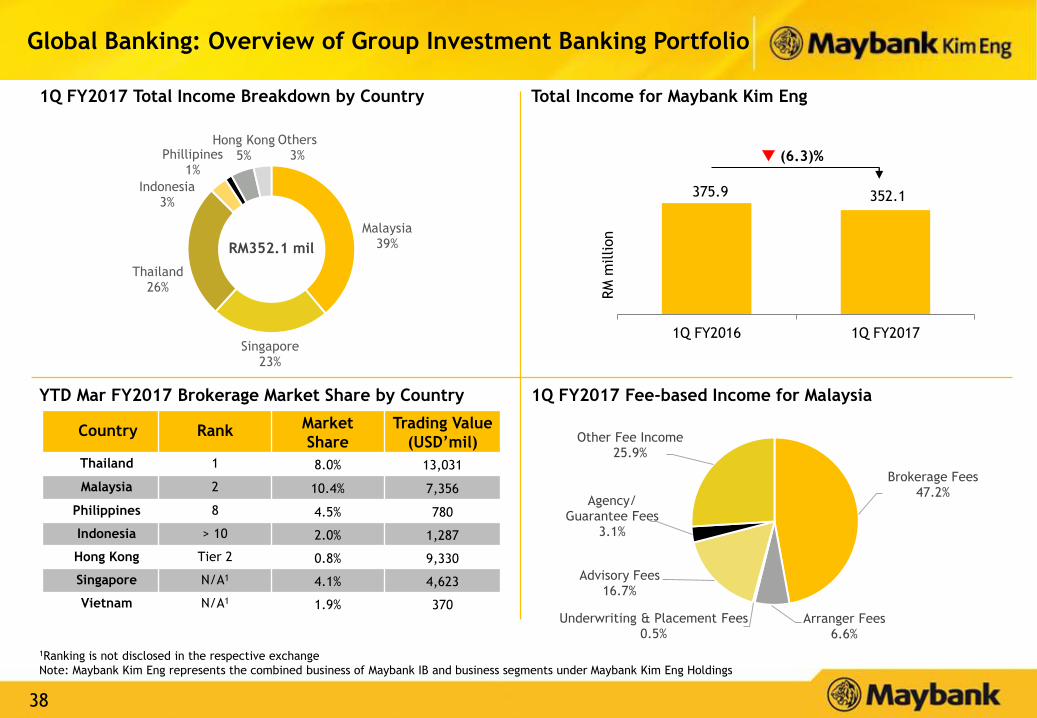
YTD Mar FY2017 Brokerage Market Share by Country
Country RankMarket
Share
Trading Value
(USD’mil)
Thailand 1 8.0% 13,031
Malaysia 2 10.4% 7,356
Philippines 8 4.5% 780
Indonesia > 10 2.0% 1,287
Hong Kong Tier 2 0.8% 9,330
Singapore N/A1 4.1% 4,623
Vietnam N/A1 1.9% 370
1Q FY2017 Fee-based Income for Malaysia
Total Income for Maybank Kim Eng
1Ranking is not disclosed in the respective exchange
Note: Maybank Kim Eng represents the combined business of Maybank IB and business segments under Maybank Kim Eng Holdings
Global Banking: Overview of Group Investment Banking Portfolio
Malaysia39%
Singapore23%
Thailand26%
Indonesia3%
Phillipines1%
Hong Kong5%
Others3%
1Q FY2017 Total Income Breakdown by Country
375.9 352.1
-
100.0
200.0
300.0
400.0
500.0
1Q FY2016 1Q FY2017
(6.3)%
RM
million
Brokerage Fees47.2%
Arranger Fees6.6%
Underwriting & Placement Fees0.5%
Advisory Fees16.7%
Agency/ Guarantee Fees
3.1%
Other Fee Income25.9%
RM352.1 mil
39 39
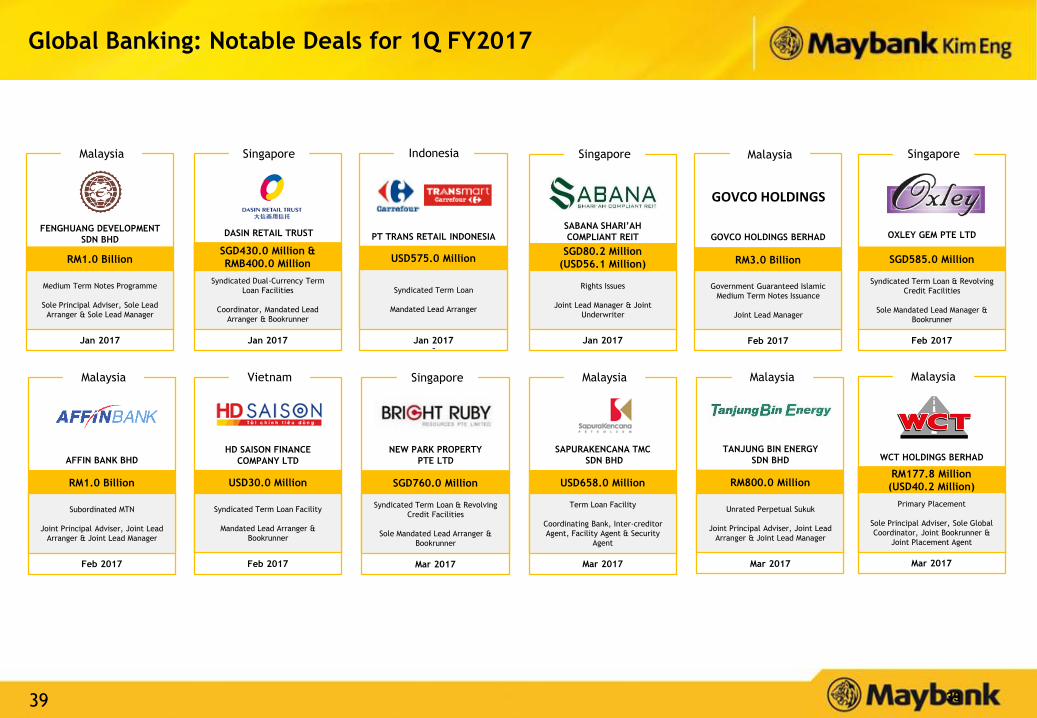
Global Banking: Notable Deals for 1Q FY2017
FENGHUANG DEVELOPMENT
SDN BHD
RM1.0 Billion
Medium Term Notes Programme
Sole Principal Adviser, Sole Lead
Arranger & Sole Lead Manager
Malaysia
Jan 2017
SGD430.0 Million &
RMB400.0 Million
DASIN RETAIL TRUST
Syndicated Dual-Currency Term
Loan Facilities
Coordinator, Mandated Lead
Arranger & Bookrunner
Singapore
Jan 2017
PT TRANS RETAIL INDONESIA
USD575.0 Million
Syndicated Term Loan
Mandated Lead Arranger
Indonesia
Jan 2017
GOVCO HOLDINGS BERHAD
RM3.0 Billion
Government Guaranteed Islamic
Medium Term Notes Issuance
Joint Lead Manager
Malaysia
Feb 2017
GOVCO HOLDINGS
Jan 2017
SABANA SHARI’AH
COMPLIANT REIT
SGD80.2 Million
(USD56.1 Million)
Rights Issues
Joint Lead Manager & Joint
Underwriter
Singapore
OXLEY GEM PTE LTD
SGD585.0 Million
Syndicated Term Loan & Revolving
Credit Facilities
Sole Mandated Lead Manager &
Bookrunner
Singapore
Feb 2017
AFFIN BANK BHD
RM1.0 Billion
Subordinated MTN
Joint Principal Adviser, Joint Lead
Arranger & Joint Lead Manager
Malaysia
Feb 2017
NEW PARK PROPERTY
PTE LTD
SGD760.0 Million
Syndicated Term Loan & Revolving
Credit Facilities
Sole Mandated Lead Arranger &
Bookrunner
Singapore
Mar 2017
HD SAISON FINANCE
COMPANY LTD
USD30.0 Million
Syndicated Term Loan Facility
Mandated Lead Arranger &
Bookrunner
Vietnam
Feb 2017
SAPURAKENCANA TMC
SDN BHD
USD658.0 Million
Term Loan Facility
Coordinating Bank, Inter-creditor
Agent, Facility Agent & Security
Agent
Malaysia
Mar 2017
TANJUNG BIN ENERGY
SDN BHD
RM800.0 Million
Unrated Perpetual Sukuk
Joint Principal Adviser, Joint Lead
Arranger & Joint Lead Manager
Malaysia
Mar 2017
WCT HOLDINGS BERHAD
RM177.8 Million
(USD40.2 Million)
Primary Placement
Sole Principal Adviser, Sole Global
Coordinator, Joint Bookrunner &
Joint Placement Agent
Malaysia
Mar 2017
40
Table of Contents
Executive Summary 2
Results Overview 5
Prospects & Outlook 20
Appendix:
1. Financial Performance 23
2. Community Financial Services 31
3. Global Banking 36
4. Maybank Singapore 41
5. Maybank Indonesia 45
6. Other segments 50
7. Affiliates 55
Financial Results: 1Q FY2017 ended 31 March 2017
41
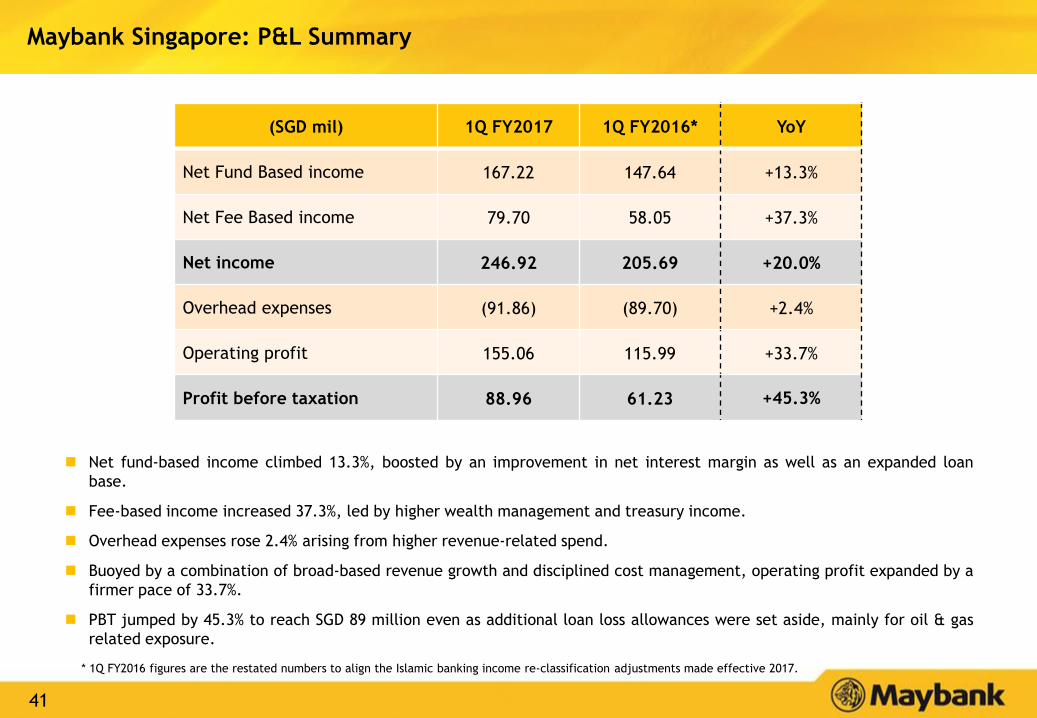
Maybank Singapore: P&L Summary
(SGD mil) 1Q FY2017 1Q FY2016* YoY
Net Fund Based income 167.22 147.64 +13.3%
Net Fee Based income 79.70 58.05 +37.3%
Net income 246.92 205.69 +20.0%
Overhead expenses (91.86) (89.70) +2.4%
Operating profit 155.06 115.99 +33.7%
Profit before taxation 88.96 61.23 +45.3%
Net fund-based income climbed 13.3%, boosted by an improvement in net interest margin as well as an expanded loan
base.
Fee-based income increased 37.3%, led by higher wealth management and treasury income.
Overhead expenses rose 2.4% arising from higher revenue-related spend.
Buoyed by a combination of broad-based revenue growth and disciplined cost management, operating profit expanded by a
firmer pace of 33.7%.
PBT jumped by 45.3% to reach SGD 89 million even as additional loan loss allowances were set aside, mainly for oil & gas
related exposure.
* 1Q FY2016 figures are the restated numbers to align the Islamic banking income re-classification adjustments made effective 2017.
42
8.5 8.4 8.4
3.8 4.9 4.9
3.8 4.2 3.9
5.9 6.3 6.5
9.5 9.7 9.9
1.7 1.8 1.93.4 3.5 3.5
Mar 16 Dec 16 Mar 17
Other(Consumer)
Car Loan
Housing Loan
Others(Corporate)
Non-Bankfinancial Inst
GeneralCommerce
Building &Const
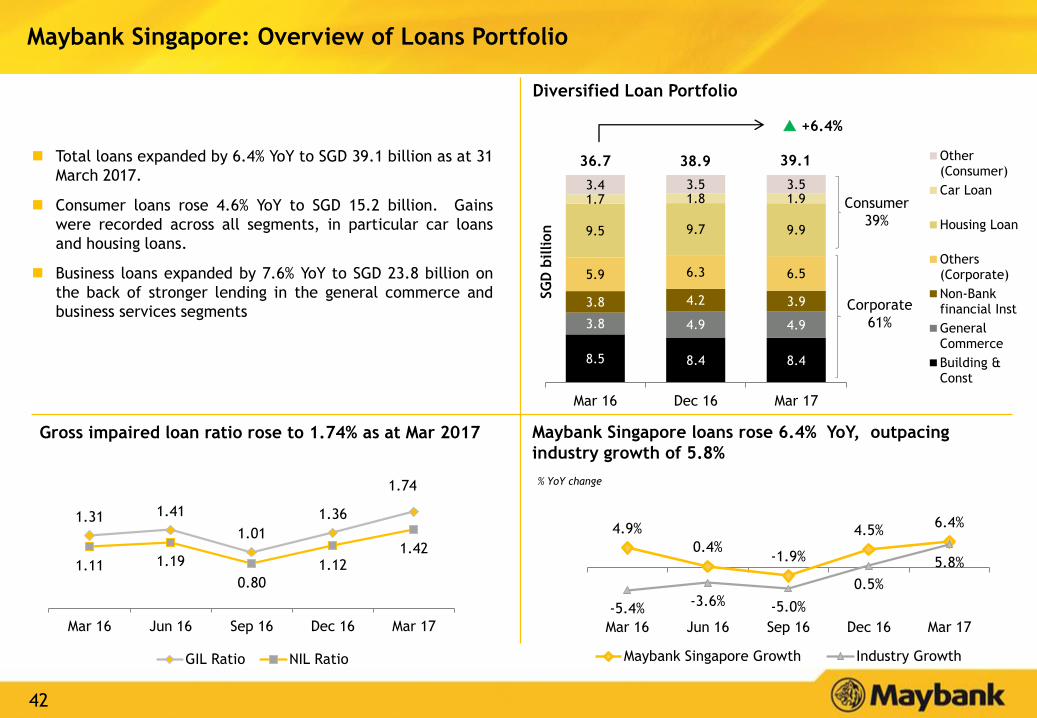
Gross impaired loan ratio rose to 1.74% as at Mar 2017 Maybank Singapore loans rose 6.4% YoY, outpacing
industry growth of 5.8%
Diversified Loan Portfolio
38.9
Consumer
39%
Corporate
61%
SG
D b
illion
Total loans expanded by 6.4% YoY to SGD 39.1 billion as at 31
March 2017.
Consumer loans rose 4.6% YoY to SGD 15.2 billion. Gains
were recorded across all segments, in particular car loans
and housing loans.
Business loans expanded by 7.6% YoY to SGD 23.8 billion on
the back of stronger lending in the general commerce and
business services segments
4.9%
0.4%-1.9%
4.5%6.4%
-5.4%-3.6% -5.0%
0.5%
5.8%
-10.0%
10.0%
Mar 16 Jun 16 Sep 16 Dec 16 Mar 17
Maybank Singapore Growth Industry Growth
+6.4%
Maybank Singapore: Overview of Loans Portfolio
1.31 1.41
1.01
1.36
1.74
1.11 1.19
0.80
1.121.42
Mar 16 Jun 16 Sep 16 Dec 16 Mar 17
GIL Ratio NIL Ratio
% YoY change
39.136.7
43
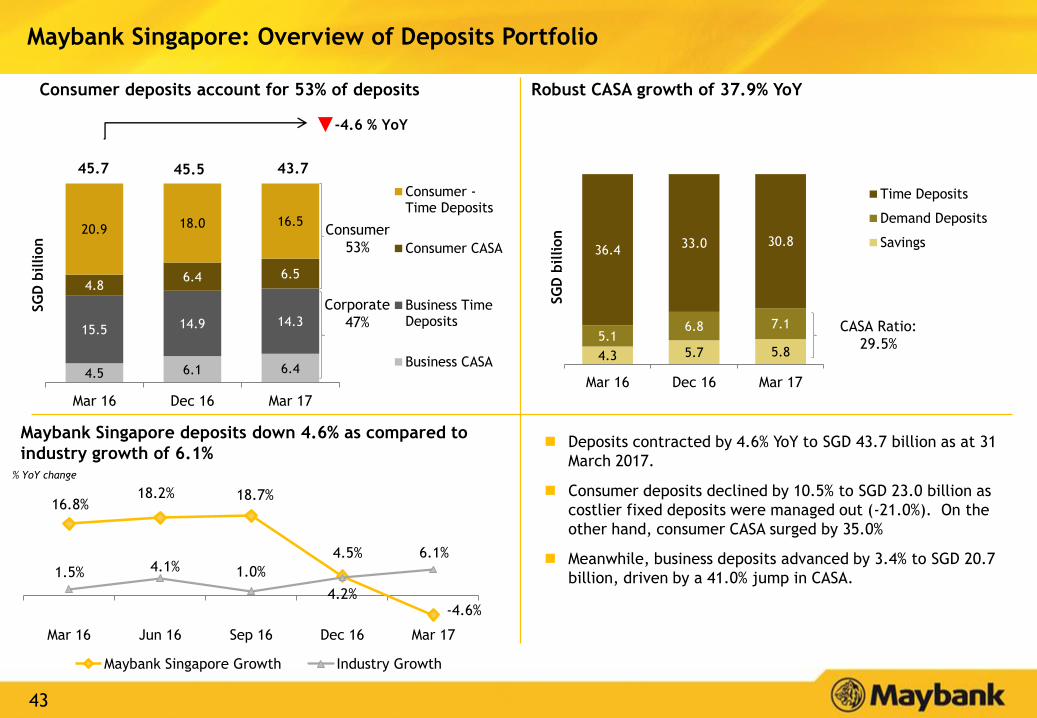
-4.6 % YoY
4.5 6.1 6.4
15.5 14.9 14.3
4.86.4 6.5
20.9 18.0 16.5
Mar 16 Dec 16 Mar 17
Consumer -Time Deposits
Consumer CASA
Business TimeDeposits
Business CASA
Maybank Singapore: Overview of Deposits Portfolio
45.5
Consumer
53%
Corporate
47%
SG
D b
illion
4.3 5.7 5.8
5.16.8 7.1
36.433.0 30.8
Mar 16 Dec 16 Mar 17
Time Deposits
Demand Deposits
Savings
CASA Ratio:
29.5%
16.8%18.2% 18.7%
4.5%
-4.6%
1.5% 4.1% 1.0%
4.2%
6.1%
Mar 16 Jun 16 Sep 16 Dec 16 Mar 17
Maybank Singapore Growth Industry Growth
Deposits contracted by 4.6% YoY to SGD 43.7 billion as at 31
March 2017.
Consumer deposits declined by 10.5% to SGD 23.0 billion as
costlier fixed deposits were managed out (-21.0%). On the
other hand, consumer CASA surged by 35.0%
Meanwhile, business deposits advanced by 3.4% to SGD 20.7
billion, driven by a 41.0% jump in CASA.
SG
D b
illion
% YoY change
Maybank Singapore deposits down 4.6% as compared to
industry growth of 6.1%
Consumer deposits account for 53% of deposits Robust CASA growth of 37.9% YoY
43.745.7
44
Table of Contents
Executive Summary 2
Results Overview 5
Prospects & Outlook 20
Appendix:
1. Financial Performance 23
2. Community Financial Services 31
3. Global Banking 36
4. Maybank Singapore 41
5. Maybank Indonesia 45
6. Other segments 50
7. Affiliates 55
Financial Results: 1Q FY2017 ended 31 March 2017
45
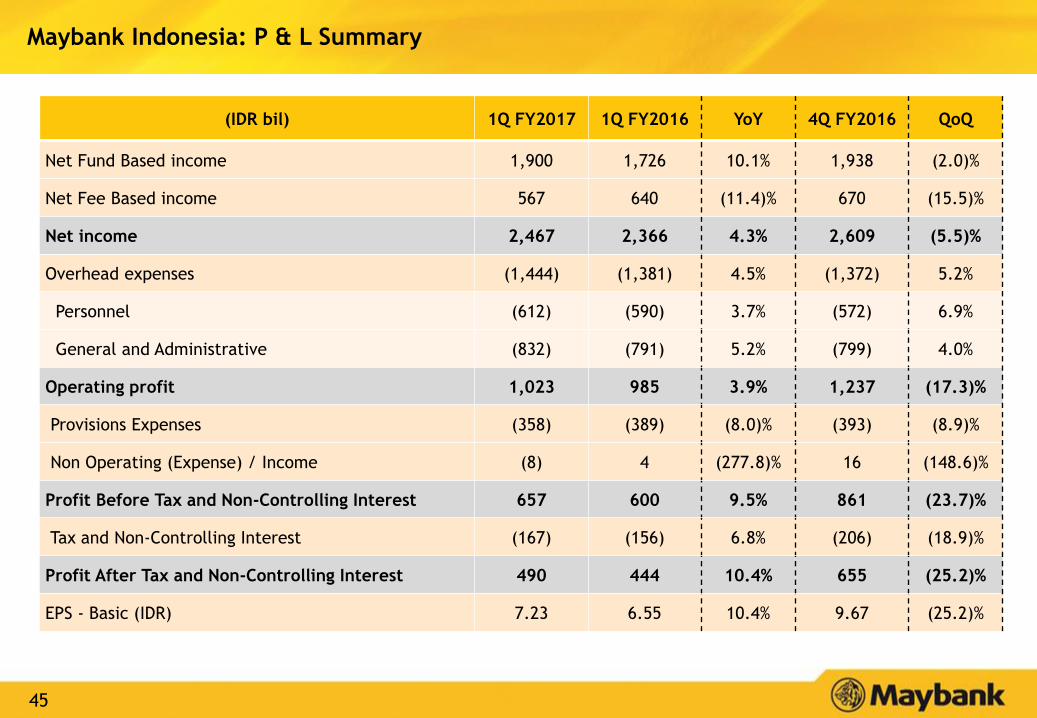
Maybank Indonesia: P & L Summary
(IDR bil) 1Q FY2017 1Q FY2016 YoY 4Q FY2016 QoQ
Net Fund Based income 1,900 1,726 10.1% 1,938 (2.0)%
Net Fee Based income 567 640 (11.4)% 670 (15.5)%
Net income 2,467 2,366 4.3% 2,609 (5.5)%
Overhead expenses (1,444) (1,381) 4.5% (1,372) 5.2%
Personnel (612) (590) 3.7% (572) 6.9%
General and Administrative (832) (791) 5.2% (799) 4.0%
Operating profit 1,023 985 3.9% 1,237 (17.3)%
Provisions Expenses (358) (389) (8.0)% (393) (8.9)%
Non Operating (Expense) / Income (8) 4 (277.8)% 16 (148.6)%
Profit Before Tax and Non-Controlling Interest 657 600 9.5% 861 (23.7)%
Tax and Non-Controlling Interest (167) (156) 6.8% (206) (18.9)%
Profit After Tax and Non-Controlling Interest 490 444 10.4% 655 (25.2)%
EPS - Basic (IDR) 7.23 6.55 10.4% 9.67 (25.2)%

46
16.2 17.3 20.4 18.9
25.6 25.6 25.6 24.8
73.7 71.9 72.9 74.0
Dec-15 Mar-16 Dec-16 Mar-17
Current Account Saving Account Time Deposit
21.5 21.5 25.7 26.0
91.1 91.3 96.0 93.8
Dec-15 Mar-16 Dec-16 Mar-17
Global Banking Community Financial Services (CFS)
6.2% YoY
Asset Quality (Consolidated)
Loans composition (Consolidated) IDR Trillion
Maybank Indonesia: Portfolio Overview
112.9112.5119.9121.8
Net Interest Margin (Consolidated)
Deposits (Consolidated) IDR Trillion
2.5% YoY
114.8115.5 117.7118.9
3.82% 3.79% 3.90%3.51% 3.63%
2.56% 2.42% 2.32% 2.25% 2.26%
Mar-16 Jun-16 Sep-16 Dec-16 Mar-17
Impaired Loans - Gross Impaired Loans - Net
4.84% 4.83%5.12% 5.17%
Dec-15 Mar-16 Dec-16 Mar-17
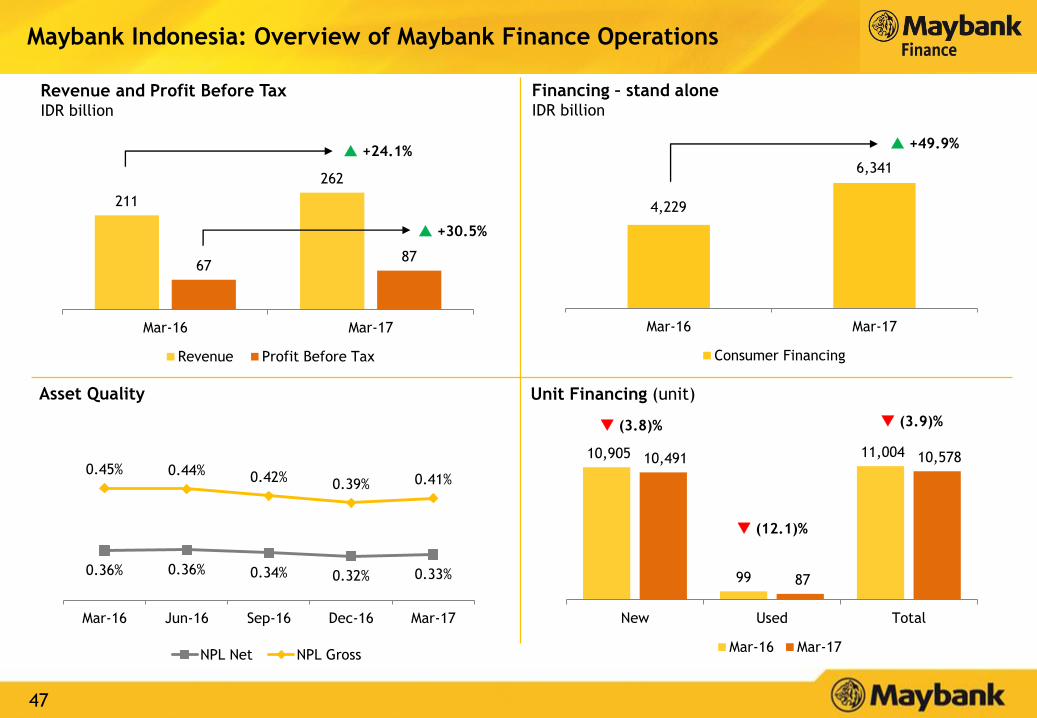
47
4,229
6,341
Mar-16 Mar-17
Consumer Financing
10,905
99
11,004 10,491
87
10,578
New Used Total
Mar-16 Mar-17
211
262
6787
Mar-16 Mar-17
Revenue Profit Before Tax
(3.8)%
(12.1)%
(3.9)%
+24.1% +49.9%
Asset Quality
Financing – stand aloneIDR billion
Unit Financing (unit)
Revenue and Profit Before Tax IDR billion
Maybank Indonesia: Overview of Maybank Finance Operations
+30.5%
0.36% 0.36% 0.34% 0.32% 0.33%
0.45% 0.44% 0.42%0.39% 0.41%
Mar-16 Jun-16 Sep-16 Dec-16 Mar-17
NPL Net NPL Gross
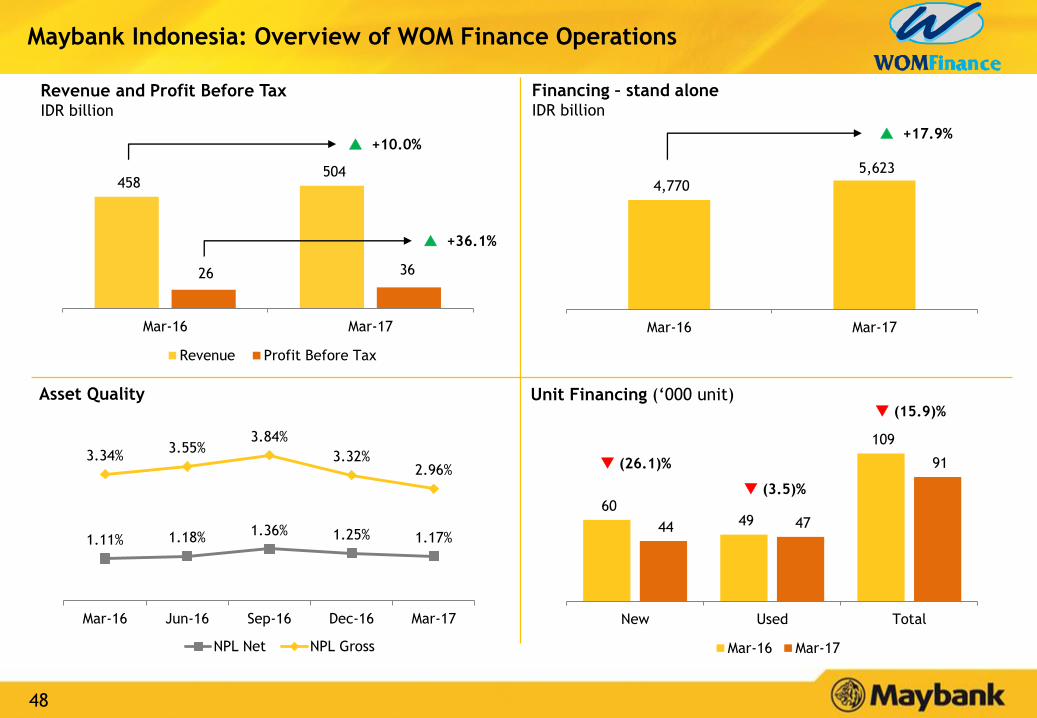
48
458 504
26 36
Mar-16 Mar-17
Revenue Profit Before Tax
Unit Financing (‘000 unit)
1.11% 1.18%1.36% 1.25% 1.17%
3.34%3.55%
3.84%
3.32%2.96%
Mar-16 Jun-16 Sep-16 Dec-16 Mar-17
NPL Net NPL Gross
60 49
109
44 47
91
New Used Total
Mar-16 Mar-17
(26.1)%
(3.5)%
(15.9)%Asset Quality
+10.0% +17.9%
Maybank Indonesia: Overview of WOM Finance Operations
+36.1%
4,770
5,623
Mar-16 Mar-17
Financing – stand aloneIDR billion
Revenue and Profit Before Tax IDR billion
49
Table of Contents
Executive Summary 2
Results Overview 5
Prospects & Outlook 20
Appendix:
1. Financial Performance 23
2. Community Financial Services 31
3. Global Banking 36
4. Maybank Singapore 41
5. Maybank Indonesia 45
6. Other segments 50
7. Affiliates 55
Financial Results: 1Q FY2017 ended 31 March 2017
50
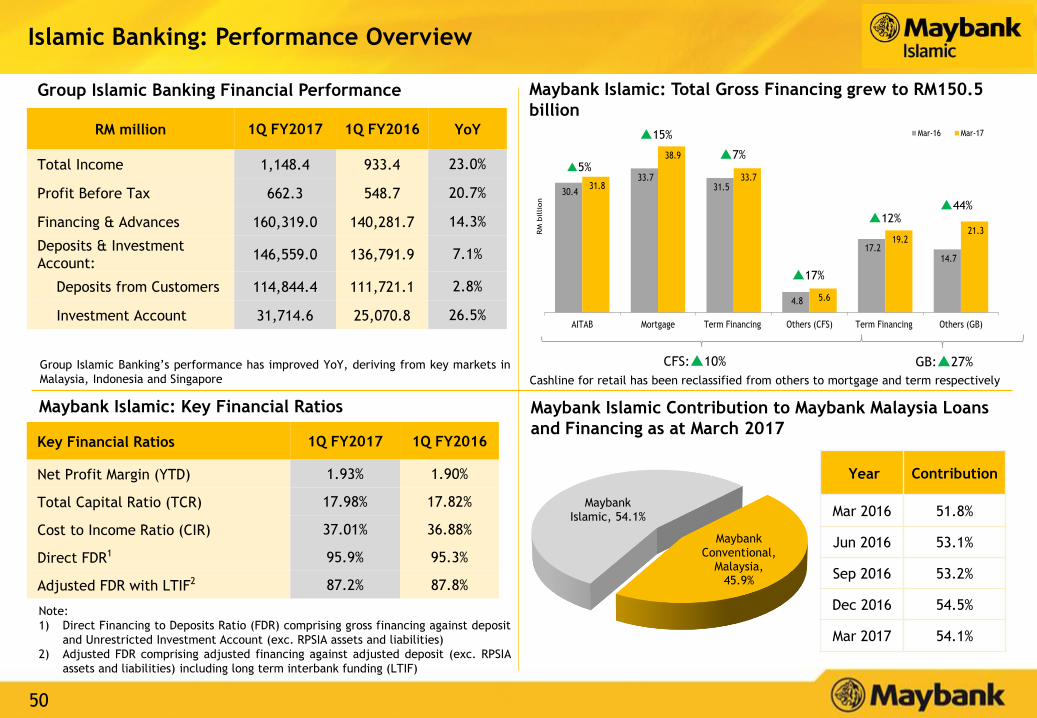
Maybank Islamic, 54.1%
Maybank Conventional,
Malaysia, 45.9%
30.4
33.7 31.5
4.8
17.2 14.7
31.8
38.9
33.7
5.6
19.2 21.3
AITAB Mortgage Term Financing Others (CFS) Term Financing Others (GB)
RM
billion
Mar-16 Mar-17
Islamic Banking: Performance Overview
Group Islamic Banking Financial Performance
Maybank Islamic: Key Financial Ratios
Maybank Islamic: Total Gross Financing grew to RM150.5
billion
CFS:10%
RM million 1Q FY2017 1Q FY2016 YoY
Total Income 1,148.4 933.4 23.0%
Profit Before Tax 662.3 548.7 20.7%
Financing & Advances 160,319.0 140,281.7 14.3%
Deposits & Investment
Account:146,559.0 136,791.9 7.1%
Deposits from Customers 114,844.4 111,721.1 2.8%
Investment Account 31,714.6 25,070.8 26.5%
Key Financial Ratios 1Q FY2017 1Q FY2016
Net Profit Margin (YTD) 1.93% 1.90%
Total Capital Ratio (TCR) 17.98% 17.82%
Cost to Income Ratio (CIR) 37.01% 36.88%
Direct FDR1 95.9% 95.3%
Adjusted FDR with LTIF2 87.2% 87.8%
Maybank Islamic Contribution to Maybank Malaysia Loans
and Financing as at March 2017
Year Contribution
Mar 2016 51.8%
Jun 2016 53.1%
Sep 2016 53.2%
Dec 2016 54.5%
Mar 2017 54.1%
Note:
1) Direct Financing to Deposits Ratio (FDR) comprising gross financing against deposit
and Unrestricted Investment Account (exc. RPSIA assets and liabilities)
2) Adjusted FDR comprising adjusted financing against adjusted deposit (exc. RPSIA
assets and liabilities) including long term interbank funding (LTIF)
GB:27%
15%
7%
17%
44%
5%
12%
Cashline for retail has been reclassified from others to mortgage and term respectively
Group Islamic Banking’s performance has improved YoY, deriving from key markets in
Malaysia, Indonesia and Singapore
51
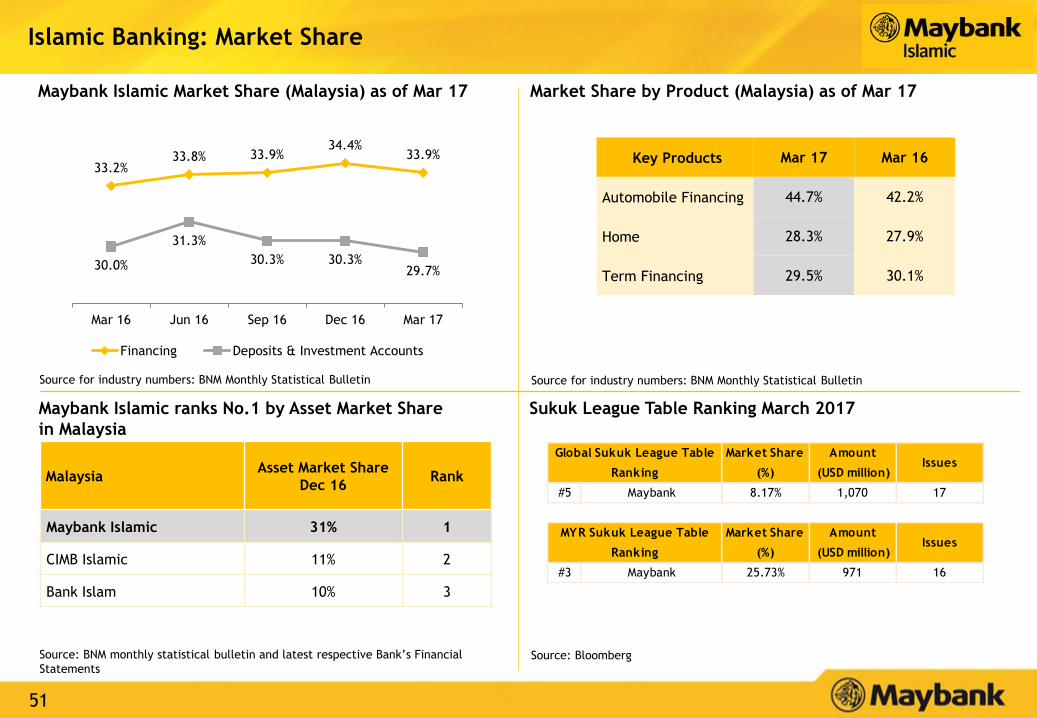
Maybank Islamic Market Share (Malaysia) as of Mar 17
Maybank Islamic ranks No.1 by Asset Market Share
in Malaysia
Source: BNM monthly statistical bulletin and latest respective Bank’s Financial
Statements
MalaysiaAsset Market Share
Dec 16Rank
Maybank Islamic 31% 1
CIMB Islamic 11% 2
Bank Islam 10% 3
Source: Bloomberg
Sukuk League Table Ranking March 2017
Key Products Mar 17 Mar 16
Automobile Financing 44.7% 42.2%
Home 28.3% 27.9%
Term Financing 29.5% 30.1%
Source for industry numbers: BNM Monthly Statistical Bulletin
Islamic Banking: Market Share
Market Share by Product (Malaysia) as of Mar 17
Source for industry numbers: BNM Monthly Statistical Bulletin
Market Share
(%)
Amount
(USD million)Issues
#5 Maybank 8.17% 1,070 17
Market Share
(%)
Amount
(USD million)Issues
#3 Maybank 25.73% 971 16
Global Sukuk League Table
Ranking
MYR Sukuk League Table
Ranking
33.2%33.8% 33.9%
34.4%33.9%
30.0%
31.3%
30.3% 30.3%29.7%
Mar 16 Jun 16 Sep 16 Dec 16 Mar 17
Financing Deposits & Investment Accounts
52
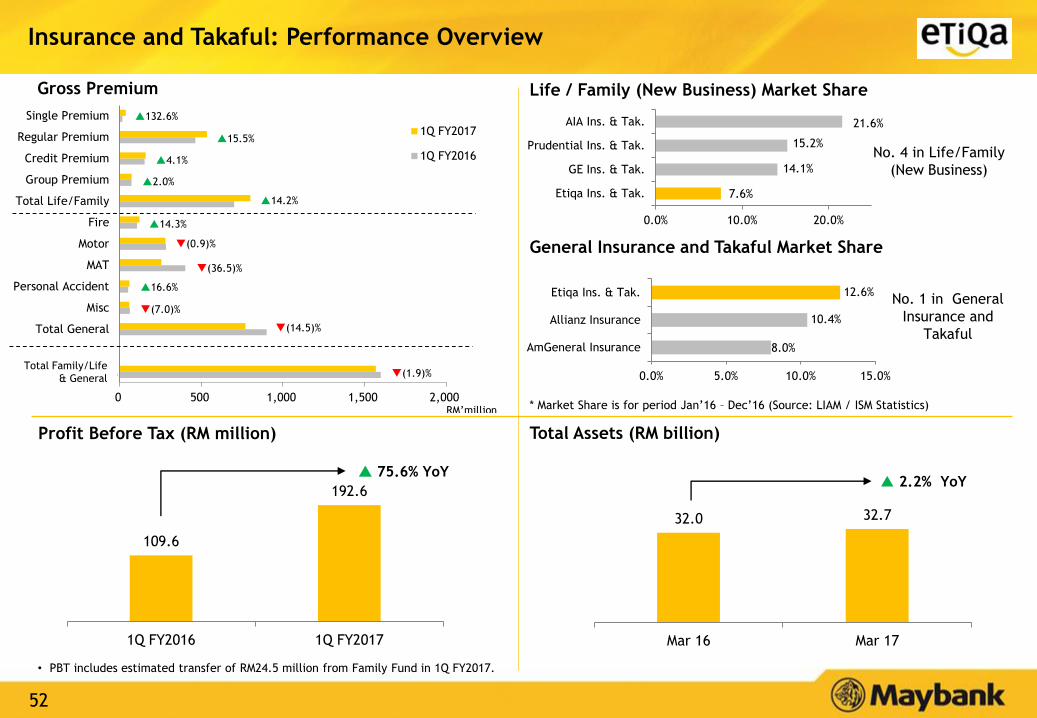
32.0 32.7
Mar 16 Mar 17
109.6
192.6
1Q FY2016 1Q FY2017
Insurance and Takaful: Performance Overview
Total Assets (RM billion)
Gross Premium
Profit Before Tax (RM million)
• PBT includes estimated transfer of RM24.5 million from Family Fund in 1Q FY2017.
Life / Family (New Business) Market Share
No. 4 in Life/Family
(New Business)
No. 1 in General
Insurance and
Takaful
* Market Share is for period Jan’16 – Dec’16 (Source: LIAM / ISM Statistics)
General Insurance and Takaful Market Share
75.6% YoY 2.2% YoY
0 500 1,000 1,500 2,000
Total Life/Family…
Total General
Misc
Personal Accident
MAT
Motor
Fire
Total Life/Family
Group Premium
Credit Premium
Regular Premium
Single Premium
1Q FY2017
1Q FY2016
Total Family/Life
& General
RM’million
132.6%
15.5%
4.1%
2.0%
14.2%
14.3%
16.6%
(0.9)%
(36.5)%
(7.0)%
(14.5)%
(1.9)%
7.6%
14.1%
15.2%
21.6%
0.0% 10.0% 20.0%
Etiqa Ins. & Tak.
GE Ins. & Tak.
Prudential Ins. & Tak.
AIA Ins. & Tak.
8.0%
10.4%
12.6%
0.0% 5.0% 10.0% 15.0%
AmGeneral Insurance
Allianz Insurance
Etiqa Ins. & Tak.
53
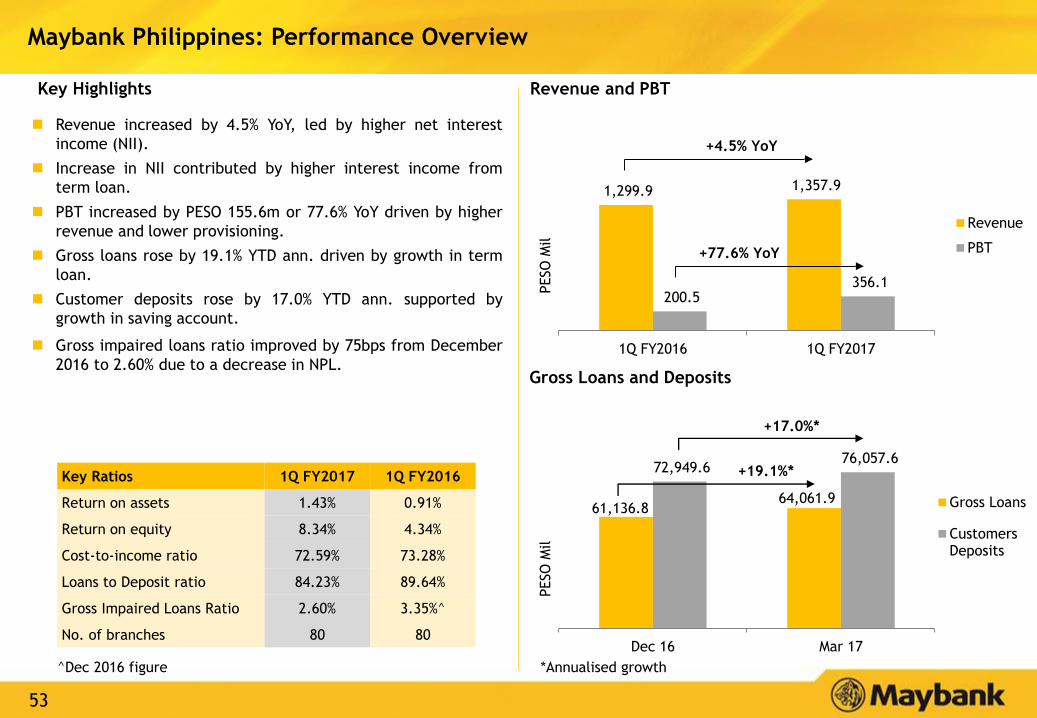
61,136.8 64,061.9
72,949.6 76,057.6
Dec 16 Mar 17
Gross Loans
CustomersDeposits
1,299.9 1,357.9
200.5 356.1
1Q FY2016 1Q FY2017
Revenue
PBT
Maybank Philippines: Performance Overview
Revenue increased by 4.5% YoY, led by higher net interest
income (NII).
Increase in NII contributed by higher interest income from
term loan.
PBT increased by PESO 155.6m or 77.6% YoY driven by higher
revenue and lower provisioning.
Gross loans rose by 19.1% YTD ann. driven by growth in term
loan.
Customer deposits rose by 17.0% YTD ann. supported by
growth in saving account.
Gross impaired loans ratio improved by 75bps from December
2016 to 2.60% due to a decrease in NPL.
+4.5% YoY
+77.6% YoY
Revenue and PBT
Gross Loans and Deposits
Key Highlights
PESO
Mil
PESO
Mil
+19.1%*
+17.0%*
Key Ratios 1Q FY2017 1Q FY2016
Return on assets 1.43% 0.91%
Return on equity 8.34% 4.34%
Cost-to-income ratio 72.59% 73.28%
Loans to Deposit ratio 84.23% 89.64%
Gross Impaired Loans Ratio 2.60% 3.35%^
No. of branches 80 80
*Annualised growth^Dec 2016 figure
54
Table of Contents
Executive Summary 2
Results Overview 5
Prospects & Outlook 20
Appendix:
1. Financial Performance 23
2. Community Financial Services 31
3. Global Banking 36
4. Maybank Singapore 41
5. Maybank Indonesia 45
6. Other segments 50
7. Affiliates 55
Financial Results: 1Q FY2017 ended 31 March 2017
55
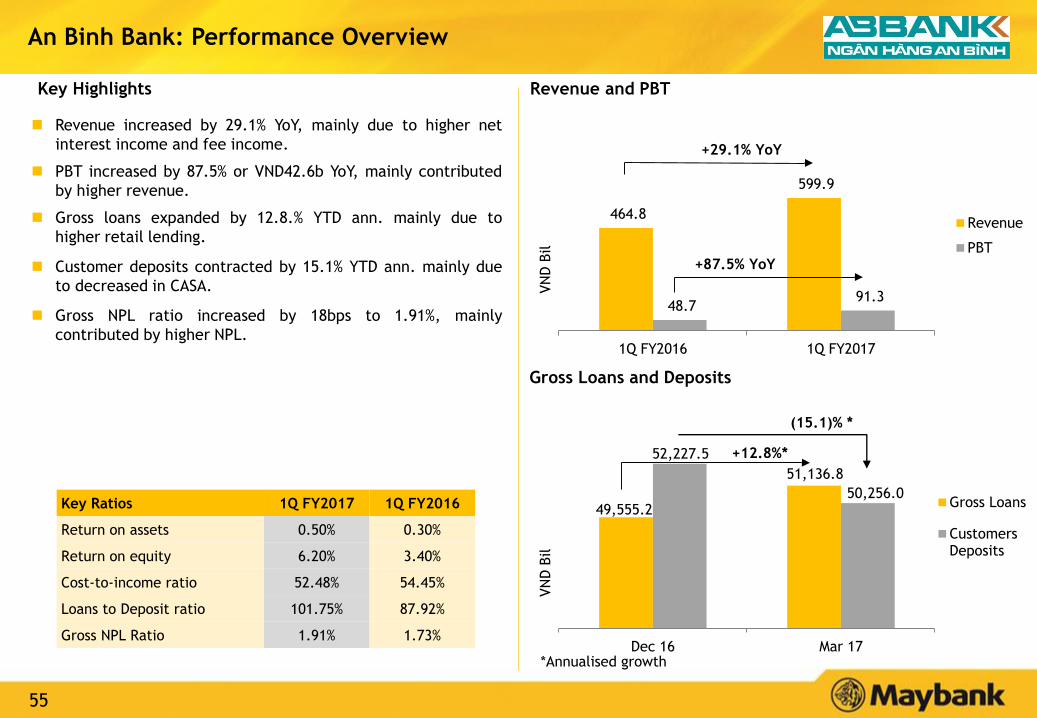
464.8
599.9
48.7 91.3
1Q FY2016 1Q FY2017
Revenue
PBT
An Binh Bank: Performance Overview
Revenue increased by 29.1% YoY, mainly due to higher net
interest income and fee income.
PBT increased by 87.5% or VND42.6b YoY, mainly contributed
by higher revenue.
Gross loans expanded by 12.8.% YTD ann. mainly due to
higher retail lending.
Customer deposits contracted by 15.1% YTD ann. mainly due
to decreased in CASA.
Gross NPL ratio increased by 18bps to 1.91%, mainly
contributed by higher NPL.
Key Ratios 1Q FY2017 1Q FY2016
Return on assets 0.50% 0.30%
Return on equity 6.20% 3.40%
Cost-to-income ratio 52.48% 54.45%
Loans to Deposit ratio 101.75% 87.92%
Gross NPL Ratio 1.91% 1.73%
VN
D B
ilVN
D B
il
+29.1% YoY
+87.5% YoY
49,555.2
51,136.8
52,227.5
50,256.0
Dec 16 Mar 17
Gross Loans
CustomersDeposits
+12.8%*
(15.1)% *
Gross Loans and Deposits
Revenue and PBTKey Highlights
*Annualised growth

56
MCB Bank: Performance Overview
14.7 15.1
9.3 9.4
1Q FY2016 1Q FY2017
Revenue
PBT
+3.2% YoY
0.3% YoY
384.0 392.8
776.0 816.5
Dec 16 Mar 17
Gross Loans
CustomersDeposits
+20.9%*
+9.1%*
PKR B
ilPKR B
il
Key Ratios 1Q FY2017 1Q FY2016
Return on assets 2.02% 2.36%
Return on equity 19.54% 21.19%
Cost-to-income ratio 45.28% 40.91%
Loans to Deposit ratio 48.10% 46.52%
Gross NPL Ratio 5.39% 6.23%
Gross Loans and Deposits
Revenue and PBT increased by 3.2% and 0.3% YoY respectively,
mainly due to increase in non-interest income (NOII).
Higher NOII was mainly attributed from gain on sale of
securities.
Gross loans increased by 9.1% YTD ann. mainly driven by
growth in domestic loans and Islamic financing.
Customer deposits grew by 20.9% YTD ann. mainly
contributed by higher CASA.
Gross NPL ratio improved from 6.23% to 5.39%, contributed by
higher loan base.
Revenue and PBTKey Highlights
*Annualised growth
57
Dato’ Amirul Feisal Wan Zahir
Group Chief Financial Officer
Contact: (6)03-2074 7703
Email: [email protected]
MALAYAN BANKING BERHAD
14th Floor, Menara Maybank
100, Jalan Tun Perak
50050 Kuala Lumpur, Malaysia
Tel : (6)03-2070 8833
www.maybank.com
Jeeva Arulampalam
Head, Group Investor Relations
Contact: (6)03-2074 8346
Email: [email protected]
Disclaimer. This presentation has been prepared by Malayan Banking Berhad (the “Company”) for information purposes only and does not purport to contain all the
information that may be required to evaluate the Company or its financial position. No representation or warranty, express or implied, is given by or on behalf of the
Company as to the accuracy or completeness of the information or opinions contained in this presentation.
The presentation does not constitute or form part of an offer, solicitation or invitation of any offer, to buy or subscribe for any securities, nor should it or any part of
it form the basis of, or be relied in any connection with, any contract, investment decision or commitment whatsoever.
The Company does not accept any liability whatsoever for any loss howsoever arising from any use of this presentation or their contents or otherwise arising in
connection therewith.
Investor Relations Contact
Humanising Financial Services