2012 1Q Earnings Release - images.samsung.com · - Handset : Demand to grow slightly QoQ,...
12
Earnings Release Q1 2012 S El t i Samsung Electronics April 2012
Transcript of 2012 1Q Earnings Release - images.samsung.com · - Handset : Demand to grow slightly QoQ,...

Earnings Release Q1 2012
S El t iSamsung Electronics
April 2012

DisclaimerDisclaimer
The financial information in this document are consolidated earnings results based on K-IFRS.
This document is provided for the convenience of investors only, before our external audit on Q1 2012 financial
results of our headquarters is completed. The audit outcomes may cause some parts of this document to change.
This document contains "forward-looking statements" - that is, statements related to future, not past, events.
In this context, "forward-looking statements" often address our expected future business and financial performance,
and often contain words such as "expects”, "anticipates”, "intends”, "plans”, "believes”, "seeks” or "will ". p , p , , p , ,
“Forward-looking statements" by their nature address matters that are, to different degrees, uncertain.
For us, particular uncertainties which could adversely or positively affect our future results include:
· The behavior of financial markets including fluctuations in exchange rates interest rates and commodity prices The behavior of financial markets including fluctuations in exchange rates, interest rates and commodity prices
· Strategic actions including dispositions and acquisitions
· Unanticipated dramatic developments in our major businesses including CE (Consumer Electronics),
IM (IT & Mobile communications), Semiconductor, DP (Display Panel)
Numerous other matters at the national and international levels which could affect our future results· Numerous other matters at the national and international levels which could affect our future results
These uncertainties may cause our actual results to be materially different from those expressed in this document.

Segment Sales & Operating ProfitSegment Sales & Operating ProfitSales
(Unit: Trillion Won) 1Q ’12 Y-on-Y 1Q ‘11 4Q ’11
Total 45.27 22%↑ 36.99 47.30
DMC 34.25 40%↑ 24.50 35.23CE 10.67 2%↑ 10.47 14.00
- VD 7.71 0.3%↑ 7.68 10.88
IM 23.22 70%↑ 13.69 20.78- Mobile 18.90 86%↑ 10.14 17.18
DS 16.33 5%↑ 15.55 17.61Semiconductor 7.98 13%↓ 9.18 9.17
Memory 4 89 17%↓ 5 87 5 45
※ Sales includes intersegment sales
- Memory 4.89 17%↓ 5.87 5.45
DP 8.54 31%↑ 6.51 8.55- LCD 6.18 17%↑ 5.27 6.25
Others △5.31 - △3.06 △5.54
Operating Profit(Unit: Trillion Won) 1Q ’12 Y-on-Y 1Q ‘11 4Q ’11
Total 5.85 98%↑ 2.95 5.30
DMC 4 77 209%↑ 1 54 3 20DMC 4.77 209%↑ 1.54 3.20
CE 0.53 550%↑ 0.08 0.66
IM 4.27 193%↑ 1.46 2.54
DS 1.06 25%↓ 1.42 2.06
Semiconductor 0 76 54%↓ 1 64 2 31
1Note) DMC (Digital Media & Communications), CE (Consumer Electronics), IM (IT & Mobile communications), DS (Device Solutions), DP (Display Panel)
Semiconductor 0.76 54%↓ 1.64 2.31
DP 0.28 - △0.23 △0.22
Others 0.02 - △0.01 0.04

Income Statement Income Statement
(Unit: Trillion Won) 1Q ’12 % of sales Y-on-Y 1Q ’11 % of sales 4Q ’11 % of sales
Sales 45.27 100% 22%↑ 36.99 100% 47.30 100%
Cost of Sales 30.14 66.6% 16%↑ 26.05 70.4% 31.51 66.6%
Gross Profit 15.13 33.4% 38%↑ 10.93 29.6% 15.79 33.4%
R&D expenses 2.73 6.0% 16%↑ 2.34 6.3% 2.74 5.8%
SG&A expenses 6.77 14.9% 17%↑ 5.79 15.7% 8.46 17.9%
Other operating profits/losses 0.21 0.5% 40%↑ 0.15 0.4% 0.70 1.5%
Operating Profit 5.85 12.9% 98%↑ 2.95 8.0% 5.30 11.2%
Equity method gains/losses 0.37 0.8% 2%↓ 0.38 1.0% 0.32 0.7%
Finance incomes/expenses 0.13 0.3% 108%↑ 0.06 0.2% △0.14 △0.3%
Profit Before Income Tax 6.35 14.0% 87%↑ 3.39 9.2% 5.47 11.6%
Income tax 1 30 2 9% 116%↑ 0 60 1 6% 1 47 3 1%
Key Profitability Indicators
Income tax 1.30 2.9% 116%↑ 0.60 1.6% 1.47 3.1%
Net profit 5.05 11.2% 81%↑ 2.78 7.5% 4.00 8.5%
1Q ’12 1Q ’11 4Q ’11
ROE 19% 12% 17%
Profitability (Net income/Sales) 0.11 0.08 0.0817%
19%16%
19%
21%
2
Asset turnover (Sales/Asset) 1.15 1.09 1.31
Leverage (Asset/Equity) 1.52 1.50 1.52
EBITDA Margin 21% 16% 19%
12%ROE EBITDA Margin
1Q ’11 4Q ’11 1Q ’12

Cash Flow StatementCash Flow Statement
(Unit: Trillion Won) 1Q ’12 4Q ’11( ) 1Q 12 4Q 11
Cash (Beginning of period)* 26.88 21.75
Cash flow from Operation 8.43 7.32
Net profit 5.05 4.00
Depreciation 3.49 3.49
Others △0.11 △0.17
Cash flow from Investment △8.02 △4.74
Increase in tangible assets △7.69 △5.93g
Cash flow from Finance △1.99 2.85
Increase in Debts △0.74 2.81
Net increase in cash △1.49 5.13
h d f i d *
Cash Balance
* Cash = Cash + Cash equivalents + Short-term financial instruments + Short-term available-for-sale securities
Cash (End of period)* 25.39 26.88
Cash Net Cash
22.34 19.07
10.798 10
21.75
9.60
25.39
11.52
26.88
12.23
3’11 1Q ’11 2Q ’11 3Q ’11 4Q
8.10
’12 1Q
9.60

Statement of Financial Position Statement of Financial Position
(Unit: Trillion Won) 1Q ’12 4Q ’11 1Q ’11
Current assets 71.29 71.50 60.96
Cash* 25.39 26.88 22.34
Trade accounts and notes receivable 21.90 21.88 17.74
Inventories 16.36 15.72 14.18
Non-current assets 88.86 84.13 75.58
Investments 13.49 12.82 12.18
PP&E 66.00 62.04 55.18
Total assets 160.16 155.63 136.53Debts 13.87 14.65 11.55
Total liabilities 54.65 53.79 45.03
Key Financial Indicators
* Cash = Cash + Cash equivalents + Short-term financial instruments + Short-term available-for-sale securities
Total shareholders’ equity 105.51 101.84 91.50
y
1Q ’12 4Q ’11 1Q ’11
Current ratio* 158% 161% 160%
Liability/Equity 52% 53% 49%
* Current ratio= Current assets/Current liabilities4
Debt/Equity 13% 14% 13%
Net debt/Equity △11% △12% △12%
1Q results1Q results
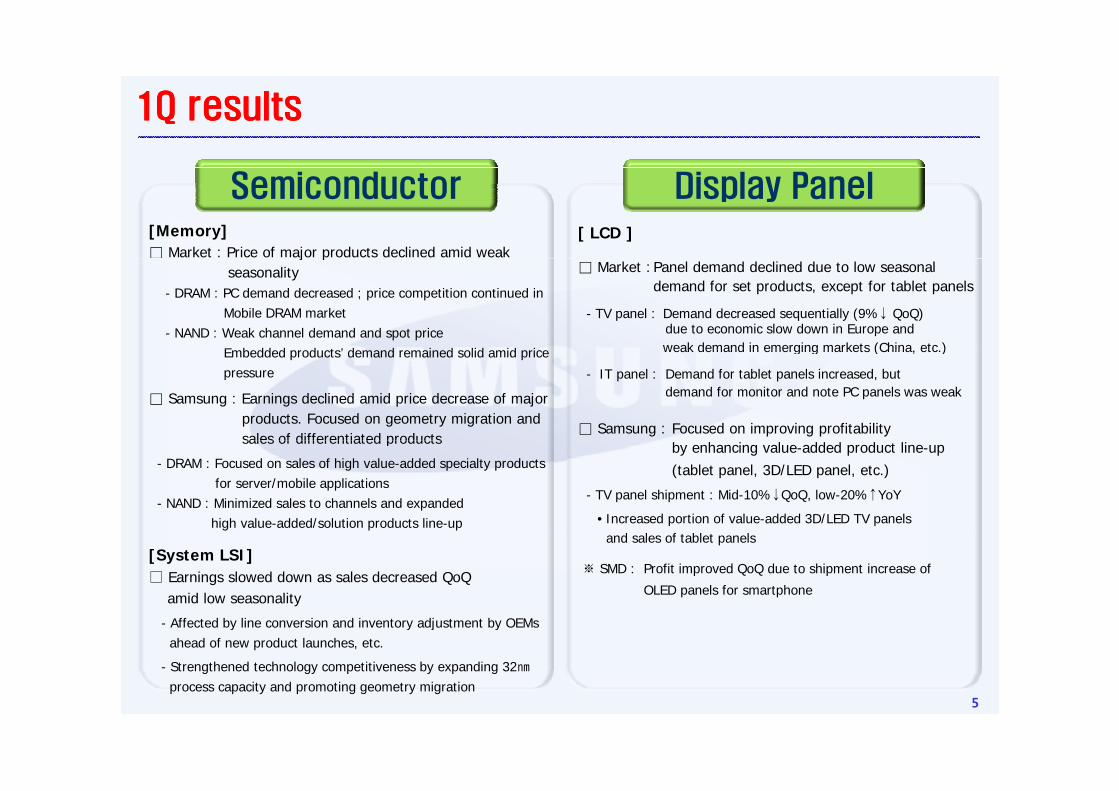
Semiconductor Display Panel[Memory]□ Market : Price of major products declined amid weak
[ LCD ]j p
seasonality - DRAM : PC demand decreased ; price competition continued in
Mobile DRAM market - NAND : Weak channel demand and spot price
E b dd d d t ’ d d i d lid id i
□ Market : Panel demand declined due to low seasonaldemand for set products, except for tablet panels
- TV panel : Demand decreased sequentially (9%↓ QoQ)due to economic slow down in Europe and weak demand in emerging markets (China etc )Embedded products’ demand remained solid amid price
pressure
□ Samsung : Earnings declined amid price decrease of majorproducts. Focused on geometry migration andsales of differentiated products
weak demand in emerging markets (China, etc.)
- IT panel : Demand for tablet panels increased, but demand for monitor and note PC panels was weak
□ Samsung : Focused on improving profitabilitysales of differentiated products
- DRAM : Focused on sales of high value-added specialty products for server/mobile applications
- NAND : Minimized sales to channels and expanded high value-added/solution products line-up
by enhancing value-added product line-up(tablet panel, 3D/LED panel, etc.)
- TV panel shipment : Mid-10%↓QoQ, low-20%↑YoY
• Increased portion of value-added 3D/LED TV panels
[System LSI]□ Earnings slowed down as sales decreased QoQ
amid low seasonality
- Affected by line conversion and inventory adjustment by OEMs
and sales of tablet panels
※ SMD : Profit improved QoQ due to shipment increase of
OLED panels for smartphone
- Affected by line conversion and inventory adjustment by OEMs ahead of new product launches, etc.
- Strengthened technology competitiveness by expanding 32㎚
process capacity and promoting geometry migration 5

1Q results1Q results
I M C E
[Handset]
□ Market : Demand decreased low teens% QoQ
[ T V ]
□ Market : Overall market demand decreased QoQ□ Market : Demand decreased low teens% QoQamid low seasonal demand
- Demand for smartphones and feature phones decreased QoQdue to demand slowdown in developed markets
□ Market : Overall market demand decreased QoQ,amid low seasonality and demand slowdown in the developed markets
- Demand declined low-30%QoQ (remained flat on a YoY basis)
- LED TV portion : Approx. 50% in ’11.4Q → high-50% in ’12.1Q□ Samsung : Earnings increased significantly QoQ led by
product mix improvement → Strong smartphone sales
- Smartphone : Shipments increased across all regions, especially in the emerging markets
p pp g
□ Samsung : Outgrew the market with solid earnings led by increased sales of strategicLED TVs in developed/emerging markets
※ Shipment and earnings improved substantially YoYp y g g
· Steady sales of the existing models (Galaxy SⅡ, Ace, Y, etc.) and sales expansion of high-end strategic models (Galaxy Note, LTE, etc.)
- ASP increased QoQ led by product mix improvement
- Expanded line-up of premium LED TVs (7/8000 series) fordeveloped markets and localized LED TVs for emerging markets
- LED TV portion : Approx. 60% in ’11. 4Q → mid-60% in ’12.1Q
[Network/IT]
□ Network: Solid earnings driven by LTE business expansion
□ IT: Solid earnings led by sales expansion of mid/high-d PC id/hi h d l if i i
[ Digital appliances ]
□ Sales declined slightly QoQ amid market demandslowdown. Profitability improved due to increasing portionof premium products and raw material cost decline, etc
end PCs, mid/high-speed multifunction printers, etc.

Market outlook (2Q)
I MSemiconductor I MSemiconductor
□ Memory- DRAM : PC DRAM market situation to improve amid demand
turnaround. Price competition to persist in mobile DRAMmarket
□ Handset- Handset : Demand to grow slightly QoQ, especially smarthphones
· LTE smartphones to lead mid/high-end demand growth in US/Japan/Korea
- NAND : Channel demand to remain weak vs. demand for embedded products to increase led by new mobile devices and note PCsadopting SSD
□ System LSI S LSI Demand fo 32nm mobile AP and high pi el image
- Tablet : Competition in new product launches to continue
□ Network/ IT- Network : LTE infrastructure expansion to continue in the US
Domestic LTE demand to slowdownIT PC d d t li htl id k t
C EDisplay Panel
- S. LSI : Demand for 32nm mobile AP and high-pixel image sensors to increase, led by launches of new set products
□ LCD □ TV
- IT : PC demand to grow slightly amid market recovery Demand for printers to slowdown due to low seasonality
- Demand to grow amid new set product launches and
sales promotion related with Chinese Labor day, Olympics, and
back-to-school period
- However, risk factors co-exist including continued oversupply
- Overall market demand to be driven by growth of emerging market
and LED TVs
· LED TV portion to grow : High-50% in 1Q → mid-60% in 2Q
□ Digital appliances : Overall market to grow slightly led by
conditions, macro-economic uncertainties, etc.
※ Outlook for 2nd Half : Solid earnings momentum to continue due to demand increase for the set products and improved demand-supply conditions for the components amid seasonal pick-up etc
demand growth in the emerging markets and seasonal demand for air conditioners, etc.
7
demand-supply conditions for the components amid seasonal pick-up, etc.
- Component business : Demand-supply conditions to improve with launches of new products (eg: PC, mobile devices)
- Brand business : Demand for smart-phones expected to increase. Demand for TV/digital appliances to continue growing in the emerging markets and to improve in the developed markets

[Appendix 1] Statement of Financial Position (K-IFRS)(Unit : KRW 100 Million)
1Q '12(A)
FY '11(B)
1Q '11(C)
Q-on-Q (A - B)
Y-on-Y (A - C)
Current Assets 712,928 715,020 609,571 -2,092 103,357
- Cash ※ 253,902 268,776 223,408 -14,874 30,494
- A/R 219,003 218,821 177,433 182 41,570
- Inventories 163,565 157,167 141,763 6,398 21,802
- Other Current Assets 76,458 70,256 66,967 6,202 9,491
Non Current Assets 888,638 841,292 755,751 47,346 132,887
- Investment 134,874 128,184 121,801 6,690 13,073
- PP&E 659,984 620,440 551,821 39,544 108,163
- Intangible Assets 33,291 33,552 28,714 -261 4,577
- Other Non Current Assets 60,489 59,116 53,415 1,373 7,074
1,601,566 1,556,312 1,365,322 45,254 236,244
Liabilities 546,499 537,859 450,334 8,640 96,165
- Debts 138,688 146,466 115,478 -7,778 23,210
- Trade Accounts and N/P 116,714 102,767 97,026 13,947 19,688
- Other Accounts and N/P & Accrued Expenses 139,223 160,565 116,532 -21,342 22,691
- Income Tax Payable 23,843 12,628 16,839 11,215 7,004
- Unearned Revenue & Other Advances 30,884 31,658 22,609 -774 8,275
- Other Liabilities 97,147 83,775 81,850 13,372 15,297
Shareholders' Equity 1,055,067 1,018,453 914,988 36,614 140,079
- Capital Stock 8,975 8,975 8,975 0 0
1,601,566 1,556,312 1,365,322 45,254 236,244
※ Cash = Cash + Cash equivalent + Short-term financial instruments + Marketable securities
Total Liabilities &Shareholder's Equity
Total Assets

[Appendix 2] Income Statement (K-IFRS)(Unit : KRW 100 Million)
Q-on-Q Y-on-Y
(A) % (B) % (C) % (A - B) (A - C)
452,705 100% 473,040 100% 369,850 100% -20,335 82,855
301,384 66.6% 315,093 66.6% 260,544 70.4% -13,709 40,840
151,321 33.4% 157,947 33.4% 109,306 29.6% -6,626 42,015
27,284 6.0% 27,424 5.8% 23,441 6.3% -140 3,843
67,671 14.9% 84,576 17.9% 57,911 15.7% -16,905 9,760
- Wages & Fee 18,159 4.0% 18,304 3.9% 15,458 4.2% -145 2,701
- Marketing Expenses 21,536 4.8% 31,700 6.7% 17,197 4.6% -10,164 4,339
SG&A
Gross Profit
Sales
Cost of Sales
R&D
1Q '12 1Q '114Q '11
2,138 0.5% 7,017 1.5% 1,531 0.4% -4,879 607
58,504 12.9% 52,964 11.2% 29,485 8.0% 5,540 29,019
3,673 0.8% 3,208 0.7% 3,756 1.0% 465 -83
1,325 0.3% -1,428 -0.3% 636 0.2% 2,753 689
- Interest Gain (or Loss) 303 0.1% 234 0.0% 116 0.0% 69 187
- F/X Related Gain (or Loss) 2,288 0.5% -2,021 -0.4% 700 0.2% 4,309 1,588
63,503 14.0% 54,744 11.6% 33,877 9.2% 8,759 29,626
- Income Taxes 13,018 2.9% 14,731 3.1% 6,030 1.6% -1,713 6,988
50,485 11.2% 40,013 8.5% 27,847 7.5% 10,472 22,638
Operating Profits
Other Operating Profits
Gain(or Loss) on Equity Method Investment
Net Income
Income Before Income Taxes
Finance Incomes / Expenses

[Appendix 3] Segment Information (K-IFRS)
(Unit : trillion KRW)
1Q 2Q 3Q 4Q Total
DMC 24.50 26.77 29.71 35.23 116.22
CE 10.47 11.23 11.32 14.00 47.02
IM 13.69 15.03 17.94 20.78 67.45
DS 15.55 16.12 16.49 17.61 65.77
Semiconductor 9.18 9.16 9.48 9.17 36.99
DP 6.51 7.09 7.08 8.55 29.24
DMC 1.54 2.19 2.77 3.20 9.70
CE 0.08 0.47 0.34 0.66 1.55
IM 1.46 1.71 2.42 2.54 8.13
DS 1.42 1.59 1.53 2.06 6.61
Semiconductor 1.64 1.79 1.59 2.31 7.34
DP -0.23 -0.21 -0.09 -0.22 -0.75
※ The results of the semiconductor and DP are the same as before the organizational change.
Sales
OperatingProfits
FY '11