Investor Presentation - March 2015
34
Investor Presentation March 2015
Transcript of Investor Presentation - March 2015

Investor PresentationMarch 2015

2
Table of Contents
About AMG 4Global Trends Driving Critical Materials Demand 5Global Leader in Supply of Critical Materials 6Critical Raw Materials 7Critical Materials Price Appreciation vs. LME Metals 8Metal Positions 9Global Locations 10Health and Safety Focus 12Financial Highlights 13Key Products & End Markets 24Appendix 30

3
THIS DOCUMENT IS STRICTLY CONFIDENTIAL AND IS BEING PROVIDED TO YOU SOLELY FOR YOUR INFORMATION BY AMG ADVANCED METALLURGICAL GROUP N.V. (THE “COMPANY”) AND MAY NOT BE REPRODUCED IN ANY FORM OR FURTHER DISTRIBUTED TO ANY OTHER PERSON OR PUBLISHED, IN WHOLE OR IN PART, FOR ANY PURPOSE. FAILURE TO COMPLY WITH THIS RESTRICTION MAY CONSTITUTE A VIOLATION OF APPLICABLE SECURITIES LAWS.
This presentation does not constitute or form part of, and should not be construed as, an offer to sell or issue or the solicitation of an offer to buy or acquire securities of the Company or any of its subsidiaries nor should it or any part of it, nor the fact of its distribution, form the basis of, or be relied on in connection with, any contract or commitment whatsoever.
This presentation has been prepared by, and is the sole responsibility of, the Company. This document, any presentation made in conjunction herewith and any accompanying materials are for information only and are not a prospectus, offering circular or admission document. This presentation does not form a part of, and should not be construed as, an offer, invitation or solicitation to subscribe for or purchase, or dispose of any of the securities of the companies mentioned in this presentation. These materials do not constitute an offer of securities for sale in the United States or an invitation or an offer to the public or form of application to subscribe for securities. Neither this presentation nor anything contained herein shall form the basis of, or be relied on in connection with, any offer or commitment whatsoever. The information contained in this presentation has not been independently verified. No representation or warranty, express or implied, is made as to, and no reliance should be placed on, the fairness, accuracy or completeness of the information or the opinions contained herein. The Company and its advisors are under no obligation to update or keep current the information contained in this presentation. To the extent allowed by law, none of the Company or its affiliates, advisors or representatives accept any liability whatsoever (in negligence or otherwise) for any loss howsoever arising from any use of this presentation or its contents or otherwise arising in connection with the presentation.
Certain statements in this presentation constitute forward-looking statements, including statements regarding the Company's financial position, business strategy, plans and objectives of management for future operations. These statements, which contain the words "believe,” “expect,” “anticipate,” “intends,” “estimate,” “forecast,” “project,” “will,” “may,” “should” and similar expressions, reflect the beliefs and expectations of the management board of directors of the Company and are subject to risks and uncertainties that may cause actual results to differ materially. These risks and uncertainties include, among other factors, the achievement of the anticipated levels of profitability, growth, cost and synergy of the Company’s recent acquisitions, the timely development and acceptance of new products, the impact of competitive pricing, the ability to obtain necessary regulatory approvals, and the impact of general business and global economic conditions. These and other factors could adversely affect the outcome and financial effects of the plans and events described herein.
Neither the Company, nor any of its respective agents, employees or advisors intend or have any duty or obligation to supplement, amend, update or revise any of the forward-looking statements contained in this presentation.
The information and opinions contained in this document are provided as at the date of this presentation and are subject to change without notice.
This document has not been approved by any competent regulatory or supervisory authority.
Cautionary Note

4
Supply: AMGSources, processes, and supplies the critical materials the market demands
Global TrendsCO2 emission reduction, population growth, affluence, and energy efficiency
DemandInnovative new products that are lighter, stronger, and resistant to higher temperatures
AMG is a critical materials company

5
Industry requiresMaterial-Science based innovation
Global Trends &Changes in Regulatory
Environments
Global Trends Driving Critical Materials Demand
Increased demand for Critical Raw
Materials
Global CO2reduction trends
Aerospace industry driven toward new technologies delivering weight reduction and fuel efficiency
CASE STUDY – Titanium Aluminides
AMG develops highly engineered Titanium Aluminides for the next generation of aircraft engines
Aircraft engines require innovative technologies to decrease fuel consumption

6
AMG is a global leader in the management of critical materials supply chains
Increased demand for Critical Raw
Materials
A Global Leader in the Supply of Critical Materials
Local Network Expertise
Legal Regime Expertise
Working Capital Management & Trade FinanceMaterial
ScienceInnovation
Complex Multi-stage Logistics
Risk Management, Insurance
Process Technology

7 *Report on Critical Raw Materials for the EU, May 2014
Melted or treated by AMG vacuum systems
Heavy REE
Niobium Antimony
Natural Graphite
Silicon Metal
Chromium
Produced by AMG
Light REE
Magnesium
GermaniumIndium
Gallium Cobalt
BerylliumPGMS
Fluorspar
Phosphate RockBorate
Magnesite
Tungsten
Coking Coal
Tin
Titanium alloysAluminum alloys Nickel
VanadiumMolybdenum
Tantalum
EU Critical Raw Materials
Sup
ply
Ris
k
Economic Importance
Critical Raw Materials
• The EU identified 20 critical raw materials* to the European economy in 2014, focusing on two determinants: economic importance and supply risk
• Silicon Metal was a new entry to the 2014 EU critical raw materials list
• AMG has a unique critical materials portfolio comprising:
– 5 EU critical raw materials
– Highly engineered Titanium Alloys for the aerospace industry
– High value-added Aluminum Master Alloys
– Vanadium, Nickel and Molybdenum from recycled secondary raw materials

8
Critical Materials Price Appreciation vs. LME Metals
The cumulative average 10 year price appreciation of AMG EU Critical Materials was 7.5 percentage points higher than LME Metals, while AMG Other Critical Materials outperformed LME Metals by 3.2 percentage points
-50%
0%
50%
100%
150%
200%
250%
300%
AMG EU Critical Materials AMG Other Critical Materials LME Metals
10 Yr CAGR:
1.3%
10 Yr CAGR:
8.8%
10 Yr CAGR:
4.5%
Note: Compound annual growth rates are calculated over the period Dec ‘04 through Dec ‘14 using the equation ((Ending Value / Beginning Value) ^ (1 / # of years) - 1) where ending value is avg monthly price in Dec ‘14 and beginning value is avg monthly price in Dec ‘04; and where AMG EU Critical Materials include Cr, Sb, Si, & Graphite; AMG Other Critical Materials include FeV, Sr, Ta, Sn, & Ti; and LME` Metals include Al, Co, Cu, Pb, Mo, Ni, & Zn. Avg annual growth rates (plotted above) are calculated over the same period using the equation ((Ending Value / Beginning Value) -1) and considering the same metal categorizations where ending value is avg monthly price in Dec of the given year and beginning value is avg monthly price in Dec ‘04.
The price increase over time illustrates the value appreciation of critical materials2005 2006 2007 2008 2009 2010 2011 2012 2013 2014
9
5.1
0.4
1.40.8
5.9
4.2 4.3
6.65.8
4.5
0
1
2
3
4
5
6
7
8
9
10
Scal
e
Metals
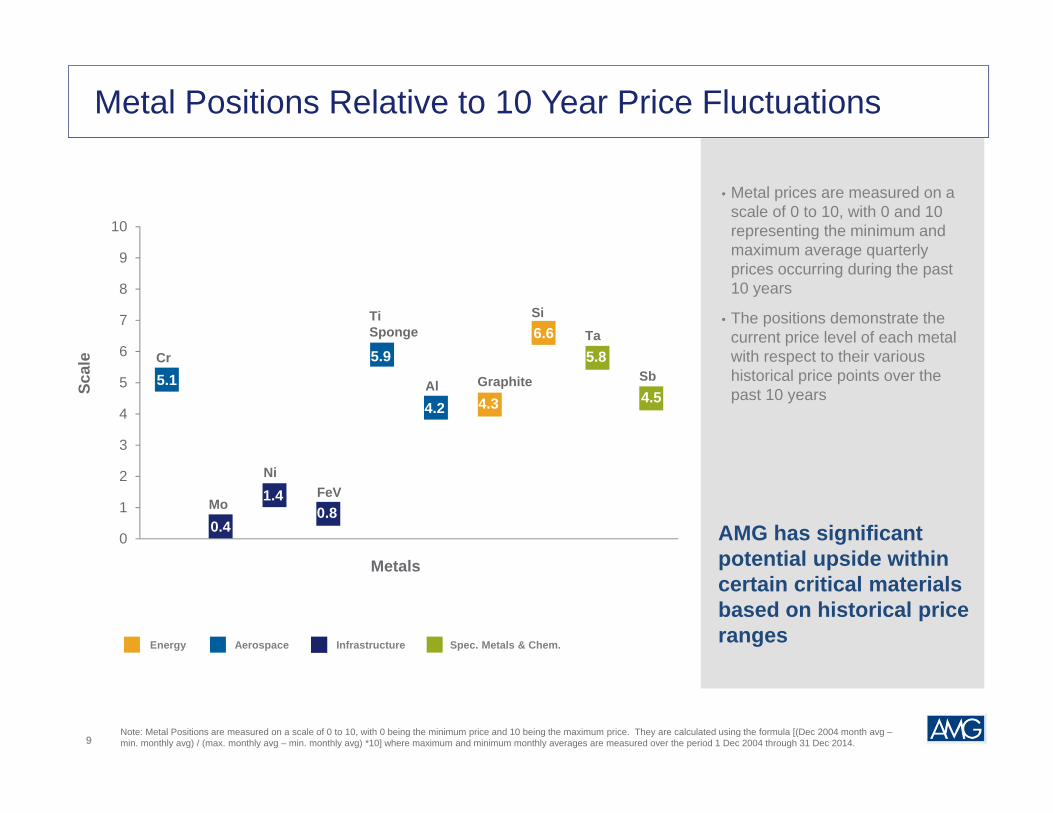
Note: Metal Positions are measured on a scale of 0 to 10, with 0 being the minimum price and 10 being the maximum price. They are calculated using the formula [(Dec 2004 month avg –min. monthly avg) / (max. monthly avg – min. monthly avg) *10] where maximum and minimum monthly averages are measured over the period 1 Dec 2004 through 31 Dec 2014.
Metal Positions Relative to 10 Year Price Fluctuations
• Metal prices are measured on a scale of 0 to 10, with 0 and 10 representing the minimum and maximum average quarterly prices occurring during the past 10 years
• The positions demonstrate the current price level of each metal with respect to their various historical price points over the past 10 years
AMG has significant potential upside within certain critical materials based on historical price ranges
Cr
Mo
NiFeV
TiSponge
Al Graphite
SiTa
Sb
Spec. Metals & Chem.Energy Aerospace Infrastructure

10
China
Sri Lanka
ZimbabweBrazilMozambique
U.S.A.
Mexico
France
UKGermany
Czech Republic
Chromium Metal
Antimony Natural Graphite
Silicon Metal
Titanium Alloys & Coatings
Aluminum Master Alloys, Aluminum Powders
FeV Tantalum Niobium
AMG Global Locations – Critical Materials
Nickel Molybdenum

11
Sales office
Mexico City, Mexico
Port Huron (MI), USA
Berlin, Germany
Limbach, Germany
Mumbai, India
Suzhou, China
East Windsor (CT), USA
Wixom (MI), USA
Guildford, UK
Moscow, Russia
Krakow, Poland
Tokyo, Japan
Singapore, Singapore
Bangkok, Thailand
Headquarters Production Facility Heat Treatment Services
Hanau, Germany(Head Office)
Grenoble,France
AMG Global Locations – Engineering

12
AMG – Health and Safety FocusHealth and Safety Focus
Leading Safety Indicators
• The number of unsafe conditions reported increased 26% over full year 2013. These are essential in order to avoid potential injuries.
• Lost time incidents over the 12 months ending December 2014 are down 48% from the previous 12 month period.
Period Ending December
Lost Time Incidents in the Last 12 Months
12 Month Average Lost Time Incident Rate
12 Month Average Incident Severity Rate
2013 62 1.76 0.21
2014 32 1.20 0.19
Rigorous commitment to safety reflected in continually improving safety records
13
Financial Highlights

14
Amounts in $M FY 2013 FY 2014 % Change
Revenue $1,158.4 $1,093.9 (5.6%)
Gross profit $177.7 $184.3 3.7%
Gross margin % 15.3% 16.8% 9.8%
EBITDA $72.6 $85.7 18.1%
EBITDA margin % 6.3% 7.8% 23.8%
Free cash flow $40.8 $72.1 76.7%
Net debt $160.5 $87.8 (45.3%)
ROCE 7.4% 11.9% 60.8%
Full Year 2014 at a Glance
• AMG continues to focus on EBITDA growth, efficient use of capital and working capital reduction to generate free cash flow
• Full year 2014 Free Cash Flow (FCF) has exceeded full year 2013 by 77%
• Net debt: $87.8M– $72.7M reduction on net debt
in 2014– Debt down 55% since 2012– Net debt to LTM EBITDA: 1.02x
Full year 2014 FCF up 77% vs FY 2013Net debt down 45% in 2014
Note: Free Cash Flow (FCF) is defined as cash flows from operating activities less cash flows used in investing activities

15
Objective Progress Update
Increase Operating Cash Flow and Improve ROCE
Reduce Gross and Net Debt
Note: Free Cash Flow (FCF) is defined as cash flows from operating activities less cash flows used in investing activities
AMG 2014 Objectives Update
• FY ‘14 cash flows from operations of $95.1M versus $69.7M full year ‘13
• FY ‘14 record free cash flow $72.1M
• Annualized ROCE of 11.9%
• Net debt declined by $72.7M, or 45%, compared to Dec. ‘13
• Gross debt declined by $67.7M, or 26%, compared to Dec ’13
2014 Objectives Update
AMG is improving operational performance and cash flow
Reduce SG&A
Improve Gross Margin
• Full year 2014 SG&A costs declined by 5.2%, compared to full year 2013
• AMG FY ‘14 gross margin of 16.8% vs. 15.3% in FY ‘13
• Q4 ‘14 gross profit up 54% vs. Q4 ‘13 for AMG Processing
• Q4 ‘14 gross profit up 17% vs. Q4 ‘13 for AMG Mining

16
Improve ROCE
Continuous Improvement
AMG 2014 Objectives Update
• Increase ROCE through operational improvements and disciplined capital management
• Improve productivity, lower cost position and optimize product mix
• Continuously improve health, safety and sustainability
2015 Objectives
AMG aims to improve ROCE and complete refinancing in 2015
Objective Description
Refinance • Complete refinancing process by end of 2015
Complete AMG Engineering Cost Reduction Program
• Implement new procurement optimization program and reduce headcount
• Annualized savings of approximately $7M per year
• To be completed Q4 2015

17
Industry Consolidation
Process Innovation & Product Development
Pursue opportunities for industry consolidation across AMG’s critical materials portfolio
Continue to focus on process innovation and product development to improve the market position of AMG’s core critical materials businesses
Strategy
Asset Dispositions
Divest peripheral assets
AMG’s strategy is to build its critical materials business through industry consolidation, process innovation and product development

18
Objectives Progress Update
Delivering Strong Operational Performance
Accelerating Portfolio Transformation
Note: Free Cash Flow (FCF) is defined as cash flows from operating activities less cash flows used in investing activities
AMG 2014 Objectives Update
• FY ‘14 record Free Cash Flow of $72.1M
• FY ‘14 Cash flow from Operations of $95.1M versus FY ‘13 of $69.7M, increase of 36.4% YOY
• Q4 ‘14 Gross Margin increases in AMG Processing and AMG Mining of 54% and 17% vs. Q4 ‘13, respectively
• Net Debt decline of $72.7M, or 45%, compared to December 2013
• FY EBITDA of $85.7M; Full year EBITDA growth in excess of 18% versus 2013
• Signed long term supply contract with Snecma to provide titanium aluminides ("TiAl") for production of the CFM International LEAP engine
• Executed capacity reduction program in AMG Aluminum to curtail capacity by 5,000 metric tons, or approximately 10% of global demand, to address current market conditions
• Reached agreement to sell 40% equity stake in AMG Graphit Kropfmühl GmbH by way of a capital increase in combination with a 10.33% equity stake in Bogala Graphite Lanka PLC
• Divested non-core equity interests in Benda-Lutz-Alpoco and Bostlan SA
• Signed long-term supply agreement with Premium AEROTEC to supply advanced technology to measure load control pathways in the manufacture of airframe components, critical to maintain and monitor the Airbus A380 wing flaps
• Signed Memorandum of Understanding with NUKEM Technologies GmbH, and E.ON Technologies GmbH to develop concept for local melting services to recycle radioactive metallic wastes from closed nuclear power plants
Transformation Delivering Results; Profitability Up YoY

19
$194.2
$160.5
$87.8
2012 2013 2014
$65.6 $69.7
$95.1
2012 2013 2014
Financial Data: Net Debt & Operating Cash flowFinancial Data: Net Debt & Operating Cash Flow
Net debt: $87.8M– $72.7M reduction on net debt
in 2014– Debt down 55% since 2012– Net Debt to LTM EBITDA: 1.02x
AMG’s primary debt facility is a $370M term loan and revolving credit facility
– 5 year term (until 2016)– In compliance with all debt
covenants
FY ‘14 Operating Cash Flow of $95.1M, compared to $69.7M in FY ‘13
Net Debt ( in USD millions)
Operating Cash Flow ( in USD millions)
$106.4M reduction in
net debt since 2012
FY ‘14 Operating Cash Flow exceeded
FY ‘13 by 36%

20
Financial Data: Free Cash Flows
Free Cash Flow (in USD millions)
$17.1
$40.8
$72.1
2012 2013 2014
Free Cash Flow as % of EBITDA
20%
56%
84%
2012 2013 2014
Financial Data: Free Cash Flow
Record FY ‘14 free cash flow of $72.1M
AMG continues to focus on EBITDA Growth, Efficient Use of Capital and Working Capital Reduction to generate Free Cash Flow
Free cash flow as a % EBITDA has increased by 50% FY ‘14 versus FY ‘13
Record YTD ‘14 Free Cash
Flow of $72.1M
Increase of 50% in FY ‘14

21
Financial Data: ROCE
9.4%
7.4%
11.9%
2012 2013 2014
Financial Data: ROCE & EBITDA
FY 2014 EBITDA growth in excess of 18% versus 2013
FY ‘14 ROCE is 61% higher than FY ‘13 (an increase of 4.5 percentage points over full year 2013)
2014 ROCE improvements are the result of EBITDA growth, efficient use of capital and working capital reductions
Annualized ROCE
EBITDA ( in USD millions)
$83.5
$72.6
$85.7
2012 2013 2014
ROCE FY ‘14 has exceeded FY ’13 by 61%
Growth in excess
of 18%

22
Working Capital Days reduced by 71% since Q3’10
Financial Highlights
79
69 70 70 70
65 65 65 6562 61
53
4743
47
42
31
23
Q3
10
Q4
10
Q1
11
Q2
11
Q3
11
Q4
11
Q1
12
Q2
12
Q3
12
Q4
12
Q1
13
Q2
13
Q3
13
Q4
13
Q1
14
Q2
14
Q3
14
Q4
14
Working Capital Reduction
Q111
Q211
Q311
Q411
Q112
Q212
Q312
Q412
Q113
Q213
Q313
Q413
Q114
Q214
Q314
Q310
Q410
56 days, or 71% Reduction
Q414

23
$10.5
$20.1 $20.4$23.4
$21.9
Q4 13 Q1 14 Q2 14 Q3 14 Q4 14
$284.0$274.9 $278.9 $279.7
$260.4
Q4 13 Q1 14 Q2 14 Q3 14 Q4 14
$41.0
$46.4$45.0
$48.1
$44.9
Q4 13 Q1 14 Q2 14 Q3 14 Q4 14
FY 2014: $1,093.9
FY 2014: $85.7
FY 2014: $184.3
Financial HighlightsFinancial Highlights
Revenue (in USD millions)
EBITDA (in USD millions)
Gross Profit (in USD millions)
Adjusted EPS
Q4 2014 fully diluted EPS: $0.26vs. ($0.12) in Q4 2013
FY 2014 EPS $0.79
8%YoY
108%YoY
9%YoY

24
Key Products & End Markets
25
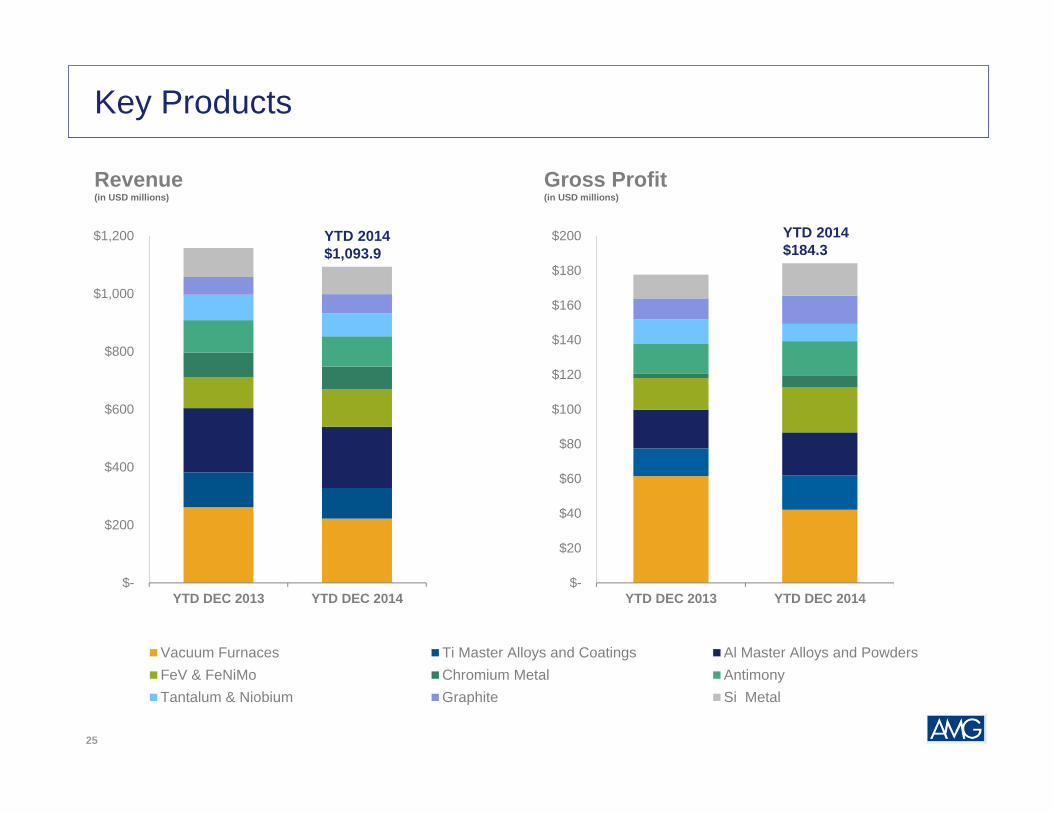
Key Products
Revenue (in USD millions)
Gross Profit (in USD millions)
$-
$200
$400
$600
$800
$1,000
$1,200
YTD DEC 2013 YTD DEC 2014
Vacuum Furnaces Ti Master Alloys and Coatings Al Master Alloys and PowdersFeV & FeNiMo Chromium Metal AntimonyTantalum & Niobium Graphite Si Metal
$-
$20
$40
$60
$80
$100
$120
$140
$160
$180
$200
YTD DEC 2013 YTD DEC 2014
YTD 2014$184.3
YTD 2014$1,093.9

26
Critical Materials – Market Trends
Spec. Metals & Chem.Energy Aerospace Infrastructure
Critical Materials Market TrendsMajor End Markets Major Customers
AMG AntimonyAntimony Trioxide
Antimony MasterbatchesAntimony Pastes
PlasticsFlame Retardants
Micro Capacitors, Superalloys
AMG BrazilTantalum & Niobium
Communications & Electronics
Fuel Efficiency
Expandable Polystyrene (EPS),
Battery Anodes
AMG GraphiteNatural Graphite
Energy Saving
Energy Storage
Aluminum Alloys,Solar
AMG SiliconSilicon Metal
Fuel Efficiency
Clean Energy
Customer Confidential

27
Critical Materials – Market Trends
AMG AluminumAluminum Master Alloys
Aluminum PowdersFuel EfficiencyAerospace
InfrastructureAMG VanadiumFerrovanadium
Ferronickel-molybdenumInfrastructure Growth
Aerospace
AMG Titanium Alloys & Coatings
Titanium Master Alloys& Coatings
Fuel Efficiency
Energy Saving
AMG Superalloys UKChromium Metal
Fuel EfficiencyAerospace
Critical Materials Market TrendsMajor End Markets Major Customers
Spec. Metals & Chem.Energy Aerospace Infrastructure

28
AMG EngineeringCapital Goods
(Vacuum furnaces)
Fuel Efficiency
Electronics
AMG EngineeringVacuum Heat Treatment
ServicesFuel EfficiencyAerospace
Engineering – Market Trends
Critical Materials Market TrendsMajor End Markets Major Customers
Aerospace
Spec. Metals & Chem.Energy Aerospace Infrastructure

29
AMG – A Global Supplier of Critical Materials
Note: *Based on 2014 Full Year unaudited Financial Statements; ROW refers to the rest of the world
A Global Supplier of Critical Materials
16% Infrastructure
27% Specialty Metals & Chemicals
39% Aerospace
18% Energy
FY 2014 Revenues by End Market
Revenue by Region*
Approx. 3,000employees
AMG is a global supplier of Critical Materials to:
$1.09 billion* annual
revenues
Aerospace InfrastructureEnergySpecialty Metals & Chemicals
44% Europe
34% North America
17% Asia5% ROW
30
Appendix

31
Actual
As ofin $M
31 December 2013 31 December 2014Unaudited
Fixed assets 259.7 237.4Goodwill and intangibles 37.2 31.7Other non-current assets 65.5 68.9Inventories 179.3 145.4Receivables 150.8 135.3Other current assets 36.6 51.6Cash 103.1 108.0
TOTAL ASSETS 832.2 778.4
TOTAL EQUITY 134.6 101.0Long term debt 223.8 168.0Employee benefits 138.0 159.7Other long term liabilities 62.4 68.9Current debt 39.8 27.9Accounts payable 127.4 134.4Advance payments 16.3 31.7Accruals 54.4 53.3Other current liabilities 35.6 33.7TOTAL LIABILITIES 697.6 677.4
TOTAL EQUITY AND LIABILITIES 832.2 778.4
Consolidated Balance Sheet

32
Actual
For the year ended in $M 31 December 2013 31 December 2014
Unaudited
Revenue 1,158.4 1,093.9Cost of sales 980.7 909.6Gross profit 177.7 184.3Selling, general & administrative 140.9 133.5Asset impairment & restructuring 65.2 6.7Environmental (0.1) 5.5Other income, net (2.1) (2.1)Operating profit (loss) (26.2) 40.6Net finance costs 21.1 19.5Share of loss of associates (2.1) (0.4)Profit (loss) before income taxes (49.4) 20.7Income tax benefit 4.4 1.0Profit (loss) for the period (45.0) 21.6Shareholders of the Company (41.5) 21.9Non-controlling interest (3.5) (0.3)
Adjusted EBITDA 72.6 85.7
Consolidated Income Statement

33
Consolidated Statement of Cash Flows
Actual
For the year ended in $M 31 December 2013 31 December 2014
Unaudited
EBITDA 72.6 85.7Change in working capital and deferred revenue 40.2 39.0Finance costs paid, net (18.0) (13.8)Other operating cash flow (13.0) (9.5)Cash flows from operations before taxes 81.8 101.4Income tax paid (12.1) (6.3)Net cash flows from operations 69.7 95.1Capital expenditures (32.0) (24.0)Other investing activities 3.2 0.9Net cash flows used in investing activities (28.9) (23.0)Net cash flows used in financing activities (62.3) (57.9)Net increase/(decrease) in cash and equivalents (21.4) 14.2Cash and equivalents at January 1 121.6 103.1Effect of exchange rate fluctuations on cash held 2.8 (9.2)
Cash and equivalents at December 31 103.1 108.0

Investor PresentationMarch 2015