Investor Presentation - Gerdau · 2018-10-05 · Gerdau Investment Highlights Investor Presentation...
19
Investor Presentation March, 2015
Transcript of Investor Presentation - Gerdau · 2018-10-05 · Gerdau Investment Highlights Investor Presentation...
Investor Presentation
March, 2015

Gerdau Investment Highlights
Strategy
Financial and Operational Highlights
Outlook
Agenda
2

Gerdau Investment Highlights
Investor Presentation
► Global player with dominant regional presence and operations in 14 countries
– Largest long steel producer in the Americas and 2ª globally
► Vertically integrated operations with flexible production processes
– A leading low cost producer
► Relevant market share and diversified product offering via downstream and service centers
► Strong balance sheet and cash generation track record
► Over 110 years of profitable operations in the steel market
– Not a single yearly loss during its history
3
► With more than 120,000 shareholders and ADTV of over US$ 70 MM, Gerdau shares are listed on the
São Paulo, New York and Madrid stock exchanges

Nippon Steel
Tata Corus
Evrazholding
Source: Steel on the Net
*Last information available: 2014
Long Steel Producers - Ranking by company (million tonnes)*
► Largest long steel producer in the Americas and 2nd globally
► Operations in 14 countries with relevant market share
Global Player with Dominant Regional Presence
Steel Units
Associated Companies
Joint ventures
USA. &
Canada
Mexico
Colombia
Peru
Chile
Uruguai
Argentina
Brazil
Dominican Republic
Venezuela
India
Spain
Guatemala
4 Investor Presentation
Arcelor Mittal
Nucor Group
JFE Steel Group
Gerdau
Hebei Steel
Riva Group
Celsa Group 8.7
8.7
9.1
10.4
10.9
11.0
11.9
18.1
25.5
54.4

Gerdau Investment Highlights
Strategy
Financial and Operational Highlights
Outlook
Agenda
5
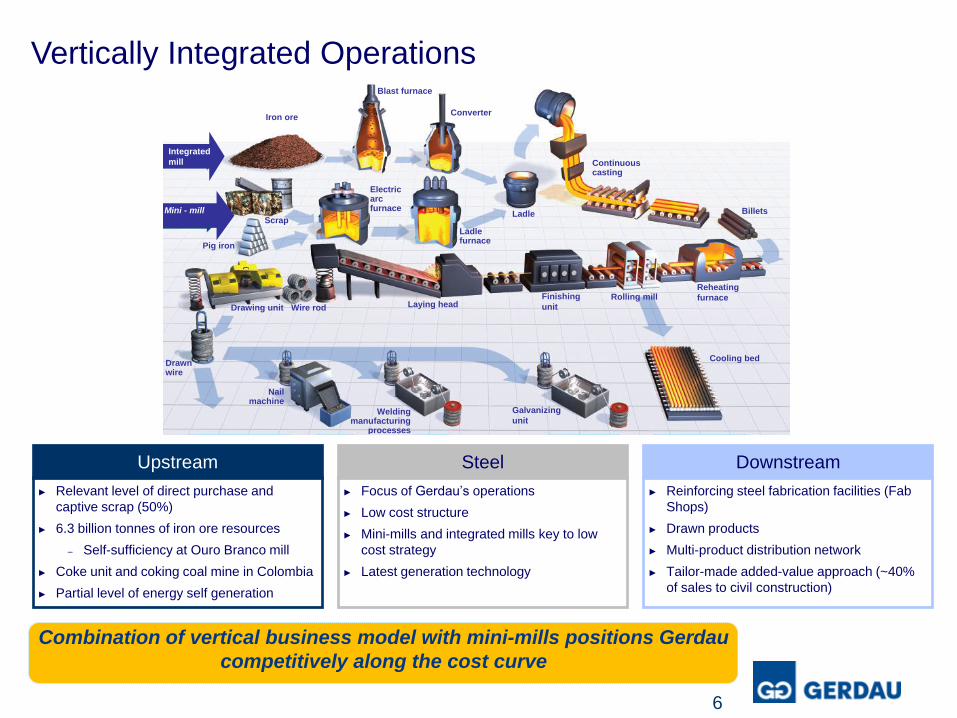
► Relevant level of direct purchase and
captive scrap (50%)
► 6.3 billion tonnes of iron ore resources
– Self-sufficiency at Ouro Branco mill
► Coke unit and coking coal mine in Colombia
► Partial level of energy self generation
Upstream
Vertically Integrated Operations
Billets
Cooling bed
Reheating
furnaceFinishing
unit
Galvanizing
unit
Laying headWire rodDrawing unit
Iron oreConverter
Blast furnace
Continuous casting
LadleScrap
Pig iron
Electric arc furnace
Ladle furnace
Drawn wire
Nail machine
Welding manufacturing
processes
Structural profiles
GG-50
rebar
Bars and profiles
Barbed wire, oval-shaped wire and galvanized wire
Welding wires and wires for electrodes
NailsCA- 60
rebar
Annealed wire
Ribbed reinforcing
mesh
Integrated
mill
Mini - mill
Rolling mill
► Focus of Gerdau’s operations
► Low cost structure
► Mini-mills and integrated mills key to low
cost strategy
► Latest generation technology
Steel
► Reinforcing steel fabrication facilities (Fab
Shops)
► Drawn products
► Multi-product distribution network
► Tailor-made added-value approach (~40%
of sales to civil construction)
Downstream
Combination of vertical business model with mini-mills positions Gerdau
competitively along the cost curve
6

Products
Brazil North America Special Steel
Ready-to-use
products
► Housing
► Infrastructure
► Industry and commercial buildings
► Agricultural
► Exports of slabs, blooms and billets
► Infrastructure
► Non-residential
► Industrial
► Automotive
► Shipbuilding
► Energy
Billets,
blooms
& slabs Merchant
bars Rebars
Fabricated
steel Heavy
structural shapes
Wire-rod Wires
Nails SBQ
Latin America
► Housing
► Infrastructure
► Industry and
commercial
buildings
Consumer Markets
33% of Net Sales
52% of EBITDA
32% of Net Sales
18% of EBITDA
13% of Net Sales
9% of EBITDA
20% of Net Sales
18% of EBITDA
Note: Net Sales and EBITDA LTM.
HRC
Iron Ore
2% of Net Sales
3% of EBITDA
► Raw material for
the steel industry
Iron Ore
7

Gerdau Investment Highlights
Strategy
Financial and Operational Highlights
Outlook
Agenda
8

Geographic diversification reduces volatility in results
Consolidated EBITDA & EBITDA Margin
EBITDA LTM: R$ 4,828 million
1,3701,196 1,170 1,224 1,238
13.3%
11.3% 11.2% 11.4% 11.4%
4Q13 1Q14 2Q14 3Q14 4Q14
EBITDA EBITDA Margin
* Adjusted BITDA and adjusted EBITDA margin
*
EBITDA and EBITDA Margin per BO
9
848
587
738
22,6%
16,5%
20,3%
4Q13 3Q14 4Q14
139
337
199
4,5%
9,1%
5,7%
4Q13 3Q14 4Q14
136 109 109
9,3% 7,6%
7,1%
4Q13 3Q14 4Q14
205 231 254
10,0% 11,0%
12,1%
4Q13 3Q14 4Q14
141
10
- 24
37.7%
4.8%
- 11,7% 4Q13 3Q14 4Q14
EBITDA (R$ million) EBITDA Margin (%)
* *
* Adjusted BITDA and adjusted EBITDA margin

(1) EBITDA LTM.
Debt Maturity Schedule
Average Debt Term: 7.1 years
R$ billion R$ billion
Debt and Leverage Ratio
Average Debt Cost: 6.5%
Debt impacted by exchange variation
Higher cash position reduces the Net Debt/EBITDA ratio to 2.4x
16,3 16,4 16,4
18,119,2
4,23,5 4,0
4,75,8
2.5x 2.5x 2.4x2.7x
2.4x
dec.13 mar.14 jun.14 sep.14 dec.14
Gross Debt Principal (R$ billion) Cash (R$ billion) Net Debt/EBITDA¹
10
1.7 0.9
3.1
0.8 0.7 2.4
9.6
2015 2016 2017 2018 2019 2020 2021 and after

Investments amount to R$2.3 billion in 2014
In 2015, Gerdau plans to invest R$1.9 billion in fixed assets (CAPEX)
Main projects
Installation of a heavy plates rolling mill at the Ouro Branco mill in Minas Gerais
Construction of a new mill in Mexico to produce structural profiles
Installation of a new continuous casting unit at the St. Paul mill in Minnesota (USA)
Installation of new special steel rolling mill and reheating furnace in Monroe (USA)
40%
14%
14%
25%
7%
Brazil
North America
Latin America
Special Steel
Iron Ore
11
Gerdau Investment Highlights
Strategy
Financial and Operational Highlights
Outlook
Agenda
12
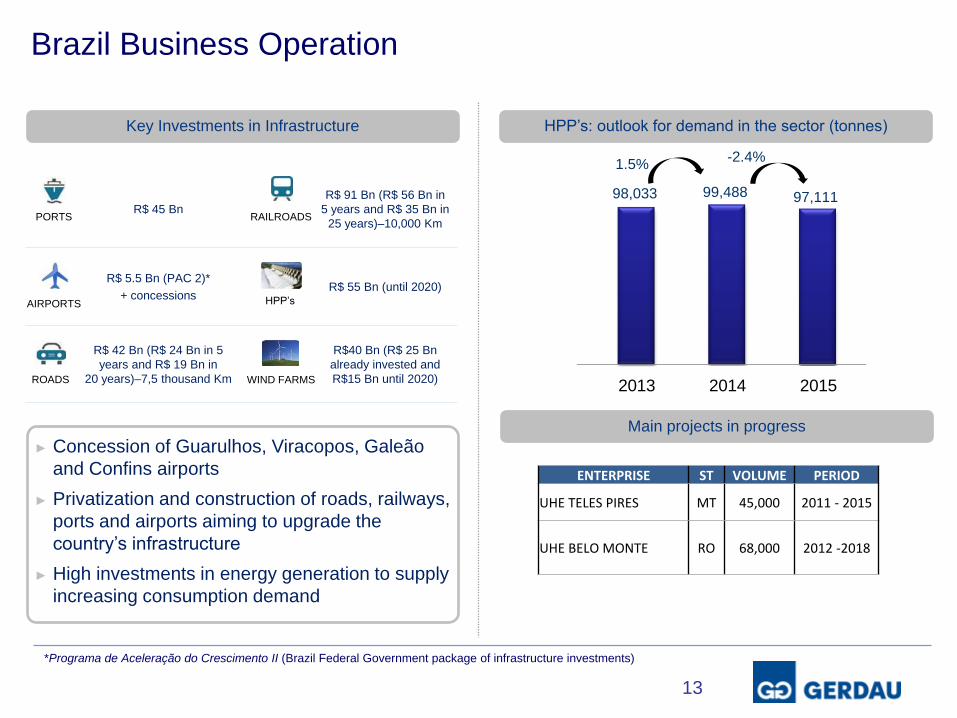
R$ 45 Bn
R$ 91 Bn (R$ 56 Bn in
5 years and R$ 35 Bn in
25 years)–10,000 Km
R$ 5.5 Bn (PAC 2)*
+ concessions R$ 55 Bn (until 2020)
R$ 42 Bn (R$ 24 Bn in 5
years and R$ 19 Bn in
20 years)–7,5 thousand Km
R$40 Bn (R$ 25 Bn
already invested and
R$15 Bn until 2020)
Brazil Business Operation
13
Key Investments in Infrastructure
► Concession of Guarulhos, Viracopos, Galeão
and Confins airports
► Privatization and construction of roads, railways,
ports and airports aiming to upgrade the
country’s infrastructure
► High investments in energy generation to supply
increasing consumption demand
PORTS
AIRPORTS
ROADS
RAILROADS
HPP’s
WIND FARMS
*Programa de Aceleração do Crescimento II (Brazil Federal Government package of infrastructure investments)
HPP’s: outlook for demand in the sector (tonnes)
Main projects in progress
89.03498.033 99.488 97.111
78.294
2012 2013 2014 2015 >2016
1,5% - 2,4%
ENTERPRISE ST VOLUME PERIOD
UHE TELES PIRES MT 45,000 2011 - 2015
UHE BELO MONTE RO 68,000 2012 -2018
98,033 99,488 97,111
1.5% -2.4%

North America Business Operation
Source: FMI, S&P Case-Shiller (prices), RealtyTrac (foreclosures) and ISM.
Manufacturing Index Institute of Supply Management (ISM): jan.97 through jan.15
Home Foreclosures
14
► US GDP forecasted growth for 2015: +3.6%

Latin America Business Operation
15
► Latin America GDP forecasted growth for 2015: +1.3%
Apparent finished steel use (Mt)
Source: FMI and worldsteel (SRO oct.14).
+2.6% +4.6%
► 2 plants
► Access to the U.S.
market
► New structural profile
rolling mill (2015)
Mexico
► Coal resources and coke
production
Colombia
► Excellent logistics
► Strong growth
Peru
► Mature market
► Good distribution network
Chile 5.1 4.7 4.8
2.7 2.6 2.6
3.5 3.9 4.0
2.9 3.0 3.12.8 2.7 3.4
19.7 21.021.8
5.8 5.96.0
42.6 43.745.7
2013 2014 (f) 2015 (f)
Others
Mexico
Venezuela
Peru
Colombia
Chile
Argentina

Special Steel Business Operation
16
► Global Coverage ► Second largest producer worldwide
1,500 kg
150 kg
NAFTA: Total Light Vehicle Production
NAFTA: Automotive Production
Source: Wards Automotive .
Units (thousand) Growth
Units (thousand) Growth
NAFTA 3,906 4.8% 16,894 4.8%
US 2,579 3.0% 11,367 4.9%
Canada 573 2.3% 2,315 -2.4%
Mexico 753 13.9% 3,211 10.2%
Total Autos
and Light
Trucks
3 months through January 12months through January

5,6
1,5
4,4
Capacity
Plants from partners
OTP I
OTP II
Iron Ore Business Operation
CAPEX (US$ MM)
CAPEX + Mine Acquisition: US$ 44/t
481.0
110.9
Done
Ongoing
CAPACITY (million t)
11.5
► Self sufficiency brings cost benefits for the Ouro Branco mill:
Annual iron ore need: 6.5 MMt*.
► Capacity expansion project under revision.
► No long term commitment (volumes and logistics).
* Considering 90% capacity utilization.
17

This presentation may contain forward-looking statements. These forward-looking
statements rely upon estimates, information or methods that may be incorrect or
inaccurate and may not actually occur. These estimates are also subject to risks,
uncertainties and assumptions, including, among others: general economic, political
and commercial conditions in Brazil and in the markets where we operate and existing
and future government regulations. Potential investors are hereby informed that these
estimates do not constitute a guarantee of future performance as they involve risks and
uncertainties. The Company does not undertake, and specifically denies, any obligation
to update any estimate, which only speak as of the date they are made.
Statement
Investor Presentation 18