
Q3 2016 Investor Presentation - CTS · Title: Q3 2016 Investor Presentation Created Date: 20161111635

INVESTOR PRESENTATIONDecember 2016
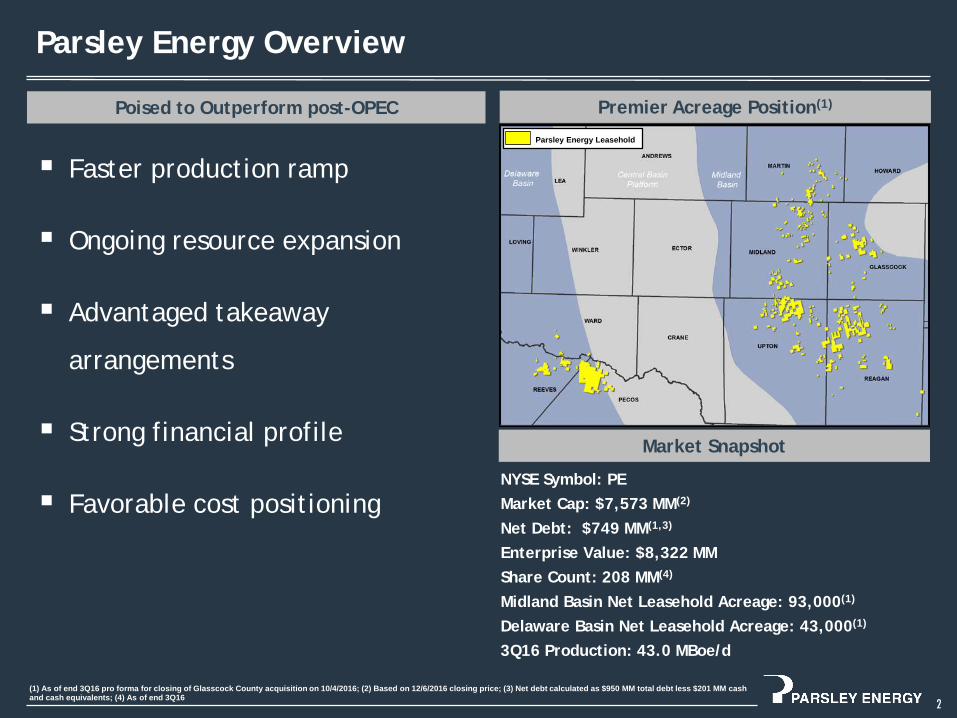
Parsley Energy Overview
2
Market Snapshot
Premier Acreage Position(1)
NYSE Symbol: PEMarket Cap: $7,573 MM(2)
Net Debt: $749 MM(1,3)
Enterprise Value: $8,322 MMShare Count: 208 MM(4)
Midland Basin Net Leasehold Acreage: 93,000(1)
Delaware Basin Net Leasehold Acreage: 43,000(1)
3Q16 Production: 43.0 MBoe/d
(1) As of end 3Q16 pro forma for closing of Glasscock County acquisition on 10/4/2016; (2) Based on 12/6/2016 closing price; (3) Net debt calculated as $950 MM total debt less $201 MM cash and cash equivalents; (4) As of end 3Q16
Faster production ramp
Ongoing resource expansion
Advantaged takeaway
arrangements
Strong financial profile
Favorable cost positioning
Poised to Outperform post-OPECParsley Energy Leasehold
0
10
20
30
40
50
0%
20%
40%
60%
80%
100%
Peer 1 Peer 2 Peer 3 Peer 4 Peer 5 Peer 6 Peer 7 PE
3Q15-3Q16
Boe/d Added per $M
M of Capex3Q
15-3
Q16
Pro
duct
ion
Gro
wth
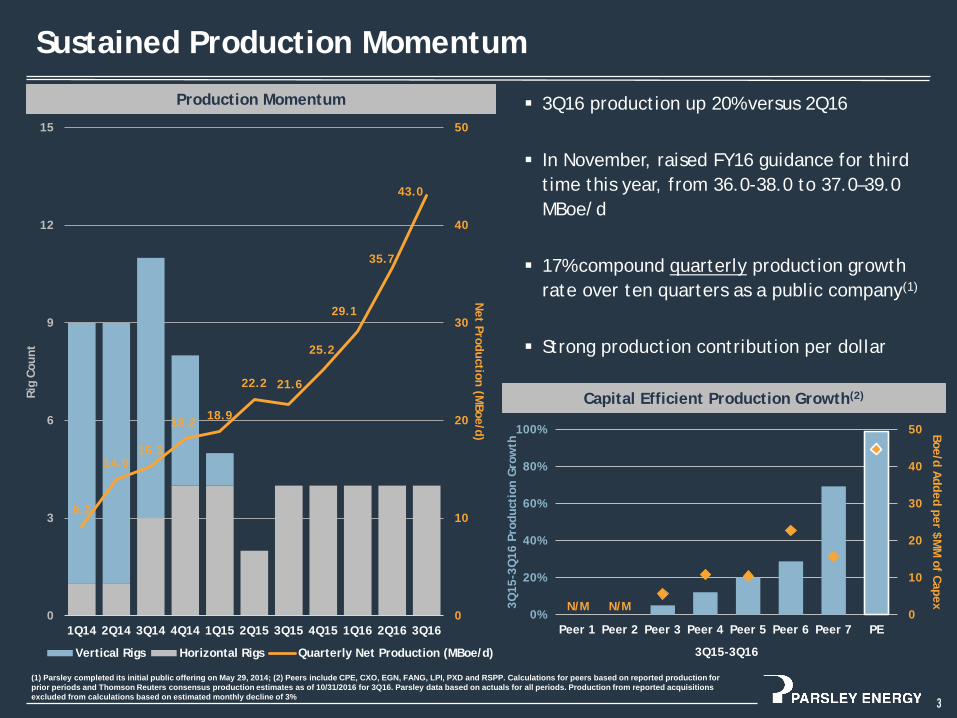
9.2
14.015.3
18.2 18.9
22.2 21.6
25.2
29.1
35.7
43.0
0
10
20
30
40
50
0
3
6
9
12
15
1Q14 2Q14 3Q14 4Q14 1Q15 2Q15 3Q15 4Q15 1Q16 2Q16 3Q16
Net Production (M
Boe/d)
Rig
Coun
t
Vertical Rigs Horizontal Rigs Quarterly Net Production (MBoe/d)
Sustained Production Momentum
3
3Q16 production up 20% versus 2Q16
In November, raised FY16 guidance for third time this year, from 36.0-38.0 to 37.0–39.0 MBoe/d
17% compound quarterly production growth rate over ten quarters as a public company(1)
Strong production contribution per dollar
(1) Parsley completed its initial public offering on May 29, 2014; (2) Peers include CPE, CXO, EGN, FANG, LPI, PXD and RSPP. Calculations for peers based on reported production for prior periods and Thomson Reuters consensus production estimates as of 10/31/2016 for 3Q16. Parsley data based on actuals for all periods. Production from reported acquisitions excluded from calculations based on estimated monthly decline of 3%
Production Momentum
Capital Efficient Production Growth(2)
N/M N/M
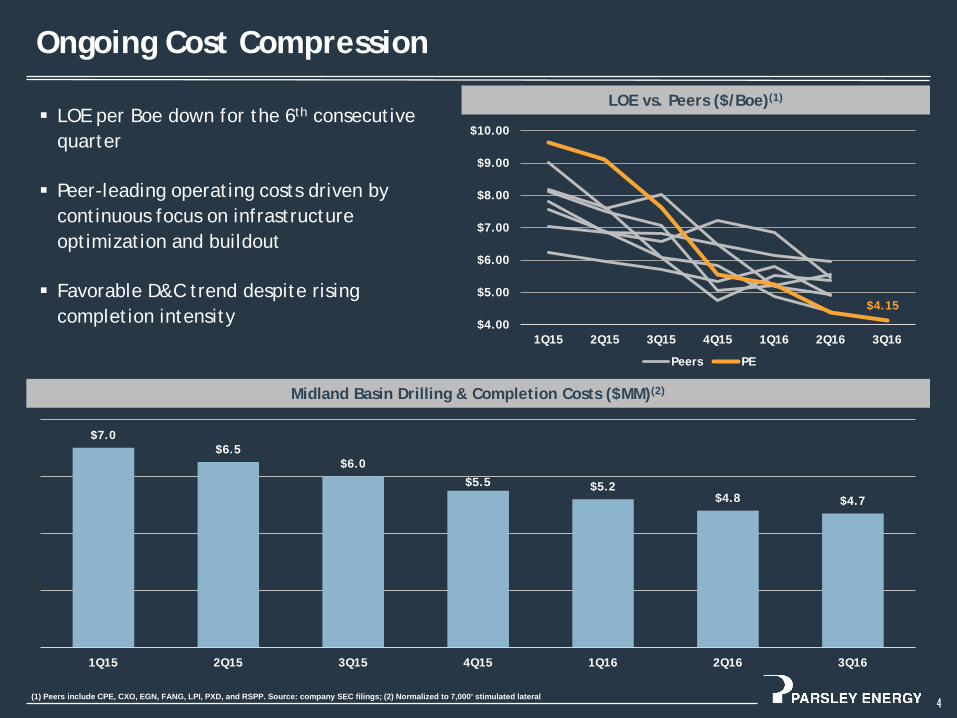
LOE per Boe down for the 6th consecutive quarter
Peer-leading operating costs driven by continuous focus on infrastructure optimization and buildout
Favorable D&C trend despite rising completion intensity
Ongoing Cost Compression
4
Midland Basin Drilling & Completion Costs ($MM)(2)
$4.00
$5.00
$6.00
$7.00
$8.00
$9.00
$10.00
1Q15 2Q15 3Q15 4Q15 1Q16 2Q16 3Q16
Peers PE
LOE vs. Peers ($/Boe)(1)
(1) Peers include CPE, CXO, EGN, FANG, LPI, PXD, and RSPP. Source: company SEC filings; (2) Normalized to 7,000’ stimulated lateral
$7.0$6.5
$6.0$5.5 $5.2
$4.8 $4.7
1Q15 2Q15 3Q15 4Q15 1Q16 2Q16 3Q16
$4.15
Differentiated Wolfcamp Thickness Supports Resource Expansion
5
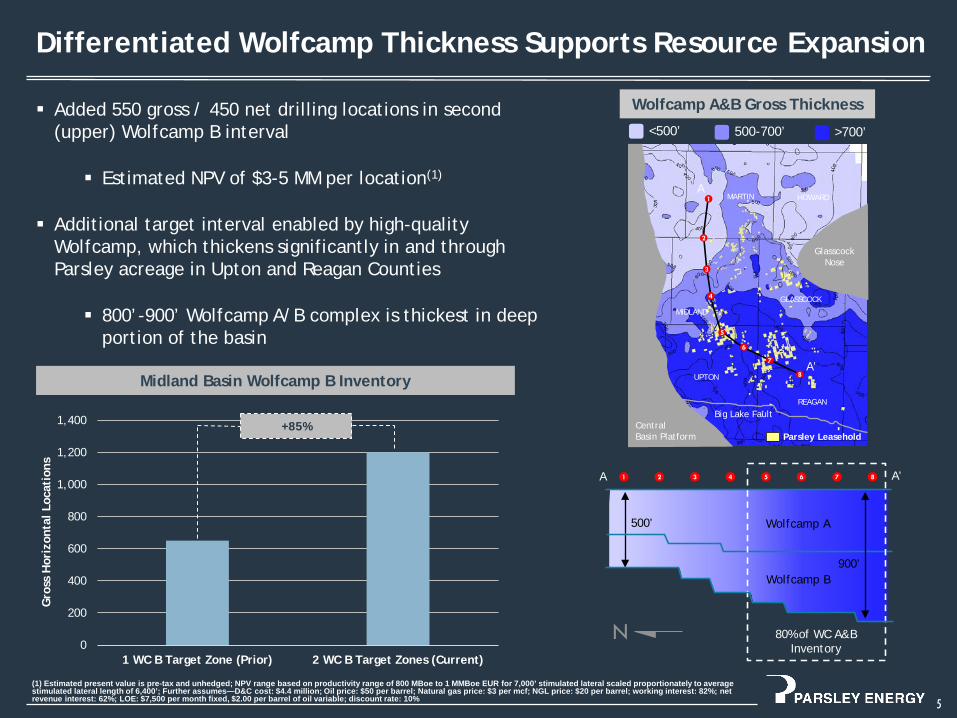
Wolfcamp A&B Gross Thickness
Wolfcamp A
Wolfcamp B
Added 550 gross / 450 net drilling locations in second (upper) Wolfcamp B interval
Estimated NPV of $3-5 MM per location(1)
Additional target interval enabled by high-quality Wolfcamp, which thickens significantly in and through Parsley acreage in Upton and Reagan Counties
800’-900’ Wolfcamp A/B complex is thickest in deep portion of the basin
N 80% of WC A&B Inventory
500’
900’
A’A
<500’ 500-700’ >700’
CentralBasin Platform
GlasscockNose
A’
A
REAGAN
UPTON
GLASSCOCK
MIDLAND
HOWARDMARTIN1
Parsley Leasehold
2
3
4
5
6
7
8
1 2 3 4 5 6 7 8
Midland Basin Wolfcamp B Inventory
0
200
400
600
800
1,000
1,200
1,400
1 WC B Target Zone (Prior) 2 WC B Target Zones (Current)
Gro
ss H
oriz
onta
l Loc
atio
ns
+85%
(1) Estimated present value is pre-tax and unhedged; NPV range based on productivity range of 800 MBoe to 1 MMBoe EUR for 7,000’ stimulated lateral scaled proportionately to average stimulated lateral length of 6,400’; Further assumes—D&C cost: $4.4 million; Oil price: $50 per barrel; Natural gas price: $3 per mcf; NGL price: $20 per barrel; working interest: 82%; net revenue interest: 62%; LOE: $7,500 per month fixed, $2.00 per barrel of oil variable; discount rate: 10%
Big Lake Fault
0
25
50
75
100
125
150
175
200
225
250
0 90 180 270 360
Cum
ulat
ive
Prod
ucti
on (
MBo
e)(1
)
Days of Production
Lower WC B Upper WC B
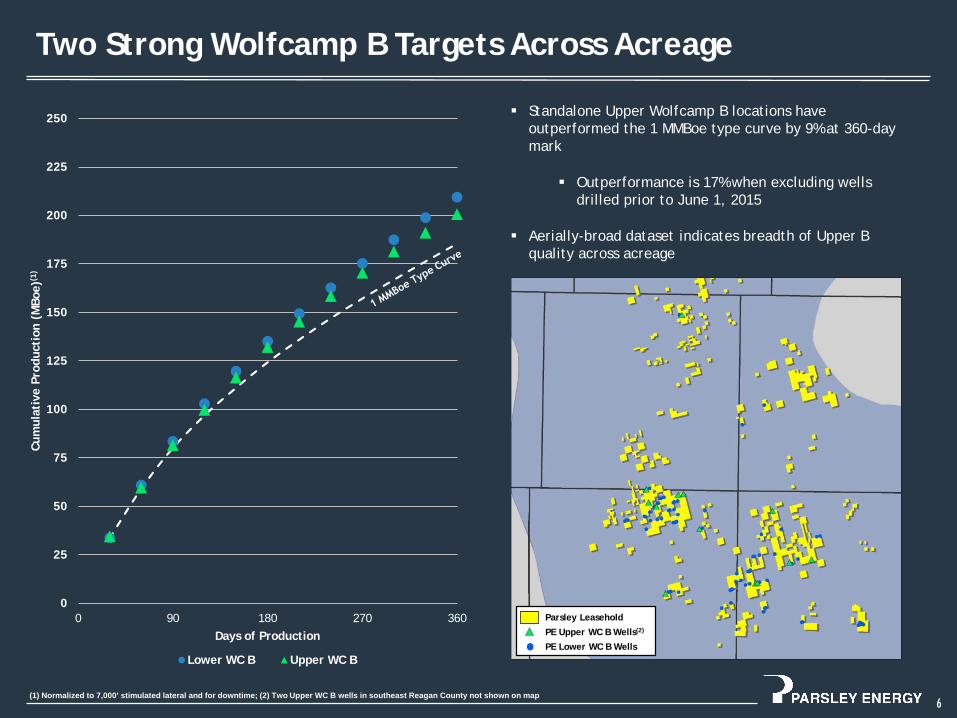
Two Strong Wolfcamp B Targets Across Acreage
Standalone Upper Wolfcamp B locations have outperformed the 1 MMBoe type curve by 9% at 360-day mark
Outperformance is 17% when excluding wells drilled prior to June 1, 2015
Aerially-broad dataset indicates breadth of Upper B quality across acreage
6(1) Normalized to 7,000’ stimulated lateral and for downtime; (2) Two Upper WC B wells in southeast Reagan County not shown on map
Parsley Leasehold
PE Upper WC B Wells(2)
PE Lower WC B Wells

0
10
20
30
40
0 10 20 30
Cum
ulat
ive
Prod
ucti
on (
MBo
e)(1
)
Days of Production
1 MMBoe Type Curve
Promising Results from First 3-Well Stacked Pad
Strong results from first set of simultaneously completed, stacked wells in the Wolfcamp A, Upper Wolfcamp B, and Lower Wolfcamp B intervals
Upper WC B lateral registered company’s second highest peak 24-hour IP at 2,420 Boe/d
3-well average tracking ahead of 1 MMBoe type curve
1.5-mile laterals completed with standard frac design
Located in the middle of Upton and Reagan acreage positions
7
Upper WC B Well Records 2nd Highest Company 24-Hr IP
0
500
1,000
1,500
2,000
2,500
3,000
Bast 34-39-4412H
(Lower WCB)
Grace 45-1-4306H
(Upper WCB)
Robbie 17-8-4403H
(Lower WCB)
Atkins 14-11-4202H
(Wolfcamp A)
Dallas Keuchel4301H
(Upper WCB)
Peak
24-
Hr
IP (
Boe/
d)(1
)
Parsley Leasehold
Grace 3-well Pad
Grace 3-Well Stack Pad Tracking 1 MMBoe Type Curve
(1) Normalized to 7,000’ stimulated lateral and for downtime

Significant Resource Expansion Potential
8
800’-900’ gross thickness in Wolfcamp A&B affords 600’-700’ between top and bottom targets, each with 200’-250’ vertical separation
Wolfcamp A may support a second landing zone given thickness across acreage, amounting to four total potential landing zones in Wolfcamp A&B
Tests in 2017 will assess multiple Wolfcamp A targets on a standalone and combined basis
Lateral spacing tests on schedule for 2017
Up to 60 potential Wolfcamp A and B locations per section with fourth target and downspacing
Appr
ox.
600-
700
ft
Current Inventory Spacing 660’
Downspaced 330’Grace
A-UB-LB Stack Test (Online)
UB-LB Stack & Downspace Test
(2017)
1-Mile Gun Barrel
A-UB-LBStack & Stagger
Test (4Q16)
Note: Spacing tests will be on different leases
UA-LA Stagger Test
(2017)
Current Inventory
per Section
PotentialInventory
per Section
Upper Wolfcamp A -- 15
Lower Wolfcamp A 8 15
Upper Wolfcamp B 8 15
LowerWolfcamp B 8 15
Total 24 60
Current InventoryInventory Upside
0%
20%
40%
60%
80%
100%
120%
$40 $45 $50 $55 $60
Rate
of
Retu
rn (
%)
Oil Price
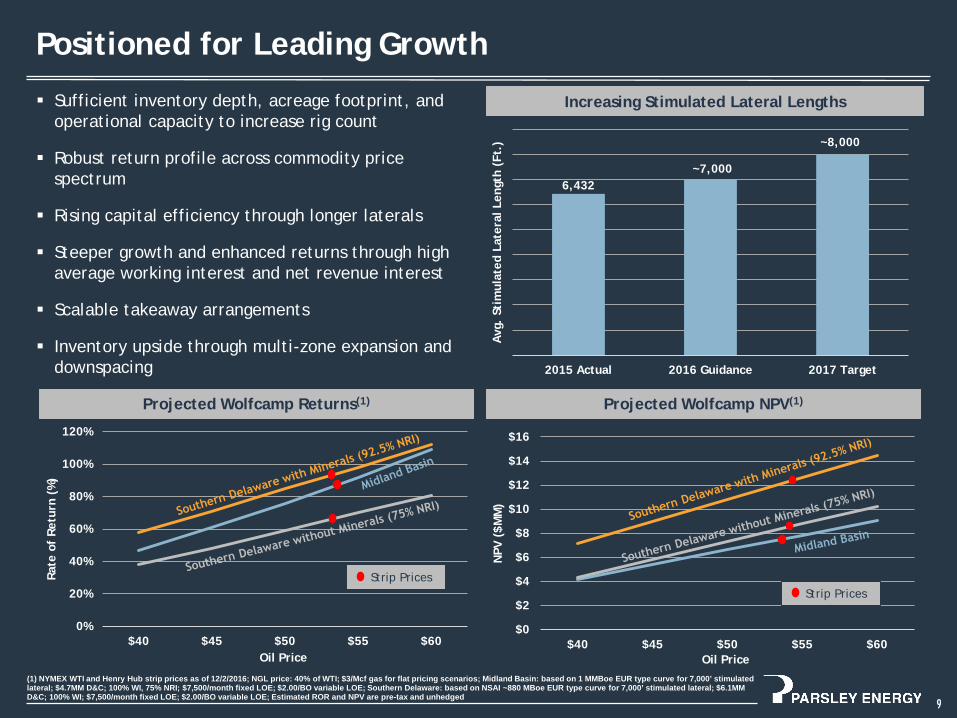
Positioned for Leading Growth
9
Increasing Stimulated Lateral Lengths Sufficient inventory depth, acreage footprint, and operational capacity to increase rig count
Robust return profile across commodity price spectrum
Rising capital efficiency through longer laterals
Steeper growth and enhanced returns through high average working interest and net revenue interest
Scalable takeaway arrangements
Inventory upside through multi-zone expansion and downspacing
Projected Wolfcamp NPV(1)
6,432~7,000
~8,000
2015 Actual 2016 Guidance 2017 Target
Avg
. St
imul
ated
Lat
eral
Len
gth
(Ft.
)
Projected Wolfcamp Returns(1)
Strip Prices
$0
$2
$4
$6
$8
$10
$12
$14
$16
$40 $45 $50 $55 $60
NPV
($M
M)
Oil Price(1) NYMEX WTI and Henry Hub strip prices as of 12/2/2016; NGL price: 40% of WTI; $3/Mcf gas for flat pricing scenarios; Midland Basin: based on 1 MMBoe EUR type curve for 7,000’ stimulated lateral; $4.7MM D&C; 100% WI, 75% NRI; $7,500/month fixed LOE; $2.00/BO variable LOE; Southern Delaware: based on NSAI ~880 MBoe EUR type curve for 7,000’ stimulated lateral; $6.1MM D&C; 100% WI; $7,500/month fixed LOE; $2.00/BO variable LOE; Estimated ROR and NPV are pre-tax and unhedged
Strip Prices
0
25
50
75
100
125
150
175
200
225
250
0 90 180 270 360
Cum
ulat
ive
Prod
ucti
on (
MBo
e)(2
)
Days of Production
Midland Basin S. Delaware
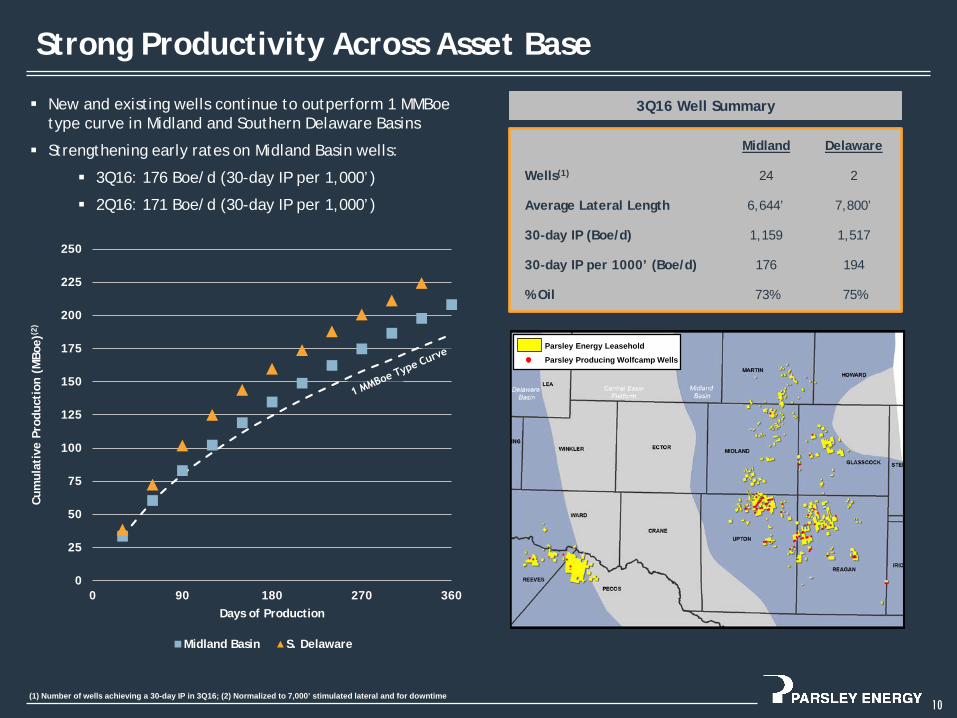
(1) Number of wells achieving a 30-day IP in 3Q16; (2) Normalized to 7,000’ stimulated lateral and for downtime
Strong Productivity Across Asset Base
10
New and existing wells continue to outperform 1 MMBoe type curve in Midland and Southern Delaware Basins
Strengthening early rates on Midland Basin wells:
3Q16: 176 Boe/d (30-day IP per 1,000’)
2Q16: 171 Boe/d (30-day IP per 1,000’)
Midland Delaware
Wells(1) 24 2
Average Lateral Length 6,644’ 7,800’
30-day IP (Boe/d) 1,159 1,517
30-day IP per 1000’ (Boe/d) 176 194
% Oil 73% 75%
3Q16 Well Summary
Parsley Energy Leasehold
Parsley Producing Wolfcamp Wells
11
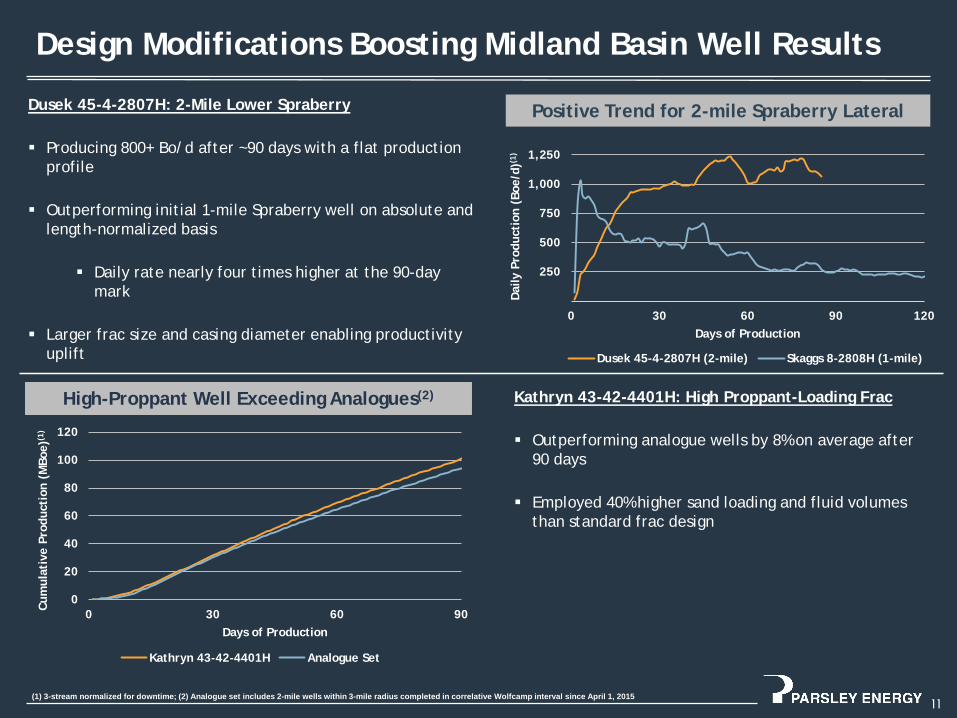
Design Modifications Boosting Midland Basin Well Results
Dusek 45-4-2807H: 2-Mile Lower Spraberry
Producing 800+ Bo/d after ~90 days with a flat production profile
Outperforming initial 1-mile Spraberry well on absolute and length-normalized basis
Daily rate nearly four times higher at the 90-day mark
Larger frac size and casing diameter enabling productivity uplift
(1) 3-stream normalized for downtime; (2) Analogue set includes 2-mile wells within 3-mile radius completed in correlative Wolfcamp interval since April 1, 2015
Kathryn 43-42-4401H: High Proppant-Loading Frac
Outperforming analogue wells by 8% on average after 90 days
Employed 40% higher sand loading and fluid volumes than standard frac design
250
500
750
1,000
1,250
0 30 60 90 120
Dai
ly P
rodu
ctio
n (B
oe/d
)(1)
Days of Production
Dusek 45-4-2807H (2-mile) Skaggs 8-2808H (1-mile)
Positive Trend for 2-mile Spraberry Lateral
0
20
40
60
80
100
120
0 30 60 90
Cum
ulat
ive
Prod
ucti
on (
MBo
e)(1
)
Days of Production
Kathryn 43-42-4401H Analogue Set
High-Proppant Well Exceeding Analogues(2)

0
500
1,000
1,500
2,000
0 30 60 90 120 150 180
Dai
ly R
ate
(Boe
/d)(1
)
Days on Production
Trees State 65-64-4307H Trees State 65-36-4307H1st Well: Trees State 16-1H
Impressive New Wells in Southern Delaware Basin
12
Evolving drilling and completion design boosting productivity relative to strong initial wells
West: First Parsley-drilled lateral in Reeves County, Lincoln 4-1-4307H, geosteered in preferred target zone
East: First pad wells pumped 60% more sand; still flowing at impressive rates
East: First 2-well Pad Benefiting from Larger Frac
Avg. Length: 7,800’Avg. Peak 30-day IP: 1,517 Boe/dAvg. Oil Cut: 75%
(1) Normalized for downtime
0
500
1,000
1,500
2,000
2,500
0 10 20 30 40 50
Dai
ly R
ate
(Boe
/d)(1
)
Days on Production
Lincoln 4-1-4307H 1st Well: Ranger C4-7-4309H
West: First Parsley-Drilled Lateral Eclipsed 2,000 Boe/d
Length: 6,890’Peak 30-day IP: N/AOil Cut: 65%
Put on ESP
WEST EAST
Parsley Energy Leasehold
New Parsley Wells
Prior Parsley Wells
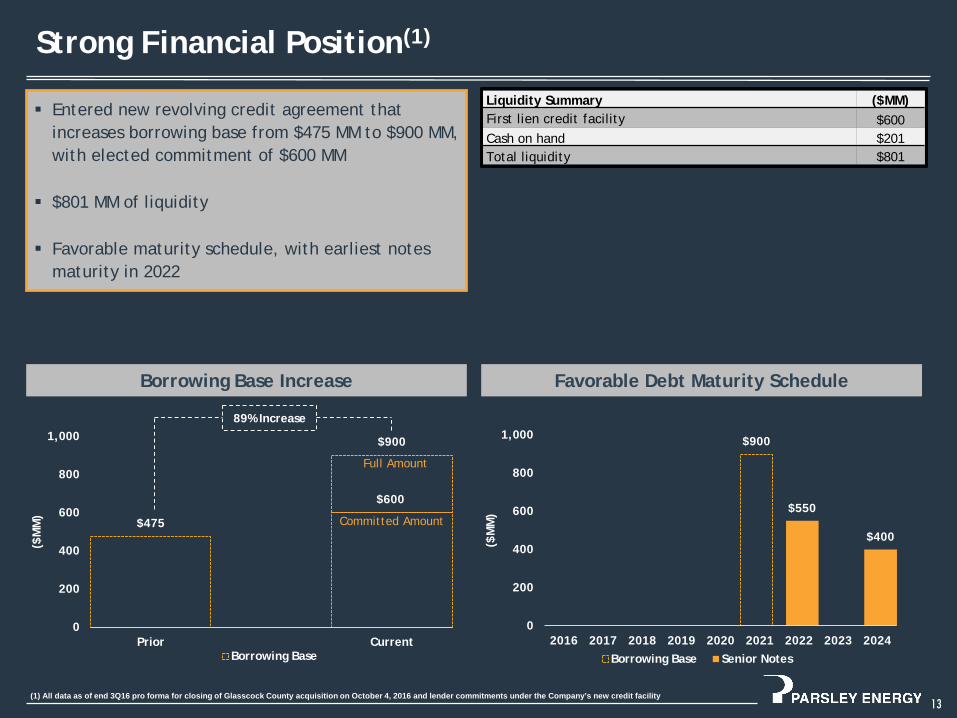
$900
$550
$400
0
200
400
600
800
1,000
2016 2017 2018 2019 2020 2021 2022 2023 2024
($M
M)
Borrowing Base Senior Notes
Liquidity Summary ($MM) First lien credit facility $600 Cash on hand $201Total liquidity $801
Entered new revolving credit agreement that increases borrowing base from $475 MM to $900 MM, with elected commitment of $600 MM
$801 MM of liquidity
Favorable maturity schedule, with earliest notes maturity in 2022
Strong Financial Position(1)
13
Borrowing Base Increase
(1) All data as of end 3Q16 pro forma for closing of Glasscock County acquisition on October 4, 2016 and lender commitments under the Company’s new credit facility
Favorable Debt Maturity Schedule
$475
$600
$900
0
200
400
600
800
1,000
Prior Current
($M
M)
Borrowing Base
89% Increase
Committed Amount
Full Amount
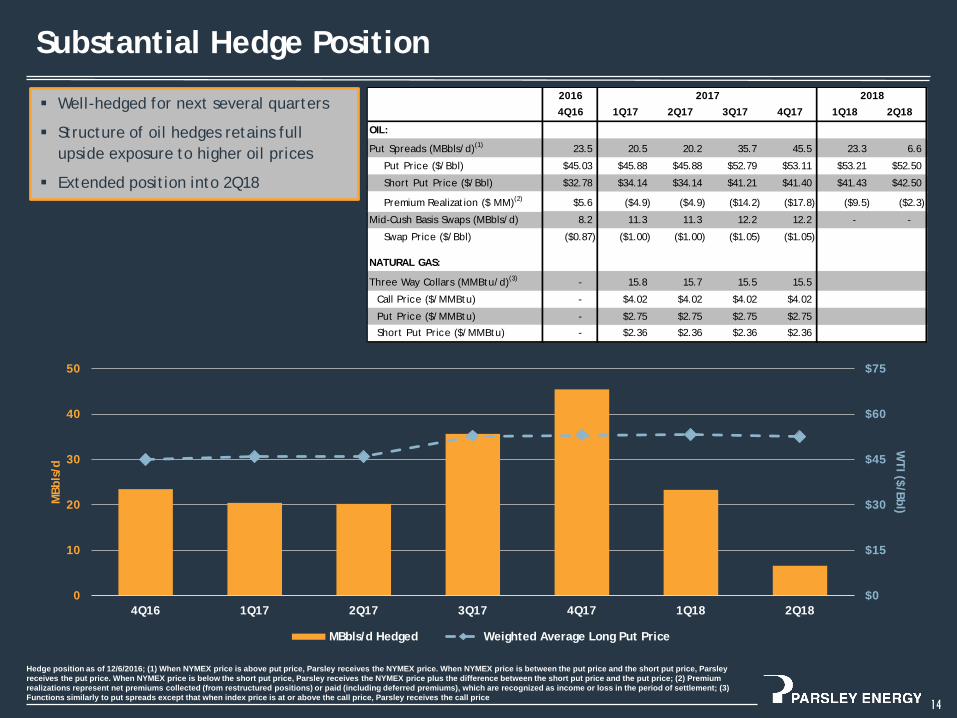
Substantial Hedge Position
14
Well-hedged for next several quarters
Structure of oil hedges retains full upside exposure to higher oil prices
Extended position into 2Q18
Hedge position as of 12/6/2016; (1) When NYMEX price is above put price, Parsley receives the NYMEX price. When NYMEX price is between the put price and the short put price, Parsley receives the put price. When NYMEX price is below the short put price, Parsley receives the NYMEX price plus the difference between the short put price and the put price; (2) Premium realizations represent net premiums collected (from restructured positions) or paid (including deferred premiums), which are recognized as income or loss in the period of settlement; (3) Functions similarly to put spreads except that when index price is at or above the call price, Parsley receives the call price
2016
4Q16 1Q17 2Q17 3Q17 4Q17 1Q18 2Q18
OIL:
Put Spreads (MBbls/d)(1) 23.5 20.5 20.2 35.7 45.5 23.3 6.6
Put Price ($/Bbl) $45.03 $45.88 $45.88 $52.79 $53.11 $53.21 $52.50
Short Put Price ($/Bbl) $32.78 $34.14 $34.14 $41.21 $41.40 $41.43 $42.50
Premium Realization ($ MM)(2) $5.6 ($4.9) ($4.9) ($14.2) ($17.8) ($9.5) ($2.3)
Mid-Cush Basis Swaps (MBbls/d) 8.2 11.3 11.3 12.2 12.2 - -
Swap Price ($/Bbl) ($0.87) ($1.00) ($1.00) ($1.05) ($1.05)
NATURAL GAS:
Three Way Collars (MMBtu/d)(3) - 15.8 15.7 15.5 15.5
Call Price ($/MMBtu) - $4.02 $4.02 $4.02 $4.02
Put Price ($/MMBtu) - $2.75 $2.75 $2.75 $2.75
Short Put Price ($/MMBtu) - $2.36 $2.36 $2.36 $2.36
2017 2018
$0
$15
$30
$45
$60
$75
0
10
20
30
40
50
4Q16 1Q17 2Q17 3Q17 4Q17 1Q18 2Q18
WTI ($/Bbl)M
Bbls
/d
MBbls/d Hedged Weighted Average Long Put Price
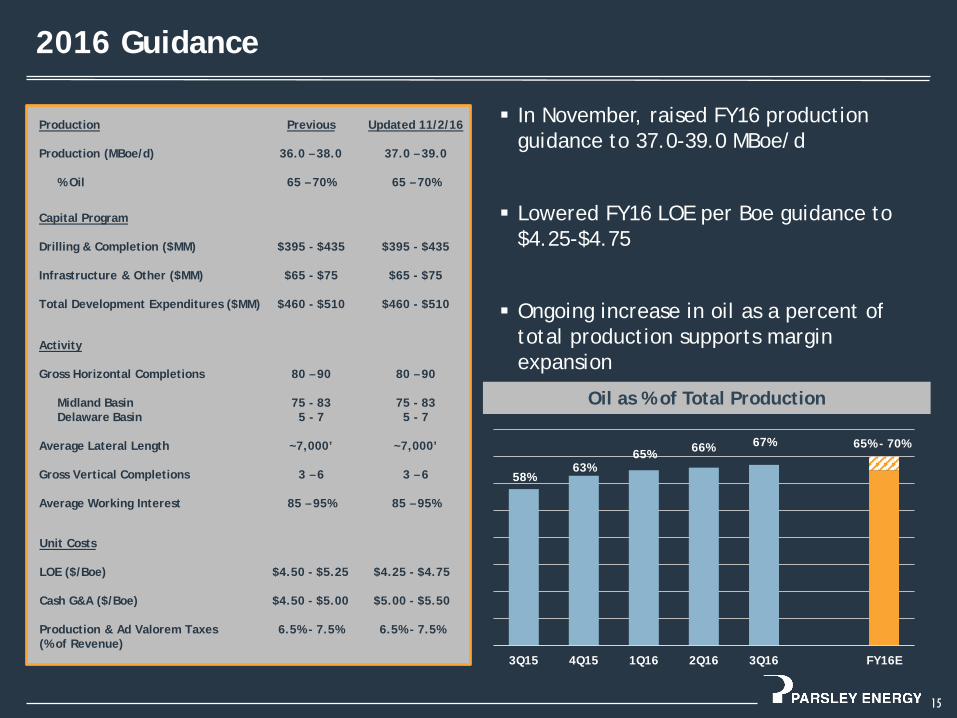
2016 Guidance
15
Unit Costs
LOE ($/Boe) $4.50 - $5.25 $4.25 - $4.75
Cash G&A ($/Boe) $4.50 - $5.00 $5.00 - $5.50
Production & Ad Valorem Taxes (% of Revenue)
6.5% - 7.5% 6.5% - 7.5%
Capital Program
Drilling & Completion ($MM) $395 - $435 $395 - $435
Infrastructure & Other ($MM) $65 - $75 $65 - $75
Total Development Expenditures ($MM) $460 - $510 $460 - $510
Activity
Gross Horizontal Completions
Midland BasinDelaware Basin
Average Lateral Length
80 – 90
75 - 835 - 7
~7,000’
80 – 90
75 - 835 - 7
~7,000’
Gross Vertical Completions
Average Working Interest
3 – 6
85 – 95%
3 – 6
85 – 95%
Production
Production (MBoe/d)
% Oil
Previous
36.0 – 38.0
65 – 70%
Updated 11/2/16
37.0 – 39.0
65 – 70%
Oil as % of Total Production
58%63%
65% 66% 67% 65% - 70%
3Q15 4Q15 1Q16 2Q16 3Q16 FY16E
In November, raised FY16 production guidance to 37.0-39.0 MBoe/d
Lowered FY16 LOE per Boe guidance to $4.25-$4.75
Ongoing increase in oil as a percent of total production supports margin expansion

$801 MM of liquidity(3)
Substantial hedge position in place
Investment Highlights
16(1) See slide 9 for associated assumptions; (2) Adjusted for estimated PDP value but not for acquired wells in various stages of drilling and completion; (3) As of end 3Q16 pro forma for closing of Glasscock County acquisition on October 4, 2016 and lender commitments under the Company’s new credit facility
Expect 72% year-over-year production growth based on midpoint of updated 2016 guidance
17% compound quarterly production growth rate over ten quarters as a public company
Wolfcamp wells generate ROR of ~65%-90% and NPV of ~$7 MM-$12 MM at strip prices(1)
Growing horizontal production base drives higher oil percentage and lower operating costs per Boe
Acquired ~42,000 net leasehold acres for ~$17,000 per acre(2) year to date
Acquired mineral rights in S. Delaware Basin boost Parsley’s average NRI to 92.5% on affected acreage
Potential for up to 60 Wolfcamp A and Wolfcamp B locations per section on portions of Midland Basin acreage
Scratching the surface of significant resource potential in the Southern Delaware Basin
Abundant Upside
Strategic Acquirer
Leading Growth Profile
World-class Returns
Strong Financial Position

Investment Highlights
17
APPENDIX
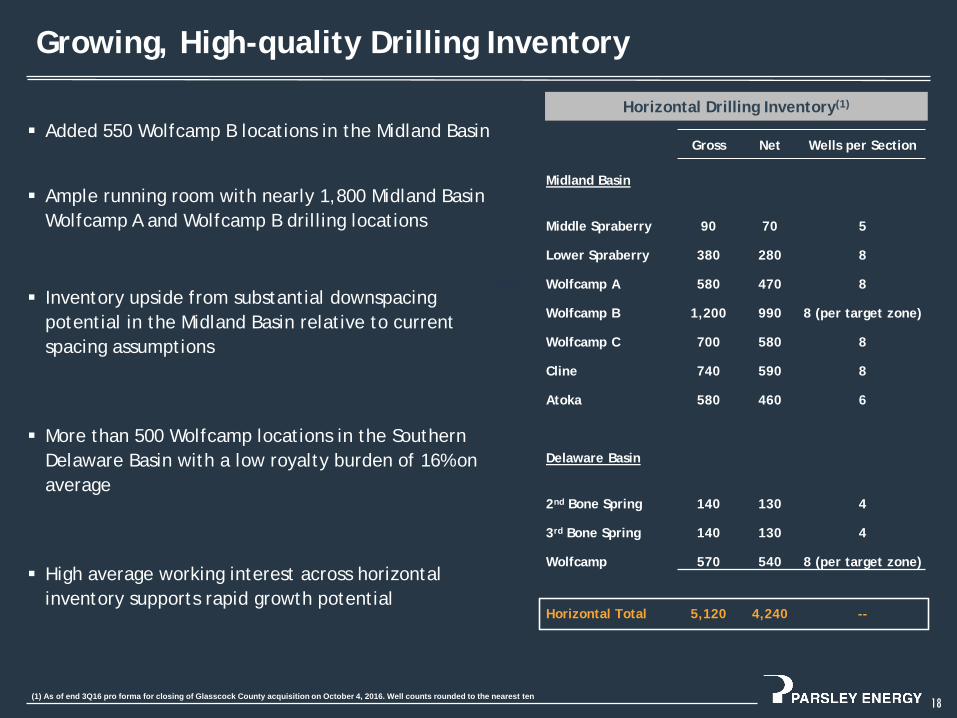
Growing, High-quality Drilling Inventory
18
Horizontal Drilling Inventory(1)
+240’
Added 550 Wolfcamp B locations in the Midland Basin
Ample running room with nearly 1,800 Midland Basin Wolfcamp A and Wolfcamp B drilling locations
Inventory upside from substantial downspacingpotential in the Midland Basin relative to current spacing assumptions
More than 500 Wolfcamp locations in the Southern Delaware Basin with a low royalty burden of 16% on average
High average working interest across horizontal inventory supports rapid growth potential
Gross Net Wells per Section
Midland Basin
Middle Spraberry 90 70 5
Lower Spraberry 380 280 8
Wolfcamp A 580 470 8
Wolfcamp B 1,200 990 8 (per target zone)
Wolfcamp C 700 580 8
Cline 740 590 8
Atoka 580 460 6
Delaware Basin
2nd Bone Spring 140 130 4
3rd Bone Spring 140 130 4
Wolfcamp 570 540 8 (per target zone)
Horizontal Total 5,120 4,240 --
(1) As of end 3Q16 pro forma for closing of Glasscock County acquisition on October 4, 2016. Well counts rounded to the nearest ten

~$390 MM acquisition closed on October 4, 2016 includes:
~9,000 mostly contiguous net leasehold acres in Glasscock County accommodating long-lateral development
300 gross horizontal drilling locations in primary target intervals (Lower Spraberry, Wolfcamp A, and Wolfcamp B)
Mineral and overriding royalty interests translating to ~5% average increase in net revenue interest (“NRI”)
Estimated net production of 270 Boe/d at acquisition announcement on August 15, 2016
5 saltwater disposal wells
Strategic Glasscock County Acquisition
19
Parsley Energy Leasehold
Acquisition Acreage
Midland Basin
GLASSCOCK
REAGAN
UPTON
MIDLAND
MARTIN
HOWARD
Midland Basin
Big Lake Fault
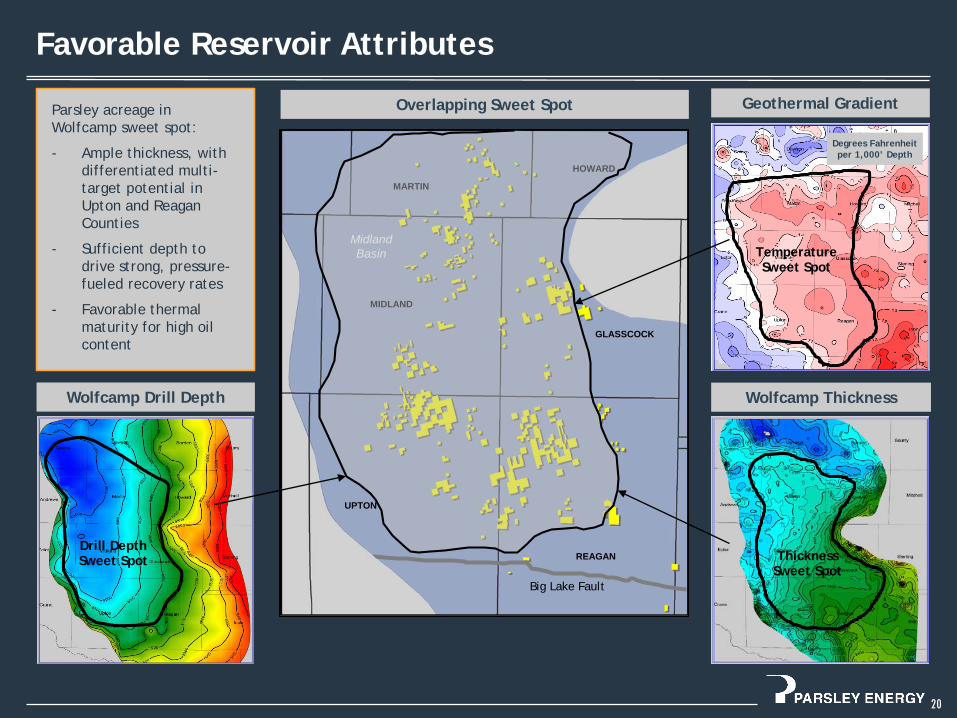
Favorable Reservoir Attributes
20
Overlapping Sweet Spot
Wolfcamp Thickness
Geothermal Gradient
Degrees Fahrenheit per 1000’ Depth
Temperature Sweet Spot
Thickness Sweet Spot
Degrees Fahrenheit per 1,000’ Depth
Wolfcamp Drill Depth
Drill DepthSweet Spot
Parsley acreage in Wolfcamp sweet spot:
- Ample thickness, with differentiated multi-target potential in Upton and Reagan Counties
- Sufficient depth to drive strong, pressure-fueled recovery rates
- Favorable thermal maturity for high oil content

Prepared for Southern Delaware Rig Ramp
Marketing
Ample options for immediate gas and oil takeaway with nearby WahaGas Hub and high-capacity oil transmission lines
Infrastructure
Initial water supply and disposal in place with buildout ongoing
Existing processing and transmission infrastructure provides electricity hubs from which to build out power grid
Surface Ownership
Estimate at least $200 M per-well savings on water sourcing and disposal
Additional savings on pads, batteries, roads, rights-of-way, and other surface damages
21
60 MMcf/d Gas Plant 200 MMcf/d Gas Plant 150 MBo/d Oil Transfer Line
60 MMcf/d Gas Plant(expected by YE16)
120 MMcf/d Gas Plant(Waha Hub)
160 MBo/d Oil Transfer Line
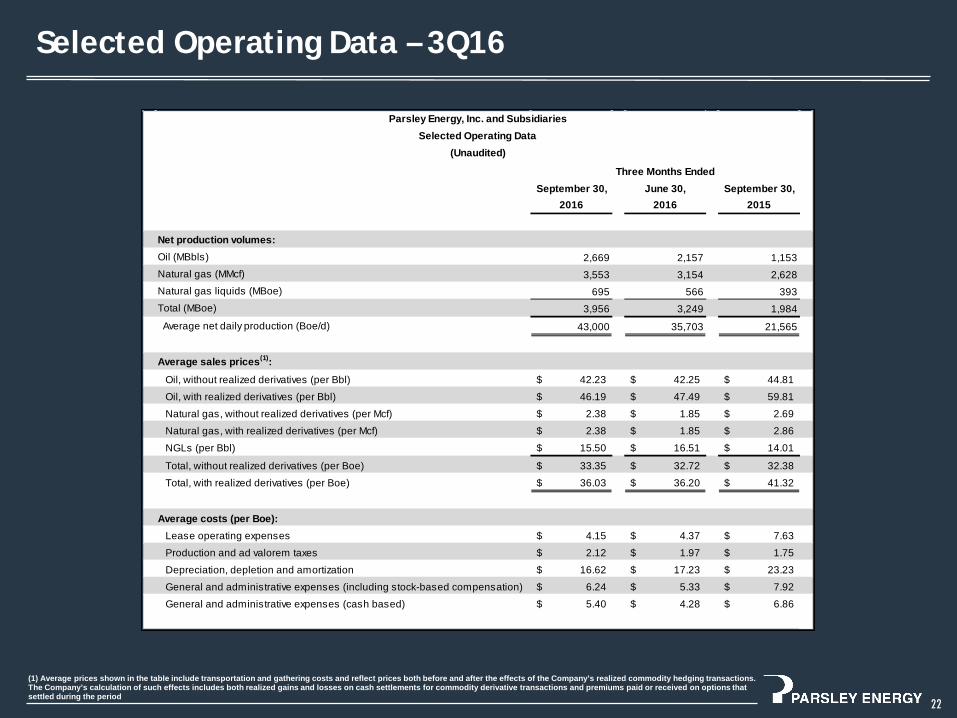
Selected Operating Data – 3Q16
22
(1) Average prices shown in the table include transportation and gathering costs and reflect prices both before and after the effects of the Company’s realized commodity hedging transactions. The Company’s calculation of such effects includes both realized gains and losses on cash settlements for commodity derivative transactions and premiums paid or received on options that settled during the period
September 30, June 30, September 30, 2016 2016 2015
Net production volumes:Oil (MBbls) 2,669 2,157 1,153Natural gas (MMcf) 3,553 3,154 2,628Natural gas liquids (MBoe) 695 566 393Total (MBoe) 3,956 3,249 1,984
Average net daily production (Boe/d) 43,000 35,703 21,565
Average sales prices(1):
Oil, without realized derivatives (per Bbl) 42.23$ 42.25$ 44.81$
Oil, with realized derivatives (per Bbl) 46.19$ 47.49$ 59.81$
Natural gas, without realized derivatives (per Mcf) 2.38$ 1.85$ 2.69$
Natural gas, with realized derivatives (per Mcf) 2.38$ 1.85$ 2.86$
NGLs (per Bbl) 15.50$ 16.51$ 14.01$
Total, without realized derivatives (per Boe) 33.35$ 32.72$ 32.38$
Total, with realized derivatives (per Boe) 36.03$ 36.20$ 41.32$
Average costs (per Boe):Lease operating expenses 4.15$ 4.37$ 7.63$
Production and ad valorem taxes 2.12$ 1.97$ 1.75$
Depreciation, depletion and amortization 16.62$ 17.23$ 23.23$
General and administrative expenses (including stock-based compensation) 6.24$ 5.33$ 7.92$
General and administrative expenses (cash based) 5.40$ 4.28$ 6.86$
Parsley Energy, Inc. and SubsidiariesSelected Operating Data
(Unaudited)
Three Months Ended

Forward Looking Statements and Cautionary StatementsForward-Looking StatementsThe information in this presentation includes “forward-looking statements” that are made pursuant to the Safe Harbor Provisions of the Private Securities Litigation Reform Act of 1995. All statements,other than statements of historical fact included in this presentation, regarding our strategy, future operations, financial position, estimated revenues and losses, projected costs, prospects, plans andobjectives of management are forward-looking statements. When used in this presentation, the words “could,” “believe,” “anticipate,” “intend,” “estimate,” “expect,” “project” and similar expressionsare intended to identify forward-looking statements, although not all forward-looking statements contain such identifying words. These forward-looking statements are based on Parsley Energy, Inc.’s(“Parsley Energy,” “Parsley,” or the “Company”) current expectations and assumptions about future events and are based on currently available information as to the outcome and timing of futureevents. We caution you that these forward-looking statements are subject to all of the risks and uncertainties, most of which are difficult to predict and many of which are beyond our control, incident tothe exploration for and development, production, gathering and sale of oil and natural gas. These risks include, but are not limited to, commodity price volatility, inflation, lack of availability of drillingand production equipment and services, environmental risks, drilling and other operating risks, regulatory changes, the uncertainty inherent in estimating reserves and in projecting future rates ofproduction, the production potential of our undeveloped acreage, cash flow and access to capital, the timing of development expenditures and the risk factors discussed in or referenced in our filingswith the United States Securities and Exchange Commission (“SEC”), including our Annual Report on Form 10-K and our subsequent Quarterly Reports on Form 10-Q and Current Reports on Form 8-K.
You are cautioned not to place undue reliance on any forward-looking statements, which speak only as of the date of this presentation. Except as otherwise required by applicable law, we disclaim anyduty to update any forward-looking statements, all of which are expressly qualified by the statements in this section, to reflect events or circumstances after the date of this presentation.
Our production forecasts and expectations for future periods are dependent upon many assumptions, including estimates of production decline rates from existing wells and the undertaking and outcomeof future drilling activity, which may be affected by significant commodity price declines or cost increases.
Reconciliation of Non-GAAP Financial MeasuresAdjusted EBITDAX and adjusted net income or loss are financial measures that are not presented in accordance with generally accepted accounting principles in the United States (“GAAP”).Reconciliations of these non-GAAP financial measures can be found in our Quarterly Report on Form 10-Q and in the appendix to this presentation.
Industry and Market DataThis presentation has been prepared by Parsley and includes market data and other statistical information from third-party sources, including independent industry publications, government publicationsor other published independent sources. Although Parsley believes these third-party sources are reliable as of their respective dates, Parsley has not independently verified the accuracy or completenessof this information. Some data are also based on the Parsley’s good faith estimates, which are derived from its review of internal sources as well as the third-party sources described above.
Oil & Gas ReservesParsley’s proved reserves are those quantities of oil and gas, which, by analysis of geoscience and engineering data, can be estimated with reasonable certainty to be economically producible—from agiven date forward, from known reservoirs, and under existing economic conditions (using unweighted average 12-month first day of the month prices), operating methods, and government regulations—prior to the time at which contracts providing the right to operate expire, unless evidence indicates that renewal is reasonably certain, regardless of whether deterministic or probabilistic methods areused for the estimation.
Proved reserves attributable to Parsley as of 12/31/15 are estimated utilizing SEC reserve recognition standards and pricing assumptions based on SEC pricing of $46.79 / Bbl crude, $2.501 / MMBtu gas,and adjusted realized pricing of $46.54 / Bbl crude, $16.42 / Bbl NGL, and $2.531 / Mcf residue gas. References to our estimated proved reserves as of 12/31/15 are derived from our proved reservereport prepared by Netherland, Sewell & Associates, Inc. (“NSAI”).
We may use the term “expected ultimate recoveries” (“EURs”) or other descriptions of volumes of reserves, which terms include quantities of oil and gas that may not meet the SEC’s definitions ofproved, probable and possible reserves, and which the SEC's guidelines strictly prohibit Parsley from including in filings with the SEC. Unless otherwise stated in this presentation, such estimates havebeen prepared internally by our engineers and management without review by independent engineers. These estimates are by their nature more speculative than estimates of proved, probable andpossible reserves and accordingly are subject to substantially greater risk of being actually realized, particularly in areas or zones where there has been limited or no drilling history. We include theseestimates to demonstrate what we believe to be the potential for future drilling and production by the Company. Actual locations drilled and quantities that may be ultimately recovered from ourproperties will differ substantially. In addition, we have made no commitment to drill all of the drilling locations. Ultimate recoveries will be dependent upon numerous factors including actualencountered geological conditions, the impact of future oil and gas pricing, exploration and development costs, and our future drilling decisions and budgets based upon our future evaluation of risk,returns and the availability of capital and, in many areas, the outcome of negotiation of drilling arrangements with holders of adjacent or fractional interest leases. Our estimates may changesignificantly as development of our properties provides additional data and therefore actual quantities that may ultimately be recovered will likely differ from these estimates. Our related expectationsfor future periods are dependent upon many assumptions, including estimates of production decline rates from existing wells, the undertaking and outcome of future drilling activity and activity that maybe affected by significant commodity price declines or drilling cost increases.
Unless otherwise noted, Net Present Value (“NPV”) estimates are before taxes and assume the Company generated EUR and decline curve estimates based on Company drilling and completion costestimates that do not include facilities, land, seismic, general and administrative (“G&A”) or other corporate level costs.