Sobha Dream Acres - New Launch by Sobha. Call 1800 3000 5245

SOBHA DEVELOPERS LTDSOBHA DEVELOPERS LTD
INVESTOR PRESENTATION
30th June, 2013
SOBHA CITY, BANGALORE– “LIVE THE MEDITERRANEAN LIFE”
AWARDS & RECOGNITION
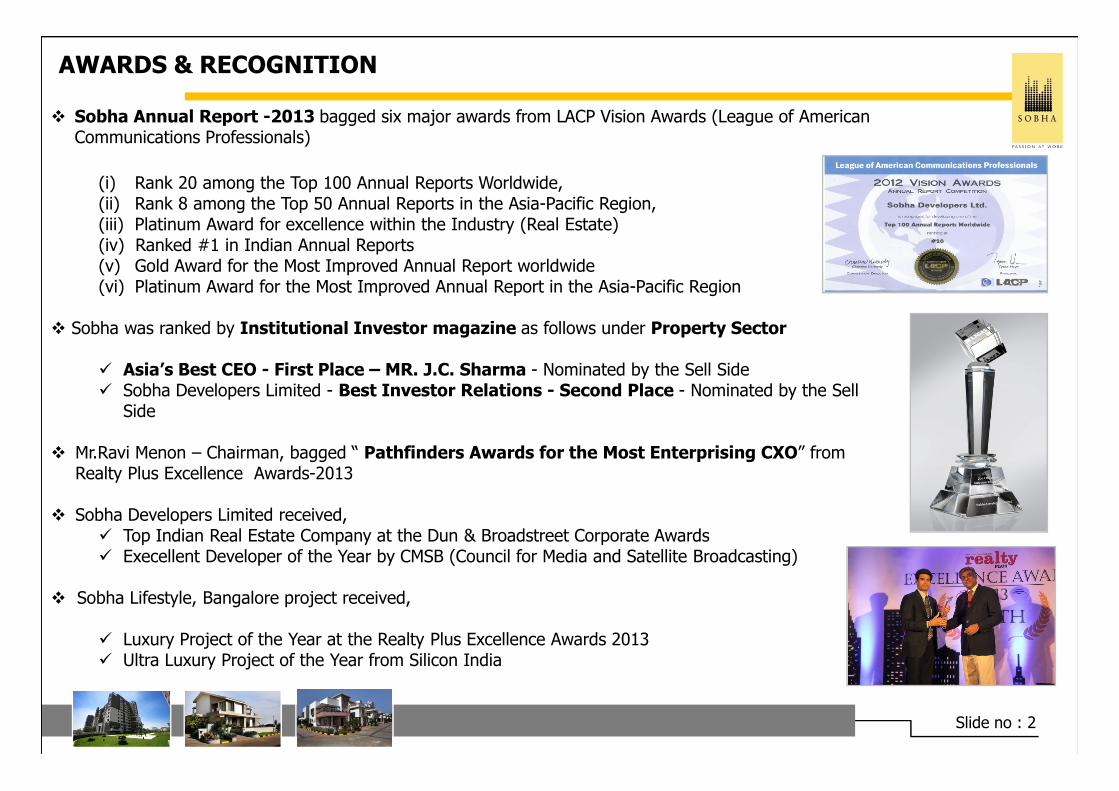
� Sobha Annual Report -2013 bagged six major awards from LACP Vision Awards (League of American Communications Professionals)
(i) Rank 20 among the Top 100 Annual Reports Worldwide, (ii) Rank 8 among the Top 50 Annual Reports in the Asia-Pacific Region, (iii) Platinum Award for excellence within the Industry (Real Estate)(iv) Ranked #1 in Indian Annual Reports(v) Gold Award for the Most Improved Annual Report worldwide(vi) Platinum Award for the Most Improved Annual Report in the Asia-Pacific Region
� Sobha was ranked by Institutional Investor magazine as follows under Property Sector
� Asia’s Best CEO - First Place – MR. J.C. Sharma - Nominated by the Sell Side� Sobha Developers Limited - Best Investor Relations - Second Place - Nominated by the Sell
Slide no : 2
� Sobha Developers Limited - Best Investor Relations - Second Place - Nominated by the Sell Side
� Mr.Ravi Menon – Chairman, bagged “ Pathfinders Awards for the Most Enterprising CXO” from Realty Plus Excellence Awards-2013
� Sobha Developers Limited received,� Top Indian Real Estate Company at the Dun & Broadstreet Corporate Awards� Execellent Developer of the Year by CMSB (Council for Media and Satellite Broadcasting)
� Sobha Lifestyle, Bangalore project received,
� Luxury Project of the Year at the Realty Plus Excellence Awards 2013� Ultra Luxury Project of the Year from Silicon India

Q1-FY14 PERFORMANCE HIGHLIGHTS
SALES
ValueRecorded new sales value of Rs.6.03 Billion during Q1 FY-14, as against Rs.4.79 Billion during Q1FY-13 - Growth of 25.7%
VolumeSold 0.92 mn.sq.ft of new space during Q1 FY-14 as against 0.84 mn.sqft during Q1 FY-13 - Growth of 10.2%
RealizationAchieved average price realization of Rs.6,548 / sq.ft during Q1 FY-14, as against Rs.5,737/sq.ft during Q1 FY-13 - Realization improved by 14.1%.
Slide no : 3
NEW LAUNCHES
� Launched 2 projects measuring 0.40 mn.sq.ft
� 0.53 mn.sqft of area released for sale during Q1 FY14 from existing projects.
Project Type Location Area (sq.ft) Sobha share
Sobha Landscape Plotted Development Bangalore 202,524 100%
St.Mark's Road property Commercial + Retail Bangalore 200,527 50%
Q1-FY14 PERFORMANCE HIGHLIGHTS
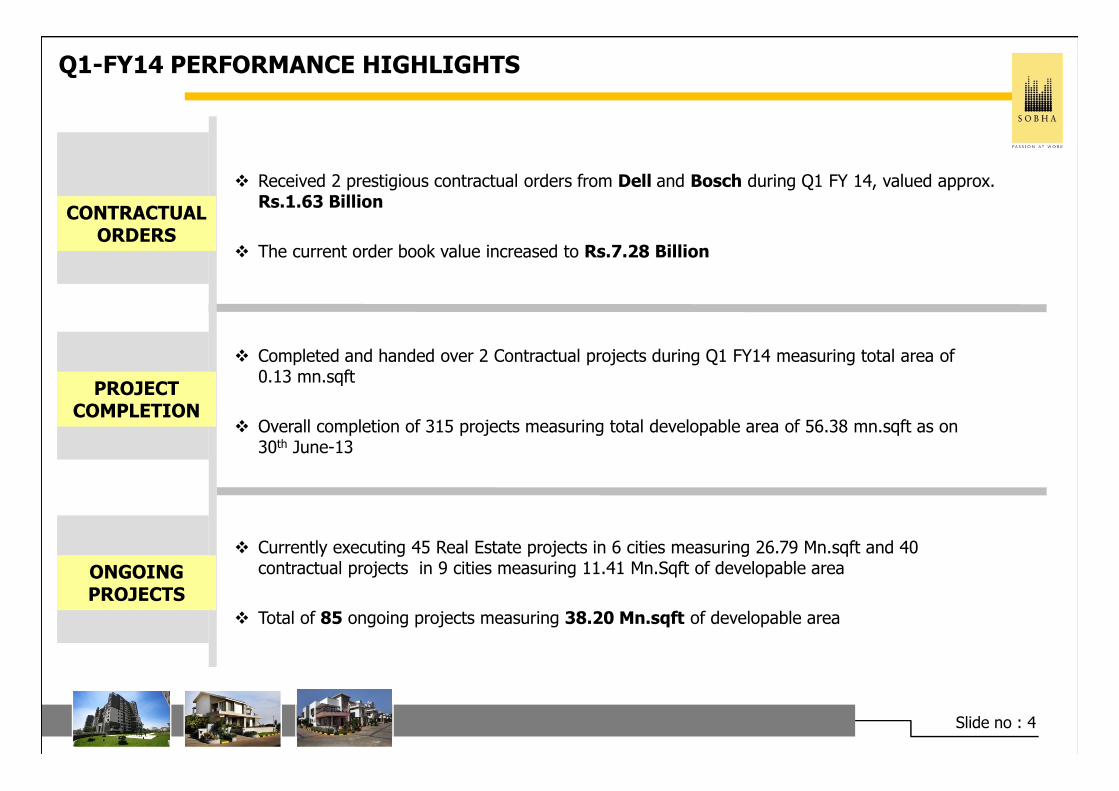
� Received 2 prestigious contractual orders from Dell and Bosch during Q1 FY 14, valued approx. Rs.1.63 Billion
� The current order book value increased to Rs.7.28 Billion
� Completed and handed over 2 Contractual projects during Q1 FY14 measuring total area of 0.13 mn.sqft
CONTRACTUAL ORDERS
PROJECT
Slide no : 4
� Overall completion of 315 projects measuring total developable area of 56.38 mn.sqft as on 30th June-13
PROJECT COMPLETION
ONGOINGPROJECTS
� Currently executing 45 Real Estate projects in 6 cities measuring 26.79 Mn.sqft and 40 contractual projects in 9 cities measuring 11.41 Mn.Sqft of developable area
� Total of 85 ongoing projects measuring 38.20 Mn.sqft of developable area
Q1 FY 14, FINANCIAL HIGHLIGHTS (Consolidated)
REVENUE
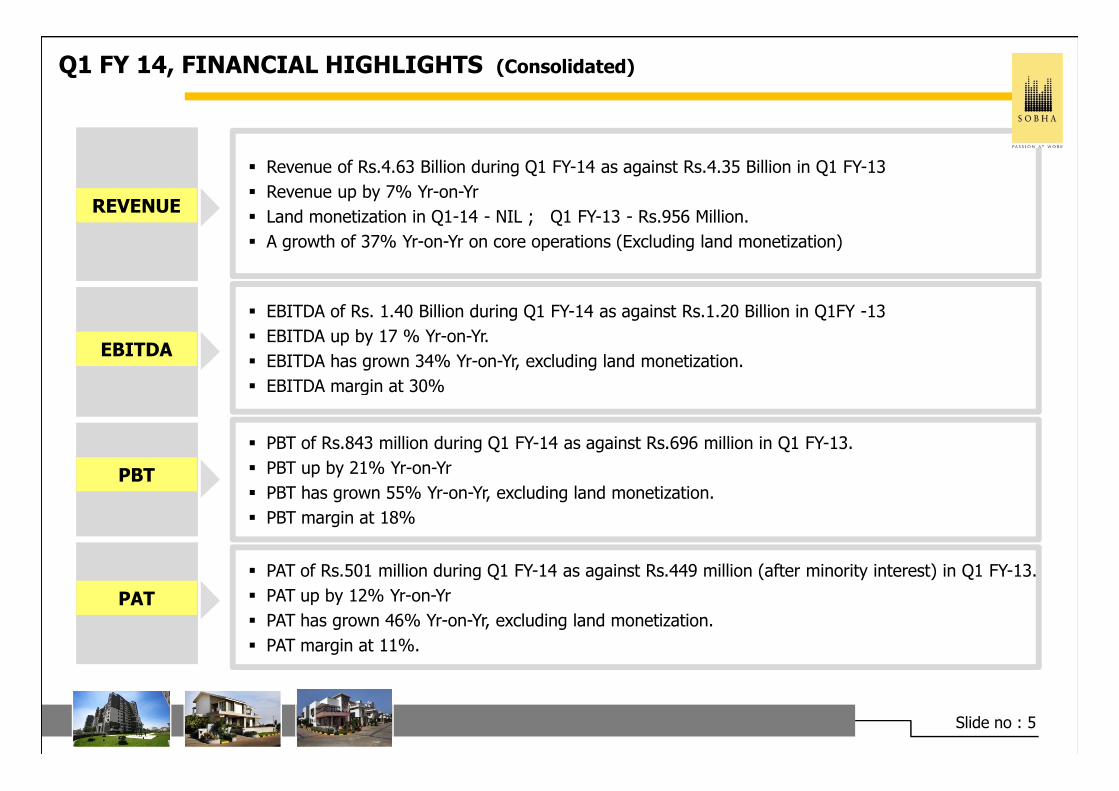
� Revenue of Rs.4.63 Billion during Q1 FY-14 as against Rs.4.35 Billion in Q1 FY-13
� Revenue up by 7% Yr-on-Yr
� Land monetization in Q1-14 - NIL ; Q1 FY-13 - Rs.956 Million.
� A growth of 37% Yr-on-Yr on core operations (Excluding land monetization)
� EBITDA of Rs. 1.40 Billion during Q1 FY-14 as against Rs.1.20 Billion in Q1FY -13
� EBITDA up by 17 % Yr-on-Yr.
� EBITDA has grown 34% Yr-on-Yr, excluding land monetization.
� EBITDA margin at 30%
EBITDA
Slide no : 5
PAT
PBT
� PBT of Rs.843 million during Q1 FY-14 as against Rs.696 million in Q1 FY-13.
� PBT up by 21% Yr-on-Yr
� PBT has grown 55% Yr-on-Yr, excluding land monetization.
� PBT margin at 18%
� PAT of Rs.501 million during Q1 FY-14 as against Rs.449 million (after minority interest) in Q1 FY-13.
� PAT up by 12% Yr-on-Yr
� PAT has grown 46% Yr-on-Yr, excluding land monetization.
� PAT margin at 11%.

Q1 FY 14, FINANCIAL HIGHLIGHTS
UNRECOGNIZED REVENUE
� Unrecognized revenue from sold units has increased to Rs.19.70 Billion from Rs.17.99 Billion
� Out of the above Rs.5.11 Billion expected to hit the P&L account during 9 months of FY 13-14
� Collected Rs.6.15 Billion from core operations during Q1-14 against Rs.4.01 billion in Q1-13
� Generated positive operational cash flow of Rs.1.32 Billion during Q1 FY-14 as against Rs.72 million in Q1 FY-13 (Excluding land monetization)
� Repaid loan of Rs.1.83 billion during Q1 FY-14.
CASHFLOW
Slide no : 6
LOAN
� Serviced interest to the tune of Rs.477 million during Q1 FY-14 compared to Rs.488 million during Q1 FY-13
� Loan to be repaid during FY 13-14 (9 months) : Rs.2.92 Billion
� Loan amounting to Rs.820 million has been re-financed at lower interest rates.
DEBT
� Consolidated net debt as on 30th June-2013 is Rs. 12.30 bn
� Consolidated net D/E ratio stands at 0.56 of equity.
� The average cost of debt as on 30th June-13 is 12.93 %

SALES PERFORMANCE & PRICE REALIZATION
LocationsQ1 FY 14
Avg. realization (Rs/sft)
Q1 FY 13 Avg. realization
(Rs/sft)
in sq. feet Rs/ sq.ft in sq. feet Rs/ sq.ft
Bangalore 603,055 7,260 520,080 5,356
NCR (Gurgaon) 36,255 9,963 135,721 9,032
Chennai 99,963 5,118 72,083 4,548
Pune 22,912 5,485 30,639 4,753
Thrissur 149,194 4,202 44,096 4,199
Coimbatore - - 26,005 4,118
Slide no : 7
Note : * Sales value includes Basic price, Car park, Statutory deposits, Taxes, but excludes Registration and stamp duty charges and maintenance deposits
Coimbatore - - 26,005 4,118
Mysore 9,300 2,678 6,975 2,409
TOTAL 920,679 6,548 835,599 5,737
Sales Value * (Rs.Billion)
6.03 4.79

REAL ESTATE PROJECTS – CASH FLOW PROJECTION
Ref.No DescriptionOngoing Projects
Completed Projects
UOM
1 Total Developable area 26.79 Mn.sft
2 Area of Car Park, Common areas and Amenities etc 7.89 Mn.sft
1 - 2 Total Saleable area 18.90 Mn.sft
3 Sobha share of Saleable area 16.20 Mn.sft
4 Less: Leasable area in Thrissur & Bangalore 0.26 Mn.sft
5= 3 – 4 Net Saleable area (Sobha share) 15.94 4.73 Mn.sft
6 Total area sold till 30th June-13 8.43 4.59
Slide no : 8
6 Total area sold till 30 June-13 8.43 4.59
5 - 6 Unsold area 7.51 0.14 Mn.sft
7Balance construction cost to be spent to complete the entire developments
45,820 30 Rs.Mns
8Outstanding receivables + Balance to be billed and collected on sold units
20,974 445 Rs.Mns
9 Sales value of unsold stock 59,340 389 Rs.Mns
9+8-7 Positive cash flow expected 34,494 804 Rs.Mns
Total Cash flow available from the Real Estate projects 35,298 Rs.Mns

LOCATION WISE STOCK DETAILS
Area in Million Sq.ft
Locations
Opening stock as on 1st Apr-13
Projects launched
during FY-14 (Q1)
increase/ (decrease) of existing
stock
Opening stock
Area sold during Q1-
FY-14
Closing stock as on 30th
June 13
Area not offered for sale
Net unsold stock as on 30th June
13
Bangalore 4.622 0.203 0.093 4.918 0.603 4.315 1.405 2.910
Gurgaon (NCR) 1.949 - (0.006) 1.943 0.036 1.907 1.417 0.490
Chennai 0.527 - - 0.527 0.100 0.427 - 0.427
Slide no : 9
Note:
• Due to increase / decrease in saleable area of ongoing projects in Bangalore and Gurgaon.• Thrissur – Commercial mall Leasable area reduced from stock.
Pune 0.270 - - 0.270 0.023 0.247 - 0.247
Coimbatore 0.242 - - 0.242 - 0.242 0.161 0.081
Thrissur 0.689 - (0.115) 0.574 0.149 0.425 - 0.425
Mysore 0.093 - 0.093 0.009 0.084 - 0.084
TOTAL 8.393 0.203 (0.028) 8.568 0.921 7.647 2.983 4.664

UNSOLD INVENTORY BREAK-UP
Area in Million Sq.ft
Category % Mn.sft
Below 50 lakhs (1BHK / Plots) 1% 0.08
Between 50 lakhs – 1 crore 16% 1.22
Between 1 cr to 2 crs 38% 2.90
Above 2 crs 45% 3.45
Unsold area (Mn.sft) 100% 7.65
Slide no : 10

PRICE BAND CATEGORY
Q1 -FY 14
Total area sold - Sq.ft 920,679
Total Sales Value – Rs.Mns 6,028
Average Price Realization – Rs/sq.ft 6,548
Category
Q1 - FY 14
SBA (Sq.ft) %Sale Value (Rs.Mns)
%
Note: * < 50 lakhs represents 1 BHK units constructed as per requirements of local laws at Tamil Nadu
Slide no : 11
< 50 lakhs* 9,622 1.0% 56 1%
50-75 lakhs 66,281 7.2% 283 5%
75 lakhs to 1cr 186,684 20.3% 984 16%
1 cr to 2 crs 469,890 51.0% 2,719 45%
Above 2 crs 188,202 20.5% 1,986 33%
Grand Total 920,679 100% 6,028 100%

FINANCIAL HIGHLIGHTS
10,621
13,996 14,144
18,701
4,347 4,630
(1,000)
2,000
5,000
8,000
11,000
14,000
17,000
20,000
FY 10 FY 11 FY 12 FY 13 Q1 13 Q1 14
2,674
3,652
4,730
5,538
1,200 1,404
-
1,000
2,000
3,000
4,000
5,000
6,000
FY 10 FY 11 FY 12 FY 13 Q1 13 Q1 14
Revenue (Rs.Mns) EBITDA (Rs.Mns)
Slide no : 12
1,658
2,514
3,177 3,239
696 843
-
500
1,000
1,500
2,000
2,500
3,000
3,500
4,000
FY 10 FY 11 FY 12 FY 13 Q1 13 Q1 14
1,341
1,813 2,060 2,172
449 501
-
500
1,000
1,500
2,000
2,500
3,000
FY 10 FY 11 FY 12 FY 13 Q1 13 Q1 14
PROFIT AFTER TAX (Rs.Mns)PROFIT BEFORE TAX (Rs.Mns)

BALANCE SHEET
Rs.in Millions
Particulars 30th June-13 30th June-12
EQUITY AND LIABILITIES
Shareholders’ funds
Share capital 981 981
Reserves and surplus 20,886 19,466
21,867 20,447
Minority Interest 102 -
Non-current liabilities
Long Term Borrowings 502 360
Deferred Tax Liability (net) 743 417
30th June-13 30th June-12
ASSETS
Non-current assets
Fixed assets
Tangible assets 3,127 2,807
Intangible assets 52 55
Goodwill on consolidation 123 170
Capital work-in-progress - 82
Non-current investments - -
Long-term loans and advances 4,357 5,495
Trade receivables - 51Deferred Tax Liability (net) 743 417
Trade Payables 178 178
Long term provisions 14 40
1,437 994
Current liabilities
Short term borrowings 13,000 12,279
Trade Payables 3,943 3,648
Other current liabilities 8,236 3,604
Short term provisions 1,551 1,403
26,730 20,933
Total 50,135 42,374
Slide no : 13
Trade receivables - 51
Other non-current assets - 79
7,659 8,741
Current assets
Current investments 6 -
Inventories 19,984 16,714
Trade receivables 1,795 931
Cash and bank balances 716 422
Short-term loans and advances 15,107 13,222
Other current assets 4,868 2,345
42,477 33,634
TOTAL 50,135 42,374

PROFIT & LOSS STATEMENT
Rs. in Million
Particulars Q1-14 Q1-13 Q4-13 FY-13
% of Growth
Q1-14 on Q1-13
Q1-14 vsQ4-13
Property Development 3,473 3,373 4,445 14,155 3% (22%)
Contractual + Manufacturing 1,143 958 1,422 4,490 19% (20%)
Other Income 14 16 10 56 (11%) 38%
Total Revenue 4,630 4,347 5,877 18,701 7% (21%)
Total Expenditure 3,226 3,147 4,241 13,163
EBITDA 1,404 1,200 1,636 5,538 17% (14%)
EBITDA % 30% 28% 28% 30%
Depreciation 165 126 159 594
Interest 396 377 446 1,705
Note : 1. EBITDA for the quarter is after considering one time settlement of our old contractual customers, resulting in write-off of Rs.63 mns, and the one time
payout of Rs.38 mns for settlement of remaining contractual labour in the manufacturing unit.2. Figures are regrouped & reclassified
Interest 396 377 446 1,705
PBT 843 696 1,031 3,239 21% (18%)
PBT % 18% 16% 18% 17%
Provision for Tax 342 247 336 1,068
PAT before minority interest 501 449 695 2,171
Minority Interest - - (1)
PAT after minority interest 501 449 695 2,172 12% (28%)
PAT % 11% 10% 12% 12%
Slide no : 14

CASH FLOW STATEMENT
PARTICULARS Q1- FY 14 Q1-FY 13 Q4-FY 13 FY 12-13
Operational cash inflows
Real Estate 4,922.65 3,248.63 5,292.71 16,110.84
Contractual 1,230.40 763.50 1,036.65 4,092.95
Total Operational cash inflow –(A) 6,153.05 4,012.13 6,329.36 20,203.79
Operational cash outflows
Real Estate project expenses 2,835.65 2,116.06 2,288.45 8,858.70
Contracts project expenses 1,219.56 992.97 673.90 3,480.56
Statutory Dues & Other Taxes 321.92 167.40 166.81 965.56
Rs. in Million
Statutory Dues & Other Taxes 321.92 167.40 166.81 965.56
Corpus Repayment 49.50 61.43 89.48 305.23
Central Over Heads (COH) 315.50 523.83 231.51 1,236.59
Advertising & Marketing expenses 91.66 78.70 55.70 451.80
Total Operational cash outflow- (B) 4,833.80 3,940.39 3,505.85 15,298.44
Net Operational Cash flow : A-B 1,319.24 71.74 2,823.51 4,905.35
Monetization of land / Development Rights (C) - 965.00 - 1,028.80
Net Operational Cash Flow including Monetization of land (A-B+C)
1,319.24 1,036.74 2,823.51 5,934.15
Slide no : 15
Continued…
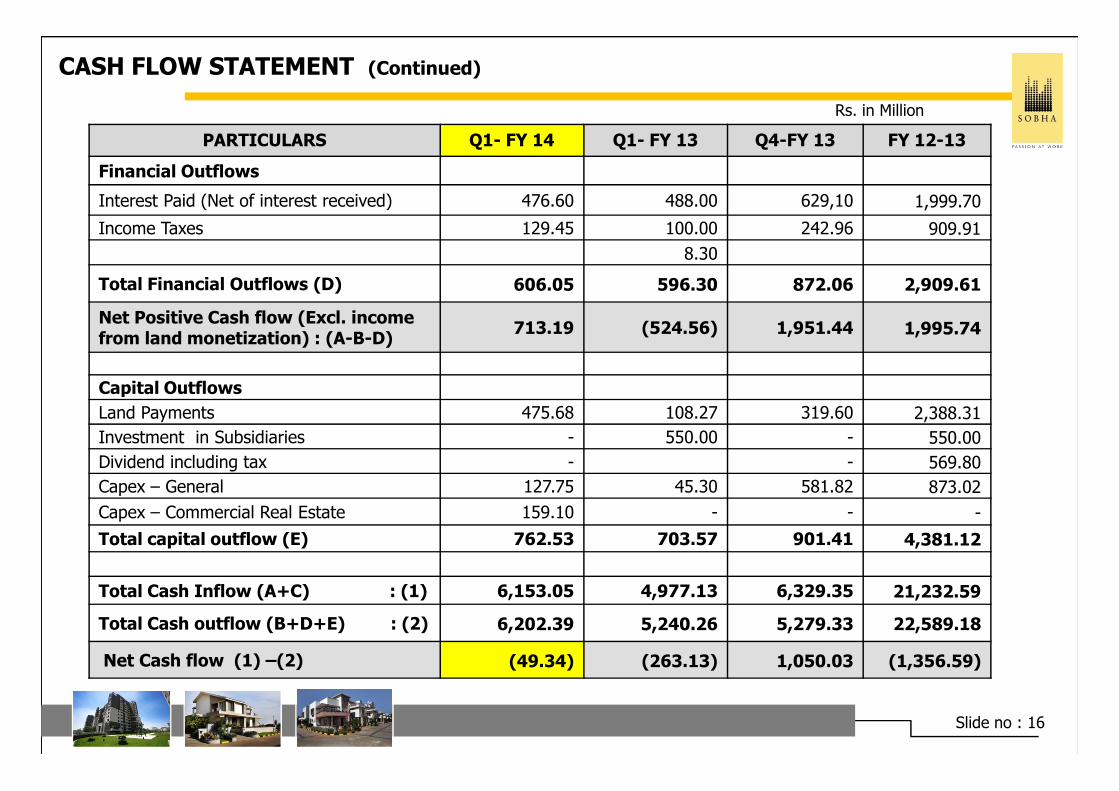
CASH FLOW STATEMENT (Continued)
PARTICULARS Q1- FY 14 Q1- FY 13 Q4-FY 13 FY 12-13
Financial Outflows
Interest Paid (Net of interest received) 476.60 488.00 629,10 1,999.70
Income Taxes 129.45 100.00 242.96 909.91
8.30
Total Financial Outflows (D) 606.05 596.30 872.06 2,909.61
Net Positive Cash flow (Excl. income from land monetization) : (A-B-D)
713.19 (524.56) 1,951.44 1,995.74
Capital Outflows
Rs. in Million
Capital Outflows
Land Payments 475.68 108.27 319.60 2,388.31
Investment in Subsidiaries - 550.00 - 550.00
Dividend including tax - - 569.80
Capex – General 127.75 45.30 581.82 873.02
Capex – Commercial Real Estate 159.10 - - -
Total capital outflow (E) 762.53 703.57 901.41 4,381.12
Total Cash Inflow (A+C) : (1) 6,153.05 4,977.13 6,329.35 21,232.59
Total Cash outflow (B+D+E) : (2) 6,202.39 5,240.26 5,279.33 22,589.18
Net Cash flow (1) –(2) (49.34) (263.13) 1,050.03 (1,356.59)
Slide no : 16
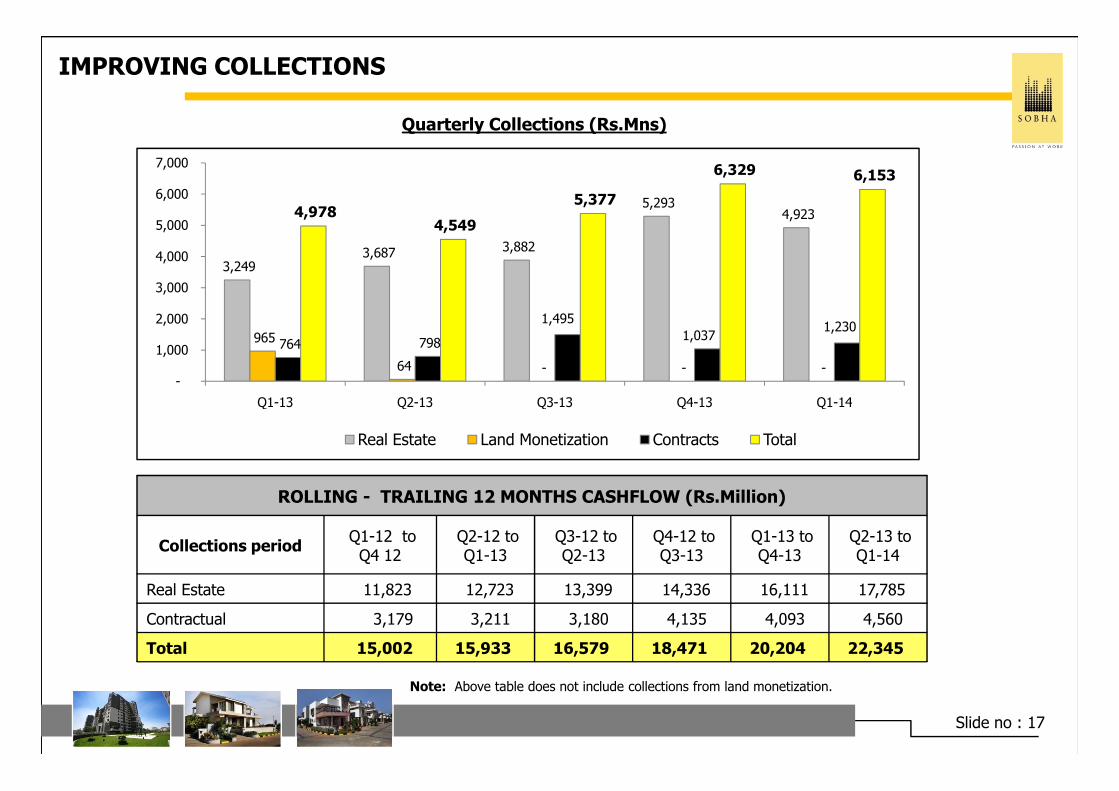
IMPROVING COLLECTIONS
3,249 3,687 3,882
5,293 4,923
965
64 - - -
764 798
1,495
1,037 1,230
4,978 4,549
5,377
6,329 6,153
-
1,000
2,000
3,000
4,000
5,000
6,000
7,000
Q1-13 Q2-13 Q3-13 Q4-13 Q1-14
Quarterly Collections (Rs.Mns)
Slide no : 17
Q1-13 Q2-13 Q3-13 Q4-13 Q1-14
Real Estate Land Monetization Contracts Total
ROLLING - TRAILING 12 MONTHS CASHFLOW (Rs.Million)
Collections periodQ1-12 to
Q4 12 Q2-12 to Q1-13
Q3-12 to Q2-13
Q4-12 to Q3-13
Q1-13 to Q4-13
Q2-13 to Q1-14
Real Estate 11,823 12,723 13,399 14,336 16,111 17,785
Contractual 3,179 3,211 3,180 4,135 4,093 4,560
Total 15,002 15,933 16,579 18,471 20,204 22,345
Note: Above table does not include collections from land monetization.

D/E Ratio - Consolidated
Particulars 30th June-13 31st Mar-13Increase
/(Decrease)
Gross Debt 13,011 13,024 (13)
Less: Cash & Cash Equivalents 716 815 (99)
Net Debt 12,295 12,209 86
Rs. in MillionConsolidated
MOVEMENT OF LOANS
Note: Net Debt excludes debentures of JV partner and lease obligation
Net Worth : Rs.21.87 Billion
Debt (net) : Rs.12.30 Billion
D/E ratio : 0.56
Slide no : 18
1.72
0.80 0.64
0.57 0.57 0.56
-
0.40
0.80
1.20
1.60
2.00
FY 08-09 FY 09-10 FY 10-11 FY 11-12 FY 12-13 Q1: 13-14

BORROWING COST
13.51%
13.90%14.09%
13.88%
13.65%13.56% 13.58%
13.45%
12.93%
12.00%
12.50%
13.00%
13.50%
14.00%
14.50%
Jun-11 Sep-11 Dec-11 Mar-12 Jun-12 Sep-12 Dec-12 Mar-13 Jun-13
Average Interest Cost
Slide no : 19
Jun-11 Sep-11 Dec-11 Mar-12 Jun-12 Sep-12 Dec-12 Mar-13 Jun-13
Note:� The average cost of borrowing excludes interest payable to debentures.
� Targeted to bring down average cost of borrowing level to 12.75% by March-14.
June-13 March-13 Dec-12 Sept-12 June-12
480 525 519 522 457
Cost of Financing (Gross):Rs. in Million

REAL ESTATE – COMPLETED PROJECTS
� Completed 85 projects in 5 cities
� Total Developed area of 26.94 mn.sqft and Super Built-up area of 21.25 mn.sft
� Product mix includes Multi Storied Apartments (Dreams, Luxury, Super Luxury & Presidential category), Row Houses, Villas, Plotted Developments & Club House Facilities etc
Apartments
Villas
Row Houses
Location wise Product - mix
Coimbatore
Bangalore 21.54
2.96
16.83
Row Houses
Apartments
1.81
17.26
1.55
13.31
* Developed / Developable area includes super built-up area (SBA) sold to the customer plus common area, car parking area, service area, storage area, internal Roads and common amenities
Slide no : 20
Plotted Development
Club Houses - 5.00 10.00 15.00 20.00 25.00
Pune
Mysore
Thrissur
Coimbatore
0.41
0.44
1.15
3.41
0.30
0.22
0.94
2.96
Super Built-up area Developed area
- 10.00 20.00
Club House, Others etc
Plotted Development
Villas
Row Houses
2.22
3.61
2.04
1.81
2.05
3.20
1.16
Super Built-up area Developed area
(Mn.sqft) (Mn.sqft)

REAL ESTATE – ONGOING PROJECTS
� 45 projects measuring Total Developed area of about 26.79 mn.sqft and Super Built-up area of 18.90 mn.sft, located at 6 cities in India.
Location wise Product - mix
Thrissur
Gurgaon
Bangalore
1.76
6.88
15.69
1.40
4.23
11.47
Row Houses
Villas
Apartments
1.59
6.65
15.37
0.99
3.78
12.02
Slide no :21
- 5.00 10.00 15.00 20.00
Coimbatore
Pune
Chennai
Thrissur
0.47
0.79
1.19
1.76
0.26
0.59
0.95
Saleable Area Developable area
(Mn.sqft)
- 5.00 10.00 15.00 20.00
Commercials
Club Houses
Plotted Development
Row Houses
2.70
0.02
0.47
1.59
1.85
0.02
0.24
Saleable Area Developable area
(Mn.sqft)

REAL ESTATE – FUTURE LAUNCHES
Proposed new launches in FY 13-14
S.No Projects Location TypeSITE Area (in Acres)
~Total SBA (sft)
Sobha share of SBA (sft)
BANGALORE
1 Doddanekundi Property Yamlur, HAL Road SL Apartments 5.62 554,802 332,881
2 Kanakapura Road property Thalaghattapura Residential 11.33 981,500 682,143
3 Hirandahalli Property Off Old Madras Road Villas + Villaments 22.50 585,066 374,442
4 Hosakerehalli Property Mysore Road L+SL Apartments 15.70 1,473,354 1,172,053
5 APMC Project Jakkur, Bellary Road Commercial+Mall 29.24 2,663,033 2,063,2525 APMC Project Jakkur, Bellary Road Commercial+Mall 29.24 2,663,033 2,063,252
MYSORE
6 Nadanahalli property Nadanahalli Plotted Development 6.20 135,036 135,036
CHENNAI
7 Sholinghanallur Property Sholinghanallur, OMR Residential Apartments 19.17 2,657,050 1,727,083
CALICUT
8 Palazhi Property Palazhi Villas 27.00 507,050 381,375
9 Feroke Property Feroke Apartments 3.53 678,056 528,884
Note: Area details are subject to change Continued…
Slide no : 22

REAL ESTATE – FUTURE LAUNCHES (continued)
Proposed new launches in FY 13-14
S.No Projects Location TypeSITE Area (in Acres)
~Total SBA (sft)
Sobha share of SBA (sft)
COCHIN
10 Vyittla property Silver Sand Island Residential Apartments 5.94 1,149,984 975,570
THRISSUR
11 Sobha City-Residential Thrissur, Kerala Residential 2.00 348,480 348,480
TOTAL 11,733,412 8,720,111
Note:
1. Targeted to launch 3 projects during Q2 FY 14 – Doddanehundi Property @ Bangalore, Palazhi Property @ Calicut and NadanahalliProperty @ Mysore .
2. Area details are subject to change
Slide no : 23

BUYERS PROFILE
Customers funding status
Note: The funding position is considered for cumulative sales period from April-12 to Mar-13.
Customers opted for Bank Loan 48%
Self Funding 52%
Profession-wise breakup
Buyers Age-wise breakup
IT/ITES Professional,
34%
Non-IT professionals,
44%
Business/ Entreprenuer,
11%
Medical/ Pharmaceutical
, 5%
Others*, 6%
* Others includes House wives, Agriculturist, Retired, Govt. Employees etc.
Bangalore, NCR,Pune
Chennai & CBE
Thrissur Total
Resident Indians 81% 64% 52% 75%
NRI’s 19% 36% 48% 25%
NRI Booking status
Slide no : 24
Note: Profession, NRI & Age wise details are based on booking made from July-12 to June-13
Age 21-30;
8%
Age 31-40;
38%Age 41-50;
32%
Age > 50;
22%

CONTRACTS - OVERVIEW
Completed Projects
� 230 Projects aggregating to 29.44 mn.sft of area
� Completed projects located in 21 cities across India
Projects Under Progress
� 40 Projects aggregating to 11.41 mn.sft of area
� Ongoing contractual projects located in 9 cities across India
Infosys,
25.02
Other
Contracts,
4.42
Mn.sft
85%
15%
Infosys,
7.47
Other
Contracts,
3.94
65%
35%
Mn.sft
• Other Corporate Clients includes Dell, HP, Timken, Taj, Bayer Material Science, HCL, Bharat Forge, ITC, Biocon, IPE, Bosch, GMR, Huawei Technologies, Hotel Leela Ventures, Woderla Holidays, PAN card club, Manipal County, Marble centre, Vakil Housing, Visa Steel House, Shanthi Hospital, Chaithanya projects and many other Private bunglows etc
Slide no : 25
4.42 3.94
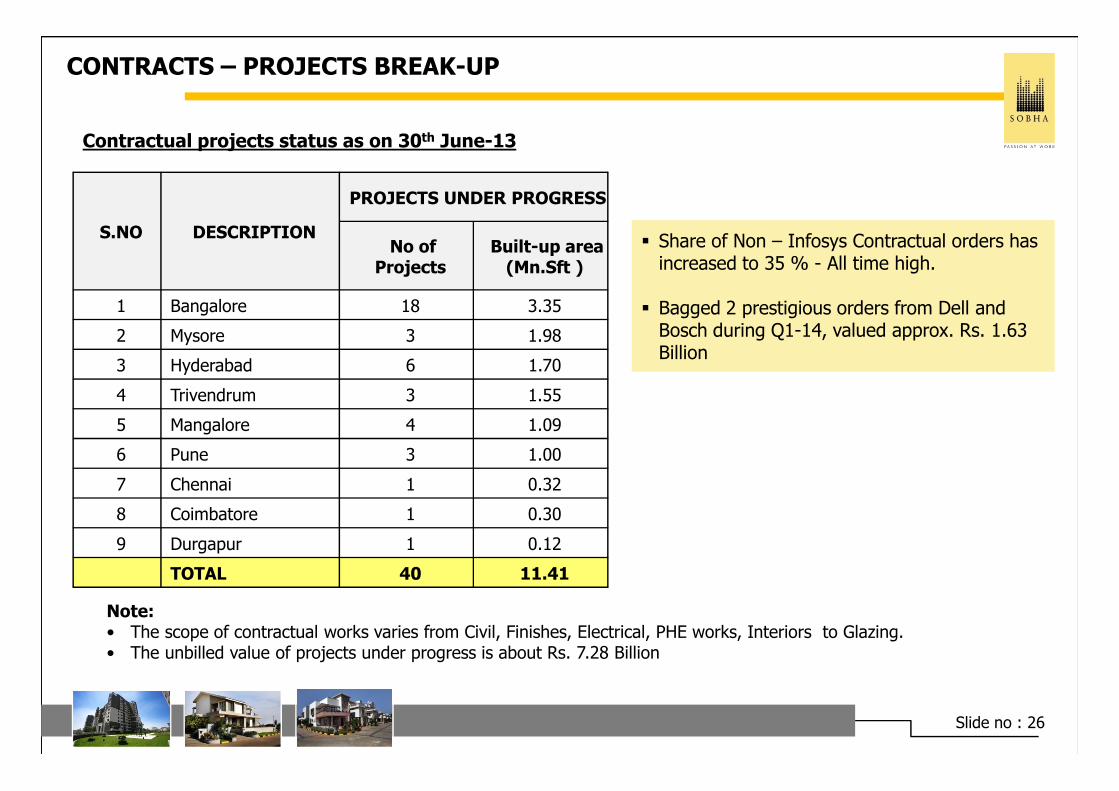
CONTRACTS – PROJECTS BREAK-UP
S.NO DESCRIPTION
PROJECTS UNDER PROGRESS
No of Projects
Built-up area (Mn.Sft )
1 Bangalore 18 3.35
2 Mysore 3 1.98
3 Hyderabad 6 1.70
4 Trivendrum 3 1.55
� Share of Non – Infosys Contractual orders has increased to 35 % - All time high.
� Bagged 2 prestigious orders from Dell and Bosch during Q1-14, valued approx. Rs. 1.63 Billion
Contractual projects status as on 30th June-13
Note: • The scope of contractual works varies from Civil, Finishes, Electrical, PHE works, Interiors to Glazing.• The unbilled value of projects under progress is about Rs. 7.28 Billion
Slide no : 26
4 Trivendrum 3 1.55
5 Mangalore 4 1.09
6 Pune 3 1.00
7 Chennai 1 0.32
8 Coimbatore 1 0.30
9 Durgapur 1 0.12
TOTAL 40 11.41
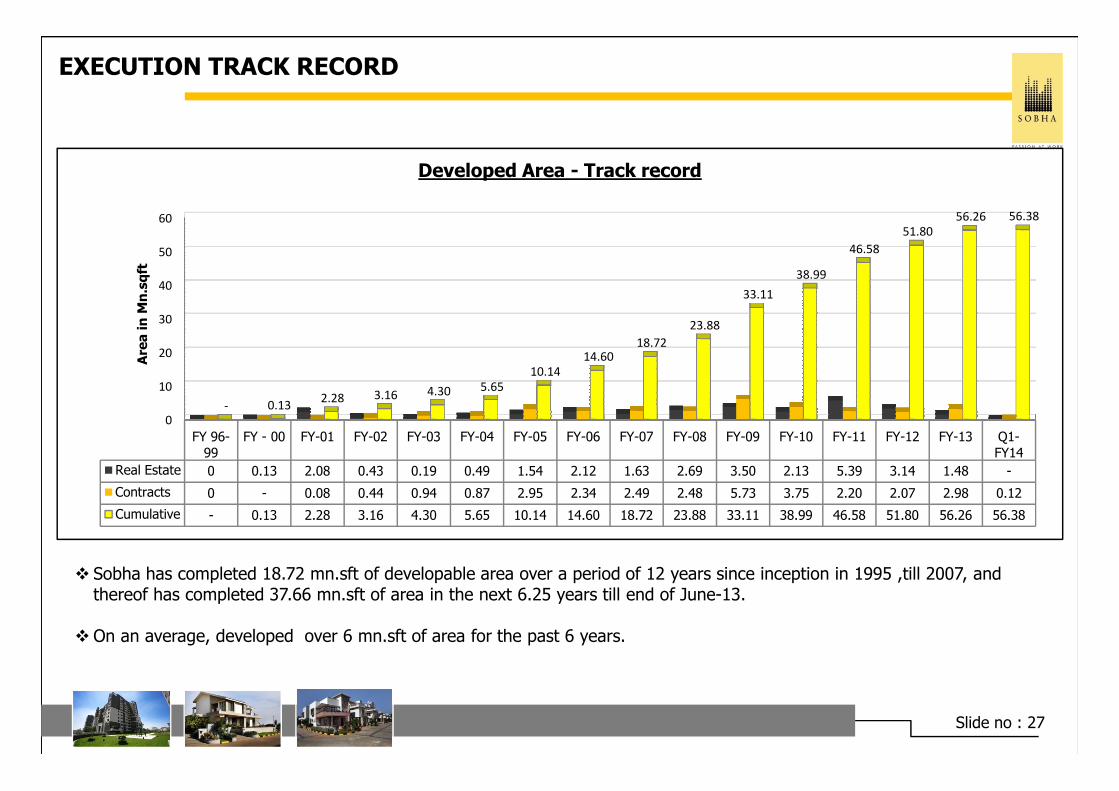
EXECUTION TRACK RECORD
10
20
30
40
50
60
2.28 3.16 4.30 5.65
10.14
14.60
18.72
23.88
33.11
38.99
46.58
51.80
56.26 56.38
Are
a i
n M
n.s
qft
Developed Area - Track record
� Sobha has completed 18.72 mn.sft of developable area over a period of 12 years since inception in 1995 ,till 2007, and thereof has completed 37.66 mn.sft of area in the next 6.25 years till end of June-13.
�On an average, developed over 6 mn.sft of area for the past 6 years.
Slide no : 27
0
FY 96-
99
FY - 00 FY-01 FY-02 FY-03 FY-04 FY-05 FY-06 FY-07 FY-08 FY-09 FY-10 FY-11 FY-12 FY-13 Q1-
FY14
Real Estate 0 0.13 2.08 0.43 0.19 0.49 1.54 2.12 1.63 2.69 3.50 2.13 5.39 3.14 1.48 -
Contracts 0 - 0.08 0.44 0.94 0.87 2.95 2.34 2.49 2.48 5.73 3.75 2.20 2.07 2.98 0.12
Cumulative - 0.13 2.28 3.16 4.30 5.65 10.14 14.60 18.72 23.88 33.11 38.99 46.58 51.80 56.26 56.38
- 0.13 2.28 3.16 4.30
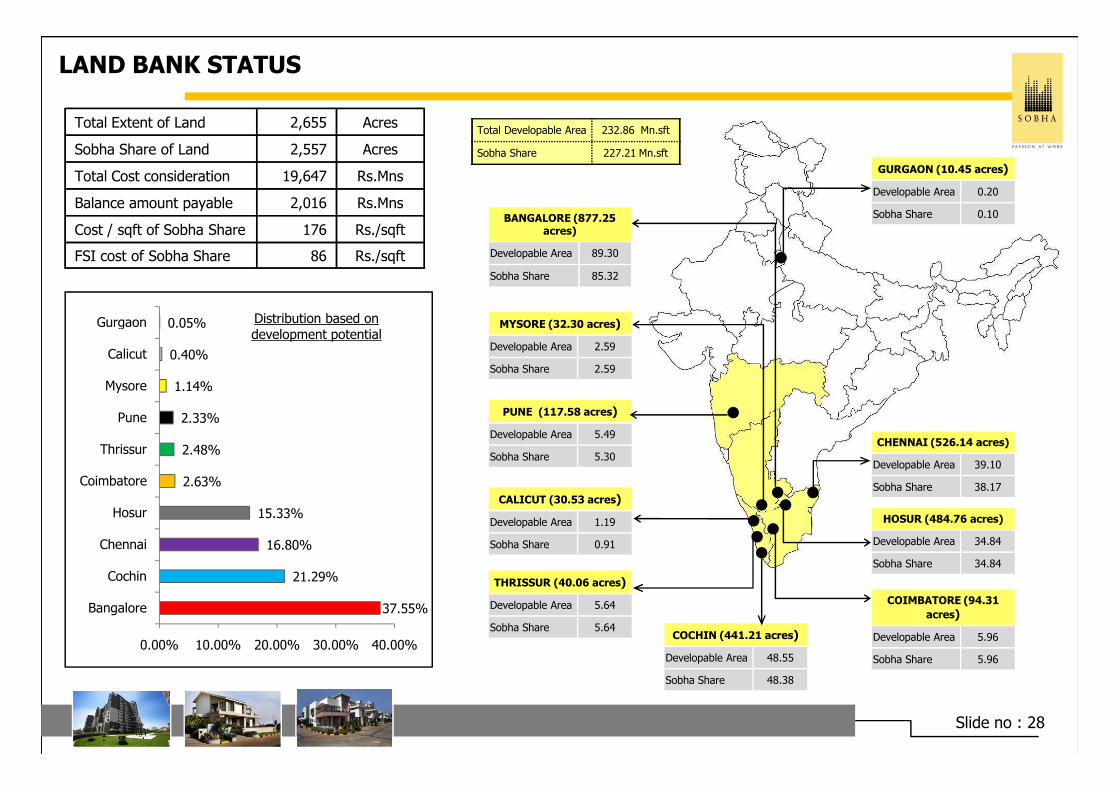
LAND BANK STATUS
BANGALORE (877.25 acres)
Developable Area 89.30
Sobha Share 85.32
MYSORE (32.30 acres)
Developable Area 2.59
Sobha Share 2.59
Total Extent of Land 2,655 Acres
Sobha Share of Land 2,557 Acres
Total Cost consideration 19,647 Rs.Mns
Balance amount payable 2,016 Rs.Mns
Cost / sqft of Sobha Share 176 Rs./sqft
FSI cost of Sobha Share 86 Rs./sqft
Total Developable Area 232.86 Mn.sft
Sobha Share 227.21 Mn.sft
GURGAON (10.45 acres)
Developable Area 0.20
Sobha Share 0.10
1.14%
0.40%
0.05%
Mysore
Calicut
Gurgaon Distribution based on development potential
PUNE (117.58 acres)
Developable Area 5.49
Sobha Share 5.30
THRISSUR (40.06 acres)
Developable Area 5.64
Sobha Share 5.64COCHIN (441.21 acres)
Developable Area 48.55
Sobha Share 48.38
COIMBATORE (94.31
acres)
Developable Area 5.96
Sobha Share 5.96
HOSUR (484.76 acres)
Developable Area 34.84
Sobha Share 34.84
CHENNAI (526.14 acres)
Developable Area 39.10
Sobha Share 38.17CALICUT (30.53 acres)
Developable Area 1.19
Sobha Share 0.91
Slide no : 28
37.55%
21.29%
16.80%
15.33%
2.63%
2.48%
2.33%
0.00% 10.00% 20.00% 30.00% 40.00%
Bangalore
Cochin
Chennai
Hosur
Coimbatore
Thrissur
Pune
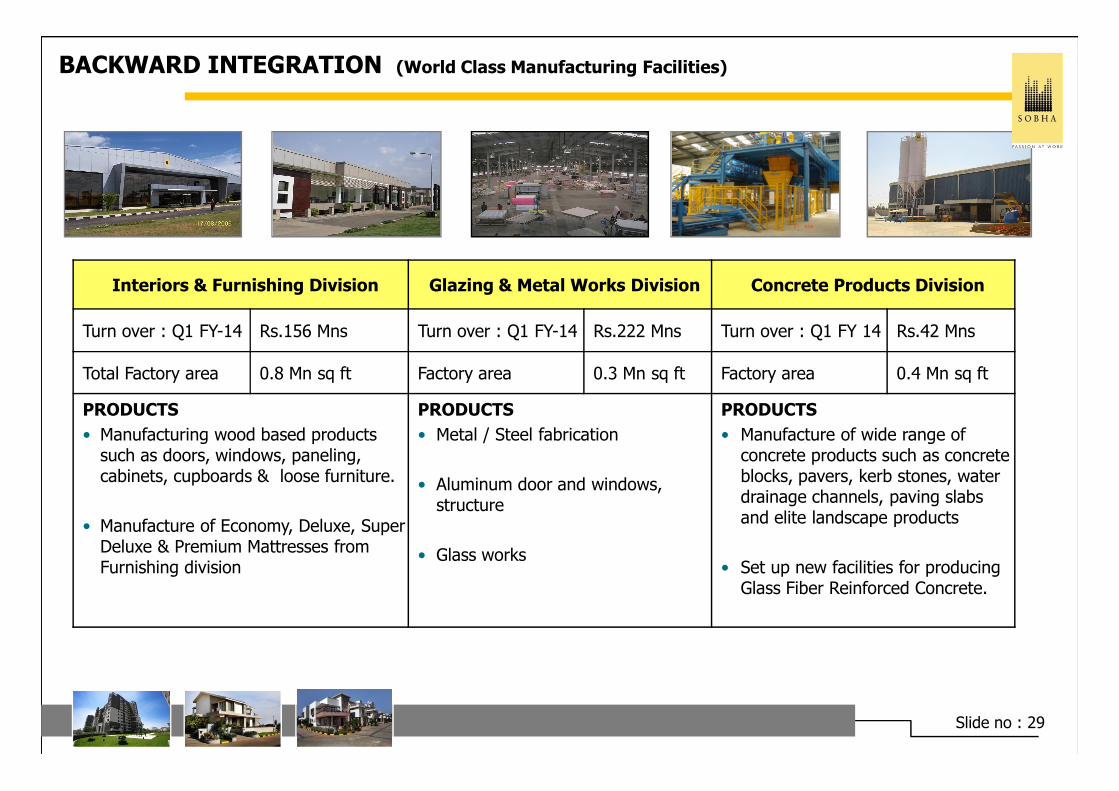
BACKWARD INTEGRATION (World Class Manufacturing Facilities)
Interiors & Furnishing Division Glazing & Metal Works Division Concrete Products Division
Turn over : Q1 FY-14 Rs.156 Mns Turn over : Q1 FY-14 Rs.222 Mns Turn over : Q1 FY 14 Rs.42 Mns
Total Factory area 0.8 Mn sq ft Factory area 0.3 Mn sq ft Factory area 0.4 Mn sq ft
PRODUCTS
• Manufacturing wood based products such as doors, windows, paneling, cabinets, cupboards & loose furniture.
• Manufacture of Economy, Deluxe, Super Deluxe & Premium Mattresses from Furnishing division
PRODUCTS
• Metal / Steel fabrication
• Aluminum door and windows, structure
• Glass works
PRODUCTS
• Manufacture of wide range of concrete products such as concrete blocks, pavers, kerb stones, water drainage channels, paving slabs and elite landscape products
• Set up new facilities for producing Glass Fiber Reinforced Concrete.
Slide no : 29
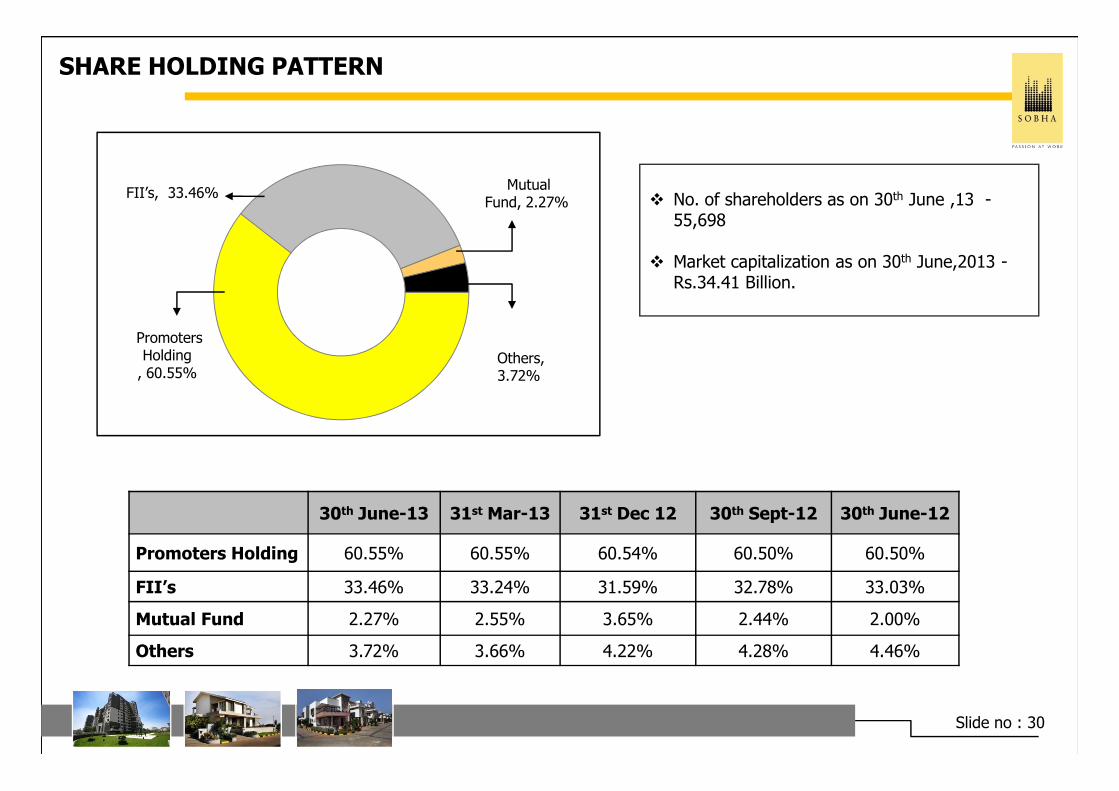
SHARE HOLDING PATTERN
� No. of shareholders as on 30th June ,13 -55,698
� Market capitalization as on 30th June,2013 -Rs.34.41 Billion.
Promoters Holding
, 60.55%
FII’s, 33.46%Mutual
Fund, 2.27%
Others,3.72%
30th June-13 31st Mar-13 31st Dec 12 30th Sept-12 30th June-12
Promoters Holding 60.55% 60.55% 60.54% 60.50% 60.50%
FII’s 33.46% 33.24% 31.59% 32.78% 33.03%
Mutual Fund 2.27% 2.55% 3.65% 2.44% 2.00%
Others 3.72% 3.66% 4.22% 4.28% 4.46%
Slide no : 30

SOBHA – STOCK PERFORMANCE
No. of Shares 98.06 Million
Market Capitalization Rs 34.41 Billion
Stock Price : 52 week High / Low Rs. 322 / 498
Avg. Daily volume (12 months) 126,853
Status as on: 30th June-13
Source : NSE index
Key Research Houses covering the stock…
-30
-20
-10
0
10
20
30
40
Jul-12 Aug-12 Sep-12 Nov-12 Dec-12 Feb-13 Mar-13 May-13 Jun-13
% C
hange in C
losi
ng P
rice
1 year Chart - Sobha v/s Nifty v/s NSE Realty
Sobha Nifty Realty
Sobha stock covered by 109 Research analysts and 19 fund managers
• Morgan Stanley • Jefferies India Ltd • IDBI Capital • IDFC securities
• Goldman Sachs • Axis Capital • IIFL (India Info Line) • Macquarie Capital Securities
• CLSA India • Deutsche India Equities • JM Financials • Bank of America (Merrill Lynch)
• ICICI Securities • Religare Capital Markets • Prabhudas & Lilladher • Kantilal Chhaganlal Securities
• J P Morgan • BNP Paribas • ICICI Direct • Emkay Global
• Ambit Capital • Kotak Securities • Standard Chartered Bank • Nirmal Bang Institutional Equities
• CIMB • Edelweisse • SBI Capital • Credit Suisse
Key Research Houses covering the stock…
Slide no : 31

THANK YOUTHANK YOU
Sobha Developers Ltd.‘SOBHA’, Sarjapur-Marathahalli Outer Ring Road(ORR),
Mr. Ganesh VenkataramanChief Financial OfficerMobile: +91- 96635 61144
K.Bala MuruganSenior Manager – VC & MD’s OfficeMobile: +91- 98807 30459
Corporate Office For Investors Contact :
Road(ORR),Devarabisanahalli, Bellandur Post,Bangalore-560103Phone: +91-80- 49320000, Fax: +91-80- 49320444Web : www.sobha.com
Mobile: +91- 96635 61144Email: [email protected]
Mobile: +91- 98807 30459Email: [email protected]
Disclaimer:The information in this presentation contains certain forward-looking statements. These include statements regarding outlook on future development
schedules, business plans and expectations of Capital expenditures. These statements are based on current expectations that involve a number of risks and uncertainties which could cause actual results to differ from those anticipated by the Company.
Sobha Corporate Office Sobha Malachite-Thrissur Sobha Moonstone Sobha Azalea