Investor Presentation 2016-17 - Paint Companies in India | Nerolac Paints | Kansai Nerolac · ·...
24
June 2017 Investor Presentation 2016-17
-
Upload
truongkien -
Category
Documents
-
view
228 -
download
4
Transcript of Investor Presentation 2016-17 - Paint Companies in India | Nerolac Paints | Kansai Nerolac · ·...
June 2017
Investor Presentation 2016-17
Disclaimer This presentation may contain statements which reflect management’s current views and estimates and could be construed as forward making statements. The future involves certain risks and uncertainties that could cause actual results to differ materially from the current views being expressed. Potential risks and uncertainties include such factors as general economic conditions, foreign exchange fluctuations, competitive product and pricing pressures and regulatory developments.
Agenda
Business Environment FY 16-17
Financial performance FY 16-17
Business Review FY 16-17
Risks and future outlook
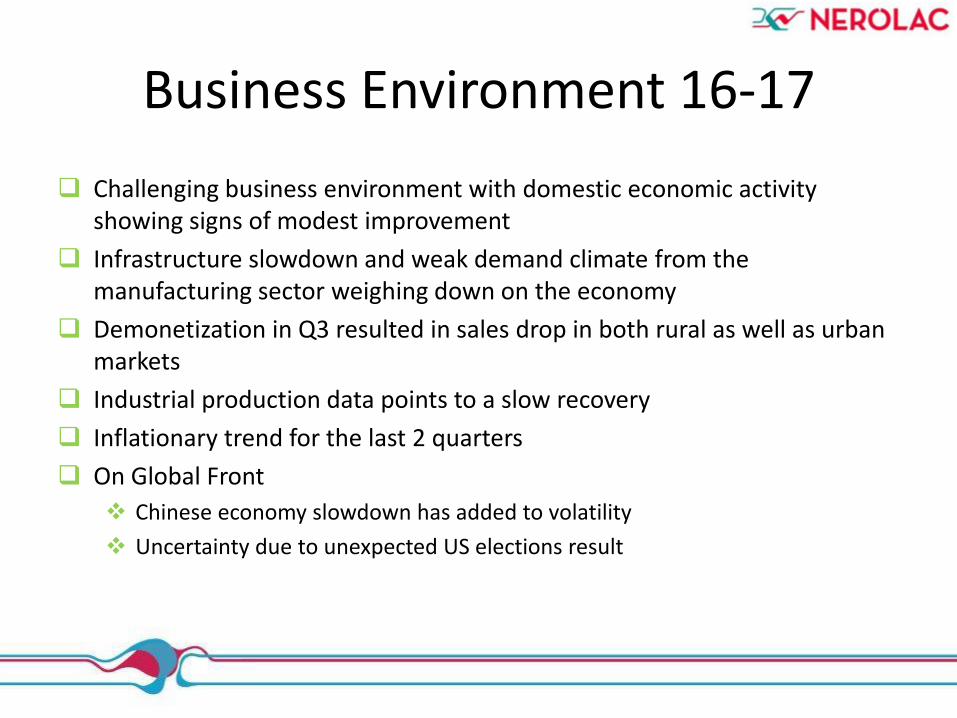
Business Environment 16-17
Challenging business environment with domestic economic activity showing signs of modest improvement
Infrastructure slowdown and weak demand climate from the manufacturing sector weighing down on the economy
Demonetization in Q3 resulted in sales drop in both rural as well as urban markets
Industrial production data points to a slow recovery
Inflationary trend for the last 2 quarters
On Global Front
Chinese economy slowdown has added to volatility
Uncertainty due to unexpected US elections result
Agenda
Business Environment FY 16-17
Financial performance FY 16-17
Business Review FY 16-17
Risks and future outlook
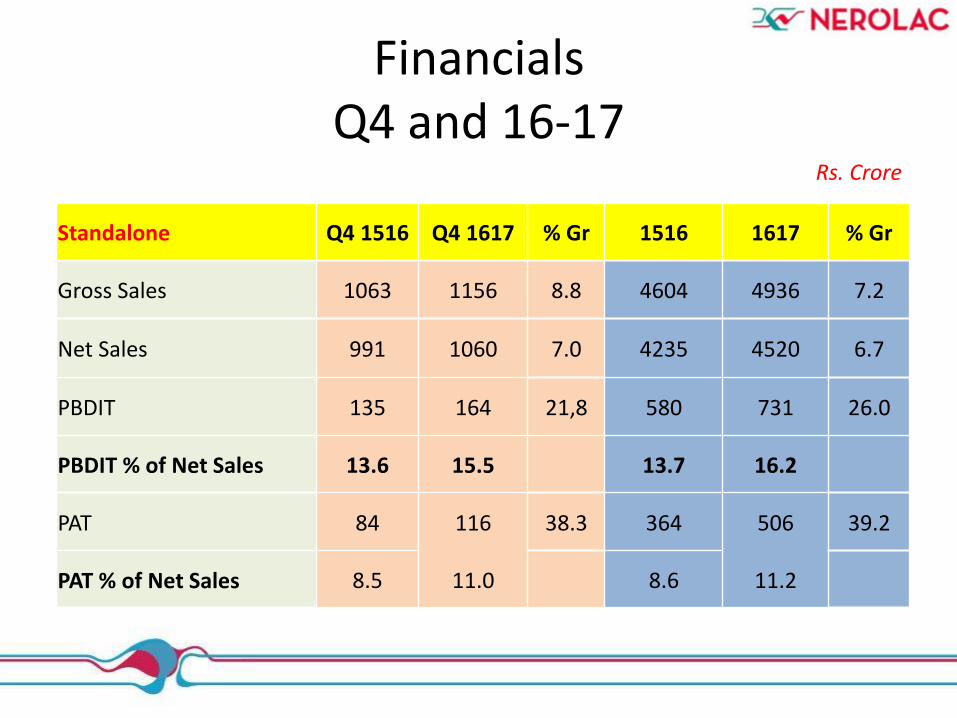
Financials Q4 and 16-17
Rs. Crore
Standalone Q4 1516 Q4 1617 % Gr 1516 1617 % Gr
Gross Sales 1063 1156 8.8 4604 4936 7.2
Net Sales 991 1060 7.0 4235 4520 6.7
PBDIT 135 164 21,8 580 731 26.0
PBDIT % of Net Sales 13.6 15.5 13.7 16.2
PAT 84 116 38.3 364 506 39.2
PAT % of Net Sales 8.5 11.0 8.6 11.2
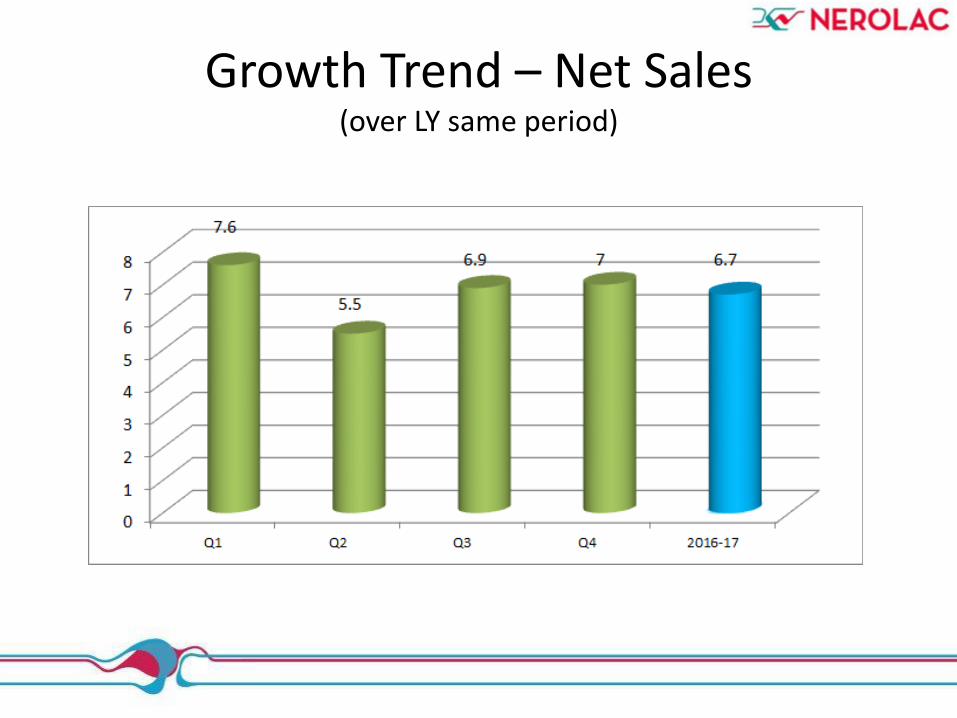
Growth Trend – Net Sales (over LY same period)
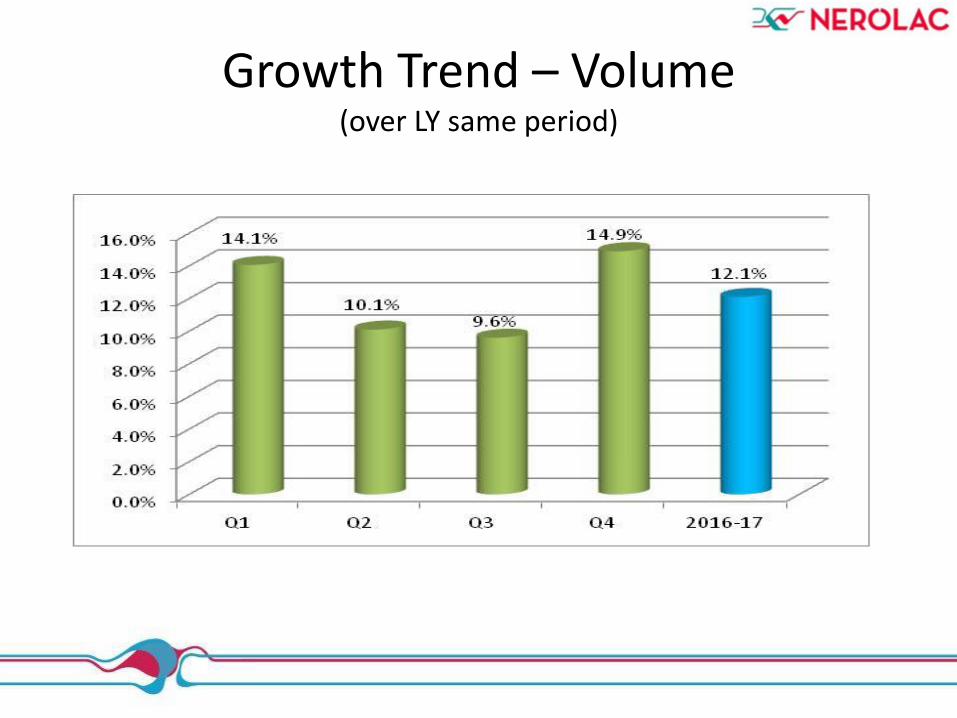
Growth Trend – Volume (over LY same period)
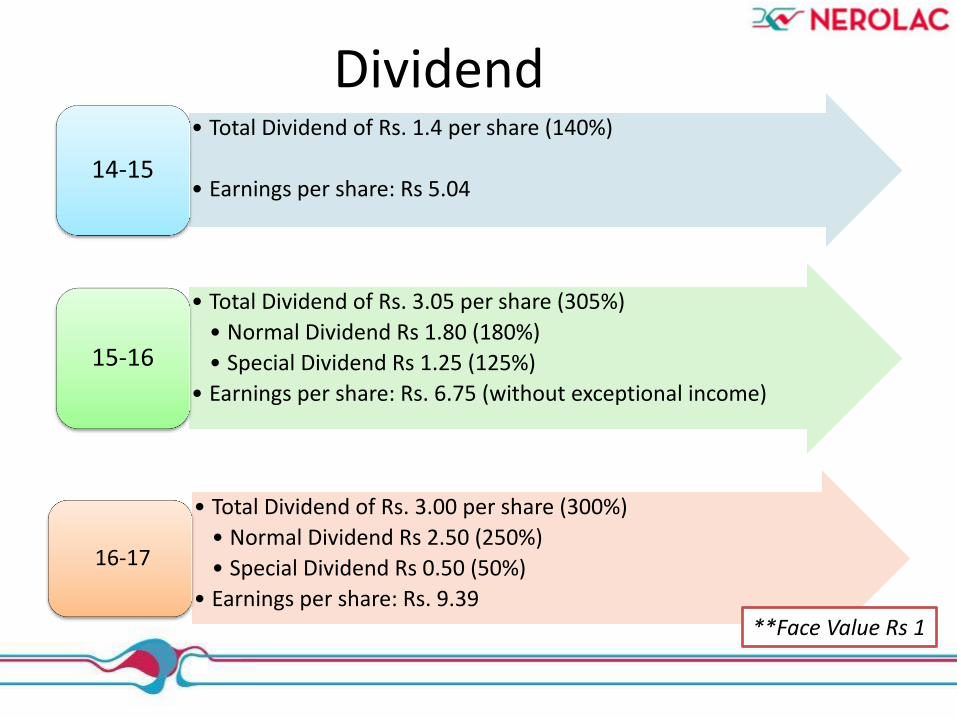
Dividend • Total Dividend of Rs. 1.4 per share (140%)
• Earnings per share: Rs 5.04 14-15
• Total Dividend of Rs. 3.05 per share (305%)
• Normal Dividend Rs 1.80 (180%)
• Special Dividend Rs 1.25 (125%)
• Earnings per share: Rs. 6.75 (without exceptional income)
15-16
• Total Dividend of Rs. 3.00 per share (300%)
• Normal Dividend Rs 2.50 (250%)
• Special Dividend Rs 0.50 (50%)
• Earnings per share: Rs. 9.39
16-17
**Face Value Rs 1
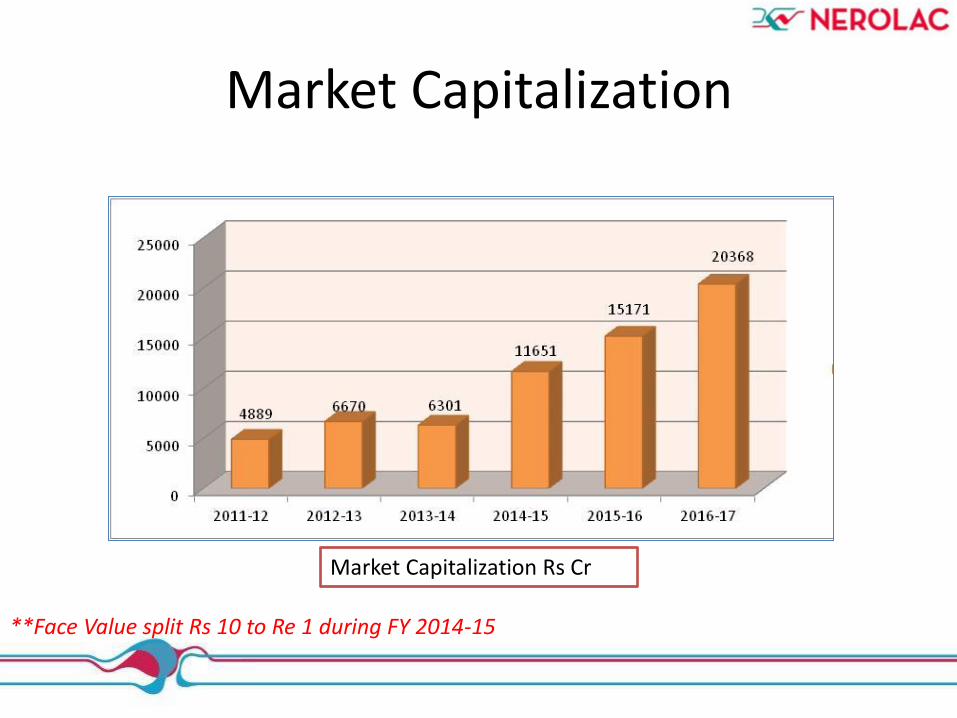
Market Capitalization
**Face Value split Rs 10 to Re 1 during FY 2014-15
Market Capitalization Rs Cr
Agenda
Business Environment FY 16-17
Financial performance FY 16-17
Business Review FY 16-17
Risks and future outlook
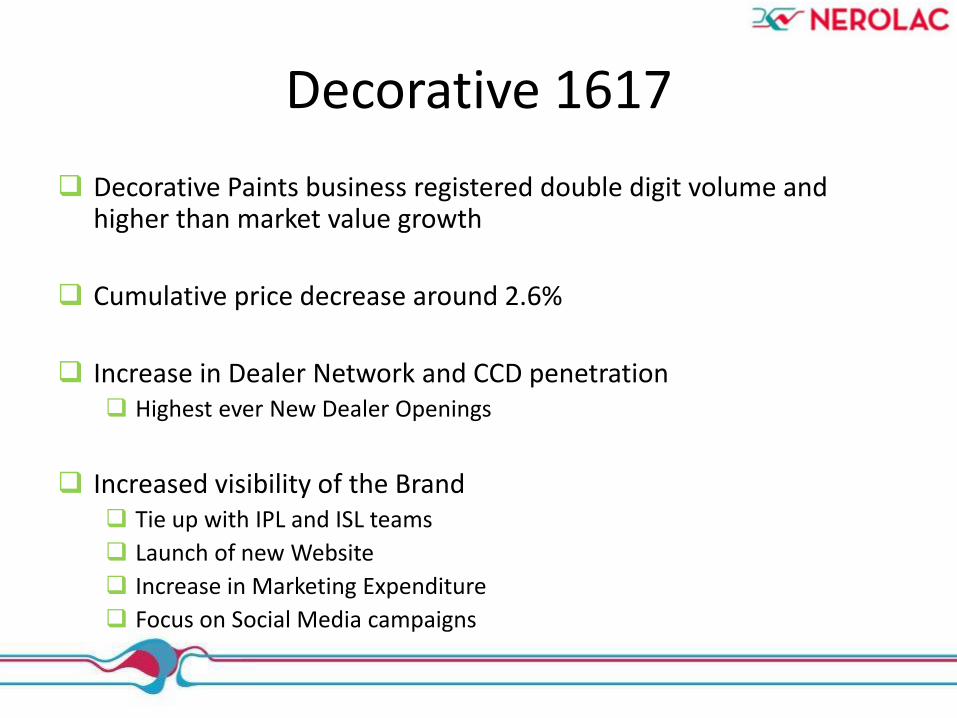
Decorative 1617
Decorative Paints business registered double digit volume and higher than market value growth
Cumulative price decrease around 2.6%
Increase in Dealer Network and CCD penetration Highest ever New Dealer Openings
Increased visibility of the Brand Tie up with IPL and ISL teams
Launch of new Website
Increase in Marketing Expenditure
Focus on Social Media campaigns
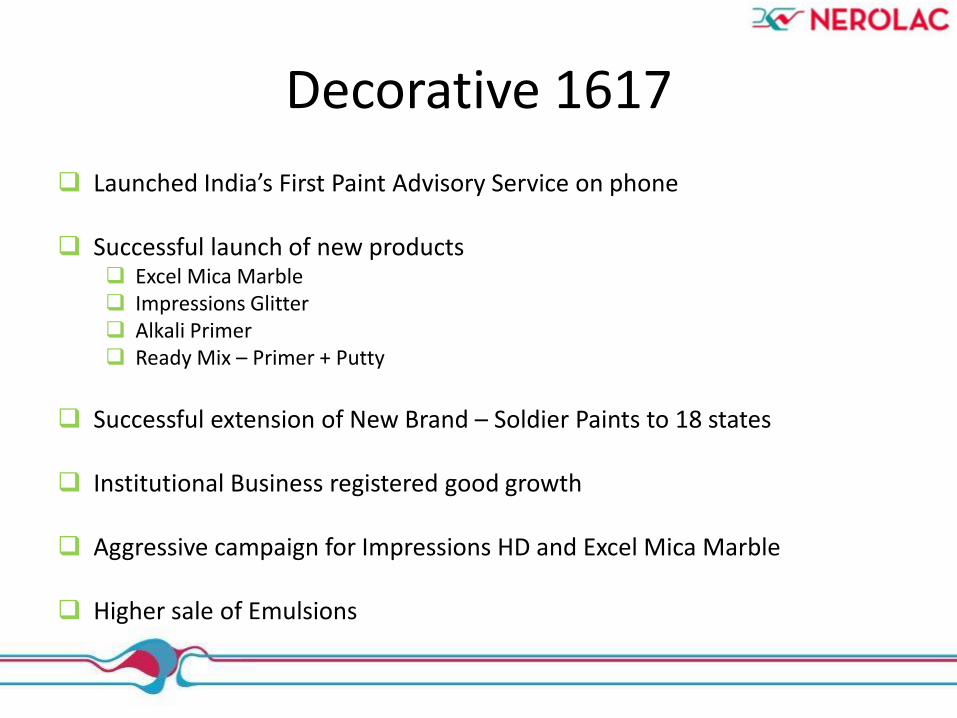
Decorative 1617
Launched India’s First Paint Advisory Service on phone
Successful launch of new products Excel Mica Marble Impressions Glitter Alkali Primer Ready Mix – Primer + Putty
Successful extension of New Brand – Soldier Paints to 18 states
Institutional Business registered good growth
Aggressive campaign for Impressions HD and Excel Mica Marble
Higher sale of Emulsions
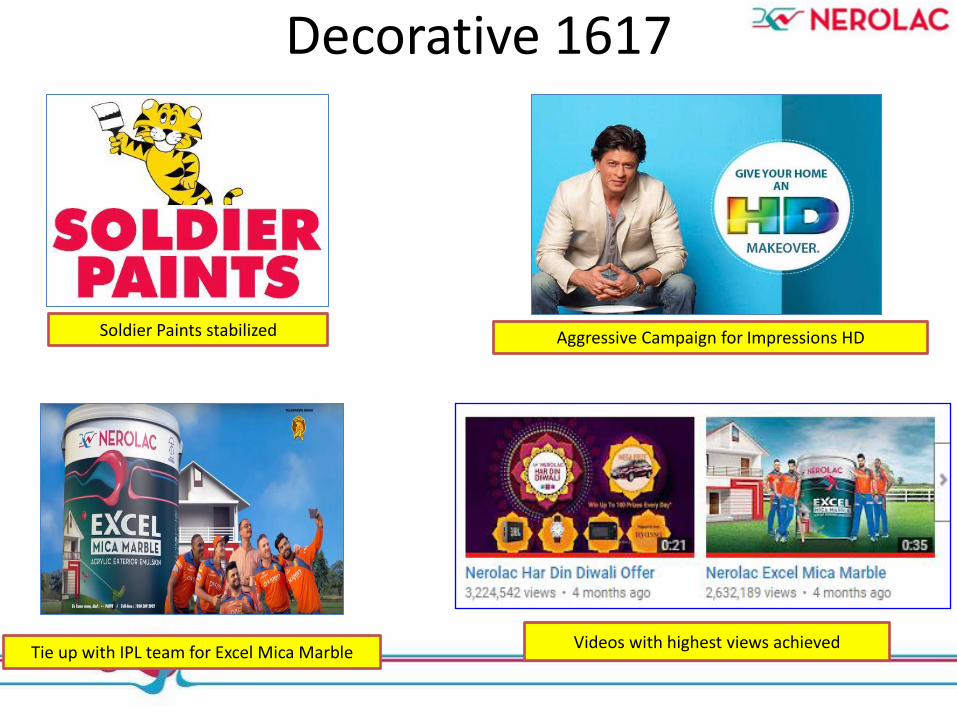
Decorative 1617
Soldier Paints stabilized Aggressive Campaign for Impressions HD
Tie up with IPL team for Excel Mica Marble Videos with highest views achieved
Industrial 1617 Low growth in auto sector led to single digit volume growth in automotive
coatings
Capture of New Business and New CED lines led to further increase in Market Share
Auto- refinish continues to grow at accelerated pace and better than the market
KNPL witnessed low market growth in the Industrial Liquid Paints and Powder coating segment owing to higher base effect
Many new and innovative products introduced for all segments of the market
Company continued its push into new technologies and entered Coil coatings segment
International Operations
Nepal
Higher than Market Growth in Nepal leading to Increase in Market Share
Lanka
Factory set up
Commenced operations in Q1 2017
Other Areas 16 -17
Strong commitment to EHS. Company’s manufacturing facilities are certified for ISO 14001: 2004 and OHSAS 18001:2007
All IT systems are upgraded to latest HANA database from SAP
Company has made a strong push for Digitalization
Company launched its Mobility initiative
IT systems made GST ready
Costs 1617
Inflationary pressures in Q3 and Q4 accelerated the cost of raw materials
Tight availability of key raw materials in last quarter drove prices up
Company increased marketing spend substantially
Company continued to work on improvement in internal efficiencies
Profitability 16-17
Material cost has decreased from 55.3% to 51.7% in Current year
This has primarily happened because of Cost Reduction efforts
Reduction in crude oil prices in initial quarters
Constant cost review
Improved Product Mix
Use of innovative technology
This has led to an improvement in profitability
Capacity Utilization 16-17
Current Capacity is 364000 KL
Capacity utilization is at 82%
Capex 16-17
CAPEX for 1617 was about Rs. 89.6 Cr
Work initiated for state of the art green field projects at AP with a capacity of 60000 KL /annum
Work in progress as scheduled for the ongoing projects New Plant Gujarat – 40000 KL/annum
New Plant Punjab – 36000 KL/annum
R&D lab at Navi Mumbai
Agenda
Business Environment FY 16-17
Financial performance FY 16-17
Business Review FY 16-17
Risks and future outlook
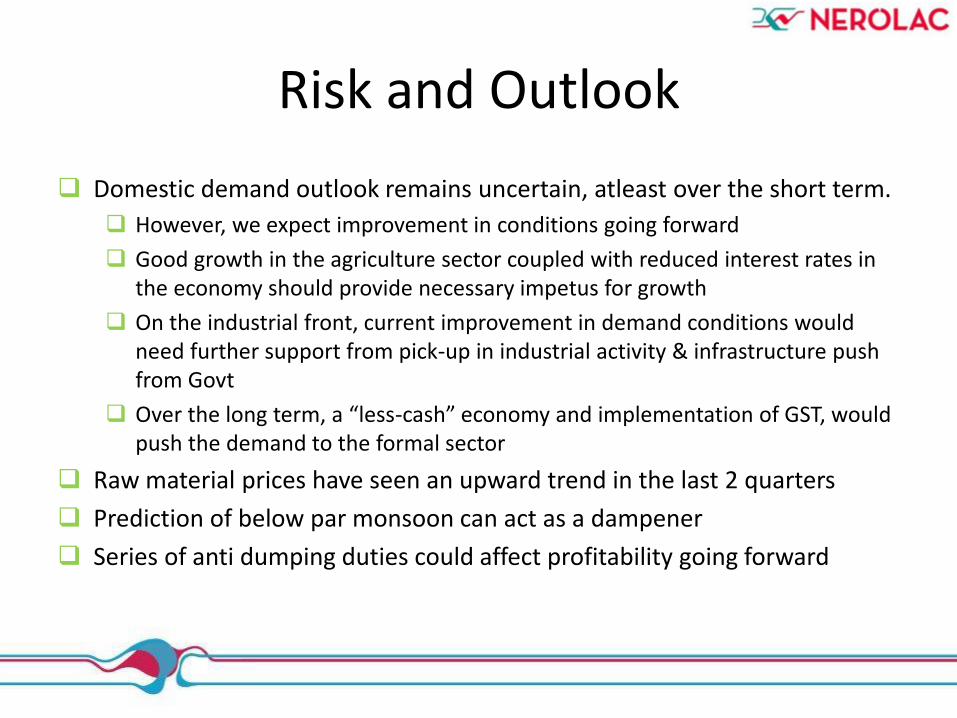
Risk and Outlook
Domestic demand outlook remains uncertain, atleast over the short term.
However, we expect improvement in conditions going forward
Good growth in the agriculture sector coupled with reduced interest rates in the economy should provide necessary impetus for growth
On the industrial front, current improvement in demand conditions would need further support from pick-up in industrial activity & infrastructure push from Govt
Over the long term, a “less-cash” economy and implementation of GST, would push the demand to the formal sector
Raw material prices have seen an upward trend in the last 2 quarters
Prediction of below par monsoon can act as a dampener
Series of anti dumping duties could affect profitability going forward
Thank You