Investor and Analyst Conference Call Q1-Q3 2018Investor and Analyst ... Coupon for Swap in EUR...
21
Thomas Kusterer, Chief Financial Officer Ingo Peter Voigt, Head of Finance, M&A and Investor Relations 12 November 2018 Investor and Analyst Conference Call Q1-Q3 2018 »
Transcript of Investor and Analyst Conference Call Q1-Q3 2018Investor and Analyst ... Coupon for Swap in EUR...
Thomas Kusterer, Chief Financial OfficerIngo Peter Voigt, Head of Finance, M&A and Investor Relations
12 November 2018
Investor and AnalystConference Call Q1-Q3 2018 »

EnBW goes green – Funding follows strategy
2 12
No
vem
be
r 2
01
8 In
vest
or
an
d A
na
lyst
Co
nfe
ren
ce C
all
Q1
-Q3
20
18
› Green bond underpins strategy
› Portfolio transformation towards share of low-risk earnings of at least 70% in 2020
› Renewable energies and smart infrastructure solutions as core element of strategy
› Sustainability is an integral part of EnBW’s business model
1 SPO ISS-oekom, 10 October 2018: Verification of the Sustainability Quality of the Fist Green Bond by EnBW
› Issuance of green bond
› Settlement date: 31 October 2018
› Issue size: €500 million
› Term to maturity: 15 years
› Coupon: 1.875%
Offshore Wind
E-Mobility
Onshore Wind
Solar
› Use of proceeds1: Asset Category
Renewable energy: 98% Portfolio share
Solar: 5% Portfolio share
Clean transportation:
2% Portfolio shareWind: 93% Portfolio share

Q1-Q3 2018 – in line with forecast, but affected by unfavourable weather conditions
Adjusted EBITDA
in € million
Group net profit1
in € million
1 Profit/loss attributable to shareholders of EnBW AG3
1,522
Q1-Q3 2017
Q1-Q3 2018
1,572
469
Q1-Q3 2017
1,869
Q1-Q3 2018
Adjusted EBITDA increased by 3% YOY
Group net profit decreased by 75% YOY
FY 2018 adjusted EBITDA guidance on
group level confirmed
Key Financials Financial highlights
12
No
vem
be
r 2
01
8 In
vest
or
an
d A
na
lyst
Co
nfe
ren
ce C
all
Q1
-Q3
20
18

-
Sales and Grids: In line with forecast
Elimination of positive one-off effects in prior year period
Full consolidation of VNG
Higher revenues from the electricity grid user charges
Grids
Sales
227 204
Q1-Q3 2018Q1-Q3 2017
-10%
829979
Q1-Q3 2017 Q1-Q3 2018
+18%
+
Adjusted EBITDA in € million
4 12
No
vem
be
r 2
01
8 In
vest
or
an
d A
na
lyst
Co
nfe
ren
ce C
all
Q1
-Q3
20
18
+++
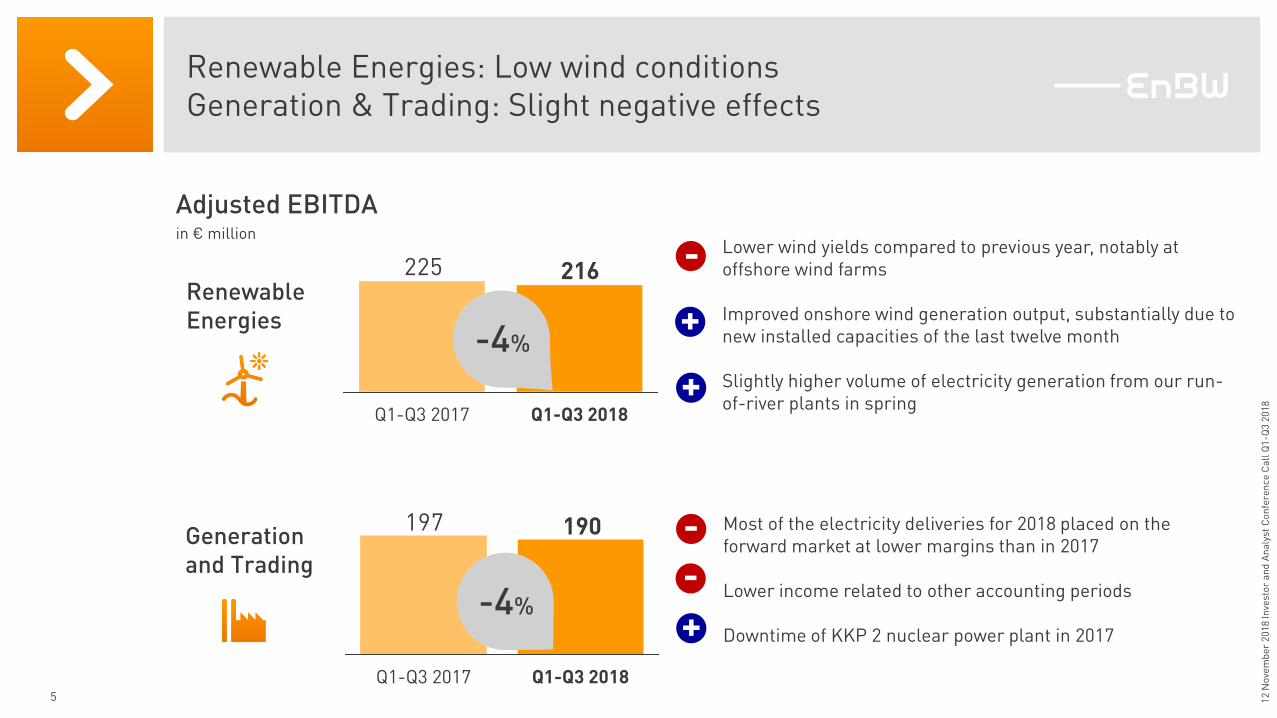
Renewable Energies: Low wind conditions Generation & Trading: Slight negative effects
Generation and Trading
Renewable Energies
Adjusted EBITDA in € million
Lower wind yields compared to previous year, notably at offshore wind farms
Improved onshore wind generation output, substantially due to new installed capacities of the last twelve month
Slightly higher volume of electricity generation from our run-of-river plants in spring
-225 216
Q1-Q3 2017 Q1-Q3 2018
-4%
Most of the electricity deliveries for 2018 placed on the forward market at lower margins than in 2017
Lower income related to other accounting periods
Downtime of KKP 2 nuclear power plant in 2017
-
+
197 190
Q1-Q3 2017 Q1-Q3 2018
-4%
+
+
5 12
No
vem
be
r 2
01
8 In
vest
or
an
d A
na
lyst
Co
nfe
ren
ce C
all
Q1
-Q3
20
18
-

EBITDA: Significant decrease mainly driven by nuclear fuel tax refund in 2017
EBITDAin € million
FFOin € million
RCF II1
in € million
Q1-Q3 2018
1,675
Q1-Q3 2017
3,064
614
777
Q1-Q3 2018 Q1-Q3 2017
1,045
Q1-Q3 2018
Net interest/ dividends
Taxes -269
+46
Non-cash items -195
Contribution to dedica-ted financial assets
+60
Provisions -541
6 1 RCF corrected for effects of the nuclear fuel tax refund 12
No
vem
be
r 2
01
8 In
vest
or
an
d A
na
lyst
Co
nfe
ren
ce C
all
Q1
-Q3
20
18

Slight increase in net debt
658-350
Investments, acquisitions and
divestments
OthersDividends paid
223
FFO
-777
Net debt 31.12.2017
8,460
Working capital
8,527
Net debt 30.09.2018
313
+1%
In € million
7 12
No
vem
be
r 2
01
8 In
vest
or
an
d A
na
lyst
Co
nfe
ren
ce C
all
Q1
-Q3
20
18

Outlook 2018 on group level confirmed; Outlook renewable energies adjusted
Adj. EBITDA2017
in € million330 332 377
SalesRenewable Energies
Generation and Trading
-5 to-15
0 to-10
Forecast
2018
in %
2,113
Group
0 to
+5
1,046
+5 to+15
Grids
8 12
No
vem
be
r 2
01
8 In
vest
or
an
d A
na
lyst
Co
nfe
ren
ce C
all
Q1
-Q3
20
18
+10 to+20
NEW
-10 to+5

Questions & Answers
9

Appendix
10
› Additional information Page 11
› Service information Page 19
12
No
vem
be
r 2
01
8 In
vest
or
an
d A
na
lyst
Co
nfe
ren
ce C
all
Q1
-Q3
20
18

Non-operating result
11 12
No
vem
be
r 2
01
8 In
vest
or
an
d A
na
lyst
Co
nfe
ren
ce C
all
Q1
-Q3
20
18
Q1-Q3 2018 Q1-Q3 2017 Variance
Income/expenses relating to nuclear power 12.2 1.279.9 -1,267.7
Result from disposals 93.1 273.1 -180.0
Reversals of/additions to the provisions for onerous contracts relating to electricity procurement agreements
31.0 20.3 10.7
Restructuring -26.0 -37.1 11.1
Other non-operating result -7.0 6.1 -13.1
Non-operating EBITDA 103.3 1,542.3 -1,439.0
Impairment losses -6.3 -27.6 21.3
Non-operating EBIT 97.0 1,514.7 -1,417.7
In € million
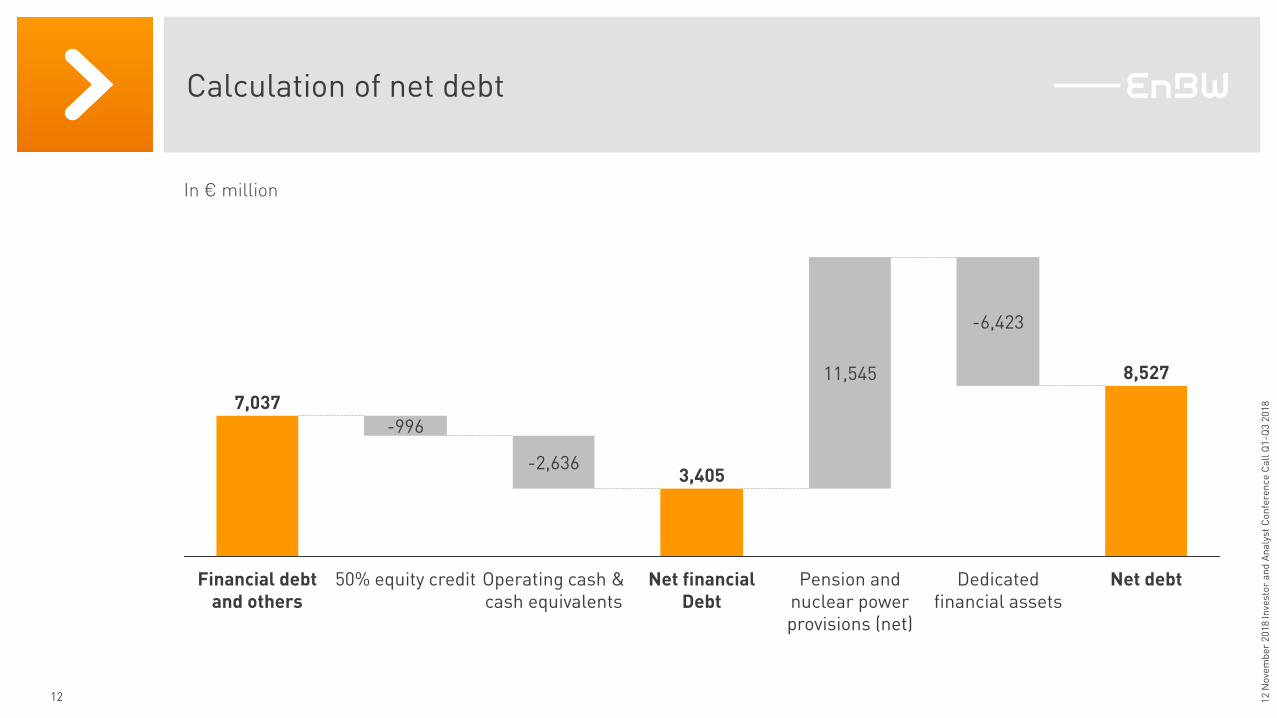
Calculation of net debt
12
Net debt
8,527
Dedicated financial assets
-6,423
Pension and nuclear power provisions (net)
11,545
Net financial Debt
3,405
Operating cash & cash equivalents
-2,636
50% equity credit
-996
Financial debt and others
7,037
In € million
12
No
vem
be
r 2
01
8 In
vest
or
an
d A
na
lyst
Co
nfe
ren
ce C
all
Q1
-Q3
20
18

Working capital effects
13
80
223
-174
Trade receivables/payables
Others Change in working capital
Inventories
202
Derivatives
115
In € million
12
No
vem
be
r 2
01
8 In
vest
or
an
d A
na
lyst
Co
nfe
ren
ce C
all
Q1
-Q3
20
18

Income statement
14
Q1-Q3 2018 Q1-Q3 2017 Variance in %
Revenue 17,397.4 15,337.4 13.4
Changes in inventories/other own work capitalised 132.7 126.5 4.9
Cost of materials -14,284.5 -12,570.5 13.6
Personnel expenses -1,309.6 -1,249.9 -4.8
Other operating income/expenses -260.8 1,420.6 -
EBITDA 1,675.2 3,064.1 -45.3
Amortisation and depreciation -897.8 -840.9 -6.8
EBIT 777.4 2,223.2 -65.0
Investment and financial result -40.9 375.1 -
EBT 736.5 2,598.3 -71.7
Income tax -170.3 -644.5 73.6
Group net profit/loss 566.2 1,953.8 -71.0
of which profit/loss shares attributable to non-controlling interests 97.5 85.1 14.6
of which profit/loss shares attributable to the shareholders of EnBW AG 468.7 1,868.7 -74.9
12
No
vem
be
r 2
01
8 In
vest
or
an
d A
na
lyst
Co
nfe
ren
ce C
all
Q1
-Q3
20
18
In € million

Cash flow statement
15
Q1-Q3 2018 Q1-Q3 2017 Variance in %
EBITDA 1,675.2 3,064.1 -45.3
Changes in provisions -540.9 -401.3 34.8
Non-cash-relevant expenses/income -194.7 -308.3 -36.8
Income tax paid/received -269.1 131.8 -
Interest and dividends received 221.7 530.5 -58.2
Interest paid for financing activities -175.4 -339.0 -48.3
Contribution of dedicated financial assets 60.0 -28.9 -
Funds from Operations (FFO) 776.8 2,648.9 -70.7
Change in assets and liabilities from operating activities -222.7 -4,647.8 -95.2
Capital expenditures on intangible assets and property, plant and equipment
-742.3 -761.2 -2.5
Disposals of intangible assets and property, plant and equipment 56.0 44.9 24.7
Cash received from construction cost and investment subsidies and refund of taxes from capitalized exploration expenses
49.9 47.1 5.9
Free cash flow -82.3 -2,668.1 -96.9
12
No
vem
be
r 2
01
8 In
vest
or
an
d A
na
lyst
Co
nfe
ren
ce C
all
Q1
-Q3
20
18
In € million

Hedge levels1
16 1 As of 30 September 2018
2019 2020
95-100 45-70
In %
2021
12
No
vem
be
r 2
01
8 In
vest
or
an
d A
na
lyst
Co
nfe
ren
ce C
all
Q1
-Q3
20
18
10-25

EnBW has a flexible access to various financing sources1
17
1 As of 30 September 20182 Rounded figures
Commercial Paper Programme
2.0
Hybrid Bonds
2.0
Debt Issurance Programme
7.0
2.9
4.1
In € billion
Thereof € 2.9 bn utilised2 Undrawn
2
Bilateral Free Credit Lines
1.1
Syndicated Credit Line
1.5
UndrawnMaturity date: 2021
2
12
No
vem
be
r 2
01
8 In
vest
or
an
d A
na
lyst
Co
nfe
ren
ce C
all
Q1
-Q3
20
18
Project financing and low-interest loans from the EIB

Maturities of EnBW’s bonds
18
750
2018
884
2023 2025
1705
2038
700
2039
1,000
500
1,0001
2021 2077
9933
2026
500
100
2034 2044
50…. …. ….…. …. ….
2022 2076
9932;3
First call dates of hybrid bonds
Senior bonds
Hybrid bonds
1 First call date: hybrid maturing in 2076 4 CHF 100 million, converted as of the reporting date of 30/09/20182 First call date: hybrid maturing in 2077 5 JPY 20 billion (swap in EUR), Coupon for Swap 3.880%3 Includes USD 300 million, Coupon for Swap in EUR 5.125% (converted as of 05/10/2016)
In € million
12
No
vem
be
r 2
01
8 In
vest
or
an
d A
na
lyst
Co
nfe
ren
ce C
all
Q1
-Q3
20
18
As of 30 September 2018

Financial calendar 2019 & important links
19
Financial calendar 2018
28 March 2019 Integrated Annual Report January to December 2018
8 May 2019 Annual General Meeting
10 May 2019 Quarterly Statement January to March 2019
25 July 2019 Six-Monthly Financial Report January to June 2019
8 November 2019 Quarterly Statement January to September 2019
Important links
Statement Q1-Q3 2018 https://www.enbw.com/company/investors/events/conference-calls/2018/q2-2018_en.html
Financial Calendar https://www.enbw.com/company/investors/events/finance-calender/
Financing facilities https://www.enbw.com/company/investors/strategy/
Maturities of our bonds https://www.enbw.com/company/investors/bonds-share/bonds/
12
No
vem
be
r 2
01
8 In
vest
or
an
d A
na
lyst
Co
nfe
ren
ce C
all
Q1
-Q3
20
18

EnBW IR contacts
20
Julia von Wietersheim
Senior Manager Investor Relations
T +49 721 – [email protected]
Ingo Peter Voigt
Head of Finance, M&A and Investor Relations
T +49 721 – [email protected]
Julia Reinhardt
Manager Investor Relations
T +49 721 – [email protected]
12
No
vem
be
r 2
01
8 In
vest
or
an
d A
na
lyst
Co
nfe
ren
ce C
all
Q1
-Q3
20
18

Important note
21
Unless indicated otherwise, all data contained hereinafter refers to the EnBW group and is calculated according to IFRS.
No offer or investment recommendation
This presentation has been prepared for information purposes only. It does not constitute an offer, an invitation or a recommendation to purchase or sell securities issued by EnBW Energie Baden-Württemberg AG (EnBW), a company of the EnBW group or any other company. This presentation does not constitute a request, instruction or recommendation to vote or give consent. All descriptions, examples and calculations are included in this presentation for illustration purposes only.
Future-oriented statements
This presentation contains future-oriented statements that are based on current assumptions, plans, estimates and forecasts of the management of EnBW. Such future-oriented statements are therefore only valid at the time at which they are published for the first time. Future-oriented statements are indicated by
the context, but may also be identified by the use of the words “may”, “will”, “should”, “plans”, “intends”, “expects”, “believes”, “assumes”, “forecasts”, “potentially” or “continued” and similar expressions.
By nature, future-oriented statements are subject to risks and uncertainties that cannot be controlled or accurately predicted by EnBW. Actual events, future results, the financial position, development or performance of EnBW and the companies of the EnBW group may therefore diverge considerably from the future-oriented statements made in this presentation. Therefore it cannot be guaranteed nor can any liability be assumed otherwise that these future-oriented statements will prove complete, correct or precise or that expected and forecast results will actually occur in the future.
No obligation to update the information
EnBW assumes no obligation of any kind to update the information contained in this presentation or to adjust or update future-oriented statements to future events or developments.
12
No
vem
be
r 2
01
8 In
vest
or
an
d A
na
lyst
Co
nfe
ren
ce C
all
Q1
-Q3
20
18