Analyst Conference Call – Q1/13 Results - Fresenius
29
Analyst Conference Call – Q1/13 Results April 30, 2013
Transcript of Analyst Conference Call – Q1/13 Results - Fresenius
Analyst Conference Call – Q1/13 Results
April 30, 2013
Page 2
Safe Harbor Statement
Analyst Conference Call – Q1/13 Results, Fresenius SE & Co. KGaA, Investor Relations © Copyright, April 30, 2013
This presentation contains forward-looking statements that are subject to various risks and uncertainties. Future results could differ materially from those described in these forward-looking statements due to certain factors, e.g. changes in business, economic and competitive conditions, regulatory reforms, results of clinical trials, foreign exchange rate fluctuations, uncertainties in litigation or investigative proceedings, and the availability of financing. Fresenius does not undertake any responsibility to update the forward-looking statements contained in this presentation.
Page 3
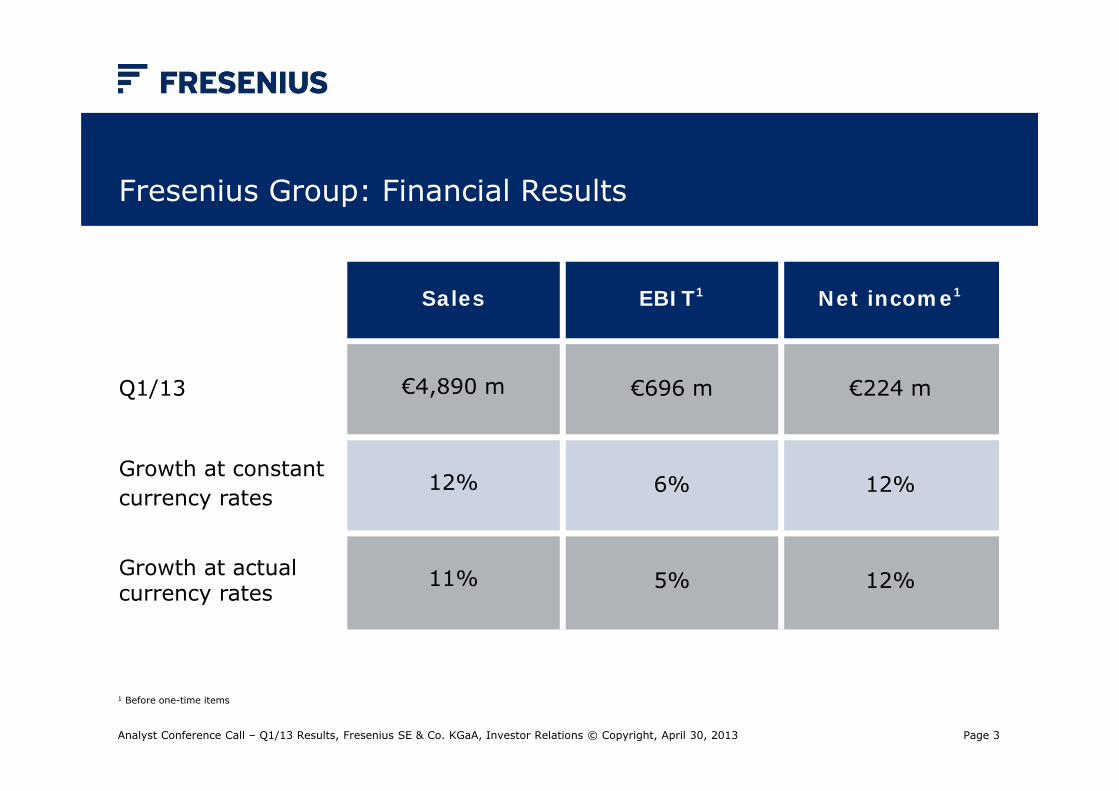
Fresenius Group: Financial Results
Analyst Conference Call – Q1/13 Results, Fresenius SE & Co. KGaA, Investor Relations © Copyright, April 30, 2013
1 Before one-time items
Sales EBIT1 Net income1
Q1/13 €4,890 m €696 m €224 m
Growth at constantcurrency rates
12% 6% 12%
Growth at actualcurrency rates
11% 5% 12%
Page 4
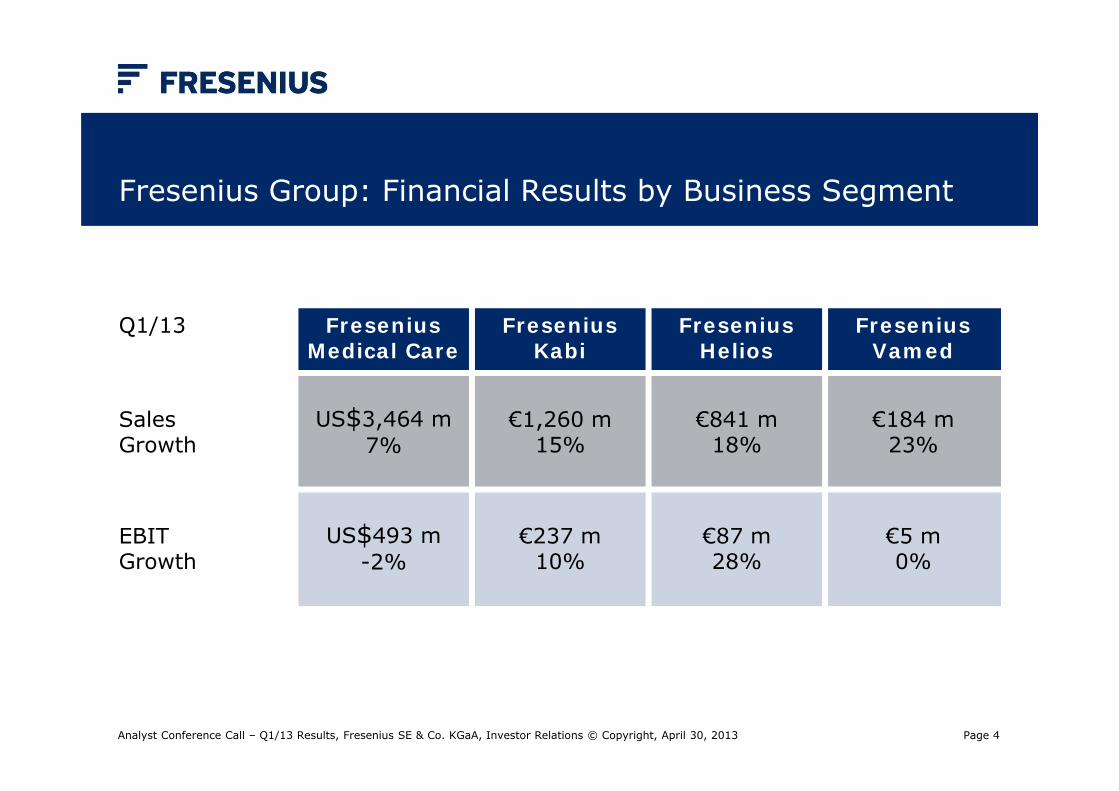
Fresenius Group: Financial Results by Business Segment
Analyst Conference Call – Q1/13 Results, Fresenius SE & Co. KGaA, Investor Relations © Copyright, April 30, 2013
Q1/13 FreseniusMedical Care
FreseniusKabi
FreseniusHelios
FreseniusVamed
SalesGrowth
US$3,464 m 7%
€1,260 m15%
€841 m18%
€184 m23%
EBITGrowth
US$493 m -2%
€237 m 10%
€87 m 28%
€5 m 0%
Page 5
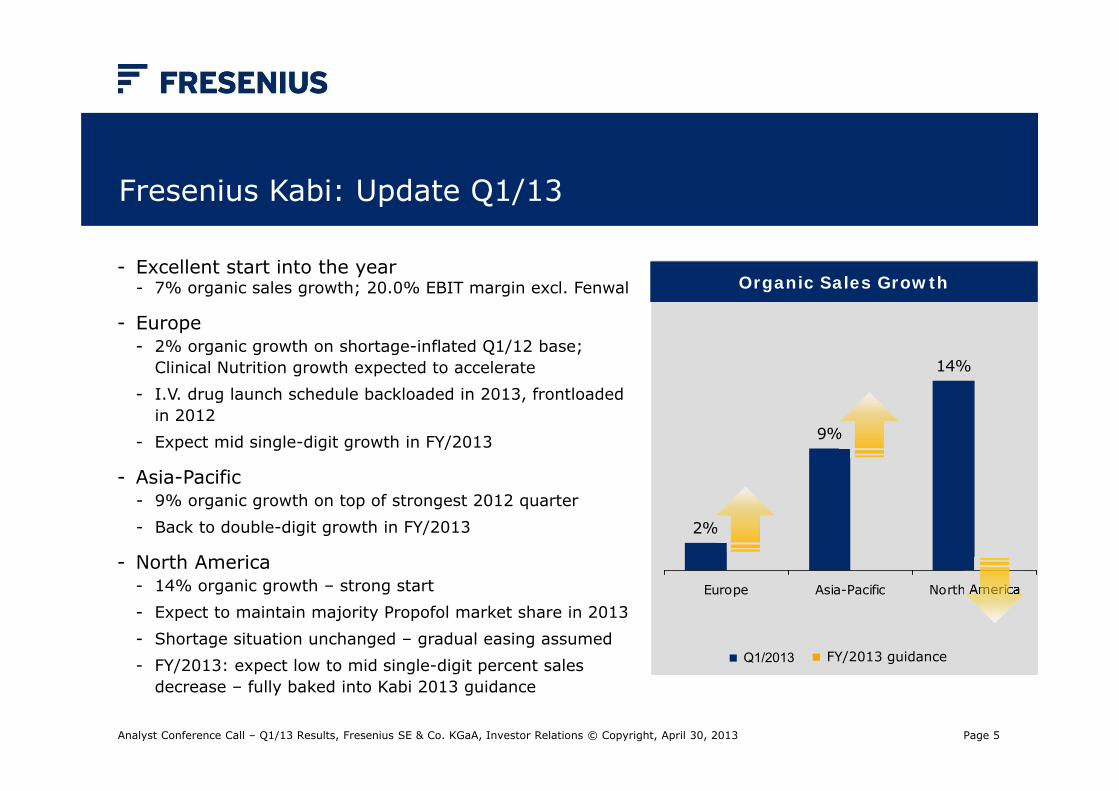
14%
9%
2%
Europe Asia-Pacific North America
Fresenius Kabi: Update Q1/13
Analyst Conference Call – Q1/13 Results, Fresenius SE & Co. KGaA, Investor Relations © Copyright, April 30, 2013
- Excellent start into the year- 7% organic sales growth; 20.0% EBIT margin excl. Fenwal
- Europe- 2% organic growth on shortage-inflated Q1/12 base;
Clinical Nutrition growth expected to accelerate - I.V. drug launch schedule backloaded in 2013, frontloaded
in 2012- Expect mid single-digit growth in FY/2013
- Asia-Pacific- 9% organic growth on top of strongest 2012 quarter- Back to double-digit growth in FY/2013
- North America- 14% organic growth – strong start - Expect to maintain majority Propofol market share in 2013- Shortage situation unchanged – gradual easing assumed- FY/2013: expect low to mid single-digit percent sales
decrease – fully baked into Kabi 2013 guidance
Organic Sales Growth
Q1/2013 FY/2013 guidance
Page 6
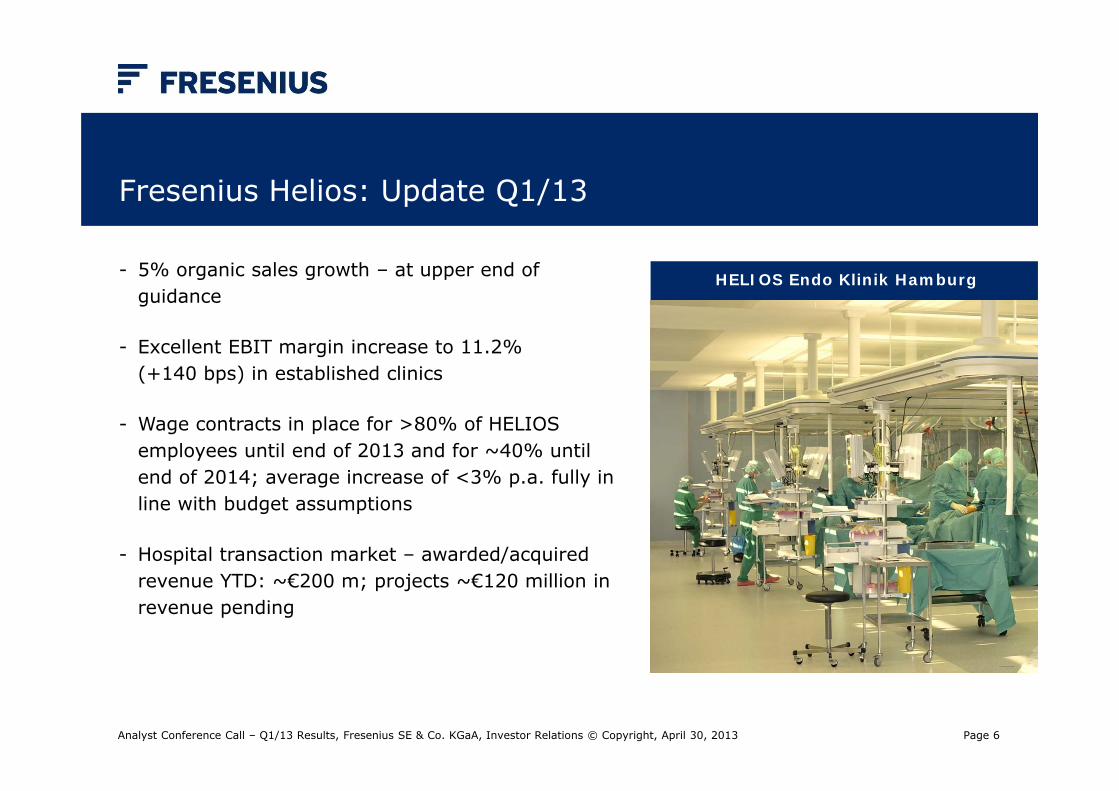
Fresenius Helios: Update Q1/13
Analyst Conference Call – Q1/13 Results, Fresenius SE & Co. KGaA, Investor Relations © Copyright, April 30, 2013
- 5% organic sales growth – at upper end of guidance
- Excellent EBIT margin increase to 11.2% (+140 bps) in established clinics
- Wage contracts in place for >80% of HELIOS employees until end of 2013 and for ~40% until end of 2014; average increase of <3% p.a. fully in line with budget assumptions
- Hospital transaction market – awarded/acquired revenue YTD: ~€200 m; projects ~€120 million in revenue pending
HELIOS Endo Klinik Hamburg
Page 7
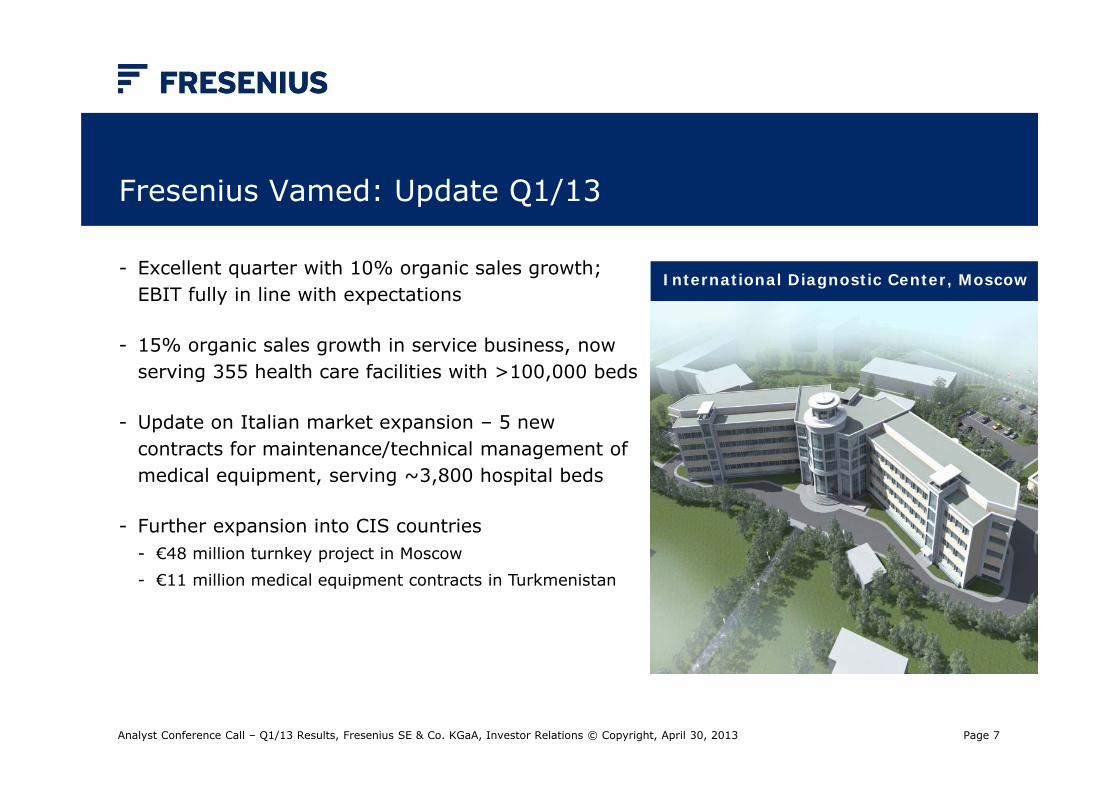
Fresenius Vamed: Update Q1/13
- Excellent quarter with 10% organic sales growth; EBIT fully in line with expectations
- 15% organic sales growth in service business, now serving 355 health care facilities with >100,000 beds
- Update on Italian market expansion – 5 new contracts for maintenance/technical management of medical equipment, serving ~3,800 hospital beds
- Further expansion into CIS countries- €48 million turnkey project in Moscow- €11 million medical equipment contracts in Turkmenistan
Analyst Conference Call – Q1/13 Results, Fresenius SE & Co. KGaA, Investor Relations © Copyright, April 30, 2013
International Diagnostic Center, Moscow
Page 8
Untertitel der Kapiteltrennseite
Maximal zweizeilig, 18 pt
Analyst Conference Call – Q1/13 Results, Fresenius SE & Co. KGaA, Investor Relations © Copyright, April 30, 2013
Group Financials Q1/13 − Outlook 2013
Page 9
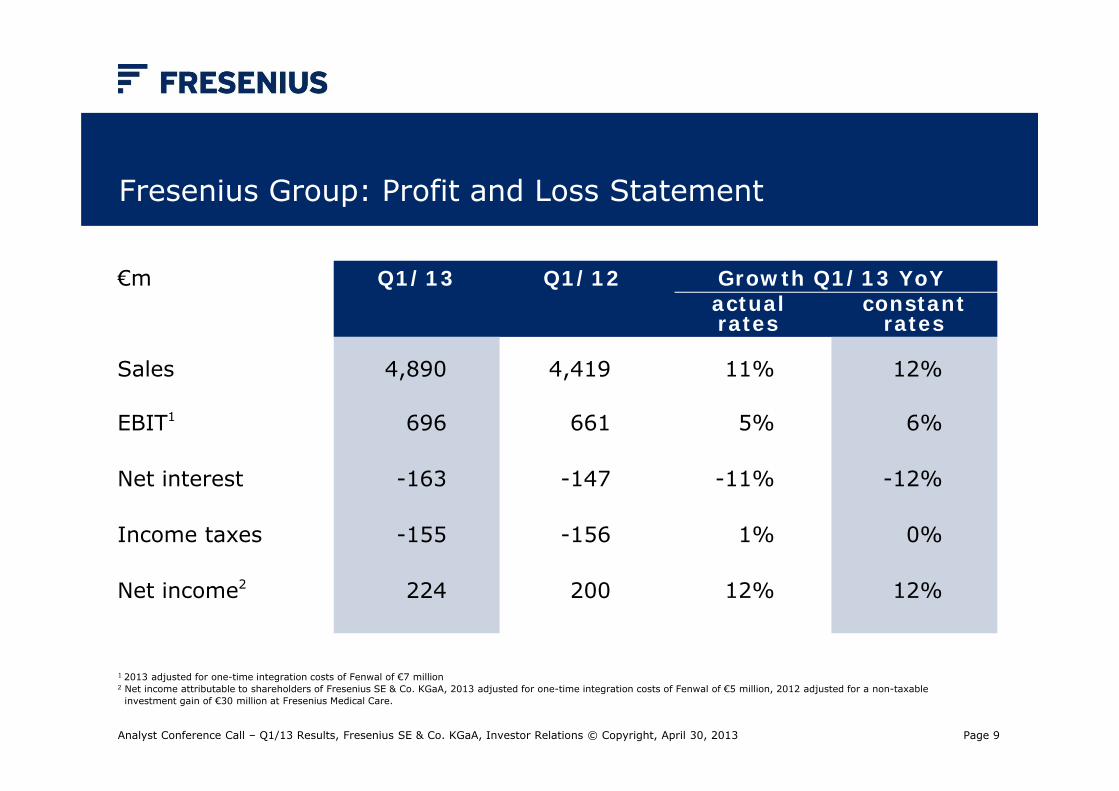
Fresenius Group: Profit and Loss Statement
Analyst Conference Call – Q1/13 Results, Fresenius SE & Co. KGaA, Investor Relations © Copyright, April 30, 2013
€m Q1/13 Q1/12 Growth Q1/13 YoYactualrates
constantrates
Sales
EBIT1
Net interest
Income taxes
Net income2
4,890
696
-163
-155
224
4,419
661
-147
-156
200
11%
5%
-11%
1%
12%
12%
6%
-12%
0%
12%
1 2013 adjusted for one-time integration costs of Fenwal of €7 million 2 Net income attributable to shareholders of Fresenius SE & Co. KGaA, 2013 adjusted for one-time integration costs of Fenwal of €5 million, 2012 adjusted for a non-taxable
investment gain of €30 million at Fresenius Medical Care.
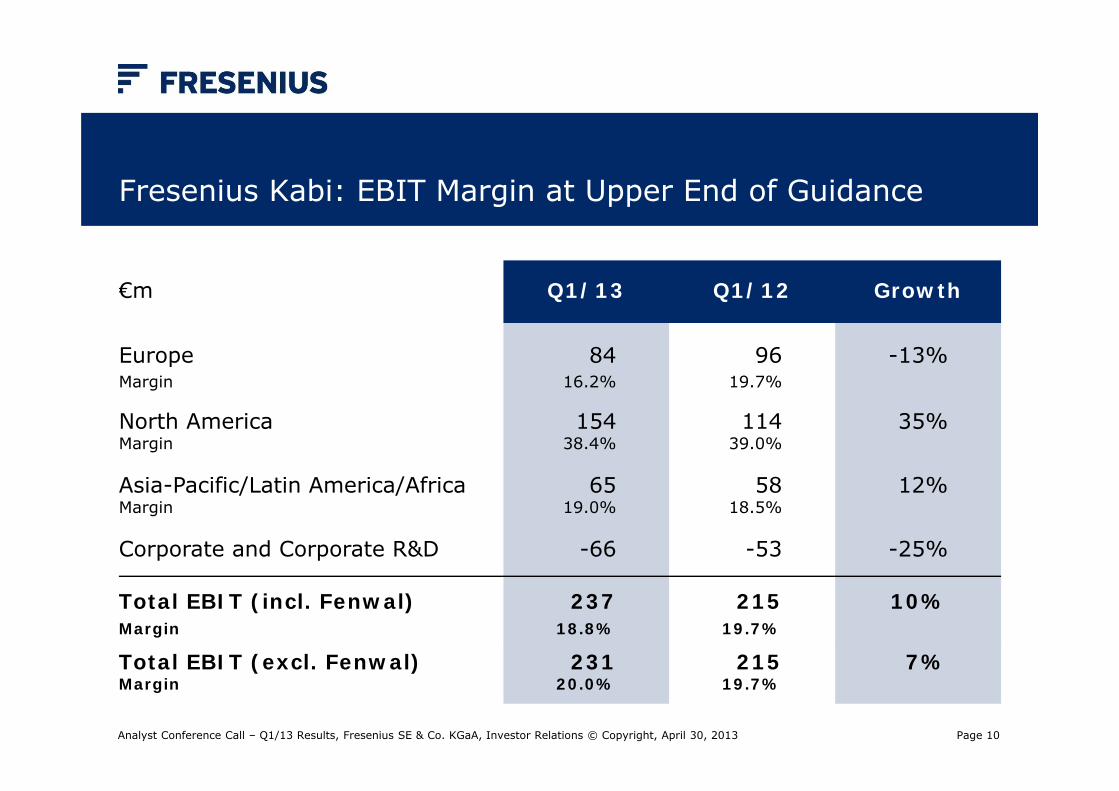
Page 10
€m Q1/13 Q1/12 Growth
EuropeMargin
North AmericaMargin
Asia-Pacific/Latin America/AfricaMargin
Corporate and Corporate R&D
8416.2%
15438.4%
6519.0%
-66
9619.7%
11439.0%
5818.5%
-53
-13%
35%
12%
-25%
Total EBIT (incl. Fenwal)Margin
23718.8%
21519.7%
10%
Total EBIT (excl. Fenwal)Margin
23120.0%
21519.7%
7%
Fresenius Kabi: EBIT Margin at Upper End of Guidance
Analyst Conference Call – Q1/13 Results, Fresenius SE & Co. KGaA, Investor Relations © Copyright, April 30, 2013
Page 11
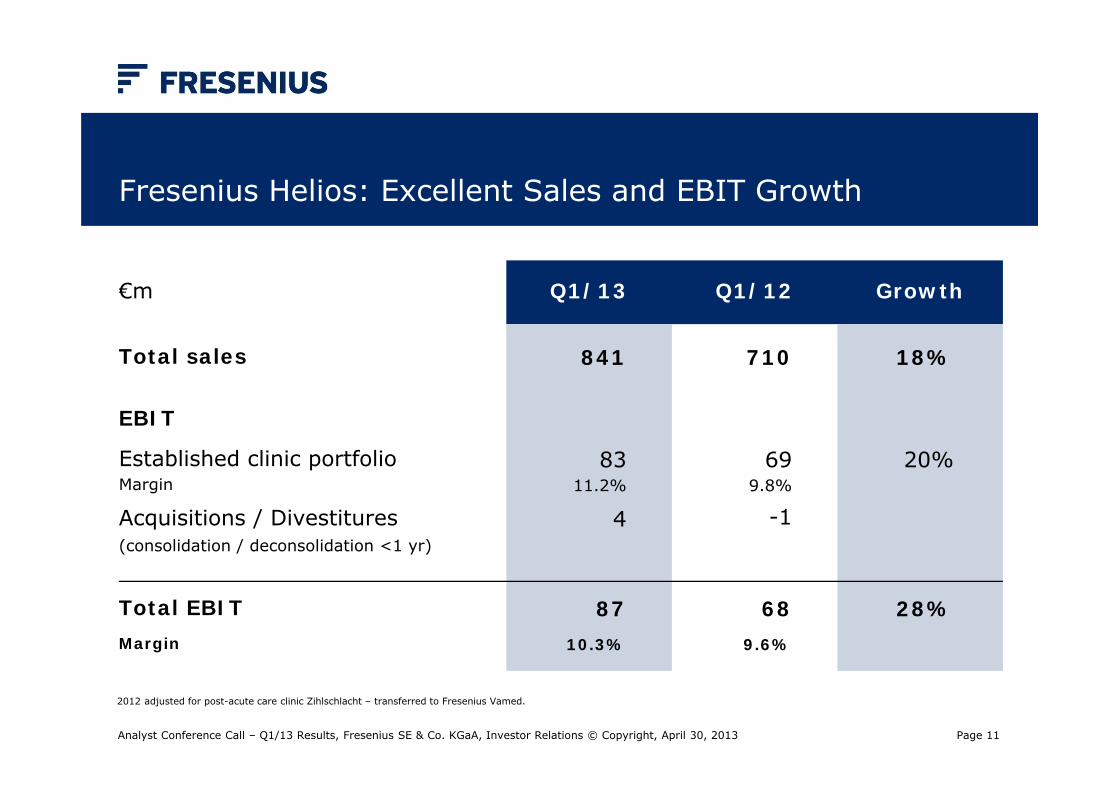
Fresenius Helios: Excellent Sales and EBIT Growth
Analyst Conference Call – Q1/13 Results, Fresenius SE & Co. KGaA, Investor Relations © Copyright, April 30, 2013
€m Q1/13 Q1/12 Growth
Total sales
EBIT
Established clinic portfolioMargin
Acquisitions / Divestitures(consolidation / deconsolidation <1 yr)
841
8311.2%
4
710
699.8%
-1
18%
20%
Total EBITMargin
8710.3%
689.6%
28%
2012 adjusted for post-acute care clinic Zihlschlacht – transferred to Fresenius Vamed.
Page 12
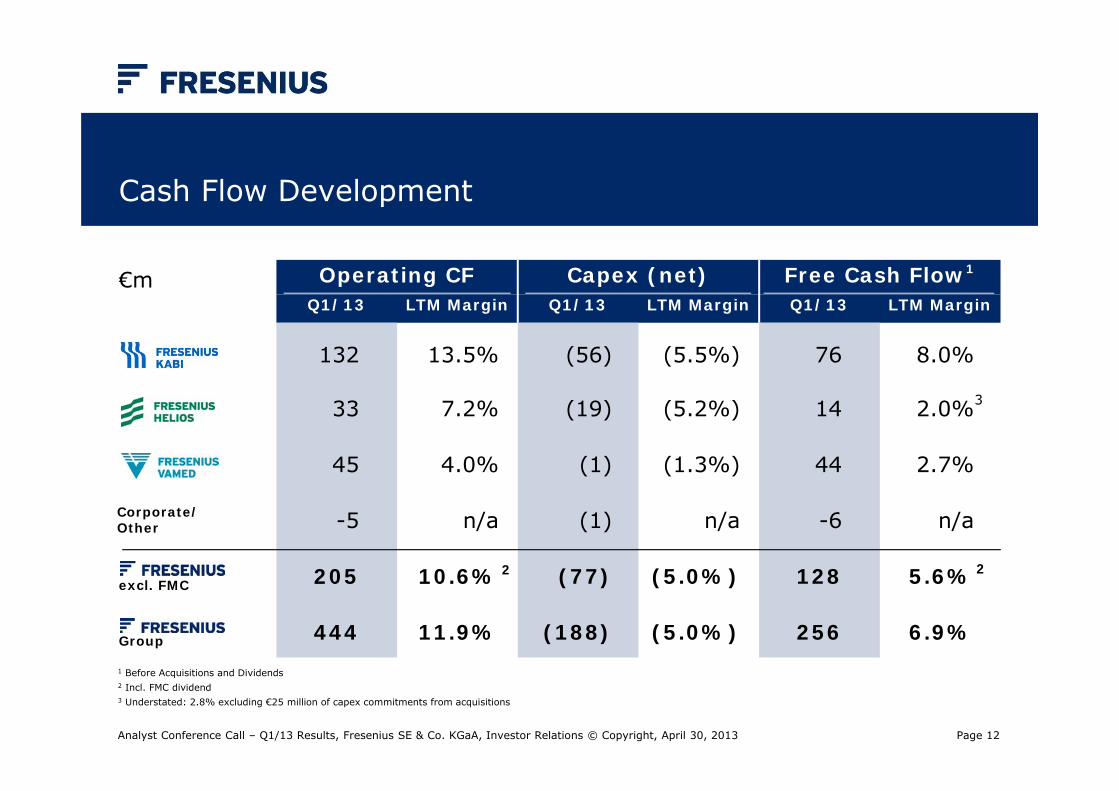
Cash Flow Development
Analyst Conference Call – Q1/13 Results, Fresenius SE & Co. KGaA, Investor Relations © Copyright, April 30, 2013
€m Operating CF Capex (net) Free Cash Flow1
Q1/13 LTM Margin Q1/13 LTM Margin Q1/13 LTM Margin
132
33
45
-5
205
444
13.5%
7.2%
4.0%
n/a
10.6%
11.9%
(56)
(19)
(1)
(1)
(77)
(188)
(5.5%)
(5.2%)
(1.3%)
n/a
(5.0%)
(5.0%)
76
14
44
-6
128
256
8.0%
2.0%
2.7%
n/a
5.6%
6.9%
Corporate/Other
excl. FMC
1 Before Acquisitions and Dividends2 Incl. FMC dividend3 Understated: 2.8% excluding €25 million of capex commitments from acquisitions
Group
2 2
3
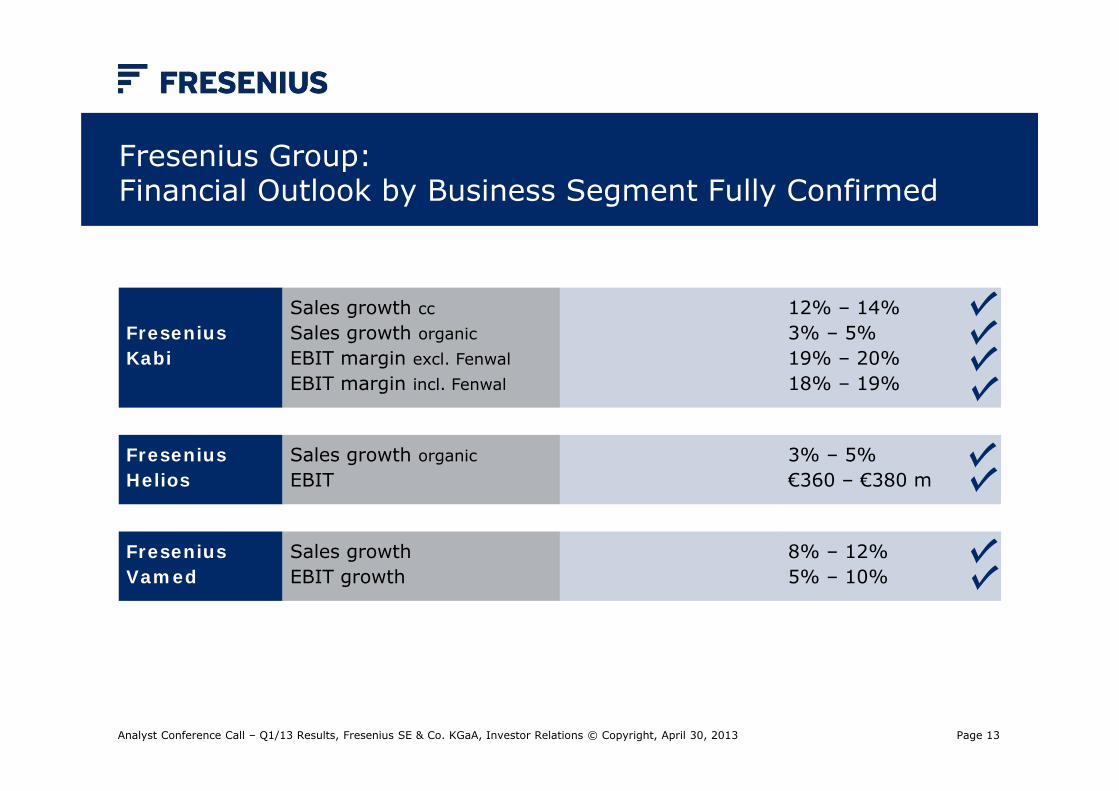
Page 13Analyst Conference Call – Q1/13 Results, Fresenius SE & Co. KGaA, Investor Relations © Copyright, April 30, 2013
Fresenius Group: Financial Outlook by Business Segment Fully Confirmed
FreseniusKabi
Sales growth ccSales growth organicEBIT margin excl. FenwalEBIT margin incl. Fenwal
12% – 14%3% – 5%19% – 20%18% – 19%
FreseniusHelios
Sales growth organicEBIT
3% – 5%€360 – €380 m
FreseniusVamed
Sales growth EBIT growth
8% – 12%5% – 10%
Page 14Analyst Conference Call – Q1/13 Results, Fresenius SE & Co. KGaA, Investor Relations © Copyright, April 30, 2013
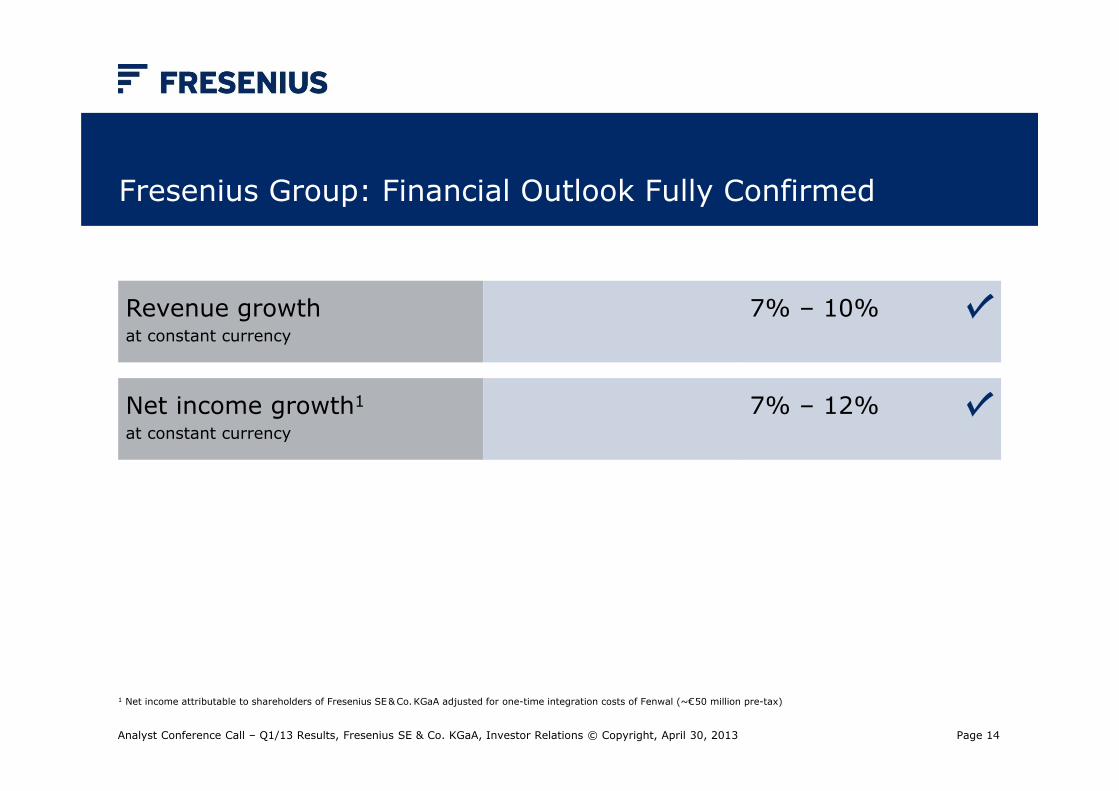
Fresenius Group: Financial Outlook Fully Confirmed
Revenue growthat constant currency
7% ‒ 10%
Net income growth1
at constant currency7% ‒ 12%
1 Net income attributable to shareholders of Fresenius SE & Co. KGaA adjusted for one-time integration costs of Fenwal (~€ 50 million pre-tax)
Page 15
Untertitel der Kapiteltrennseite
Maximal zweizeilig, 18 pt
Analyst Conference Call – Q1/13 Results, Fresenius SE & Co. KGaA, Investor Relations © Copyright, April 30, 2013
Attachments
Page 16
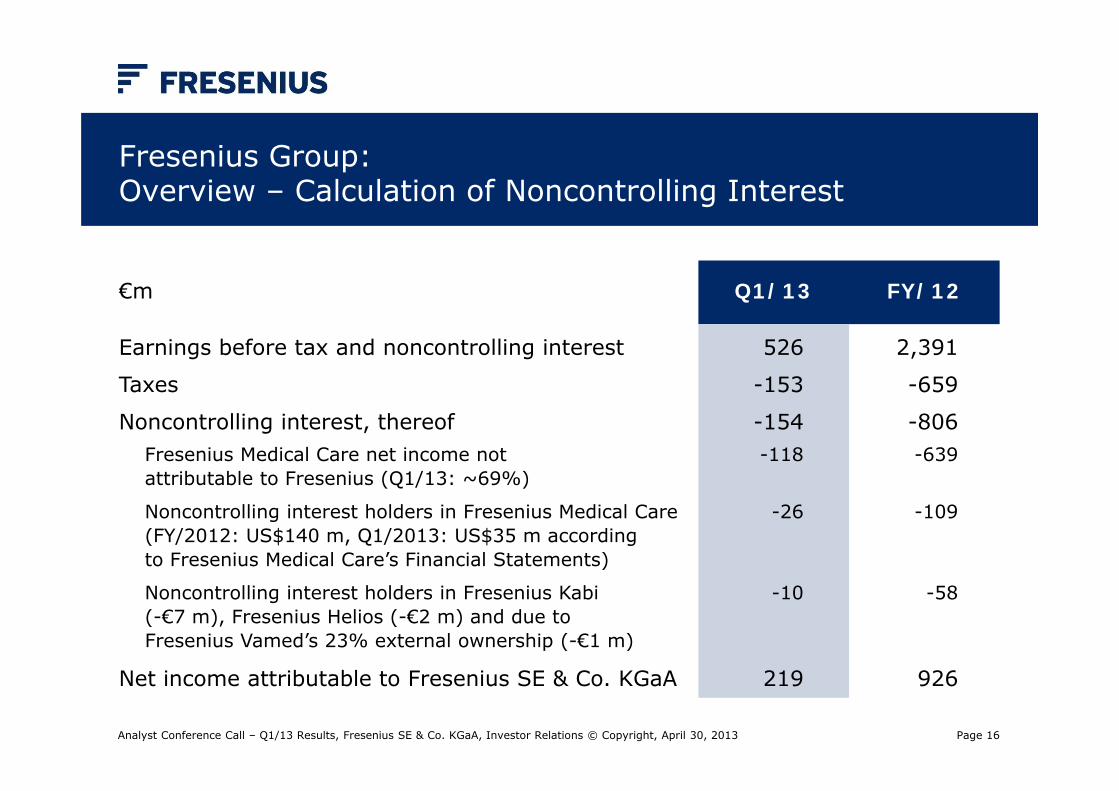
Fresenius Group: Overview – Calculation of Noncontrolling Interest
Analyst Conference Call – Q1/13 Results, Fresenius SE & Co. KGaA, Investor Relations © Copyright, April 30, 2013
€m Q1/13 FY/12
Earnings before tax and noncontrolling interest
Taxes
Noncontrolling interest, thereofFresenius Medical Care net income not attributable to Fresenius (Q1/13: ~69%)
Noncontrolling interest holders in Fresenius Medical Care(FY/2012: US$140 m, Q1/2013: US$35 m according to Fresenius Medical Care’s Financial Statements)
Noncontrolling interest holders in Fresenius Kabi(-€7 m), Fresenius Helios (-€2 m) and due to Fresenius Vamed’s 23% external ownership (-€1 m)
Net income attributable to Fresenius SE & Co. KGaA
526
-153
-154-118
-26
-10
219
2,391
-659
-806-639
-109
-58
926
Page 17
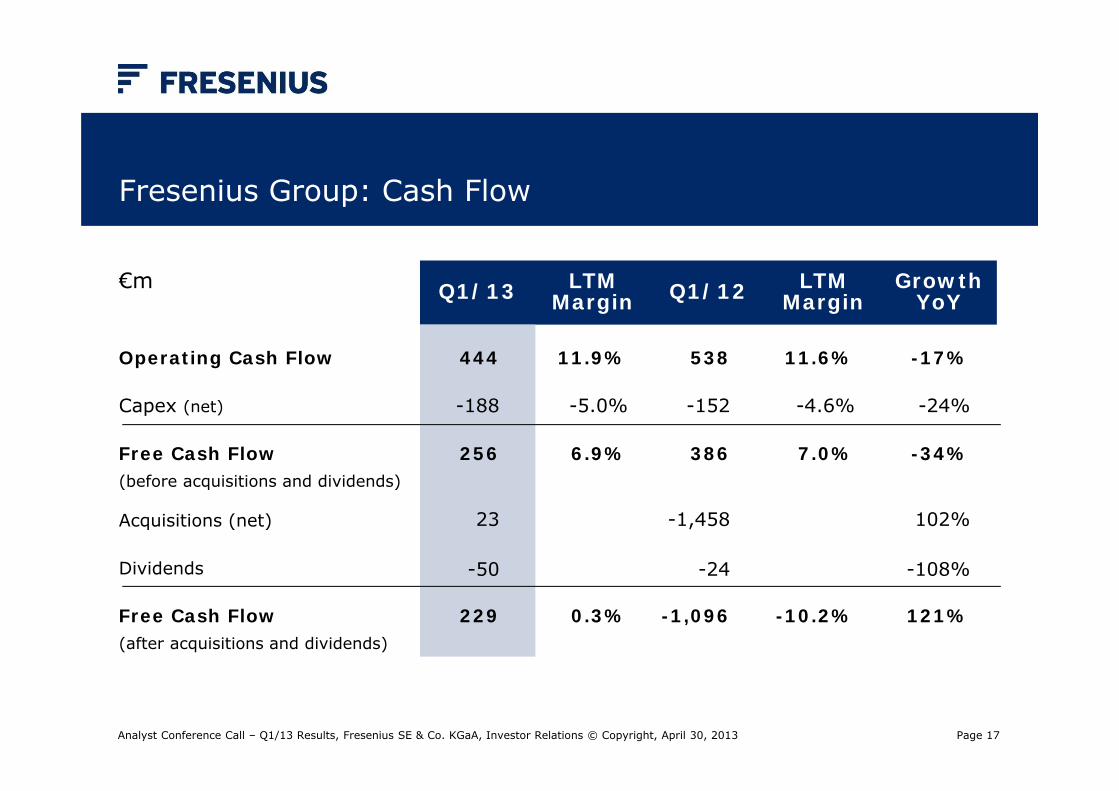
€m Q1/13 LTMMargin Q1/12 LTM
MarginGrowth
YoY
Operating Cash Flow
Capex (net)
Free Cash Flow(before acquisitions and dividends)
Acquisitions (net)
Dividends
Free Cash Flow(after acquisitions and dividends)
444
-188
256
23
-50
229
11.9%
-5.0%
6.9%
0.3%
538
-152
386
-1,458
-24
-1,096
11.6%
-4.6%
7.0%
-10.2%
-17%
-24%
-34%
102%
-108%
121%
Fresenius Group: Cash Flow
Analyst Conference Call – Q1/13 Results, Fresenius SE & Co. KGaA, Investor Relations © Copyright, April 30, 2013

Page 18
Cash Flow Development LTM
Analyst Conference Call – Q1/13 Results, Fresenius SE & Co. KGaA, Investor Relations © Copyright, April 30, 2013
€m Operating CF Capex (net) Free Cash Flow1
LTM Q1/13 LTM Margin LTM Q1/13 LTM Margin LTM Q1/13 LTM Margin
635
239
35
-24
885
2,344
13.5%
7.2%
4.0%
n/a
10.6%
11.9%
(259)
(171)
(11)
(11)
(452)
(988)
(5.5%)
(5.2%)
(1.3%)
n/a
(5.0%)
(5.0%)
376
68
24
-35
433
1,356
8.0%
2.0%
2.7%
n/a
5.6%
6.9%
Corporate/Other
excl. FMC
1 Before Acquisitions and Dividends2 Incl. FMC dividend3 Understated: 2.8% excluding €25 million of capex commitments from acquisitions
Group
Margin = in % of sales
2 2
3
Page 19
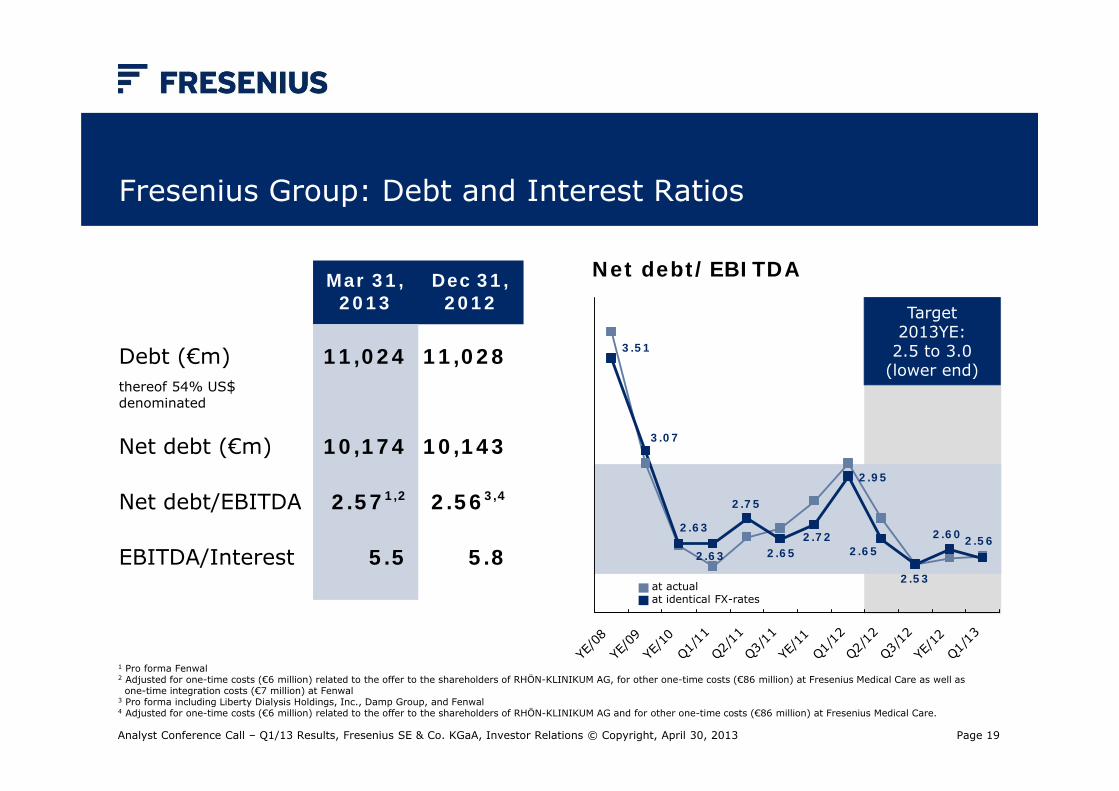
Fresenius Group: Debt and Interest Ratios
Analyst Conference Call – Q1/13 Results, Fresenius SE & Co. KGaA, Investor Relations © Copyright, April 30, 2013
1 Pro forma Fenwal2 Adjusted for one-time costs (€6 million) related to the offer to the shareholders of RHÖN-KLINIKUM AG, for other one-time costs (€86 million) at Fresenius Medical Care as well as
one-time integration costs (€7 million) at Fenwal3 Pro forma including Liberty Dialysis Holdings, Inc., Damp Group, and Fenwal4 Adjusted for one-time costs (€6 million) related to the offer to the shareholders of RHÖN-KLINIKUM AG and for other one-time costs (€86 million) at Fresenius Medical Care.
Mar 31,2013
Dec 31,2012
Debt (€m)thereof 54% US$denominated
11,024 11,028
Net debt (€m) 10,174 10,143
Net debt/EBITDA 2.571,2 2.563,4
EBITDA/Interest 5.5 5.8
Net debt/EBITDA
2.562.60
2.53
2.65
2.95
2.722.65
2.75
2.63
2.63
3.07
3.51
YE/0
8YE
/09
YE/1
0Q1/
11Q2/
11Q3/
11YE
/11
Q1/12
Q2/12
Q3/12
YE/1
2Q1/
13
Target 2013YE:
2.5 to 3.0(lower end)
at actualat identical FX-rates

Page 20
€m Q1/13 Q1/12 OrganicGrowth
Infusion Therapy
I.V. Drugs
Clinical Nutrition
Medical Devices/Transfusion Technology
250
460
326
224
246
410
316
120
5%
13%
5%
-1%
Total sales 1,260 1,092 7%
Fresenius Kabi: Strong Organic Sales Growth
Analyst Conference Call – Q1/13 Results, Fresenius SE & Co. KGaA, Investor Relations © Copyright, April 30, 2013

Page 21
Fresenius Kabi: Strong Organic Sales Growth
Analyst Conference Call – Q1/13 Results, Fresenius SE & Co. KGaA, Investor Relations © Copyright, April 30, 2013
€m Q1/13 Q1/12 OrganicGrowth
Europe
North America
Asia-Pacific
Latin America/Africa
517
401
223
119
487
292
199
114
2%
14%
9%
9%
Total sales 1,260 1,092 7%
Page 22
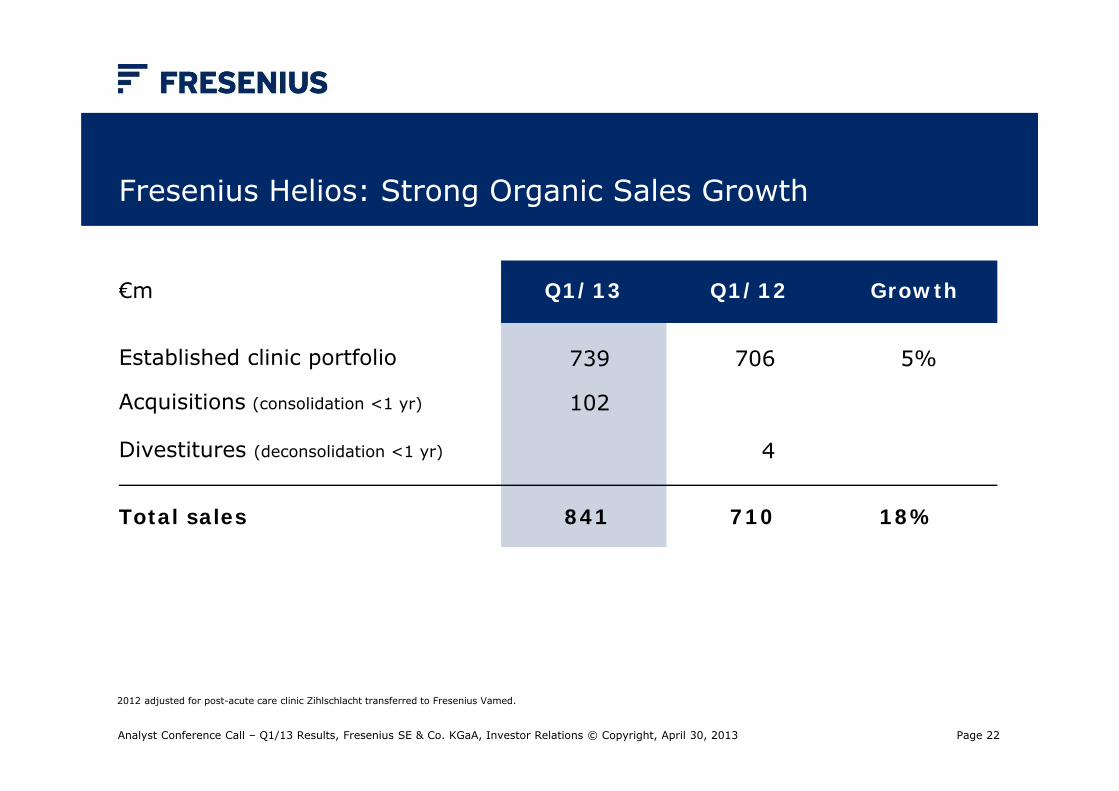
Fresenius Helios: Strong Organic Sales Growth
Analyst Conference Call – Q1/13 Results, Fresenius SE & Co. KGaA, Investor Relations © Copyright, April 30, 2013
€m Q1/13 Q1/12 Growth
Established clinic portfolio
Acquisitions (consolidation <1 yr)
Divestitures (deconsolidation <1 yr)
739
102
706
4
5%
Total sales 841 710 18%
2012 adjusted for post-acute care clinic Zihlschlacht transferred to Fresenius Vamed.
Page 23
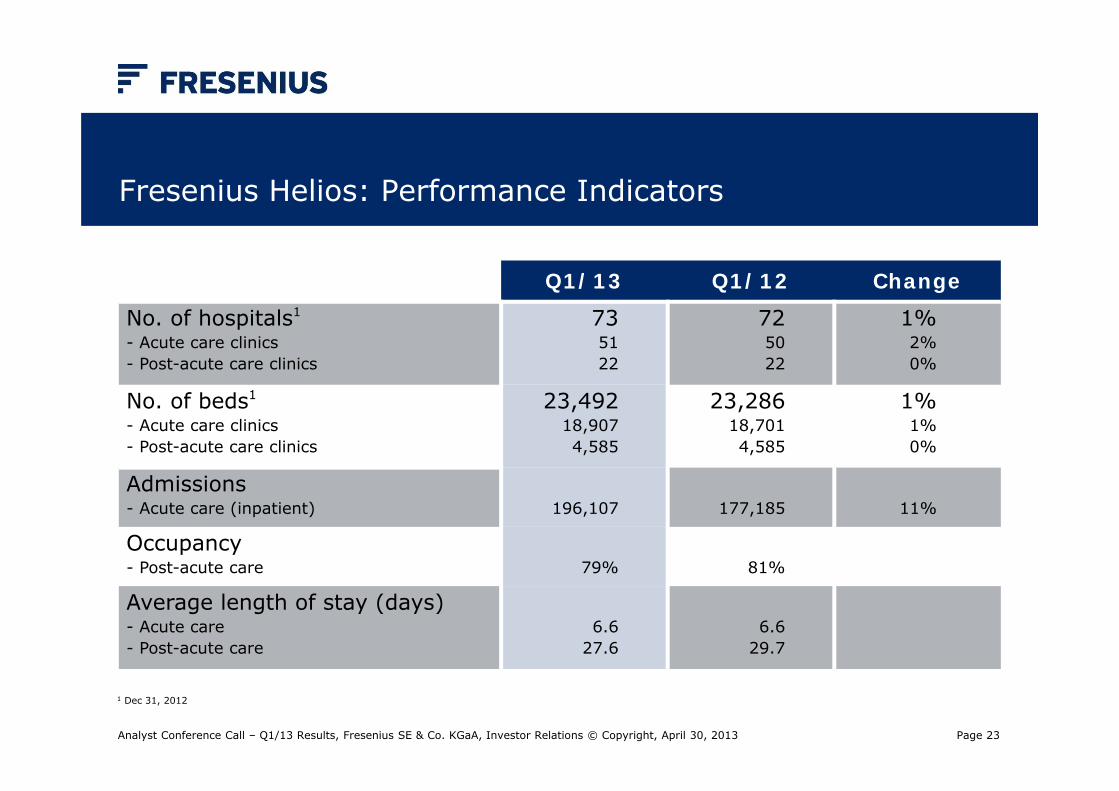
Fresenius Helios: Performance Indicators
Analyst Conference Call – Q1/13 Results, Fresenius SE & Co. KGaA, Investor Relations © Copyright, April 30, 2013
Q1/13 Q1/12 Change
No. of hospitals1
- Acute care clinics- Post-acute care clinics
735122
725022
1%2%0%
No. of beds1
- Acute care clinics- Post-acute care clinics
23,49218,9074,585
23,28618,7014,585
1%1%0%
Admissions- Acute care (inpatient) 196,107 177,185 11%
Occupancy- Post-acute care 79% 81%
Average length of stay (days)- Acute care- Post-acute care
6.627.6
6.629.7
1 Dec 31, 2012
Page 24
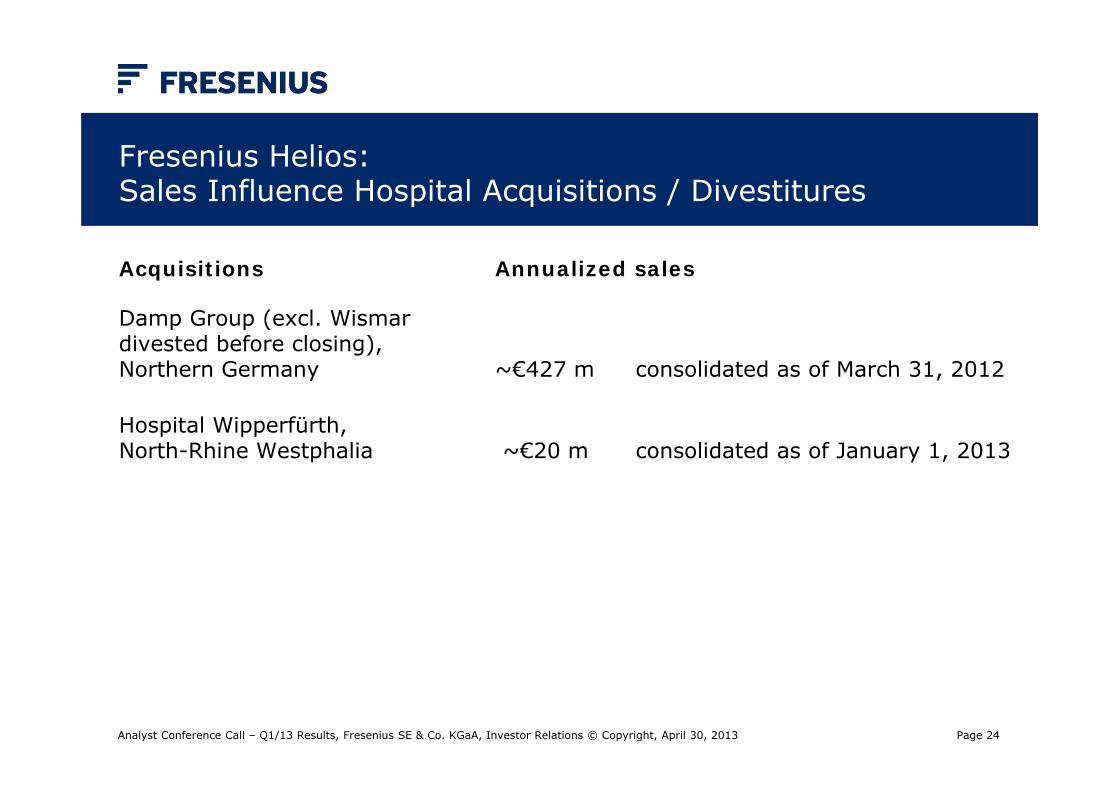
Fresenius Helios: Sales Influence Hospital Acquisitions / Divestitures
Analyst Conference Call – Q1/13 Results, Fresenius SE & Co. KGaA, Investor Relations © Copyright, April 30, 2013
Acquisitions Annualized sales
Damp Group (excl. Wismardivested before closing),Northern Germany ~€427 m consolidated as of March 31, 2012
Hospital Wipperfürth,North-Rhine Westphalia ~€20 m consolidated as of January 1, 2013
Page 25
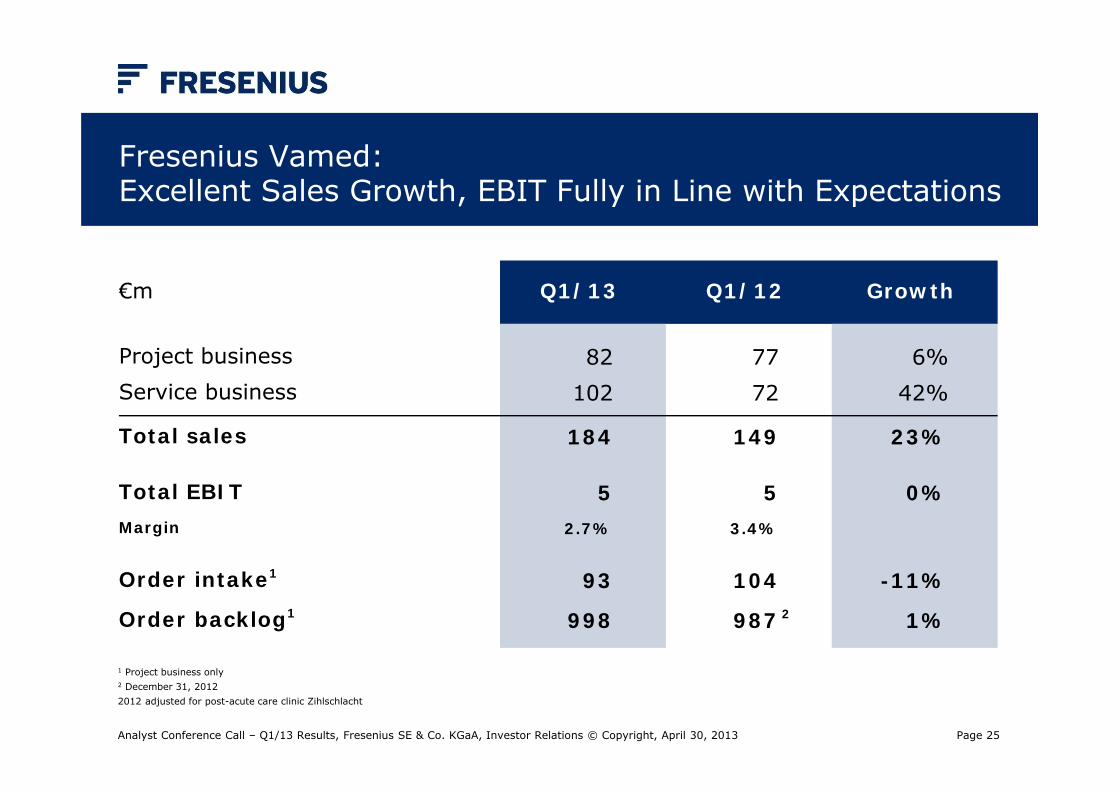
Fresenius Vamed: Excellent Sales Growth, EBIT Fully in Line with Expectations
Analyst Conference Call – Q1/13 Results, Fresenius SE & Co. KGaA, Investor Relations © Copyright, April 30, 2013
€m Q1/13 Q1/12 Growth
Project businessService business
82102
7772
6%42%
Total sales
Total EBITMargin
Order intake1
Order backlog1
184
52.7%
93
998
149
53.4%
104
987
23%
0%
-11%
1%
1 Project business only2 December 31, 20122012 adjusted for post-acute care clinic Zihlschlacht
2
Page 26
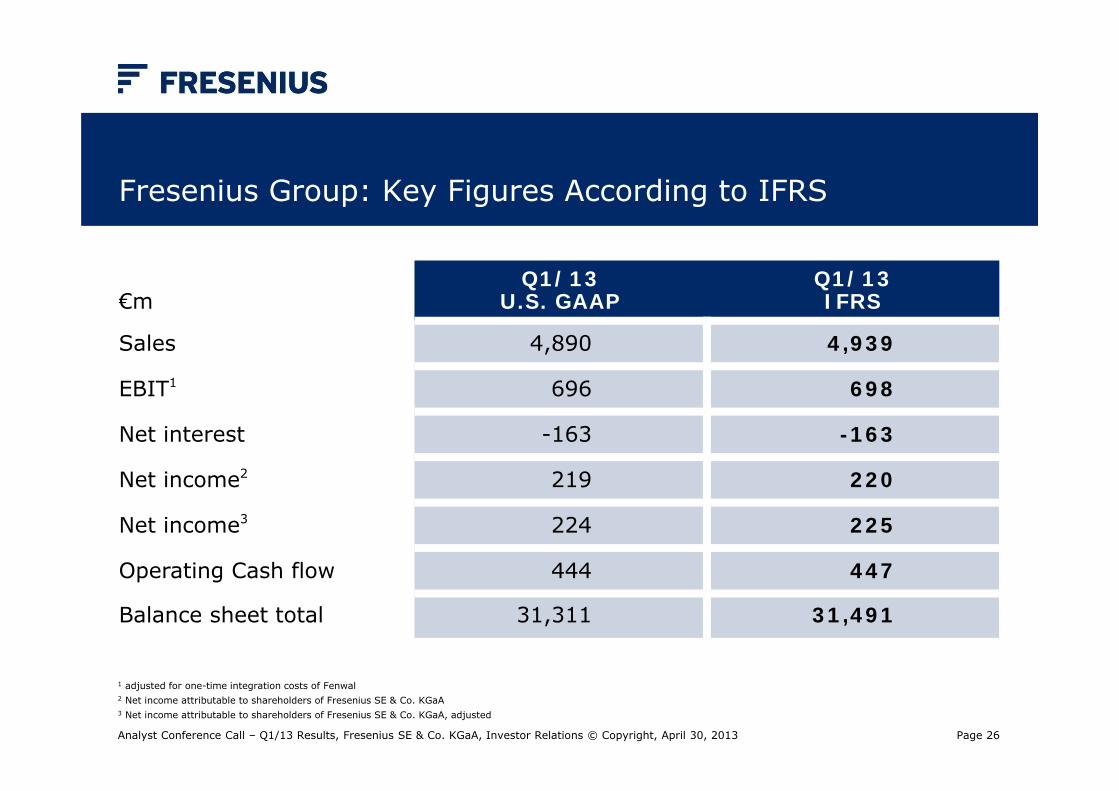
Fresenius Group: Key Figures According to IFRS
Analyst Conference Call – Q1/13 Results, Fresenius SE & Co. KGaA, Investor Relations © Copyright, April 30, 2013
€mQ1/13
U.S. GAAPQ1/13IFRS
Sales 4,890 4,939
EBIT1 696 698
Net interest -163 -163
Net income2 219 220
Net income3 224 225
Operating Cash flow 444 447
Balance sheet total 31,311 31,491
1 adjusted for one-time integration costs of Fenwal2 Net income attributable to shareholders of Fresenius SE & Co. KGaA3 Net income attributable to shareholders of Fresenius SE & Co. KGaA, adjusted
Page 27
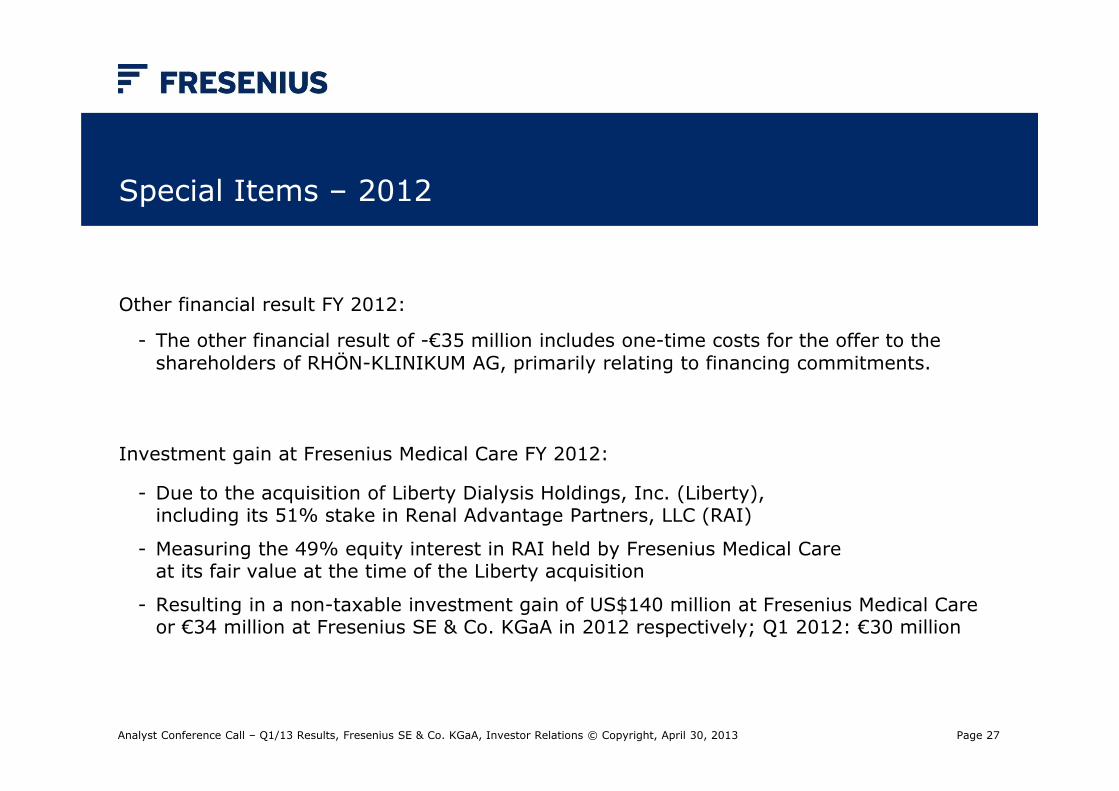
Special Items – 2012
Analyst Conference Call – Q1/13 Results, Fresenius SE & Co. KGaA, Investor Relations © Copyright, April 30, 2013
Other financial result FY 2012:
- The other financial result of -€35 million includes one-time costs for the offer to the shareholders of RHÖN-KLINIKUM AG, primarily relating to financing commitments.
Investment gain at Fresenius Medical Care FY 2012:
- Due to the acquisition of Liberty Dialysis Holdings, Inc. (Liberty),including its 51% stake in Renal Advantage Partners, LLC (RAI)
- Measuring the 49% equity interest in RAI held by Fresenius Medical Care at its fair value at the time of the Liberty acquisition
- Resulting in a non-taxable investment gain of US$140 million at Fresenius Medical Care or €34 million at Fresenius SE & Co. KGaA in 2012 respectively; Q1 2012: €30 million
Page 28
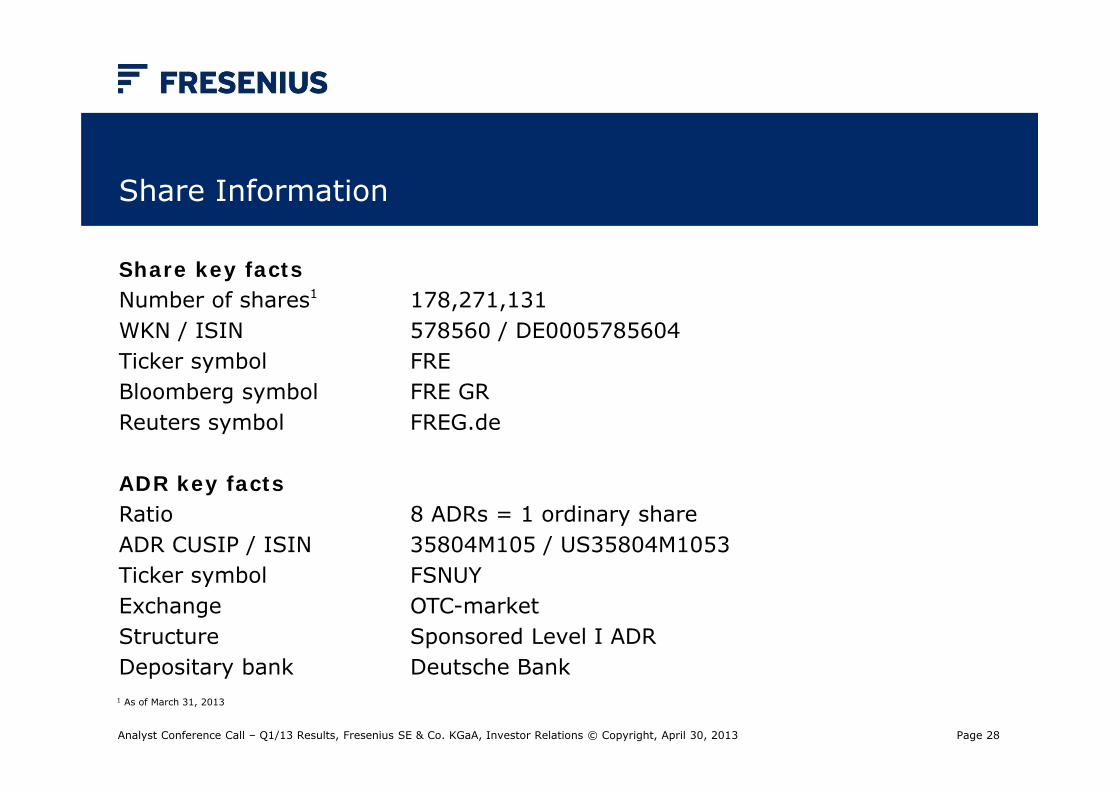
Share Information
Analyst Conference Call – Q1/13 Results, Fresenius SE & Co. KGaA, Investor Relations © Copyright, April 30, 2013
Share key factsNumber of shares1 178,271,131WKN / ISIN 578560 / DE0005785604Ticker symbol FREBloomberg symbol FRE GRReuters symbol FREG.de
ADR key factsRatio 8 ADRs = 1 ordinary shareADR CUSIP / ISIN 35804M105 / US35804M1053Ticker symbol FSNUYExchange OTC-marketStructure Sponsored Level I ADRDepositary bank Deutsche Bank1 As of March 31, 2013
Page 29
Financial Calendar
Analyst Conference Call – Q1/13 Results, Fresenius SE & Co. KGaA, Investor Relations © Copyright, April 30, 2013
17.05.2013 Annual General Meeting, Frankfurt/Main
30.07.2013 Report on 1st half 2013
05.11.2013 Report on 1st – 3rd quarter 2013
ContactBirgit Grund SVP Investor Relations Fresenius SE & Co. KGaA
Telephone: +49 6172 608-2485e-mail: [email protected]
For further information and current news: http://www.fresenius.com


![Analyst Presentation (Q1 FY2015-16) [Company Update]](https://static.fdocuments.in/doc/165x107/577cb26f1a28aba7118c046a/analyst-presentation-q1-fy2015-16-company-update.jpg)