Investment SECTION - MERS | Municipal Employees' Retirement System
30
Investment SECTION Prudent Investment Our Investments Department, under direction of the Retirement Board, provides strict oversight and due diligence of our investment managers, available investment funds for our participant-directed programs, and ensures our programs meet our standards of security and stability for our members.
Transcript of Investment SECTION - MERS | Municipal Employees' Retirement System

Investment
SECTION
Prudent Investment
Our Investments Department, under direction of the Retirement Board, provides strict oversight and due diligence of our investment managers, available investment funds for our participant-directed programs, and ensures our programs meet our standards of security and stability for our members.

INvESTmENTS SECTIONChief Investment Officer Report . . . . . . . . . . . . . . . . . . . . . . . . . . . . . . . . . . 53Report On Investment Activity . . . . . . . . . . . . . . . . . . . . . . . . . . . . . . . . . . . . 55Defined Benefit Plan . . . . . . . . . . . . . . . . . . . . . . . . . . . . . . . . . . . . . . . . . . 56Investment Objectives and Activity . . . . . . . . . . . . . . . . . . . . . . . . . . . . . . . . 56Portfolio Highlights . . . . . . . . . . . . . . . . . . . . . . . . . . . . . . . . . . . . . . . . . . . . 57Investment Themes . . . . . . . . . . . . . . . . . . . . . . . . . . . . . . . . . . . . . . . . . . . 59Total Market Fund Review . . . . . . . . . . . . . . . . . . . . . . . . . . . . . . . . . . . . . . 60
Asset Class Performance for 2012 (gross of fees) and Contribution to Total Return . . . . . . . . . . . . . . . . . . . . . . . . . . . . . . . . . . . . 60Performance Versus Custom Benchmarks . . . . . . . . . . . . . . . . . . . . . . . . . 61Downside Protection Upside Participation . . . . . . . . . . . . . . . . . . . . . . . . . . 62Current Asset Allocation versus Target Allocation . . . . . . . . . . . . . . . . . . . . . 63Statistical Performance (gross of fees) . . . . . . . . . . . . . . . . . . . . . . . . . . . . 63Securities Lending 2012 Rebates and Fees . . . . . . . . . . . . . . . . . . . . . . . . 64Investment Summary . . . . . . . . . . . . . . . . . . . . . . . . . . . . . . . . . . . . . . . . 65Reconciliation of Investments to Financial Statements . . . . . . . . . . . . . . . . . 65
Equity Asset Class Summary . . . . . . . . . . . . . . . . . . . . . . . . . . . . . . . . . . . . 66Market Commentary . . . . . . . . . . . . . . . . . . . . . . . . . . . . . . . . . . . . . . . . . . 67
Public Equity Performance . . . . . . . . . . . . . . . . . . . . . . . . . . . . . . . . . . . . . 67Top Ten Equity Holdings . . . . . . . . . . . . . . . . . . . . . . . . . . . . . . . . . . . . . . . 67Public Equity – Investment Managers . . . . . . . . . . . . . . . . . . . . . . . . . . . . . 68
Fixed Income & High Yield Asset Class Summary . . . . . . . . . . . . . . . . . . . . . . 69Fixed Income Performance . . . . . . . . . . . . . . . . . . . . . . . . . . . . . . . . . . . . 70Top Ten Fixed Income Holdings . . . . . . . . . . . . . . . . . . . . . . . . . . . . . . . . . 70Fixed Income – Investment Managers . . . . . . . . . . . . . . . . . . . . . . . . . . . . 70High Yield Performance as of December 31, 2012 (gross of fees) . . . . . . . . 71High Yield – Investment Managers . . . . . . . . . . . . . . . . . . . . . . . . . . . . . . . 71
Alternative Asset Class Summary . . . . . . . . . . . . . . . . . . . . . . . . . . . . . . . . . 72Alternative Performance . . . . . . . . . . . . . . . . . . . . . . . . . . . . . . . . . . . . . . 75Alternatives – External Investment Managers . . . . . . . . . . . . . . . . . . . . . . . 75
Investment Management Fees . . . . . . . . . . . . . . . . . . . . . . . . . . . . . . . . . . . 76Schedule of Investment Fees . . . . . . . . . . . . . . . . . . . . . . . . . . . . . . . . . . . 76Schedule of Investment Commissions . . . . . . . . . . . . . . . . . . . . . . . . . . . . 77
MERS Investment Menu Summary for the Defined Contribution Plan, Hybrid (Part II) Plan, Health Care Savings Program, and 457 Program . . . . . . 78MERS Retiree Health Funding Vehicle . . . . . . . . . . . . . . . . . . . . . . . . . . . . . . 79MERS Investment Services Program . . . . . . . . . . . . . . . . . . . . . . . . . . . . . . . 79

investments sectioncomprehensive annual financial report 53
CHIEF INVESTMENT OFFICER REPORT
Dear Members and MERS Retirement Board:
I respectfully submit the investment activity report for the Municipal Employees’ Retirement System (MERS) of Michigan’s Comprehensive Annual Financial Report for the fiscal year ending December 31, 2012.
As always, our goal as prudent investors is to provide our member municipalities with effective returns at efficient costs, while protecting the pensions and assets of our many members. Our investment returns consistently outperform our benchmarks and market averages, with a prudent, long-term approach designed to provide downside protection and upside market participation.
Economic Overview
The effects of the global economic crisis which began in 2008 are beginning to recede, but the systemic issues which precipitated what is now known as the “Great Recession,” continue to play out in the global markets. Slower growth in the developed world should be expected for the medium term. As generational transfer policy issues are addressed heightened market and political volatility will continue. Last year saw several events impact the investing environment: the surprising calm of the European credit crisis, reduced volatility, the U.S. election, continued political dysfunction, and an upward movement of risk assets. Global central banking activity remained accommodative and is likely to remain so through 2014. While markets have stabilized, systemic risks will remain elevated for the medium term. The deleveraging of developed governmental balance sheets is at best a third of the way complete in contrast to the business and consumer sectors. As this process continues, expect significant market movements to present both opportunities and challenges.
The global financial markets posted strong returns throughout the year across all asset
classes. Chinese economic activity began to increase as that country seemed to have avoided a hard landing. The U.S. resolved its electoral issues and is moving slowly toward addressing its structural budgetary concerns. The most recent quarterly GDP numbers show the Eurozone GDP at -0.6% and the U.S. GDP at 1.6% for the 4th quarter with 2.2% U.S. GDP for 2012. U.S. growth slowed in the 4th quarter due largely to cut backs in government spending and tax increases. The housing market saw positive upward momentum with the Case-Shiller index up 8% for the year. Unemployment in the U.S. has continued to remain high at 7.9% and the U6 unemployment at 14.4%, although these numbers are steadily improving as new jobs are being added. In the private sector job growth has increased on average 160,000 jobs per month for 2012. The deleveraging process will negatively impede top line GDP growth for several years to come. A more opportunistic and patient investment approach will be necessary to maximize returns. Industry specific factors and potential inflationary pressures may lead to continued asset price appreciation despite slower economic growth. Lastly, it is worth mentioning that equity markets tend to be leading indicators and current trends should be viewed positively.
MERS Total Market Fund
Regardless of economic and financial turmoil, the defined investment objective of the MERS fund is to grow assets at a rate which, when coupled with contributions, satisfies earned benefits to our members. The Office of Investments strives to achieve a real rate of return of at least 3.50% annually over the rate of inflation and/or exceed the actuarial assumption rate of 8.00% annually. On an absolute return basis, the MERS Office of Investments strives for better performance, but feels confident about MERS performance relative to our benchmarks.

investments sectioncomprehensive annual financial report54
MERS 2012 highlights:
• The MERS Total Market Fund return for 2012 was 11.39% gross of investment fees, which outperformed the actuarially assumed rate of 8.00% by 3.39%.
• The MERS Total Market Fund underperformed its custom policy benchmark gross of investment fees by only 0.04%. This performance is a testament of MERS portfolio asset allocation, active management, and tactical decision-making. The MERS portfolio is specifically designed to provide downside protection during turbulent markets.
• At the broad asset class level, absolute returns gross of investment fees for the year were as follows:
Total Equity 17.88%Real Estate 13.84%Fixed Income 6.02% High Yield 12.69%Commodities 6.87%Private Equity 0.50%Cash 1.12%
In conclusion, I would like to thank the Retirement Board, the fiduciaries of the MERS Plan, for their continued support of the Office of Investments. The clarity of MERS governance structure and the functional checks and balances has allowed the investment program to be successful for our members. This relationship makes for a more efficient decision-making process, benefiting our membership through stronger, risk-adjusted returns.
Respectfully,
Jeb Burns, Chief Investments Officer

investments sectioncomprehensive annual financial report 55
REPORT ON INVESTMENT ACTIVITY
MERS is organized for the express purpose of using its collective resources to ensure that its member municipalities have sufficient financial resources to meet the pension obligations that each is individually responsible for under the State of Michigan’s Constitution 1963, Article 9, Section 24. MERS is authorized to create subsidiary entities and to provide additional benefits and savings programs to its members at the direction of the Retirement Board. See PA 490 of 2004, Section 36(2)(a); MCL 38.1536(2)(a).
The MERS Retirement Board (Board), as “investment fiduciary” under the Public Employee Retirement System Investment Act (PERSIA), PA 314 of 1965, has the fiduciary responsibility and authority to direct the Retirement System’s investment program. Members of the Board must follow the state law and prudent standards of diligence consistent with “discharging their duties for the exclusive benefit of plan participants.” The prudent person standard requires that the Board “exercise the same judgment, care, skill, prudence, and diligence under the circumstances which persons acting in a like capacity and familiar with such matters would use in the conduct of a similar enterprise with similar aims.” MERS has a Defined Benefit Plan, Defined Contribution Plan, Hybrid Plan, 457 Supplemental Retirement Program, Health Care Savings Plan, Retiree Health Funding Vehicle, and Investment Services Program. MERS’ Retirement Board (Board) has granted full discretion to manage all investment management operations and activities to MERS Office of Investments, except those specifically reserved for the Board.
The Investment Policy Statement (IPS) outlines the investment goals, objectives, and policies of the Fund. The purpose of the IPS is to ensure that the investment activities are carried out within the framework established by MERS policy and administrative documents. The IPS assists the Board, Investment Committee, and staff in effectively monitoring MERS’ investment
program and offers a map to assist in making prudent and informed investment decisions. This IPS addresses the following issues:
• The goals of MERS’ Investment Program;
• Investment policies;
• Performance objectives and evaluation;
• Major investment programs; and
• Investment processes and procedures.
The IPS is designed to provide sufficient flexibility in the management and oversight process to reflect the dynamic nature of the capital markets. It will serve as a working document and may be modified as needed or as market conditions change. At a minimum, the IPS will be updated annually and approved by the Board.
In accordance with GASB 25, plan investments are presented at fair value. Short-term investments are valued at cost plus accrued interest, which approximates fair value. Securities traded on a national or international exchange are valued at the last reported sales price at current exchange rates. Corporate bonds not traded on a national or international exchange are based upon equivalent values of comparable securities with similar yield and risk. Independent appraisals are the basis for valuing the fair value of real estate. Other investments that do not have established markets are recorded at an estimated fair value. Real estate, private equity, and certain alternative investments typically have a quarter lag in reporting, which is an industry standard. Periodic and independent appraisals of these assets are carried out to ensure an accurate valuation to assist in properly assessing the value of the total fund.
MERS uses a time weighted rate of return calculation methodology based on the market rate of return for the schedule of investment results in the CAFR.

investments sectioncomprehensive annual financial report56
A. DEFINED BENEFIT PlAN
INVESTMENT OBJECTIVES AND ACTIVITY
In conformity with PERSIA, the primary goal of MERS’ Investment Program is to grow assets at a rate which, when coupled with employer and employee contributions, satisfies promised benefits to MERS members. This should be done with a high degree of prudence to reduce risk. The following objectives are intended to assist in achieving this goal:
• Maintain the stability of the Plan’s funded status
• Maintain adequate liquidity to pay promised benefits
• Adopt a strategic asset allocation plan that reflects current and future liabilities, minimizes volatility and maximizes the long-term total rate of return
• Minimize the costs associated with implementation of the asset allocation through the efficient use of internal and external resources
• Exceed the actuarial investment assumption on a long-term basis, which is currently 8% annually. More specifically, earn a minimum real rate of return of at least 3.5% per year above inflation
• Maintain above median peer rankings for the 3, 5, and 10-year time periods
• Exceed the return of the Fund’s Policy Benchmark. The Policy Benchmark currently consists of:
WeightingIndex
Barclays Aggregate Bond Index 30%S&P 500 Index 20%Russell 2000 Index 15%Custom Real Estate Index* 7%Russell Micro Cap Index 5%MSCI EAFE Index 5%MSCI Emerging Markets Index 5%BofA Merrill Lynch High Yield Master II 5%DJ UBS Commodities Index 5%Citigroup 91-day T-bill 3%

investments sectioncomprehensive annual financial report 57
PORTFOlIO HIGHlIGHTS
Asset Allocation
The Fund’s asset allocation is the single most important determinant of achieving the stated investment goals. The Office of Investments conducts a full asset allocation study every three years to assess portfolio construction and strategy. MERS adopts and implements an asset allocation policy that is predicated on a number of factors, including:
• A projection of actuarial assets, liabilities and benefit payments, and the cost of contributions;
• Historical and expected long-term capital market risk and returns;
• Expected correlations of returns among various asset classes;
• An assessment of future economic conditions, including inflation and interest rate levels;
• Various risk/return scenarios; and
• Liquidity requirements.
Criteria for Inclusion of Asset Classes
The following criteria will be used in assessing an asset class for inclusion in the Fund:
• Sufficient size and liquidity to permit an investment by the Fund;
• Staff and consultant expertise to ensure proper due diligence and cost-effective implementation;
• The incorporation of the asset class contributes to the return enhancement and/or further diversification of the Fund’s assets; and
• Ability to readily measure performance and risk against appropriate benchmarks.
Portfolio Weighting Guidelines
• New investment strategies (asset classes or sub-asset classes) will be given:
◦ A minimum weighting of 2% of the total portfolio and a maximum weighting of 5% of the total portfolio
◦ Allocations may be increased above the 5% threshold after successful integration into the portfolio
◦ Strategies may be allocated among several managers to reduce risk
• Each manager will have a maximum allocation of 15% of the Total Fund
The Board adopted the most recent asset allocation study in July 2010. The current plan is:
Domestic Equity 34.5%International Equity 10%Fixed Income 30%High Yield 5%Real Estate 7%Private Equity 7%Commodities 5%Cash 1.5%
Tactical Asset Allocation
As the financial markets and economic conditions change, certain asset classes become more favorable than others. Therefore, it is necessary to engage in short-term, tactical deviations from the strategic allocation in order to capitalize on unusual or exceptional investment opportunities. Since the markets are so dynamic, these moves will be made very quickly in an effort to take advantage of short-term, systemic inefficiencies and broad-market trends. MERS Office of Investments feels that engaging in such tactical deviations is necessary to produce superior investment returns from a risk/return perspective.

investments sectioncomprehensive annual financial report58
Idea Generation MERS BoardDetailed StrategyResearch
Portfolio ReviewCommittee (PRC)
InvestmentCommittee (IC)
Office of Investments Review MERS Board Review
• Internal discussions• Investment managers• Third parties• Conferences• Peers
• Risk / return profile• Cost• Scale• Liquidity• Short-term or long-term horizon
• Strategy presented to PRC• Investment idea approved and sent to Investment Committee or• Further research required
• IC can request further research or• IC can approve and implement idea or deny idea or• IC can approve the idea and send to full MERS Board for approval and implementation
• Board can request further research or• Approve and implement idea or• Deny investment strategy
Rejected Idea Database(potential future applications or opportunities for use)
Ongoing StrategyMonitoring andManagement
InvestmentCommittee Review
The team is well positioned to identify appealing investment opportunities through the use of a variety of quantitative and qualitative tools. These tools include insight from existing investment managers, research databases, third-party research, and financial publications, among numerous others. There is no timetable for these tactical deviations, but they will typically have a duration of less than one year. Once the short-term opportunities have run their course, the portfolio will be rebalanced to the overall strategic asset allocation.
Investment Strategy Implementation Process

investments sectioncomprehensive annual financial report 59
INVESTMENT THEMES
As the Total Market Fund continues to evolve, several prevalent themes have emerged as guideposts for the Fund’s structure. These broad-based themes will continue to be strongly considered in our decision-making process as we look for investment opportunities to exploit them. We feel successful integration of these themes into the fund will help exceed the stated fund objectives. Naturally, new themes will emerge over time and replace existing themes.
Global Growth
Rapid economic growth in emerging markets such as China and India has created tremendous investment opportunities. Furthermore, population growth will continue to put strain on the world’s supply of critical resources. Conversely, the aging of the developed world will create other risks and opportunities. MERS has made numerous investments in an effort to diversify the portfolio and take advantage of these trends and will continue to do so. Currently there is a strong preference toward investing in the U.S. over developed Europe and prudently increasing our emerging market exposure over the medium term.
Active/Passive Mix
The Fund will exhibit a more passive approach in more efficient asset classes. Active management will continue to be utilized in less efficient areas of the market (small/micro cap, emerging markets, credit, etc.) where it has proven to be additive. A more passive approach allows for greater flexibility to invest in unique investment opportunities and reduces management fees without sacrificing returns.
Opportunistic Investing
In an effort to further diversify the portfolio and capture additional alpha, MERS Office of Investments will continue to seek out opportunistic investments. This may result in the portfolio maintaining higher cash balances during certain time periods.
Expanded Mandates
In an effort to give managers a better opportunity to deploy their skill and create alpha, the Fund will move toward expanded mandates for managers. This will result in the blurring of traditional style boxes for managers.
Mean Reversion
Mean reversion is one of the few predictable components of investing — that returns eventually move up or down toward the mean. Thus, our policies and procedures are designed to exploit mean reversion throughout all levels of the portfolio.
Private Investments
Private investments will be looked at through an opportunistic lens and will only be considered to the extent that the reward outweighs the drawbacks (illiquidity and expenses). It is recognized that with the institutionalization of alternative investments, returns will likely be compressed. An effort will be made to make more direct investments and select funds internally to reduce expenses and increase returns. Public investments will be favored all things being equal.

investments sectioncomprehensive annual financial report60
TOTAl MARKET FUND REVIEW
MERS investments generated a gross return of 11.39% for calendar year 2012 using a time-weighted rate of return based on the market rate of return of the portfolio. Performance across all asset classes varied during the year with real estate and international equities generating some of the highest returns, 13.84% and 16.12%, respectively. They were only exceeded by MERS domestic equity, which returned 18.36%.
Contribution to Total Return2012 Gross ReturnsType
Domestic Stocks 18.36% 0.53International Stocks 16.12 -0.52Fixed Income 6.02 0.78High Yield 12.69 -0.02Real Estate 13.84 0.12Private Equity 0.50 -1.15Commodities 6.87 0.29
Asset Class Performance for 2012 (gross of fees) and Contribution to Total Return
Portfolio Rebalance Policy
MERS adopted a new asset allocation effective July 2010; the Investment Guidelines have been officially amended to reflect this new asset allocation. To ensure that the portfolio remains within the asset allocation parameters established by the Board, the following rebalancing policy has been established. This policy should minimize unintended drift from MERS strategic asset allocation, allow tactical shifts to take advantage of market conditions, and ensure that adequate cash levels are maintained to meet ongoing pension fund expenses. Systematic rebalancing should reduce volatility and increase portfolio returns over the long term.
Daily Review and Optional Rebalance
In an effort to minimize tracking error at the Total Fund level, the Office of Investments works with the Clifton Group to monitor allocations and implement a policy overlay using index futures. Asset allocation levels for the following asset classes are monitored daily in relation to the predetermined variation bands, and rebalanced using the appropriate index futures:
Index FuturesVariation Band %Asset Class
Domestic Equity ± 10% S&P 500, S&P 400, or Russell 2000 IndexInternational Equity ± 20 MSCI EAFE IndexEmerging Markets Equity ± 20 MSCI EM IndexFixed Income ± 10 Barclays Capital Aggregate Bond IndexCommodities ± 20 Goldman Sachs Commodity Index
investments sectioncomprehensive annual financial report 61
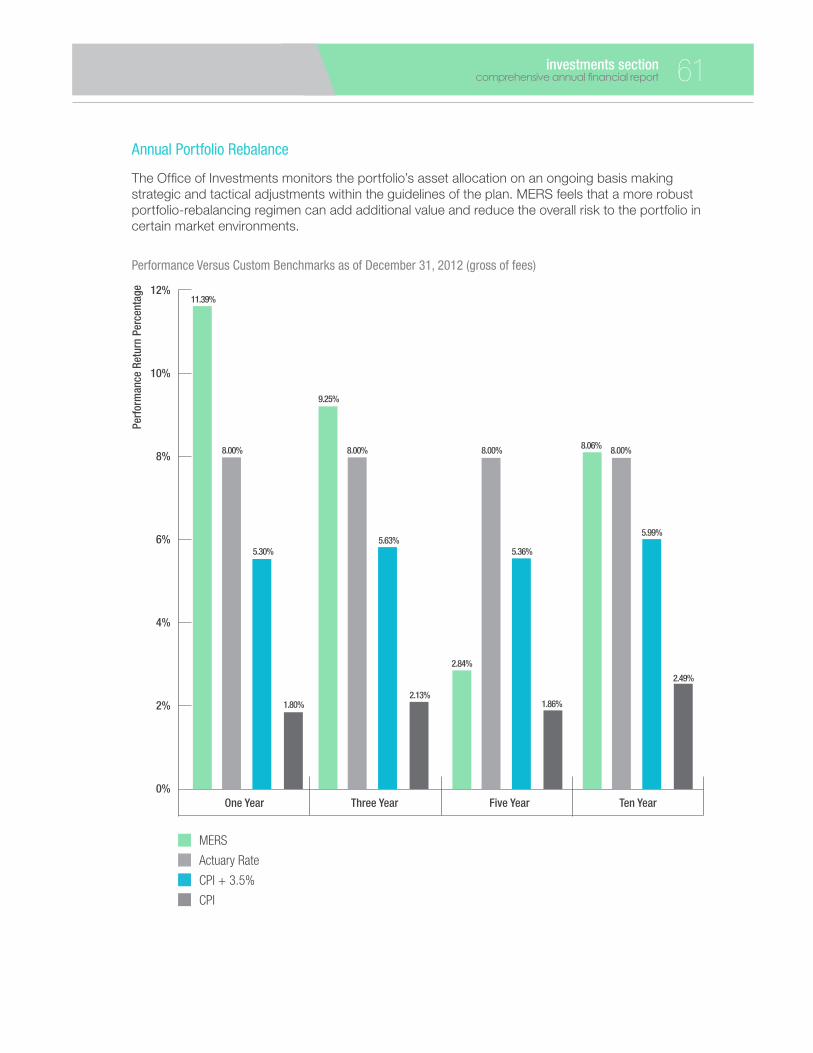
Performance Versus Custom Benchmarks as of December 31, 2012 (gross of fees)
One Year Three Year Five Year Ten Year0%
2%
4%
6%
8%
10%
12%11.39%
2.84%
1.86%
2.49%
2.13%
8.00% 8.00% 8.00% 8.00%
9.25%
5.30%5.63%
8.06%
5.99%
5.36%
1.80%
Perf
orm
ance
Ret
urn
Perc
enta
ge
MERS
Actuary Rate
CPI + 3.5%
CPI
Annual Portfolio Rebalance
The Office of Investments monitors the portfolio’s asset allocation on an ongoing basis making strategic and tactical adjustments within the guidelines of the plan. MERS feels that a more robust portfolio-rebalancing regimen can add additional value and reduce the overall risk to the portfolio in certain market environments.

investments sectioncomprehensive annual financial report62
Downside Protection Upside Participation as of December 31, 2012
40%
35%
30%
25%
20%
15%
10%
5%
0%
-5%
20 years 17 years 14 years 11 years 8 years 5 years 2 years
Upmarket Participation
Downside Protection
Barclays US Aggregate Bond Index
MERS
Russell 3000
Diversification is a portfolio strategy designed to reduce exposure to the volatility of returns by combining a variety of investments (such as stocks, bonds, real estate, and commodities) which are unlikely to all move in the same direction. The goal of diversification is to reduce the risk in a portfolio. While it is impossible to foresee all market risks, the strategic goal of the MERS asset allocation policy and the MERS Total Market Fund is to create a well-diversified portfolio that provides downside market protection with upside market participation.

investments sectioncomprehensive annual financial report 63
Current Allocation
Target Allocation
Current Asset Allocation versus Target Allocation as of December 31, 2012
0%
5%
10%
15%
20%
25%
30%
35%
40%
Domestic Equity
Fixed Income International Equity
Real Estate Private Equity
High Yield Commodities Cash Equivalents
Overlay
Allo
catio
n %
33.2%
27.2%
9.8%
6.0% 7.5%
3.6% 5.4% 6.5%
0.8%
34.5%
30.0%
10.0%
7.0% 7.0%
5.0% 5.0%
1.5% 0.0%
1 YearPortfolio Characteristics
Annualized Return (gross of fees) 11.39% 9.25% 2.84% 8.06%Annualized Standard Deviation 6.96 9.41 12.00 9.57Sharpe Ratio 1.62 0.97 0.20 0.67Excess Return -0.04 0.84 -0.18 0.38Beta 0.97 0.90 0.86 0.88Correlation to Policy Benchmark 0.98 0.99 0.99 0.99
Statistical Performance (gross of fees)
3 Year 5 Year 10 Year

investments sectioncomprehensive annual financial report64
Commission Recapture
MERS requests that all domestic equity managers direct a target of 25% of commission trades with the State Street Global Markets LLC (SSGM) for the purpose of commission recapture. Notwithstanding these instructions, brokerage transactions in the normal course of business should only be directed to this broker if in so doing the obligation to achieve best execution of the Total Market Fund’s transactions is fulfilled. The SSGM program provides a network of brokers with whom trades can be executed. MERS has the ability
to waive commission recapture participation for investment managers via their investment guidelines as certain strategies are more sensitive to trade execution (i.e. micro cap). The recapture commissions are shared based on a contractually-negotiated split of 90% MERS / 10% broker. Recapture dollars are used to offset the administrative, custodial, accounting, and performance measurement costs incurred by the fund. For 2012 $108,969 was directed by equity managers to SSGM of which $98,014 was rebated to MERS.
Securities Lending 2012 Rebates and Fees
Rebates Gross Earnings Agent Manager Fees Net Earnings
First Quarter $1,102,658 $68,773 $206,694 $827,191Second Quarter 1,192,583 139,522 210,537 842,524Third Quarter 1,416,321 140,543 255,070 1,020,708Fourth Quarter 1,494,872 159,881 266,865 1,068,126 Totals $5,206,434 $508,719 $939,166 $3,758,549
Securities Lending
MERS participates in the securities lending program at State Street Bank. Income earned from participation in the program is credited to each portfolio within 15 business days of the previous month’s end. The goal of the securities lending program is to enhance the overall income of the Plan and to help offset investment management related expenses.

investments sectioncomprehensive annual financial report 65
Investment Summary for Defined Benefit Plan, Retiree Health Funding Vehicle, Health Care Savings Program, 457 Supplemental Retirement Program and Investment Services Programs as of December 31, 2012
Type of Investment Market Value
Fixed Income Domestic and International Fixed Income $2,307,555,447
Total Fixed Income 2,307,555,447
Equities Domestic and International Stock 3,209,834,892
Total Equities 3,209,834,892
Private Equity & Commodities Private Equity 558,451,250 Commodities 396,802,951
Total Private Equity & Commodities 955,254,201
Real Estate Real Estate 444,998,480
Total Real Estate 444,998,480
Subtotal Investments 6,917,643,020
Cash EquivalentsCash Equivalents 479,384,425
Total Cash Equivalents 479,384,425
Total Investments & Cash $7,397,027,445
Note: Includes receivables and payables for sales and purchases of securities with settlement dates after December 31, 2012.
Reconciliation of Investments to Financial Statements
Total Investments from above $7,397,027,445Receivables - Sale of Investments, Interest & Dividends (913,099,495)Bonds in default (860,292)Small adjustment (2)Investments not in MERS State Street’ portfolio 291,432,099 Cash at State Street (33,659,808)Payables - Purchases of Investments 893,463,701
Investments on Financial Statements $7,634,303,648

investments sectioncomprehensive annual financial report66
EQUITY ASSET ClASS SUMMARY
As of December 31, 2012, the public equity portfolio had a market value of $3.18 billion, representing 43.0% of the Total Market Fund. Performance for the total equity portfolio was 17.88% gross of fees for the year.
MERS maintains a significant allocation to publicly traded shares of corporations around the world. Broad exposure to the public equity markets is paramount to achieving the Fund’s stated objectives and delivering the actuarial rate of return of 8%. The public equity portfolio has a target allocation of 44.5% of the total Fund. As of December 31, 2012, the portfolio includes domestic equity, international developed equity, and emerging and frontier markets equity. Exposure is achieved through portfolios diversified by geographic region, styles, sectors, and market capitalizations. Active management is used to take advantage of less efficient areas of the market while passive management is deployed in more efficient areas and used to reduce fees. Allocations are monitored in relation to asset class bands on an ongoing basis and rebalances take place if deemed appropriate. This portfolio is expected to perform well in periods of low to falling inflation and rising economic growth. It is also expected to provide ongoing income through dividend payments as well as downside protection in volatile markets. Fiscal year 2012 was relatively calm in terms of activity within the public equity portfolio. Several incremental asset allocation shifts were made throughout the year, but the portfolio remained relatively unchanged from the prior year. The following activities are noted:
• Funded an internal, active micro cap equity portfolio, and hired an emerging micro cap manager
• Microcap Equities were the highest performing segment in the equity space for the year
• Equities and active management were the primary contributors to the funds’ success
• During the year, one manager was hired and two managers were terminated.
Small Cap International 5.52%
Global Equities 10.07%
Emerging Markets 4.80%
Frontier Markets 2.49%
All Cap Domestic 1.74%
Large Cap Domestic 32.75%
Mid Cap Domestic 12.26%
Smid Cap Domestic 0.93%
Small Cap Domestic 17.51%
Micro Cap Domestic 11.94%
Equity Asset Class Summary
investments sectioncomprehensive annual financial report 67
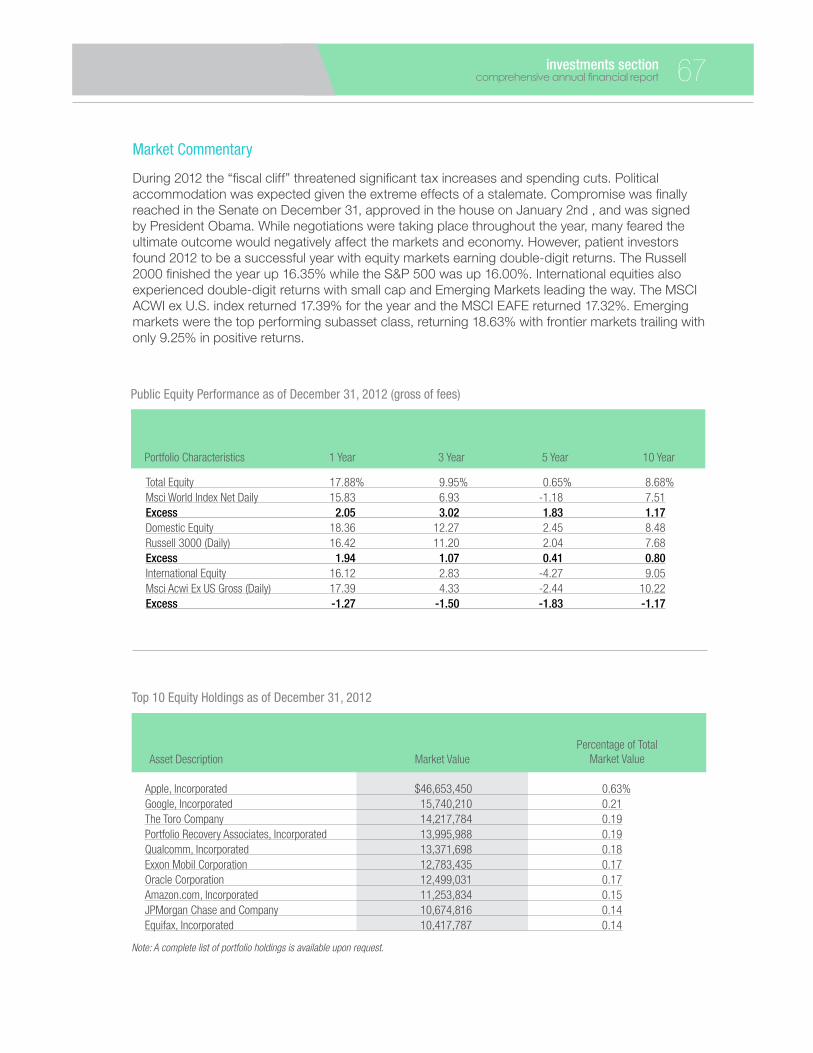
1 YearPortfolio Characteristics
Total Equity 17.88% 9.95% 0.65% 8.68%Msci World Index Net Daily 15.83 6.93 -1.18 7.51Excess 2.05 3.02 1.83 1.17Domestic Equity 18.36 12.27 2.45 8.48Russell 3000 (Daily) 16.42 11.20 2.04 7.68Excess 1.94 1.07 0.41 0.80International Equity 16.12 2.83 -4.27 9.05Msci Acwi Ex US Gross (Daily) 17.39 4.33 -2.44 10.22Excess -1.27 -1.50 -1.83 -1.17
Public Equity Performance as of December 31, 2012 (gross of fees)
3 Year 5 Year 10 Year
Top 10 Equity Holdings as of December 31, 2012
Asset Description Market Value Percentage of Total
Market Value
Apple, Incorporated $46,653,450 0.63%Google, Incorporated 15,740,210 0.21The Toro Company 14,217,784 0.19Portfolio Recovery Associates, Incorporated 13,995,988 0.19Qualcomm, Incorporated 13,371,698 0.18Exxon Mobil Corporation 12,783,435 0.17Oracle Corporation 12,499,031 0.17Amazon.com, Incorporated 11,253,834 0.15JPMorgan Chase and Company 10,674,816 0.14Equifax, Incorporated 10,417,787 0.14
Note: A complete list of portfolio holdings is available upon request.
Market Commentary
During 2012 the “fiscal cliff” threatened significant tax increases and spending cuts. Political accommodation was expected given the extreme effects of a stalemate. Compromise was finally reached in the Senate on December 31, approved in the house on January 2nd , and was signed by President Obama. While negotiations were taking place throughout the year, many feared the ultimate outcome would negatively affect the markets and economy. However, patient investors found 2012 to be a successful year with equity markets earning double-digit returns. The Russell 2000 finished the year up 16.35% while the S&P 500 was up 16.00%. International equities also experienced double-digit returns with small cap and Emerging Markets leading the way. The MSCI ACWI ex U.S. index returned 17.39% for the year and the MSCI EAFE returned 17.32%. Emerging markets were the top performing subasset class, returning 18.63% with frontier markets trailing with only 9.25% in positive returns.

investments sectioncomprehensive annual financial report68
Public Equity – Investment Managers
Style Portfolio Market Value
Blackrock Frontier Markets Enhanced Index $79,077,090 Acadian International Small Cap 175,530,597 Driehaus All-Cap Global Growth 320,127,784 Mountain Pacific Emerging Markets 51,549,438 HEXAM Emerging Markets 100,978,059 Wellington Large Cap U.S. Growth 215,961,511 Mellon Tangent Added TAA Large Cap Core/Value 384,608,827 AMBS Investment Large Cap U.S. Value 30,280,667 Punch Investments Micro Cap 89,711,145 Morgan Dempsey Micro Cap 76,746,789 Eudaimonia Micro Cap 76,022,855 Kennedy Capital Micro Cap 80,310,604 Downriver Capital Micro Cap 26,625,684 C.S. McKee Small Cap U.S. Core 191,276,804 Irving Magee Small Cap U.S. Value 167,120,758 Kennedy Capital Small Cap U.S. Value 198,232,443 Hellman Jordan All-Cap U.S. Core 55,322,543 Seizert Capital SMID Cap U.S. Value 29,477,609 Wellington Mid Cap U.S. Core 201,674,276
MERS S&P 400 S&P 400 Index 188,172,846 MERS S&P 500 S&P 500 Index 410,307,795 MERS Micro Cap Active Micro Cap 30,280,896
External Investment Manager
Investment Manager
Internal Investment Manager

investments sectioncomprehensive annual financial report 69
FIXED INCOME & HIGH YIElD ASSET ClASS SUMMARY
As of December 31, 2012, the Total Fixed Income portfolio had a market value of $2.28 billion representing 30.80% (fixed income of 27.20% and high yield of 3.60%) of the Total Market Fund. Performance for fixed income and high yield was 6.02% and 12.69% gross of fees, respectively.
Fixed Income Asset Allocation
Infrastructure 11.59%
Active Core 15.27%
Active Global 17.14%
Emerging Market Debt 14.86%
Bank Reg Capital 4.22%
Triple Net Lease 0.85%
Short Duration 12.90%
Core Plus 23.17%
Fixed Income
Fixed income is the base of the MERS Total Market Fund, providing exposure to high quality securities that provide stable cash flow and liquidity to the overall portfolio. Total fixed income assets, excluding high yield, were $2.01 billion as of December 31, 2012, and were allocated into eight strategies (see pie chart below). Fixed income provides meaningful diversification to the Total Market Fund, covering a variety of different macroeconomic environments. Core fixed income tends to perform well in times of falling economic growth and stable to falling inflation. During the year one manager was terminated and three were hired.
In mid-2012 the fixed income portfolio changed from a traditional strategy to a core and satellite approach. A core and satellite investment strategy incorporates a passive “core” component and an “active” satellite element. A core investment is the central part of a portfolio. It demands that the investment be steadily reliable throughout the year preserving capital and liquidity. Core is the foundation from which the rest of the portfolio is built. However, the satellite component is where the strategic deployment of active risk occurs, both short term and long term. The main purpose for this approach is to provide the opportunity to earn greater returns than those generated by the core portion of the portfolio.
Market Commentary
Fixed income returns were lower than equity markets for 2012, but still outpaced inflation. All sectors of the bond market produced positive returns. Corporate bonds outperformed the broader bond market by a wide margin during this period. They were more attractive than government bonds due to higher yields and the continued improvement in the health of U.S. corporations which led to capital appreciation within the asset class. Corporate profits increased in 2012 and dividend payments increased by more than 15%, reflecting healthy corporate balance sheets amidst a backdrop of slow economic growth.
Treasury yields remained depressed throughout 2012, with the 10-year reaching a record low yield of 1.38% in July 2012. The record low yield environment reflects investors favoring quality assets while fearing macroeconomic risks and slow growth.

investments sectioncomprehensive annual financial report70
Top 10 Fixed Income Holdings as of December 31, 2012
Asset Description Market Value Percentage of Total
Market Value
GNMA Pool 5.0% 9/15/2039 $24,140,815 0.33%Fannie Mae 6.0% 4/18/2036 22,267,051 0.30United States Treasury 1.25% 7/15/2020 18,338,899 0.25United States Treasury 0.5% 4/15/2015 16,864,799 0.23Fannie Mae 5.5% 4/1/2036 15,880,572 0.21Federal Farm Credit Bank 1.0% 1/17/2017 12,347,053 0.17United States Treasury 0.625% 4/15/2013 11,508,534 0.16United States Treasury 1.75% 4/15/2014 11,183,480 0.15Canada Housing Trust 3.15% 6/15/2014 11,155,228 0.15Fannie Mae 6.0% 3/1/2037 11,082,055 0.15
Note: A complete list of portfolio holdings is available upon request.
1 Year
Fixed Income 6.02% 7.35% 6.45% 6.07%BC Aggregate (Daily) 4.21 6.19 5.95 5.18Excess 1.81 1.16 0.50 0.89
Fixed Income Performance as of December 31, 2012 (gross of fees)
3 Year 5 Year 10 Year
Fixed Income – Investment Managers
StyleInvestment Manager Portfolio Market Value
Credit Suisse Infrastructure $233,474,039C.S. McKee Core Fixed Income 307,546,646First International Advisors Global Bonds 345,100,682Janus Capital Management Core Plus 466,484,642Janus Capital Management Short Duration 259,720,625Oak Street Real Estate Capital Triple Net Lease 17,171,832Orchard Global Capital Bank Regulatory Capital 84,908,437TCW Emerging Market Debt 299,294,023
External Investment Manager
Municipal bonds, while sustaining more than their share of bad news in 2012, still delivered respectable returns. While the states’ fiscal health is improving, local governments continue to face financial challenges; expenses continue to expand faster than revenues. Regardless of this issue, municipal bonds generated solid gains due to low Treasury rates and favorable supply and demand. Investors continued to take advantage of their attractive yields, driving prices higher.

investments sectioncomprehensive annual financial report 71
High YieldAsset Allocation
Active Global High Yield 92.31%
Loan Credit Fund 7.69%
High Yield
The MERS high yield allocation provides additional diversification to the Total Market Fund through allocations to domestic and global high yield, emerging markets, and inflation-protected securities. Total high yield assets as of December 31, 2012, were $264,322,552 and were allocated into two strategies (see pie chart below). The strategy employs opportunistic mandates that seek to capitalize on market inefficiencies. A blended approach is expected to deliver returns in excess of U.S. high yield benchmarks with less volatility. One manager was terminated from the high yield portfolio during 2012.
Market Commentary
High yield bonds produced strong positive performance in 2012, as the ultra-low rates on safer assets caused investors to gravitate to the more attractive income available in this area. The Bank of America Merrill Lynch U.S. High Yield Master II Constrained Index posted a positive total return of 15.58% as of December 31, 2012. High yield was also pushed by the improvement in the financial health of the underlying issuers, as seen in the rising earnings and strengthening balance sheets of U.S. corporations. Many wonder if these trends will continue into 2013
High Yield – Investment Managers
StyleInvestment Manager Portfolio Market Value
Stone Harbor High Yield/ EMD/ TIPS $243,985,238 Stone Tower Loan Credit Fund 20,337,314
External Investment Manager
1 Year
High Yield 12.69% 12.04% 5.23% 8.66%BofAml High Yield Master II (Daily) 15.58 11.60 10.01 10.39Excess -2.89 0.44 -4.78 -1.73
High Yield Performance as of December 31, 2012 (gross of fees)
3 Year 5 Year 10 Year

investments sectioncomprehensive annual financial report72
Urdang $161,580,420
Townsend $173,756,398
Hancock Timber $109,661,662
Real EstateAsset Allocation
AlTERNATIVE ASSET ClASS SUMMARY
As of December 31, 2012, the alternatives portfolio had a market value of $1.40 billion representing 18.9% (real estate of 6.00%, commodities of 5.40%, and private equity of 7.50%) of the Total Market Fund. Performance for real estate, commodities, and private equity was 13.84%, 6.87%, and 0.50%, respectively.
Real Estate
MERS real estate target allocation represents 7% of the total plan, and is diversified among private property partnerships, global real estate investment trusts (REITs), and timber partnerships. The allocation provides diversification, inflation protection, consistent income, and uncorrelated returns to the Total Market Fund.
Market Commentary
Private Property
The underlying momentum for economic growth has been moving up in recent months. The high demand for yield and the current cash flows in this asset class have contributed greatly
to the upward price movement. Commercial property markets improved in late 2012 despite uncertainty about the fiscal cliff. Construction activity remained low relative to demand across much of the commercial real estate market. However, the typical lag between the index movement and resulting construction spending indicated that construction activity will increase in the following 9 to 12 months, primarily driven by a large multifamily development pipeline. Vacancies across property types were lower through the fourth quarter of 2012. Private equity U.S. real estate transaction volume totaled approximately $275 billion in 2012. The average capitalization rate, as reported by NCREIF, was 6.84% for the year.
REITs
REITs, as measured by the FTSE NAREIT Index, continued to perform well for the year returning 18.06%. There has been an increased demand for yield in REITs which, along with present cash flows, has added significantly to the mounting price movement.
Global Real Estate delivered healthy total returns in 2012 and this trend has carried through the New Year. For 2013, improving global economic growth will facilitate further increases in real estate cash flows through higher property occupancies and in cases where occupancy has reached/will reach equilibrium, higher rents. The best performing property sectors during the last quarter were Self Storage, Health Care, Industrial, and Regional Malls. Conversely, Mixed Office and Industrial, Manufactured Home Sites, Shopping Centers and Office lagged in comparison.

investments sectioncomprehensive annual financial report 73
Timber
MERS has invested in Timber since 1995, and has looked at this portion of the portfolio to provide diversification, current income, and capital preservation through its inflation-sensitive pricing characteristics. Due to the subprime mortgage crisis and related collapse of the U.S. housing market, demand for timber has suffered in recent years. As a result, returns from the asset class have been muted since 2008, with the five-year return coming in below 1% annually. Since inception, however, MERS’ investments in timber have performed more as expected, generating an annualized return of 6.54% net of fees.
Market Commentary
The outlook for North America timber markets will be determined by the timing and strength of the recovery of U.S. residential construction, which undeniably began in the second half of 2012. A unique characteristic of timberland, however, is that it functions as both a factory and a warehouse. This gives investors in timber the flexibility of harvesting trees when timber prices are up, and delaying harvests when prices are down. So while we would expect that the steep and swift recovery in US housing markets would fuel a rebound in U.S. lumber and timber markets, the deferred harvest over the previous five years will moderate the recovery in timber prices.
Commodities
The MERS’ commodities target allocation represents 5% of the Total Market Fund. Commodities exhibit low correlations to most traditional asset classes and therefore behave differently during market cycles. Unlike stocks and bonds, commodities are expected to perform well during periods of inflation creating a natural hedge in the portfolio. Exposure to the commodity markets is obtained through an enhanced swap agreement with Cargill and cattle exposure through a new manager hire, Australian Pastoral Fund. Only one manager was terminated from the commodities allocation. The commodities portfolio was further diversified with recent direct Investments in pastoral land in Australia. This investment will further diversify the portfolio, increase the correlation benefit, and capitalize on global population growth.
Market Commentary
Commodities income at the 10 largest banks slumped 24% last year to $6 billion. The Standard & Poor’s GSCI Spot Index of raw materials climbed less than 0.3% in 2012, the worst performance in four years. Slower growth in China and below trend growth in the developed world is depressing prices. Things do not appear to be turning around for commodities in 2013. Low volatility and reduced client activity have caused a drop in commodity revenues in 2012. Increasing concerns about regulation and capital sensitivity also led banks to re-examine commodity strategies. The Dodd-Frank Act, the creation of which is being closely watched in anticipation of its completion, has already banned proprietary trading and designed rules to increase transparency in derivatives markets are among regulations. These changes and the fear of other possible restrictions have affected the processes and nature of this asset class.

investments sectioncomprehensive annual financial report74
Private Equity
MERS private equity target allocation represents 7% of the Total Market Fund and its role within the portfolio is to provide diversification from public equity investments and enhanced returns, as compensation for the higher level of risk undertaken in this asset class. Investments in private equity include U.S. and international, venture capital, buyout, and special situation funds. Private Equity returns for the calendar year 2012 underperformed its benchmark, the Russell 2000 public equity index, primarily due to the different ways that results are reported. The Russell Index is marked to market daily, as the share prices of the publicly traded equities that comprise the Index are reported daily. Private Equity investments are valued quarterly by underlying investment managers, which use their opinions of current market conditions to arrive at internal valuations as of a given reporting date. The process of looking back at quarterly results and determining value in a look-back fashion creates a reporting lag relative to public equities, which can range from 6-12 months depending on the reporting requirements of underlying investments. As a result, some of the rally in the public equity markets that occurred in the second half of 2012 has yet to be reflected in private equity valuations, which accounts for some of the relative underperformance of the asset class. It should also be noted that Private Equity is a long-term asset class and its performance is more fairly evaluated on a longer time horizon. The asset class has performed much better relative to its benchmark over longer time periods, exceeding the Russell 2000 index over the five and seven-year time periods. MERS staff expects that the portfolio of private markets investments will continue to provide long-term benefits for the Total Market Fund.
Market Commentary
Deal volume in the private equity space showed modest improvement during 2012. According to S&P Capital IQ, North American target deal volume increased 4.1% to 17,423 transactions in 2012 from 16,730 in 2011. Strategic M&A improved 4.0% to 16,213 deals in 2012 from 15,586 in 2011, while leveraged buyout volume rose 5.8% to 1,210 from 1,144 transactions. Separately, non-buyout private equity investments fell 16.4% to 2,916 from 3,487 during the same period. The dollar value of North American buyout transactions shrank 4.7% to $1.02 trillion in
2012 from $1.07 trillion in 2011. The bulk of the deal value is a result of strategic merger and acquisition transactions, which accounted for $910.6 billion in dollar value in 2012. This is a decline 7.3% from the 2001 level of $982.8 billion. The value of leveraged buyouts grew 23.4% to $112.1 billion from $90.8 billion, which is reflective the re-emergence of the mega-deal in 2012, which also grew the average deal size 16.7% to $92.6 million from $79.4 million in 2011.
investments sectioncomprehensive annual financial report 75
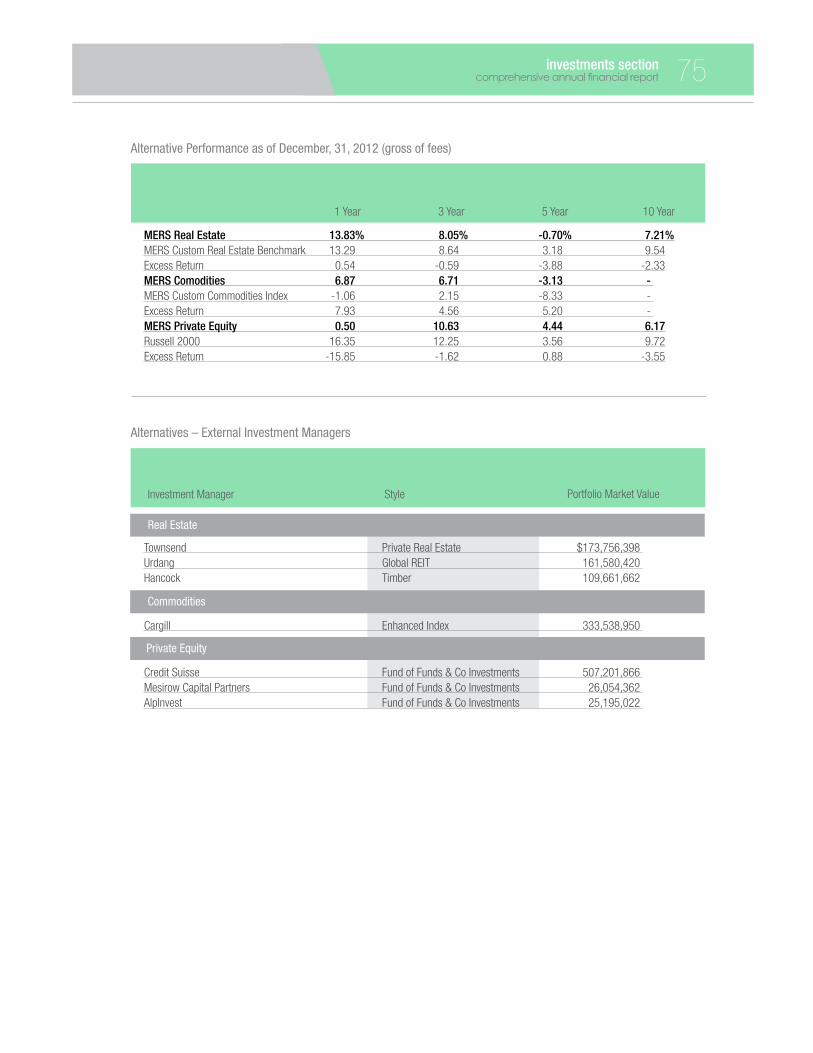
MERS Real Estate 13.83% 8.05% -0.70% 7.21%MERS Custom Real Estate Benchmark 13.29 8.64 3.18 9.54Excess Return 0.54 -0.59 -3.88 -2.33MERS Comodities 6.87 6.71 -3.13 - MERS Custom Commodities Index -1.06 2.15 -8.33 - Excess Return 7.93 4.56 5.20 - MERS Private Equity 0.50 10.63 4.44 6.17Russell 2000 16.35 12.25 3.56 9.72Excess Return -15.85 -1.62 0.88 -3.55
1 Year
Alternative Performance as of December, 31, 2012 (gross of fees)
3 Year 5 Year 10 Year
Alternatives – External Investment Managers
StyleInvestment Manager Portfolio Market Value
Townsend Private Real Estate $173,756,398 Urdang Global REIT 161,580,420 Hancock Timber 109,661,662
Cargill Enhanced Index 333,538,950
Credit Suisse Fund of Funds & Co Investments 507,201,866 Mesirow Capital Partners Fund of Funds & Co Investments 26,054,362 AlpInvest Fund of Funds & Co Investments 25,195,022
Real Estate
Commodities
Private Equity

investments sectioncomprehensive annual financial report76
Schedule of Investment Fees – as of December 31, 2012
Investment ManagersAverage Assets
Under Management Annual FeeAverage
Basis Points
Acadian Asset Management $163,485,670 $785,208 48.03AMBS Investment 29,471,075 58,908 19.99BlackRock- Core Active Bond 218,816,983 114,037 5.21BlackRock- Frontier Markets 75,219,510 547,613 72.80BRC Investment Management 67,329,273 84,211 12.51Credit Suisse Customized Infrastructure 241,473,129 1,916,856 79.38Credit Suisse Private Equity Fund 555,402,586 371,155 6.68C.S. McKee- Small Cap Core 187,410,984 824,622 44.00C.S. McKee- Fixed Income 294,941,119 445,234 15.10Downriver Capital Management 26,069,526 78,543 30.13Driehaus Global Growth 315,575,346 949,748 30.10EAM 75,945,968 761,392 100.25First International Advisors 334,381,437 769,190 23.00Hellman Jordan 35,211,025 156,032 44.31Hexam 97,006,473 679,097 70.01Irving Magee 161,451,717 909,888 56.36Janus- Core Plus 456,880,512 566,348 12.40Janus- Short Duration 280,377,661 202,675 7.23Kennedy Capital Management- Micro Cap 76,418,069 691,629 90.51Kennedy Capital Management- Small Cap Value 191,196,520 797,442 41.71Mellon Tangent Added TAA 392,806,283 667,517 16.99Morgan Dempsey 73,729,038 516,684 70.08Punch Investments 83,219,566 741,659 89.12Reams Asset Management 134,509,839 154,243 11.47Seizert Capital 27,587,330 110,349 40.00Stone Harbor 233,019,214 578,439 24.82Urdang Investment Management 150,600,712 775,805 51.51Wellington Management 210,089,084 535,182 25.47Wellington Management- Mid Cap 195,503,975 1,072,694 54.87The Townsend Group 160,457,344 247,741 15.44
Total Investment Manager Fees $5,545,586,968 $17,110,141 30.85
Investment Custodian State Street Bank and Trust 1,055,791Investment Performance Measurement Consultant State Street Bank and Trust 102,000Securities lending Agent State Street Bank and Trust 939,166
Total Investment Fees $19,207,098
INVESTMENT MANAGEMENT FEESSince management fees directly affect the returns of a manager, a best effort is made to achieve the best fee agreement possible. MERS leverages the scale of investments to negotiate deals that are at the lower end of industry standards and more than competitive with peers. While it is understood that superior managers often have higher fee structures, performance expectations and cost are carefully balanced. Fees are the only factor that one can be certain of ex ante; thus it is critical to minimize them to the extent possible. All else being equal, managers with lower fees will be favored.

investments sectioncomprehensive annual financial report 77
Instinet 22,827,339 $304,524 0.0133Cantor Fitzgerald & Company 11,610,960 262,998 0.0227State Street Bank and Trust 20,067,767 204,803 0.0102Knight Equity Markets, LP 6,398,731 114,939 0.0180Knight Direct LLC 7,152,110 93,559 0.0131Merrill Lynch, Pierce, Fenner, and Smith Inc 4,503,149 90,871 0.0202Bloomberg Tradebook, LLC 7,234,506 89,743 0.0124JonesTrading Institutional Services, LLC 3,932,811 86,375 0.0220Weeden & Company 2,922,962 77,084 0.0264Wm Smith & Company 2,058,797 65,683 0.0319Capital Institutional Services, Incorporated 2,037,451 65,508 0.0322State Street Global Markets, LLC 1,504,281 63,666 0.0423Craig-Hallum Capital Group LLC 2,552,489 58,010 0.0227Robert W. Baird and Company 1,422,340 48,535 0.0341Credit Suisse Securities 12,269,957 48,519 0.0040Raymond James and Associates Incorporated 1,497,128 44,831 0.0299Morgan Stanley and Company Incorporated 6,284,403 43,680 0.0070Cowen and Company, LLC 1,364,546 42,058 0.0308J.P. Morgan Clearing Corporation 1,232,279 35,972 0.0292Needham & Company 1,291,825 34,529 0.0267BNY Brokerage 2,445,554 34,205 0.0140Goldman Sachs & Company 3,779,314 34,083 0.0090Stifel, Nicolaus, & Company, Incorporated 1,508,693 33,093 0.0219RBC Capital Markets 1,994,984 32,847 0.0165Gilford Securities 980,930 32,603 0.0332
Subtotal (25 Largest) 130,875,306 2,042,718 0.0156
Remaining Total 92,426,194 955,221 0.0103
Total Commissions 223,301,500 $2,997,939 0.0134
Schedule of Investment Commissions as of December 31, 2012
Brokerage Firm Shares Traded Total Dollars Commission/Share

investments sectioncomprehensive annual financial report78
B. MERS INVESTMENT MENU SUMMARY FOR THE DEFINED CONTRIBUTION PlAN, HYBRID (PART II) PlAN, HEAlTH CARE SAVINGS PROGRAM, AND 457 PROGRAM
The MERS Retirement Board, together with the Office of Investments, selects the menu of investment options for the MERS Defined Contribution Plan, Hybrid Plan (Part II), Health Care Savings Program, and 457 Supplemental Retirement Program. In addition, the Board establishes and maintains investment guidelines, approves any material changes, and directs staff to help participants with investment education.
The MERS Investment Menu is simplified into four categories or “sleeves” which help streamline the participant’s selection process. For performance and fee information of individual funds, please review the MERS Investment Menu Fund and Fee Summary, which is updated on a quarterly basis and available on the MERS website at www.mersofmich.com/investments. A full description of each investment option can also be found on the MERS website.
Retirement Strategies
Retirement Strategies are also known as Target Date Funds. Each fund is a complete, diversified investment program that changes its asset mix as the participant moves toward and through retirement. Retirement Strategies are the default investment selection for the Defined Contribution Plan, Hybrid Part II, and the 457 Program.
Diversified Portfolios
Diversified Portfolios are professionally managed by MERS, and allow access to certain MERS investments. Each fund is a fully diversified portfolio with a target allocation that is rebalanced quarterly. The Diversified Portfolios include the Established Market Fund, which is the default selection for the MERS Health Care Savings Program.
Expanded Funds
Expanded Funds give experienced investors a variety of available funds from which to choose. Used in conjunction with any of the other sleeves of the MERS Investment Menu or by themselves, these funds are designed to further diversify a participant’s investment portfolio.
Self-Directed Brokerage Window
The Self-Directed Brokerage Window offers access to a broader selection of funds. Several requirements are needed to be eligible as well as a minimum account balance. The Brokerage Window is not available for the MERS Health Care Savings Program.
investments sectioncomprehensive annual financial report 79
C. MERS RETIREE HEAlTH FUNDING VEHIClE
The MERS Retirement Board and Office of Investments actively choose and monitor the fund lineup available to employers enrolled in the Retiree Health Funding Vehicle. MERS values a disciplined approach to investing and must also follow Michigan state law and established standards of diligence with strict oversight and management. The funds are professionally managed by a dedicated team of experienced investment professionals and support staff, and are responsible for monitoring all investment activity.
The funds available in the Retiree Health Funding Vehicle are:
• MERS Total Market Fund
• MERS Established Market Fund
• MERS Diversified Bond Fund
• MERS Short-Term Managed Income Fund
D. MERS INVESTMENT SERVICES PROGRAM
The Investment Services Program provides municipalities with non-membership access to the MERS Total Market Fund. Employers benefit from a professionally managed fund, economies of scale, and lower administrative fees while still maintaining local control of administration.
To view investment activity on the MERS Total Market Fund, see part A of the Investments Section.

investments sectioncomprehensive annual financial report80
THIS PAGE INTENTIONALLY LEFT BLANK