City of Philadelphia Municipal Retirement System Actuarial Valuation Report.pdf · City of...
102
, • • City of Philadelphia Municipal Retirement System July 1, 1999 Actuarial Valuation Report April2000 .
Transcript of City of Philadelphia Municipal Retirement System Actuarial Valuation Report.pdf · City of...
,
•
•
City of PhiladelphiaMunicipal Retirement System
July 1, 1999Actuarial Valuation Report
April2000 .

;
•
•
CONTENTS
Executive summary 1
Costderivation 10
Plan membership 27
Financial experience of fund 45
Major features of the Retirement System 53
Actuarial cost method, factors, and assumptions 75
Minimum municipal obligation 83
Governmental Accounting Standards Board (GASB) 94
-,
EXECUTIVE SUMMARY 1
This report presents the actuarial valuation of the costs and liabilities for the City of Phila-delphia Municipal Retirement System as of July I, 1999 for the fiscal year ending June 30,2001. This section summarizes the valuation results and discusses changes in theSystem's costs and liability arising from experience for the year ending June 3D, 1999.
On February 2, 1999 the System received $1.250 billion in proceeds from the PensionObligation Bond (P,O,B.). Our understanding of Act 205 is that the City may first reduceits obligation. as a reflection of the P.O.B., for fiscal year 2000 (covered by last year'sreport). We included additional tables in the "Minimum Municipal Obligation" section tosupport the information "O:w needed in the State of Pennsylvania's Act 205 filings,
Findings summary
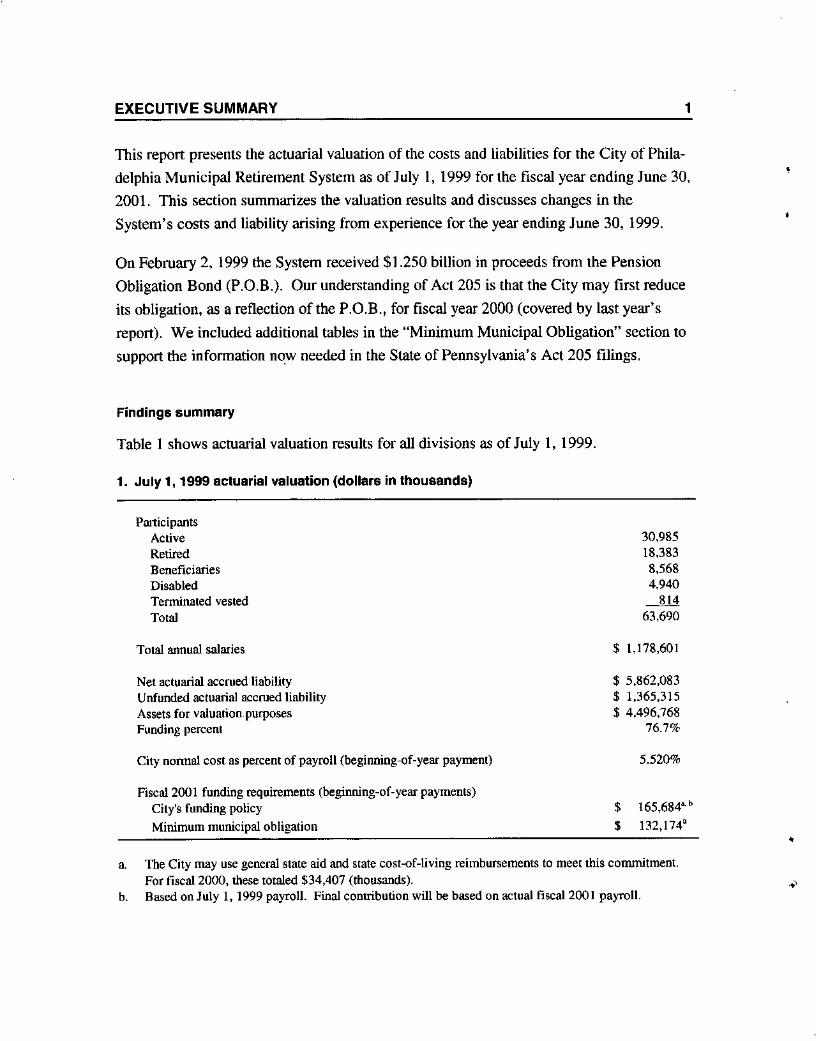
Table 1 shows actuarial valuation results for all divisions as of July 1, 1999.
1. July 1, 1999 actuarial valuation (dollars in thousands)
•
•
PwticipantsActiveRetiredBeneficiariesDisabledTenninated vestedTotal
Total annual salaries
Net actuarial accrued liabilityUnfunded actuarial accrued liabilityAssets for valuation purposesFunding percent
City nonnal cost as percent of payroll (beginning-of-year payment)
Fiscal 2001 funding requirements (beginning-of-year payments)City's funding policyMinimum municipal obligation
30,98518,3838,5684,940-ill63,690
$ 1,178,601
$ 5,862,083$ 1,365,315$ 4,496,768
76.7%
5.520%
$ 165,6840'b$ 132,174a
•a. The City may use general state aid and state cost-of-living reimbursements to meet this conurutment.
For fiscal 2000, these totaled $34,407 (thousands).b. Based on July I, 1999 payroll. Final contribution will be based on actual fiscal 2001 payroll.
EXECUTIVE SUMMARY
Normal cost
2
•
"
•
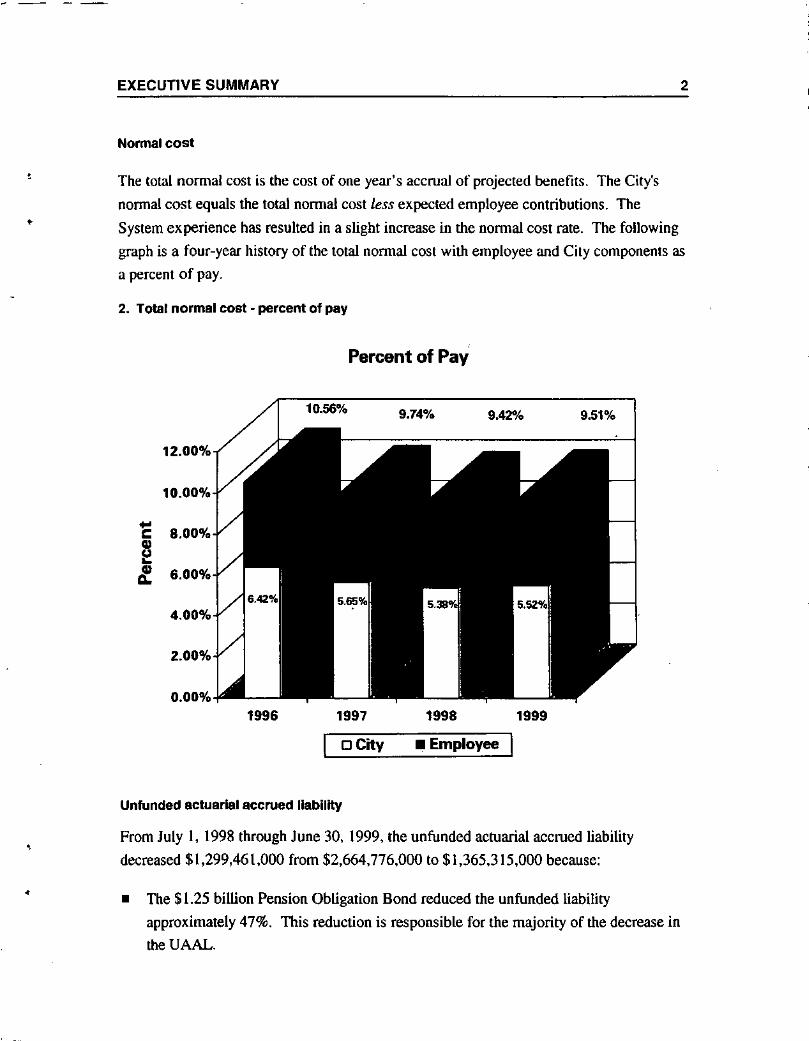
The total normal cost is the cost of one year's accrual of projected benefits. The City'snonnal cost equals the total nonnal cost less expected employee contributions. TheSystem experience has resulted in a slight increase in the normal cost rate. The followinggraph is a four-year history of the total normal cost with employee and City components asa percent of pay.
2. Total normal cost - percent of pay
Percent of Pay
10.56% 9.74% 9.42"" 9.51%
12.00%
10.00%
•• 8.000/0c••e:. 6.00%
4.00%
2.000/0
0.000/01996 1997 1998 1999
o City • Employee
Unfunded actuarial accrued liability
Prom July I, 1998 through June 30. 1999, the unfunded actuarial accrued liabilitydecreased $1,299,461,000 from $2.664,776,000 to $1,365,315,000 because:
• The $1.25 billion Pension Obligation Bond reduced the unfunded liabilityapproximately 47%. This reduction is responsible for the majority of the decrease intheUAAL.
EXECUTIVE SUMMARY
• Salary increases were Jess than anticipated, resulting in a gain.
• Investment return on an adjusted market basis was 10.0%. Because this is more thanthe assumed 9% rate, the gain reduced the unfunded actuarial accrued liability.
Offsetting the above causes for the unfunded decrease are:
3
•
• The June 30, 1985 unfunded liability. which is amortized with payments increasing5.0% per year, continues to increase the unfunded liability each year through fiscal year
2003; after then it will decrease .
• Other non-economic plan experience resulted in a net loss .
• The plan was amended during the year to include overtime for all Municipal employees.The plan also provided two ad hoc COLA payments to pensioners in pay status formore than 10 years. Both changes increased the unfunded liability.
These factors are illustrated in Table 3.
3. Unfunded liability (millions)
J 998 unfunded liability
Change due to:Plan changesPayment scheduleSalary increaseslnvestment returnOther actuarial experienceP,OBTotal of all changes
1999 unfunded liability
85.528.8(I5.1)(155.6)2004
(1,263.5)
$ 2,664.8
$ (1.299.5)
$ 1,365.3
Because the July 30, 1985 unfunded liability is being amortized with payments increasing5.0% per year, the amortization payment is scheduled to increase unlil 2019 and then dropto 7..ero. The total unfunded liability is scheduled to increase each year until fiscal yearZ003, and then decrease to zero by 2019, With the ]997 change in Act 205, once thefunding ratio reaches 70% the City may shift to a 10 year rolling level amortizationschedule. The plan is currently 76.7% funded; however, the alternative amortizationschedule will not result in lower cost to the City until fiscal year 2014.
•
•
EXECUTIVE SUMMARY
Graph 3(A) illustrates changes in the amortization payment through 2019. Graph 3(8)tracks the unfunded liability through 20t9. The bold lines indicate actual changes in theamortization payment or unfunded liability and includes scheduled increases and changesbecause of previous plan amendments, assumption changes, gains and losses and theimpact of the P.D.B. The dotted lines reflect projected changes under the 10 yearamortization schedule. In both cases, we assume no future gains or losses.
3(A). Amortization schedule
4
•
$250,000
=>.000
$150,000
$100,000
'"~~;#~~~'~~#~##~~r~~~##~
EXECUTIVE SUMMARY
3(8). Unfunded actuarial accrued liability
$3.000,000
52,500,000
$2,000,000
$1.S0o,oeo
$1,000,000
5500,000
'"~ ~ ~ ~ ~ ~ ~ ~ ~ ~ ~ ~ ~ ~ ~ ~ ~ ~ ~ ~ ~~ ~ ~ ~ ~ ~ ~ ~ ~ ~ ~ ~ ~ ~ ~ ~ ~ ~ ~ ~ ~
City funding policy
5
•
The report shows the recommended City contributions, assuming they're paid at the
beginning of the fiscal year (July 1, 2000). If paid after July 1 the City's funding policy has
been to pay interest at 9% from July 1. 2000 to the date paid.
The resulting estimated City contributions for fiscal years 2000 and 200 1 are shown in
Table 4(A). We also demonstrate the estimated City obligation reflecting the P.O.B.,
which the City can adopt for fiscal 2000.
4(A). Estimated City contributions (thousands) - beginning-of-Y8ar payment
Pre-POB Post-POBFiscal 2000 Fiscal 2000 Fiscal 2001 •
Nanna! cost $ 60,704 $ 60,704 $ 65,055'
Amortization payment 198.415 105,342 100,629 "Total City cost $ 259,119 $ 166,046 $165,684b
a. Based on July 1, 1999 payroll. Actual nonnal cost will be based on actual fiscal 2001 payrolLb. The City may use general state aid and state cost-of-living reimbursements to meet this commitment.
For fiscal 2000, they totaled $34,407 (thousands).
EXECUTIVE SUMMARY 6
,
The P.O.B.'s impact on the City's funding policy mirrors the required application of theseadditional assets in the calculation of the Minimum Municipal Obligation (MMO). Thebond proceeds are ratioed over the unfunded actuarial accrued liability at the beginning ofthe plan year in which the bonds are sold (July 1, 1998). This ratio is applied to reduce allpast service amortization bases reflecting a pro-rata retirement of these bases by theproceeds.
Table 4(B) shows July 1,2000 employee contribution rates.
4(B). Employee contribution rates effective July 1, 1999
1967 PlanPlan 87
Municipal
3.75%"2.21%
Elected
N/A
7.94%
Police
6.00%5.00%
Fire
6.00%5.00%
a. 6.00% on wages over the Social Security maximum taxable wage base - $76,200 in 2000.
Quasi agency funding
Table 4(C) shows the quasi agencies funding rate for fiscal years 2000 and 2001 and theParking Authority's additional contribution for their early retirement window. This specialamortization charge must be made through fiscal 2004.
4(C). Quasi agency funding rate
Valuation date
Normal cost rate
Amortization rate
Total, year-end rate
Total, adjusted for quarterly payments
Parking Authority special amortization payment
Annual year-end payment
Quarterly payment
a. Nanna! cost rate, page 12.b. ($63,346 - $78) .,..$529,921, see pages 16 and 12.c. .97546 (quarterly adjustment factor) x 17.382%.d. $78,000.,.. 4 x .97546.
Fiscal 2000
July I, 1998
5.109%"
2!lm%25.746%
25.114%
$78,000
$19,02Id
Fiscal 2001
July I, 1999
5.443%"
11.939%b
17.382%
16.995%C
$78,000
$19,021d
EXECUTIVE SUMMARY
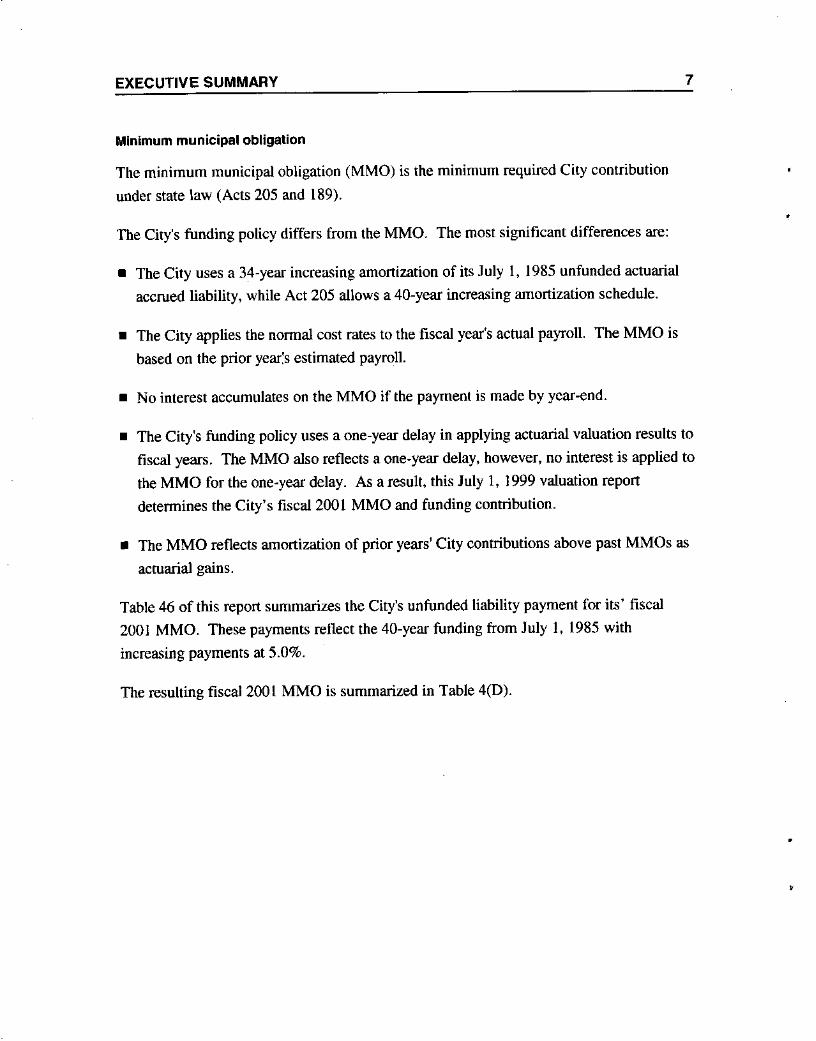
Minimum municipal obligation
The minimum municipal obligation (MMO) is the minimum required City contribution
under state law (Acts 205 and 189).
The City's funding policy differs from the MMO. The most significant differences are:
• The City uses a 34-year increasing amortization of its July 1, 1985 unfunded actuarialaccrued liability, while Act 205 allows a 40-year increasing amortization schedule .
• The City applies the nonnal cost rates to the fiscal year's actual payroll. The MMO is
based on the prior year:s estimated payroll .
• No interest accumulates on the MMO if the payment is made by year-end.
7
•
• The City's funding policy uses a one-year delay in applying actuarial valuation results tofiscal years. The MMO also reflects a one-year delay. however, no interest is applied tothe MMO for the one.year delay. As a result, this July 1, 1999 valuation reportdetennines the City's fiscal 2001 MMO and funding contribution .
• The MMO reflects amortization of prior years' City contributions above past MMOs as
actuarial gains.
Table 46 of this report summarizes the City's unfunded liability payment for its' fiscal2001 MMO. These payments relleet the 40-year funding frnm July 1, 1985 with
increasing payments at 5.0%.
The resulting fiscal 2001 MMO is summarized in Table 4(D).
•
EXECUTIVE SUMMARY
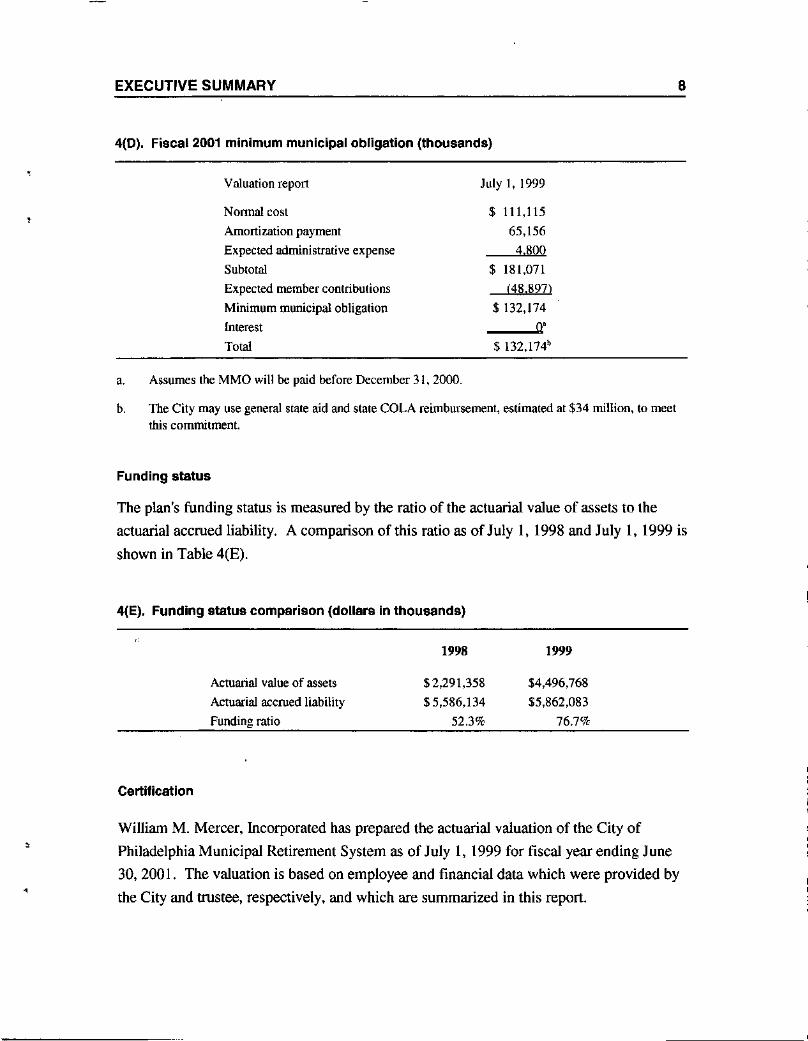
4(0). Fiscal 2001 minimum municipal obligation (thousands)
8
,Valuation report
Nonna! costAmortization paymentExpected administrative expenseSubtotalExpected member contributionsMinimum municipal obligationInterestTotal
a. Assumes the MMO will be paid before December 31, 2000.
July I, 1999
$ 111,115
65,1564,800
$ 181,071(48,897)
$ 132,1740'
$ 132,174b
b. The City may use general state aid and stale COLA reimbursement, estimated at $34 million, to meetthis commitment.
Funding status
The plan's funding status is measured by the ratio of the actuarial value of assets to theactuarial accrued liability. A comparison of tbisratio as ofJuly I, 1998 and July I, 1999 issbown in Table 4(E).
4(E). Funding status comparison (dollars in thousands)
Certification
Actuarial value of assetsActuarial accrued liabilityFunding ratio
1998
$ 2.291,358$ 5,586,134
52.3%
1999
$4,496,768
$5.862.08376.7%
, William M. Mercer, Incorporated has prepared the actuarial valuation of the City ofPhiladelphia Municipal Retirement System as of July I, t 999 for fiscal year ending June30,2001. The valuation is based on employee and financial data which were provided bythe City and trustee, respectively. and which are summarized in this report.
EXECUTIVE SUMMARY
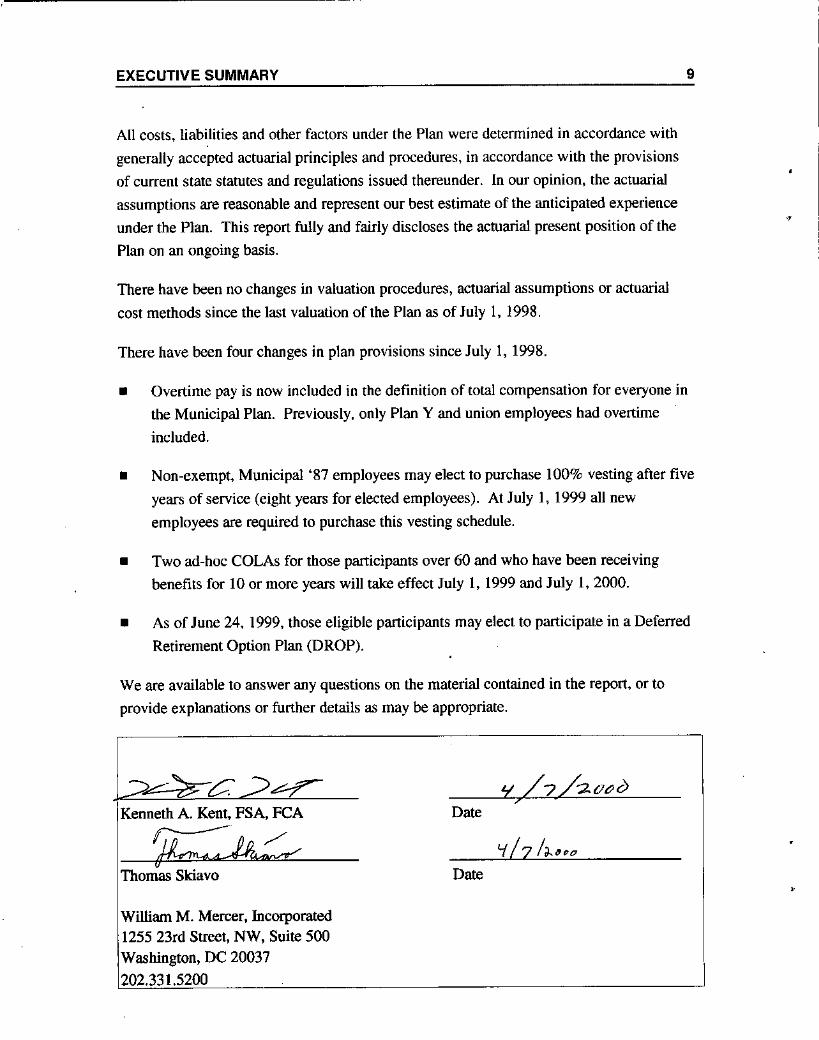
All costs. liabilities and other factors under the Plan were detennined in accordance withgenerally accepted actuarial principles and procedures, in accordance with the provisionsof current state statutes and regulations issued thereunder. In our opinion, the actuarialassumptions are reasonable and represent our best estimate of the anticipated experienceunder the Plan. This report fully and fairly discloses the actuarial present position of thePlan on an ongoing basis.
There have been no changes in valuation procedures, actuarial assumptions or actuarialcost methods since the last valuation of the Plan as of July 1, 1998.
There have been four changes in plan provisions since July 1, 1998.
9
.•
• Overtime pay is now included in the definition of total compensation for everyone inthe Municipal Plan. Previously. only Plan Y and union employees had overtimeincluded.
• Non-exempt, Municipal '87 employees may elect to purchase 100% vesting after fiveyears of service (eight years for elected employees). At July I, 1999 all newemployees are required to purchase this vesting schedule.
• Two ad-hoc COLAs for those participants over 60 and who have been receivingbenefits for 10 or more years will take effect July I, 1999 and July 1, 2000.
• As of June 24. 1999, those eligible participants may elect to participate in a DeferredRetirement Option Plan (DROP).
We are available to answer any questions on the material contained in the report, or toprovide explanations or further details as may be appropriate.
~Kenneth A. Kent. FSA, FCA
~Thomas Skiavo
William M. Mercer, Incorporated1255 23rd Street, NW, Suite 500Washington, DC 20037202.331.5200
Date
Date ,
COST DERIVATION 10
,
This section explains the Retirement System's costs. Costs are determined using the entryage actuarial cost method. The cost estimates derived in this actuarial valuation will bethe basis for determining pension costs for the fiscal year ending June 30, 2001. Pensioncosts consist of the normal cost and the unfunded liability amortization payment.
Derivation of normal cost
The normal cost is the total of the individual normal costs for all members assuming theplan always existed and the underlying actuarial assumptions are exactly realized.Benefits payable under every circumstance (retirement, death, disability, and tennination)are included in the calculations. Employee contributions expected to be made during theyear are subtracted from the lotal normal cost to determine the City's normal cost. TheCity's nonnal cost is divided by total payroll to detennine the normal cost as a percent ofpay for each division and the entire Retirement System.
Derivation of the unfunded actuarial accrued liability
The actuarial accrued liability is the total of the actuarial present value of all accumulatedpast nonnal costs assuming the normal cost had always been contributed and actuarialassumptions had been exactly realized.
The valuation assets are determined as of July 1, 1999, using an actuarial asset methodthat spreads investment experience over a five-year period to minimize the impact ofinvestment volatility on the Retirement System's costs. The method measures gains orlosses against the assumed 9% investment yield, recognizing one-fifth of the gain or lossover the current and each of the next four years.
The unfunded actuarial accrued liability is the accrued liability less the fund's assets onthe valuation date.
Experience gains and losses are the difference between the expected and actual unfundedactuarial accrued liability (see the preceding paragraphs) on the valuation date.
COST DERIVATION 11
The portion of the unfunded actuarial accrued liability attributable to the Dombrowskiclass action suit is amortized in level dollar payments over 40 years ending June 30,2009. The remaining July 1, 1985 unfunded actuarial accrued liability is amortized over34 years ending June 3D, 2019 in annual payments increasing 5.0% per year. Changes inthe actuarial accrued liability realized after July I, 1985 are amortized in level dollarpayments over the following years according to Act 205:
• Changes in actuarial assumptions - 20 years
• Experience gains and losses - 15 years
• Active members' benefit modifications - 20 years
• Nonactive members' benefit modifications -10 years.
For a detailed analysis of the derivation of plan costs, see Tables 5 through 16.
The resulting contribution reflects the City's funding policy which calls for a largercontribution than the MMO detennined under Act 205.
Table 46 shows the annual unfunded liability payments needed to satisfy the City's MMO
for fiscal year ending June 30, 2001.
Table 17 shows the annual payments needed to fund plan liabilities through fiscal year
ending June 30, 2021.
•
•
" "
COST DERIVATION 12
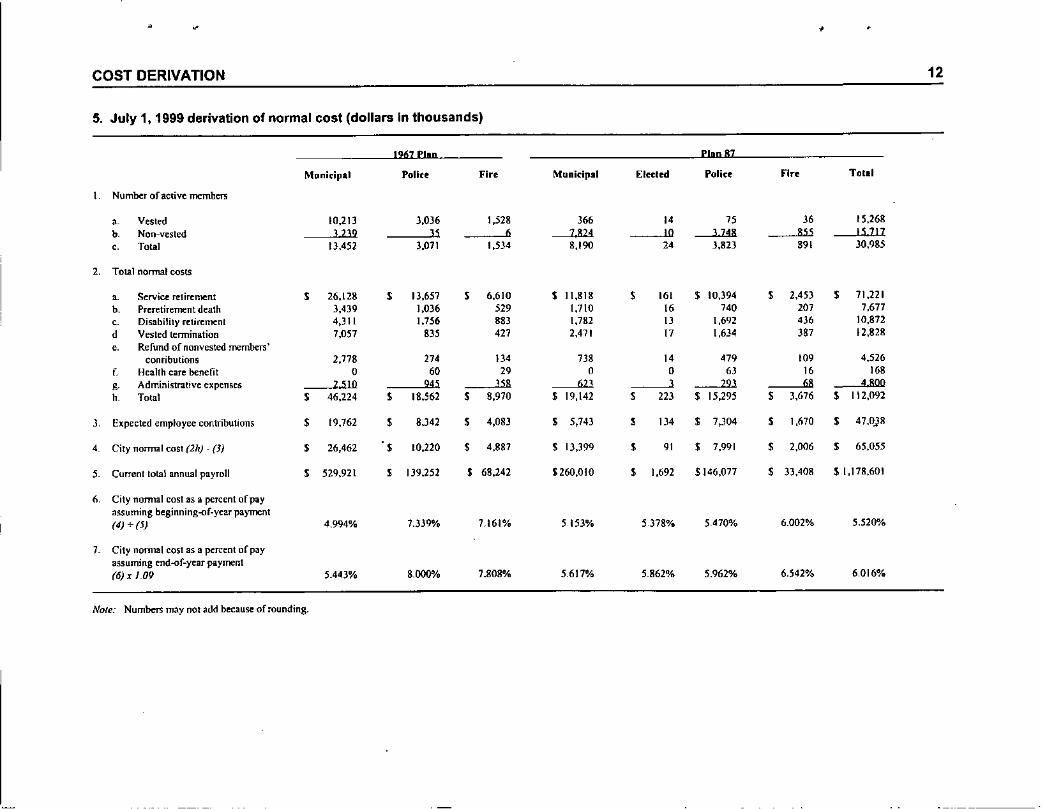
5. July 1, 1999 derivation of normal cost (dollars In thousands)
1267 Pllp Plan 87
Munitipal Polin Fire Municipal Elected Polin Fire Tolal
Num~t of active members
, Vested 10,213 3,036 1,528 366 14 75 36 15,268b Non-vested 3239 35 • 7824 10 3748 855 IS 717,. Total 13,452 3,071 1,534 8,190 24 3,823 891 30,985
2. Total normal costs
,. Service retirement $ 26,128 $ 13,657 $ 6,610 S 11,818 $ 161 $ 10,394 $ 2,453 $ 11,221
b. Preretirement death 3,439 1,0)6 529 1,710 16 740 207 7,677,. Disability retirement 4,J!l 1,756 883 1,782 I) 1,692 '" 10,872d Vested termination 7,057 835 421 2,471 17 1,634 387 12,828,. Refund of nonvested members'
conributions 2,778 214 1)4 738 14 479 109 4,526f. Health care benefit 0 60 29 0 0 63 16 168g. Administrative expenses BID 945 358 623 3 293 68 " 800
b. Tota' $ 46,224 $ 18,562 $ 8,970 $ 19,142 $ m $ 15,295 $ 3,676 $ 112,092
3. Expected employee contributions $ 19,162 $ 8,342 $ 4,083 $ 5,143 $ 134 $ 7,304 $ 1,670 $ 47,0)8
4. City normal cost (2h) -m $ 26,462 $ 10,220 $ 4,887 $ 13,399 $ 91 $ 7,991 , 2,006 $ 65,055
5 Currenllolal annual payroll $ 529,921 $ 139,252 $ 68,242 $260,010 $ 1,692 S ]46,077 $ 33,408 $ 1.178,601
6. City normal cost as a percent of payassuming beginning-of-year JllIyment(4) + (5) 4.994% 7.339% 7.161% 5153% 5.37!W. 5.470% 6.002% 5.520%
J City normal cost as a percent of payassuming end-of-year payment(6) xI.Of} 5-443% 8.000% 7.808% 5.617% 5.862% 5.962% 6.542% 6,016%
NOle: Numbers may not add because of rounding.
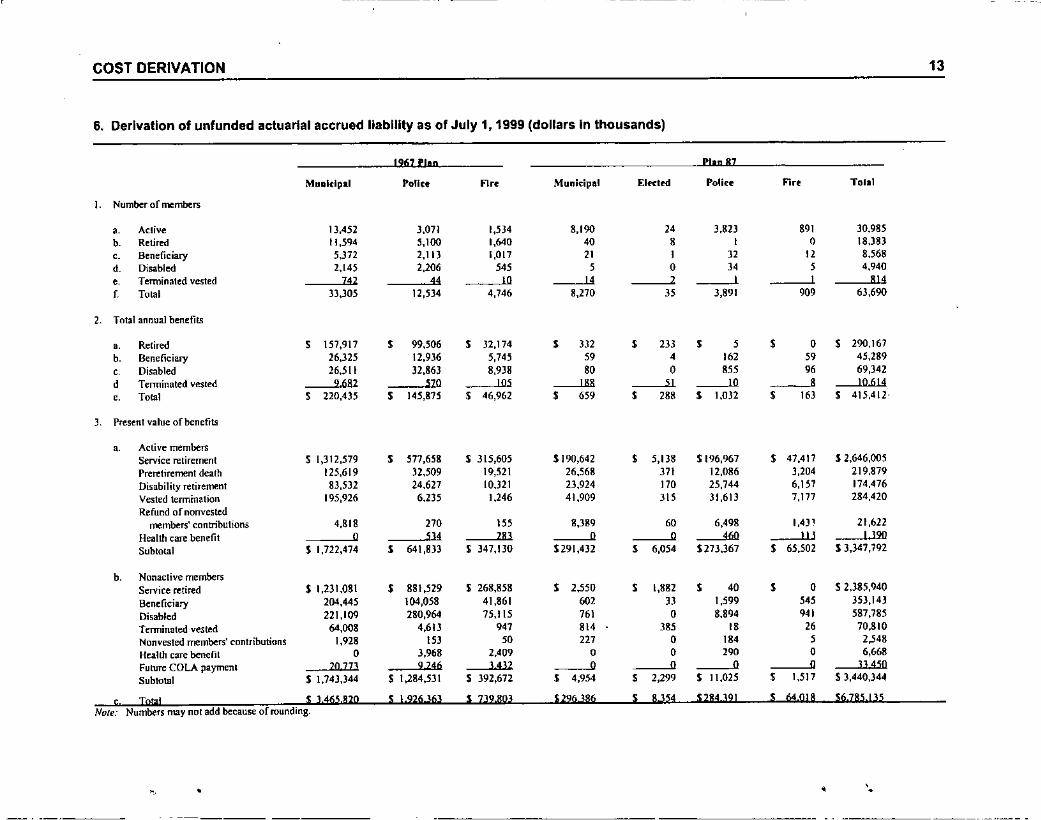
COST DERIVATION
6. Derivation of unfunded actuarial accrued liability as of July 1, 1999 (dollars In thousands)
1967 Pillo PIIP 87
Mllllltlp.1 Police F1" Municipal EIKtrd Poliu F1" Tolil
I. Number of members
,. Active 13,452 3,071 1,534 8,190 24 3,823 '" 30.985b. Retired 11,594 5,100 1,640 4' , , 0 18,383,. Beneficiary 5,372 2,11] 1,017 21 , 32 12 8,568
d Disabled 2,145 2,206 54' , • 34 , 4,940, Terminated vested 742 44 10 14 2 , , 814
f. Total 33,305 12,5)4 4,746 8,270 3S 3,891 909 63,690
,. Total annual benefits
,. Retired , 157,9\7 , 99,506 , 32,174 , JJ2 , 23J , , , 0 , 290.167b. Beneficiary 26,325 12.936 5,745 50 4 162 50 45,289, Disabled 26,511 32,86) 8,938 80 0 '" 96 69,342d Terminated vested 9682 $70 105 188 51 10 , JOll14,. Total , 220,435 , 145,875 , 46,962 , 650 , lB' , 1,032 , 163 , 415,4l2'
J Present value of benefits
,. Active rnembelSService retirement $ 1,312,579 , 517,658 $ 315,605 S 190,642 , 5,138 $196,967 , 47,417 $ 2,646,005
rreretirement death 125,619 32,509 19,521 26,568 371 12,086 3,204 219,879
Disability retirement 83,532 24,627 10,)21 23,924 110 25,744 6,157 174,476
Vested termination 195,926 6,235 1,246 41,909 3IS 31,613 7,177 284,420
Refund of non vestedmembers' contributions 4,818 270 1S5 8,389 60 6,498 1,4)1 21,622
Health care benefit 0 514 183 0 0 460 113 I ]90
Subtotal $ 1,722,474 , 641,833 $ 347,130 $291,432 , 6,054 $273,367 , 65,502 S 3,347,792
b. Nonactive membersService retired $ 1,231,081 $ 881,529 S 268,858 , 2,550 , 1,882 , 40 , 0 S 2,)85,940
Beneficiary 204,445 104,058 41,861 602 J3 1,599 ,,, 353,14)
Disabled 22\,109 280,964 75,115 761 0 8,894 94' 587,785
Terminated vested 64,008 4,613 947 '" 3" 18 26 70,810
Nonvested members' contributions 1,928 ISJ 50 m 0 184 , 2,548
Health care benefit 0 3,968 2,409 0 0 29. • 6,668
Future COLA payment 20773 9246 3412 0 Q 0 0 3J 450
Subtotal $ 1,743,344 $ 1,284,531 $ 392,672 , 4,954 , 2,299 $ 11,025 , 1,517 $ 3,440,344
c, Iota! $ 3465,820 $ 1.926,363 $ ]J9,B03 $2963B6 $ 8,354 $284 39! , 64 DI8 $6,785,135Note: Numbers may not add because of rounding.
13
" • • '.
• '" •
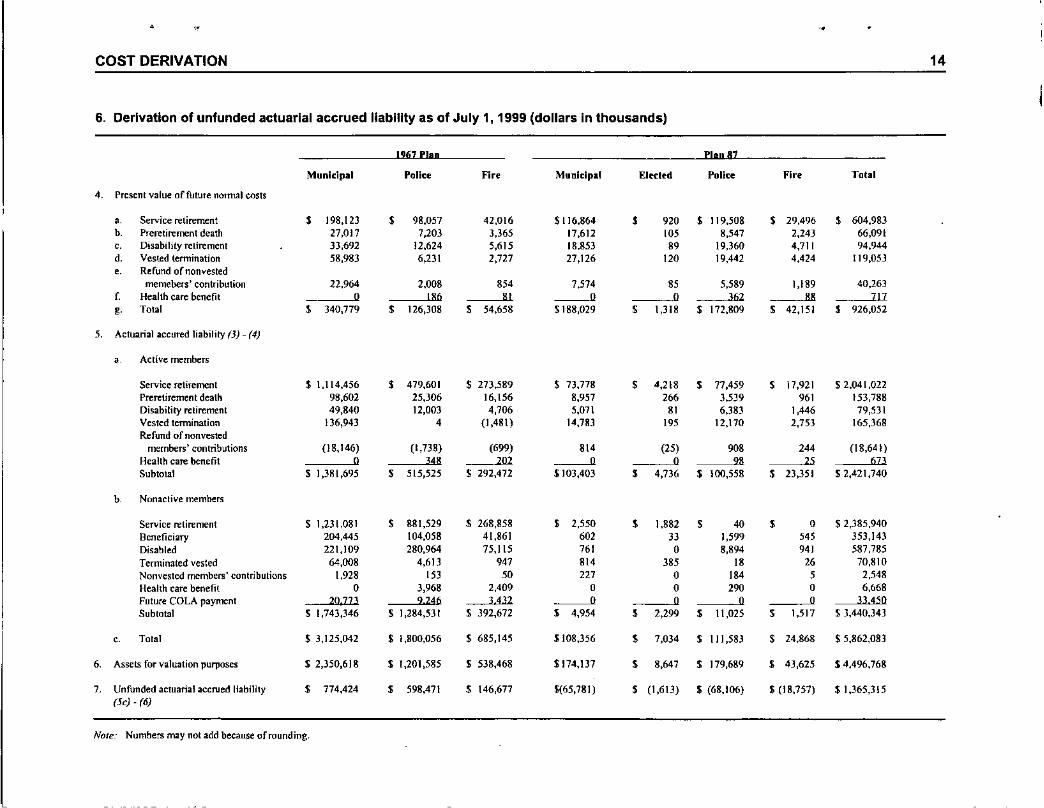
COST DERIVATION
6. Derivation of unfunded actuarial accrued liability as of July 1, 1999 (dollars in thousands)
1267 Plan Plan 87
Municipal Police Fire Municipal Elttled Police Fire To'a',. Present value of future normal costs
, Service retirement , 198,123 , 98,057 42,016 $116,864 , 920 $ 119,508 , 29,496 • 604,983b. Preretirement death 27,017 7,203 3,365 17,612 105 8,547 2,143 66,091,. Disability retirement 33,692 12,624 5,615 18.853 89 19,360 4,711 94,944d. Vested termination 58,983 6,231 2,727 21,126 120 19,442 4,424 119,053.. Refund ornonvesled
memebers' contribution 22,964 2,008 854 7,514 85 5,589 1,189 40,263f. Health care benefit 0 186 81 0 0 362 88 717
8. Total • 340,779 • 126,308 • 54,658 S 188,029 • \,318 $ 172,809 • 42,151 , 926,052
5. Actuarial accured liability (3) - (4)
, Active members
Service retirement S 1,114,456 , 479,601 $ 273,589 S 73,778 • 4,218 • 77,459 • 17,921 $ 2,04 t ,022Preretirement death 98,602 25,306 16,156 8,957 266 3,539 961 153,788Disability retirement 49,840 12,003 4,706 5,071 81 6,383 1,446 79,531Vested termination l36,943 , (1,481) 14,783 195 12,170 2,753 165,368Refund of non vested
members' contributions (18,146) (1,738) (699) 81' (25) 908 24' (18,641)Health care benefit 0 348 202 0 0 98 25 673Subtotal $ 1,381,695 • 515,525 S 292,472 S 103,403 , 4,736 $ 100,558 • 23,351 $ 2,421,740
b Nonactive members
Service retirement $ 1,231,081 • 881,529 $ 268,858 • 2,550 , 1,882 • '0 , 0 $ 2,385,940Beneficiary 204,445 104,058 41,861 602 J3 1,599 545 353,143Disabled 221,109 280,964 75,115 761 0 8,894 941 587,785Terminated vested 64,008 4,613 947 81' 385 I' 26 70,810Nonvested members' contributions 1,928 153 SO 227 0 I" 5 2,548Health care benefit 0 3,968 2,409 0 0 290 0 6,668Future COLA payment 20,77J 9246 3432 0 0 0 0 33 450Subtotal $ 1,743,346 S 1,284,531 S 392,672 , 4,954 • 2,299 , 11,025 • 1,517 S 3,440,343
, Total $ 3,125,042 S 1,800,056 S 685,145 1108,356 • 7,034 $ 111,583 • 24,868 S 5,862,083
6. Assets for valuation purposes $ 2,350,618 $ 1,201,585 $ 538,468 S 174,137 • 8,647 $ 179,689 , 43,625 S 4,496,768
7. Unfunded actuarial accrued liability , 774,424 , 598,471 $ 146,677 $(65,781) , (1,613) $ (68,106) $ (18,757) S 1,365,315(5c) - (6)
Note: Numbers may not add because of rounding.
14
COST DERIVATION
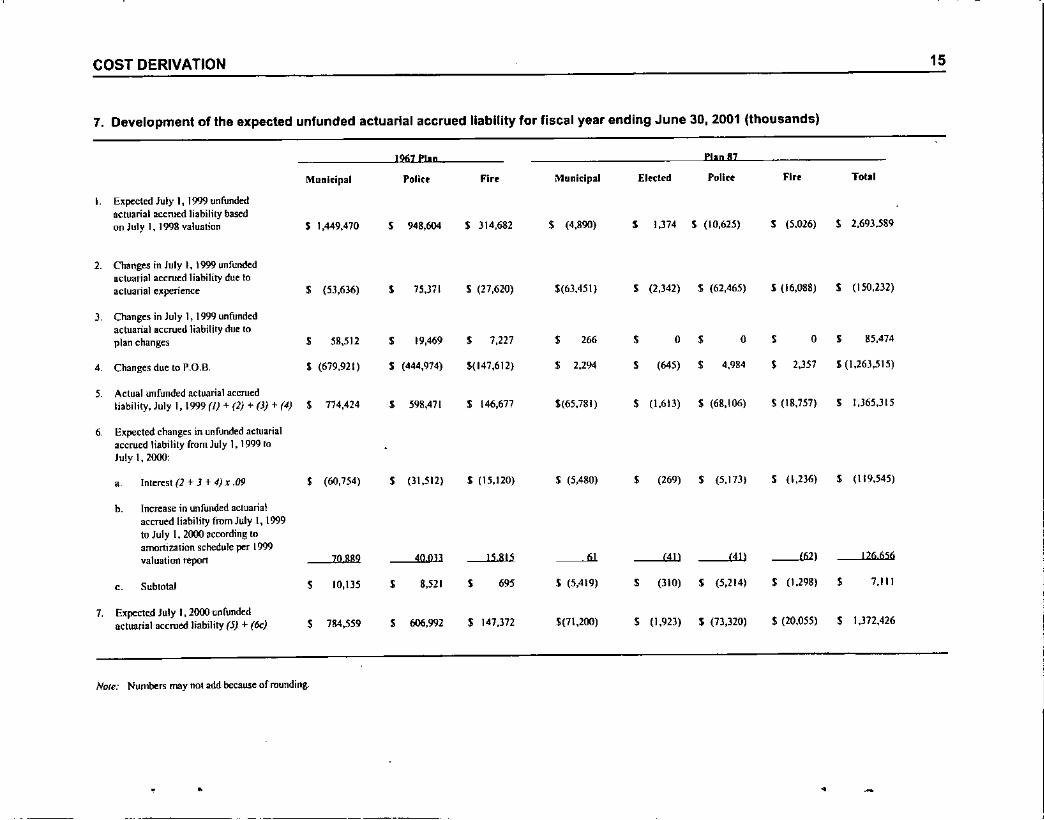
7. Development of the expected unfunded actuarial accrued liability for fiscal year ending June 3D, 2001 (thousands)
1967 PI.n Plan 87
Monkipal Polit! Fire Municipal EI«tl'd Polict Fire Total
I Expected July 1, 1999 unfundedactuarial accrued liability basedon July 1, 1998 valuation $ 1,449,470 S 948,604 $ 3]4,682 S (4,890) S 1.374 S (10,625) S (5,026) S 2,693,589
2. Changes in July I, 1999 unfu~dactuarial accrued liability due 10actuarial ellperience S (53,636) S 75,311 $ (27,620) $(63,451) S (2,342) S (62,465) S (l6.O88) S (150,232)
) Changes in July 1, 1999 unfundedactuarial accrued liability due toplan changes S SS,512 S 19,469 S 7,227 S 266 S 0 S 0 S 0 S 85,474
4. Changes due to P.O.B. $ (679,921) S (444,974) $(147,612) S 2,294 S (645) S 4,984 • 2,357 $ (1,263,515)
5 Actua! unfunded actuarial accruedliability, July I, 1999 (I) + (2) + (J) + (4) S 774,424 S 598,471 $ 146,677 $(65,781) S (1,613) $ (68,106) S (18,757) • 1,365,315
6. Expected changes in unfunded actuarialaccrued liability from July I, 1999 toJuly I, 2000:
, Interest (2 + 3 + 4) x.09 • (60,754) S (31,512) $ (15,120) $ (5,480) S (269) S (5,17J) S (1,236) S (119,545)
b. Increase in unfunded actuarialaccrued [iability from July I, 1999to July I, 2000 according toamortization s~hedule per 1999valuation report 70 SS9 40013 IS 815 61 <41l (41) (62) [26656
o. Subtotal S 10,135 S 8,521 S 695 S (5,419) 5 (310) S (5,214) $ (1,298) S 7,111
7. Expected July 1,2000 unfundedactuarial accrued liability (5) + (oc) S 784,559 S 606,992 S 147,372 $(71,200) S (1,923) S (73,320) S (20,055) S 1,372,426
Note: Numbers may nol add because of rounding.
15
• •
•
COST DERIVATION
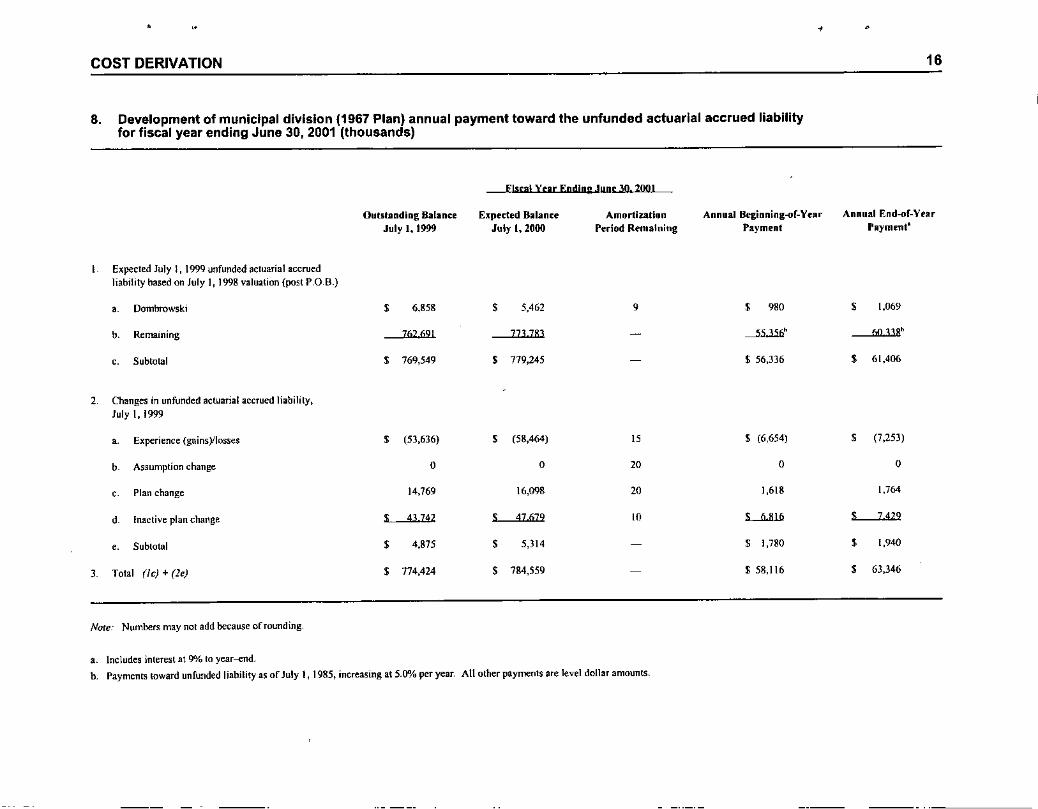
8. Development of municipal division (1967 Plan) annual payment toward the unfunded actuarial accrued liabilityfor fiscal year ending June 3D, 2001 (thousands)
Fiscal Year Ending ,!lIne 30. 20111
•16
Outstanding BalanceJuly 1,1999
Expeded BllianeeJuly 1,2000
AmortilJltionPeriod Remaining
Annual Beginning-of-Yt'arPayment
Annual End-of-YtllrPayment'
Expected July l, 1999 unfunded actuarial accruedliability based on July I, 1995 valuation (post P,OR)
• Dombrowski $ 6,858 $ 5,462 9 $ 980 $ 1,069
b Remaining 762691 773783 - --'.\..lli" hlU38"
,. Subtotal $ 769,549 $ 779,245 $ 56,336 $ 61,406
2. Changes in unfunded actuarial accrued liability,July I, 1999
• Experience (gainsYlosses $ (53,636) $ (58,464) IS $ (6,654) $ (7,253)
b Assumption change 0 0 20 0 0
, Plan change 14,769 16,098 20 1,618 1,764
d Inactive plan change , 43742 , 47679 10 ~ , 7429
.. Subtotal $ 4,875 $ 5,314 $ 1,780 $ 1,940
) Total (Ie) + (le) $ 774,424 $ 784,559 $ 58,116 $ 63,346
Nore: Numbers may not add because of rounding.
a. Includes interest at 9% to year--end.
b. Payments toward unfunded liability as of July I, 1985, increasing at 5.0"10per year. An other payments are level dollar amounts.
COST DERIVATION
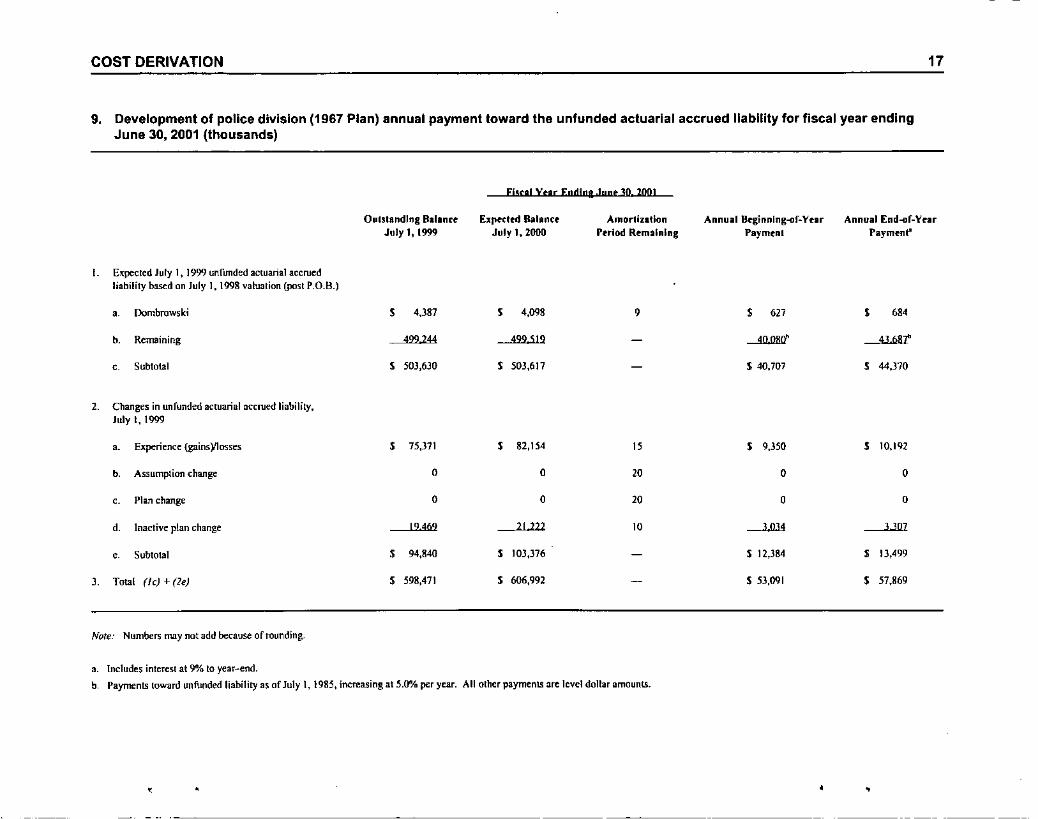
9. Development of police division (1967 Plan) annual payment toward the unfunded actuarial accrued liability for fiscal year endingJune 3D, 2001 (thousands)
17
Fisu! vue Egdlns.!!!"!! 30. 2001
OutstandIng Ballntt EJfI«ttit Ballnte AmorllZlllon Annual Brginnlng-of-Yflr Annual End-of-YnrJuly I, 1999 July I. 2000 Pttlod Remaining Payment Payment"
L E~pecled July 1, 1999 unfunded actuarial accruedliability based on July I, 1998 valuation (post P.O.B.)
• Dombrowski , 4,387 , 4,098 , , 627 • '"b. Remaining 499244 499519 - ---"'JlBJl" 4368t
, Subtotal , 503,630 S 503,611 - S 40,707 , 44,370
2. Changes in unfunded actuarial accrued liability,July I, 1999
.. Experience {gains)/losses , 75,371 , 82,154 " • 9,350 , 10,192
b. Assumption change 0 0 20 0 0
,. Plan change 0 0 20 0 0
d. Inactive plan change 19469 21 222 10 -'Jll< 3307
, Subtotal , 94,840 , 103,376 - $ 12,384 , 13,499
]. Total (Ie) + (le) , 598,471 $ 606,992 - $ 53,091 , 57,869
Note: Numbers may not add beeause of rounding.
a. Includes interest at 9% to year-end.
b, Payments toward unfunded liability as of July I, 1985, increasing at 5.0"/0 per year. All other payments are level dollar amounts.
• •, .
,
COST DERIVATION
•
18
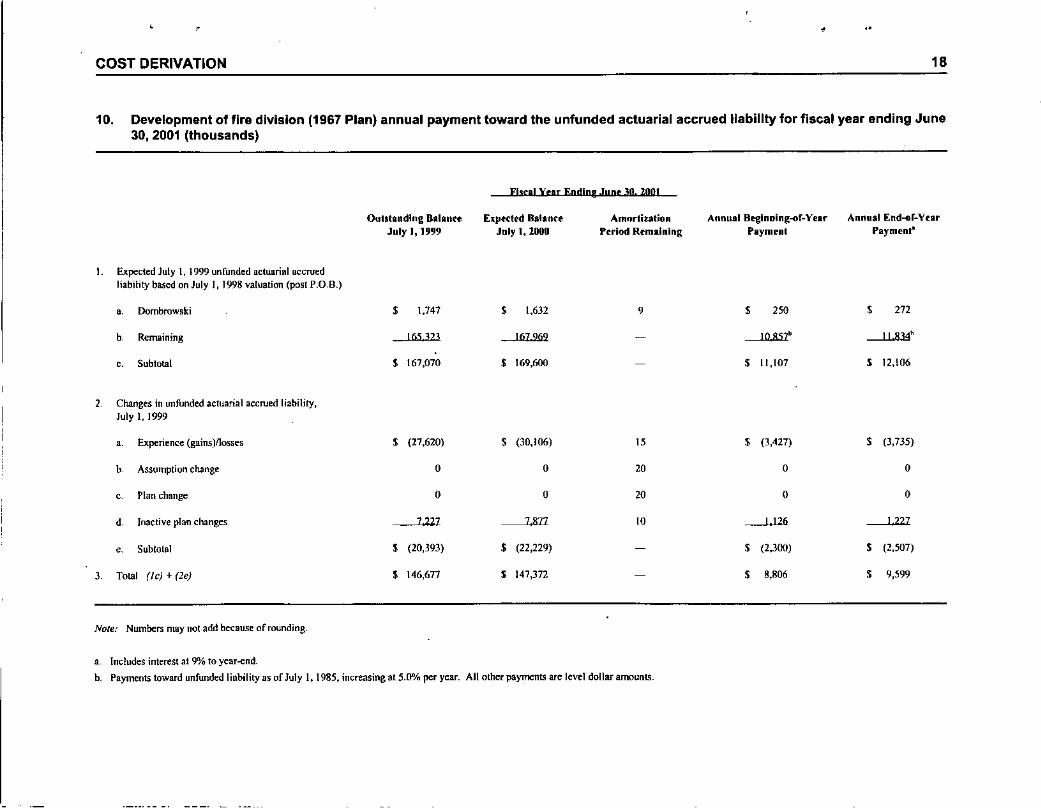
10. Development of fire division (1967 Plan) annual payment toward the unfunded actuarial accrued liability for fiscal year ending June30,2001 (thousands)
Fiscal VCar Ending JUDe 3D.2001
Outstanding Balanu Expected Balance Amnrtiution Annual Beginoing-of-Year Annual [nd-or-YcarJuly I, 19'.19 July I, 1000 Period Remaining Payment Payment'
I. Expected July I, 1999 unfunded actuarial accruedliability based on July I, 1998 valuation (post P.O. B.)
• Dombrowski $ 1,747 $ 1,632 9 $ 250 $ 272
b. Remaining 165 323 167969 - 10851" I! 834'
o. Subtotal $ 167,070 $ 169,600 $ I t,107 , 12,106
1 Changes in unfunded actuarial accrued liability,July I, 1999
.. Experience (gains )Ilosses $ (27,620) $ (30,106) 15 $ (3,427) $ (3,735)
b Assumption change 0 0 10 0 0
0 Plan change 0 0 10 0 0
d Inactive plan changes 7227 7871 10 I 126 1.227
0 Subtolal $ (20,393) , (22,229) $ (2,300) $ (2,507)
3 Total (Ie) + (2e) $ 146,671 , 147,372 $ 8,806 $ 9,599
Note: Numbers may not add because of rounding.
a. Includes interest al 9% to year-end.
b. Payments toward unfunded liability as of July I, 1985, increasing at 5.0"A. per year. All other payments are level dollar amounts.
COST DERIVATION 19
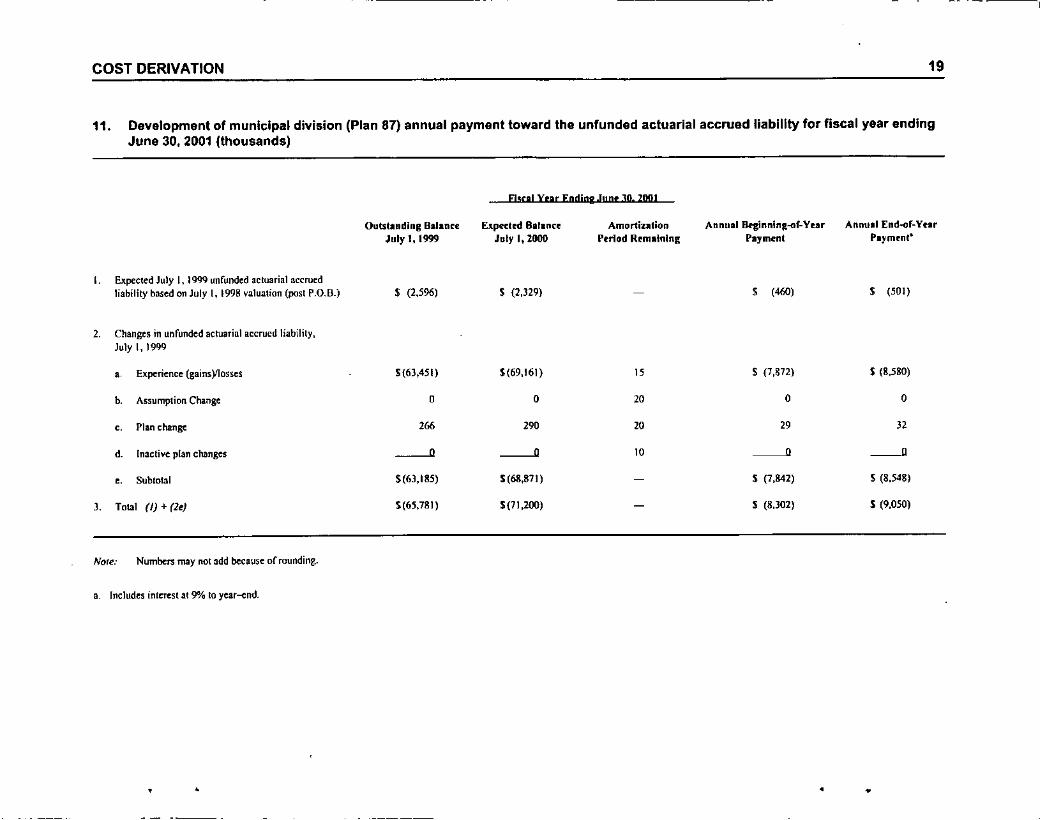
11. Development of municipal division (Plan 87) annual payment toward the unfunded actuarial accrued liability for fiscal year endingJune 3D, 2001 (thousands)
Fill"! Yur End!", Jun, 3D.Zool
Outstanding BalanreJuly I, 1m
Expec:trd BlranceJuly 1,2000
AmortizationPeriod Remaining
Annual8foginninR-of-YurPayment
Annual [ndoOr-YearPayment"
I. Expected July I, 1999 unfunded acluarial accruedliability based on July I, 1998 ~alualion (post P.O,[l-) $ (2,596) $ (2,J29) $ ("") $ (SOl)
2. Changes in unfunded actuarial accrued liability,July I, 1999
• Experience (gains)llosses $(63,451) $(69,161) 15 $ (7,872) S (8,580)
b. Assumption Change 0 0 20 0 0
,. Plan change 266 290 20 29 J2
d. Inactive plan changes ----' ----' 10 ----' -".. Subtotal $(63,185) 5(68,871) S (7,&42) S (8,548)
3. Total (I) + (le) 5(65,781) 5(71,200) - 5 (8,302) 5 (9,050)
Nore: Numbers may IIQtadd because or rounding.
a. Includes inlereSI at 9% 10year-end.
• • • •
COST DERIVATION
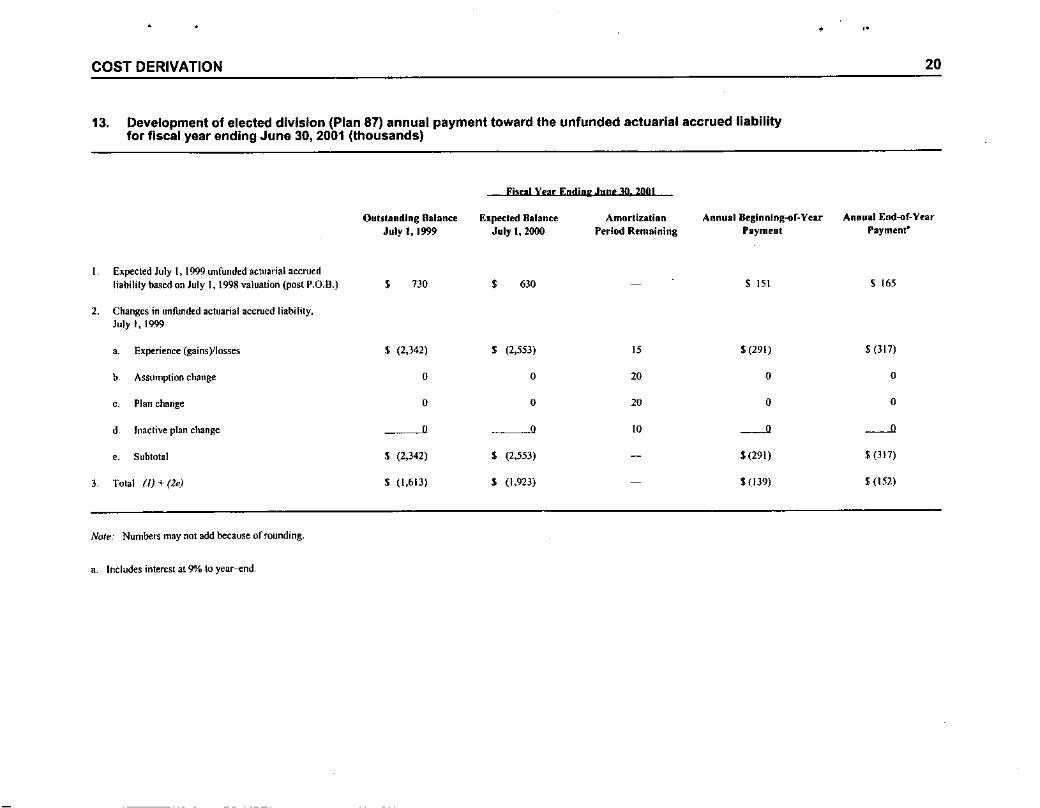
13. Development of elected division (Plan 87) annual payment toward the unfunded actuarial accrued liabilityfor fiscal year ending June 30, 2001 (thousands)
• ,.
20
Fiscal Year Ending June]Q 2001
Outstanding Balance ["peeled Balance Amortization Annual8eginnlng-of-Year Annual End-of-YearJuly 1,1999 July t, 2000 Period Remaining PlIymenl Payment'
[ Expected July I, 1999 unfunded actuarial accruedliability based on July 1, 1998 valuation (post P.O.B.) , 730 , 630 $ lSI .$ 165
2. Changes in unfunded actuarial accrued liability,July I, \999
,. Experience (gains)/Iosses $ (2,342) .$ (2,553) IS .$ (291) .$ (317)
b Assumption change 0 0 20 0 0
,. Plan change 0 0 20 0 0
d Inactive plan change 0 0 10 --" --".. Subtotal .$ (2,342) .$ (2,553) - $(291) .$ (J 11)
3. Total (I) + (2e) .$ (1,613) .$ (1,923) $(139) .$ (152)
Nole: Numbers may nol add because of rounding.
a. Includes inlerest at 9"10 10 year--elld.
COST DERIVATION
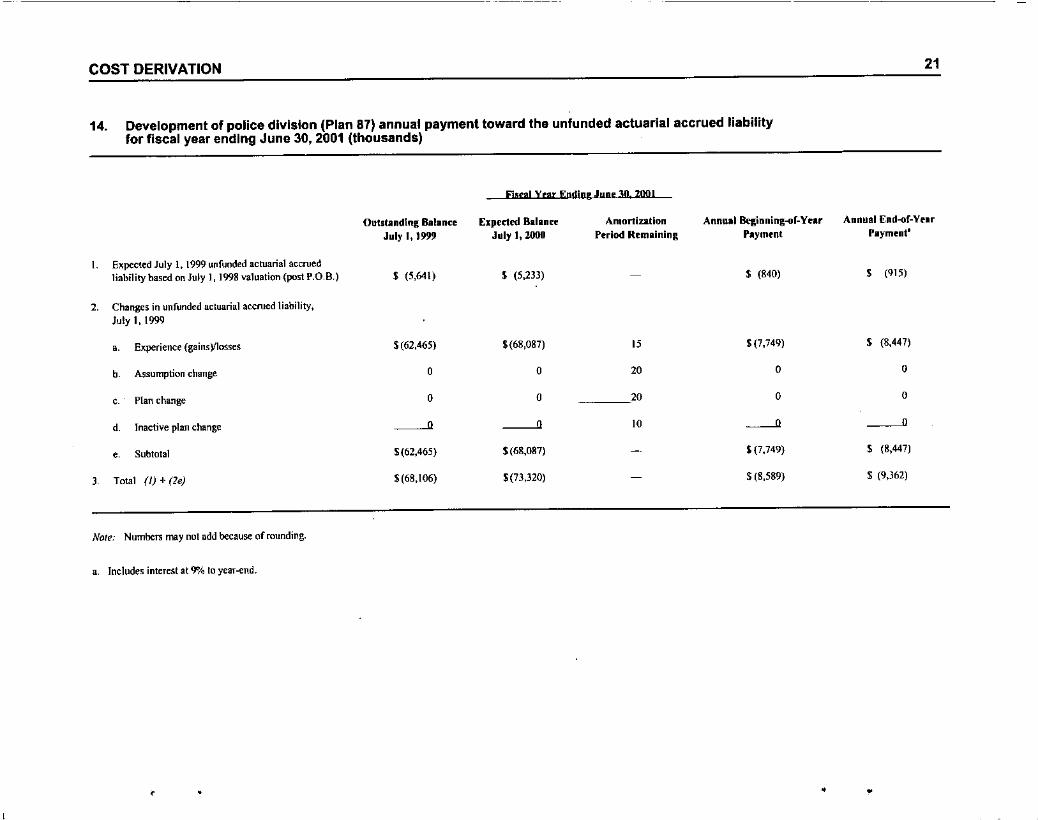
14. Development of police division (Plan 87) annual payment toward the unfunded actuarial accrued liabilityfor fiscal year ending June 3D, 2001 (thousands)
21
Fiscal Year End;ng JUDe 30 200!
Outstanding Balance Exptded Ballncr Amortization Annulllk'ginning-of-Ytar Annual End-of-YeuJuly 1, 1999 July 1,:WOO Period Remaining Payment Pllyment'
L Ellpected July I, 1999 unfunded actuarial accruedliability based on July I, 1998 valuation (posl P.O,R) $ (5,641) $ (5,233) S (840) , (915)
2. Changes in unfunded actuarial accrued liability,July 1, 1999
.. Experience (gains)/losses $(62,465) $(68,087) 15 $(7,749) $ (8,447)
b Assumption change 0 0 20 0 0
, Plan change 0 0 20 0 0
d. Inactive plan change ~ ~ 10 ----" ----", Subtotal $(62,465) $(68,087) - $ (7,749) S (8,447)
) Total (J) + (le) $(68,106) $(73,320) $ (8,589) $ (9,362)
NOll': Numbers may not add because of rounding.
a. Includes interest at 9"10 to year-end.
, • •
COST DERIVATION
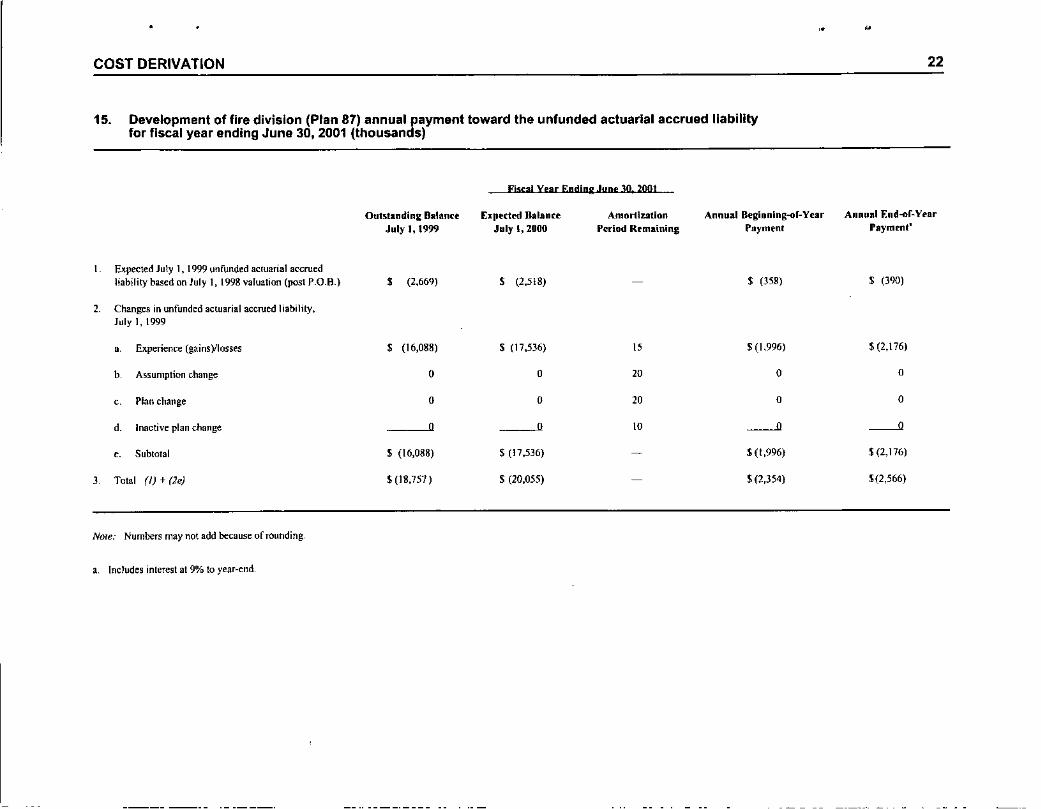
15. Development of fire division (Plan 87) annual payment toward the unfunded actuarial accrued liabilityfor fiscal year ending June 30, 2001 (thousands)
,. •
22
Fiscal Year Ending JUDI' 30. 2001
Outstanding Balaott ["puted Ralan~e Amortization Annual Beginnlng-llf-Year Annual End-nf-Year
July I, 1999 July 1,2000 Period Remaining Payment Payment'
Expected July 1, 1999 unfunded actuarial accruedliability based on july I, 1998 valuation (post P_O_B.) • (2,669) • (2,518) $ (358) $ (390)
2, Changes ill unfunded actuarial accrued liahility,July I, 1999
• Experience (gains)llosses • (16,088) $ (17,536) 15 $ (1,996) $ (2,176)
b, Assumption change 0 0 20 0 0
, Plan change 0 0 20 0 0
d, Inactive plan change 0 0 10 --'l --'l
" Subtotal $ (\6,088) $ (17,536) ~ $(1,996) 5{2,176)
3, Total (I) + (2e) $(18,757) $ (20,055) $ (2,354) $(2,566)
Nore.- Numbers may not add because of rounding.
a, Includes interest at 9"/010 year-end,
COST DERIVATION
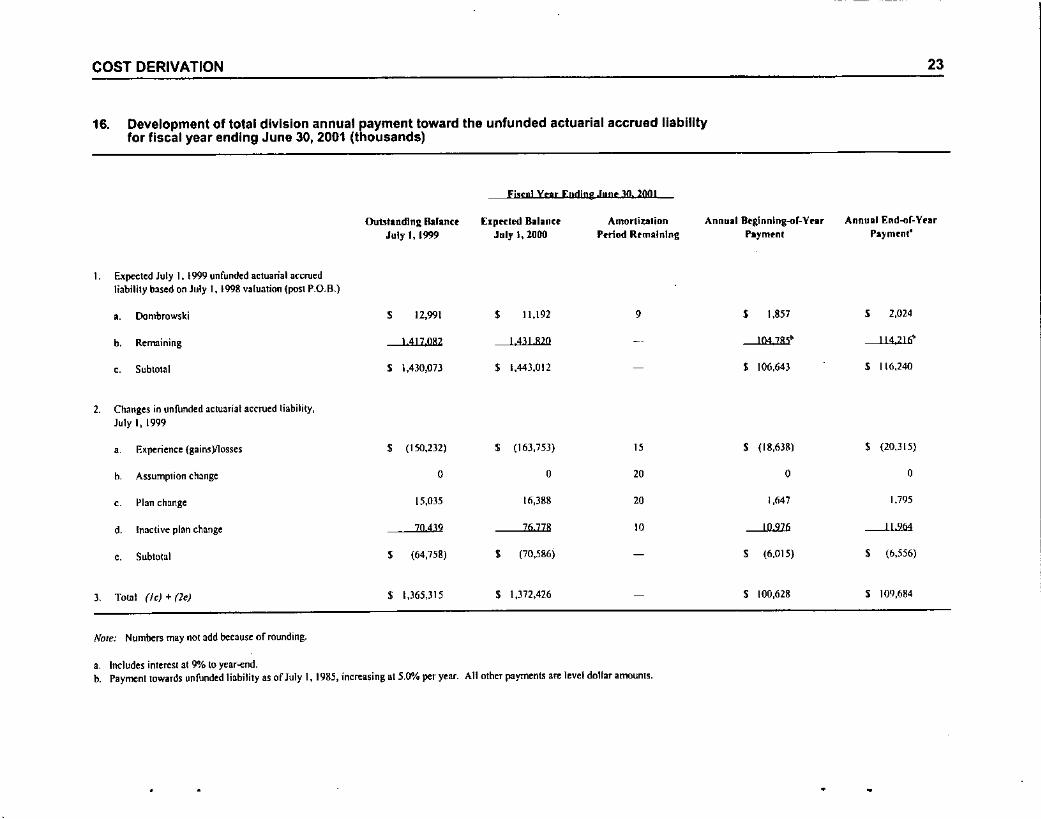
16. Development of total division annual payment toward the unfunded actuarial accrued liabilityfor fiscal year ending June 30, 2001 (thousands)
Fj!lrg! vru [ndlng .Innt 30. 2001
23
Outstanding BalanctJuly 1, 1999
Elptded B,lal1ceJuly I, 2000
AmortiUlionPeriod Remaining
AnnUli Btglnnlng-of-YurPayment
Annuml End-of-VnrParm"nt'
1. Expe1:ted July 1. 1999 unfumled actuarial accruedliability based on July 1, 1998 va(uatioo (post r.O.B.)
.. Dombrowski , 12,991 S 11,192 9 S 1,857 S 2,024
b. Remaining 1.417.082 1.431..8lO _. J04185~ J 14 216'
,. Subtotal , 1,430,073 , 1,443,012 • 106,643 S 116,240
2. Changes in unfunded acluarial accrued liability,July I, 1999
• Experience {gaiM)I1osses • (150,232) • (163,753) 15 • (18,638) • {20,J15}
b Assumption change 0 0 20 0 0
, Plan change 15,035 (6,388 20 I,M7 1,795
d. Inactive plan change 70439 76778 10 10976 II 964
,. Subtotal • (64,758) S (70,586) - • (6.015) • (6,556)
) Total (Ie) + (le) • 1,365,315 • 1,372,426 • 100,628 • 109,684
Note: Numbers may not add because of rounding.
, Indudes interest at 9% to year-end.b. Payment towards unfunded liability as of July 1, 1985, increasing at 5.0"10 per year. All other payments are level dollar amounts.
•
COST DERIVATION
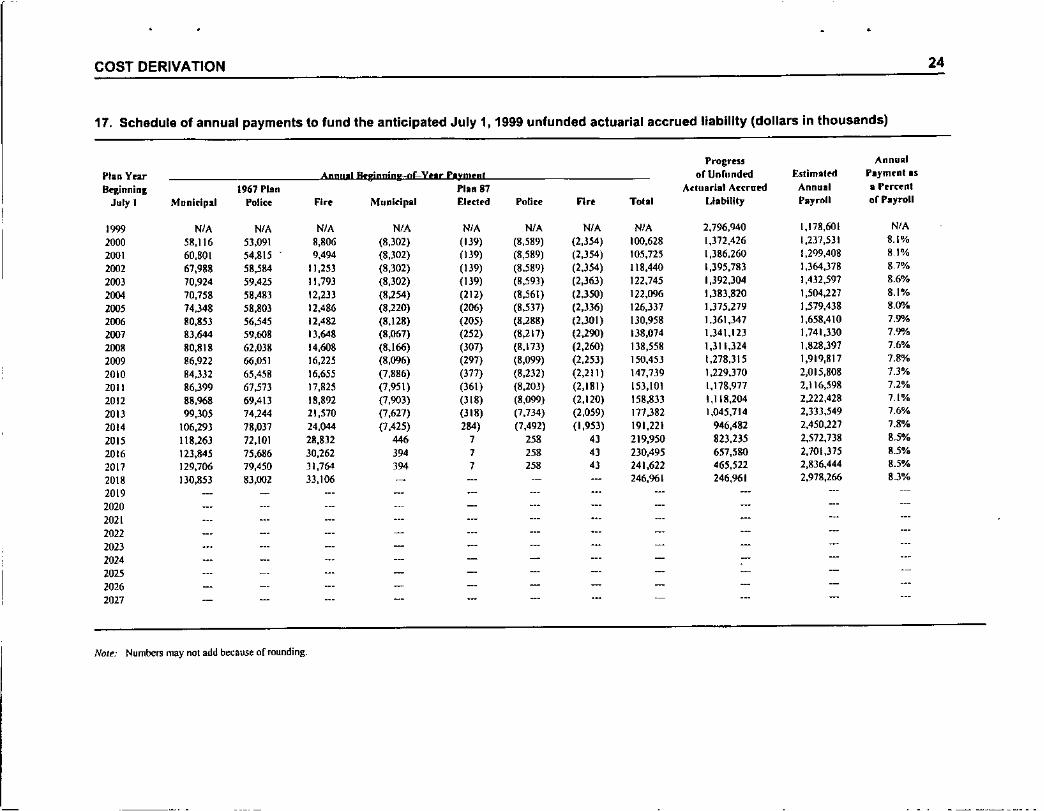
17. Schedule of annual payments to fund the anticipated July 1, 1999 unfunded actuarial accrued liability (dollars in thousands)
Progress Annual
flail Year AnDn.likgionjpg--Df-Y"r P'rmt"l ofUnfnndl'd Eslim.ltd r.ymll'nln
Beginninl 1967 Plan Plan 87 ArlUarial Accrued Annual a Frr«nt
July 1 Mnnltlp.1 Police Fire MunldplI.l Elrclrd Police fl" Toill L1.billty P.yrtlll off.frall
1999 NIA NIA NIA NIA NIA NIA NIA NIA 2,796,940 1,178,601 NIA2000 58,116 53,09\ 8,806 (8,302) (139) (8,589) (2,354) 100,628 1,372,426 1,2]7,531 8.1%
2001 60,801 54,815 9,494 (8,302) (139) (8,589) (2,354) 105,725 1,386,260 1,299,408 81%
2002 67,988 58,584 11,253 (8,302) (139) (8,589) (2,354) 1\8,440 1,395,783 1,364,)78 8,7%
200) 70,924 59,425 11,793 (8,302) (139) (8,593) (2,363) 122,745 1,392,31)4 1,432,597 8.6%
2004 70,758 58,483 12,233 (8,254) (212) (8,561) (2,350) 122,096 1,383,820 1,504,227 8.1"10
2005 74,348 58,803 12,486 (8,220) (206) (8,537) (2,336) 126,337 1.375.279 1,579,43B 8.0%
2006 80,853 56.545 12,4B2 (8.128) (205) (8,288) (2.301) 130,958 1.361,347 1,65B,41O 7.9%
2007 83,644 59,608 13,648 (8,067) (252) (8,217) (2,290) 138,074 1,341,123 1,741,330 7.9%
2008 80,81B 62.038 14,60B (8,166) (307) (B,173) (2,260) 138,558 1,311,324 1,82B,397 7.6%
2009 86,922 66,051 16,225 (8,096) (297) (8,099) (2,253) 150,453 1,278,315 1.919,817 7.8%
2010 B4,332 65,458 16,655 (7,886) (377) (8,232) (2,211 ) 147,739 1.229.370 2,015,808 7.3%
2011 86,399 67.573 17,B25 (7,951) (361) (8,203) (2,181) 153.101 1,178,977 2,116,598 7.2%
2012 88,968 69.413 18,892 (7,903) (318) (8,099) (2,120) 158,833 1,118.204 2,222,428 7.1%
2013 99,305 74,244 21,570 (7.627) (318) (7,734) (2.os9) 177,382 1,045,714 2.333,549 7.6%
2014 106,293 78.037 24,044 (7,425) 284) (7,492) (1,953) 191,221 946,482 2,450,227 7.8%
2015 118,263 72.101 28.832 446 7 258 4J 219,950 823,235 2,512,738 8.5%
2016 123,845 75.686 30.262 394 7 258 4J 230,495 657,5&0 2,701,375 8.5%
2017 129,706 79,450 31,764 )94 7 258 4J 241,622 465,522 2,836,444 8.5%
2018 130,853 83.002 33,106 .- ... ... 246,961 246,961 2.978,266 8.3%
201920202021202220232024202520262027
NOlI!: Numbers may not add because or rounding.
24
COST DERIVATION
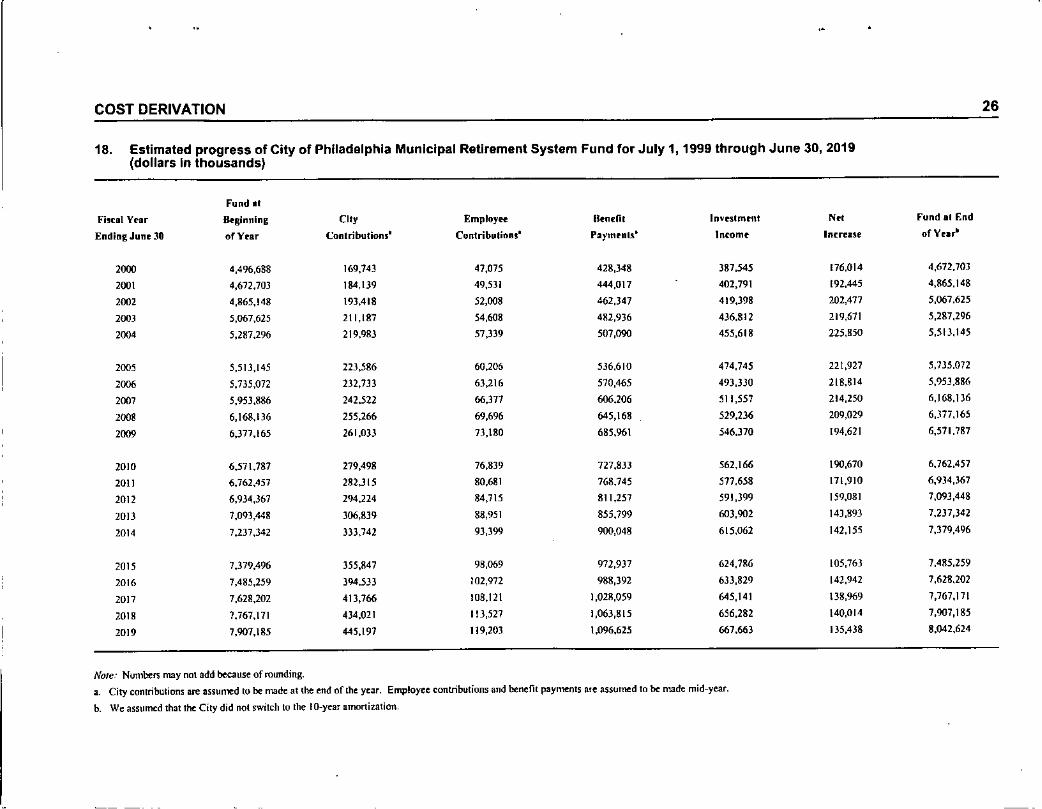
Estimated pension fund progress
25
•Table 18 shows the pension fund's estimated progress for fiscal years 2000 through 2019.The July I, 1999 adjusted market value of fund assets is the starting point. This projectionshows the emerging benefit payments of the fund and the concurrent fund growth. Theprojection is based on the same assumptions used to determine the Retirement System'sannual cost and related liabilities.
The City contribution ofnonnal cost plus the scheduled payments toward amortizing theunfunded actuarial accrued liability is used in the projection. The first year of theprojection reflects the anticipated City contribution as oftbe July I, 1998 valuation.Subsequent contributions are based on the July 1, 1999 valuation. The contribution'snormal cost component increases 5.0% annually, reflecting anticipated increases incovered payroll. The projected employee contributions also increase annually, reflectingassumed salary increases at 5.0%.
The fund projection is limited to the period with the fiscal year ending June 30, 2019.Fluctuations from the figures shown in this 20-year period are to be expected.
The fund's underlying growth trend tends to follow that shown in Table 18, even thoughthe actual numbers vary. While the projection shows that City and employee combinedfund contributions do not exceed the benefits paid, when combined with expectedinvestment earnings, the cash flow requirements meet benefit payments and allow forcontinued fund growth.
COST DERIVATION
18. Estimated progress of City of Philadelphia Municipal Retirement System Fund for July 1, 1999 through June 30, 2019(dollars In thousands)
Fund II
FI,cai Year U.ginnlng City Employet' IIe-IIdil In~"tmtnt N" Fund al End
Ending June 30 "rYrar Contributions' Contributions' Payments' Inromt Increase ofVrar"
2000 4,496,688 169,143 47,075 428,)48 387,545 176,014 4,672.703
2001 4,612,703 184.1J9 49,531 444,017 402,791 192,445 4,865.148
2002 4,865,148 193,418 52,008 462,347 419,398 201,477 5,067.625
2003 5,067,625 211,187 54,608 482,936 436.812 219,671 5,287,296
200' 5,287,296 219,983 57,339 507,090 455,618 225,850 5.513.145
2005 5,513,145 223,586 60,205 536,610 474,745 221,927 5,735.072
2006 5,735,072 132,733 63,216 570,465 493,330 2[8,814 5,')53,886
2007 5,953,886 242,522 66,371 606,206 511,557 214,250 6,168,136
200. 6,168,136 255,266 69,696 645,168 529,236 209,029 6,377,165
2009 6,377,165 261,033 73,180 685,961 546,)70 194,621 6,511.787
2010 6.571.787 279,498 76,839 727,833 562,166 190,670 6,762,457
2011 6,762,457 282,J15 80,681 768.745 511.658 171,910 6,934,367
2012 6,934,367 294,224 84,715 811,257 591,399 159,081 7,093,448
2013 7,093,448 306,839 88,951 855,799 603,902 143,893 7,237,342
2014 7,237,342 333,742 93,399 900,048 615,062 142,155 7,379,496
2015 7,379,496 355,847 98,069 972,937 624,786 105,763 7,485,259
2016 7,485,259 394,533 102,972 988,392 633,829 142,942 7,628,202
2017 7,628,202 413,766 108,121 1,028,059 645,141 138,969 7,767,171
2018 7.767,171 434,021 113,527 1,063,815 656,282 140,014 7,907,185
2019 7,901,185 445,197 119,203 1,096,625 667,663 135,438 8,042,624
Note: Numbers may not add because of rounding.a. City cOl1lribulions are assumed to be made at the end of the year. Employee eontributions and benefit pay~nlS ate assumed to be made mid-year.
b. We assu~d that the City did nol switch to the Io-year amortization.
26
PLAN MEMBERSHIP
Data for active, retired, disabled, and terminated vested members as of July 1, 1999 wasprovided by the Philadelphia Board of Pensions and Retirement.
The active member data, supplied on tape and list, contained information for allRetirement System members as ofJuly 1, 1999. The data contained basic identifyinginformation on each employee in addition to the annual rate of base compensation,overtime pay, longevity payments, and employee contribution totals. We reviewed thedata for consistency and completeness and verified it against the July I, 1998 data forcontinued active member coverage.
The nonactive member data, also supplied on tape and list, contained information for allretired, beneficiary, disabled, and terminated vested members as of July 1,1999.
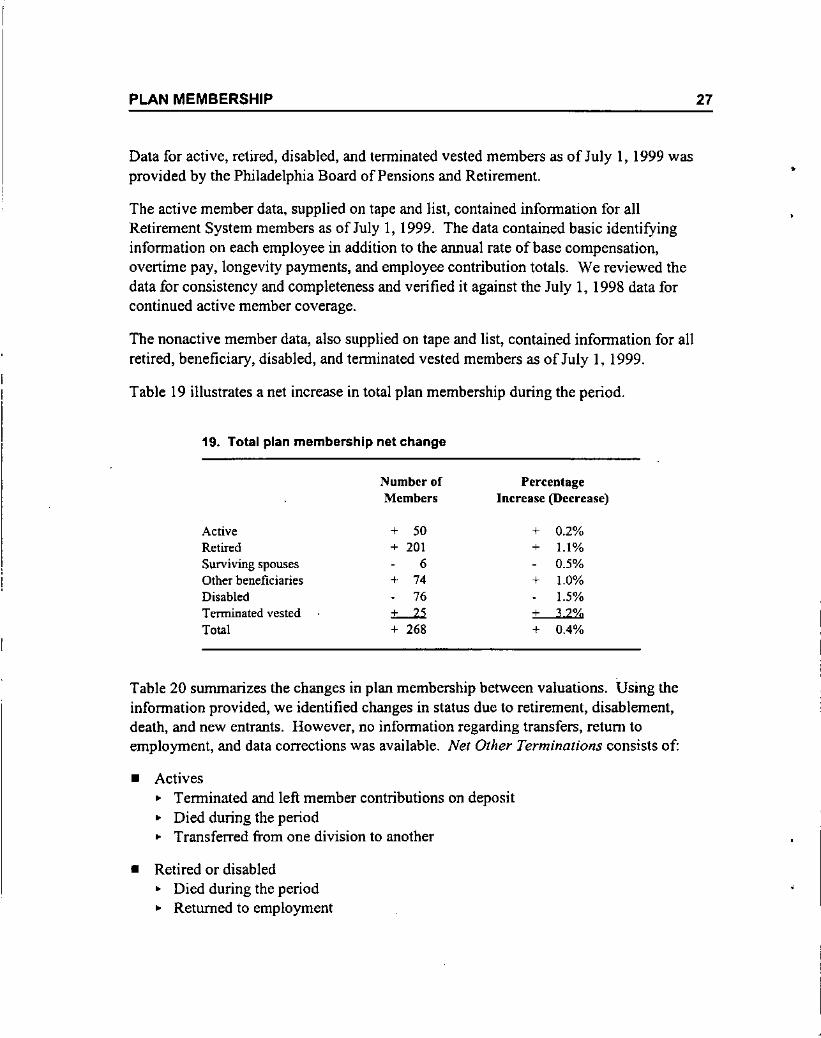
Table 19 illustrates a net increase in total plan membership during the period.
19. Total plan membership net change
Number of PercentageMembers Increase (Decrease)
Active + 50 + 0.2%Retired + 201 + 1.1%Surviving spouses 6 0.5%Other beneficiaries + 7' + 1.0%Disabled 76 1.5%Terminated vested L2i + 32%Total + 268 + 0.4%
Table 20 sununarizes the changes in plan membership between valuations. Using theinformation provided, we identified changes in status due to retirement, disablement,death, and new entrants. However, no information regarding transfers, return toemployment, and data corrections was available. Net Other Terminations consists of:
• Actives•. Terminated and left member contributions on deposit•. Died during the period•. Transferred from one division to another
• Retired or disabled•. Died during the period•. Returned to employment
27
•
IIIJ
PLAN MEMBERSHIP
• Terminated vested•. Retired or died during the period•.. Returned to employment
28
Table 21 breaks down active members' payroll and nonactive members' benefit payments.
PLAN MEMBERSHIP
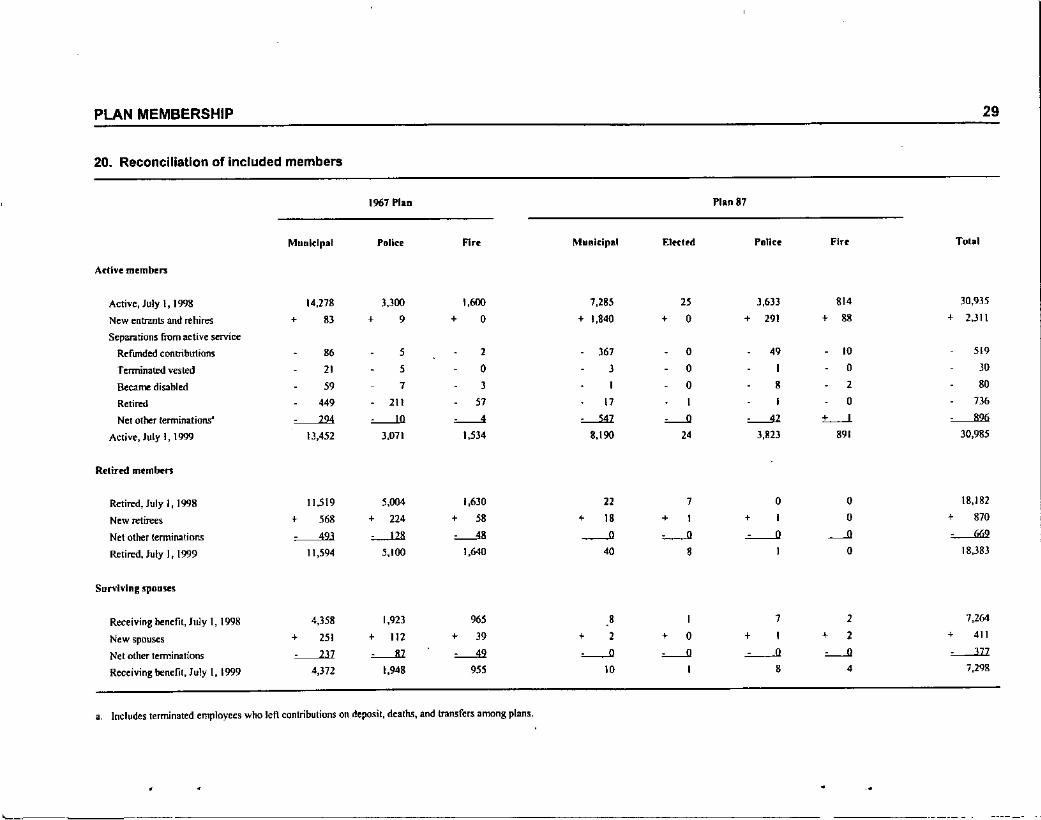
20. Reconciliation of included members
Municipal
Adive memlnn
1967 Plan
Police R" Munlt:lpal EI«ted
Plan 87
Pollee Fire Total
29
Active, July I, 1998
New entr1lllt5 and rehires
Separations from active service
Refunded contributions
Terminated vested
Became disabled
Retired
Net other terminations'
Active, July I, 1999
Retired memlnn
Retired, July I, 1998
New retirees
Net other terminationsRetired, July I, 1999
Surviving ~POU'leS
Receiving benefit, luly I, 1998
New spouses
Net other terminations
Receiving benefit, July I, 1999
14,278 3,300 1.600 7,285 2S 3,633 814 30,935
+ 83 + , + 0 + 1,840 + 0 + 291 + 88 + 2.311
86 5 2 367 0 49 10 '"21 5 0 ) 0 1 0 30
59 7 J 1 0 8 2 80
44' 2lI 57 17 1 1 0 736
~ '----"' ~ '---"11 '----" '------'-' L-' '----"<i13,452 3,071 1,534 8,190 24 3,823 891 30,985
11,519 5.004 1,630 22 7 0 0 18,182
+ 5" + 224 + " + J8 + I + 1 0 + 870
'----'" ~ '----" ----" '--" ~ ---" '--""11,594 5,100 1,640 40 8 1 0 18,383
4,358 1,923 '65 8 I 7 2 7,264
+ 2" + 112 + J9 + 2 + 0 + 1 + 2 + 411
~ ~ '----'2 '----" '--" ~ '----" O--.ill
4,312 1,948 '55 10 1 8 4 7,29!!
~-----
a. Includes terminated employees who left contributions on deposit, deaths, and transfers among plans.
•
PLAN MEMBERSHIP
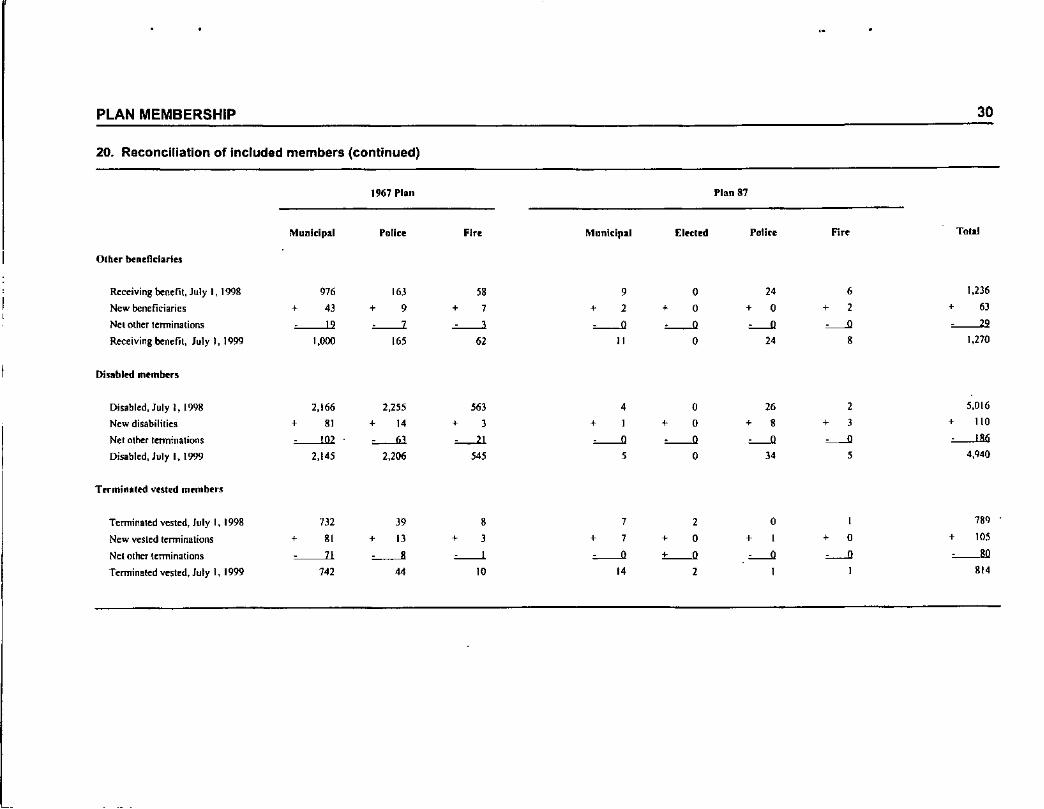
20. Reconciliation of Included members (continued)
1967 Plan Plan 87
30
Othu bendldarl~
Municipal Poliee FIre Municipal [Icoded Poliee Fire Tolal
Receiving benefit, July I, 1998
New beneficiaries
Net other terminationsReceiving benefit, luly I, ]999
Disabled members
Disabled, July I, 1998
New disabilities
Net olher lmninations
Disabled, July I, 1999
Terminated vested members
Terminated vested, July I, 1998
New vested terminations
Net other terminations
Tcnninated vested, July 1, 1999
976 16) " 9 0 24 6 1,236
+ 4J + 9 + 7 + 2 + 0 + 0 + 2 , 6J
'-----'-' '-----'1 -'-----' '----" '----" '----" '----" ~1,000 165 62 11 0 24 8 1,270
2,166 2,255 563 4 0 26 2 5,016
+ 81 + 14 + 3 + 1 + 0 + 8 + 3 + 110
102 o--<il '---" '----" '----" '----" '----" o.-JBli2,145 2,206 545 5 0 " 5 4,940
732 39 8 7 2 0 1 '"+ 81 + 13 + ) + 7 + 0 + 1 + 0 + 105
'----'l ~ ~ '----" "-----" '----" '----" '----"742 44 10 14 2 1 1 814
L__
PLAN MEMBERSHIP
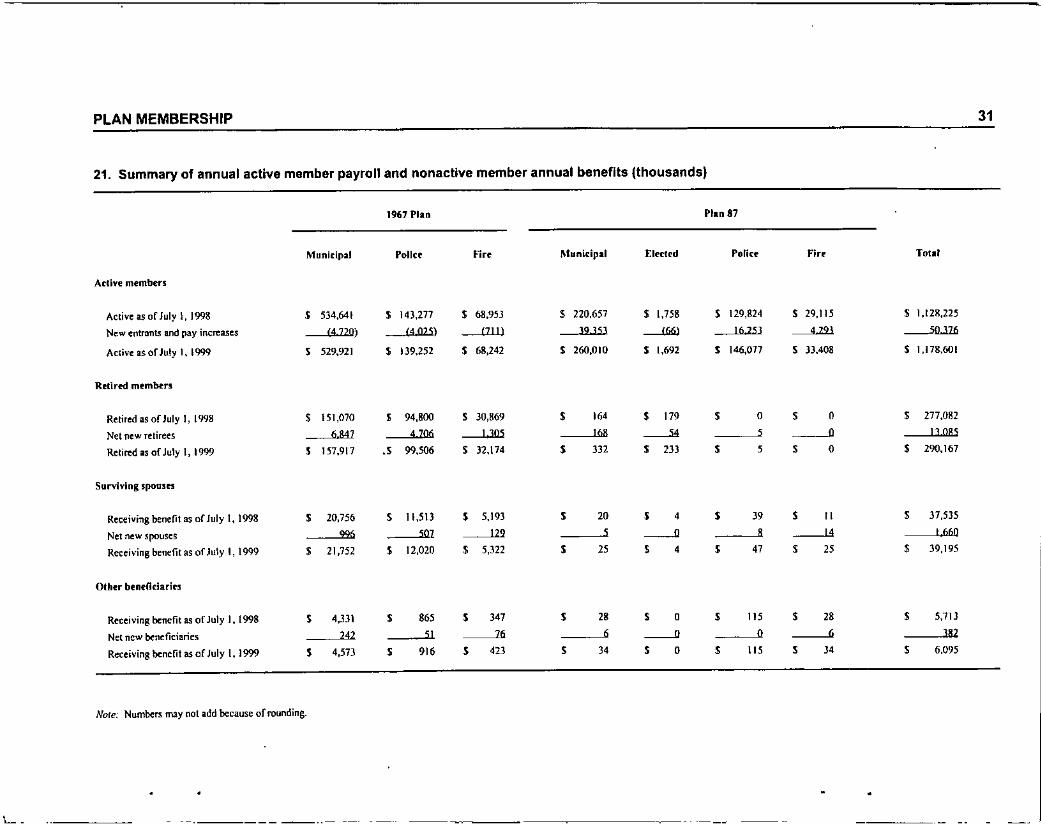
21. Summary of annual active member payroll and nonactive member annual benefits (thousands)
1967 Plan Plan 87
Municipal Pollcr Fire Municipal Eletled Poliet, Fire Total
Active members
Active as of July l, 1998 , 534,641 S 143,271 $ 68,953 $ 220,657 $ 1,758 S 129,824 $ 29,115 S 1,12l!,225
New entrants and pay illcreases (4 no) (4025) (7JJ) 39353 ----"6l 16253 4293 --'ll..lli
Active as of July 1, 1999 , 529,921 $ 139,252 S 68,242 S 260,010 S 1,692 $ 146,077 S 33,408 S 1,178,601
Relirt'd memMrs
Retired as of July I, 1998 , 151,070 , 94,800 S )0,869 , 16' , 179 , 0 , 0 , 277,082
Net new retirees 6 &47 4706 J 305 168 ----'" 5 0 J3 085
Retired as of July 1, 1999 , 157,9[7 ., 99.506 $ 32,174 , 3J2 , 23J , 5 , 0 , 290,167
Surviving spoonll
Receiving benefit as of luly I, 1998 , 20,756 , II,SO , 5,193 , 20 , 4 , J9 , II , 37,535
Nel new spouses 996 507 129 , ----" , -l.4 t 660
Receiving benefit as of July I, 1999 $ 21,752 , 12,020 , 5,322 , 25 , • , 47 $ 25 , 39,195
Othu benendarie~
R«:eiving benefit as of July I, 1999 , 4,331 , 865 , 347 , 18 , 0 , 115 , 18 , 5,113
Net new beneficiaries 242 51 76 6 ----" 0 6 JIl2
Receiving benefit MOr July I, 1999 , 4,573 , 916 , 423 , l4 , 0 , lIS , l4 , 6,095
Note: Numbers may not add because of rounding.
31
PLAN MEMBERSHIP
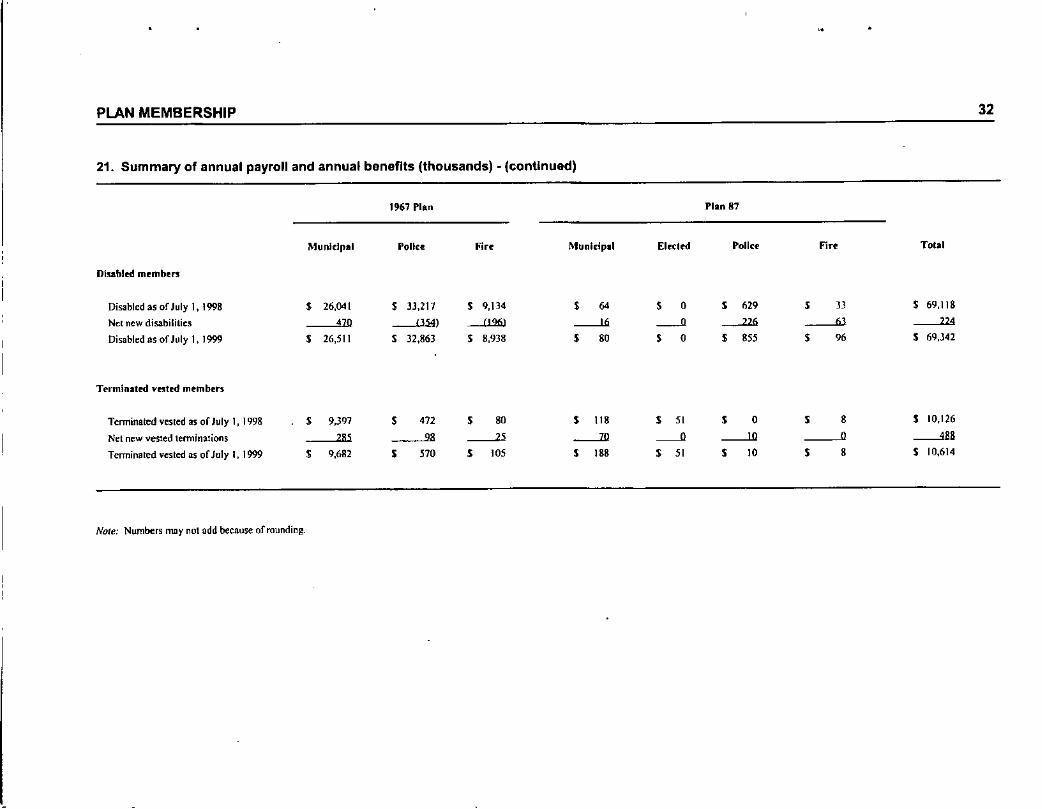
21. Summary of annual payroll and annual benefits (thousands) - (continued)
1967 Plan Plan 87
Munldpal Poilu Fire Municipal Eledtd Police Fire Total
Diu.bltd members
Disabled as of July 1, 1998 , 26,041 , 33,217 S 9,134 , 64 , 0 , 629 , JJ $ 69,118
Net new disabilities 470 0:54) -"-'" ----'-' --" ~ 63 224Disabled as of July 1, 1999 , 26,511 , 32,863 S 8,938 , 80 , 0 , 855 , 96 S 69,342
Terminated "nted members
Terminated vesled as of Jul)' 1, 1998 , 9,397 , 472 , 80 , 118 , 51 , 0 , 8 S 10,126
Net new vesled terminations 285 98 ----2> ----'" --" ---'.ll 0 488Tenninated vesled as of July I, 1999 , 9,682 , l70 , 105 , 188 5 51 , 10 , 8 S 10,614
Nole: Numbers may nol add because of rounding .
32

PLAN MEMBERSHIP
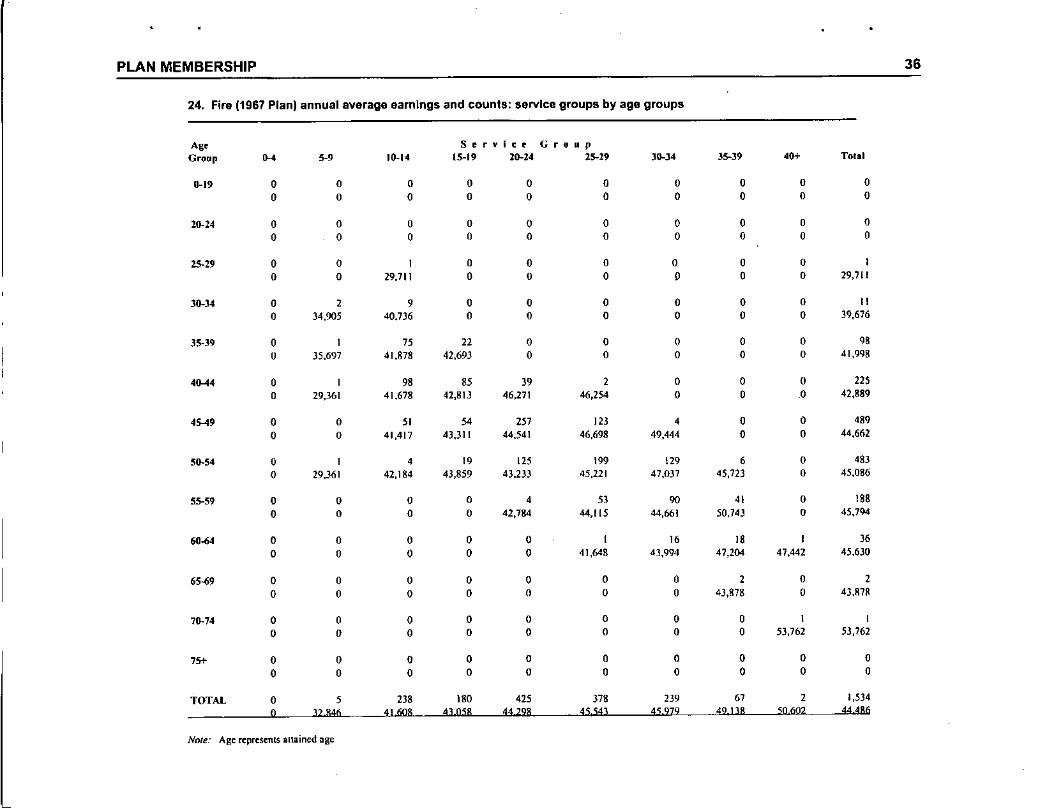
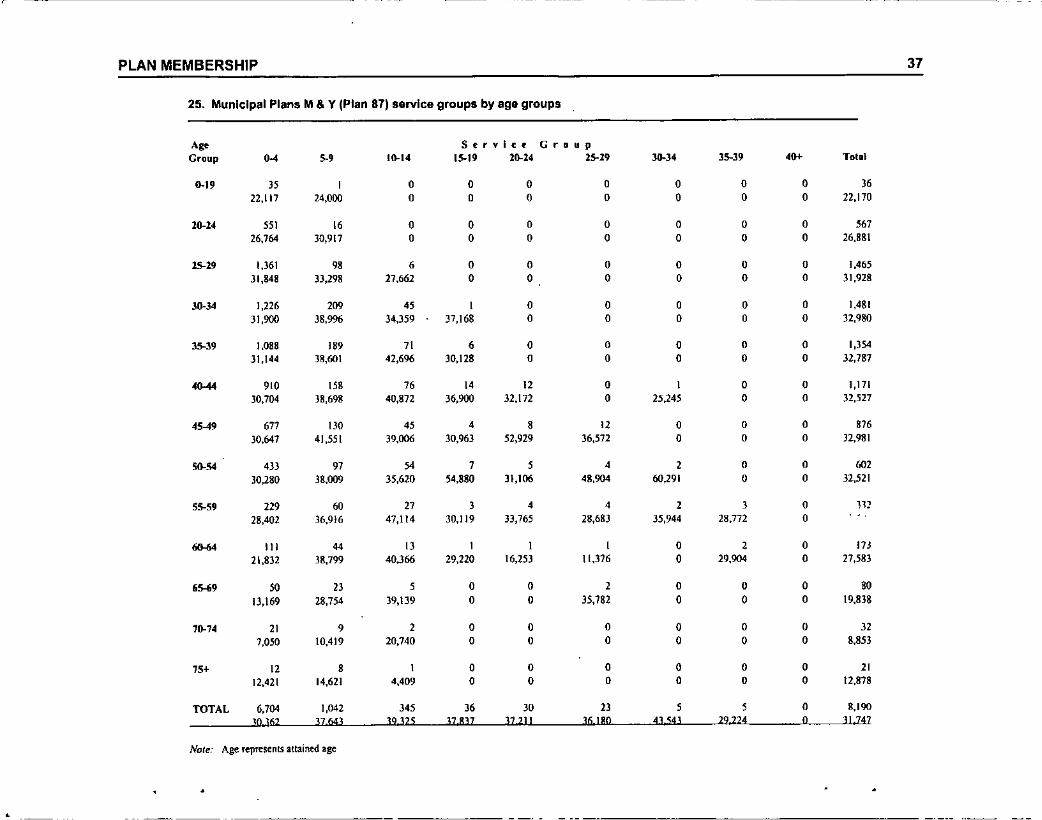
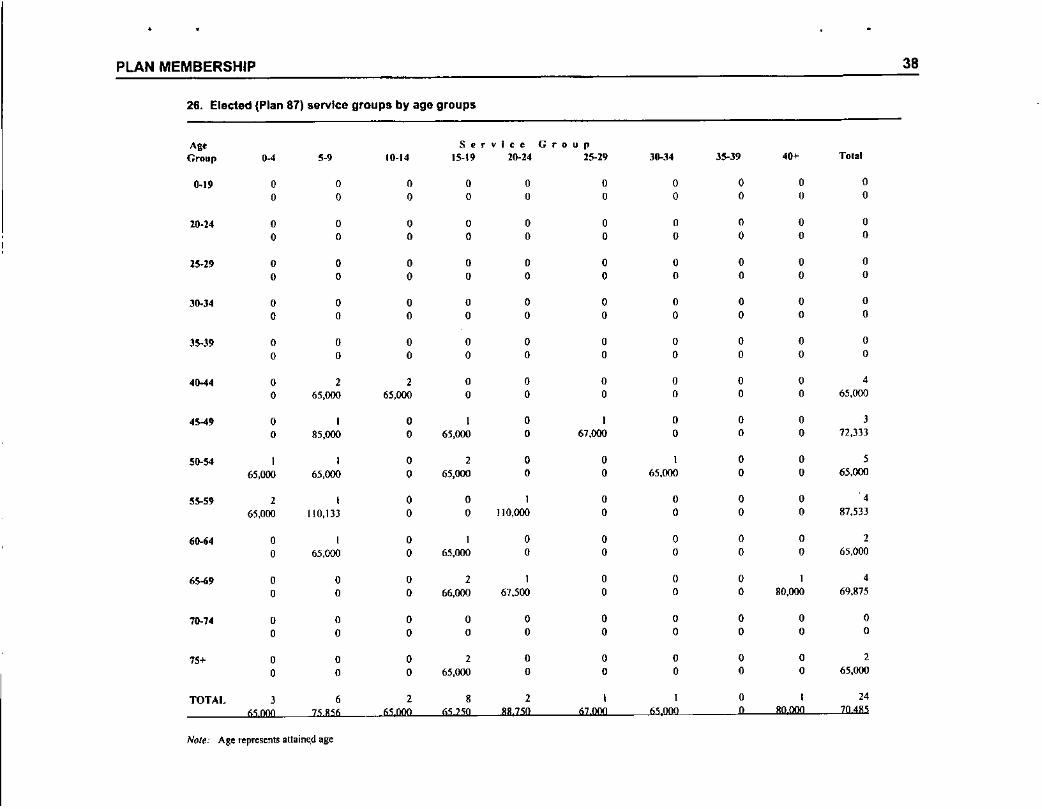
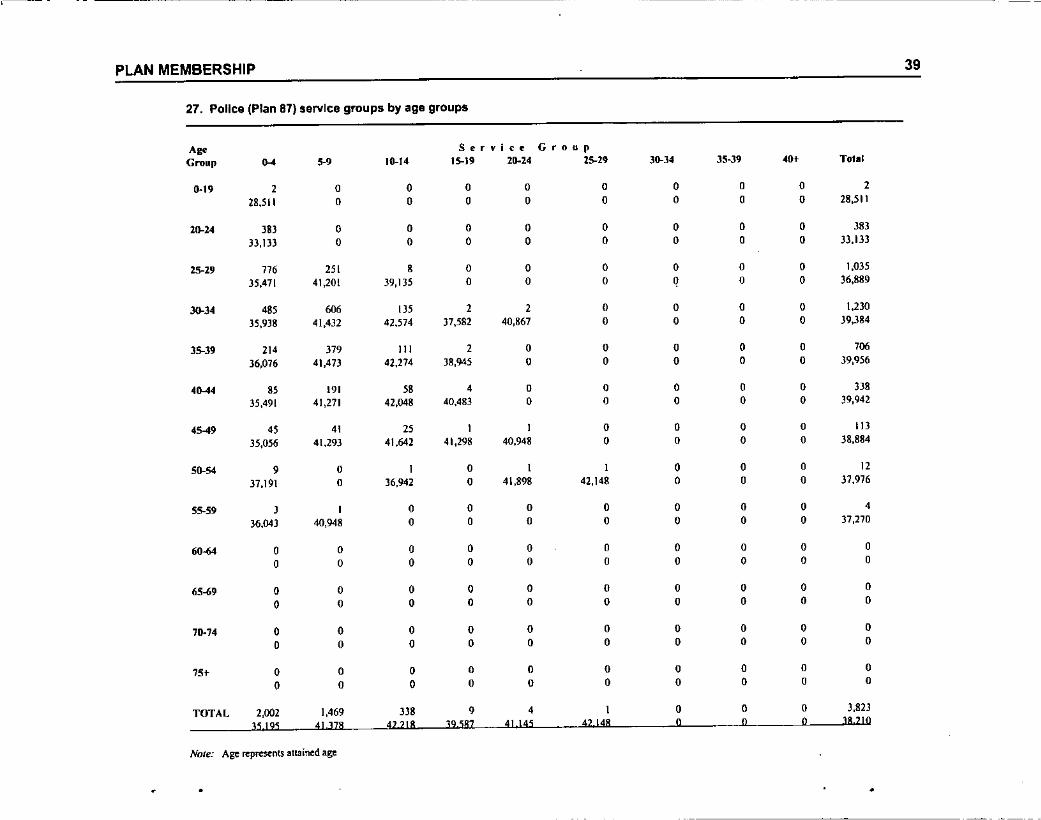
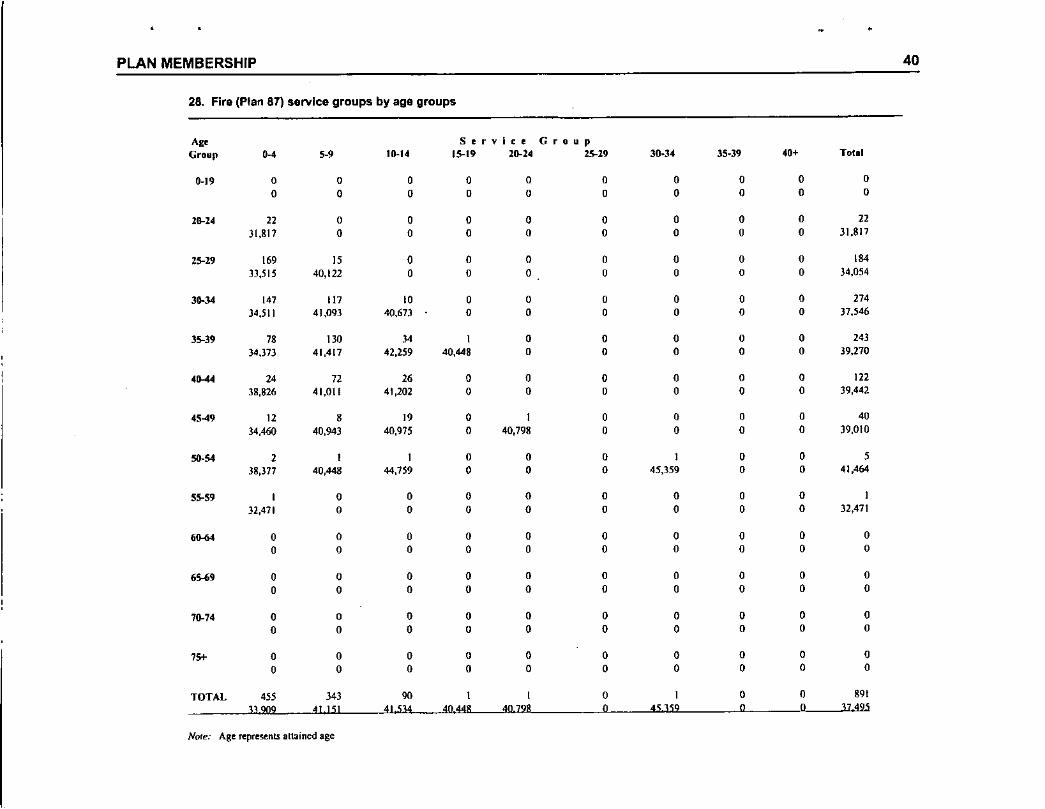
A distribution of the active employees' annual earnings for each division by age andservice group as of July 1, 1999 appears in Tables 22 through 28.
33
•
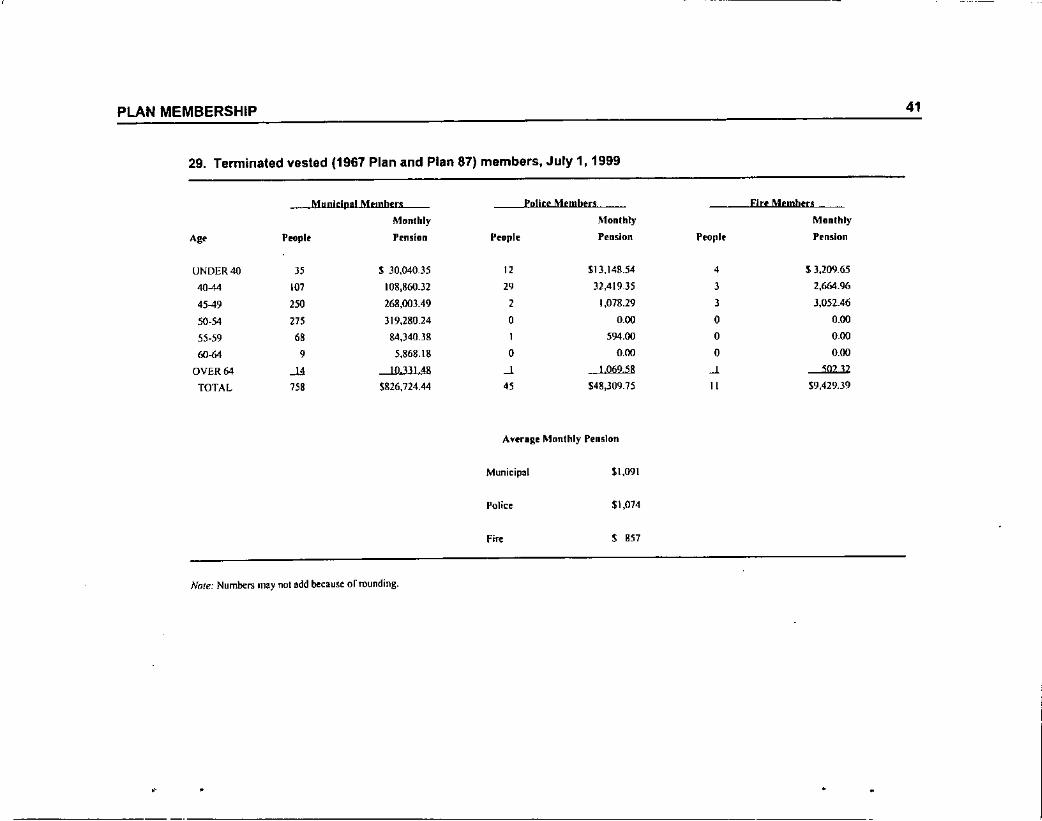
A distribution of inactive members by age and monthly pension is shown in Tables 29-32.
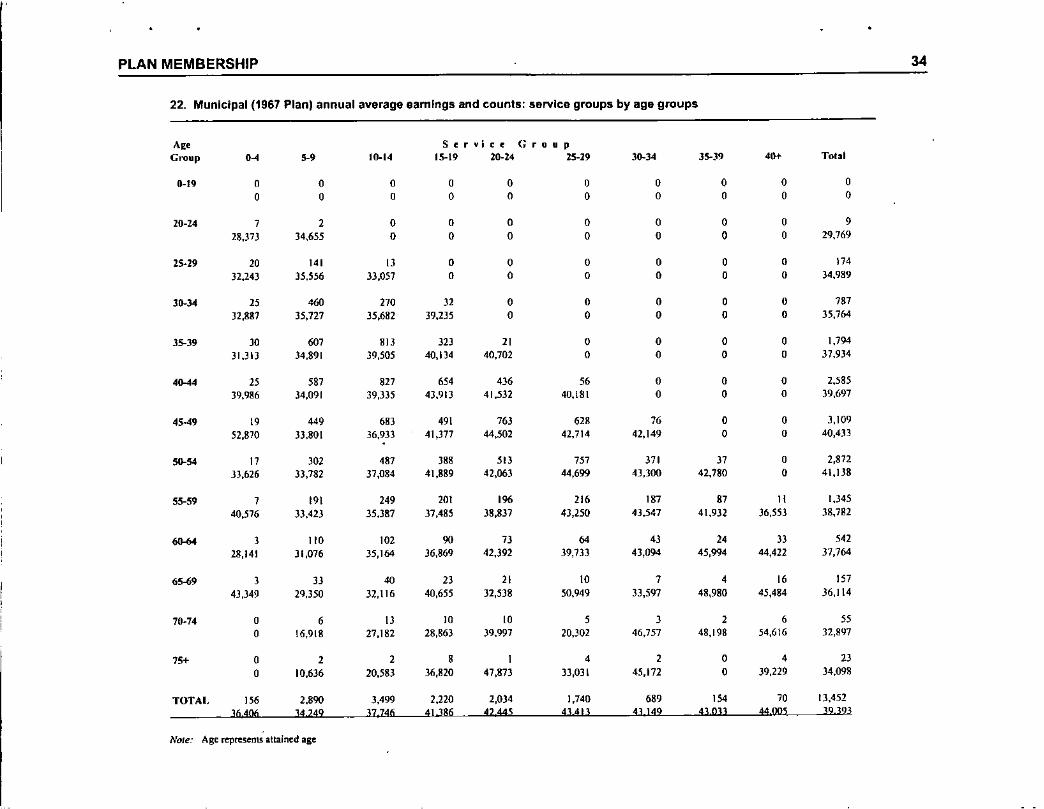
PLAN MEMBERSHIP 34
22. Municipal (1967 Plan) annual average earnIngs and counts: service groups by age groups
A,. Service GroupGroup •••• 5-' 10-14 15-19 20-24 25-29 30-34 35-39 4" Total
0-19 0 0 0 0 0 0 0 0 0 00 0 0 0 0 0 0 0 0 0
20-24 7 2 0 0 0 0 0 0 0 •28,373 )4,655 0 0 0 0 0 0 0 29,769
25-29 20 141 13 0 0 0 0 0 0 174
32,243 35.556 33,051 0 0 0 0 0 0 34,989
30-34 25 460 170 32 0 0 0 0 0 787
32,887 35,727 35,6112 39,2)5 0 0 0 0 0 35,764
35-39 30 607 813 32J 21 0 0 0 0 1,794
31,313 34,891 39,505 40,1)4 40,702 0 0 0 0 37,934
4•.•• 4 25 587 827 654 436 " 0 0 0 2,58539,986 34,091 39,335 43,913 41,532 40,18\ 0 0 0 39.697
45-4' 19 449 '"3 491 763 628 76 0 0 3,109
52,870 33,801 36,933 41,371 44,501 42,714 42,149 0 0 40,433
50-54 17 302 487 "" 51) 757 371 37 0 2,872)3,626 33,782 )7,084 4\,889 42,063 44,699 43,300 42,780 0 41,138
55-59 7 191 249 201 196 216 187 87 11 1,345
40,576 )3,423 35,387 ]7,485 38,837 43,250 43,547 41,932 36,553 38,782- 3 110 102 90 73 64 43 24 33 5"28,141 )1,076 35,164 36,869 42,392 39,733 43,094 45,994 44,422 37,764
65-69 3 33 40 23 21 10 7 4 16 1S743,349 29,350 32,116 40,655 32,538 50,949 33,597 48,980 45,484 36,114
70.74 0 6 13 10 10 , 3 2 6 550 16,918 27.182 28,863 39,997 20,302 46,757 48,198 54,616 32,897
75+ 0 2 2 " 1 4 2 0 4 23
0 10,636 20.583 36,820 47,873 33,031 45,172 0 39,229 34,098
TOTAl, 1S6 2.890 3,499 2,220 2,0)4 1.740 '"' 1S4 70 13,452
36406 34 249 37,746 41 386 4244S 43413 43 149 430U 4400S 39 393
Note.. Age represents attained age
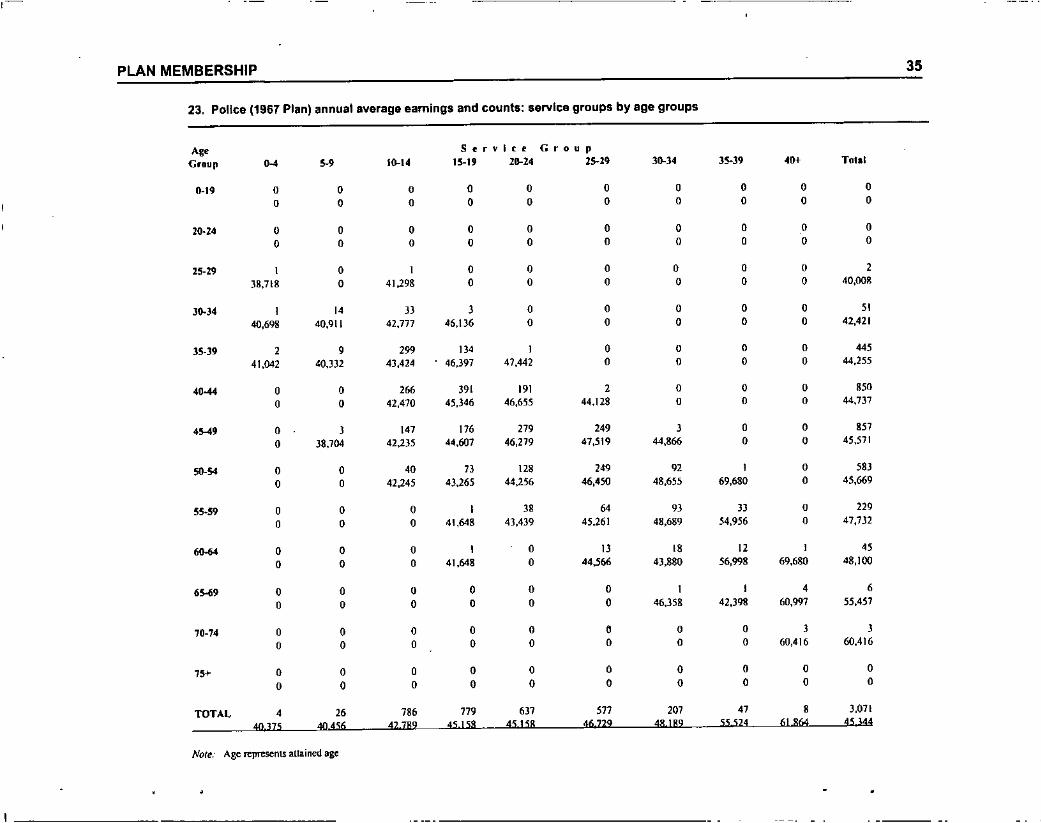
PLAN MEMBERSHIP 35
23, Police (1967 Plan) annual average earnings and counts: service groups by age groups
A,_ Service GroupGroup Il-4 5-' 10-t4 15-19 20-24 2S.29 30-]4 35-39 .'" Tol.1
0-19 0 0 0 0 0 0 0 0 0 00 0 0 0 0 0 0 0 0 0
20.24 0 0 0 0 0 0 0 0 0 00 0 0 0 0 0 0 0 0 0
15-29 I 0 I 0 0 0 0 0 0 238,718 0 41,298 0 0 0 0 0 0 40,008
30-34 I 14 33 3 0 0 0 0 0 5140,698 40,9\1 42,777 46,IJ6 0 0 0 0 0 42,421
35-39 2 • 299 134 I 0 0 0 0 44541,042 40,332 43,424 46,397 47,442 0 0 0 0 44,255
40•••• 0 0 266 391 1.1 2 0 0 0 ",00 0 42,470 45,346 46,655 44,128 0 0 0 44,737
'5-4' 0 3 147 176 279 249 3 0 0 '5)0 38,704 41,235 44,607 46,219 47,519 44,866 0 0 45,571
50.64 0 0 40 73 128 249 92 I 0 5830 0 42,245 4),265 44,256 46,450 48,655 69,680 0 45,669
55.59 0 0 0 I 38 64 93 33 0 229
0 0 0 41,648 43,439 45.261 48,689 54,956 0 47,7)2
60-64 0 0 0 I 0 13 I' 12 I 45
0 0 0 41,648 0 44,566 43,880 56,998 69,680 48,100
••••• 0 0 0 0 0 0 I I • •0 0 0 0 0 0 46,]58 42,398 60,997 55,457
70-74 0 0 0 0 0 , 0 0 3 30 0 0 0 0 0 0 0 60,416 60,416
75+ 0 0 0 0 0 0 0 0 0 0
0 0 0 0 0 0 0 0 0 0
TOTAL • 26 786 779 637 577 207 47 , 3,071
40 375 40 456 42789 45158 45158 46729 48lS9 55 524 61 864 45344
NO(l!; Age represents attained age
PLAN MEMBERSHIP 36
24. Fire (1967 Plan) annual average earnings and counts: service groups by age groups
Ag' S l' r •. I c l' GroupGroup ••• 5-' 10-14 15-19 20-24 25-29 )1)..)4 35-39 '0+ TOIII
0-19 0 0 0 0 0 0 0 0 0 00 0 0 0 0 0 0 0 0 0
20-24 0 0 U 0 0 0 0 0 0 00 0 0 U 0 0 0 0 0 0
25-29 0 0 , 0 0 0 0 0 0 ,0 0 29,711 0 0 0 0 0 0 29,711
30-" 0 , 9 0 0 0 0 0 0 110 34,905 40,736 0 0 0 0 0 0 39,676
35-39 0 , 7S " 0 0 0 0 U "U 35,697 41,878 42,693 0 0 0 0 0 41,998
,•.., 0 , 98 85 J9 , 0 0 0 22S0 29,36\ 4\.678 42,aU 46,271 46,254 0 0 0 42,889
'5-49 0 0 51 54 '" 123 • 0 0 '"0 0 41,417 43,311 44,541 46,698 49,444 0 0 44,662
!liD-54 0 , • 19 '25 199 129 6 0 '"0 29,361 42,184 43,859 43.233 45,121 47,{}J7 45,723 0 45,086
55-59 0 0 0 0 • 53 90 41 0 '880 0 0 0 42,784 44,115 44,661 50,743 0 45,794
60-64 0 0 0 0 0 , 16 18 , 360 0 0 0 0 41,648 43,994 47,204 47,442 45,630
65--69 0 0 0 0 0 0 U , 0 ,0 0 0 0 0 0 0 4J,878 0 43,1178
70-74 0 0 0 0 0 0 0 0 , ,0 0 0 0 0 0 0 0 53,762 53,762,.. 0 0 0 0 0 0 0 0 0 00 0 0 0 0 0 0 0 0 0
TOTAL 0 5 238 180 425 378 '" 67 , 1,534
0 32846 41608 43 058 44 298 45 543 45979 49138 50 602 44 486
NOll': Age represents allained age
•
PLAN MEMBERSHIP 37
25. Municipal Plans M& Y (Plan 87) service groups by age groups
Ag. Strvict' GroupGroup ••• 5-' 10-14 15-111 20-24 25-29 lO-J4 35-39 4t» Total
•." l5 , 0 0 0 0 0 0 0 J622,117 24,000 0 0 0 0 0 0 0 22,170
10-24 55' 16 0 0 0 0 0 0 0 56726,164 30,917 0 0 0 0 0 0 0 26,881
15-29 1,361 98 6 0 0 0 0 0 0 1,46531,848 33,298 27,662 0 0 0 0 0 0 ]1,928
30-34 1,226 209 45 I 0 0 0 0 0 1,48131,900 38,996 34,359 )7,168 0 0 0 0 0 32,980
35-39 1,088 189 71 6 0 0 0 0 0 1,35431,144 38,601 42,696 )0,128 0 0 0 0 0 32,787
4044 910 158 16 J4 12 0 I 0 0 1,17130,704 38,698 40,872 36,900 32,172 0 25,245 0 0 J2,527
45-4' 677 130 45 4 8 12 0 0 0 87630,641 41,551 39,006 30,963 52,929 36,572 0 0 0 32,981
56-" 433 97 " 7 , 4 2 0 0 60230,280 38,009 35,620 54,880 31,106 48.904 60,291 0 0 32,521
55-59 229 60 27 l 4 4 2 l 0 11228,402 36,9!6 47,114 30,119 33,765 28,68) 35,944 28,772 0
6Jl.<4 III 44 13 I I , 0 2 0 17)21,832 38,799 40J66 29,220 16,253 11,376 0 29,904 0 27,583
,•.•, SO 13 5 0 0 2 0 0 0 8013,169 28,754 39,139 0 0 35,782 0 0 0 19,838
10-74 21 , 2 0 0 0 0 0 0 327,050 10,419 20,740 0 0 0 0 0 0 8,853
". 12 8 I 0 0 0 0 0 0 2112,421 14,621 4,409 0 0 0 0 0 0 12,878
TOTAL 6,704 1,04Z 345 36 30 13 5 5 0 8,19010 362 37643 39,325 37 837 37211 36180 43,543 29 224 0 31,747
Nole: Age represenls aUained age
•
PLAN MEMBERSHIP 38
26. Elected (Plan 87) service groups by age groups
A" Service G r 0 U fI
Group O~ ,-, 10-14 15-19 26-24 25-29 30-34 35-39 40' Total
0.1' 0 0 0 0 0 0 0 0 0 00 0 0 0 0 0 0 0 0 0
20-24 0 0 0 0 0 0 0 0 0 00 0 0 0 0 0 0 0 0 0
25-29 0 0 0 0 0 0 0 0 0 00 0 0 0 0 0 0 0 0 0
J().J4 0 0 0 0 0 0 0 0 0 0
0 0 0 0 0 0 0 0 0 0
35-39 0 0 0 0 0 0 0 0 0 00 0 0 0 0 0 0 0 0 0
,11-4, 0 2 2 0 0 0 0 0 0 4
0 65,000 65,000 0 0 0 0 0 0 65,000
,~, 0 I 0 I 0 I 0 0 0 J0 85,000 0 65,000 0 67,000 0 0 0 12,333
'0-54 I I 0 2 0 0 I 0 0 565,000 65,000 0 65,000 0 0 65,000 0 0 65,000
55-59 2 I 0 0 I 0 0 0 0 4
65,000 [10,133 0 0 110,000 0 0 0 0 87,533
,•.•, 0 I 0 I 0 0 0 0 0 20 65,000 0 65,000 0 0 0 0 0 65,000
65-69 0 0 0 2 I 0 0 0 I 4
0 0 0 66,000 67,500 0 0 0 80,000 69,875
70-74 0 0 0 0 0 0 0 0 0 00 0 0 0 0 0 0 0 0 0
75+ 0 0 0 2 0 0 0 0 0 2
0 0 0 65,000 0 0 0 0 0 65,000
TOTAl. J , 2 8 2 I I 0 I "65,000 75 856 65,000 65250 887SQ 67000 65000 0 80000 70485
Note: Age represents attain",d age
,----
•
PLAN MEMBERSHIP 40
28. Fire (Plan 87) service groups by age groups
A,. Service GroupGroup ,-. 5-' 10-14 l5-t9 20-24 25-29 30.34 35.)9 40' Tolil
0-19 0 0 , 0 0 0 , 0 0 ,0 0 , , 0 , , 0 0 0
26-24 n 0 , 0 0 0 0 0 0 n)[,817 0 0 0 0 0 0 0 0 31.817
25-29 169 15 0 0 0 0 0 0 0 18433,515 40,122 0 0 0 0 0 0 0 34,054
30-34 147 117 10 0 0 0 0 0 0 27'34,511 41,093 40,67) 0 0 0 0 0 0 37,546
35-39 78 1JO l4 I 0 0 0 0 0 24334,373 41,417 42,259 40,448 0 0 0 0 0 39,210
.0-4< 24 n 26 0 0 0 0 0 0 In38,826 41,011 41,202 0 0 0 0 0 0 39,442
45-49 12 8 I' 0 I 0 0 0 0 4034,460 40,943 40,975 0 40,798 0 0 0 0 )9,010
50-84 2 I I 0 0 0 I 0 0 538,377 40,448 44,759 0 0 0 45,359 0 0 41,464
55-59 I 0 0 0 0 0 0 0 0 I32,471 0 0 0 0 0 0 0 0 32,47]
•••• 0 0 0 0 0 0 0 0 0 00 0 0 0 0 0 0 0 0 0
•••• 0 0 0 0 0 0 0 0 0 00 0 0 0 0 0 0 0 0 0
70-74 0 0 0 0 0 0 0 0 0 00 0 0 0 0 0 0 0 0 0
,S<- o 0 0 0 0 0 0 0 0 00 0 0 0 0 0 0 0 0 0
TOTAL '55 J43 90 I I 0 I 0 0 89133 909 41 151 41.534 40448 40 798 0 45 359 0 0 37 495
Note: Age~p=nt.s a1l3inedage
PLAN MEMBERSHIP
29. Tenninaled vested (1967 Plan and Plan 87) members, July 1, 1999
Municipal Membtl'1l Police Members Eire Membtrs
Monthly Monthly Monthly
A,_ People Pt'nsion Pnple Pension People Pension
UNDER4Q J5 S 30,040.35 12 $13.148.54 , S 3,209.65
40-44 101 108,860-32 " 32,419.35 3 2,664.96
45-49 2SO 268,003.49 2 1,078.29 J 3,052-46
SO-54 27S 319,280.24 0 000 0 0.00
55-59 68 84,340.38 I 594.00 0 000
60-64 9 5,868.\8 0 0.00 0 0.00
OVER 64 .JA 10m 48 --' 106958 --' 50232
TOTAL 158 $826,724.44 45 $48,309.75 II $9,429.39
Anragr Monthly PensIon
41
Nole: Numbers may not add because or rounding.
,
Municipal
Police
Fire
SI,091
$1,014
S 857
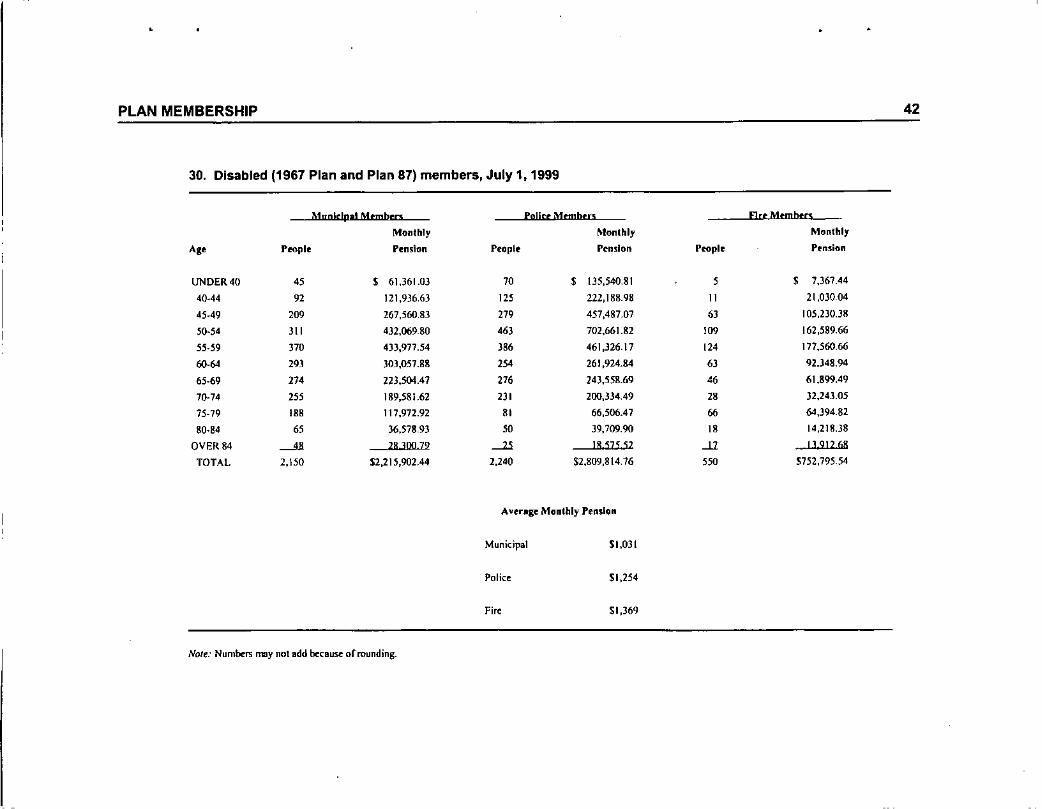
PLAN MEMBERSHIP
30. Disabled (1967 Plan and Plan 87) members, July 1, 1999
Munlclpal Mtmbro PoUcr Membrn Flrt Membra
Monthly Monthly Monthly
Ag. Peo.pll' Pension People Pl'ndon People P'nJion
UNDER 40 45 , 61,361.03 70 , 1J5,540.81 5 , 7,367.44
40.44 92 121,936,6) '" 222,188.98 11 21,030.04
45.49 209 267,560,113 279 457,487.Q7 6J 105,230.311
50-54 311 432,069.80 463 702,661.82 109 162,589.6655.59 370 4)3,977.54 '" 461,326.17 12' 177,560.6660-64 293 303,057.88 254 261,924.84 6J 92.348.94
65-69 27' 223,504.41 276 243,5511.69 46 61.899.497(}-74 '" 189,581.62 211 200,334.49 28 32,243.05
75-79 "B 117,972.92 "' 66,506.47 66 64,394.82
80.84 " 36,578.93 " 39,709.90 " 14,2111.38
OVER 84 --'-" 28 lOll 79 --'" 1857552 -" 13,91268
TOTAL 2,150 $2,215,902.44 1,240 $2,809,814.16 5" S752,795,54
Average Monthly Pension
42
Municipal
Police
Fire
NOle: Numbers may not add beca~ ormunding.
SI,OJI
$1,254
$1,369
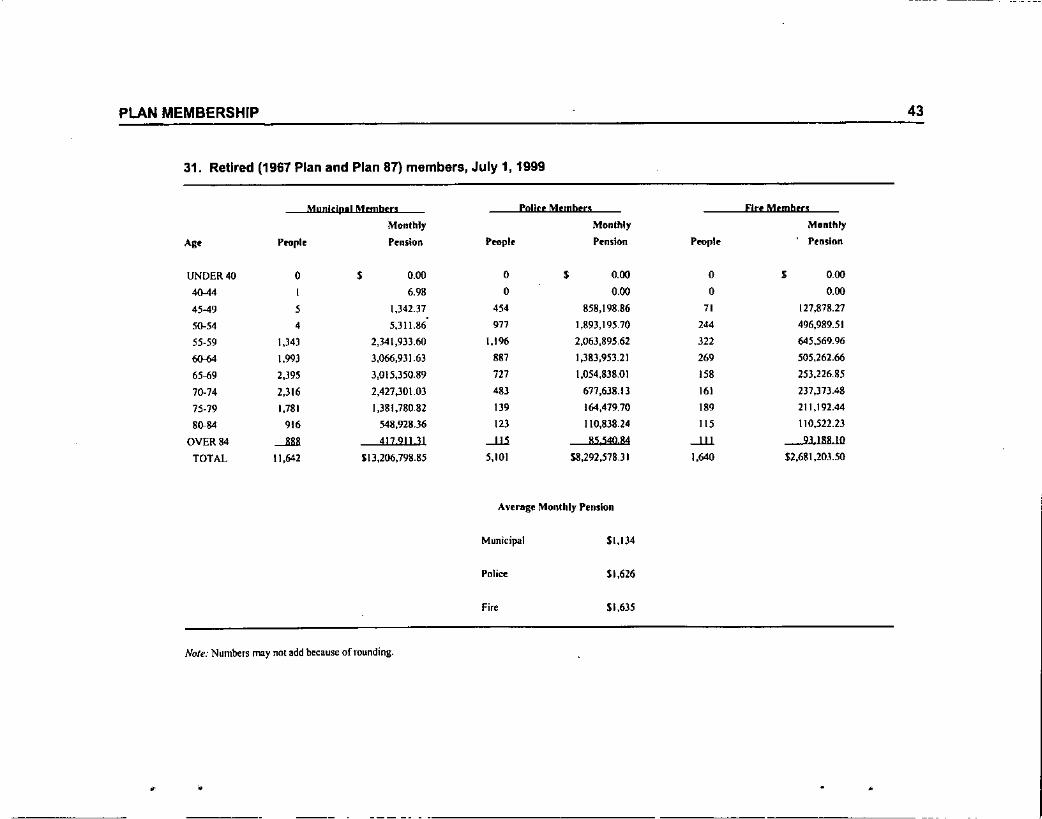
PLAN MEMBERSHIP
31. Retired (1967 Plan and Plan 87) members, July 1, 1999
Mlln1dp'! Mrmbtn Paller M,mbrrs Flu Mtmbrn
Monthly Monthly MonthlyA,. Profile Prnston People Pension Prople Pension
UNDER 40 0 $ 0.00 0 $ 0.00 0 $ 0004{).44 , 6.98 0 000 0 0.00
45-49 , 1.341.37 '54 858,198.86 71 [21,878.27
50-54 , 5,JI1.86 977 1,893,195,70 244 496,989.51
55-59 \,J43 2,341,933.60 1,196 2,063,895,62 322 645,569.96
6%1 \,993 3,066,931.63 887 1,383,953.21 269 505,262.66
65-69 2.395 3,015,350.89 72J 1,054,838.01 '58 253,226.85
70-74 2,316 2,427,301.03 48) 671,638.13 161 237,)7).48
75-79 1,781 1,381,780,82 139 164,479.70 189 211,192.44
80-84 916 548,928.36 123 110,838.24 11$ 110,522.23
OVER 84 --'" 417 911 31 -'11 85540 84 -lll 9] 188 10
TOTAL 11,642 $13,206,798.85 5,101 $8,292,518.3 I 1,640 52.681,203.50
Average Monthly Pension
43
,
Municipal
Police
Fire
Note: Numbers may not add because ofrounding.
,
$1,134
$1,626
$1,635
•
--- -- ---------------------- ------ ----------
•
PLAN MEMBERSHIP
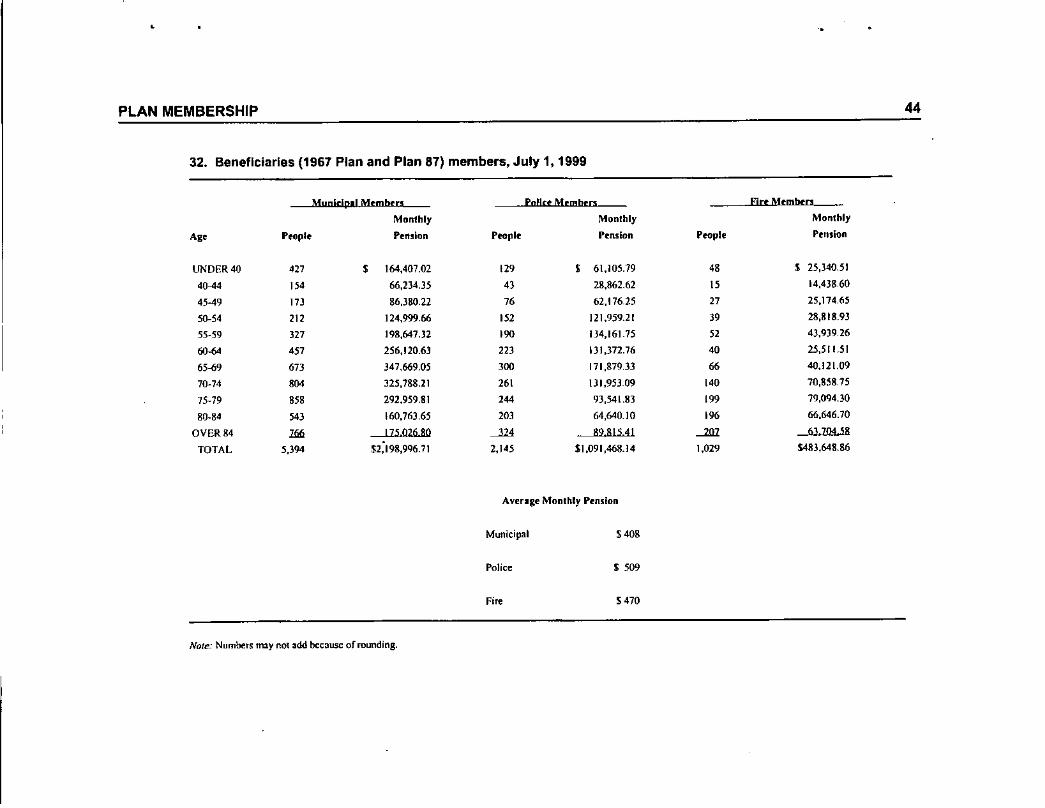
32. Beneficiaries (1967 Plan and Plan 87) members, July 1, 1999
Mllnicip" Mrmbrrs polICtMembers [jet Memben
Monthly Monthly Monthly
A" People Pension People Pt'nsion People Proslnn
UNDER 40 ." , 164,407.02 129 I 6\,105.79 48 S 25,340.51
40~ 154 66,234.35 43 28,862.62 15 14,438,60
45-49 17l 86,380.22 76 62,176.25 27 25,174.65
50-54 111 124,999.66 152 121,959.21 J9 28,818.93
55-59 317 198,647.32 190 134,161.75 52 4),9)9,26
0l-64 451 256,120.63 113 131.372.76 40 25,511.51
65-69 673 )47,669.05 300 171,879,33 66 40,121.09
70-74 804 325,788.21 261 DI,95J.09 140 70,858,15
75-79 858 292.959.81 244 93,541.83 199 79,094.30
80-84 543 160.76),65 203 64,640.10 196 66,646.70
OVER84 ,.. 1]502680 -->lA 8981541 --'1l2 637D4 58
TOTAL 5,394 $2,198,9Q6.71 2,145 11.091,468.14 1,029 $483,648.86
Averlge Monlllly Pension
44
Note: Numbeu tn:l)' not add because ofmunding.
Municipal
Police
Fire
H08
$509
5470
FINANCIAL EXPERIENCE OF FUND 45
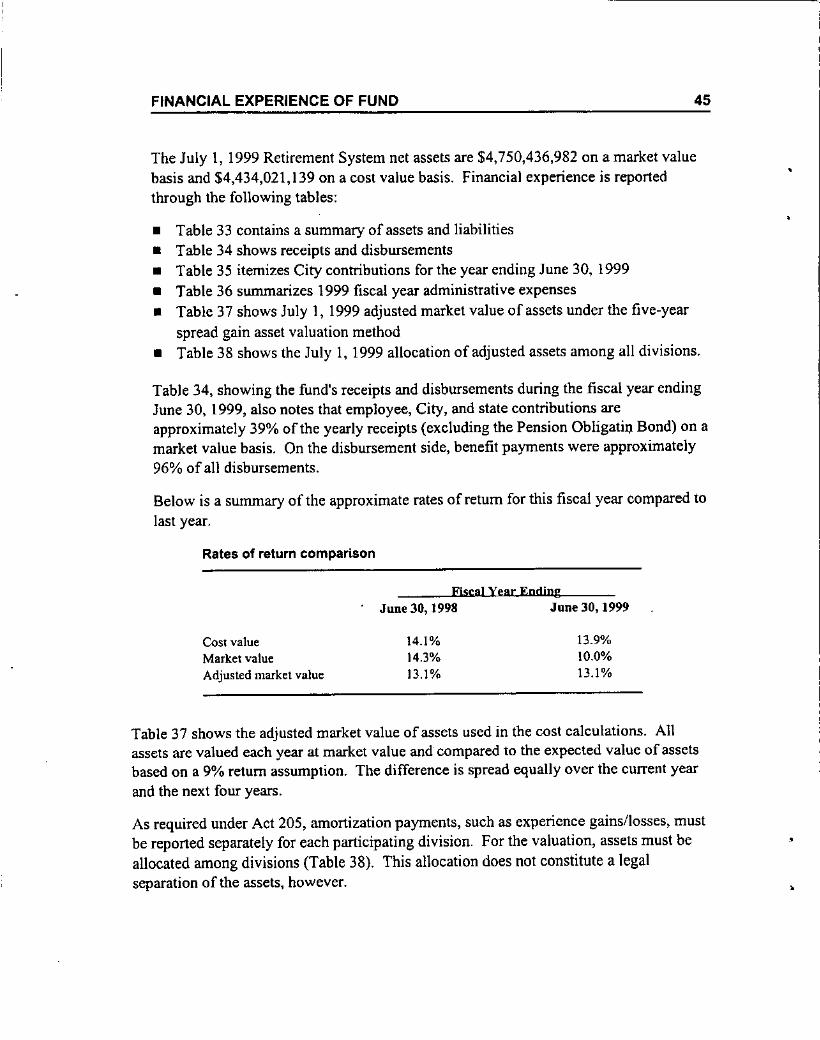
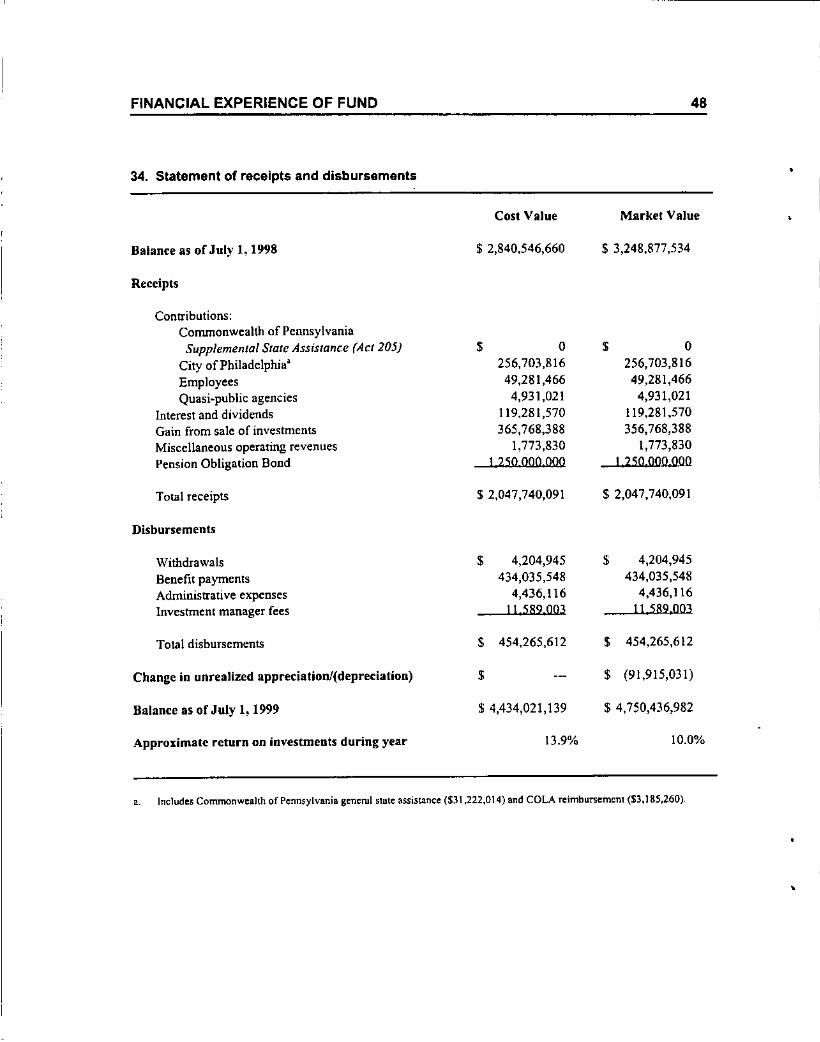
The July 1, 1999 Retirement System net assets are $4,750,436,982 on a market valuebasis and $4,434,021,139 on a cost value basis. Financial experience is reportedthrough the following tables:
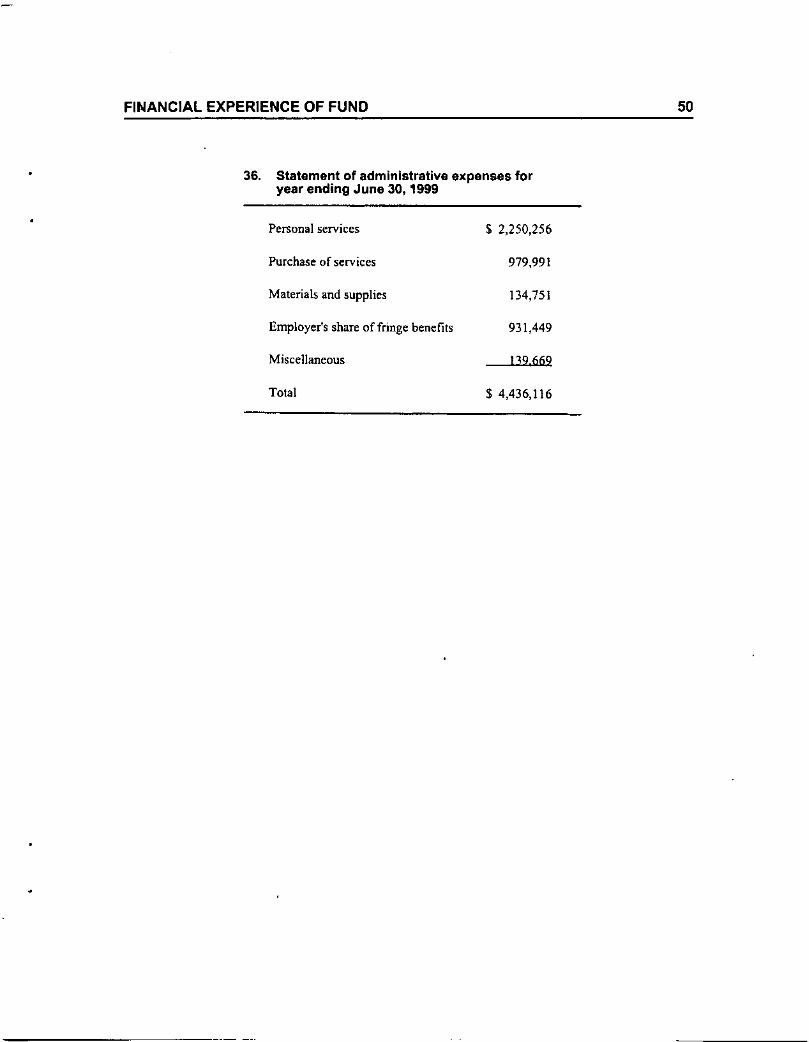
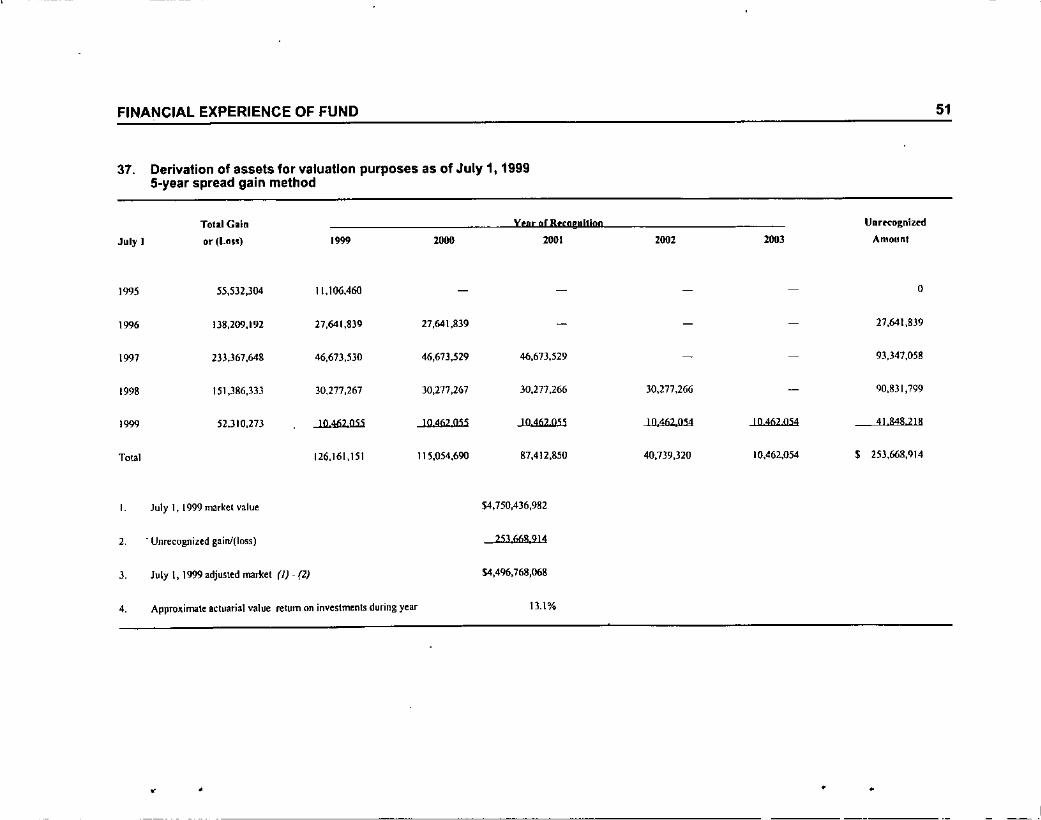
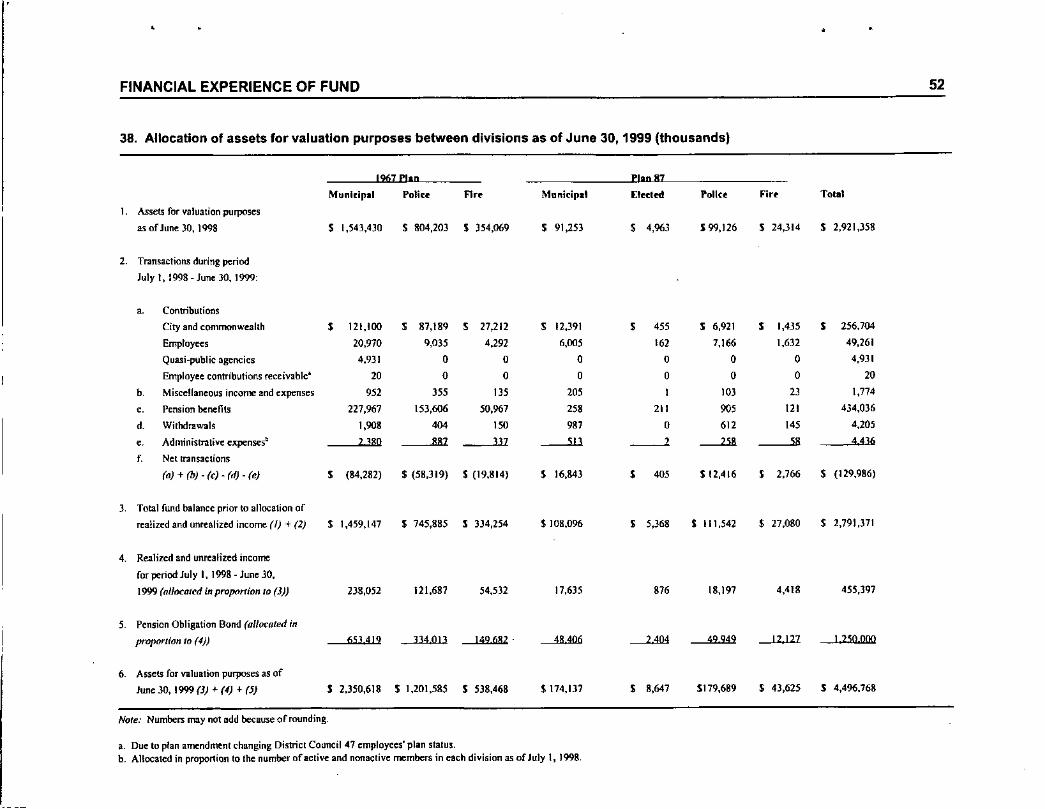
• Table 33 contains a summary of assets and liabilities• Table 34 shows receipts and disbursements• Table 35 itemizes City contributions for the year ending June 30, 1999• Table 36 summarizes 1999 fiscal year administrative expenses• Table 37 shows July 1, 1999 adjusted market value of assets under the five~year
spread gain asset valuation method• Table 38 shows the July 1, 1999 allocation of adjusted assets among all divisions.
Table 34, showing the fund's receipts and disbursements during the fiscal year endingJune 30, 1999, also notes that employee, City, and state contributions areapproximately 39% of the yearly receipts (excluding the Pension Obligatil) Bond) on amarket value basis. On the disbursement side, benefit payments were approximately96% of all disbursements.
Below is a summary of the approximate rates of return for this fiscal year compared tolast year.
Rates of return comparison
Fiscal Year EndingJune 30, 1998 June 30, 1999
Cost valueMarket valueAdjusted market value
14.1%14.3%13.1%
13.9%10.0%13.1%
Table 37 shows the adjusted market value of assets used in the cost calculations. Allassets are valued each year at market value and compared to the expected value of assetsbased on a 9% return assumption. The difference is spread equally over the current yearand the next four years.
As required under Act 205, amortization payments, such as experience gains/losses, mustbe reported separately for each participating division. For the valuation, assets must beallocated among divisions (Table 38). This allocation does not constitute a legalseparation of the assets, however.
•
FINANCIAL EXPERIENCE OF FUND 46
•
Table 38 begins with July 1, 1998 valuation assets. The noninvestment transactions (item2), other than administrative expenses attributable to each division, were provided by theCity of Philadelphia's Finance Department. Administrative expenses were allocatedaccording to the member count of each division at the beginning of the fiscal year.Investment income (after investment expenses) was allocated in proportion to the fundbalance of each division before investment income.
The P .D.B., demonstrated in Table 38, was allocated between each participating divisionin proportion to the total fund balance by division as of June 3D, 1999 prior to allocation ofrealized and unrealized income .

FINANCIAL EXPERIENCE OF FUND 47
33. Statement of assets and liabilities (fiscal year ending June 3D, 1999) •
Cost Value Market Value
Assets
Cash $ 17,891,219 $ 17,891.219Investment accounts 4,617,204,070 4,933.619,913Accounts receivable 7,319,981 7,319,981Interest and dividends receivable 20,591,649 20,591,649Due from other funds 0 0Due from other governmental units 1,602,412 1,602,412Other assets 11 22Q ) 1 220
Total assets $ 4,644,620,551 $ 4,981,036,394
Liabilities
Vouchers payable $ 23,833 $ 23,833Accounts payable 2,556,651 2,556,651Salaries and wages payable 104,646 104,646Accrued expenses 498,483 498,483Funds held in escrow (1) (1)Deferred revenue 4,852,076 4,852,076Other liabilities (including amounts due to brokers) 222563,724 222563724
Total liabilities $ 230,599,412 $ 230,599,412
Fund balance $ 4,414,021,139 $ 4,750,436,982
•
FINANCIAL EXPERIENCE OF FUND
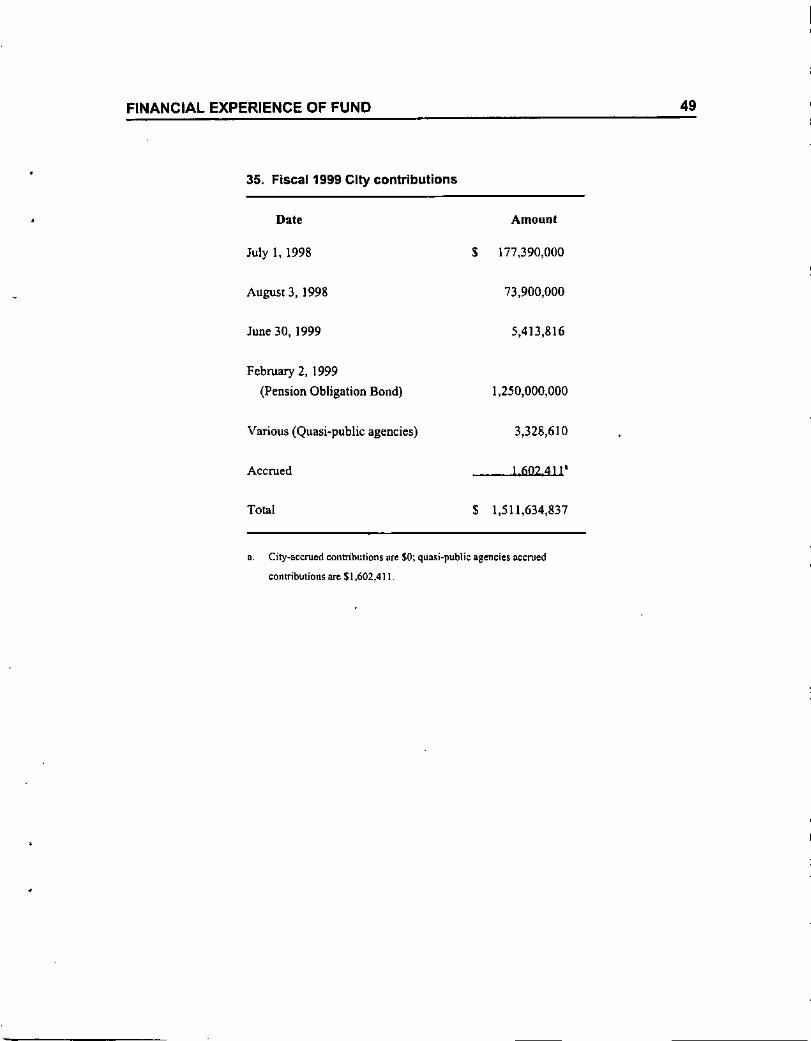
35. Fiscal 1999 City contributions
Date Amount
July 1, 1998 $ 177,390,000
August 3,1998 73,900,000
June 30, 1999 5,413,816
February 2,1999
(Pension Obligation Bond) 1,250,000,000
Various (Quasi-public agencies) 3,328,610
Accrued 160241"
Total $ 1,511,634,837
o. City-accrued contributions aTe $0; quasi-public agencies aeemed
contributions are $1,602,4] I
49
FINANCIAL EXPERIENCE OF FUND
34. Statement of receipts and disbursements
Balance as of July 1, 1998
Receipts
Contributions:Conunonwealth of PennsylvaniaSupplemental State Assistance (Act 205)City ofPbiiadelphia"EmployeesQuasi.public agencies
Interest and dividendsGain from sale of investmentsMiscellaneous operating revenuesPension Obligation Bond
Total receipts
Disbursements
Cost Value
$ 2,840,546,660
$ 0256,703,81649,281,4664,931,021
119.281,570365,768,388
1,773,830I 25000D,OOO
$ 2,047,740,091
48
Market Value
$ 3,248,877,534
$ 0256,703,81649,281,4664,931,021
119,281,570356,768,388
1,773,8301 250 000,000
$ 2,047,740,091
WithdrawalsBenefit paymentsAdministrative expensesInvestment manager fees
Total disbursements
Change in unrealized appreciation/(depreciation)
Balance as of July 1, 1999
Appro:limale return on investments during year
$ 4,204,945 $ 4,204,945434,035,548 434,035,548
4,436,116 4,436,116II 589003 11 589,003
$ 454,265,612 $ 454,265,612
$ $ (91,915,031)
$ 4,434,021,139 $ 4,750,436,982
13.9% 10.0%
a. Includes Commonwealth of Pennsylvania gencml state assistance ($31,222,014) and COLA reimbursement ($3,185,260).
FINANCIAL EXPERIENCE OF FUND
36. Statement of administrative expenses foryear ending June 30, 1999
50
Personal services
Purchase of services
Materials and supplies
Employer's share of fringe benefits
Miscellaneous
Total
$ 2,250,256
979,991
134,751
931,449
139669
$ 4,436,116
FINANCIAL EXPERIENCE OF FUND
37. Derivation of assets for valuation purposes as of July 1, 19995-year spread gain method
Total G.in Year of Rrcognllioo UnrKognized
July I or (lllu) "99 2000 2001 lOOl 2003 Amount
199' 55,532,304 11,106,460 - - 0
1996 138,209,192 27,641,839 27,641,839 - - 27,641,839
1997 233,367,648 46,673,530 46,673,529 46,673,529 - 93,347,058
1998 151,386,333 30,277,267 30,217,267 30,277,266 30,277,266 - 90.831,799
1999 52,310,273 10.462.Oii 10462 055 JO 462 ass 10462054 10462054 418482JB
Total 126,161,151 115.054,690 &7,412,850 40,739,320 10,462,054 , 253,668,914
I. July I, 1999 market value $4,750,436,982
2. . Unrecognized gain/(Ioss) 253668914
3. July!, 1999adjusledmarlcet (1)-(1) $4,496,768,068
4. Approllimale actuarial value retum on investments during year 13.1%
51
< • <
FINANCIAL EXPERIENCE OF FUND
38. Allocation of assets for valuation purposes between divisions as of June 30, 1999 (thousands)
1967 P1ln PliO 87
Muniripil Police F1" Municipal E:IKted Pollee Fire Tolal
I. Assets for VlI1uatlonpurposes
asofJuneJO,I998 S 1,543,430 S 804,20) S 354,069 $ 91,253 , 4,963 S 99,126 S 24,)14 S 2,921,358
2. Transactions during period
July I, 1998 -June 30, 1999:
,. Contributions
City and comlTl(Jl1wealth , 121,100 , 87,189 , 27,212 , 12,391 , 455 $ 6,921 , 1,435 , 256,704
Employees 20,970 9,0)5 4,292 6,OOj 162 7,166 1,632 49,261Quasi.public agellCies 4,931 0 0 0 0 0 0 4,931
Employee contributions ret:eivable' 20 0 0 0 0 0 0 20b. Miscellaneous income and expenses '52 355 135 205 I 103 23 1,774
,. Pension benefits 227,967 153,606 50,967 258 211 905 121 434,036
d. Withdrawals 1,908 404 ISO 987 0 612 145 4,205
, Administrative expenses' 2380 887 337 m .--.l ---'" 58 4 436
f. Net lransactions
(a) + (b) - (c) - (d) - (e) , (84,282) $ (58,319) S (19,814) , 16,843 , 405 S 12,416 I 2,766 S (129,986)
3 Total fund balance prior to allocation of
realized and unrealized income (I) + (2) S 1,459,147 S 745,885 S 334,254 $ 108,096 , 5,368 S 111,542 $ 27,080 $ 2,791.371
4. Realized and unrealized income
for perioci luly I, 1998-1undO,
1999 (al/ocatl'd in proportion /0 (1)) 238,052 121,687 54,532 17,635 876 18,197 4,418 455,397
5 Pension Obligation Bond (allocated in
proportion /0 (4)) 653419 334013 149682 48406 -'-"" 49949 12127 I 250000
6 Assets for valuation purposes as of
June 30, 1999 (1) + (4) + (5) S 2,350,618 S 1,201,585 S 538,468 $ 114,137 , 8,647 $179,689 $ 43,625 S 4,496,768
Note: Numbers may not add because of rounding.
a. Due 10 plan amendmenl changing Districl Council 47 employees' plan stalus.b. Allocated in propor1ion 10 lhe number ofaclive and nonaclive members in each division as of July I, 1998,
52
MAJOR FEATURES OF THE RETIREMENT SYSTEM
1967 PLAN
53
MUNICIPAL (PLAN J) UNIFORMED (PLANS D AND XJ
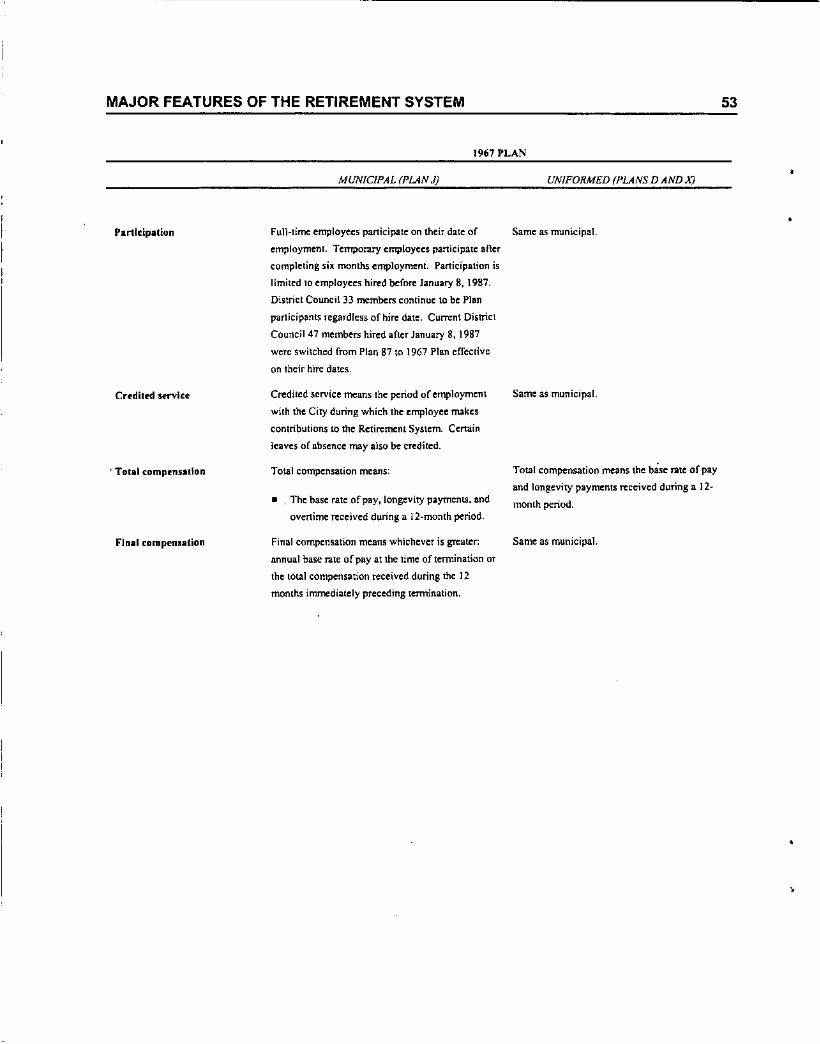
Participation Full-lime employees participate on their dale of Same as municipal.
employment. Tempol11ry employees participate lifter
completing six months employment. Participation is
limited 10 employees hired before January 8, 1987.
District Council 33 members continue 10 be Plpn
participants regardless of hire dale. Current District
Council 47 members hired after January 8, 1987
were switched from Plan 87 to 1967 Plan tllect! •••e
on their hire dales,
Credited service
. Total compenutlon
Final compenlalion
Credited service means the period of employment
with the Cit)' during which the employee makes
contributions to the Retirement System. Cenain
leaves of absence may also be credited.
Total compensation means:
• , The base rale nfpay, longevity payments. and
ovenime received during a l2-month period.
Final compensation means whichever is greater:
annual base rale of pay atlhe lime of termination or
the total compensation received during the 12
months immediately preceding termination.
Same as municipal.
Total compensation means the base rale of pay
and longevity payments received during a 12-
month period.
Same as municipal.
MAJOR FEATURES OF THE RETIREMENT SYSTEM
1967 PLAN
54
• Average final compensation
MUNICIPAL (PLAN J)
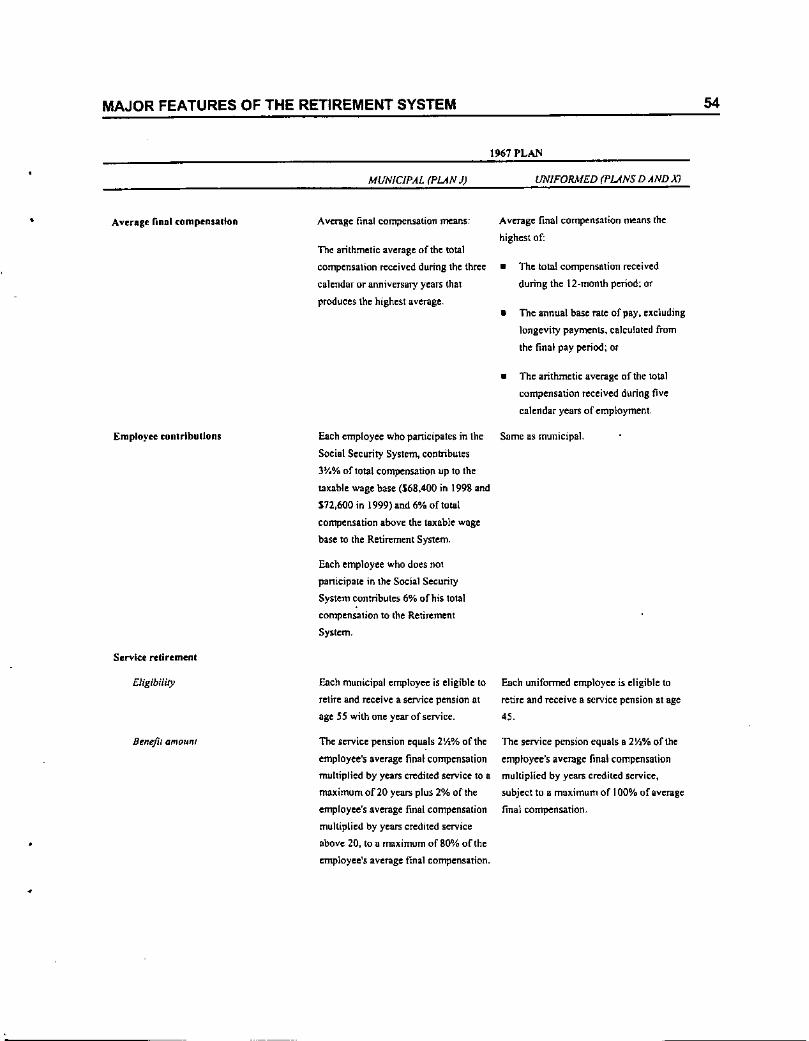
AVenlge final compensation means:
The arithmetic average of the total
compensation received during the three
calendar or anniversary years that
produces Ihe highest averngc.
UNIFORMED (PUNS D AND XJ
Average final compensation means the
highest of:
• The total compensation received
during the 12-monlh period; or
• The annual base rate ofpoy. excluding
longevity payments, calculated from
the final pay period; Of
• The arithmetic average of the total
compensation received during fivecalendar years of employment.
Employee contributIons
Service retirement
Each employee who panicipates in the Same as municipal.Social Security System, contributes3\1.% oflotal compensation up to the
tannic wage base (168,400 in 1998 and172,600 in 1999) and 6% oflolal
compensation above the taxable wage
base to the Retirement System.
Each employee who does not
panicipale in the Social Security
System contributes 6% of his total
compensation to the Retirement
System.
•
Eligibility
Benefit amOUII/
Each municipal employee is eligible to
retire and receive a service pension lit
age SS with one year of service.
The service pension equals 2'h% of the
employee's average final compensalion
multiplied by years credited service to II
maximum of20 years plus 2% of the
employee's IIverage final compensation
multiplied by years credited service
above 20, to a maximum of 80"10 of theemployee's average final compensation .
Each unifonned employee is eligible to
retire and receive a service pension at age
45.
The service pension equals a 2Y.% of the
employee's average final compensation
multiplied by years credited service,
subject to a maximum of I 00% of average
final compensation.
MAJOR FEATURES OF THE RETIREMENT SYSTEM
1967 PLAN
55
Early retirement
MUNICIPAL (PLANJ) UNIFORMED (PLANS D AND X)
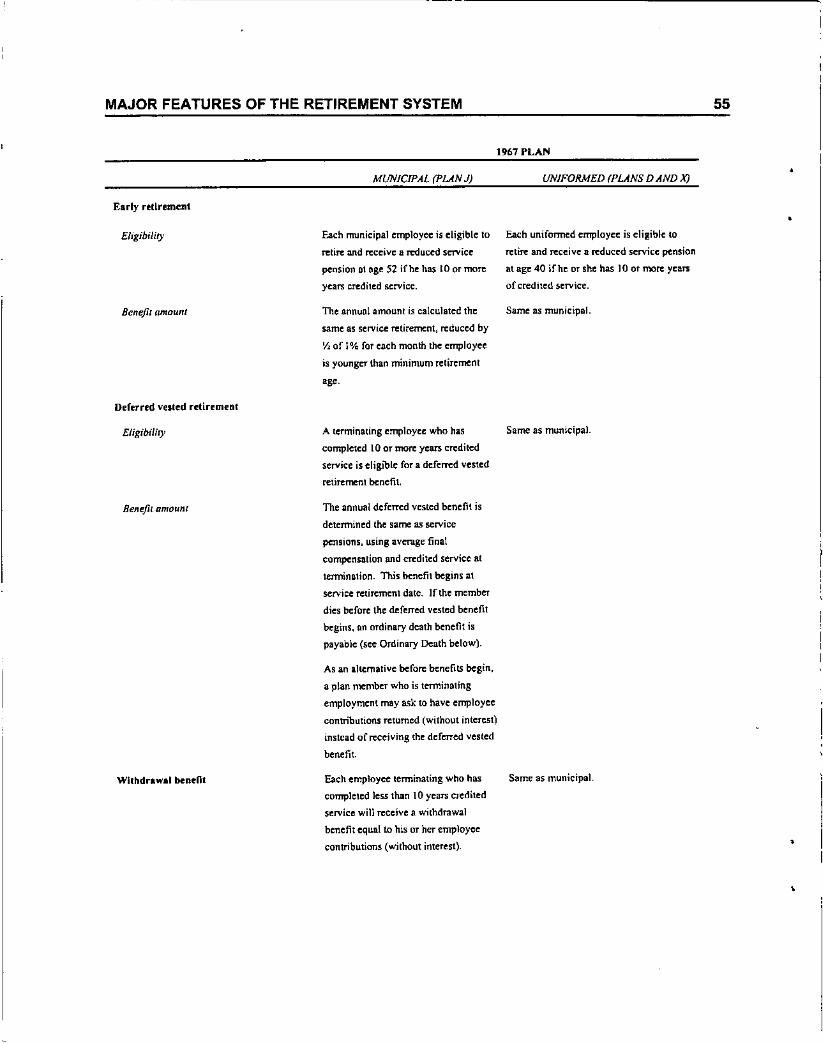
Eligibility Each municipal employ~ is eligible to Each uniformed employee is eligible 10
retire and receive II reduced sm-iec:
pension 0\ age 52 if he has 10 or more
years credited service.
retire lind receive a reduced service: pension
at age 40 if he or she has J 0 or more years
of credited service.
Beneftl amount
Deferred vested retirement
Eligibility
Benefit amount
The annual amount is calculated the Same as municipal.
same as service retirement, reduced by
II, of 1% for each month the employeeis youngu than minimum retirement
age.
A terminating employee who has Same as municipal.completed 10 or more years credited
service is eligible for a deferred vested
retirement benefit
The annual deferred vested benefit is
determined the same as service
pensions, using aVmlge final
compensation and credited service at
tef11lination. This benefit begins lit
service retirement date. If the member
dies before the deferred vested benefit
begins, an ordinary death benefit is
payable (see Ordinary Death below).
As an alternative before ~nefits begin,
a plan member who is terminating
employment may ask to have employce
contributions returned (without interest)
instead of receiving the deferrcd vcsted
benefit.
Withdrawal beneOt Each employee tcrminating who has
complcted less than 10 years credited
service will receive a withdrawal
benefit cqual to his or her cmployee
contributions (without interest).
Same as municipal.
,
,
MAJOR FEATURES OF THE RETIREMENT SYSTEM
1967 PLAN
56
•Serviee-eonnuted death
MUNICIPAL (PLANJ) UNIFORMED (PLANS D AND Xl
Eligibility
Benefil amount
Ordinary death
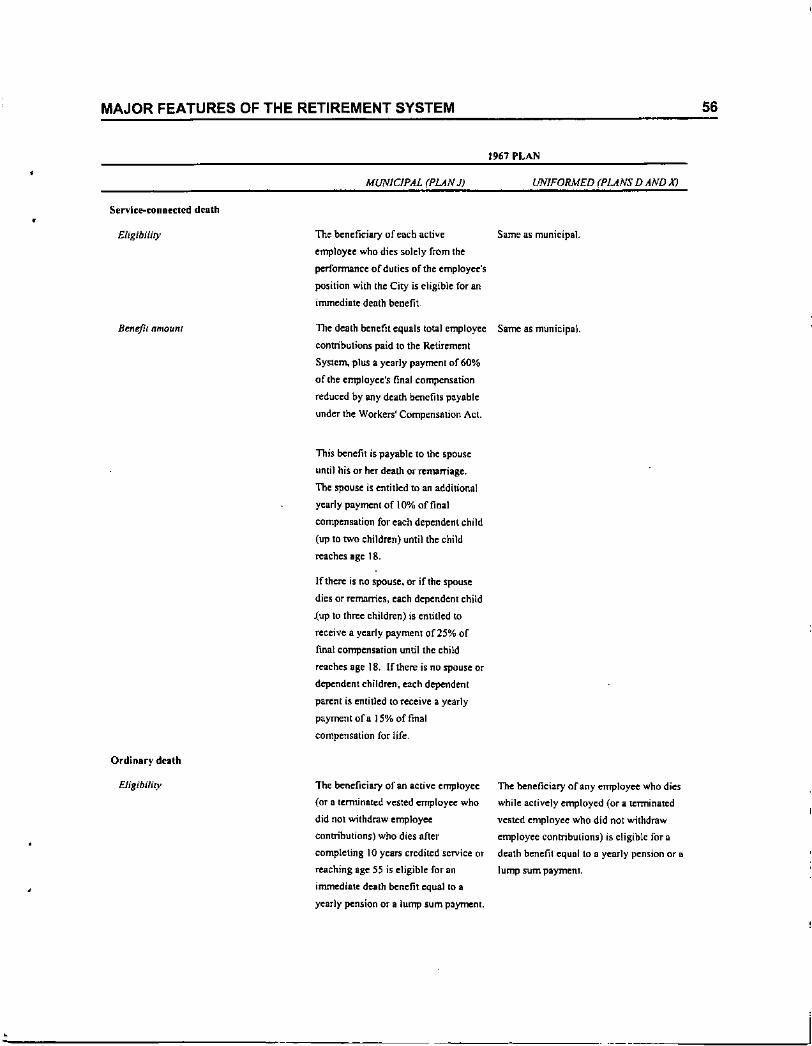
The beneficiary of each active Same as municipal.
employee who dies solely from lheperfonnance of dulies of the empJoyec:'sposition with the City is eligible for animmediate death benefit
The death benefit equals total employee Same as municipal.conttibulions paid to the Retirement
System, plus II yearly payment of 60%
of [he employee's final compensation
reduced by llf1ydeath benefits payableunder the Workers' Compensation Act.
This benefit is payable to Iht spouse
until his or her death orremarTiage.
The SJXluscis entitled to an additionalyearly payment of 10"10 affinalcompensation for each dependent child
(up 10 two children) until the child
reaches age 18.
If there is no spouse. or if the Spouse
dies or rernanies, each dependent child
~up to three children) is entitled to
receive a yearly payment of25% of
final compensation until the child
reaches age 18, If there is no 5pouseor
dependent children. each dependent
parentis entitled to receive a yearly
payment of a IS% of final
compensation for life.
Eligibiliry The beneficiary of an active employee
(or a terminated vested employee who
did not withdraw employee
contributions) who dies after
completing 10 years credited service or
reaching age 55 is eligible for an
immediate death benefit equal to a
yearly pension or a lump sum payment.
The beneficiary orany employee who dies
while actively employed (or a terminated
vested employee who did not withdraw
employee contributions) is eligible for I
death benefit equllto a yearly pension or I
lump sum payment.
MAJOR FEATURES OF THE RETIREMENT SYSTEM
1967 PLAN
57
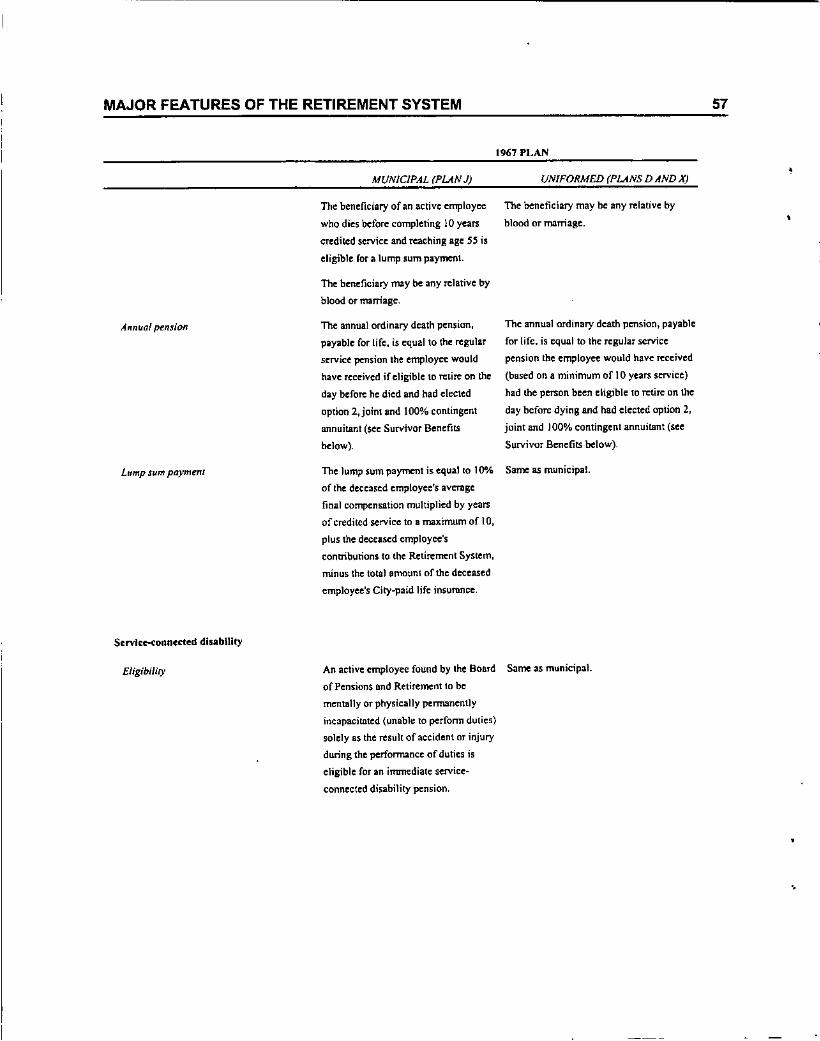
Annual pension
Lump Sllm paymenl
ServleM:onnected disability
MUNICIPAL (PLANJ)
The beneficiary of an lU:tive employee
who dies before completing 10 years
credited service and reaching age 55 is
eligible for a lump sum payment.
The bmdicilll')' may be any relative by
blood or marriage.
The annual ordinary death pension,
payable for life. is equal to the regular
servi~ pension the employee would
have received if eligible 10 retire on the
day before he died and had elected
option 2,joinl and 100% contingent
annuitant (see Survivor Benefits
below).
The lump sum payment is equal 10 ]O"A,
of the deceased employee's avertlgc
final compensation multiplied by years
of credited service to a maximum of 10,
plus the deceased employee's
contributions to the Retirement System,
minus the total amount oflhe deceased
employee's City-paid life insumnce,
UNIFORMED (PUNS D AND X)
The beneficiary may be any relative by
blood or marriage.
The annual ordinary death pension, payable
for life. is equal to the regular service
pension the employ~ would have received
(based on a minimum of 10 years service)
had the person been eligible to retire on the
day before dying and had elected option 2,
joint and 100% contingent annuitant (see
Survivor Benefits below).
Same as municipal.
£/igibi/il)' An active employee found by the Board Same as municipa1.
of Pensions Dnd Retirement to be
mentally or physically permanently
incapacitnted (unable to perform duties)
solely as the result of accident or injury
during the performance of duties is
eligible for an imrrn:diate service-
connected disability pension,
.•
MAJOR FEATURES OF THE RETIREMENT SYSTEM
1967 PLAN
58
• MUNICIPAL (PUN J) UNIFORMED (PUNS D AND X)
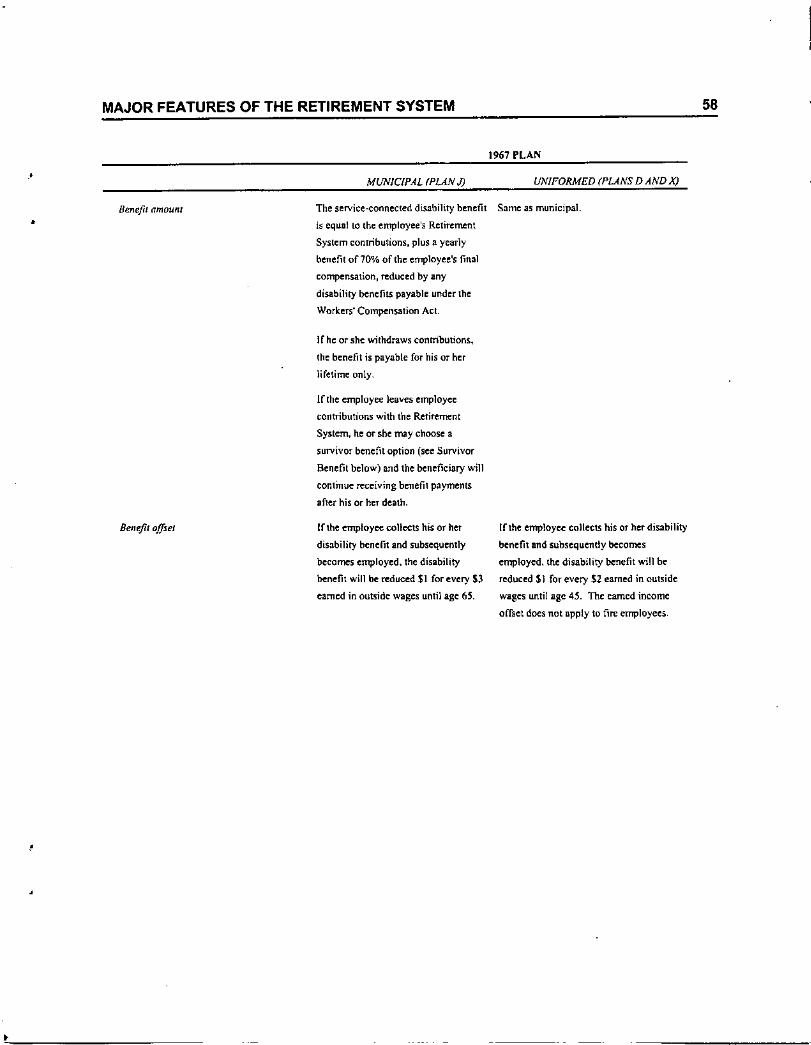
•Benefit amOU/Il Tile service-<:onnected disability benefit Same as municipal.
is equal to the employee's Retirement
System contributions, plus a yearly
benefit of70% of the employee's final
compensation, reduced by any
disability benefits payable under the
Workers' Compensation Act.
If he or she withdraws contributions,
the benefit is payable for his or her
lifetime only.
If the employee leaves employee
contributions with the Retirement
System, he or she may choose asurvivor benefit option (see Survivor
Benefit below) and the beneficiary will
continue receiving benefit payments
aOer his or her dea\ll.
•
•
Benefit offset lflhe employee ca1lcets his or her
disability benefit and subsequently
becomes employed, the disability
benefit will be reduced $1 for every $3
earned in outside wages until age 6S.
If the employee collC(:ts his or her disability
benefit and subsequently be{:omes
employed, the disability benefit will be
reduced SI for every $2 earned in outside
wages until age 4S. The earned income
offset does not apply to fire employees .
MAJOR FEATURES OF THE RETIREMENT SYSTEM
1967 PLAN
59
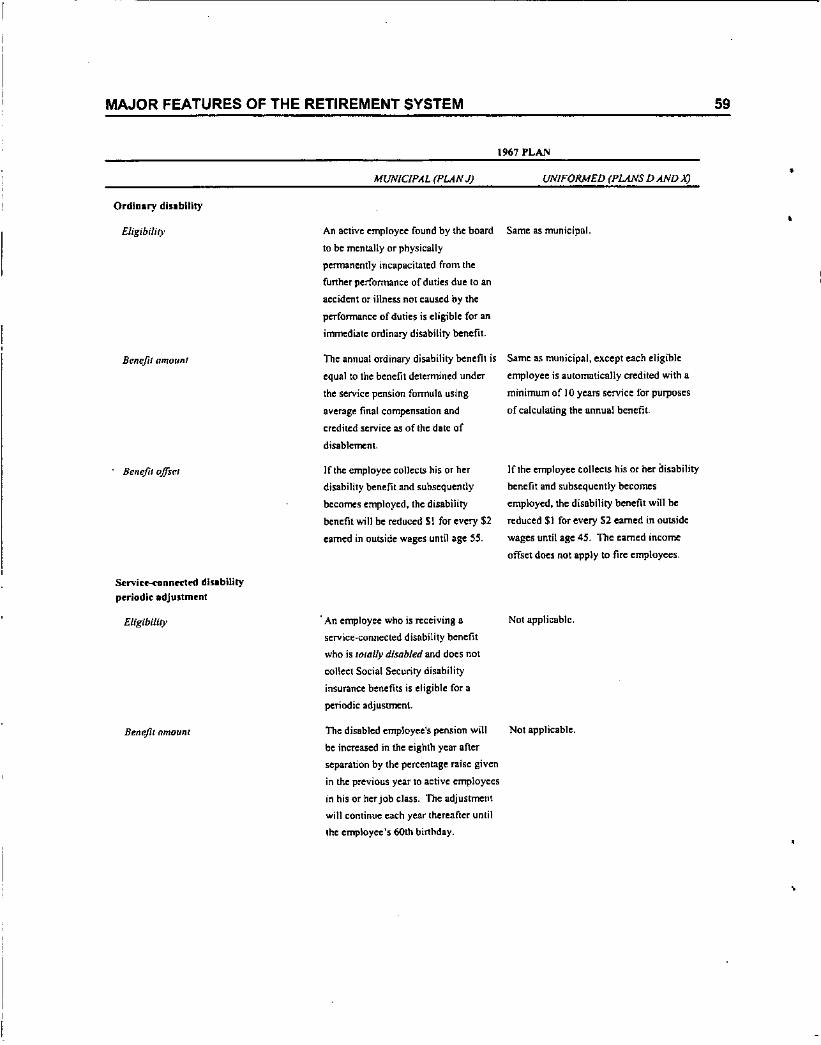
Ordinary disability
Eligibility
Benefit amQunt
Benefit ojJseT
Servil:e-c1Innn:led disabilitypC'riodic adjustment
MUNICIPAL (PLAN J)
An active employee found by tile board
to be mentally or physically
permanently incapacitated from the
furthcrpenormance of dUlies due to an
accident or illness nOI caused by the
performance of duties is eligible for an
irnrncdiale ordinal)' disability benefit.
The annual ordinary disability henefit isequal 10 the benefit determined undCT
the: service pension formula using
nverage final compensation and
credited service as of the dale of
disablement
If the employee collects his or her
disability benefit and suhsequently
becomes employed, the disability
benefit will be reduced 51 for every $2
earned in outside wages unlil age 55.
UNIFORMED (PLANS D AND A)
Same as municipal.
Same as municipal, except each eligible
employee is automatically credited with a
minimum of 10 years service for purposes
of calculating the annual benefit.
If the employee collects his or her disability
benefit and subsequently becomes
employed, the disability benefit will be
n:duced $1 for every $2 earned in outside
wages until age 45. The earned income
offset does 1I0t apply to fin: employees.
•
Eligibility
Benefit nmoullt
An tlTlJ'loyee who ISn:celvlng a Not applicable.
service-connected disability bellefit
who is lo/ally disabled alld does not
collect Social Security disability
insul'llnce benefits is eligible for a
periodic adjustmtnl.
The disabled employee's pension will Not applicable.
be increased in the eighth year after
separation by the percentage raise given
in the previous year to active employees
in his or her job class. The adjustment
will contillue each year thereafler ulllil
Ihe employec:'s 60th birthday.
,
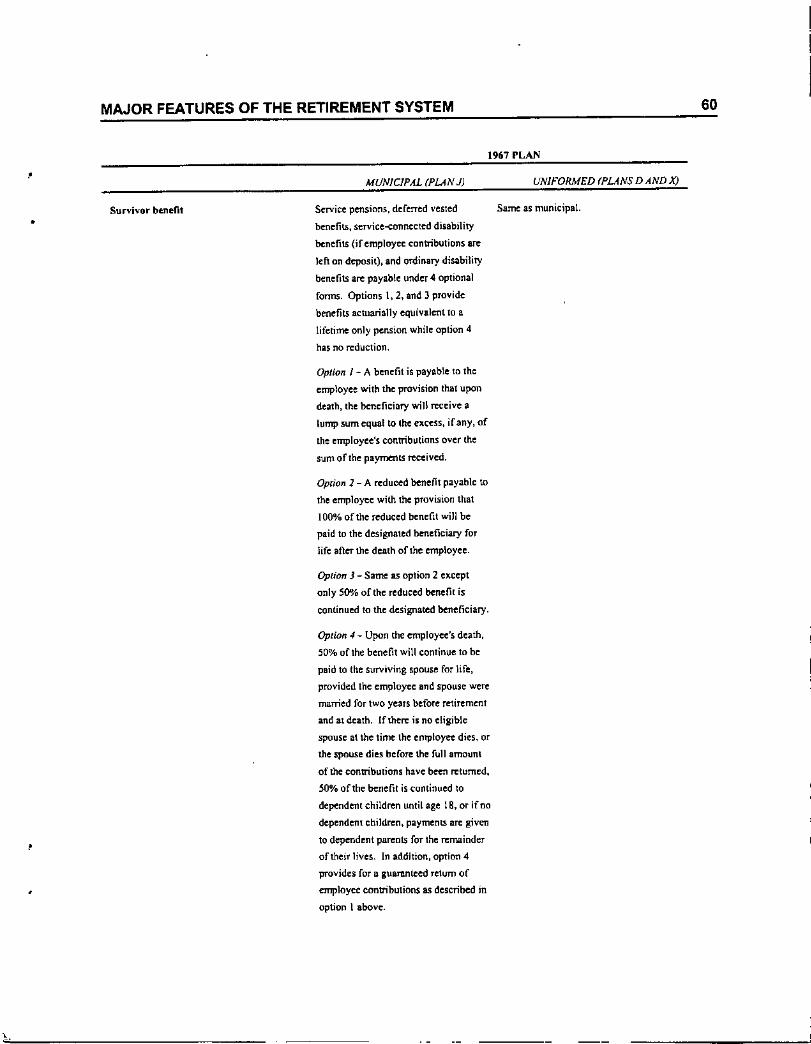
MAJOR FEATURES OF THE RETIREMENT SYSTEM 60
,MUNICIPAL (PLAN J)
1967 PLAN
UNIFORMED (PLANS D AND X)
•
,
Survivor benefit Service pensions. deferred vested Same as municipal.
benefit.>, service-eonneCled disability
benefits (if employee: contributions are
left on deposit), and ordinary disability
benefits are payable under 4 optional
fonns. Options 1,2, and J providebenefits acluarially equivalent to a
lifetime only pension while option 4
has no reduction.
Option 1- A benefit is payable to the
employee with the provision that upon
death, the beneficiary will receive a
lump sum equal to tile ellteSS, if any. of
the employee's contributions over the
sum cfllle payments received.
Option 1- A reduced benefit payable 10
the employee with the provision that
100% cfllle reduced benefit will be
paid to the designated beneficiary for
life after the death of the employee.
Option 3 - Same as option 2 e)';cept
only 50"/0 ofthc reduced benefit is
continued 10 the designated beneficiary.
Option 4 - Upon the employee's death,
50% of the benefit will continue to bepaid to the surviving spouse for life,
provided the employee and spouse were
married for two years before retirement
and at death. If there is no eligible
spouse at the time the employ~ dies, or
the spouse dies before the full amount
of the contributions have been returned,
50% of the tJ.cnefit is continued to
dependent children until age 18, or ifno
dependent children, payments arc given
to dependent parents for the remainder
of their lives. In addition, option 4
provides for a gullt1lnlCed return of
employee contributions as described in
option 1 above.
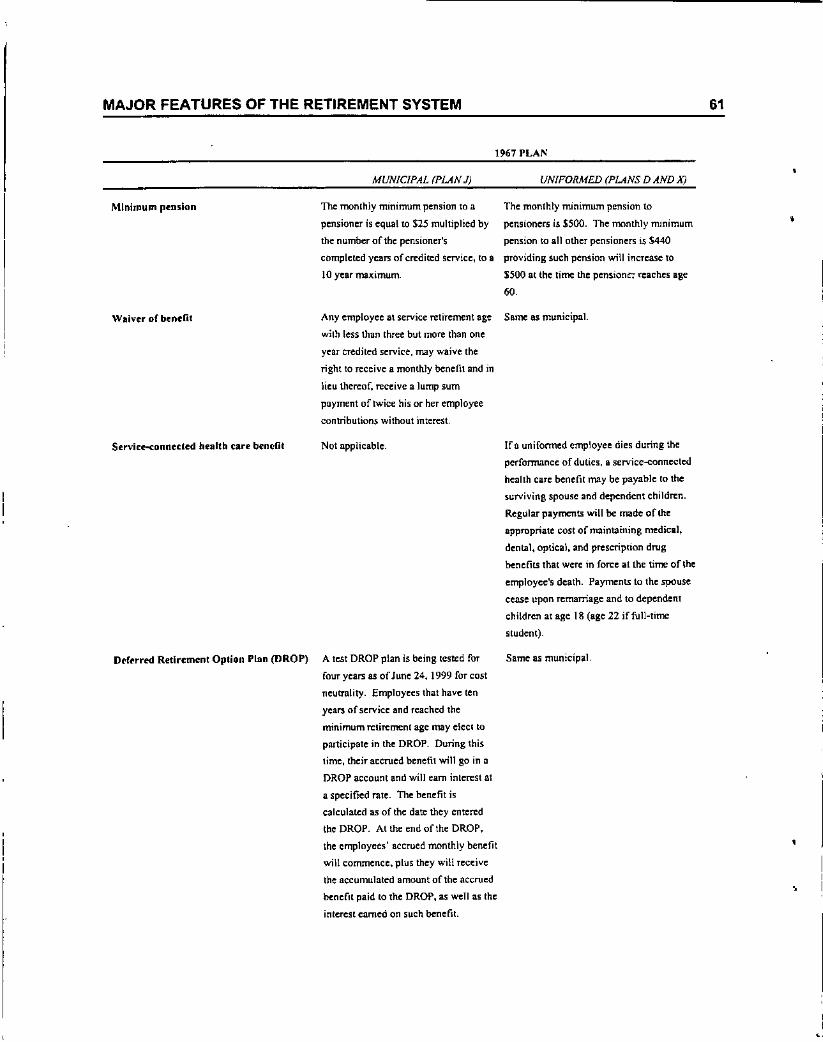
MAJOR FEATURES OF THE RETIREMENT SYSTEM
1967 PLAN
61
Minimum pension
MUNICIPAL (PLAN J)
The monthly minimum pension 10 a
pensioner is equal to $25 multiplied by
Ihe number of the pensioner's
completed years of credited service, to a
10 year maximum.
UNIFORMED (PLANS D AND X)
The monthly minimum pension to
pensioners is 1500. The monthly minimum
pension to all other pensioners is S440
providing such pension will increase to
1500 at the lime the pension~ rcaches age
60
•
Any employee al service retirement age Same as municipal.
with less than three but more than one
year credited service. may waive the
right to receive a monthly benefilllnd in
lieu thereof, receive a lump sum
payment of twice his or her employee
contributions without interest.
Servic~onnecled health carl' bcnc(lt NOlllpplicable. Ifn uniformed employee dies during the
perfOTTTUlnceof duties. a service-connected
health care benefil may be payable 10 the
surviving spouse and dependent children.
Regular payments will be made of the
appropriate cost of maintaining medical,
dental, optical. and prescription drug
henefits that were in force at the time oflhe
employee's death. Payments to the spouse
cease upon remarriage and to dependent
children at age 18 (age 22 iffull-timc
student)_
Dcftrred Retirement Option Plan (DROP) A test DROP plan is being tested for
four years as of June 24, 1999 for cost
neutrality. Employees that have ten
years of service and reached the
minimum retirement age may elect to
participate in the DROP. During this
time, their accrued benefit will go in a
DROP account and will earn inlerest al
a specified rate. The benefit is
calculated as of the date they entered
the DROP. At the end of the DROP,
the employees' accrued monthly benefit
will commence, plus they will receive
the accumulaled amount of the accrued
benefit paid to the DROP, as ~11 as lhe
inlerest earned on such benefit.
Same as municipal.
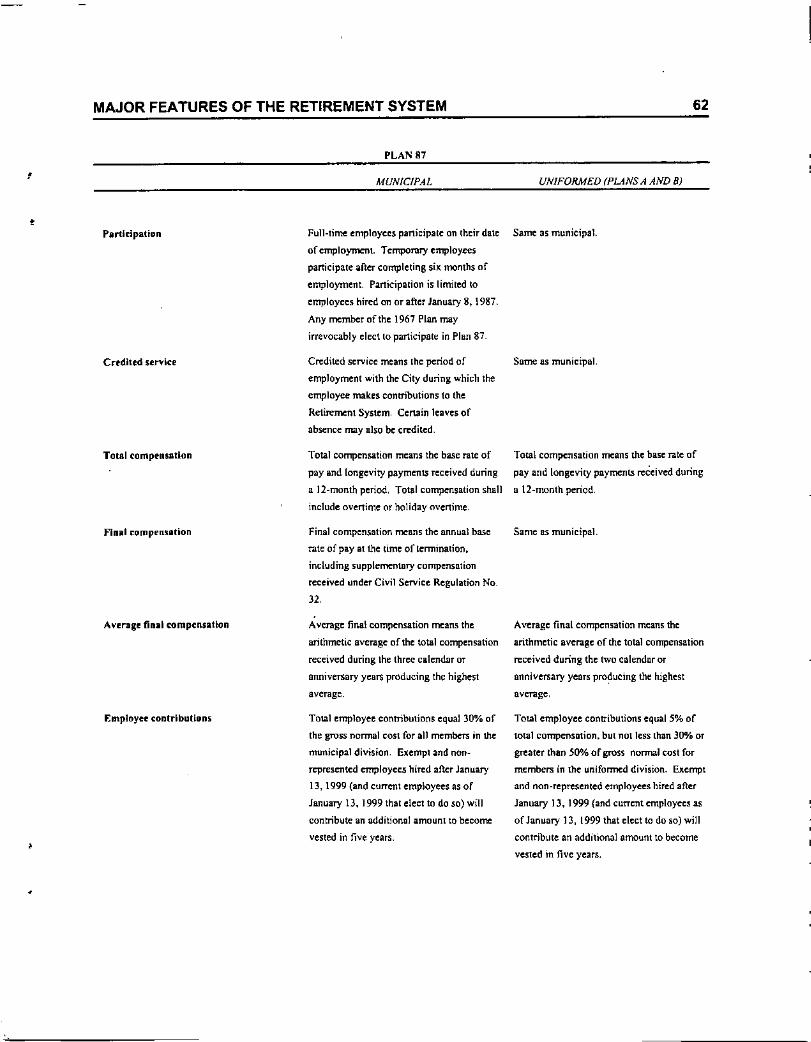
,
•
MAJOR FEATURES OF THE RETIREMENT SYSTEM
PLAN 87
MUNICIPAL
62
UNIFORMED (PUNS A AND B)
•
Particlpation
Credited service
Total compensation
Final compensation
Average final compensatlon
Employer contributions
Full-time employees participate on their dale
of employment. TempornT)' employees
participate after completing si~ months of
employment. Participation is limited to
employees hired on or after January 8, 1987.
Any member of the 1967 Plan may
irrevocably elect 10participate in Plan 87.
Credited service means lhe period of
employment with the City during which lhe
employee makes contributions \0 the
Retirement System. Cerlllin leaves of
absence may also be credited.
Total compensation means the base rale of
pay and longevity payments received during
a 12-month period, TOlal compensation shall
include ovenime or holiday overtime.
Final compensation means the annual base
rale afpay at the time oftennination.
including supplemrnlDry compensation
received under Civil Service Regulation No.
32.
Average final compensation means the
arilltmetic average of the tOllll compensation
received during the three calendar or
anniversary years producing the highest
average.
TOlDl employee contributions equal 30% of
the gross nonnal cOSt for all members in the
municipal division. Exempl and non-
represented employees hired after January
13. 1999 (and current employees as of
January 13, 1999 thai elect to do so) will
contribute an additional amount to become
vested in live years.
Same as municipal.
Same as municipal.
TOllll compensation means the base ralc of
pay and longevity payments reCeived during
a 12-month period.
Same as municipal.
Average final compensation means the
arithmetic average of the tOllll compensation
received during the two calendar or
anniversary years producing the highest
average,
Total employee contributions equal 5% of
total compensation. but nOl less than 30% or
greater lhan 50% of gross nonnal cost for
members in the uniformed division. Exempt
and non-represented employees hired after
January 13, 1999 (and current employees as
of January 13, 1999 that elect to do so) will
contribute an additional amount to become
vested in livc years .

MAJOR FEATURES OF THE RETIREMENT SYSTEM
PLAN 87
MUNICIPAL
63
UNIFORMED (PLANS A AND B) •
Eligibility
Benefit omoum
Earl}" retirement
Eligibility
Benefit amount
Defured vesled retlremenl
Each municipal employee is eligible to retire
and receive a service pension at age 60 and ifhe Of she has 10 or more years afcreditedservice aT, iftheemployee made additionalcontributions to become vcsted in five years,
five years afcredited service.
The service pension equals 2.2% oflhe
employee's average final compensation for
the first 10 years of credited service, plus 2%
of the employee's average final compensation
multiplied by years of service over 10.
Each municipal employee is eligible to retire
and receive a reduced service pension at ngc
52 ifhc has 10 or more years credited
service. As an alternative, a member is
eligible ifhe or she has 33 years credited
service. regardless of age.
The annual amount is calculated the SlIme as
service retirement, reduced by V.of I% for
each month the employee is younger than
minimum retirement age. Benefits are not
reduced if the employee has 33 or more years
of credited service,
Each uniformed employee is eligible to retire
and re<:eive a service pension upon reaching
age 50 and 10 or more years of credited
service, or, if the employee made additional
contributions to become vested in five years,
five years of credited service.
The service pension equals 2.2% of the
employee's average final compensation
multiplied by years of credited service to a
maximum of20 years, plus 2% of the
employee's average final compensation
multiplied by years of credited service over
20.
Each unifonned employee is eligible to retire
and receive a reduced service pension at age
40 ifhe or she has 10 or more years of
credited service. Alternatively, a member is
eligible ifhe has 2S years credited service,
regardless of age.
The annual amount is calculated the same as
service retirement, reduced by V. of 1% for
each month the employee is younger than his
minimum retirement age. Benefits are not
reduced ifthe employee has 25 or more years
of credited service.
Eligibility A employee tenninating employment and Same as municipal.
who completed 10 or more years credited
service or, if the employee made additional
contributions to become vested in five years,
five years of credited service, is eligible for a
deferred vested retirement henefit ifhis or
her contributions have not been withdrnwn.
•
,
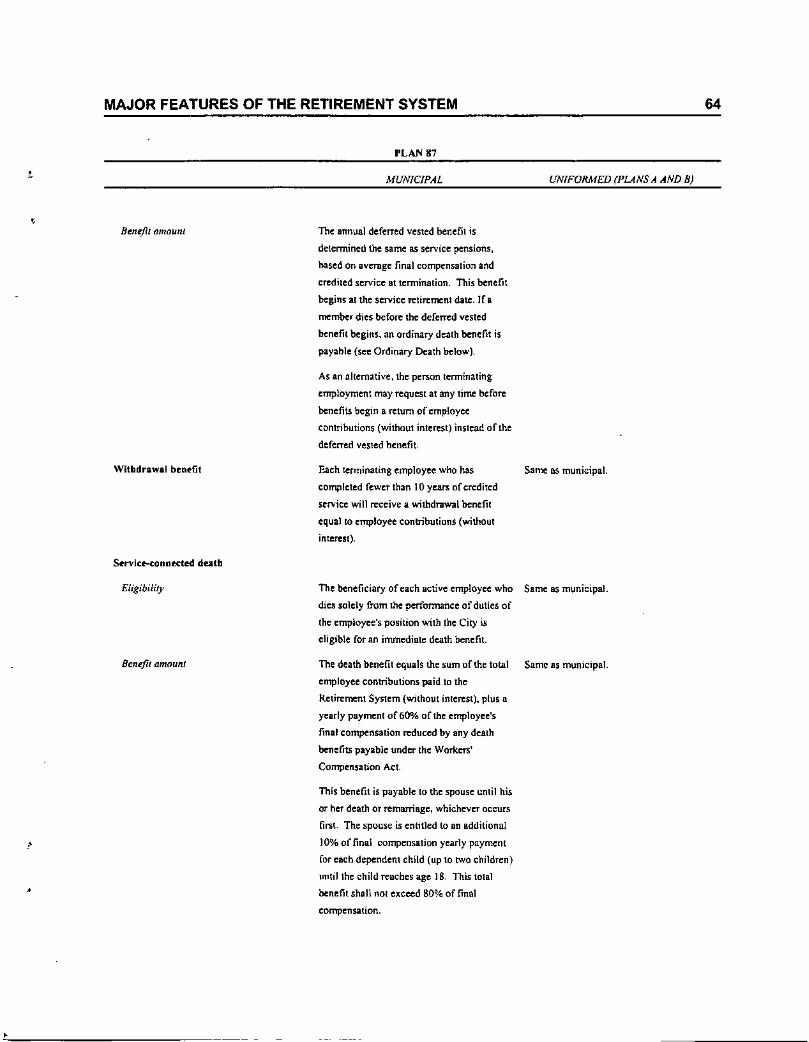
MAJOR FEATURES OF THE RETIREMENT SYSTEM
PLAN 117
64
Benefit amOUni
Withdrawal ben ••fit
Service.conneded death
MUNICIPAL
The annual deferred vested benefit is
determined the same as service penSions,
hased on aVCTllge final compensation and
credited service at termination. This benefit
begins at the service retirement dale. If a
member dies before the deferred vested
benefit begins, an ordinary dealh benefit is
payable (s~ Ordinary Death below).
As an alternative, the person terminating
employment may request at any time before
benefits begin a return of employee
contributions (without interest) instead ofthe
deferred vested benefit.
Each terminating employee who hascompleted fewer than 10 years of credited
service will rel:cive a wilhdT'llwal benefit
equal to employee conbibutions (without
interest).
UNIFORMED (PLANS A AND B)
Same as municipal.
•
Eligibility
Benefit amount
The beneficiary of each active employee who Same as municipal.
dies solely from Ihe performance of duties of
the employee's position wilh the Cil)' is
eligible for an immediaie death benefit
The death benefit equals the sum of the tolal Same as municipaL
employee contributions paid to the
Relirement System (without interest), plus II
yearly payment of60% of the employee's
final compensalion reduced by any death
benefits payable under the Workers'
Compensation Act.
This benefit is payable 10 the spouse until his
or her death or remarriage, whichever oceurs
first. The spouse is entitled to an additional
10% of final compensalion yearly payment
for each dependent child (up 10 two children)
unlilthe child reaches age 18. This 10lal
benefit shall not exceed 80% of final
eompensation.
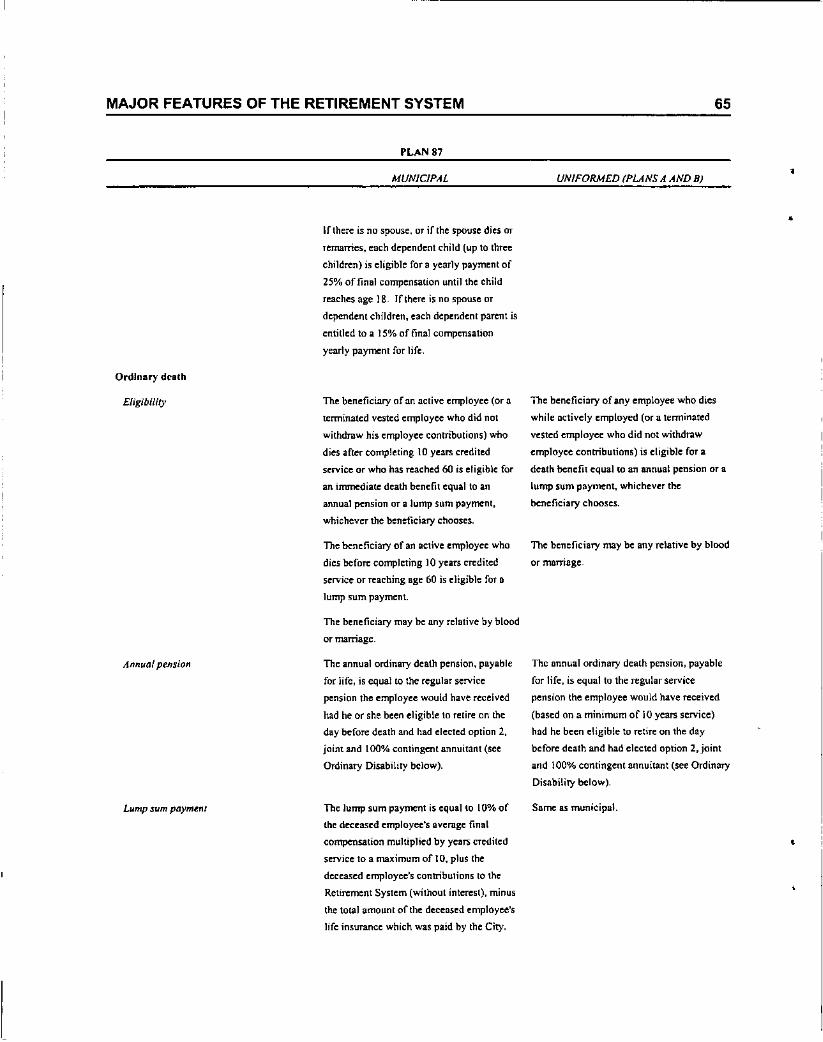
MAJOR FEATURES OF THE RETIREMENT SYSTEM
PLAN 87
MUNICIPAL
Ifthel'<: is no spouse, or if the spouse dies or
remarries, cach dependent child (up to three
children) is eligible for a yearly payment of
25% affinal compensation until the child
reaches age 18. '(there is no spouse or
dependent children, each dependent parent is
entitled to a 15% of final compensation
yearly payment for life.
Ordinary dulh
65
UNIFORMED (PLANS A AND B),
•
Eligibility
Annllal pensian
Lllmp Slim payment
The beneficiary of an active employee (or II
terminated vested employee who did nOI
withdraw his employee contributions) who
dies after completing \0 yurs credited
service or who has reached 60 is eligible for
an illlJl'lediate death ~ndil equal to an
annual pension or a lump sum payment,
whichever the beneficiary chooses.
The beneficiary of an active employee who
dies before completing 10 years eredited
service or reaching age 60 is eligible for a
lump sum payment.
The beneficiary may be any relative by blood
or marriage_
The annual ordinary death pension, payable
for life, is equal to the regular service
pension the employee would have received
had he or she been eligible to retire on the
day before death and had elected option 2,
joint and 100% contingent annuitant (see
Ordinary Disability below).
The lump sum payment is equal 10 10%of
the deceased employee's average final
compensation multiplied by years credited
service to a maximum of 10, plus the
deceased employee's conltibulions to the
Retirement System (without interest), minus
the total amount of the deceased employee's
life insurance which was paid by the City.
The beneficiary of any employee who dies
while actively employed (or a tenninated
vested employee who did not withdraw
employee contributions) is eligible for a
death benefit equal 10 an annual pension or a
lump sum payment, whichever the
beneficiary chooses.
The beneficiary may be any relative by blood
or marriage_
Thc annual ordinary death pension, payable
for life, is equal to the regular service
pension the employee would have received
(based on II minimum of 10 years service)
had he been eligible to retire on the day
before death and had elected option 2,joint
and 100% contingent annuitant (see Ordinary
Disability below).
Samc as municipal.
•
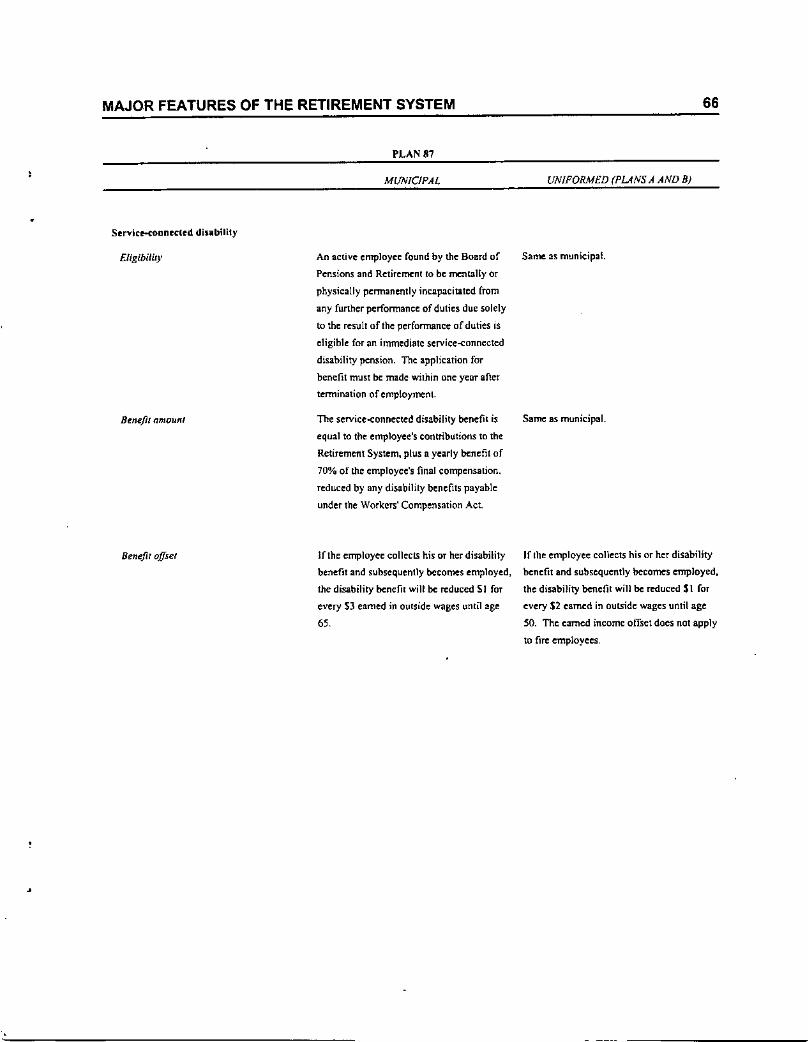
MAJOR FEATURES OF THE RETIREMENT SYSTEM
PLAN 87
MUNICIPA.L
Servicr-(Oonected dinbility
66
UNIFORMED (PLANS A AND B)
•
Efigibilil}'
Benefit amount
BenefiT offset
An active employee found by the Board of
Pensions and Retiremenl 10 be mentally or
physically permanently incapacitated from
any funher performance of duties due solely
to the result ufthe performance of duties is
eligible for an immediate service-connecled
disability pension. The application for
benefit mUSl be:made within one year after
termination of employmenL
The service-connected disability benefit is
equal to the employee's contributions In the
Retirement System. plus n yearly benefit of
70% of the employee's final compensation.
reduced by any disabilily benefits payable
under the Workers' Compensation Act.
If the employee collects his or her disability
benefit and subsequently beeomes employed,
the disability benefil will be reduced 51 for
every $J earned in oulside wages unlil age
65
Same as municipal.
Same as municipal.
If the employee collects his or her disability
benefit and subsequently becomes employed,
the disability benefit will be reduced $1 for
every $2 earned in outside wages until age
50. The earned income offset does not apply
to fire employees .
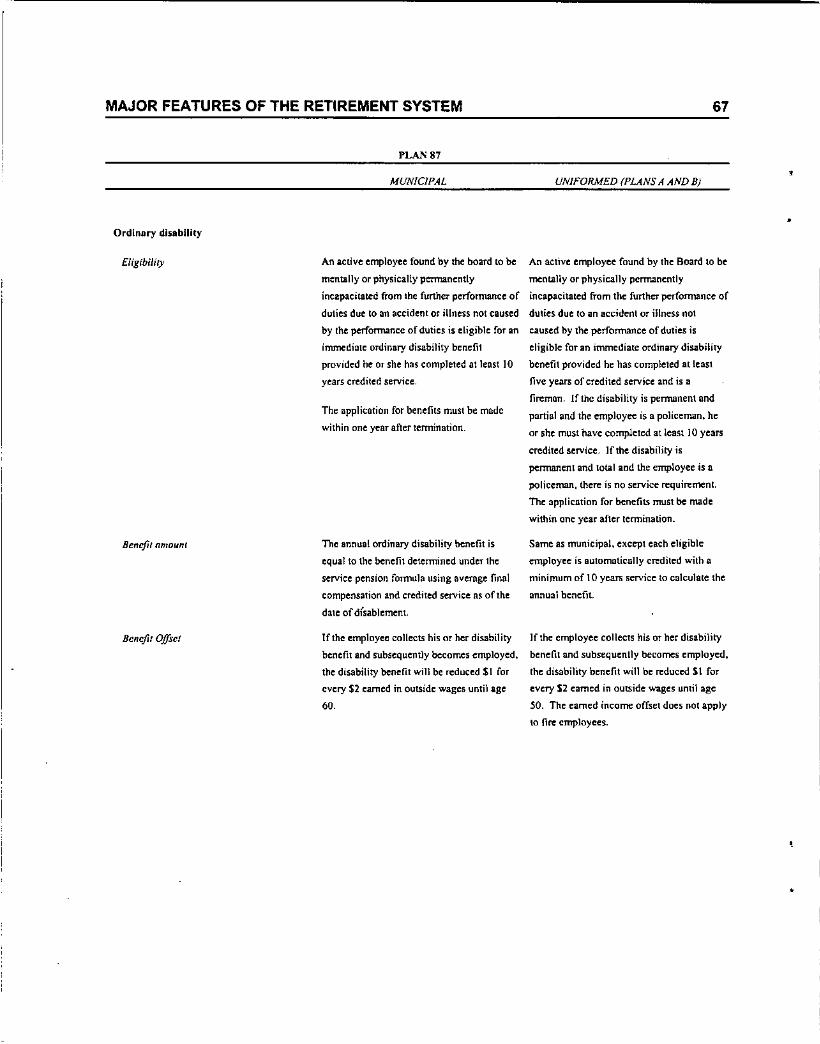
MAJOR FEATURES OF THE RETIREMENT SYSTEM
PLAN 87
MUNICIPAL
Ordillury dlublllly
67
UNIFORMED (PLANS A AND B),
E/igibiliry An active employee found by the board to be:
mentally or physically permanently
incapacitated from the fUlther performance of
An active employee found by the Board 10 be
mentally or physically permanently
incapacitated from 1M:further performance of
dulies due to an accident Of illness not caused dUlies due to an accident or illness not
Bl!ncfil nmounr
Benefit Offset
by the performance of duties is eligible for an
immediate ordinary disability benefit
provided he or she has completed allensllO
years credited service,
The application for benefits must be made
within one year after termination.
The annual ordinary disability benefit is
equal to the benefit determined under the
service pension fOllflula using average finalcompensation and credited service as of the
date of dIsablement.
If the employee co][octs his or her disability
benefit and subsequently becomes employed,
the disability benefit will be reduced $1 for
every $2 earned in outside wages until age
60
caused by the performance of duties is
eligible for an immediate ordinary disability
benefit provided he has completed at least
five years of credited service and is a
fireman. If the disability is permanent and
partial and the employee is a policeman, he
or she must have completed at leasllO years
credited service. If the disability is
permanent and total and the employee is II
policeman, there is no service requirement.
The application for benefits must be made
within one year after termination.
Same as municipal, except each eligible
employee is automatically credited with II
minimum of 10 years service to calculate the
annual benefit.
If the employee collects his or her disability
benefit and subsequently becomes employed,
the disability benefit will be reduced 1\ for
every $2 earned in outside wages until age
SO. The earned income offset docs not apply
\0 fire employees.
•
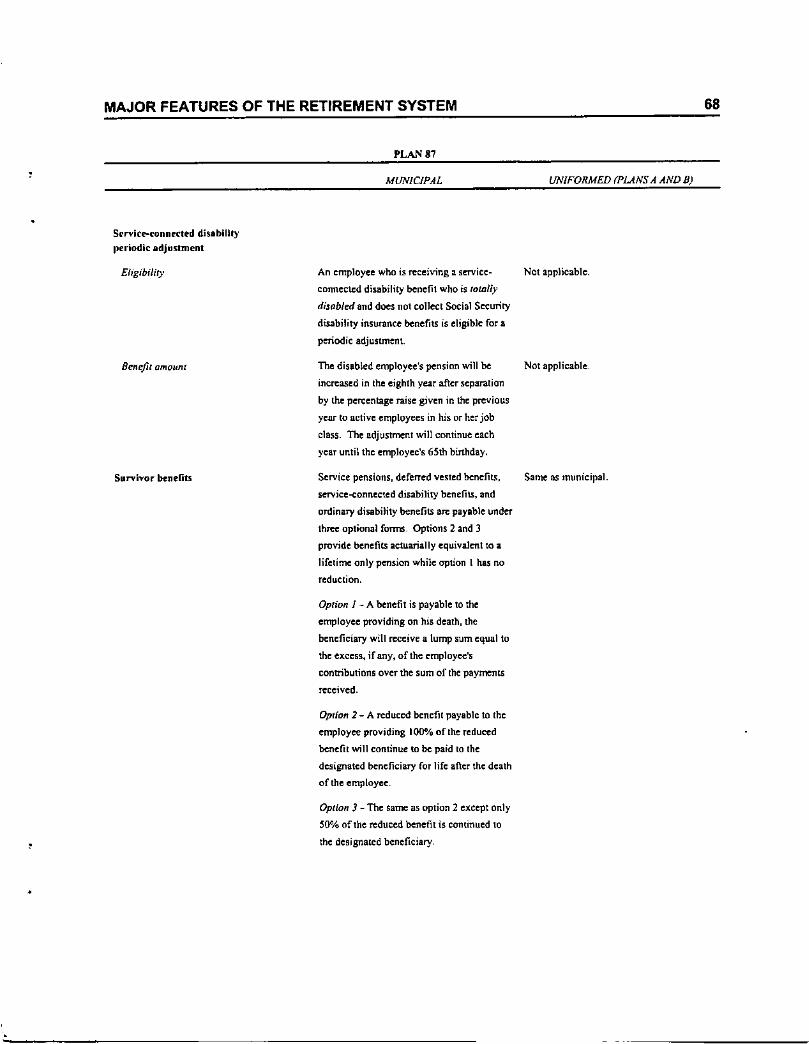
MAJOR FEATURES OF THE RETIREMENT SYSTEM
PLAN 87
68
Sfrvlce-connected disabilityperiodic adjustment
MUNICiPAL UNIFORMED (PLANS A AND B)
•
Eligibility
Benefit omOllni
Survivor br:ndlts
An employee who is receiving a service- Not applicable.
connected disability benefit who is /%l1y
disabled and does not co1Jee! Social Security
disability insurance benefits is eligible for a
periodic adjustmtnl.
The disabled employee's pension will be Not applicable.
increased in the eighth year after separation
by the percentage raise given in the previous
year to active employees in his or her job
class. The adjustment will continue each
year until the employee's 65th birthday.
Service pensions, deferred vested benefits. Same as municipal.service-eonnected disability benefits, andordinary disability benefits an: payable under
three: optional forms. Options 2 and)
provide benefits actuarially equivalent to a
lifetime only pensioo while option I has no
reduction.
Opl/on 1 - A benefit is payable to the
employee providing on his death, the
beneficiary will re<:eive a lump sum equal to
the excess, if any, of the employee's
contributions over the sum of the payments
received.
Oprion 2 - A reduced benefit payable to the
employee providing 100"/0of the reduced
benefit will continue 10 be paid to the
designated beneficiary for life after the death
of the employee.
Opl/on 3 - The same as option 2 except only
~O%of the reduced benefit is continued to
the designated beneficiary .
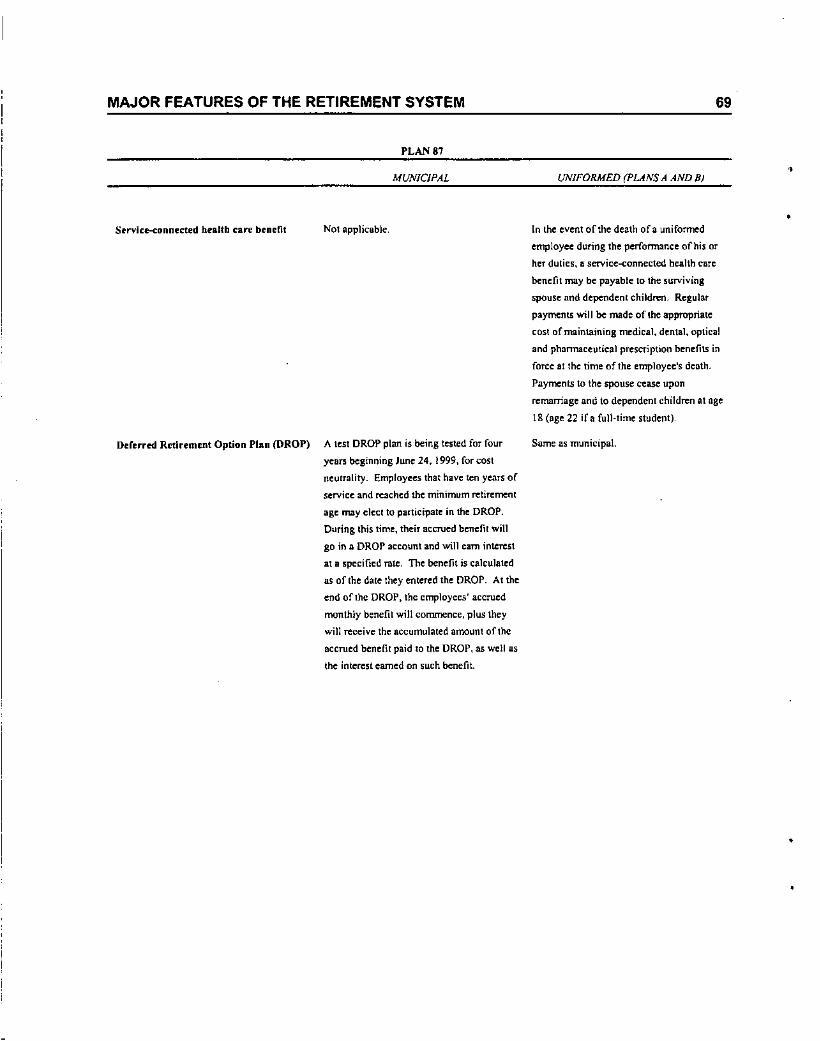
MAJOR FEATURES OF THE RETIREMENT SYSTEM
PLAN 87
MUNICiPAL
69
UNIFORMED (PUNS A AND 8) •
Servlce-<:onnected hulth !:aTe benefit Not applicable. In the event oflhl' death of a uniformed
employee during the performance of his or
her dulies, a service-connected health care
hendit may be payable 10 the surviving
spouse and dependent children. Regular
payments will be made of the appropriate
COSlofmaintaining medical, dental, optical
and phnnnaceutical prescription benefits in
force at the lime of the employee's death.
Payments to the spouse cease upon
remarriage lind to dependent children at age
1g (age 22 if II full-time student),
Deferred Retirement Option Plan (DROP) A lest DROPplan is being testedfor four Same liS municipal.years beginning June 24, 1999, for cost
neul1ality. Employus that have ten years of
service and reached the minimum reliT~menl
ag~ may ~1ecl to par1icipat~ in th~ DROP.
During this tim~, th~iT aCCT\l~db~n~lil will
go in a DROP account and will ~arn interest
al a sp~cili~d rate. The benelit is calculat~d
as of the date they entered th~ DROP. Atth~
end of the DROP, the employees' accrued
monthly benefit will commence, plus they
will receive the accumulated amount of the
accrued benefit paid 10 th~ DROP, as w~lIl1s
the interest earn~d on such benefit.
•
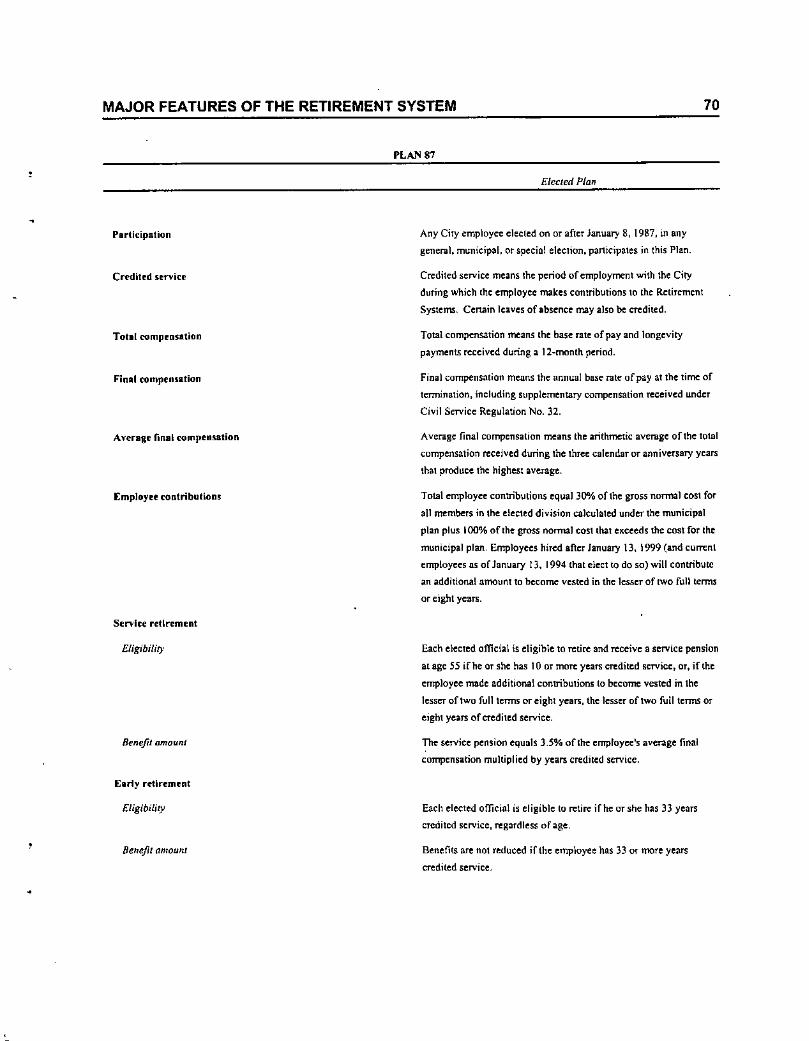
MAJOR FEATURES OF THE RETIREMENT SYSTEM
PLAN 87
Elected Plan
70
Participation
Credited srrvice
Tolal compensation
Average final compensation
Employu rontribution~
Service retirement
Eligibility
Benefil amall,,1
Euly rnlrement
Eligibility
Benefilllmoun/
Any City employee elected on or after January 8, 1987, in any
general, municipal. Of special election, panicipates in this Plan.
Credited service means the period of employment with the City
during which the employee makes contributions 10 the Retirement
Systems. Cenain leaves of absence may also be credited.
Total compensation means the base rail' of pay and longevity
paymenl5 received during a 12-month period.
Final compensation means the annual base rate of pay at the lime of
termination, including supplementary compensation received under
Civil Service Regulation No. 32.
Average final compensation means the arithmetic avcmge oflhl' totalcompensation received during the three calendar or anniversary years
that produce the highest average,
Total employee contributions equal 30"/0 of the gross normal cost for
all members in the elected division calculated under the municipal
plan plu~ 100% oflhe gross normal cost that e~ceed~ the cost for the
municipal plan. Employees hired after January 13, 1999 (and cum:nt
employees as of January 13, 1994 that elect to do so) will contribute
an additional amount to become vested in the lesser of two full terms
or eight years.
Each elected official is eligible to retire and receive a service pension
at age 55 ifhe or she has 10 or more years credited service, or, if the
employee made additional contributions to become vested in the
lessCTof two full terms or eight years, the lesser oflWo full terms or
eight years of credited service.
Tllc service pension equals 3.5% of the employee's average final
compensation multiplied by years credited service.
Each elected official is eligible to retire ifhe or she has 33 years
credited service, regardless of age.
Benefits arc not reduced if the employee has 33 or more years
credited service.
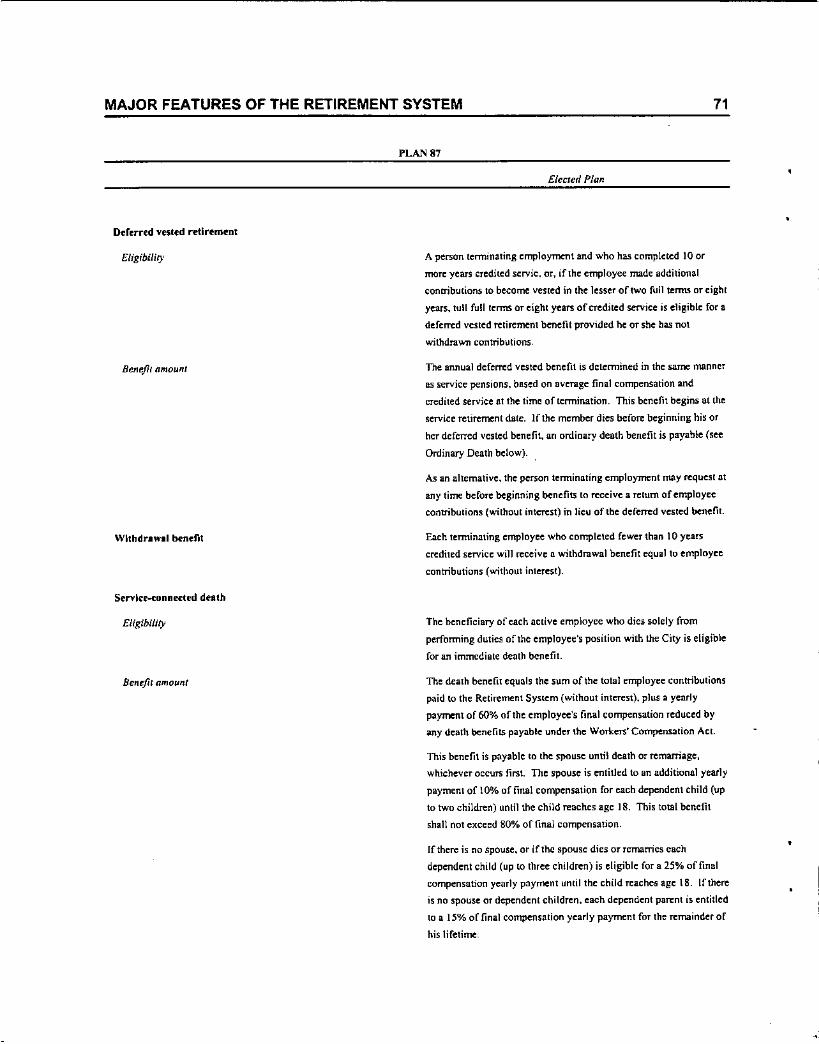
MAJOR FEATURES OF THE RETIREMENT SYSTEM
PLAN 8'
Inferred vested retirement
Elected Plan
71
EligibiUry
Benefil amount
Servlce.c:onnected death
Eligibility
Benefil amount
A person terminating employment and who has completed 10 or
more years credited servic. or, if the employee made additional
contributions 10 become vested in the lesser of two full tern'LS or eight
~ars, lull full terms or eight years afcredited service is eligible for II
deferred vested retirement benefit provided he or she has not
withdrawn contributions,
The annual deferred vesled benefit is determined in the same manner
as service pensions, based on average final compensation and
credited service lit the time of termination. This benefit begins at the
service retirement dale. lrthe member dies before beginning his or
her deferred vested benefit, an ordinary death benefit is payable (s~
Ordinary Death below).
As an alternative, the person terminating employment may request at
any time before beginning benefits to receive a return of employee
contributions (without interest) in lieu of the deferred vested benefit.
Each terminating employee who completed fewer than 10 years
credited service will receive a withdrawal benefit equal to employee
contributions (without interest).
The beneficiary of each active employee who dies solely from
performing duties of the employee's position with the City is eligible
for an immediate death benefit.
The death benefit equals the sum of the tolal employee contributions
paid to the Retirement System (without interest), plus a yearly
payment of 60% of the employee's final compensation reduced by
any death benefits payable under the Workers' Compensation Act.
This benefit is payable to the spouse until death or remaniage,
whichever occurs first. The spouse is entitled to an additional yearly
payment of 10% of final compensation for each dependent child (up
to two children) until the child reaches age 18. This total benefit
shall not exceed 80% of final compensation.
If there is no spouse, or if the spouse dies or remarries each
dependent child (up to three children) is eligible for a 25% offinal
compensation yearly payment until the child reaches age 18. If there
is no spouse or dependent children, each dependent parent is entitled
to a 15% of final compensation yearly payment for the remainder of
his lifetime.
•
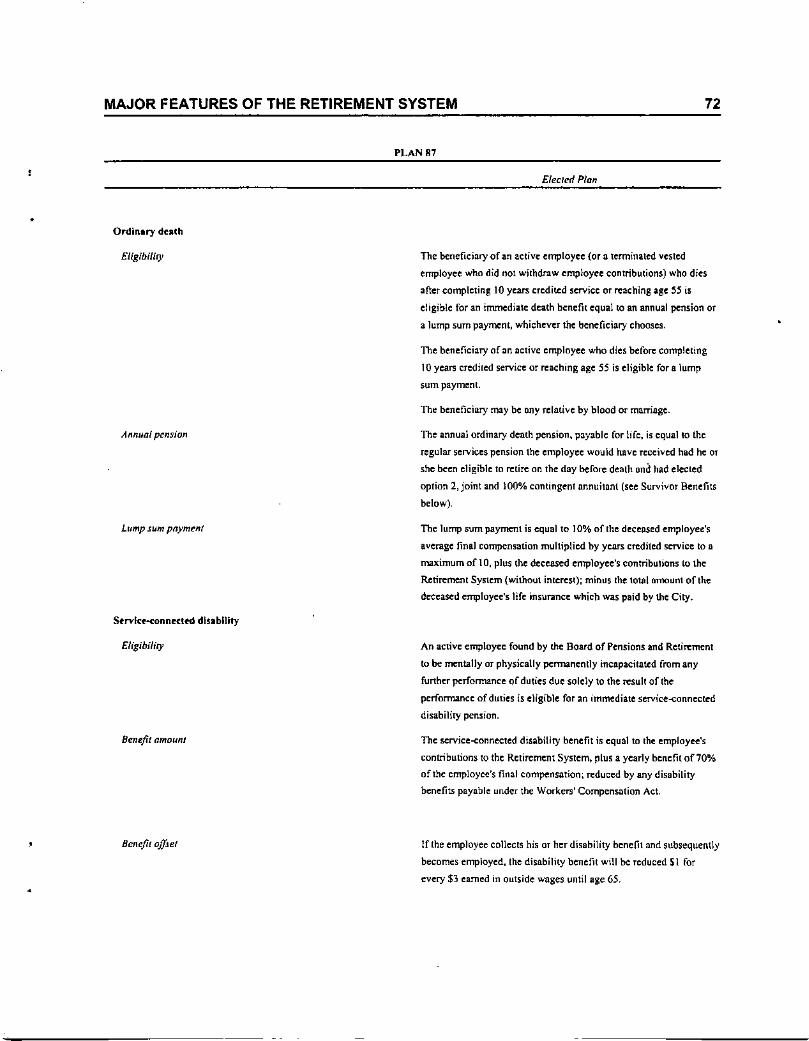
MAJOR FEATURES OF THE RETIREMENT SYSTEM
PLAN 87
Ordlnuy deaCh
Elecll'rl Plan
72
Eligibility
Annual pension
Lr,mp sum pnymf'1I1
Strvlu-conn«lt'd disablllty
Eligibility
Benefit amOUnI
Bel1f'fit ojJiel
The beneficiary of an active employee (or a terminated vested
employee who did not withdraw employee contributions) who dies
after completing 10 years credited service or reaching age 5S iseligible for an immediate death benefit equal to an annual pension ora lump sum payment, whichever the beneficiary chooses.
The beneficiary of an active employee who dies before completing
10 years credited service or reaching age 55 is eligible for a lump
5umpaymenl.
The beneficiary may be ony relative by blood or marriage.
The annual ordinary death pension, payablc for life, is equal eo the
regular services pension the employee would have received had he or
she been eligible to n:tirc on the day before death and had elected
option 2, joint and 100% contingent annuitant (see Survivor Benefits
below).
The lump sum payment is equal to 10% of the decellSed employee's
average final compensation multiplied by years credited service to a
maximum of 10, plus the decellSed employee's contributions to the
Retirement System (without interest); minus the t01ll1amount of the
deeeased employee's life insurance wnicn was paid by the City.
An active employee found by the Board of Pensions and Retirement
to be menllllly or physically permanently incapacitated from any
funher performance of dUlies due solely to Ihe resull of the
performance of duties is eligible for an immediate service-l:onnected
disability pension.
The service-conneeted disability benefit is equal to the employee's
contributions to the Retirement System, plus a yearly benefit of70%
oftbe employee's final compensation; reduced by any disability
benefits payable under the Workers' Compensation Act.
If the employee collects his or her disability benefit and subsequently
becomes employed,lhe disability benefit will he reduced $1 for
every $3 earned in outside wages until age 65.
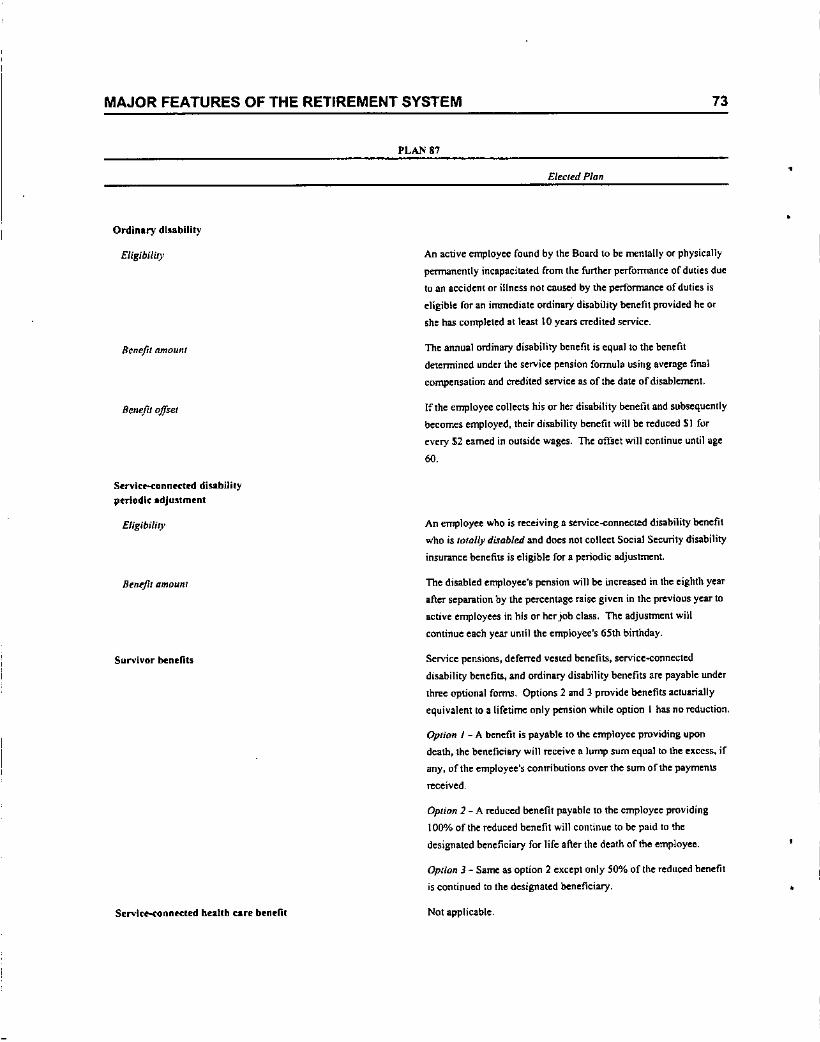
MAJOR FEATURES OF THE RETIREMENT SYSTEM
PLAN 87
Ordinary disability
Elected Plan.
73
,
Eligibility
Benefit amount
Benefit offset
Servkl!'-Conneeted disabililyperiodic adjuslment
Eligibility
Benefit omoum
Survivor benefits
Servlce--conntded beallh earl' btnefil
An active employee found by the Board to be mentally or physically
per1'1Unently incapacitated from the further performance of duties due
to an accident or illness not caused by the performance of dulies is
eligible for an immcdillte ordinary disability benefit provided he or
she has completed at least 10 years credited service.
The annual ordinary disability benefit is equal 10 the benefit
determined under the service pension formula using average final
compensation and credited service as of the date of disablement.
If the employee col1el:15 his or her disability benefit and subsequently
becomes employed, their disability benefit will be reduced $1 for
every $2 earned in outside wages. The offset will continue until age
6iJ.
An employee who is =:eiving a service-connected disability benefit
who is tOlolly d~ob/eJi and does not collect Social Security disability
insurance benefilS is eligible for a periodic adjustment.
The disabled employee's pension will be increased in the eighth year
after separation by the percentage raise given in the previous year to
active employees in his or her job class. The adjUSlmCnt will
continue each year until the employee's 65th binhday.
Service pensions, deferred vested benefits, service-connected
disability benefits, and ordinary disability benefilS are payable under
three optional fol'tt\5. Options 2 and 3 provide benefits actuarially
equivalent to a lifetime only pension while option I has no reduction.
Option / _ A benefit is payable 10 lite employee providing upon
death, the beneficiary will receive a lump sum equal to the excess, if
any, of the employee's contributions over the sum of the payments
received.
Option 2 _ A reduced benefit payable 10 the employee providing
100"/" of the redueed benefit will continue to be paid 10 the
designated beneficiary for life after the death of the employee.
Option 3 - Same as option 2 except only 50% of the reduced benefit
is C011tinued 10 the designated beneficiary.
Not applicable.
MAJOR FEATURES OF THE RETIREMENT SYSTEM
PLAN 87
Elected Plan
74
•
Deferred Rdlrement Option Plu (DROP) A lest DROP plan is being tested for four years Deginning June 24,
1999, for cost neutr1llily. Employees that have ten yean of service
and reached the minimum retirement age may elet:llo panicipate inthe DROP. Duling this time, their accrued benefit will go in a DROP
account and will cam interest al a spe<:ifie<l rale. The benefit is
calculated as afthe date they entered the DROP. Allhe end of the
DROP, the employees' accrued monthly benefit will commence, plus
they will receive the accumulated amount of the accrued benefit paid
to the DROP, as well as the interest earned on such benefit.
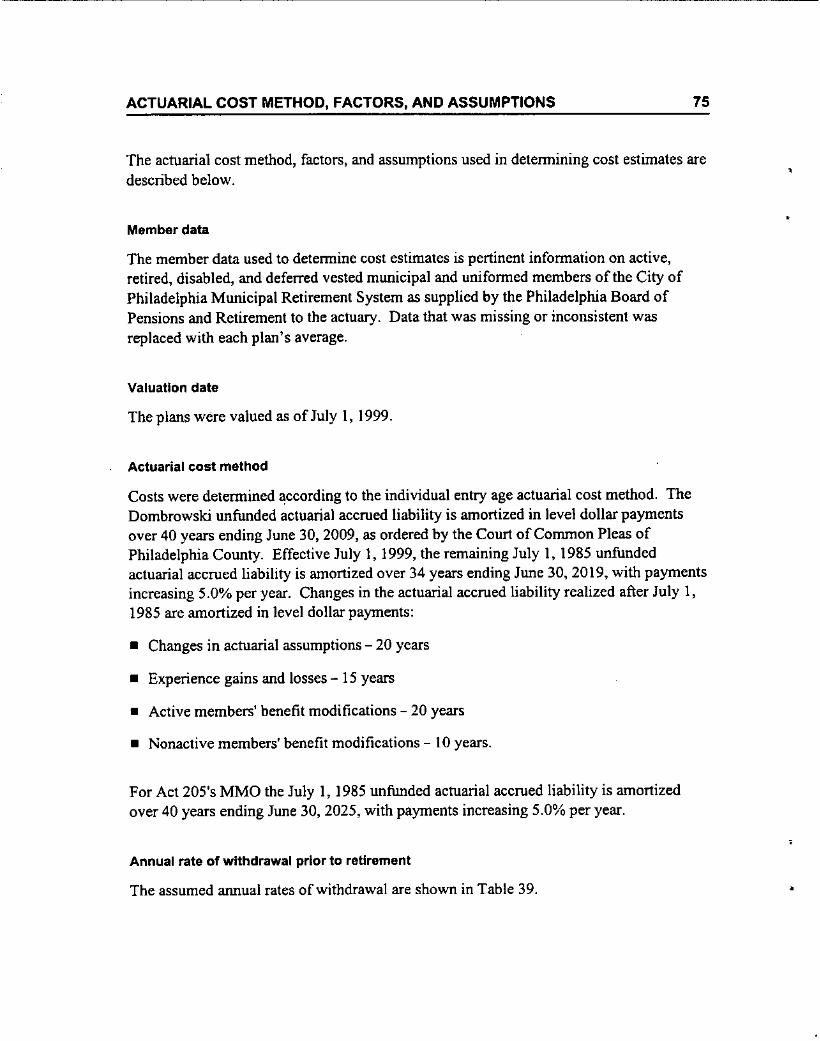
ACTUARIAL COST METHOD, FACTORS, AND ASSUMPTIONS 75
The actuarial cost method, factors, and assumptions used in detennining cost estimates aredescribed below.
Member data
The member data used to determine cost estimates is pertinent information on active,retired, disabled, and deferred vested municipal and uniformed members of the City ofPhiladelphia Municipal Retirement System as supplied by the Philadelphia Board ofPensions and Retirement to the actuary. Data that was missing or inconsistent wasreplaced with each plan's average.
Valuation date
The plans were valued as ofJuly I, 1999.
Actuarial cost method
Costs were determined ~ccording to the individual entry age actuarial cost method. TheDombrowski unfunded actuarial accrued liability is amortized in level dollar paymentsover 40 years ending June 3D, 2009, as ordered by the Court of Common Pleas ofPhiladelphia Couoty. Effective July I, 1999, the remaining July I, 1985 unfundedactuarial accrued liability is amortized over 34 years ending June 30, 2019, with paymentsincreasing 5.0% per year. Changes in the actuarial accrued liability realized after July 1,1985 are amortized in level dollar payments:
• Changes in actuarial assumptions - 20 years
• Experience gains and losses - 15 years
• Active members' benefit modifications - 20 years
• Nonactive members' benefit modifications - 10 years.
For Act 205's MMO the July 1, 1985 unfunded actuarial accrued liability is amortizedover 40 years ending June 30, 2025, with payments increasing 5.0% per year.
Annual rate of withdrawal prior to retirement
The assumed annual rates of withdrawal are shown in Table 39. •
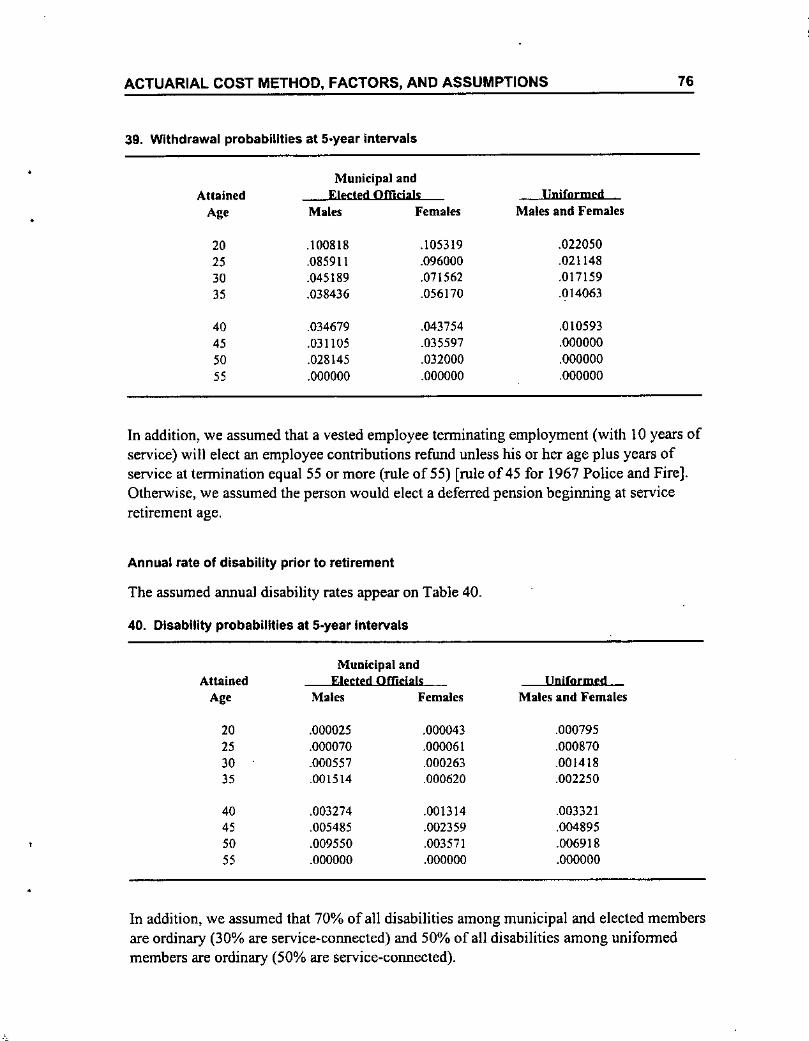
ACTUARIAL COST METHOD, FACTORS, AND ASSUMPTIONS
39. Withdrawal probabilities at 5.year Intervals
Municipal andAUained Elected Officials JJnjformed
Age Males Females Males and Females
20 .100818 .105319 .02205025 .085911 .096000 .02114830 .045189 .071562 .01715935 .038436 .056170 .014063
40 .034679 .043754 ,01059345 .031105 .035597 .00000050 .028145 .032000 .00000055 .000000 .000000 .000000
76
In addition, we assumed that a vested employee tenninating employment (with 10 years ofservice) will elect an employee contributions refund unless his or her age plus years ofservice at termination equal 55 or more (rule of 55) [rule of 45 for 1967 Police and Fire].OthetWise, we assumed the person would elect a deferred pension beginning at serviceretirement age.
Annual rate of disability prior to retirement
The assumed annual disability rates appear on Table 40.
40. Disability probabilities at 5~yearIntervals
Municipal andAttained Elected Offielals IJpi(ormedAge Males Females Males and Females
20 .000025 .000043 .00079525 .000070 .000061 .00087030 .000557 .000263 .00141835 .001514 .000620 .002250
40 .003274 .001314 .00332145 .005485 .002359 .00489550 .009550 .003571 .00691855 .000000 .000000 .000000
In addition, we assumed that 70% of all disabilities among municipal and elected membersare ordinary (30% are service-connected) and 50% of all disabilities among uniformedmembers are ordinary (50% are service-connected).
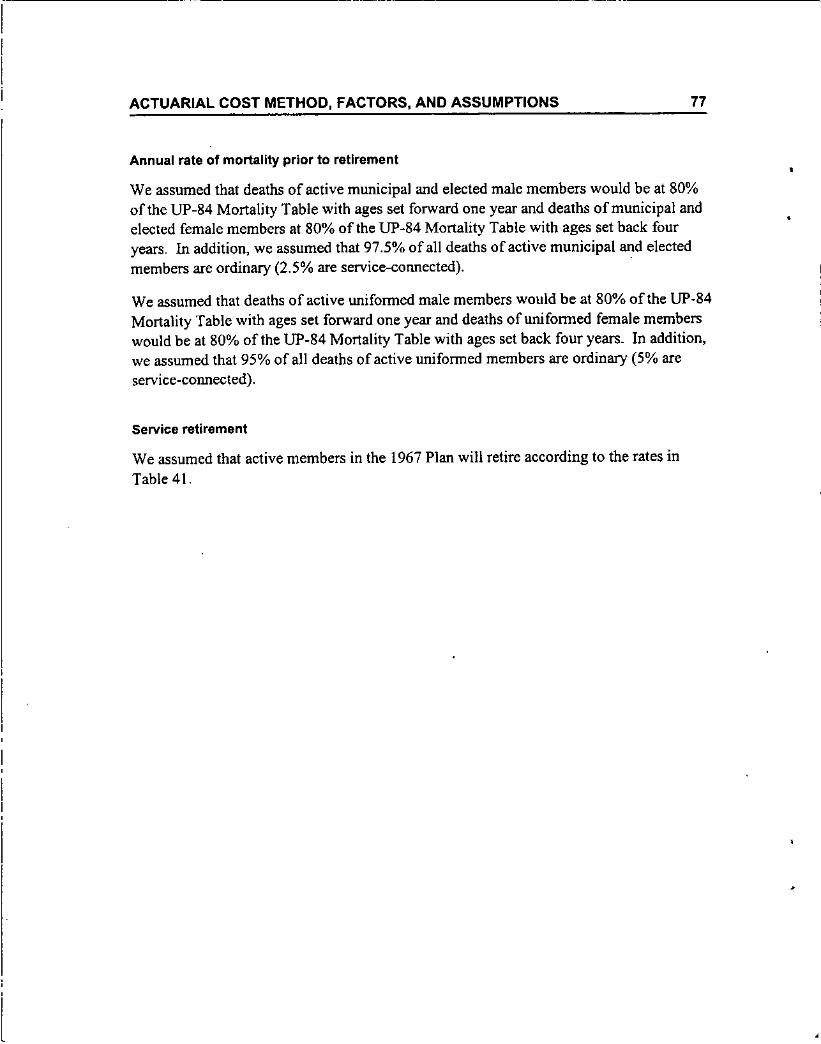
ACTUARIAL COST METHOD, FACTORS, AND ASSUMPTIONS 77
,
l
Annual rate of mortality prior to retirement
We assumed that deaths of active municipal and elected male members would be at 80%of the UP-84 Mortality Table with ages set forward one year and deaths of municipal andelected female members at 80% of the UP-84 Mortality Table with ages set back fouryears. In addition, we assumed that 97.5% of all deaths of active municipal ar-tdelectedmembers are ordinary (2.5% are service-connected).
We assumed that deaths of active uniformed male members would be at 80% of the UP.84Mortality Table with ages set forward one year and deaths ofunifonned female memberswould be at 80% of the UP-84 Mortality Table with ages set back four years. In addition,we assumed that 95% of all deaths of active uniformed members are ordinary (5% areservice-COllllected).
Service retirement
We assumed that active members in the 1967 Plan will retire according to the rates inTable 41.
•
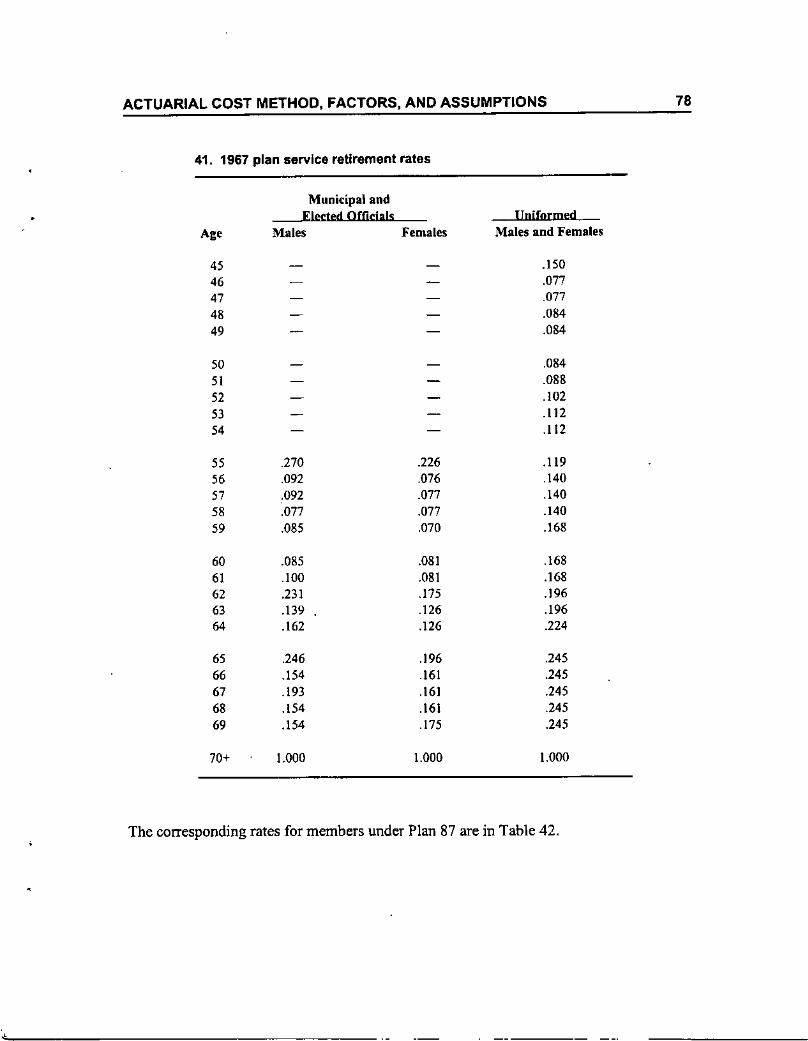
,
ACTUARIAL COST METHOD, FACTORS, AND ASSUMPTIONS
41. 1967 plan service retirement rates
Municipal andElected Offielals Uniformed
Age Males Females Males and Females
45 .15046 ,07747 .07748 .08449 .084
50 .08451 .08852 .10253 .11254 .112
55 .270 .226 .11956 .092 .076 .14057 .092 .077 .14058 ,077 .077 .14059 .085 ,070 .168
60 .085 .081 .16861 .100 .081 .16862 .231 .175 .19663 .139 .126 .19664 .162 .126 .224
65 .246 .196 .24566 .154 .161 .24567 .193 .161 .24568 .154 .161 .24569 .154 .175 .245
70+ 1.000 1.000 1.000
The corresponding rates for members under Plan 87 are in Table 42.
78
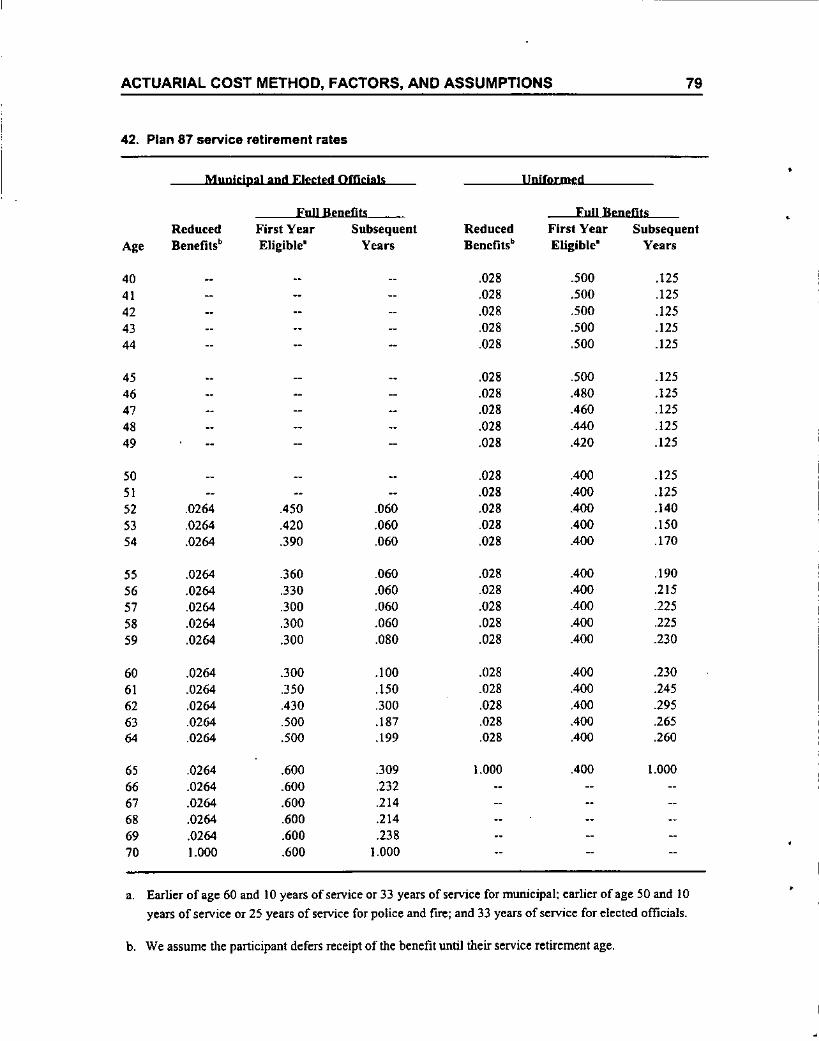
ACTUARIAL COST METHOD, FACTORS, AND ASSUMPTIONS 79
42. Plan 87 service retirement rates
Municipal and Elected Officials IJpjformed
FuJI Benefits Full Benefits
Reduced First Year Subsequent Reduced First Vear SubsequentAge Benefitsb Eligible" Years Benefitsb Eligible" Years
40 .028 .500 .12541 .028 .500 .12542 .028 .500 .12543 .028 .500 .12544 .028 .500 .125
45 .028 .500 .12546 .028 .480 .12547 .028 .460 .12548 .028 .440 .12549 .028 .420 .125
50 .028 ADO .12551 .028 .400 .12552 .0264 .450 .060 .028 .400 .14053 .0264 .420 .060 .028 .400 .15054 .0264 .390 .060 .028 .400 .170
55 .0264 .360 .060 .028 .400 .19056 .0264 .330 .060 .028 .400 .21557 .0264 .300 .060 .028 .400 .22558 .0264 .300 .060 .028 .400 .22559 .0264 .300 .080 .028 .400 .230
60 .0264 .300 .100 .028 .400 .23061 .0264 .350 .150 .028 .400 .24562 .0264 .430 .300 .028 .400 .29563 .0264 .500 .187 ,028 ADO .26564 .0264 .500 .199 .028 .400 .260
65 .0264 .600 .309 1.000 .400 1.00066 .0264 .600 .23267 .0264 .600 .21468 .0264 .600 .21469 .0264 .600 .23870 1.000 .600 1.000
Earlier of age 60 and 10 years of service or 33 years of service for municipal: earlier of age 50 and 10 •,.years of service or 25 years of service for police and fIre; and 33 years of service for elected officials.
b. We assume the participant defers receipt of the benefit until their service retirement age.
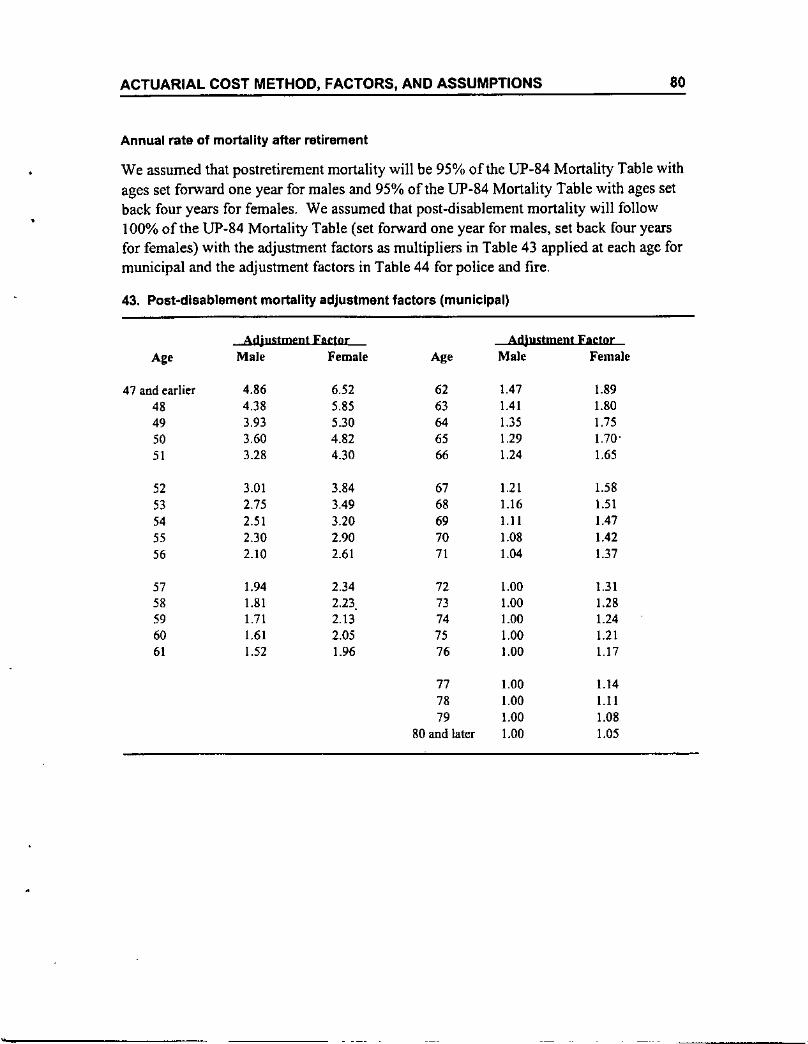
ACTUARIAL COST METHOD, FACTORS, AND ASSUMPTIONS
Annual rate of mortality after retirement
80
..
We assumed that postretirement mortality will be 95% of the UP-84 Mortality Table withages set forward one year for males and 95% of the UP-84 Mortality Table with ages setback four years for females. We assumed that post-disablement mortality will follow100% of the UP-84 Mortality Table (set forward one year for males, set back four yearsfor females) with the adjustment factors as multipliers in Table 43 applied at each age formunicipal and the adjustment factors in Table 44 for police and fire.
43. Post~dlsablement mortality adjustment factors (municipal)
Adjustment Factor Adjustment Factor
Ag' Male Female Ag' Male Female
47 and earlier 4.86 6.52 62 1.47 1.8948 4.38 5.85 63 1.41 1.8049 3.93 5.30 64 1.35 1.7550 3.60 4.82 65 1.29 1.70'51 3.28 4.30 66 1.24 1.65
52 3.01 3.84 67 1.21 1.5853 2.75 3.49 68 1.16 1.5154 2.51 3.20 69 1.11 1.4755 2.30 2.90 70 1.08 1.4256 2.10 2.61 71 1.04 1.37
57 1.94 2.34 72 1.00 1.3158 1.81 2.23 73 1.00 1.2859 1.71 2.13 74 1.00 1.2460 1.61 2.05 75 1.00 1.2161 1.52 1.96 76 1.00 1.17
77 1.00 1.1478 1.00 1.1179 1.00 1.08
80 and later 1.00 1.05
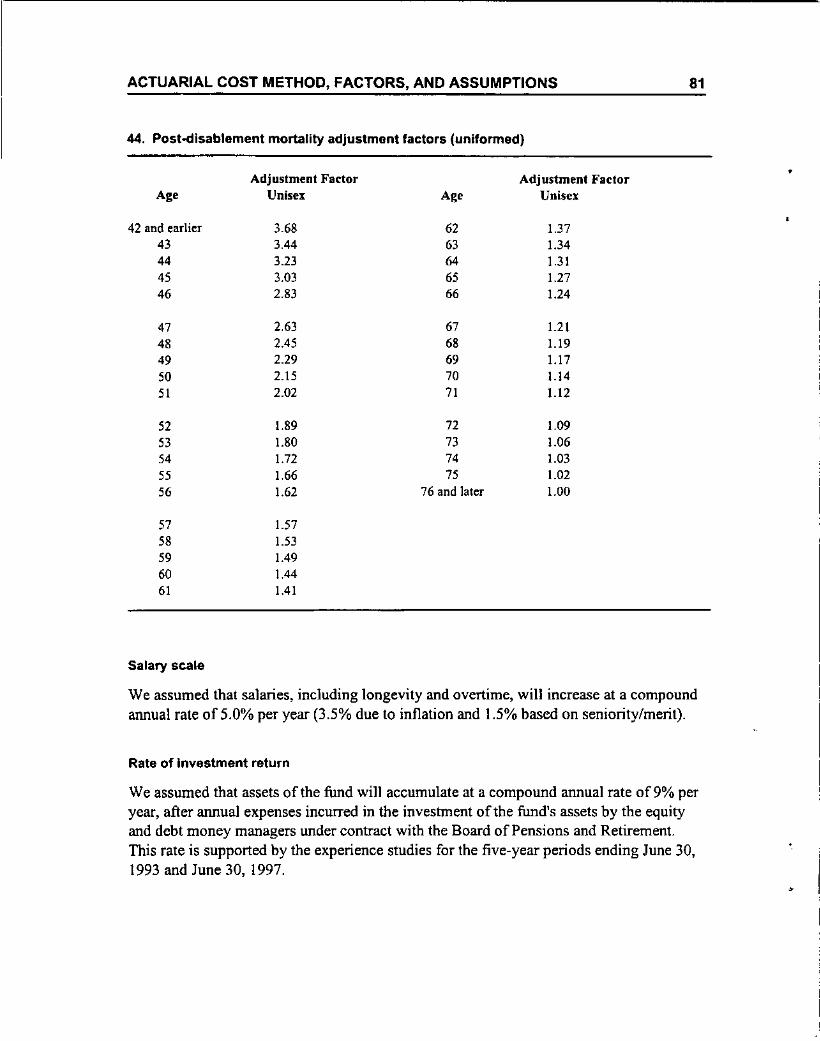
ACTUARIAL COST METHOD, FACTORS, AND ASSUMPTIONS 81
44. Post--disablement mortality adjustment factors (uniformed)
Adjustment Factor,
Adjustment FactorAg' Unisex Ag' Unisex
42 and earlier 3.68 62 1.3743 3.44 63 1.3444 3.23 64 1.3145 3.03 65 1.2746 2.83 66 1.24
47 2.63 67 1.2148 2.45 68 1.1949 2.29 69 1.1750 2.15 70 1.1451 2.02 71 1.12
52 1.89 72 1.0953 1.80 73 1.0654 1.72 74 1.0355 1.66 75 1.0256 1.62 76 and later 1.00
57 1.5758 1.5359 1.4960 1.4461 1.41
Salary scale
We assumed that salaries, including longevity and overtime, wil1 increase at a compoundannual rate of 5.0% per year (3.5% due to inflation and 1.5% based on seniority/merit).
Rate of Investment return
We assumed that assets of the fund will accumulate at a compound annual rate of9% peryear, after annual expenses incurred in the investment of the fund's assets by the equityand debt money managers under contract with the Board of Pensions and Retirement.This rate is supported by the experience studies for the five-year periods ending June 30,1993 and June 30, 1997.
ACTUARIAL COST METHOD, FACTORS, AND ASSUMPTIONS 82
,
Expenses
The administrative expenses of operating the Retirement System are based on the previousyear's actual expenses increased by the average salary increase for continuing actives.Administrative expenses exclude the fees of the money managers hired to invest the fund'sassets.
Value of investments
Assets held by the fund are valued at market value as reported by the "City. The actuarialvalue of assets is the difference between the market value of the assets reported and lastyear's assets projected forward at the rate of investment return. One-fifth oftrus differenceis recognized immediately and four-fifths is deferred and recognized over the next fouryears, onc- fifth at a time.
Family composition
We assumed that 70% cfall active members and 60% of all nonactive members will besurvived by a spouse and that female (male) spouses are four years younger (older) thanmembers.
Form of annuity
We assumed that all Plan '67 members will elect Option 4 and Plan '87 members willelect Option 1 unless otherwise indicated in the participant's data.
Rate of covered payroll growth
We assume that the annual rate of growth of total covered payroll is 5.0% per year. This issupported by the actuarial experience studies for the five-year periods ending June 30,1993 and June 30, 1997, which showed that the adjusted growth rate of covered payrollaveraged 4.7% and 3.2%, respectively.
MINIMUM MUNICIPAL OBLIGATION 83
The minimum municipal obligation (MMO) is the minimum required City contributionunder state law (Acts 205 and 189). The City's MMO for the year ending June 30, 2001 is$132,174,000. This amount is summarized by division in Table 45 and is based, on theJuly 1, 1999 actuarial valuation report.
The City receives general pension state aid and cost~of-living adjustment reimbursementfrom the state. The MMO includes these amounts. For fiscal 2000, the total statepayments are $34,407,000. Amounts received during fiscal 2001 may be used to meet the$132,174,000 obligation. Supplemental State Assistance (SSA), ifany, may not be usedto offset this commitment.
The City's funding policy differs from the MMO. The most significant differences are:
• The City uses a 34-year increasing amortization of its July I, 1985 unfundedactuarial accrued liability, while Act 205 allows a 40-year increasing amortizationschedule. The City chose to amortize the July I, 1985 unfunded actuarial accruedliability over the 34 years remaining in their then-existing schedule, rather thanadopting the 40-year phased-in schedule permitted under Act 205. The City's moreaggressive funding policy has resulted in larger contributions than Act 205 requires.
• The City applies the normal cost rates to the fiscal year's actual payroll. The MMOuses the prior year's estimated payrolL
• The City's actual contribution includes interest at 9% from July I to the paymentdate. However, no interest accumulates on the MMO if the payment is made byyear-end (December 31).
• The MMO reflects amortization of prior years' City contributions above past MMOsas actuarial gains.
•
,
•
•
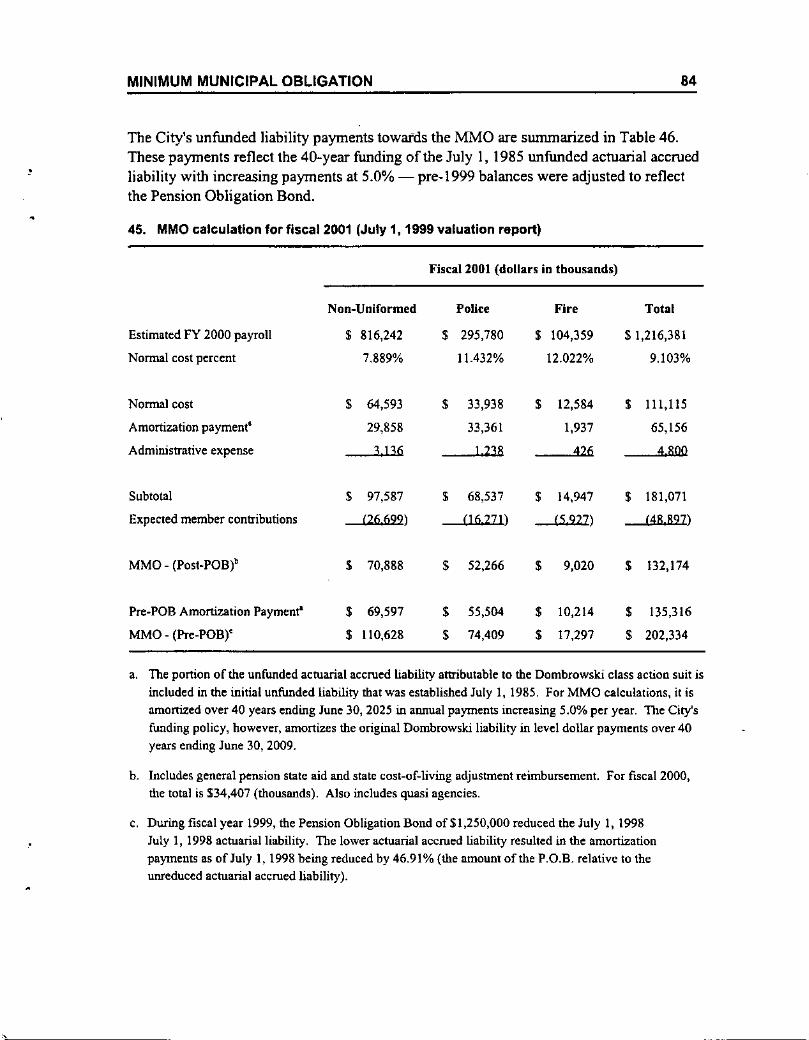
MINIMUM MUNICIPAL OBLIGATION 84
,The City's unfunded liability payments towards the MMO are summarized in Table 46.These payments reflect the 40-year funding of the July 1, 1985 unfunded actuarial accruedliability with increasing payments at 5.0% - pre-1999 balances were adjusted to reflectthe Pension Obligation Bond.
45. MMOcalculation for flscal2001 (July 1, 1999 valuation report)
Fiscal 2001 (dollars in thousands)
Non-Uniformed Police Fire Total
Estimated FY 2000 payroll $ 816.242 $ 295,780 $ 104,359 $ 1,216,381
Normal cost percent 7.889% 11.432% 12.022% 9.103%
Normal cost $ 64,593 $ 33,938 $ 12,584 $ 111,115
Amortization payment" 29,858 33,361 1,937 65,156
Administrative expense 3136 1 238 426 4 ROO
Subtotal $ 97,587 $ 68,537 $ 14,947 $ 181,071
Expected member contributions (26699) (16271) (5927) (48 897)
MMO - (Post.POBl $ 70,888 $ 52,266 $ 9,020 $ 132,174
Pre-POB Amortization Paymen~ $ 69,597 $ 55,504 $ 10,214 $ 135,316
MMO - (Pre-POB)' $ 110,628 $ 74,409 $ 17,297 $ 202,334
a. The portion of the unfunded actuarial accrued liability attributable to the Dombrowski class action suit isincluded in the initial unfunded liability that was established July 1, 1985. For MMO calculations, it isamonized over 40 years ending June 30, 2025 in annual payments increasing 5.0% per year. The City'sfunding policy, however, amortizes the original Dombrowski liability in level dollar payments over 40years ending June 30, 2009.
b. Includes general pension state aid and state cost-of-living adjustment reimbursement. For fiscal 2000,the total is $34,407 (thousands). Also includes quasi agencies.
c. During fiscal year 1999, the Pension Obligation Bond ofSI,250,OOO reduced the July 1, 1998July 1, 1998 actuarial liability. The lower actuarial accrued liability resulted in the amortizationpayments as of July I, 1998 being reduced by 46.91% (the amount of the P.O.B. relative to theunreduced actuarial accrued liability).
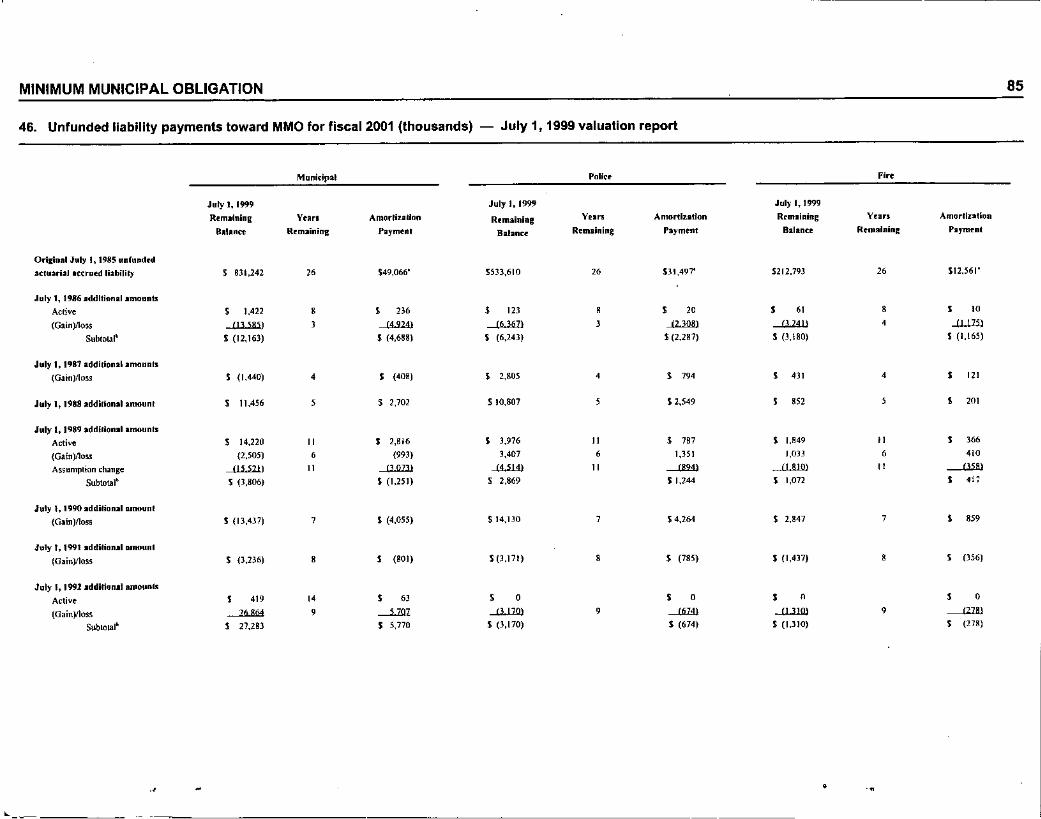
MINIMUM MUNICIPAL OBLIGATION
46. Unfunded liability payments toward MMO for fiscal 2001 (thousands) - July 1, 1999 valuation report
Municipal Pallc~ Fire
July I, 1999 July I, 1999 Jul)' I, 1999
R.mainlng V.ars Amorllz.ollon R.maining Yun Amortization Remaining y•••• Amortization
balance R.maining Paymtol Balan •• Remaining Payment B.lan •• Remaining rayment
Oririnal July I, 1985 unfundedutuatlaJ .ccrued liabilil)' 5 831,242 " $49,066' 5533,610 " $31,497' S212.793 ,. $12,561"
July 1, 1986 .ddltionallmoun1:ll
Aclive , 1,422 , , '" $ m , , '" , " , , "(Gain)/loss --UJ.ill) 2 -l<lli2 --"-"" 2 -"-"" --<J.lli) • -lLllilSubloul' S (12,163) S (4,688) S (6,243) S (2,287) S 0,180) S (1,165)
July 1, 1987 additional."",unl.
(Gain)/Ios! S (1,440) • , (408) , 2,805 • , '" , '" • , '"July I, 1988 addllional."",unl , 11,456 , .$ 2,702 .$ 10,807 , S 2,549 , '" , , '"'July I, 1989 addilional amounls
Acti~ , 14,210 " , 2,B16 , 3,976 " $ m , 1,849 ", '"
(Gain)/lo,", (2,505) • (993) 3,407 • 1,351 I,on • ".Assumption change -ill.llil " -illIl.ll -«llil " ---"'" -'J.WU " -1illJ
Subtotal' S (3,806) S (1,251) S 2,869 S 1,244 S 1,012 , 4'"..July I, 1990 additional amounl
{Gain)l1oss S (13,437) , S (4,055) S 14,BO , $ 4,264 S 2,847 , , 'SO
July I, 1991 additional amounl
(G.in)lloss $ (3,236) , $ (BOI) S (3,l7l) , S (785) S (1,4]7) " , (]56)
July I, 1992 additional amOlln"
Active , '" " , 02 , • , • , 0 , 0
(G.in)lloss ~ • --'-1Jl1 -"-"" • --'llil --U-llJll • --ill!)Subtotal' , 27,2B3 S 5,770 $ (3,170) S (674) S (I,JIO) , (278)
85
c
, • •
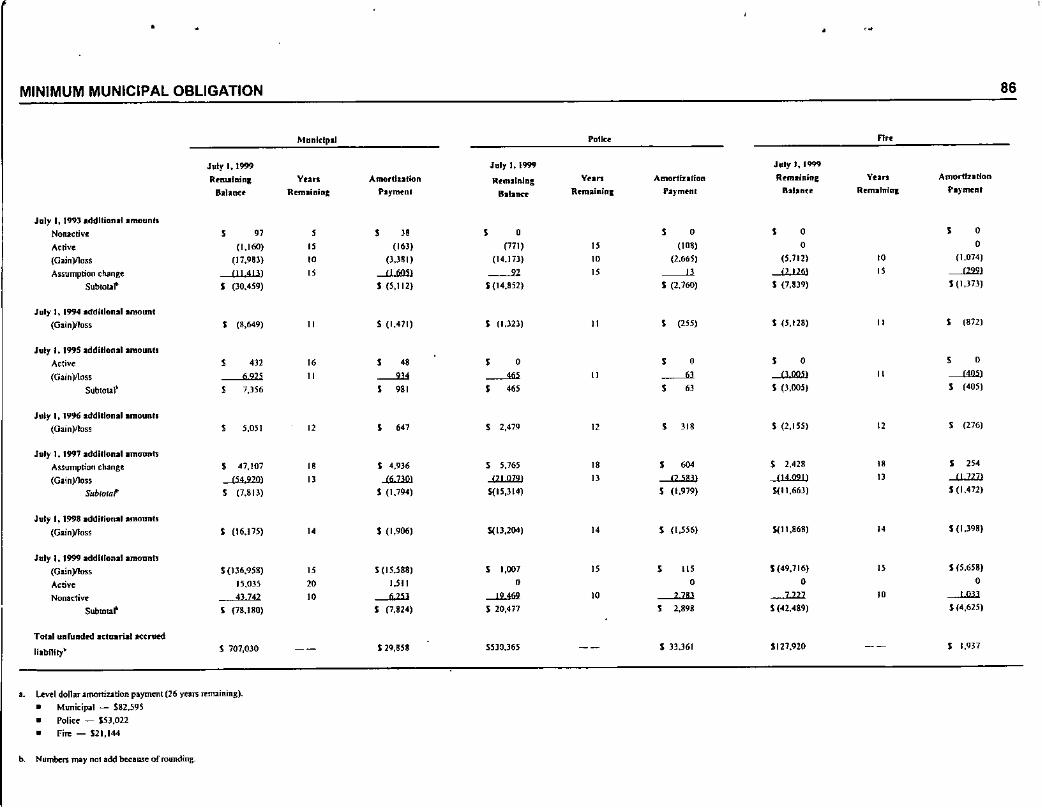
MINIMUM MUNICIPAL OBLIGATION 86
Mnnldpal Potk~ n"July I, 1999
R~lIUlainlB21anc~
VunR••••• inint
AmortlzallonPly_nl
July I, 1999
R~mllnJnl:
8111na
VunR~mlinilll
AmnrtlnlinllPI}'m~lIl
Jlllyl,l99'J
R~mlllllnlBllIlIU
VunR~mllnl"l
i\mortlzilion
Pll_nl
July I, ]99) .ddltlonal amounh
Nonattiv~Attiv~{Gain)flcss
A••umption chan~Subtol.ol"
, " ,(1,160) "(17,98l) "ill.illJ "S (30,459)
, "(16l)
P,lSI)-il.OO.Il$ (5,112)
, "(771)
(14,173)
--'"S{14,852)
"'""
, "(108)
(2,665)
---"$ (V60)
, ""(5,112)
--'2.lliJ$ (7,8)9)
'""
, ,,(1.1374)
-=$ (1,373)
$ (276)
$ (872)
, "--"'"S (405)
"
"
"
$ (5,128)
$ (2,155)
, ,--O.ooJJ$ (3.005)
$ (255)
$ 318
, "--"l "
"
"
"S (1,32l)
1 2,479
, "--'"$ 465
, ..---'"$ 981
S (1,411)
$ 641"
"
""
, (8,649)
, '"..",, 7,)56
, 5,051July I, 1996 .ddltlonalamounl.
(Gajolllos!
July I. 1995 additlonal.mount.
Aclive
(Gain)llossSublotal'
July t, 1994 addltloulamoun!
(Gain)lloss
July 1, 19'97 .ddilionalamoontsAssumption change
(GainjllossSub/oraf
S 47,107
--"'.22DlS (7,BI3)
'""$ 4,936
-l<.1JJll$ (1,794)
1 5,765
-'lLllWS{15,3(4)
"D , ""---l2.illlS (1,979)
S 2,428
-'l.4Jl2JJ$(11,663)
"D S 254
-ll.1Z1l$ (1.472)
July I, 19'98 additional.monnl,
(Gain)flos. S (16,175) •• $ (1,906) $(13,204) " S ([,556) $(11,868) " S (1.398)
July I. 1999 addlllonalamoonts
(Gain)lloss
Aclive
Nona.Ii""Subllllal'
S (136,958)
1'i,035
Al.illS (78,IBO)
"""$(15,588)
1,511
-'-ill$ (7,824)
1 1.007
"--"-'"1 20,477
"'"
1 115
"---2lliS 2,898
$(49,716)
"--=S (42,489)
"'"
1(5,658),-1.ll.l.1$ (4,625)
Total unrund..J uta.rial_rued
IIlbnHy' S 707,030 $ 29,858 1Sl0,]65 1]3,361 $127,920 S 1,937
•. ~""I dollor amortiz.alion payment (26 yem Jtlll3.ining).
• Mun;ci""l - $82,595• Police ~ $53,022• Fin: - $21,144
b, N"mberl may no1 add bee ••••• ofroWlding.
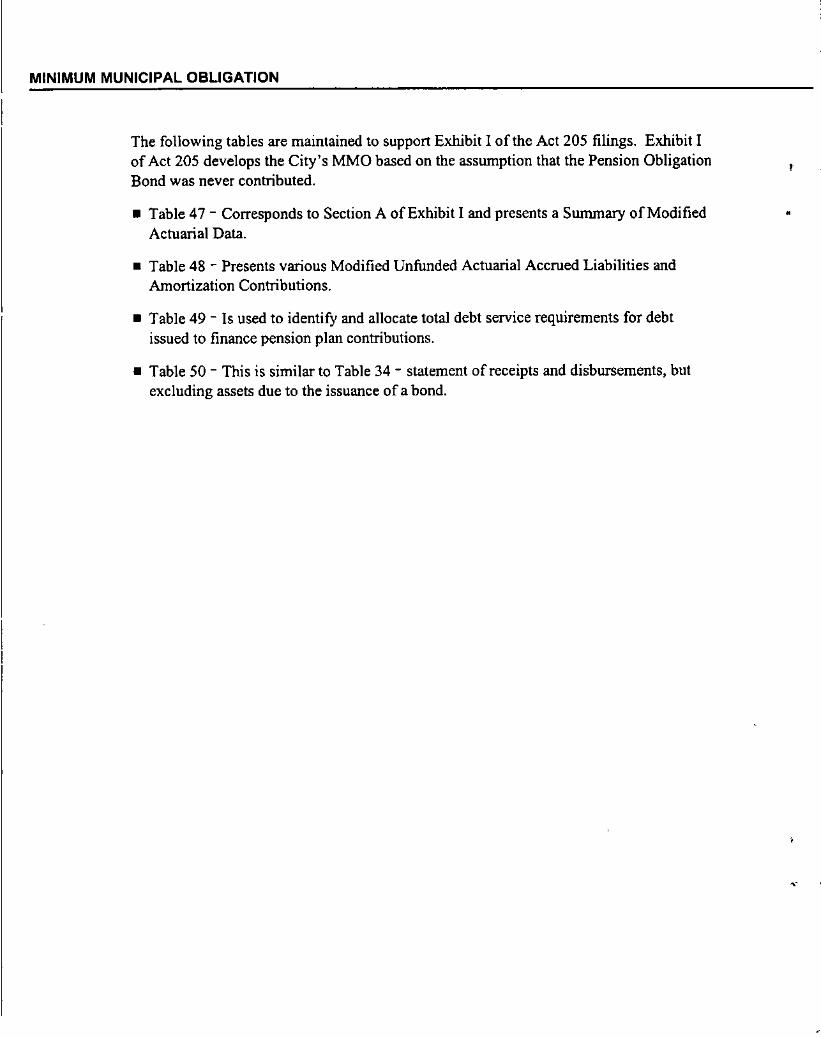
MINIMUM MUNICIPAL OBLIGATION
The following tables are maintained to support Exhibit I of the Act 205 filings. Exhibit Iof Act 205 develops the City's MMO based on the assumption that the Pension ObligationBond was never contributed .
• Table 47 - Corresponds to Section A of Exhibit I and presents a Summary of ModifiedActuarial Data .
• Table 48 - Presents various Modified Unfunded Actuarial Accrued Liabilities andAmortization Contributions .
• Table 49 - Is used to identify and allocate total debt service requirements for debtissued to finance pension plan contributions .
• Table 50 - This is similar to Table 34 - statement ofreceipls and disbursements, butexcluding assets due to the issuance of a bond.
,
•

rt"
•
MINIMUM MUNICIPAL OBLIGATION
47. Summary of Modified Actuarial Data
• ,.
88
Actuarial accrued liability
Market value of assets"
Actuarial value of assets"
Unfunded actuarial accrued liability
Amortization contributions
1/1185 initial liability
Munidpal Police Fire Total
3,240,432,000 1,911,638,000 710,013,000 5,862,083,000
1,883,255,000 1,029,630,000 ~33,373,000 3,346,258,000
1,783,004,000 972,700,000 409,750,000 3,165,454,000
1,457,428,000 938,938,000 300,262,000 2,696,628,000
Remaining amortization period
Level dollar contribution
Payroll-based contribution
Posl-1/1/85 liability
Remaining amortization period
Amortization contribution
Total amortization contribution
2682,595,000
92,417,000
6
(22,820,000)
69,597,000
2653,022,000
59,326,000
N/A
(3,822,000)
55,504,000
2621,144,000
23,658,000
12
(13,444,000)
10,214,000
26156,761,000
175,401,000
10
(40,086,000)
135,315,000
a. Must equal the total fund assets that would have existed had the bond issue proceeds not been contributed to the pension fund including adjustments for invesbnent income on theP.0.8. and reduced contributions.
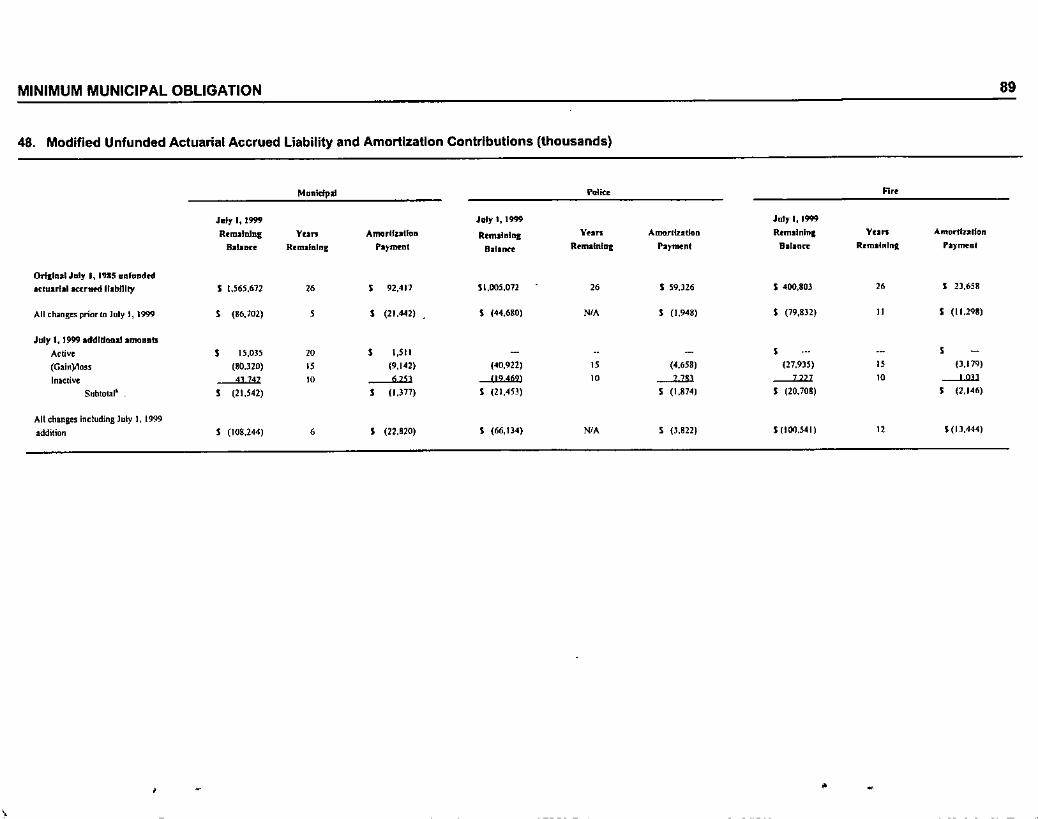
,
MINIMUM MUNICIPAL OBLIGATION
48. Modified Unfunded Actuarial Accrued Liability and Amortization Contributions (thousands)
Mooldpal •••••• ""Jllly 1, 1999 Jaly I, 1999 JlIly I. 1999
R.malnlng Yun "marl/utlon RmWnl"ll Yun AlIIOrllzadoo RnnllDint Vun AttlOrtlntlon
Iblalltt! ROIlIlllling ray",",' D111~ a.mallllltC hY"'l'nt Dala"". R.malolng PIYlmof
Orltlul July I, I'JIS unf ••"dtdnfUnlal aarMd liability S 1.565,672 " , 92,417 $1,005,012 " S 59,326 S 400,803 " S 23,658
All changes prior III July I, 1999 • (86.702) • • (21.442} S (44,680) ",A S (1,948) S (79,832) " S (11.298)
July I, 1999 .ddlll ••••al.moUIlB
Active , 15,035 " • 1,511 - ... , •.. .- ,(Gain)lloss (80,320) " (2,142) (40,922) " (4,658) (27,935) " (J,I'N)
InlCli~ 41 147 " 6m 112462) " -= ----1.22l " --'.JlllSubtolll" , (2l,S42) • (1,377) S (21,45~) S (1,874) S (20,708) , (2.146)
All changes including July I, 1999
addilion S (108,244) , , (22,820) S (66,134) "'A $ {J.SHI $(100,541) " $(13,444)
•
89
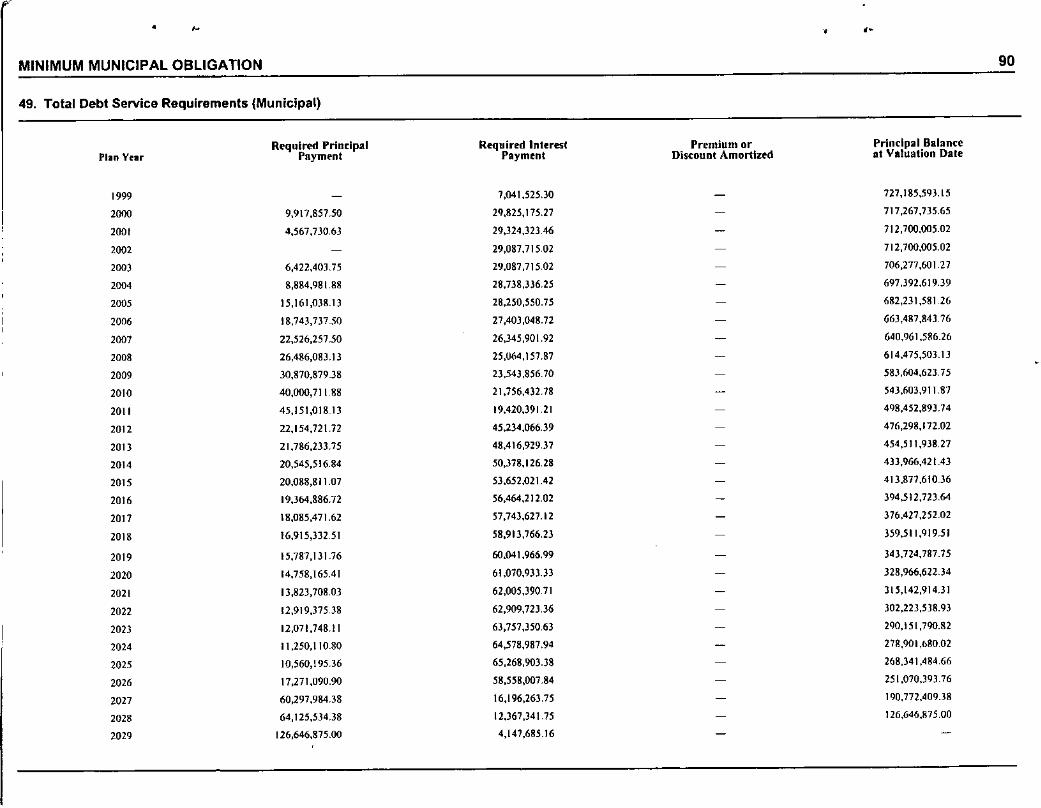
• ~ .-MINIMUM MUNICIPAL OBLIGATION
49. Total Debt Service Requirements (Municipal)
90
Plan Year
1999
2000
2001
2002
200'
2004
2005
2006
2001
2008
2009
2010
2011
2012
2013
2014
2015
2016
20112018
2019
2020
2021
2022
20232024
2025
2026
2027
2028
2029
Required PrincipalPayment
9,917,857.50
4,567,730.63
6,422,403.75
8,884,981,1111
15,161,0311.13
18,743,737.50
22,526,257.50
26,486,083.13
30,870,879.38
40,000,71188
45,151,018.13
22,154,721.72
21,786,233.75
20,545,516.84
20,088,811.07
19,364,886.72
18,085,471.62
16,915,332.51
15,787,13L76
14,758,165.41
13,823,708,03
12,919,375.38
12,071,748.11
11,250,110.80
10,560,195.36
17,271,090.90
60,297,9&4.38
64,125,534.38
126,646,875.00
Required IntereslPayment
7,041,525,30
29,825,175,27
29,324,323.46
29,087,715.02
29,087,715,02
28,738,336.25
28,250,550.75
27,403,048.72
26,345,901,92
25,064,157,87
23,543.856.70
21,756,432.78
19,420.391,21
45,234,066.39
48,416,929.37
50,378,126.28
53.652,021.42
56,464,212.02
57,743,627.12
58,913,766.23
60.041,966.99
61,070,933.33
62,005,390,71
62,909,723,36
63,757,350,63
64,578,987,94
65,268,903.38
58,558,007.84
16,196,263,75
12,367,34\.75
4,147,685.16
Premium orDiscount Amortlztd
Principal Balanceat Valuation Date
727,185,593.15
717,267,735.65
712,700,005.02
712,700,005.02
706,217,601.27
697,392,619.39
682,23 1,58126
663,4117,843,76
640,961,586.26
614,475,503.13
583,604,623,75
543,603,911,87
4lJ8,452,893.74
476,298,172.02
454,511,938,27
433,966,421.43
413,877,610.36
394,512,723.64
376,427,252.02
359,511 ,919.51
343,724,787.75
328,966,622.34
315,142,914.31
302,223,538.93
290,151,790.82
278,901,680,02
268,341,484,66
251,070,393.76
190,772,409.38
126,646,1175.00
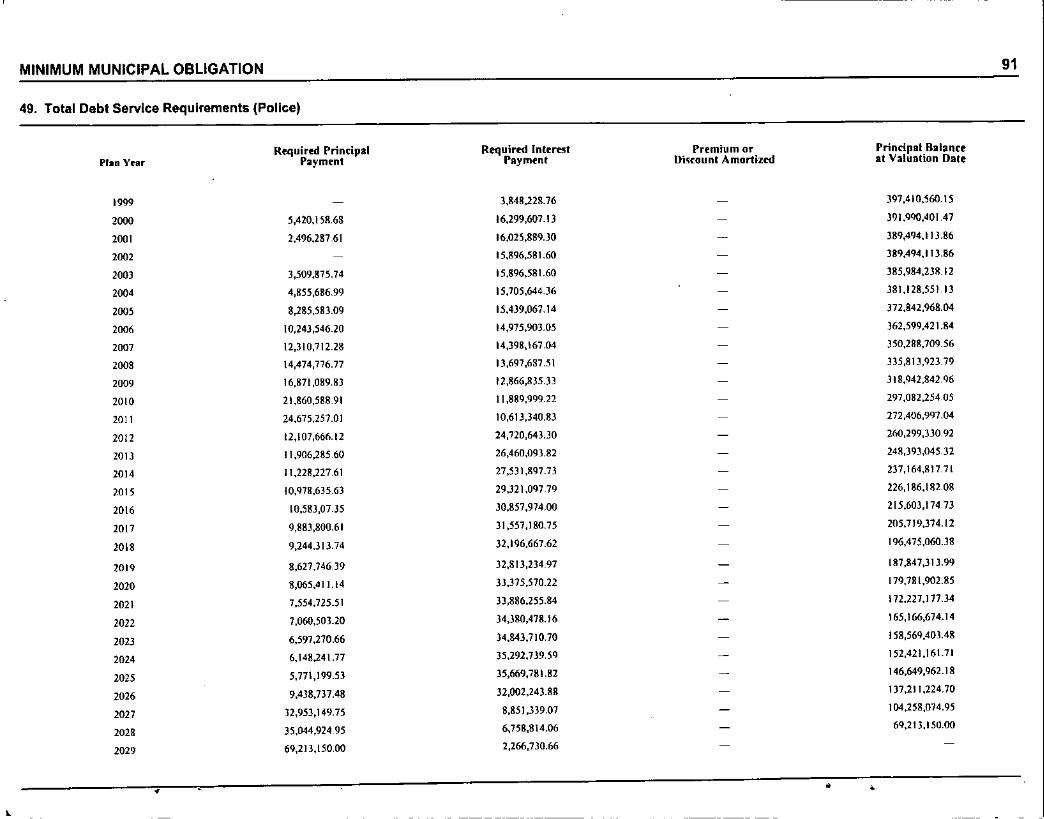
MINIMUM MUNICIPAL OBLIGATION 91
49. Total Debt Service Requirements (Police)
Required Principal Requirro Interest Premium or Principal BalancePI.n Year Payment Payment Di~('ounr Amortized at Valuation Date
1999 3,848,228.76 397,410,560.15
2000 5,420,15&.68 16,299,607.13 391,990,401,47
2001 2,496,287.61 16,025,889.30 - 389,494,113.86
2002 15,896,581.60 389,494,11 ).86
2003 3,509,875.74 15,896,581.60 385,984,238.12
200' 4,855,686.99 15,105,644.36 381,128,55l 13
2005 8,285,583.09 15,439,061.14 - 372,842,968.04
2006 10,243,546.20 14,915,903.05 362,599,421.84
2007 12,310,712.28 14,398,167.04 350,288,709.56
2008 14,474,776.77 13,697,687.5\ 335,813,923.79
2009 16,871,089.83 12,866,8)5.33 318,942,842.96
2010 21,860,588.91 11,889,999.22 297,082,254.05
2011 24,675,257.01 10,613,340.83 272,406,997.04
2012 12,107,666.12 24,720,643.30 - 2(,(1,299,BO,92
2013 11,906,28560 26,460,093.82 248,393,045,32
2014 11,228,227,61 27,531,897.73 237,164,817 ,71
2015 10,978,635,63 29,321,097.79 226,186,182,08
2016 10,583,07.35 30,857,974.00 - 215,603,174.73
2017 9,883,800.61 31,557,180.75 205,719,374.12
2018 9,244,313.74 32,196,667.62 196,475,060.38
2019 8,627.746.39 32,813,234.97 - 187,847,313.99
2020 8,065,411.14 33,315,570.22 - 119,181,902.85
2021 7,554,725.51 33,886,255.84 172,221,177.34
2022 7,060,503.20 34,380,478.!6 - 165,166,674.14
2023 6,597,210.66 34,843,710.70 158,569.403.48
2024 6,148,241.77 35,292,739,5ll - 152,421,161.71
2025 5,771,199.53 35,669,781.82 - 146,649,962.18
2026 9,438,737.48 32,002,24].88 137,211,224.70
2027 32,953,149.75 8,851,339.01 - 104,258,074.95
2028 35,044,924.95 6,758,814.06 - 69,213,150.00
2029 69,213,150,00 2,266,730.66
• • ••
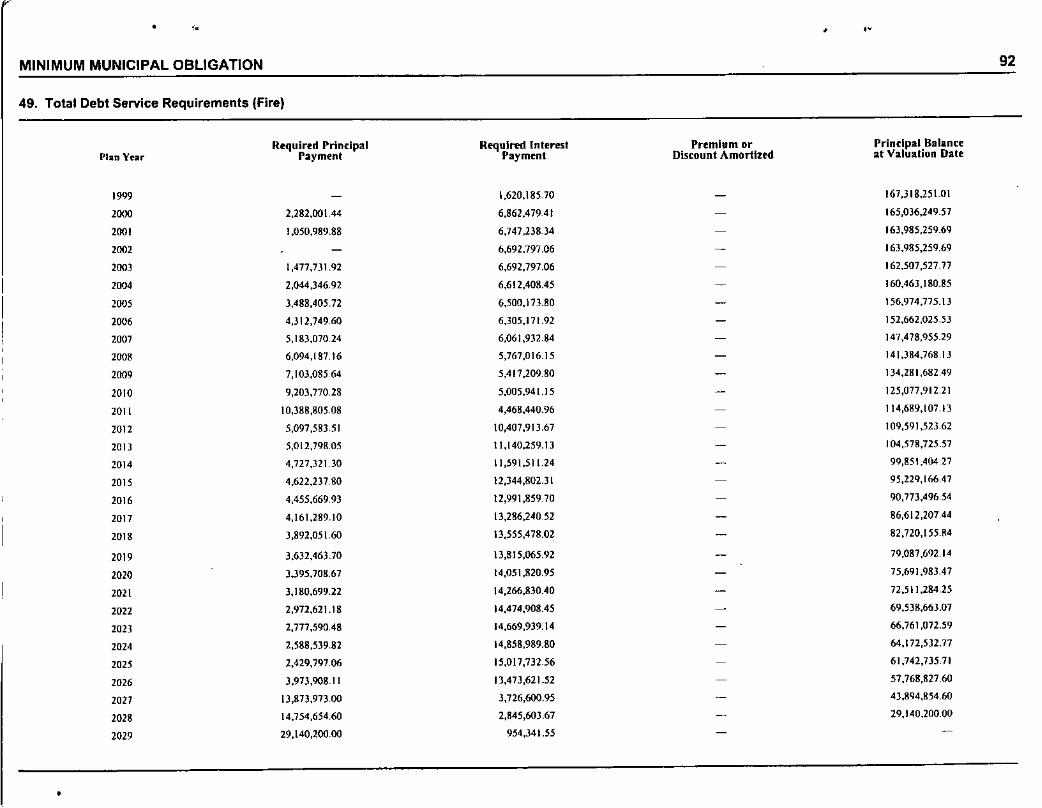
• ". • ,.
MINIMUM MUNICIPAL OBLIGATION
49. Total Debt Service Requirements (Fire)
92
•
Plan Year
1999200020012002200J20042005
20062007200820092010
2011
1012
2013
2014
2015
2016
2017
2018
2019
20102011
2022
2023
20242025
20262021
2028
2029
Required PrincipalPayment
2,282,001.44
l,050,989.88
1,477,731.92
2,044,346.92
3,488,405.72
4,312,749,60
5,183,010,24
6,094,187,16
7,103,085.64
9,203,770,28
10,388,805,08
5,091,583,51
5,012,798,05
4,721,321,30
4,622.237,80
4,455,669,93
4,161,289.10
3,892,051,60
3,632,463.10
3,395,708.67
3,180,699.22
2,972,621.18
2,777,590,48
2,588,539.82
2,429,797,06
3,973,908.11
13,813,91],00
14,754,654.60
29,140,200.00
Required InterestPayment
1,620,185-70
6,862,479-41
6,747,238.34
6,692.791.06
6,692,797.06
6,612,408.45
6,500,173.80
6,305,171.92
6,061,932.84
5,767,016.15
5,411,209.80
5.005,941.15
4,468,440.96
10,407.913.67
11,140,259.13
11,591,511.24
12,344,801.31
12,991,859.70
13,286,240.52
13,555,478.02
13,815,065.92
14,051,820.95
14,266,830.40
14,474,908.45
14,669,939.14
14,858,989.80
15,017,732.56
13,473,621.52
3,726,600.95
2,845,603.67
954,341.55
Premium orDiscount Amortized
Prindpal Balanceat Valuation Date
167,318,251-01
165,036,249.57
163,985,259.69
163.985,259.69
162,507,527.77
160,463,180.85
156,974,775.13
152,662,025.53
147,478,955.29
141,384,768,13
134,281,682,49
125,077,912,21
114,689,107,13
109,591,523,62
104,578,725.57
99,851.404.27
95,229,166,47
90,773,496,54
86,612,207,44
82,720,155.84
79.087,692.14
75,691,983.47
72,511,284.25
69,538,663.07
66,761,072.59
64,172,532.77
61,742,735.71
51,768,821.60
43,894,854.60
29,140.200.00
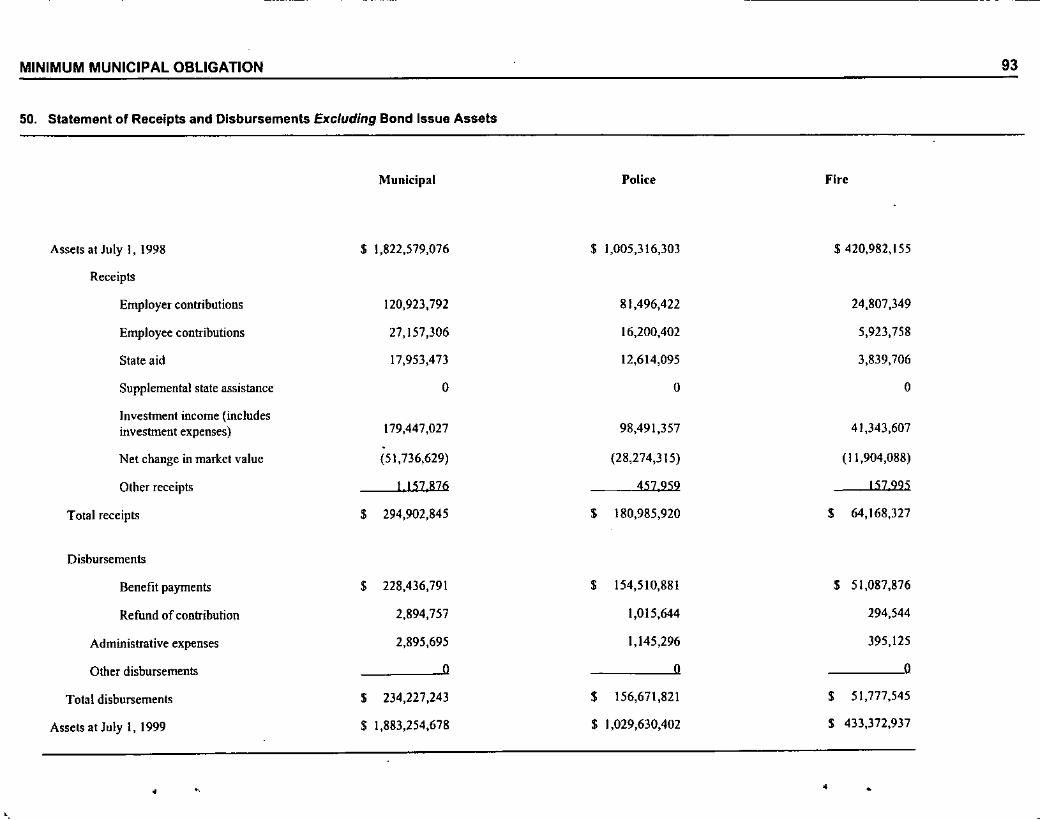
MINIMUM MUNICIPAL OBLIGATION
50. Statement of Receipts and Disbursements Excluding Bond Issue Assets
Municipal Police Fire
93
Assels al July 1, 1998 $ 1,822,579,076 $ 1,005,316,303 $ 420,982,155
Receipts
Employer contributions 120,923,792 81,496,422 24,807,349
Employee contributions 27,157,306 16,200,402 5,923,758
State aid 17,953,473 12,614,095 3,839,706
Supplemental state assistance 0 0 0
Inveshnent income (includesinvestment expenses) 179,447,027 98,491,357 41,343,607
Net change in market value (51,736,629) (28,274,315) ('1,904,088)
Other receipts Ll51.R16 457.959 ----li7-'1'l5
Total receipts $ 294,902,845 $ 180,985,920 $ 64,168,327
Disbursements
Benefit payments $ 228,436,791 $ 154,510,881 $ 51,087,876
Refund of contribution 2,894,757 1,015,644 294,544
Administrative expenses 2,895,695 1,145,296 395,125
Other disbursements -ll 0 0
Total disbursements $ 234,227,243 $ 156,671,821 $ 51,777,545
Assets at July I, 1999 $ 1,883,254,678 $ 1,029,630,402 $ 433,372,937
'.
• , •
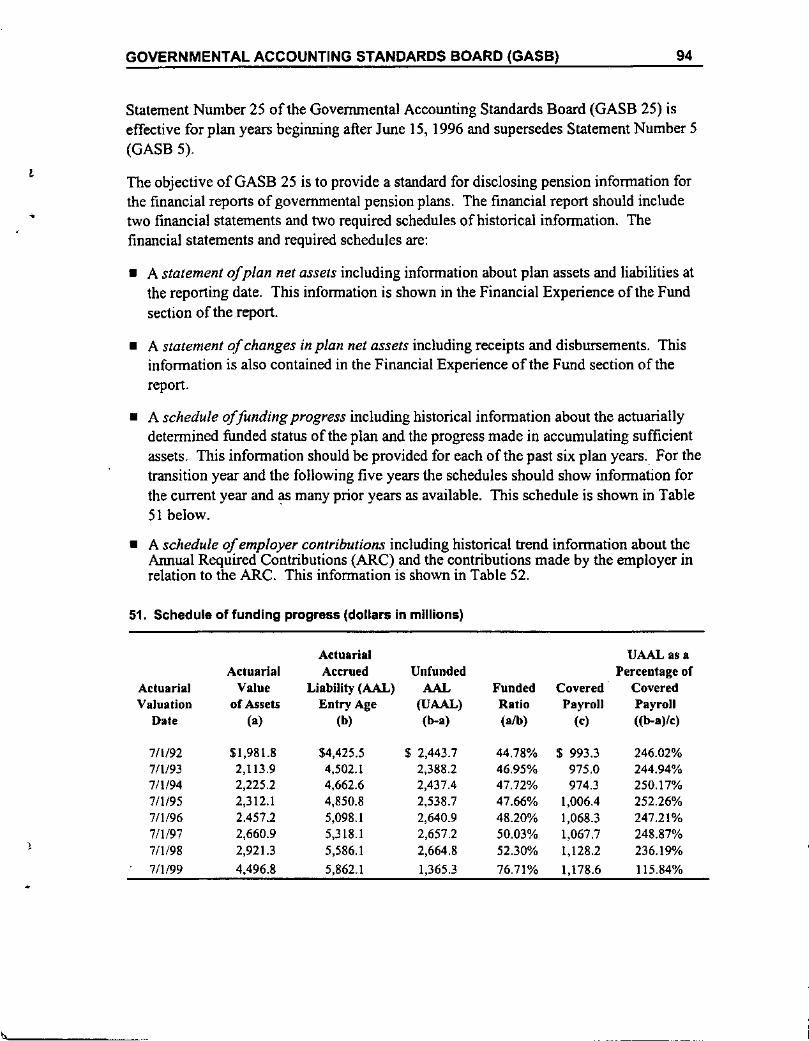
GOVERNMENTAL ACCOUNTING STANDARDS BOARD (GASB) 94
,
Statement Number 25 of the Governmental Accounting Standards Board (GASB 25) iseffective for plan years beginning after June 15, 1996 and supersedes Statement Number 5(GASB 5).
The objective ofGASB 25 is to provide a standard for disclosing pension information forthe financial reports of governmental pension plans. The financial report should includetwo financial statements and two required schedules of historical information. Thefinancial statements and required schedules are:
• A statement of plan net assets including information ahout plan assets and liabilities atthe reporting date. This information is shown in the Financial Experience of the Fundsection of the report.
• A statement of changes in plan net assets including receipts and disbursements. Thisinformation is also contained in the Financial Experience of the Fund section of thereport.
• A schedule of funding progress including historical information about the actuariallydetermined funded status of the plan and the progress made in accumulating sufficientassets. This information should be provided for each of the past six plan years. For thetransition year and the following five years the schedules should show information forthe current year and ~ many prior years as available. This schedule is shown in Table51 below.
• A schedule of employer contributions including historical trend information about theArmual Required Contributions (ARC) and the contributions made by the employer inrelation to the ARC. This information is shown in Table 52.
51. Schedule of funding progress (dollars In mlilions)
Aduarial UAAL asaActuarial Accrued Unfunded PerceDtage of
Actuarial Value Liability (AAL) AAL Funded Covered CoveredValuation of Assets Entry Age (UAAL) Ratio Payroll PayrollDate (a) (b) (b-a) (alb) (e) «b-a)/c)
7/1/92 $1,981.8 54,425.5 $ 2,443.7 44.78% $ 993.3 246.02%7/l/93 2,113.9 4,502.1 2,388.2 46.95% 975.0 244.94%7/1194 2,225.2 4,662.6 2,437.4 47.72% 974.3 250.17%7/1/95 2,312.1 4,850.8 2,538.7 47.66% 1,006.4 252.26%711/96 2.457.2 5,098.1 2,640.9 48.20% 1,068.3 247.21%7/1/97 2,660.9 5,318.1 2,657.2 50.03% 1,067.7 248.87%
l 7/1/98 2,921.3 5,586.1 2,664.8 52.30% 1,128.2 236.19%7/1/99 4,496.8 5,862.1 1,365.3 76.71% 1,178.6 115.84%
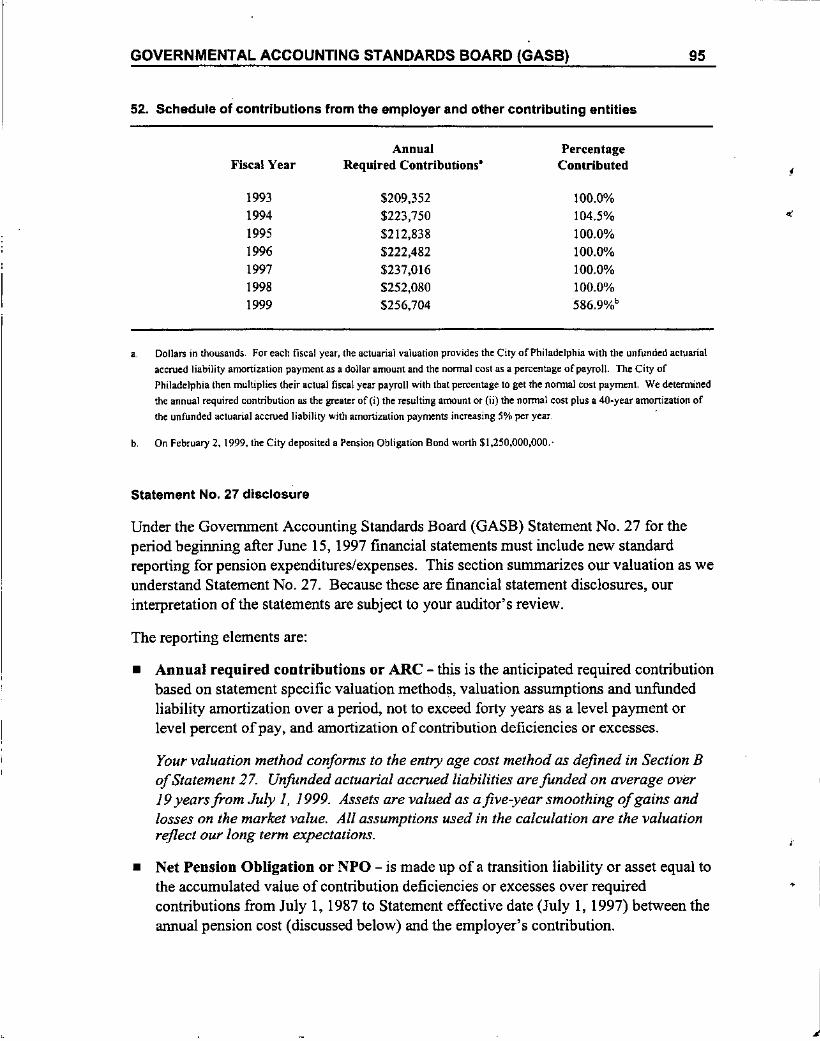
GOVERNMENTAL ACCOUNTING STANDARDS BOARD (GASB)
52. Schedule of contributions from the employer and other contributing entities
95
Annual PercentageFiscal Year Required Contributions. Contributed ,
1993 $209,352 100.0%1994 $223,750 104.5%1995 $212,838 100.0%1996 $222,482 100.00101997 $237,016 100.0%1998 $252,080 100.0%1999 $256,704 586.9%b
a, Dollars in thousands. For each fiscal year, the actuarial valuation provides the City of Philadelphia with the:unfunded actuarialaccrued liability amortization payment as a dollar amount and the normal cost as a percentage of payroll. The City ofPhiladelphia then multiplies their actual fiscal year payroll with that percentage to get the nonnal cost payment. We determinedthe annual required contribution as the greater of(il the resulting amount or (ii) the normal cost plus a 40-year amortization of{heunfunded actuarial accrued liability with amortization payments increasing 5% per year,
b, On February 2. 1999. the City deposited a Pension Obligation Bond worth $1,250,000,000.'
Statement No. 27 disclosure
Under the Govenunent Accounting Standards Board (GASB) Statement No. 27 for theperiod beginning after June 15, 1997 financial statements must include new standardreporting for pension expenditures/expenses. This section summarizes our valuation as weunderstand Statement No. 27. Because these are financial statement disclosures, ourinterpretation of the statements are subject to your auditor's review.
The reporting elements are:
• Annual required contributions or ARC - this is the anticipated required contributionbased on statement specific valuation methods, valuation assumptions and unfundedliability amortization over a period, not to exceed forty years as a level payment orlevel percent of pay, and amortization of contribution deficiencies or excesses.
Your valuation method conforms to the entry age cost method as defined in Section Ba/Statement 27. Unfunded actuarial accrued liabilities are funded on average over19 years from July 1, 1999. Assets are valued as afive-year smoothing o/gains andlosses on the market value. All assumptions used in the calculation are the valuationreflect our long term expectations.
• Net Pension Obligation or NPO - is made up of a transition liability or asset equal tothe accumulated value of contribution deficiencies or excesses over requiredcontributions from July 1, 1987 to Statement effective date (July 1, 1997) between theannual pension cost (discussed below) and the employer's contribution.
,
•
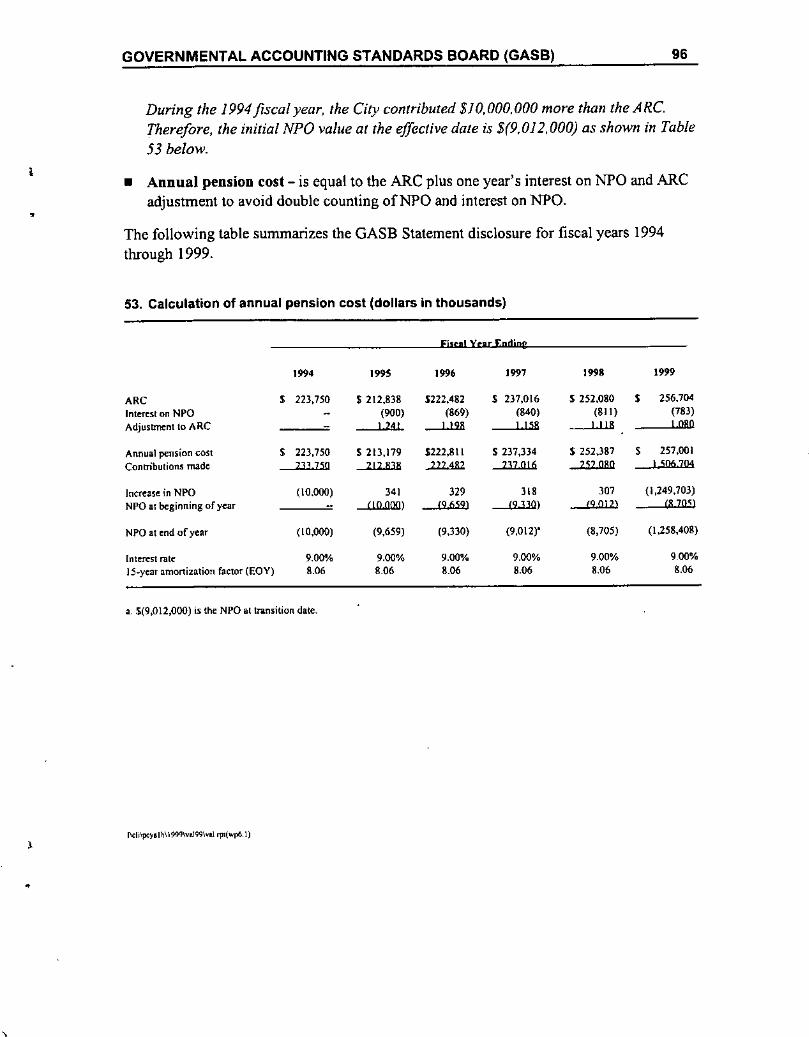
GOVERNMENTAL ACCOUNTING STANDARDS BOARD (GASB) 96
,
1
•
•
During the 1994 fiscal year, the City contributed $10,000,000 more than the ARC.Therefore, the initial NPO value at the effective dale is $(9.012, 000) as shown in Table53 below.
• Annual pension cost - is equal to the ARC plus one year's interest on NPO and ARCadjustment to avoid double counting ofNPO and interest on NPO .
The following table summarizes the GASB Statement disclosure for fiscal years 1994through 1999.
53. Calculation of annual pension cost (dollars in thousands)
Fist'! VUt Ending
'99' 1995 '99' '99' '99' "99
ARC , 223,750 $ 212,838 1222,482 ,237,016 S 252,080 , 256.704
Interest on NPa (900) (869) (840) (Bll) (783)
Adjustment to ARC J 24! ---l.l28 J 158 J 118 1080
Annual pension COSt, 223,750 5213,179 S22Z,Bil S 237,334 S 252,387 , 257,001
Contributions made 211750 212818 ..122.ill 2U016 252080 I 5Q67Q4
Increase in NPO (10,000) 341 329 318 307 (1,249,703)
NPO al beginning of yea! (0000) (96591 (9 nO) (9012) (8 70~)
NPO at end ofyeaf (10,000) (9,659) (9,330) (9,012)' (8,705) (I,258,408)
[nlerest rate 9.()()OA, 9.00% 9.00% 9.00% 9.00% 9.00%
IS-year amonization factor (EOY) 8.06 8.06 8.06 8.06 8.06 8.06
a, $(9,012,000) is the NPO at transition date.
""1i\po~.lh\199'l\voI99\v.) rpllwpl>, I)

I'
,
,

l
•
•

,,
I
•
)