Investment of Pension Funds and Sovereign Wealth Funds … in Pension... · Investment of Pension...
38
1 Investment of Pension Funds and Sovereign Wealth Funds in China BY STUART H. LECKIE, O.B.E., J.P., F.I.A., F.S.A. CHAIRMAN, STIRLING FINANCE LIMITED TEL: (852) 2147 9998 FAX: (852) 2147 2822 E-mail: [email protected] 20 August 2011 CFA Institute Shenzhen Seminar
Transcript of Investment of Pension Funds and Sovereign Wealth Funds … in Pension... · Investment of Pension...
1
Investment of Pension Funds and Sovereign Wealth Funds in China
BY
STUART H. LECKIE, O.B.E., J.P., F.I.A., F.S.A.
CHAIRMAN, STIRLING FINANCE LIMITED
TEL: (852) 2147 9998
FAX: (852) 2147 2822
E-mail: [email protected]
20 August 2011
CFA Institute Shenzhen Seminar
Contents
Demographic Dynamics in China
Pension Reforms and Enterprise Annuities
Urban pension system
Enterprise Annuities
New rural pension system
Sovereign Wealth Funds
National Social Security Fund (NSSF)
China Investment Corporation (CIC)
State Administration of Foreign Exchange (SAFE)
China-Africa Development Fund
Investment Opportunities and Future Outlook2
Demographic Dynamics in China
3
4
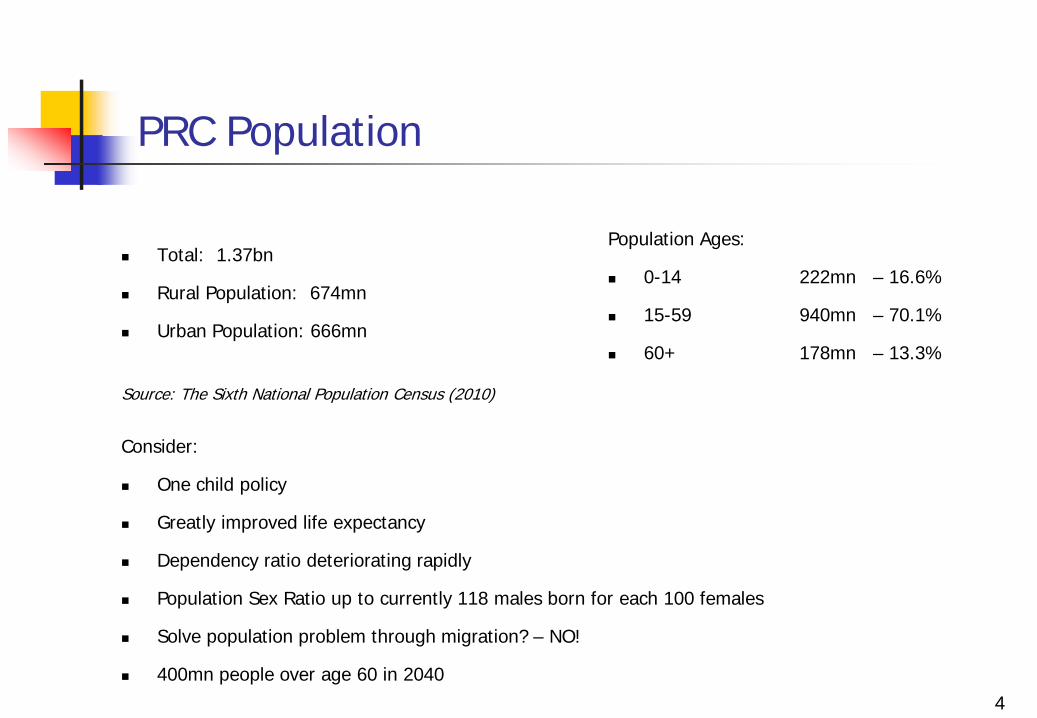
PRC Population
Total: 1.37bn
Rural Population: 674mn
Urban Population: 666mn
Source: The Sixth National Population Census (2010)
Population Ages:
0-14 222mn – 16.6%
15-59 940mn – 70.1%
60+ 178mn – 13.3%
Consider:
One child policy
Greatly improved life expectancy
Dependency ratio deteriorating rapidly
Population Sex Ratio up to currently 118 males born for each 100 females
Solve population problem through migration? – NO!
400mn people over age 60 in 2040
5
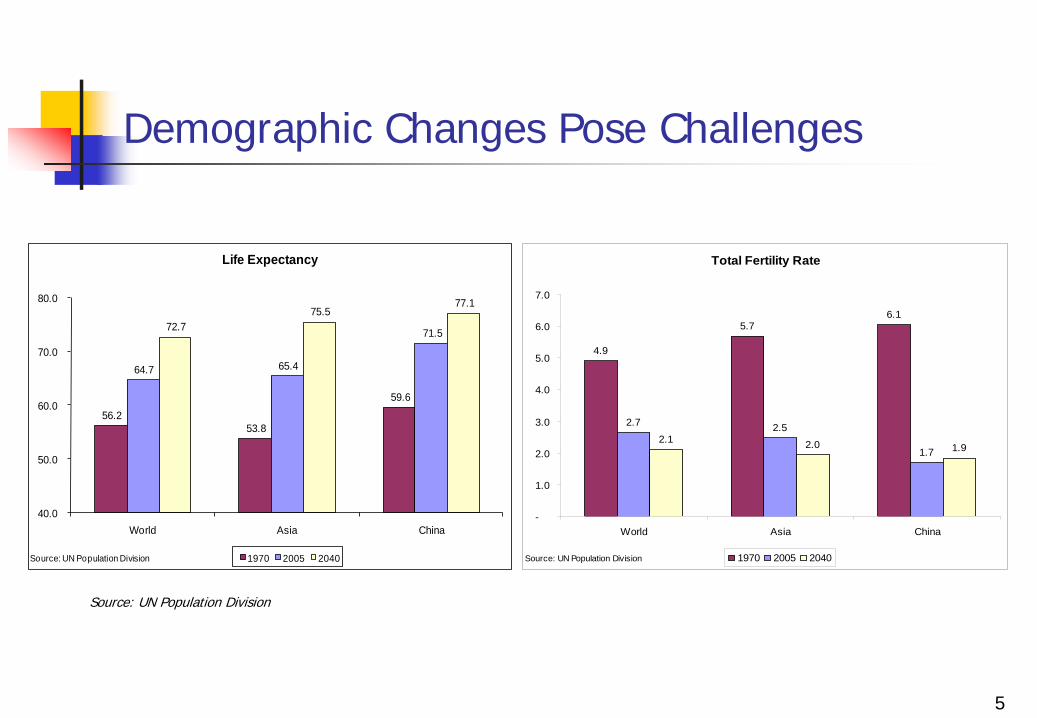
Demographic Changes Pose Challenges
Total Fertility Rate
4.9
5.76.1
2.7 2.5
1.72.1 2.0 1.9
-
1.0
2.0
3.0
4.0
5.0
6.0
7.0
World Asia China
1970 2005 2040Source: UN Population Division
56.2 53.8
59.6
64.7 65.4
71.5 72.7 75.5
77.1
40.0
50.0
60.0
70.0
80.0
World Asia China
Life Expectancy
1970 2005 2040Source: UN Population Division
Source: UN Population Division
6
Demographic Changes Pose Challenges (Cont’d)
60 & over as % of Total Population
8.46.5 6.8
10.49.3
10.9
19.120.4
28.2
-
5.0
10.0
15.0
20.0
25.0
30.0
World Asia China
1970 2005 2040Source: UN Population Division
Old-age Dependency Ratio
6.4
8.27.8
5.9
6.76.2
3.1 3.0
2.0
-
1.0
2.0
3.0
4.0
5.0
6.0
7.0
8.0
9.0
World Asia China
1970 2005 2040Source: UN Population Division
Source: UN Population Division

Pension Reforms
and
Enterprise Annuities
7
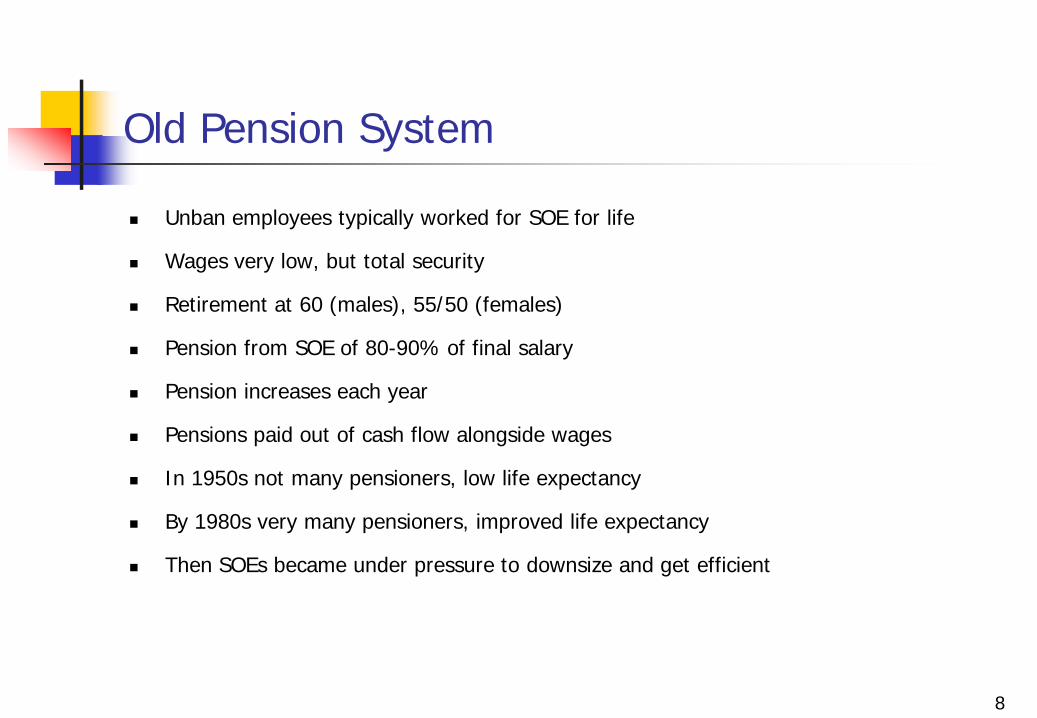
Old Pension System
Unban employees typically worked for SOE for life
Wages very low, but total security
Retirement at 60 (males), 55/50 (females)
Pension from SOE of 80-90% of final salary
Pension increases each year
Pensions paid out of cash flow alongside wages
In 1950s not many pensioners, low life expectancy
By 1980s very many pensioners, improved life expectancy
Then SOEs became under pressure to downsize and get efficient
8
9
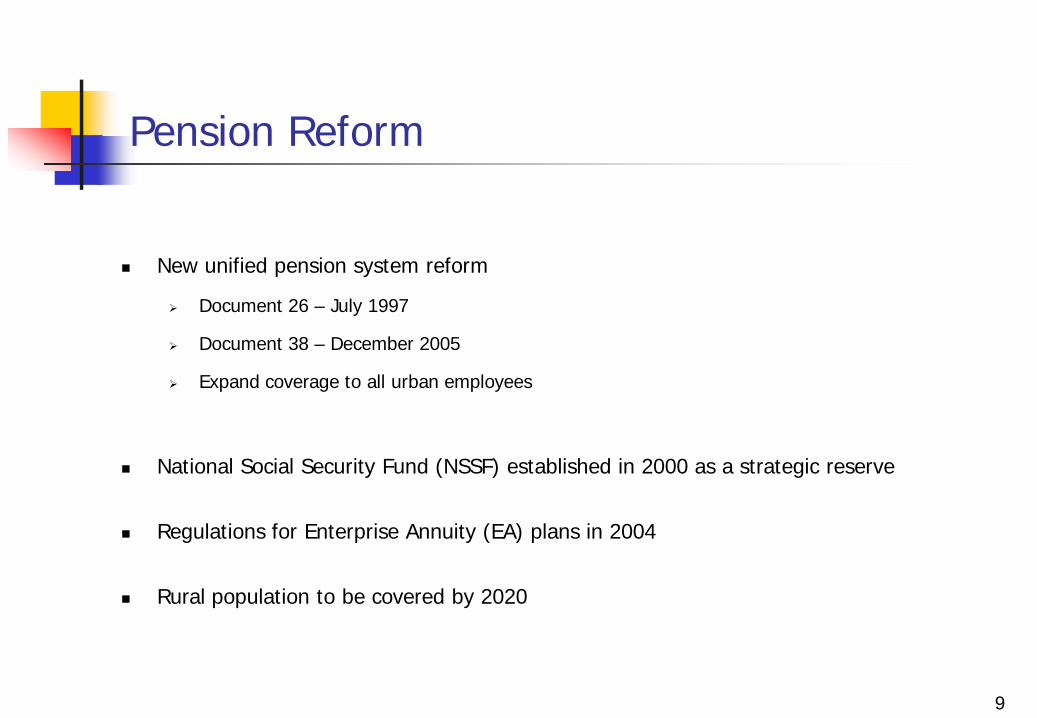
Pension Reform
New unified pension system reform
Document 26 – July 1997
Document 38 – December 2005
Expand coverage to all urban employees
National Social Security Fund (NSSF) established in 2000 as a strategic reserve
Regulations for Enterprise Annuity (EA) plans in 2004
Rural population to be covered by 2020
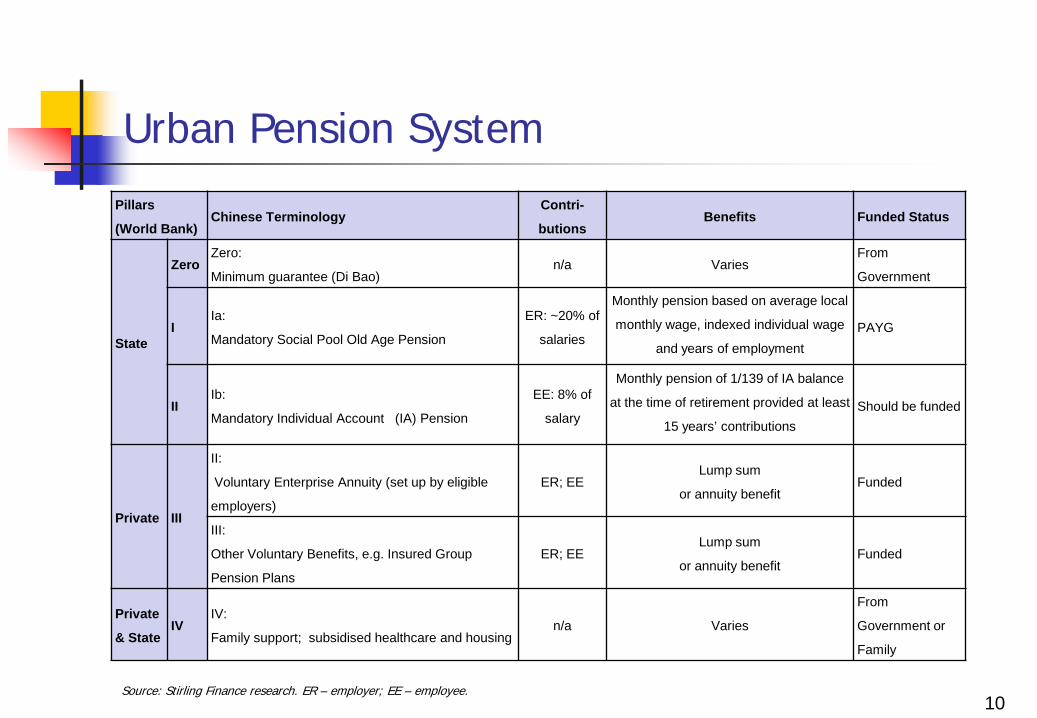
Urban Pension System
10Source: Stirling Finance research. ER – employer; EE – employee.
Pillars
(World Bank)Chinese Terminology
Contri-
butionsBenefits Funded Status
State
ZeroZero:
Minimum guarantee (Di Bao)n/a Varies
From
Government
IIa:
Mandatory Social Pool Old Age Pension
ER: ~20% of
salaries
Monthly pension based on average local
monthly wage, indexed individual wage
and years of employmentPAYG
IIIb:
Mandatory Individual Account (IA) Pension
EE: 8% of
salary
Monthly pension of 1/139 of IA balance
at the time of retirement provided at least
15 years’ contributionsShould be funded
Private III
II:
Voluntary Enterprise Annuity (set up by eligible
employers)
ER; EELump sum
or annuity benefitFunded
III:
Other Voluntary Benefits, e.g. Insured Group
Pension Plans
ER; EELump sum
or annuity benefitFunded
Private
& StateIV
IV:
Family support; subsidised healthcare and housingn/a Varies
From
Government or
Family
11
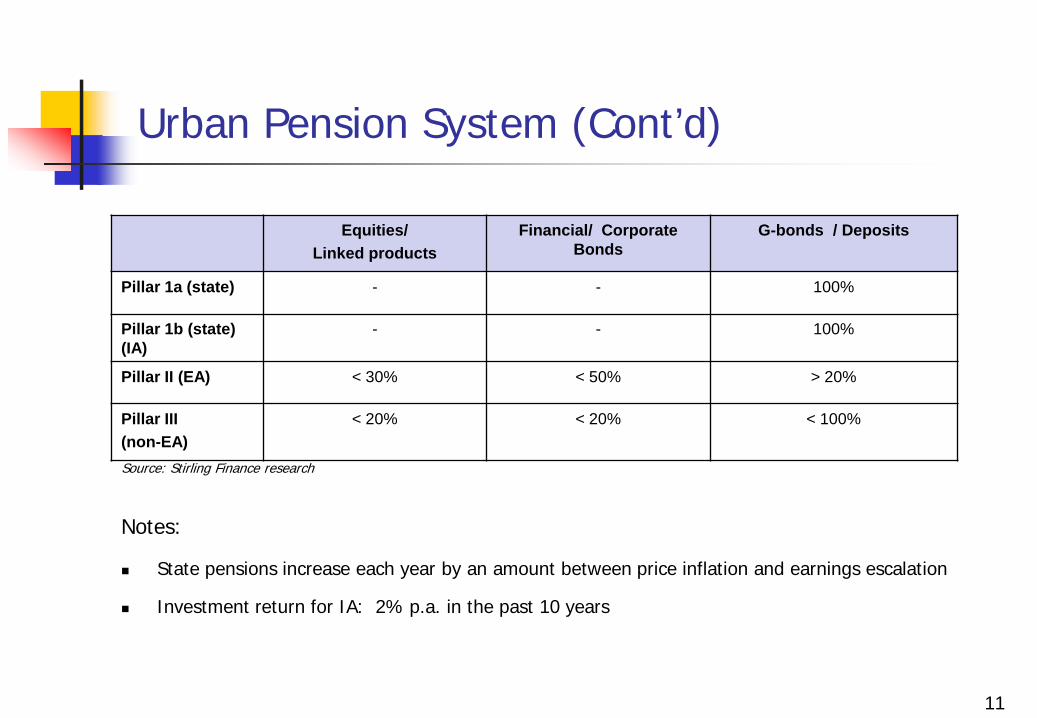
Urban Pension System (Cont’d)
Equities/Linked products
Financial/ Corporate Bonds
G-bonds / Deposits
Pillar 1a (state) - - 100%
Pillar 1b (state) (IA)
- - 100%
Pillar II (EA) < 30% < 50% > 20%
Pillar III (non-EA)
< 20% < 20% < 100%
Source: Stirling Finance research
Notes:
State pensions increase each year by an amount between price inflation and earnings escalation
Investment return for IA: 2% p.a. in the past 10 years
12
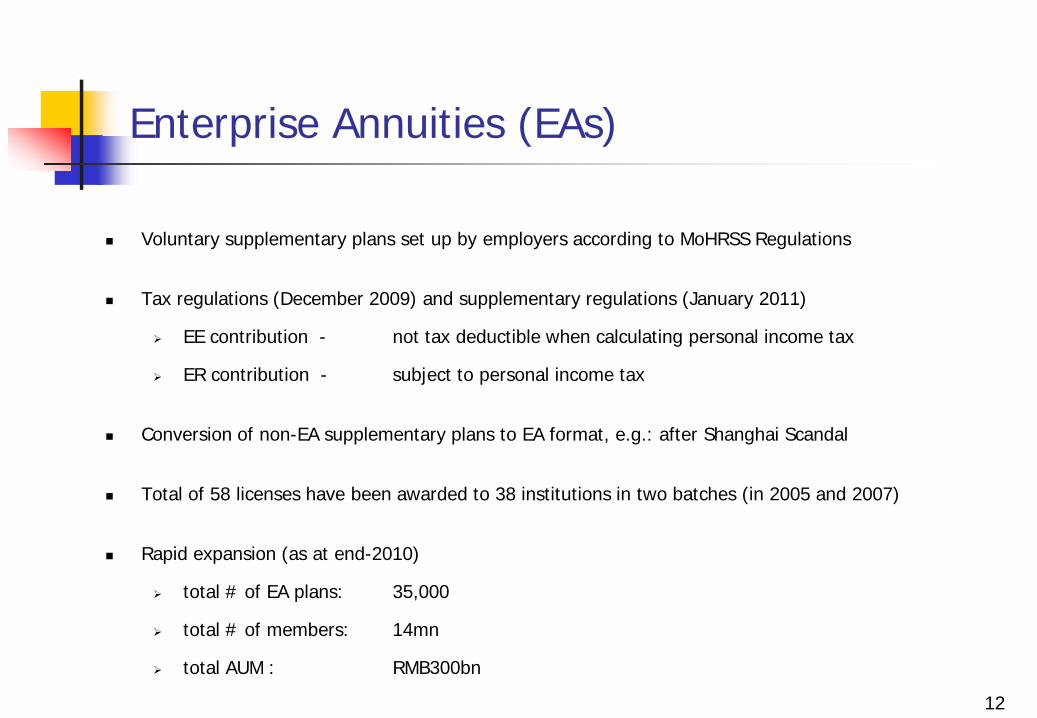
Enterprise Annuities (EAs)
Voluntary supplementary plans set up by employers according to MoHRSS Regulations
Tax regulations (December 2009) and supplementary regulations (January 2011)
EE contribution - not tax deductible when calculating personal income tax
ER contribution - subject to personal income tax
Conversion of non-EA supplementary plans to EA format, e.g.: after Shanghai Scandal
Total of 58 licenses have been awarded to 38 institutions in two batches (in 2005 and 2007)
Rapid expansion (as at end-2010)
total # of EA plans: 35,000
total # of members: 14mn
total AUM : RMB300bn
13
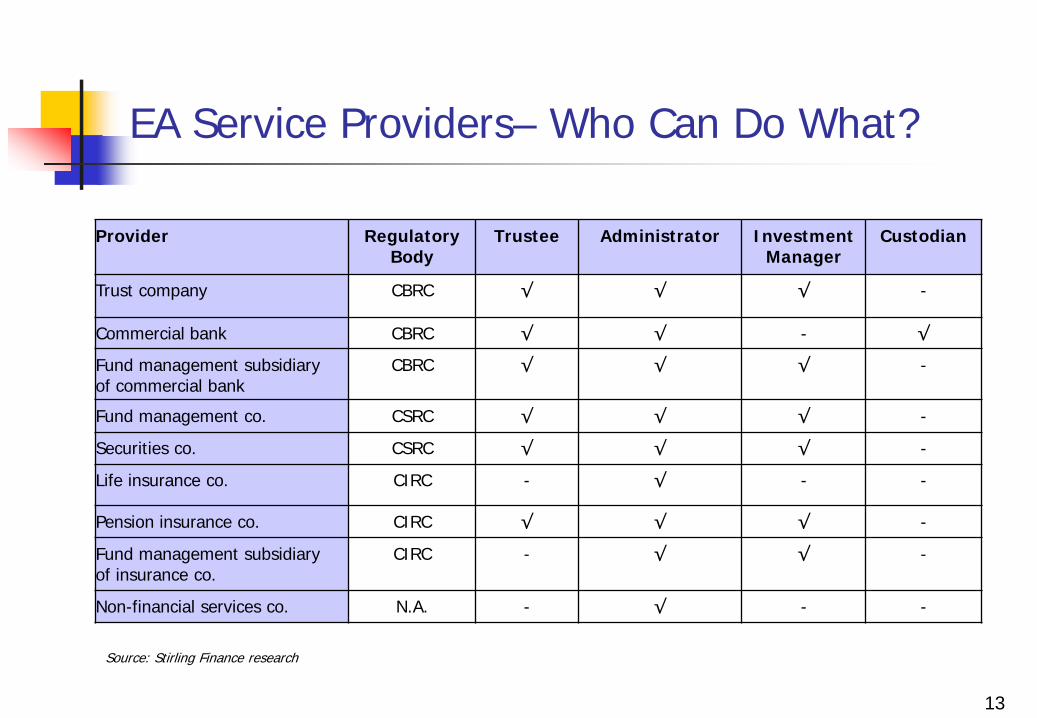
EA Service Providers– Who Can Do What?
Provider RegulatoryBody
Trustee Administrator InvestmentManager
Custodian
Trust company CBRC √ √ √ -
Commercial bank CBRC √ √ - √
Fund management subsidiaryof commercial bank
CBRC √ √ √ -
Fund management co. CSRC √ √ √ -
Securities co. CSRC √ √ √ -
Life insurance co. CIRC - √ - -
Pension insurance co. CIRC √ √ √ -
Fund management subsidiaryof insurance co.
CIRC - √ √ -
Non-financial services co. N.A. - √ - -
Source: Stirling Finance research
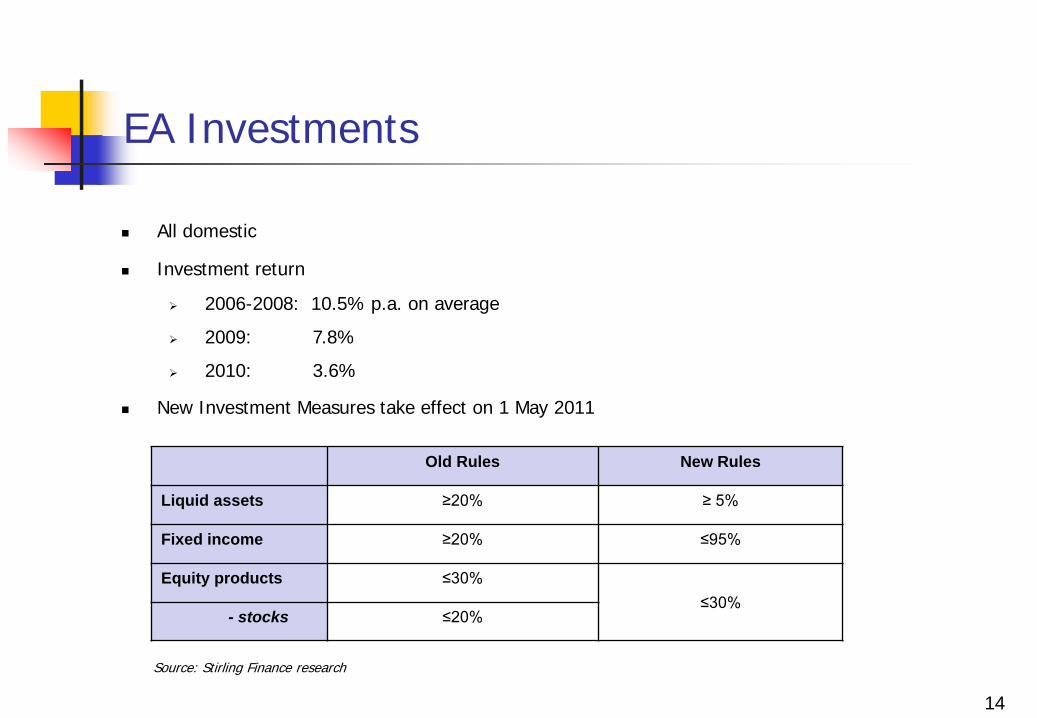
EA Investments
14
All domestic
Investment return
2006-2008: 10.5% p.a. on average
2009: 7.8%
2010: 3.6%
New Investment Measures take effect on 1 May 2011
Old Rules New Rules
Liquid assets ≥20% ≥ 5%
Fixed income ≥20% ≤95%
Equity products ≤30%≤30%
- stocks ≤20%
Source: Stirling Finance research
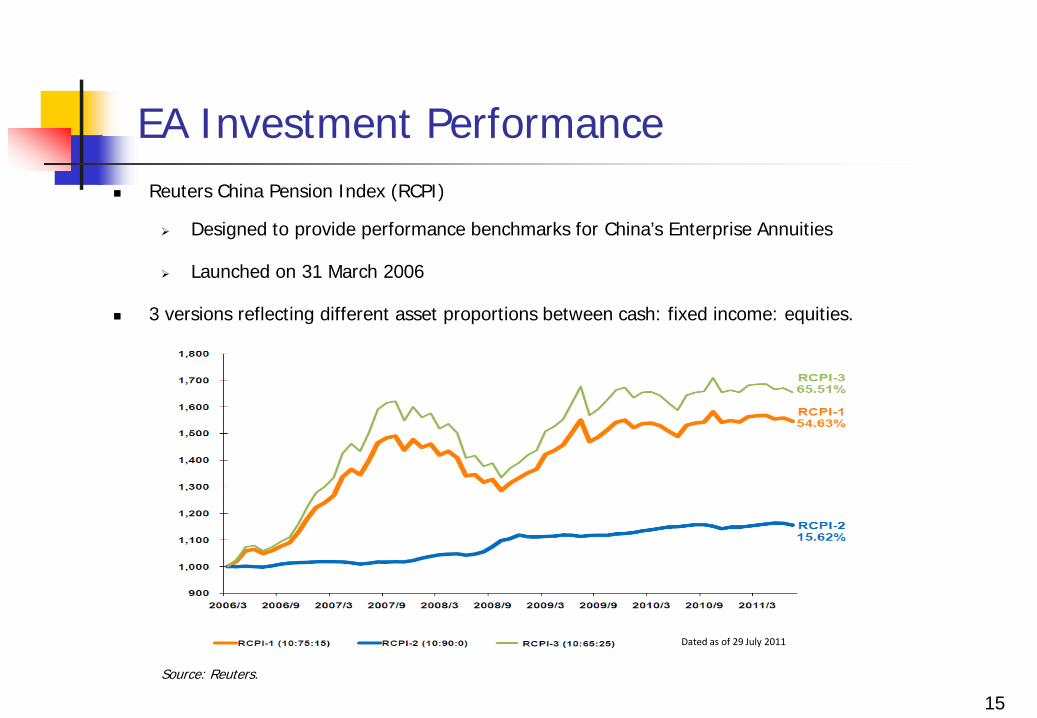
EA Investment Performance Reuters China Pension Index (RCPI)
Designed to provide performance benchmarks for China’s Enterprise Annuities
Launched on 31 March 2006
3 versions reflecting different asset proportions between cash: fixed income: equities.
15
Source: Reuters.
Dated as of 29 July 2011
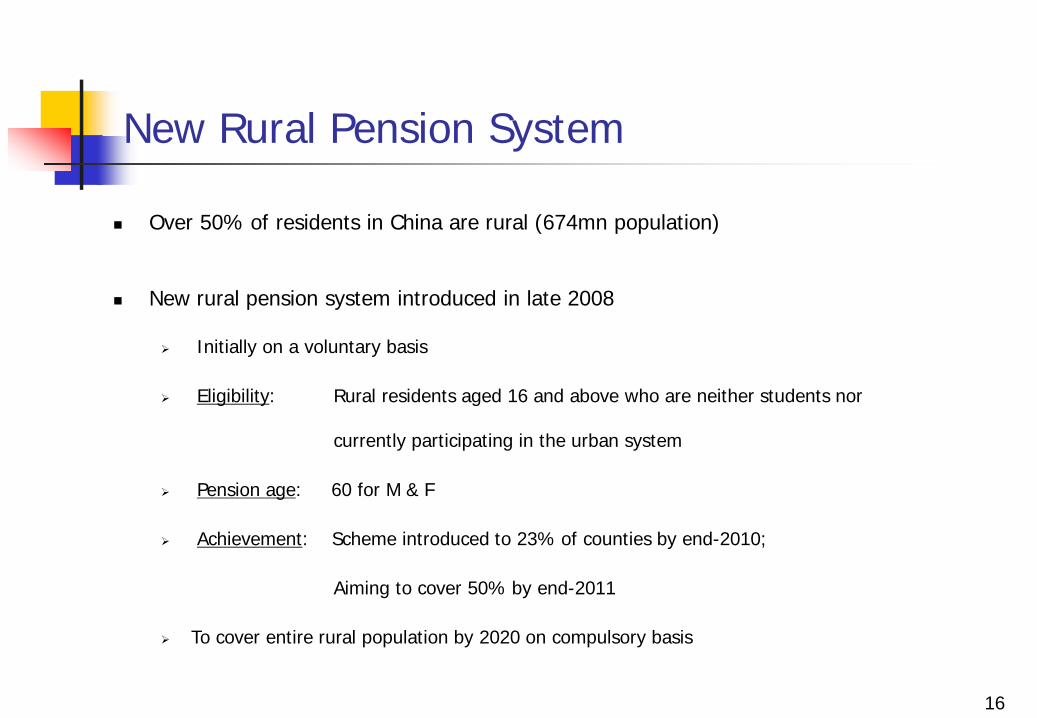
New Rural Pension System
16
Over 50% of residents in China are rural (674mn population)
New rural pension system introduced in late 2008
Initially on a voluntary basis
Eligibility: Rural residents aged 16 and above who are neither students nor
currently participating in the urban system
Pension age: 60 for M & F
Achievement: Scheme introduced to 23% of counties by end-2010;
Aiming to cover 50% by end-2011
To cover entire rural population by 2020 on compulsory basis
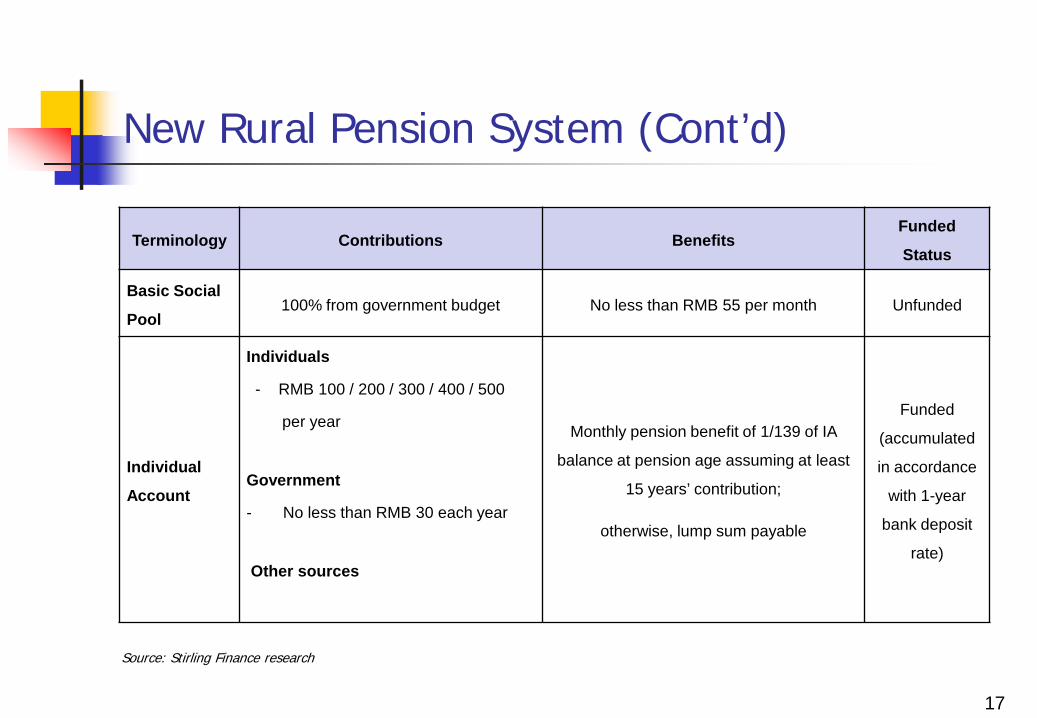
New Rural Pension System (Cont’d)
17
Terminology Contributions BenefitsFunded
Status
Basic Social
Pool100% from government budget No less than RMB 55 per month Unfunded
Individual
Account
Individuals
- RMB 100 / 200 / 300 / 400 / 500
per year
Government
- No less than RMB 30 each year
Other sources
Monthly pension benefit of 1/139 of IA
balance at pension age assuming at least
15 years’ contribution;
otherwise, lump sum payable
Funded
(accumulated
in accordance
with 1-year
bank deposit
rate)
Source: Stirling Finance research

Sovereign Wealth Funds
18
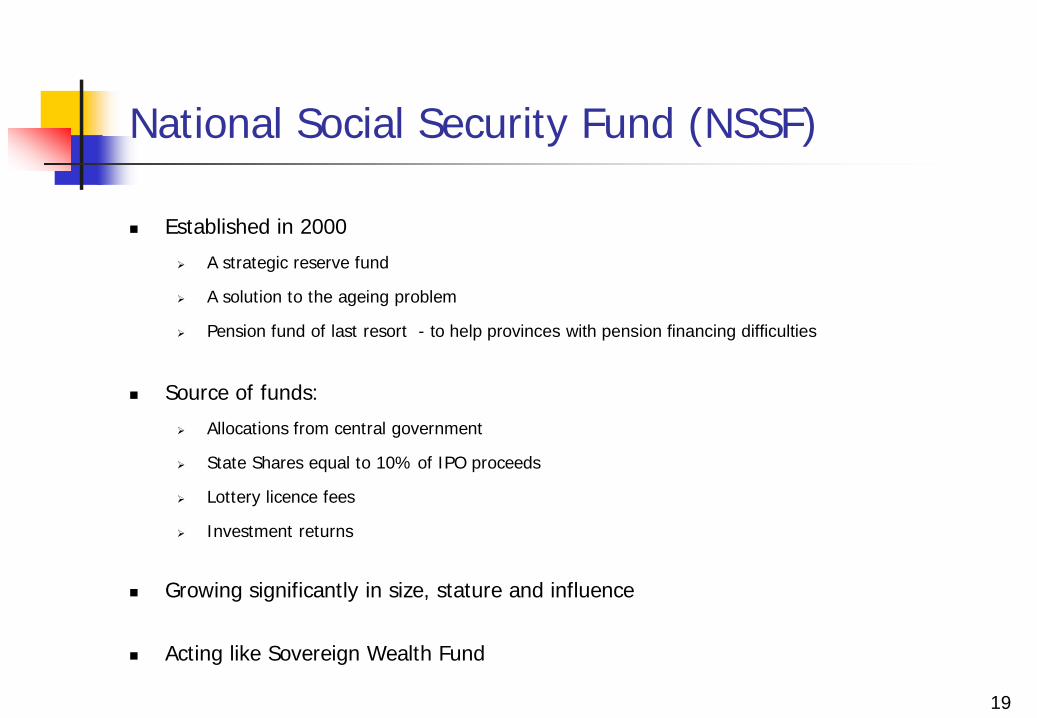
National Social Security Fund (NSSF)
Established in 2000
A strategic reserve fund
A solution to the ageing problem
Pension fund of last resort - to help provinces with pension financing difficulties
Source of funds:
Allocations from central government
State Shares equal to 10% of IPO proceeds
Lottery licence fees
Investment returns
Growing significantly in size, stature and influence
Acting like Sovereign Wealth Fund
19
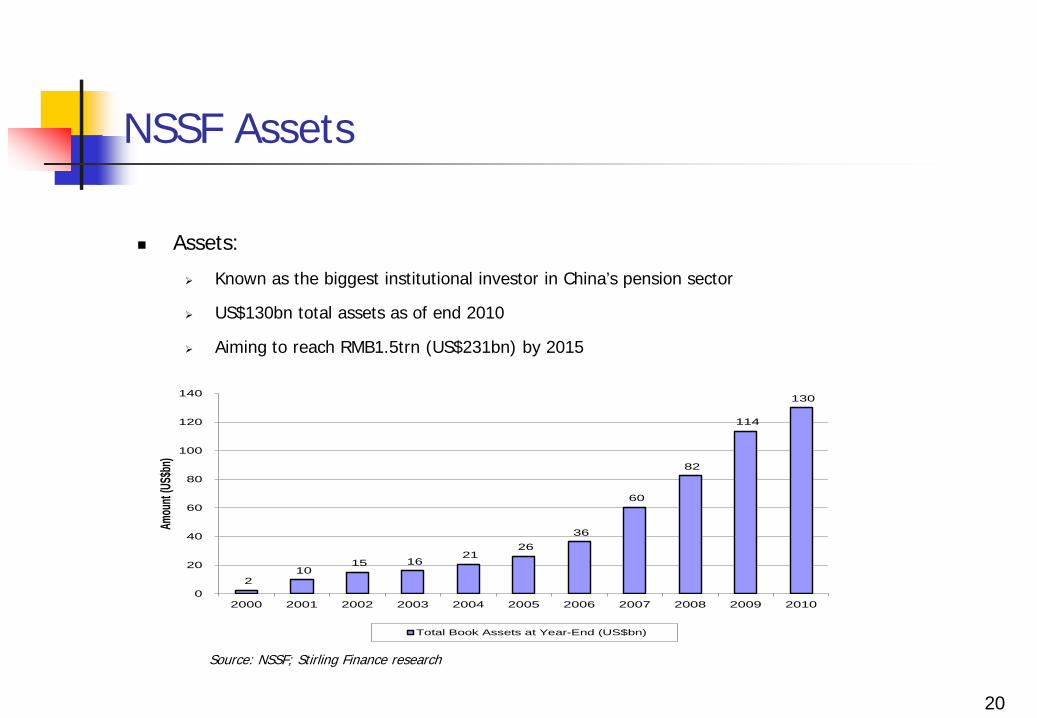
NSSF Assets
Assets:
Known as the biggest institutional investor in China’s pension sector
US$130bn total assets as of end 2010
Aiming to reach RMB1.5trn (US$231bn) by 2015
20
Source: NSSF; Stirling Finance research
2 10
15 16 21
26 36
60
82
114
130
0
20
40
60
80
100
120
140
2000 2001 2002 2003 2004 2005 2006 2007 2008 2009 2010
Amou
nt (US
$bn)
Total Book Assets at Year-End (US$bn)
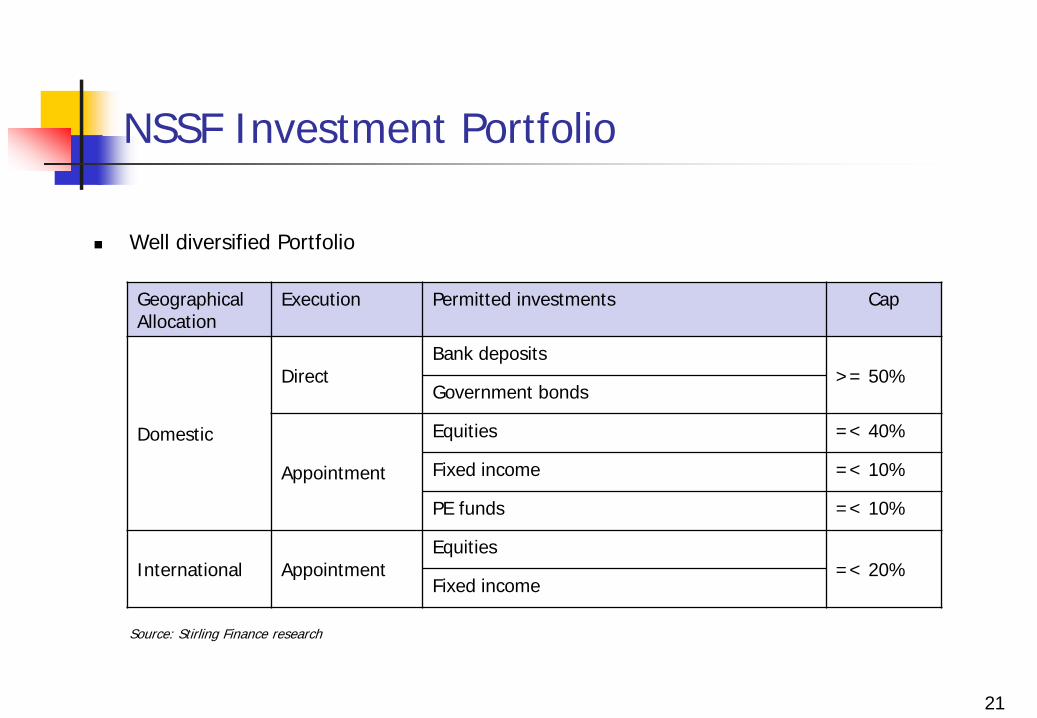
NSSF Investment Portfolio
Well diversified Portfolio
21
GeographicalAllocation
Execution Permitted investments Cap
Domestic
DirectBank deposits
>= 50%Government bonds
Appointment
Equities =< 40%
Fixed income =< 10%
PE funds =< 10%
International AppointmentEquities
=< 20%Fixed income
Source: Stirling Finance research
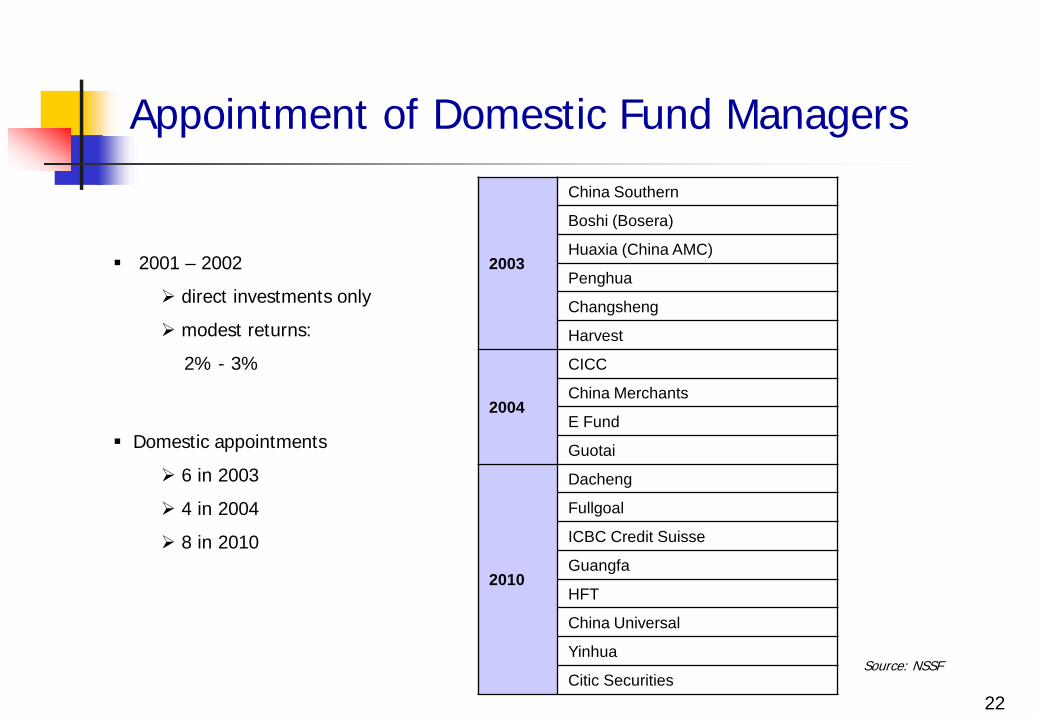
Appointment of Domestic Fund Managers
2001 – 2002
direct investments only
modest returns:
2% - 3%
Domestic appointments
6 in 2003
4 in 2004
8 in 2010
2003
China Southern
Boshi (Bosera)
Huaxia (China AMC)
Penghua
Changsheng
Harvest
2004
CICC
China Merchants
E Fund
Guotai
2010
Dacheng
Fullgoal
ICBC Credit Suisse
Guangfa
HFT
China Universal
Yinhua
Citic Securities22
Source: NSSF
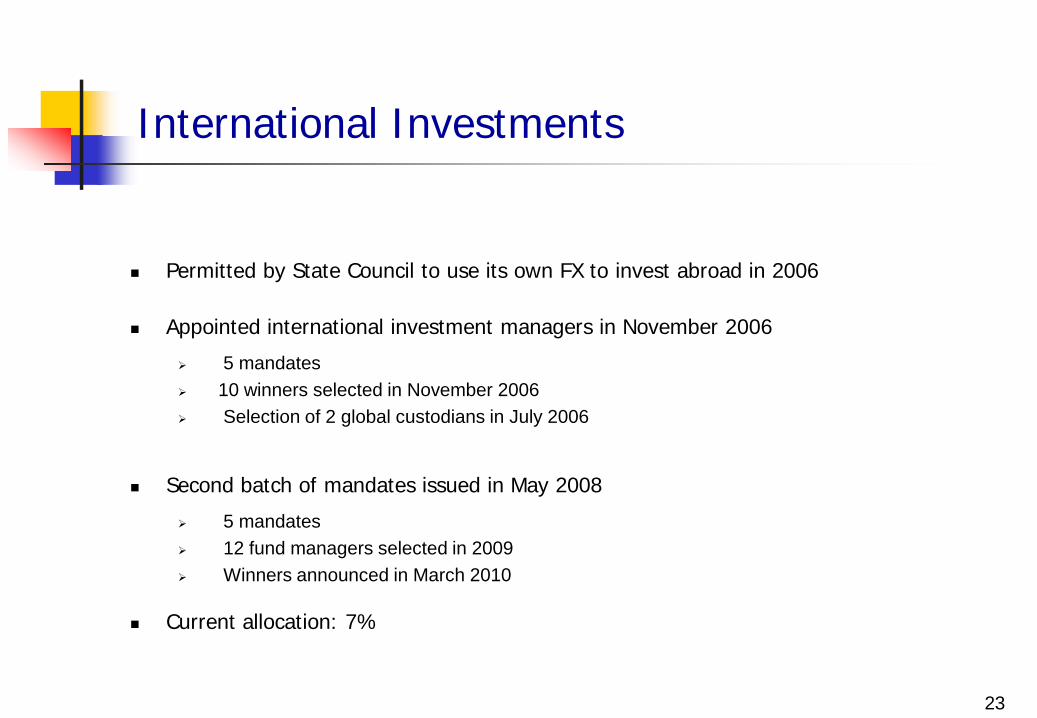
International Investments
Permitted by State Council to use its own FX to invest abroad in 2006
Appointed international investment managers in November 2006 5 mandates 10 winners selected in November 2006 Selection of 2 global custodians in July 2006
Second batch of mandates issued in May 2008
5 mandates 12 fund managers selected in 2009 Winners announced in March 2010
Current allocation: 7%
23
24
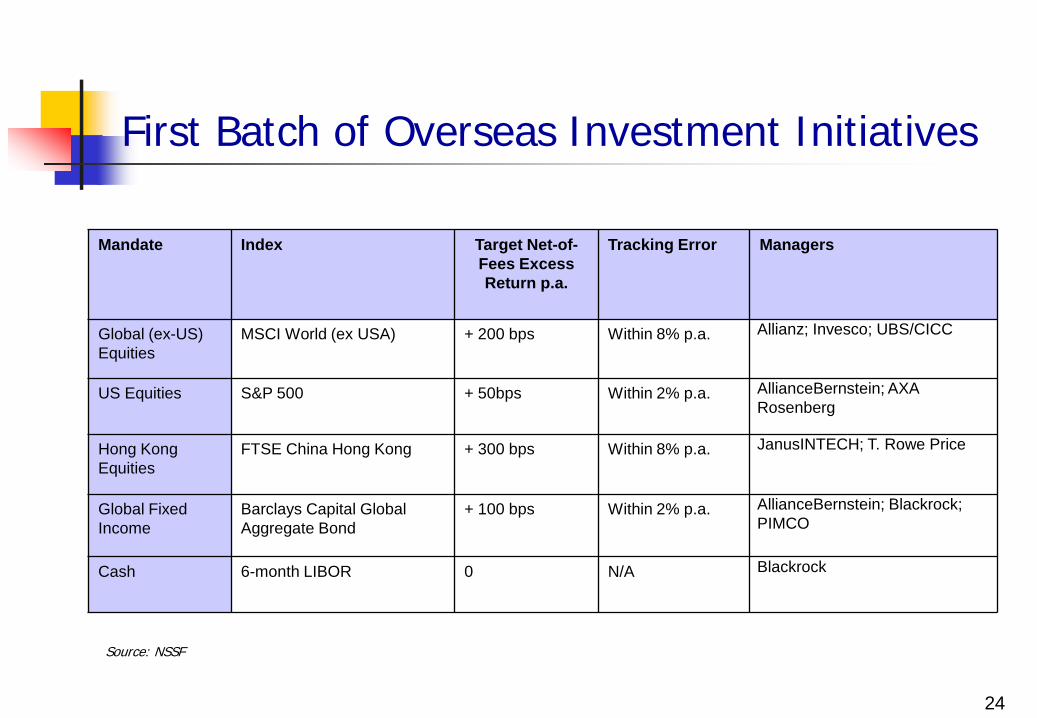
First Batch of Overseas Investment Initiatives
Mandate Index Target Net-of-Fees Excess Return p.a.
Tracking Error Managers
Global (ex-US) Equities
MSCI World (ex USA) + 200 bps Within 8% p.a. Allianz; Invesco; UBS/CICC
US Equities S&P 500 + 50bps Within 2% p.a. AllianceBernstein; AXA Rosenberg
Hong Kong Equities
FTSE China Hong Kong + 300 bps Within 8% p.a. JanusINTECH; T. Rowe Price
Global Fixed Income
Barclays Capital Global Aggregate Bond
+ 100 bps Within 2% p.a. AllianceBernstein; Blackrock; PIMCO
Cash 6-month LIBOR 0 N/A Blackrock
Source: NSSF
25
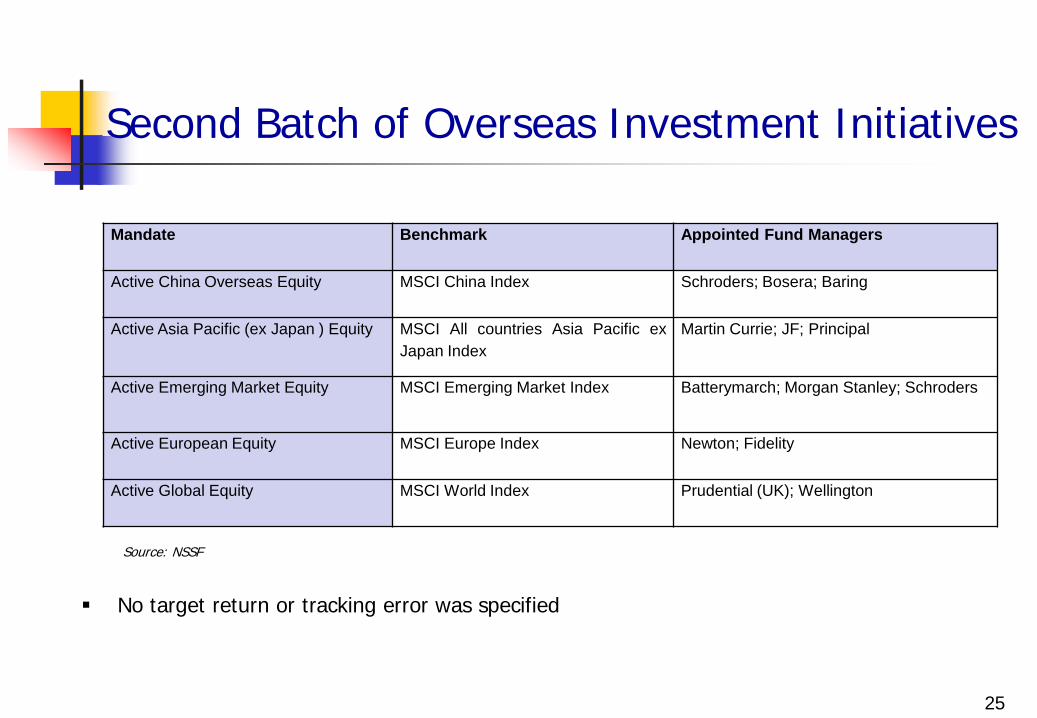
Second Batch of Overseas Investment Initiatives
Source: NSSF
No target return or tracking error was specified
Mandate Benchmark Appointed Fund Managers
Active China Overseas Equity MSCI China Index Schroders; Bosera; Baring
Active Asia Pacific (ex Japan ) Equity MSCI All countries Asia Pacific exJapan Index
Martin Currie; JF; Principal
Active Emerging Market Equity MSCI Emerging Market Index Batterymarch; Morgan Stanley; Schroders
Active European Equity MSCI Europe Index Newton; Fidelity
Active Global Equity MSCI World Index Prudential (UK); Wellington
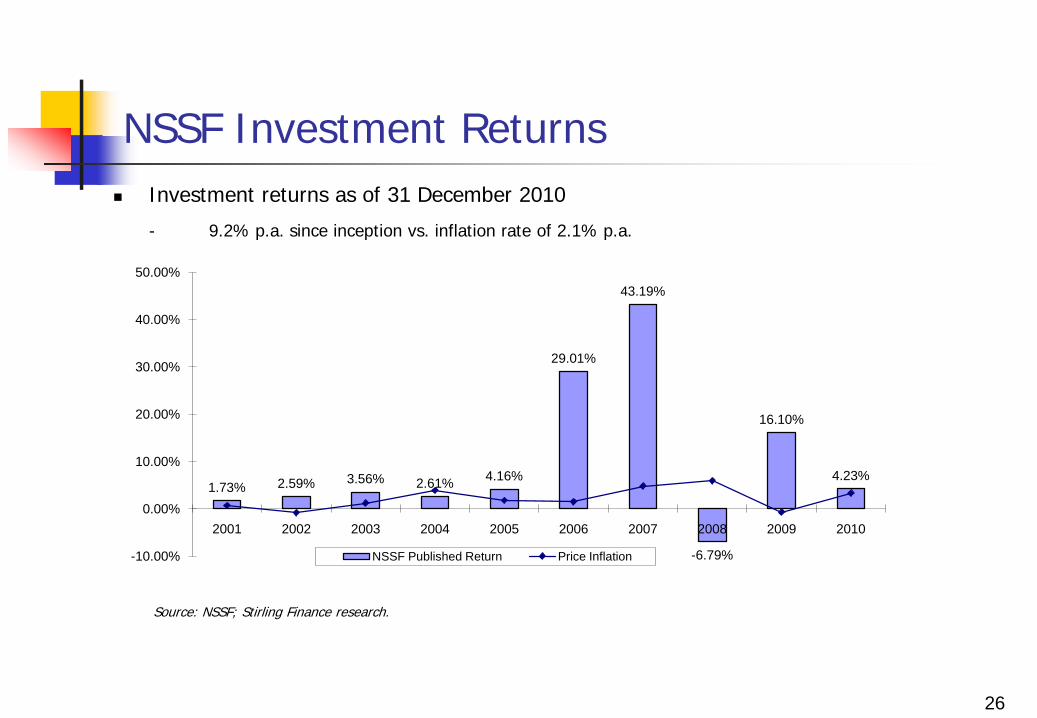
NSSF Investment Returns
26
Investment returns as of 31 December 2010
- 9.2% p.a. since inception vs. inflation rate of 2.1% p.a.
Source: NSSF; Stirling Finance research.
1.73% 2.59% 3.56% 2.61% 4.16%
29.01%
43.19%
-6.79%
16.10%
4.23%
-10.00%
0.00%
10.00%
20.00%
30.00%
40.00%
50.00%
2001 2002 2003 2004 2005 2006 2007 2008 2009 2010
NSSF Published Return Price Inflation
27
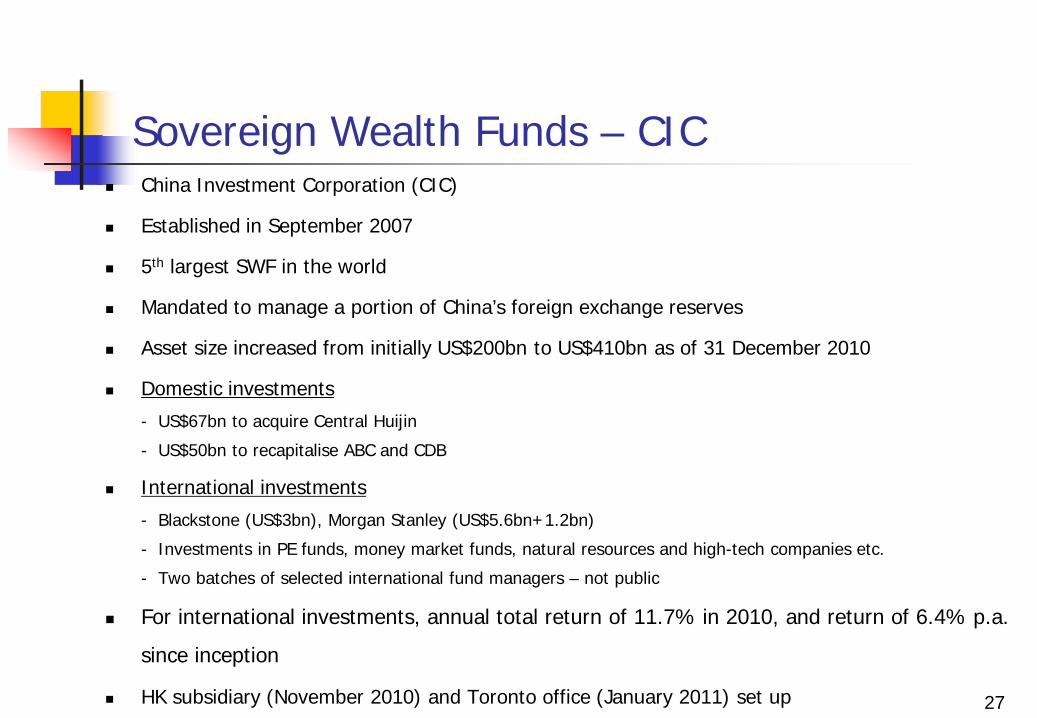
Sovereign Wealth Funds – CIC China Investment Corporation (CIC)
Established in September 2007
5th largest SWF in the world
Mandated to manage a portion of China’s foreign exchange reserves
Asset size increased from initially US$200bn to US$410bn as of 31 December 2010
Domestic investments
- US$67bn to acquire Central Huijin
- US$50bn to recapitalise ABC and CDB
International investments
- Blackstone (US$3bn), Morgan Stanley (US$5.6bn+1.2bn)
- Investments in PE funds, money market funds, natural resources and high-tech companies etc.
- Two batches of selected international fund managers – not public
For international investments, annual total return of 11.7% in 2010, and return of 6.4% p.a.
since inception
HK subsidiary (November 2010) and Toronto office (January 2011) set up
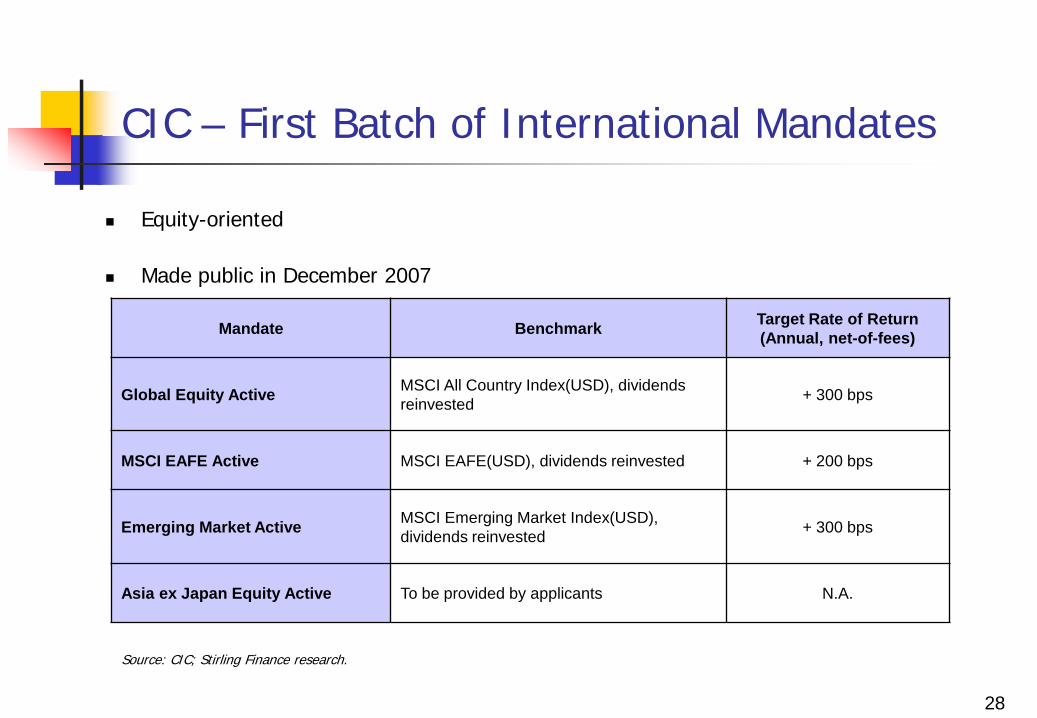
CIC – First Batch of International Mandates
Equity-oriented
Made public in December 2007
28
Mandate Benchmark Target Rate of Return (Annual, net-of-fees)
Global Equity Active MSCI All Country Index(USD), dividends reinvested + 300 bps
MSCI EAFE Active MSCI EAFE(USD), dividends reinvested + 200 bps
Emerging Market Active MSCI Emerging Market Index(USD), dividends reinvested + 300 bps
Asia ex Japan Equity Active To be provided by applicants N.A.
Source: CIC; Stirling Finance research.
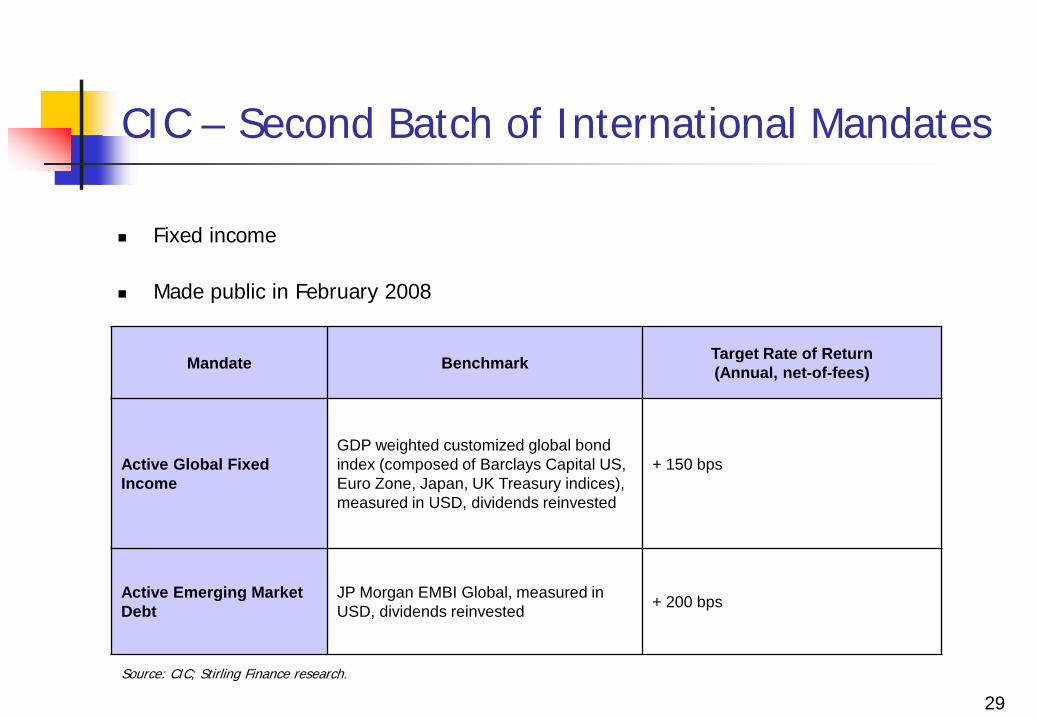
CIC – Second Batch of International Mandates
29
Mandate Benchmark Target Rate of Return(Annual, net-of-fees)
Active Global Fixed Income
GDP weighted customized global bond index (composed of Barclays Capital US, Euro Zone, Japan, UK Treasury indices), measured in USD, dividends reinvested
+ 150 bps
Active Emerging Market Debt
JP Morgan EMBI Global, measured in USD, dividends reinvested + 200 bps
Source: CIC; Stirling Finance research.
Fixed income
Made public in February 2008
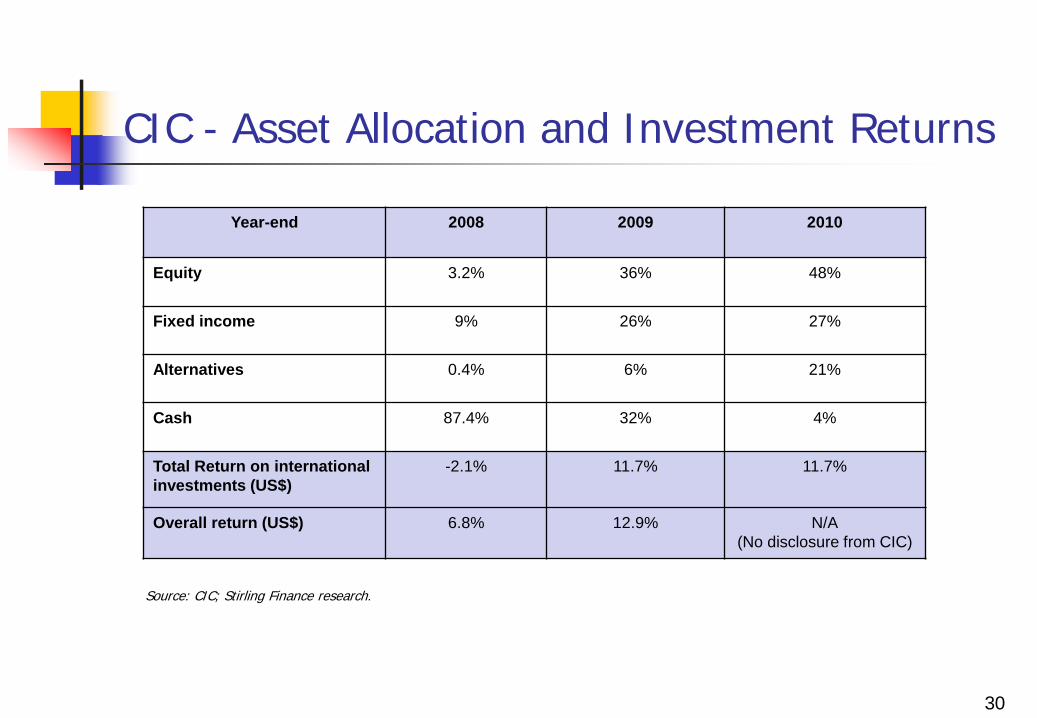
CIC - Asset Allocation and Investment Returns
30
Source: CIC; Stirling Finance research.
Year-end 2008 2009 2010
Equity 3.2% 36% 48%
Fixed income 9% 26% 27%
Alternatives 0.4% 6% 21%
Cash 87.4% 32% 4%
Total Return on internationalinvestments (US$)
-2.1% 11.7% 11.7%
Overall return (US$) 6.8% 12.9% N/A(No disclosure from CIC)
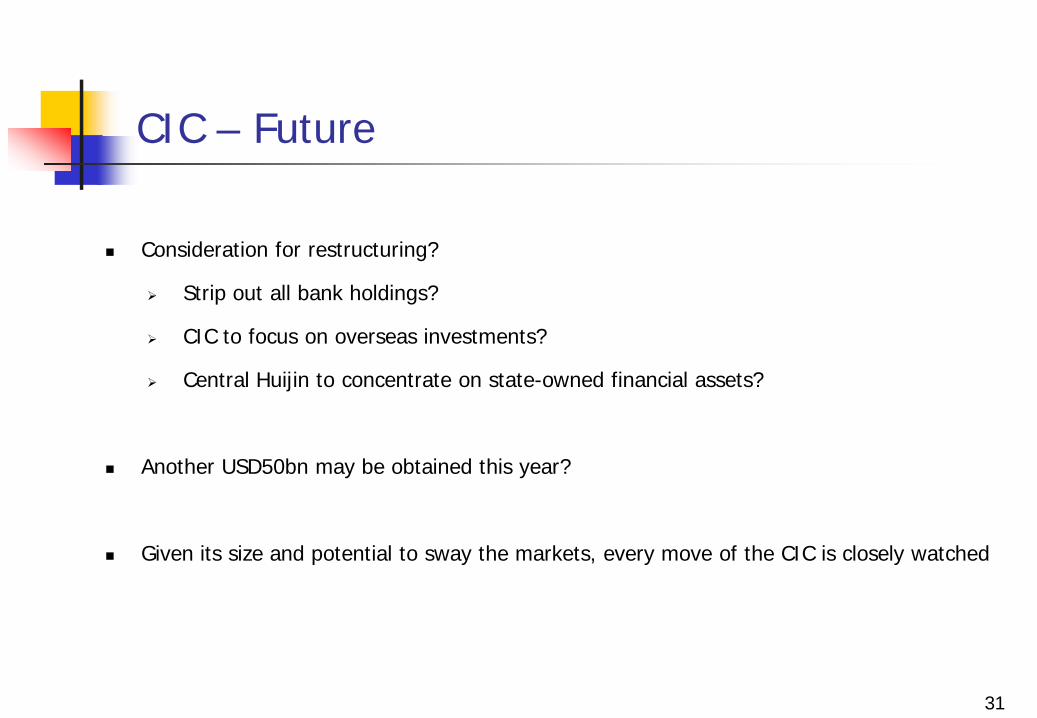
CIC – Future
Consideration for restructuring?
Strip out all bank holdings?
CIC to focus on overseas investments?
Central Huijin to concentrate on state-owned financial assets?
Another USD50bn may be obtained this year?
Given its size and potential to sway the markets, every move of the CIC is closely watched
31
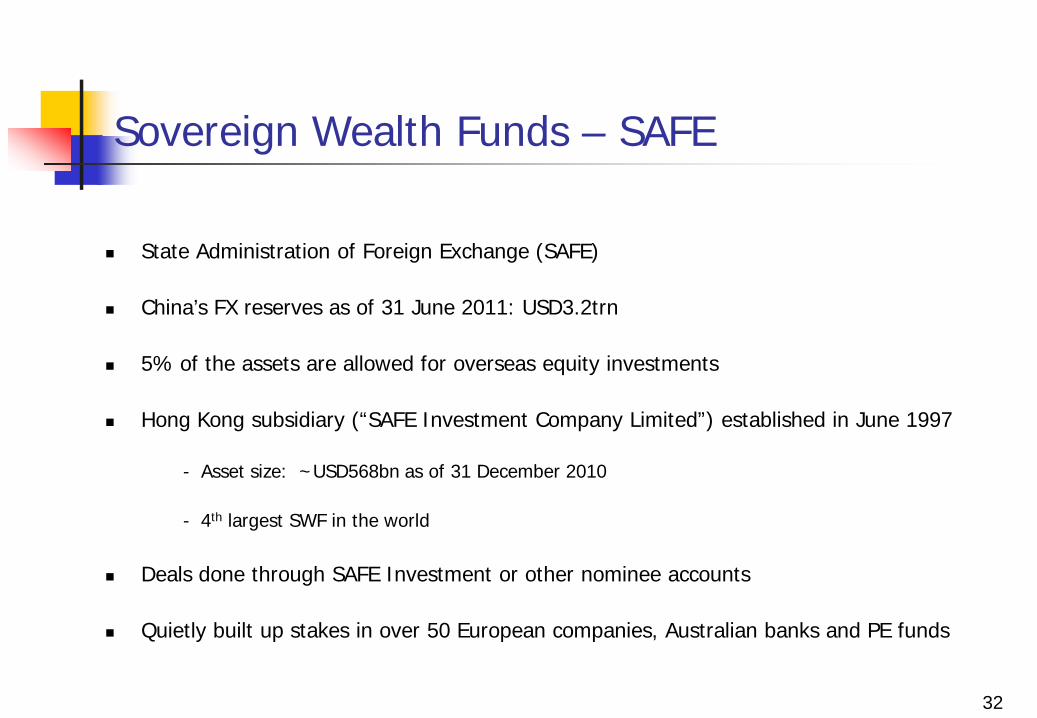
Sovereign Wealth Funds – SAFE
State Administration of Foreign Exchange (SAFE)
China’s FX reserves as of 31 June 2011: USD3.2trn
5% of the assets are allowed for overseas equity investments
Hong Kong subsidiary (“SAFE Investment Company Limited”) established in June 1997
- Asset size: ~USD568bn as of 31 December 2010
- 4th largest SWF in the world
Deals done through SAFE Investment or other nominee accounts
Quietly built up stakes in over 50 European companies, Australian banks and PE funds
32
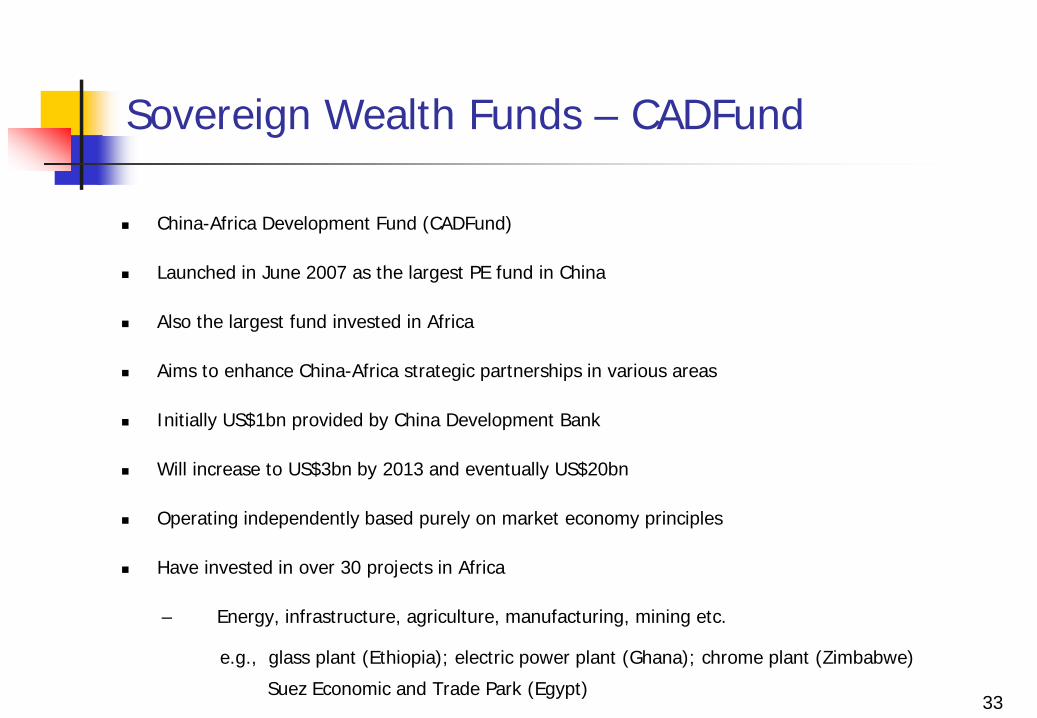
Sovereign Wealth Funds – CADFund
China-Africa Development Fund (CADFund)
Launched in June 2007 as the largest PE fund in China
Also the largest fund invested in Africa
Aims to enhance China-Africa strategic partnerships in various areas
Initially US$1bn provided by China Development Bank
Will increase to US$3bn by 2013 and eventually US$20bn
Operating independently based purely on market economy principles
Have invested in over 30 projects in Africa
– Energy, infrastructure, agriculture, manufacturing, mining etc.
e.g., glass plant (Ethiopia); electric power plant (Ghana); chrome plant (Zimbabwe)
Suez Economic and Trade Park (Egypt)33

Investment Opportunities
and
Future Outlook
34
35
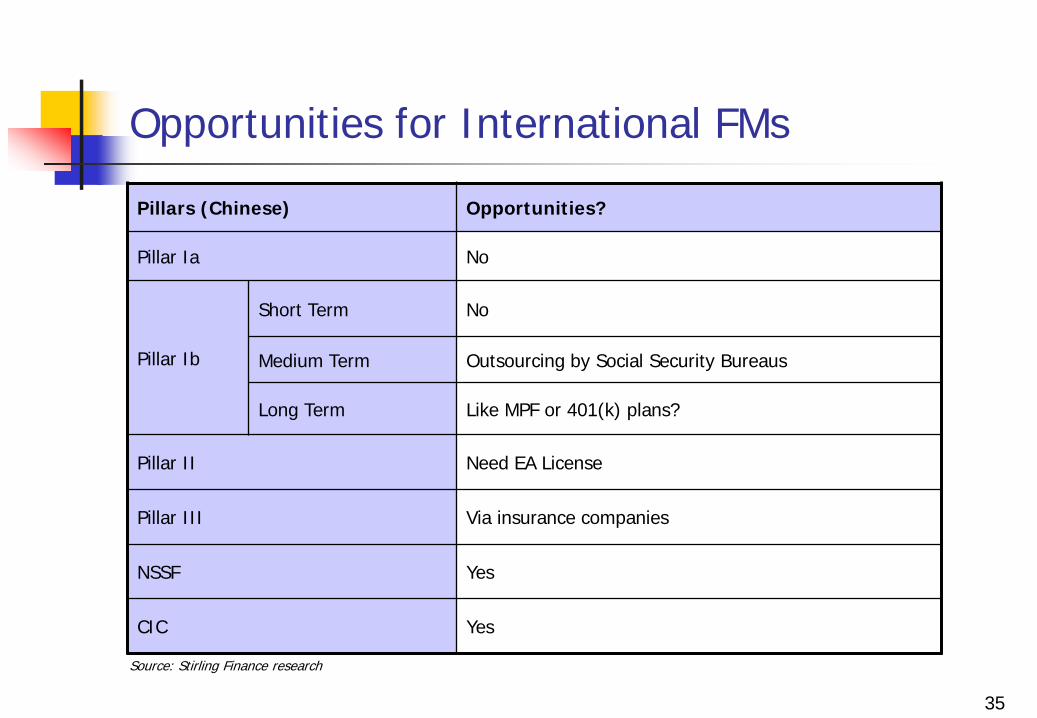
Opportunities for International FMs
Pillars (Chinese) Opportunities?
Pillar Ia No
Pillar Ib
Short Term No
Medium Term Outsourcing by Social Security Bureaus
Long Term Like MPF or 401(k) plans?
Pillar II Need EA License
Pillar III Via insurance companies
NSSF Yes
CIC Yes
Source: Stirling Finance research
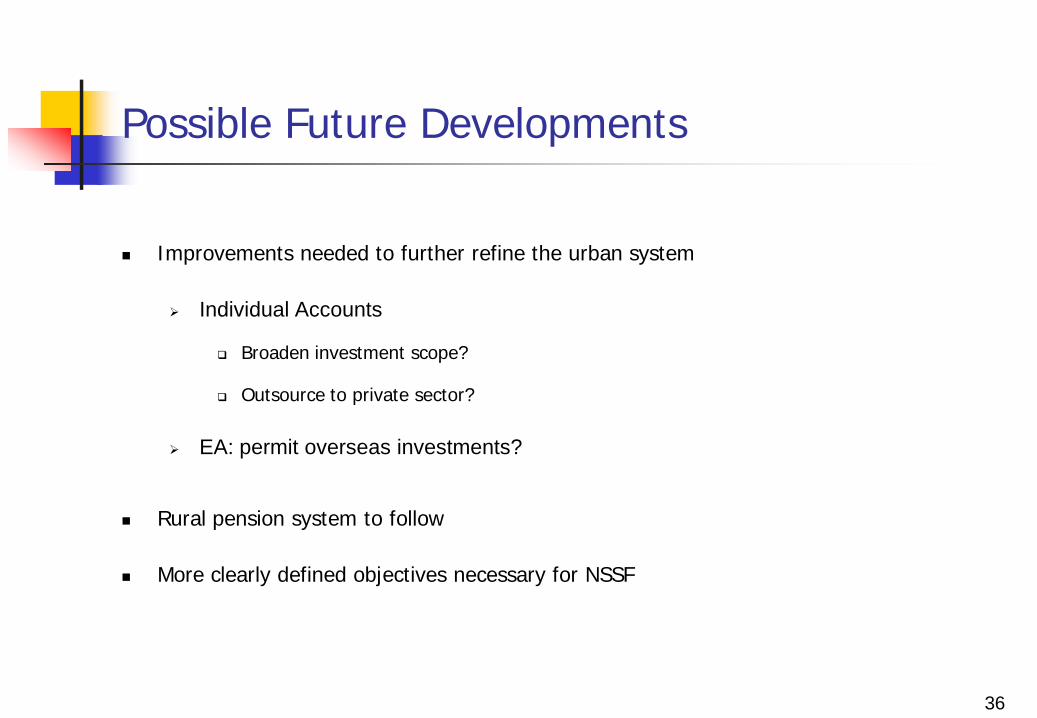
Possible Future Developments
Improvements needed to further refine the urban system
Individual Accounts
Broaden investment scope?
Outsource to private sector?
EA: permit overseas investments?
Rural pension system to follow
More clearly defined objectives necessary for NSSF
36
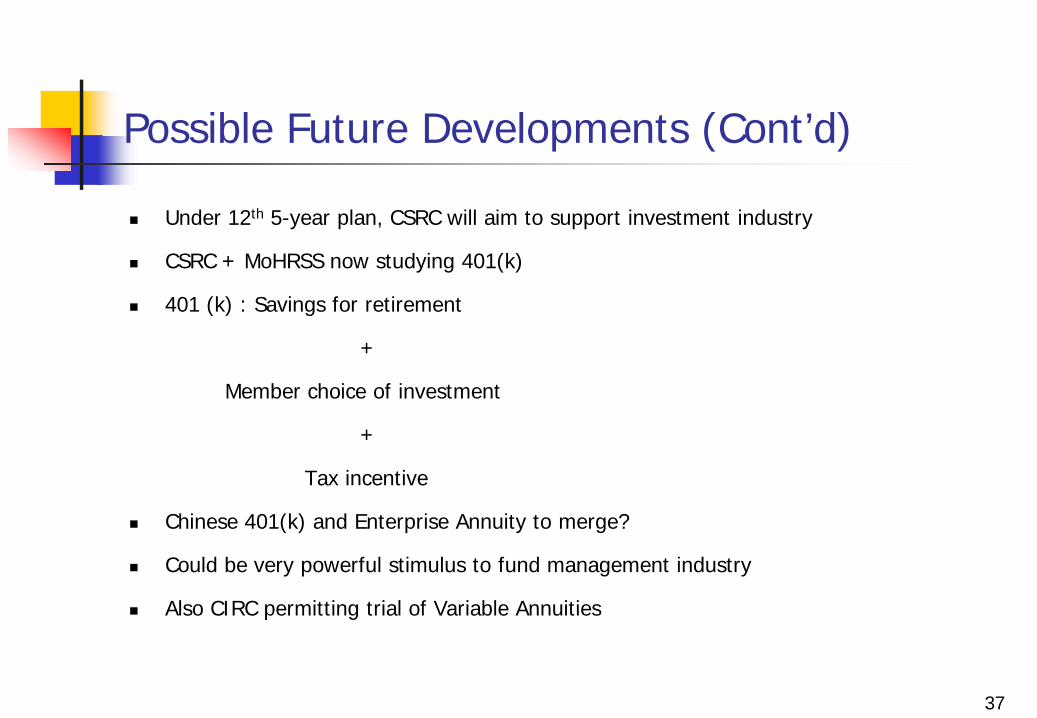
Possible Future Developments (Cont’d)
Under 12th 5-year plan, CSRC will aim to support investment industry
CSRC + MoHRSS now studying 401(k)
401 (k) : Savings for retirement
+
Member choice of investment
+
Tax incentive
Chinese 401(k) and Enterprise Annuity to merge?
Could be very powerful stimulus to fund management industry
Also CIRC permitting trial of Variable Annuities
37

38
谢谢!