Investigator(s): Dr. Jose Palacios-The Pennsylvania …...Investigator(s): Dr. Jose Palacios-The...
19
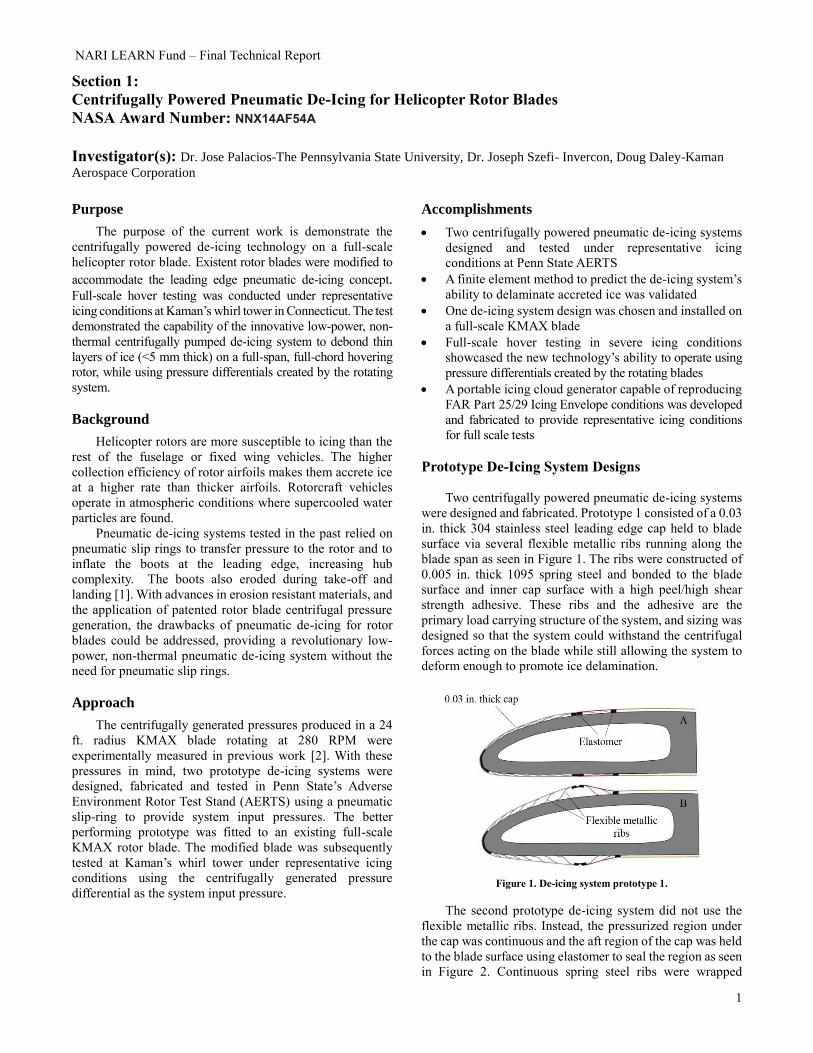
NARI LEARN Fund – Final Technical Report 1 Section 1: Centrifugally Powered Pneumatic De-Icing for Helicopter Rotor Blades NASA Award Number: NNX14AF54A Investigator(s): Dr. Jose Palacios-The Pennsylvania State University, Dr. Joseph Szefi- Invercon, Doug Daley-Kaman Aerospace Corporation Purpose The purpose of the current work is demonstrate the centrifugally powered de-icing technology on a full-scale helicopter rotor blade. Existent rotor blades were modified to accommodate the leading edge pneumatic de-icing concept. Full-scale hover testing was conducted under representative icing conditions at Kaman’s whirl tower in Connecticut. The test demonstrated the capability of the innovative low-power, non- thermal centrifugally pumped de-icing system to debond thin layers of ice (<5 mm thick) on a full-span, full-chord hovering rotor, while using pressure differentials created by the rotating system. Background Helicopter rotors are more susceptible to icing than the rest of the fuselage or fixed wing vehicles. The higher collection efficiency of rotor airfoils makes them accrete ice at a higher rate than thicker airfoils. Rotorcraft vehicles operate in atmospheric conditions where supercooled water particles are found. Pneumatic de-icing systems tested in the past relied on pneumatic slip rings to transfer pressure to the rotor and to inflate the boots at the leading edge, increasing hub complexity. The boots also eroded during take-off and landing [1]. With advances in erosion resistant materials, and the application of patented rotor blade centrifugal pressure generation, the drawbacks of pneumatic de-icing for rotor blades could be addressed, providing a revolutionary low- power, non-thermal pneumatic de-icing system without the need for pneumatic slip rings. Approach The centrifugally generated pressures produced in a 24 ft. radius KMAX blade rotating at 280 RPM were experimentally measured in previous work [2]. With these pressures in mind, two prototype de-icing systems were designed, fabricated and tested in Penn State’s Adverse Environment Rotor Test Stand (AERTS) using a pneumatic slip-ring to provide system input pressures. The better performing prototype was fitted to an existing full-scale KMAX rotor blade. The modified blade was subsequently tested at Kaman’s whirl tower under representative icing conditions using the centrifugally generated pressure differential as the system input pressure. Accomplishments Two centrifugally powered pneumatic de-icing systems designed and tested under representative icing conditions at Penn State AERTS A finite element method to predict the de-icing system’s ability to delaminate accreted ice was validated One de-icing system design was chosen and installed on a full-scale KMAX blade Full-scale hover testing in severe icing conditions showcased the new technology’s ability to operate using pressure differentials created by the rotating blades A portable icing cloud generator capable of reproducing FAR Part 25/29 Icing Envelope conditions was developed and fabricated to provide representative icing conditions for full scale tests Prototype De-Icing System Designs Two centrifugally powered pneumatic de-icing systems were designed and fabricated. Prototype 1 consisted of a 0.03 in. thick 304 stainless steel leading edge cap held to blade surface via several flexible metallic ribs running along the blade span as seen in Figure 1. The ribs were constructed of 0.005 in. thick 1095 spring steel and bonded to the blade surface and inner cap surface with a high peel/high shear strength adhesive. These ribs and the adhesive are the primary load carrying structure of the system, and sizing was designed so that the system could withstand the centrifugal forces acting on the blade while still allowing the system to deform enough to promote ice delamination. Figure 1. De-icing system prototype 1. The second prototype de-icing system did not use the flexible metallic ribs. Instead, the pressurized region under the cap was continuous and the aft region of the cap was held to the blade surface using elastomer to seal the region as seen in Figure 2. Continuous spring steel ribs were wrapped
Transcript of Investigator(s): Dr. Jose Palacios-The Pennsylvania …...Investigator(s): Dr. Jose Palacios-The...
NARI LEARN Fund – Final Technical Report
1
Section 1:
Centrifugally Powered Pneumatic De-Icing for Helicopter Rotor Blades
NASA Award Number: NNX14AF54A
Investigator(s): Dr. Jose Palacios-The Pennsylvania State University, Dr. Joseph Szefi- Invercon, Doug Daley-Kaman
Aerospace Corporation
Purpose
The purpose of the current work is demonstrate the
centrifugally powered de-icing technology on a full-scale
helicopter rotor blade. Existent rotor blades were modified to
accommodate the leading edge pneumatic de-icing concept. Full-scale hover testing was conducted under representative
icing conditions at Kaman’s whirl tower in Connecticut. The test
demonstrated the capability of the innovative low-power, non-
thermal centrifugally pumped de-icing system to debond thin
layers of ice (<5 mm thick) on a full-span, full-chord hovering
rotor, while using pressure differentials created by the rotating
system.
Background
Helicopter rotors are more susceptible to icing than the
rest of the fuselage or fixed wing vehicles. The higher
collection efficiency of rotor airfoils makes them accrete ice
at a higher rate than thicker airfoils. Rotorcraft vehicles
operate in atmospheric conditions where supercooled water
particles are found.
Pneumatic de-icing systems tested in the past relied on
pneumatic slip rings to transfer pressure to the rotor and to
inflate the boots at the leading edge, increasing hub
complexity. The boots also eroded during take-off and
landing [1]. With advances in erosion resistant materials, and
the application of patented rotor blade centrifugal pressure
generation, the drawbacks of pneumatic de-icing for rotor
blades could be addressed, providing a revolutionary low-
power, non-thermal pneumatic de-icing system without the
need for pneumatic slip rings.
Approach
The centrifugally generated pressures produced in a 24
ft. radius KMAX blade rotating at 280 RPM were
experimentally measured in previous work [2]. With these
pressures in mind, two prototype de-icing systems were
designed, fabricated and tested in Penn State’s Adverse
Environment Rotor Test Stand (AERTS) using a pneumatic
slip-ring to provide system input pressures. The better
performing prototype was fitted to an existing full-scale
KMAX rotor blade. The modified blade was subsequently
tested at Kaman’s whirl tower under representative icing
conditions using the centrifugally generated pressure
differential as the system input pressure.
Accomplishments
Two centrifugally powered pneumatic de-icing systems
designed and tested under representative icing
conditions at Penn State AERTS
A finite element method to predict the de-icing system’s
ability to delaminate accreted ice was validated
One de-icing system design was chosen and installed on
a full-scale KMAX blade
Full-scale hover testing in severe icing conditions
showcased the new technology’s ability to operate using
pressure differentials created by the rotating blades
A portable icing cloud generator capable of reproducing
FAR Part 25/29 Icing Envelope conditions was developed
and fabricated to provide representative icing conditions
for full scale tests
Prototype De-Icing System Designs
Two centrifugally powered pneumatic de-icing systems
were designed and fabricated. Prototype 1 consisted of a 0.03
in. thick 304 stainless steel leading edge cap held to blade
surface via several flexible metallic ribs running along the
blade span as seen in Figure 1. The ribs were constructed of
0.005 in. thick 1095 spring steel and bonded to the blade
surface and inner cap surface with a high peel/high shear
strength adhesive. These ribs and the adhesive are the
primary load carrying structure of the system, and sizing was
designed so that the system could withstand the centrifugal
forces acting on the blade while still allowing the system to
deform enough to promote ice delamination.
Figure 1. De-icing system prototype 1.
The second prototype de-icing system did not use the
flexible metallic ribs. Instead, the pressurized region under
the cap was continuous and the aft region of the cap was held
to the blade surface using elastomer to seal the region as seen
in Figure 2. Continuous spring steel ribs were wrapped
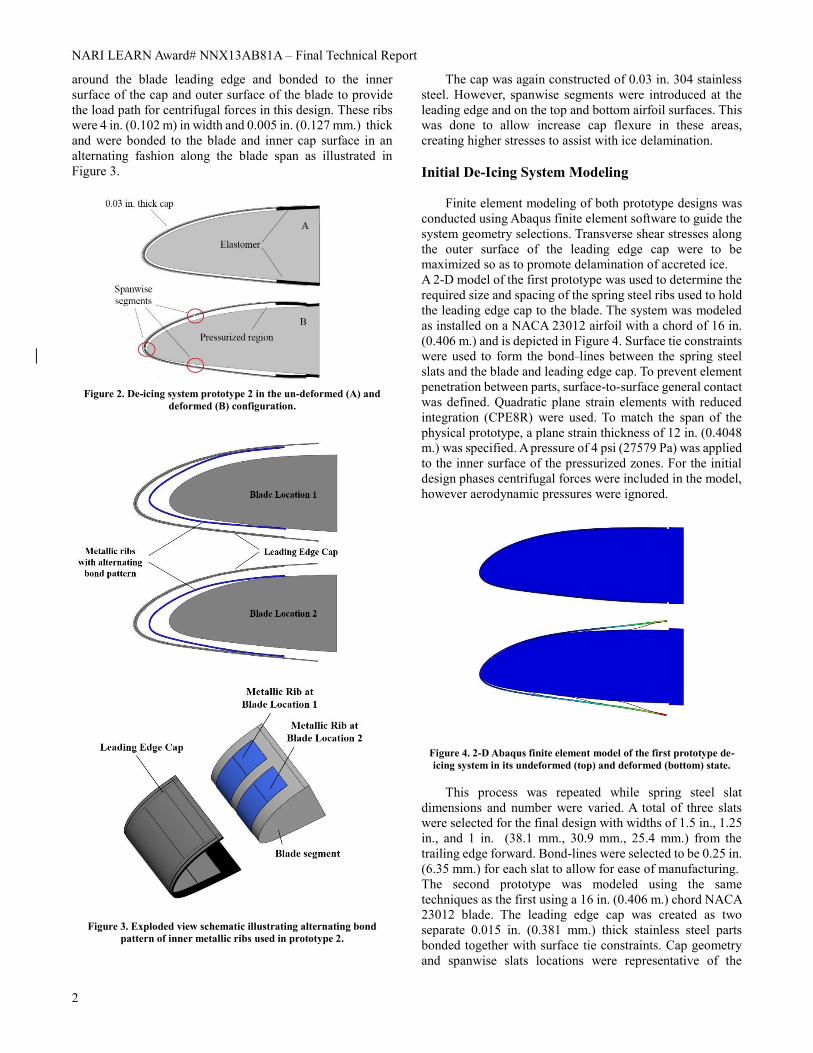
NARI LEARN Award# NNX13AB81A – Final Technical Report
2
around the blade leading edge and bonded to the inner
surface of the cap and outer surface of the blade to provide
the load path for centrifugal forces in this design. These ribs
were 4 in. (0.102 m) in width and 0.005 in. (0.127 mm.) thick
and were bonded to the blade and inner cap surface in an
alternating fashion along the blade span as illustrated in
Figure 3.
Figure 2. De-icing system prototype 2 in the un-deformed (A) and
deformed (B) configuration.
Figure 3. Exploded view schematic illustrating alternating bond
pattern of inner metallic ribs used in prototype 2.
The cap was again constructed of 0.03 in. 304 stainless
steel. However, spanwise segments were introduced at the
leading edge and on the top and bottom airfoil surfaces. This
was done to allow increase cap flexure in these areas,
creating higher stresses to assist with ice delamination.
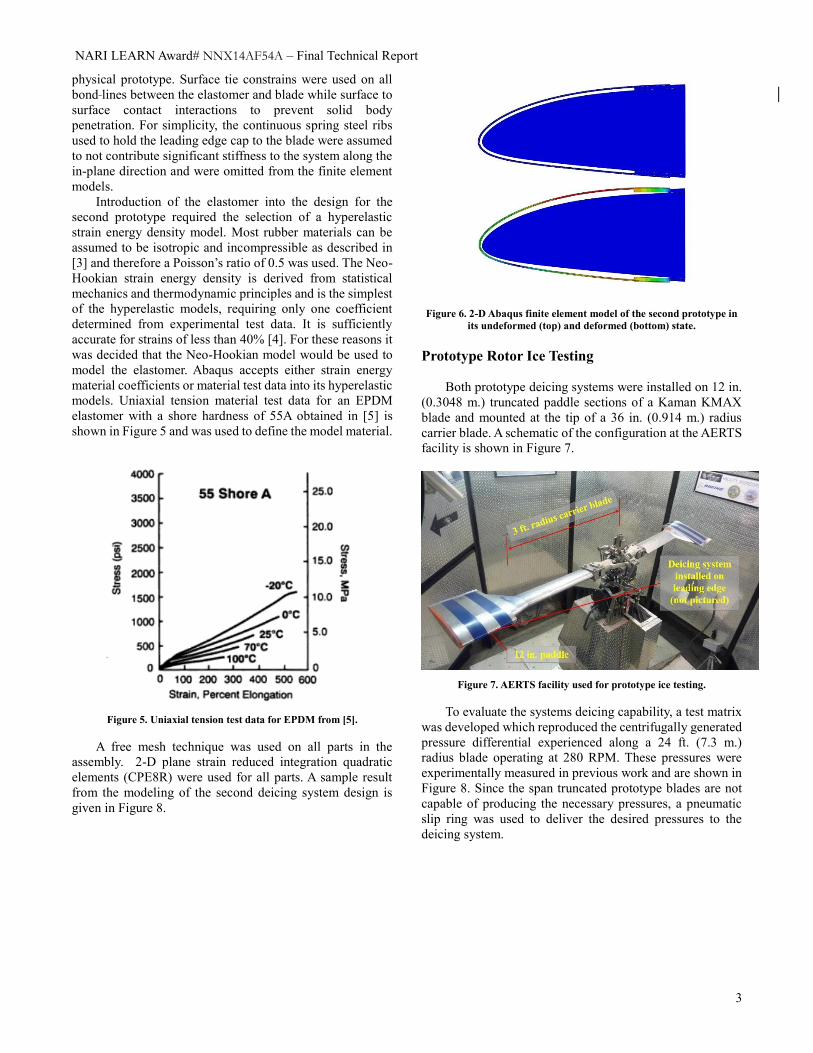
Initial De-Icing System Modeling
Finite element modeling of both prototype designs was
conducted using Abaqus finite element software to guide the
system geometry selections. Transverse shear stresses along
the outer surface of the leading edge cap were to be
maximized so as to promote delamination of accreted ice.
A 2-D model of the first prototype was used to determine the
required size and spacing of the spring steel ribs used to hold
the leading edge cap to the blade. The system was modeled
as installed on a NACA 23012 airfoil with a chord of 16 in.
(0.406 m.) and is depicted in Figure 4. Surface tie constraints
were used to form the bond lines between the spring steel
slats and the blade and leading edge cap. To prevent element
penetration between parts, surface-to-surface general contact
was defined. Quadratic plane strain elements with reduced
integration (CPE8R) were used. To match the span of the
physical prototype, a plane strain thickness of 12 in. (0.4048
m.) was specified. A pressure of 4 psi (27579 Pa) was applied
to the inner surface of the pressurized zones. For the initial
design phases centrifugal forces were included in the model,
however aerodynamic pressures were ignored.
Figure 4. 2-D Abaqus finite element model of the first prototype de-
icing system in its undeformed (top) and deformed (bottom) state.
This process was repeated while spring steel slat
dimensions and number were varied. A total of three slats
were selected for the final design with widths of 1.5 in., 1.25
in., and 1 in. (38.1 mm., 30.9 mm., 25.4 mm.) from the
trailing edge forward. Bond-lines were selected to be 0.25 in.
(6.35 mm.) for each slat to allow for ease of manufacturing.
The second prototype was modeled using the same
techniques as the first using a 16 in. (0.406 m.) chord NACA
23012 blade. The leading edge cap was created as two
separate 0.015 in. (0.381 mm.) thick stainless steel parts
bonded together with surface tie constraints. Cap geometry
and spanwise slats locations were representative of the
NARI LEARN Award# NNX14AF54A – Final Technical Report
3
physical prototype. Surface tie constrains were used on all
bond lines between the elastomer and blade while surface to
surface contact interactions to prevent solid body
penetration. For simplicity, the continuous spring steel ribs
used to hold the leading edge cap to the blade were assumed
to not contribute significant stiffness to the system along the
in-plane direction and were omitted from the finite element
models.
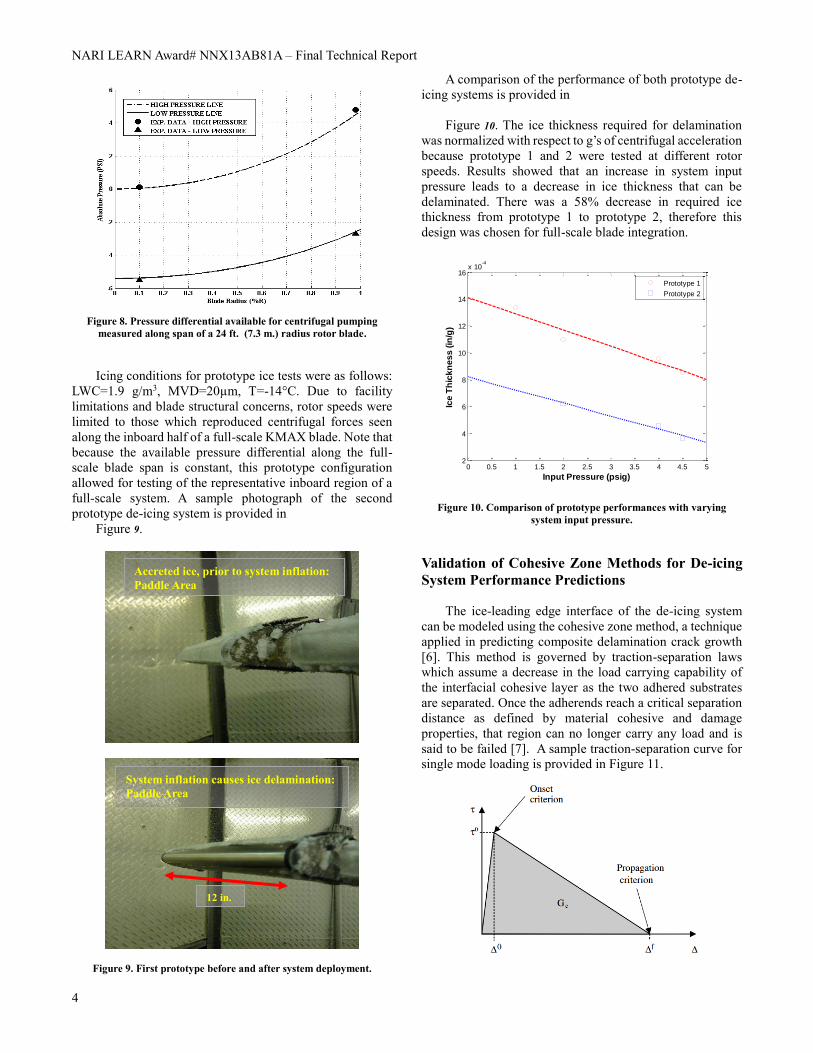
Introduction of the elastomer into the design for the
second prototype required the selection of a hyperelastic
strain energy density model. Most rubber materials can be
assumed to be isotropic and incompressible as described in
[3] and therefore a Poisson’s ratio of 0.5 was used. The Neo-
Hookian strain energy density is derived from statistical
mechanics and thermodynamic principles and is the simplest
of the hyperelastic models, requiring only one coefficient
determined from experimental test data. It is sufficiently
accurate for strains of less than 40% [4]. For these reasons it
was decided that the Neo-Hookian model would be used to
model the elastomer. Abaqus accepts either strain energy
material coefficients or material test data into its hyperelastic
models. Uniaxial tension material test data for an EPDM
elastomer with a shore hardness of 55A obtained in [5] is
shown in Figure 5 and was used to define the model material.
Figure 5. Uniaxial tension test data for EPDM from [5].
A free mesh technique was used on all parts in the
assembly. 2-D plane strain reduced integration quadratic
elements (CPE8R) were used for all parts. A sample result
from the modeling of the second deicing system design is
given in Figure 8.
Figure 6. 2-D Abaqus finite element model of the second prototype in
its undeformed (top) and deformed (bottom) state.
Prototype Rotor Ice Testing
Both prototype deicing systems were installed on 12 in.
(0.3048 m.) truncated paddle sections of a Kaman KMAX
blade and mounted at the tip of a 36 in. (0.914 m.) radius
carrier blade. A schematic of the configuration at the AERTS
facility is shown in Figure 7.
Figure 7. AERTS facility used for prototype ice testing.
To evaluate the systems deicing capability, a test matrix
was developed which reproduced the centrifugally generated
pressure differential experienced along a 24 ft. (7.3 m.)
radius blade operating at 280 RPM. These pressures were
experimentally measured in previous work and are shown in
Figure 8. Since the span truncated prototype blades are not
capable of producing the necessary pressures, a pneumatic
slip ring was used to deliver the desired pressures to the
deicing system.
NARI LEARN Award# NNX13AB81A – Final Technical Report
4
Figure 8. Pressure differential available for centrifugal pumping
measured along span of a 24 ft. (7.3 m.) radius rotor blade.
Icing conditions for prototype ice tests were as follows:
LWC=1.9 g/m3, MVD=20µm, T=-14°C. Due to facility
limitations and blade structural concerns, rotor speeds were
limited to those which reproduced centrifugal forces seen
along the inboard half of a full-scale KMAX blade. Note that
because the available pressure differential along the full-
scale blade span is constant, this prototype configuration
allowed for testing of the representative inboard region of a
full-scale system. A sample photograph of the second
prototype de-icing system is provided in
Figure 9.
Figure 9. First prototype before and after system deployment.
A comparison of the performance of both prototype de-
icing systems is provided in
Figure 10. The ice thickness required for delamination
was normalized with respect to g’s of centrifugal acceleration
because prototype 1 and 2 were tested at different rotor
speeds. Results showed that an increase in system input
pressure leads to a decrease in ice thickness that can be
delaminated. There was a 58% decrease in required ice
thickness from prototype 1 to prototype 2, therefore this
design was chosen for full-scale blade integration.
Figure 10. Comparison of prototype performances with varying
system input pressure.
Validation of Cohesive Zone Methods for De-icing
System Performance Predictions
The ice-leading edge interface of the de-icing system
can be modeled using the cohesive zone method, a technique
applied in predicting composite delamination crack growth
[6]. This method is governed by traction-separation laws
which assume a decrease in the load carrying capability of
the interfacial cohesive layer as the two adhered substrates
are separated. Once the adherends reach a critical separation
distance as defined by material cohesive and damage
properties, that region can no longer carry any load and is
said to be failed [7]. A sample traction-separation curve for
single mode loading is provided in Figure 11.
0 0.5 1 1.5 2 2.5 3 3.5 4 4.5 52
4
6
8
10
12
14
16x 10
-4
Input Pressure (psig)
Ice
Th
ick
ne
ss
(in
/g)
Prototype 1
Prototype 2
Accreted ice, prior to system inflation:
Paddle Area
System inflation causes ice delamination:
Paddle Area
12 in.
NARI LEARN Award# NNX14AF54A – Final Technical Report
5
Figure 11. Sample traction separation curve for single mode loading
[7].
Using cohesive properties of the substrates, which were
experimentally measured in NASA LEARN Phase I, the
critical mixed-mode separation, Δ𝑓 in Figure 11, can be
calculated. For the current application this separation is 2.7e-
4 in (6.88µm).
Abaqus finite element software is capable of predicting
the Mode I and Mode II/III separations by defining a
cohesive surface at the interface of the ice and metallic
leading edge cap. Representative ice shapes were produced
using Lewice. 2-D parts were created from these ice shapes
and were used in the delamination prediction study. An
example of the created ice shape parts is provided in Figure
12.
Figure 12. Representative ice shape created using Lewice for de-icing
system delamination predictions in Abaqus.
By varying the input pressure to the pneumatic de-icing
system, a relationship between the percentage of ice
delaminated and pressure can be obtained for each ice shape.
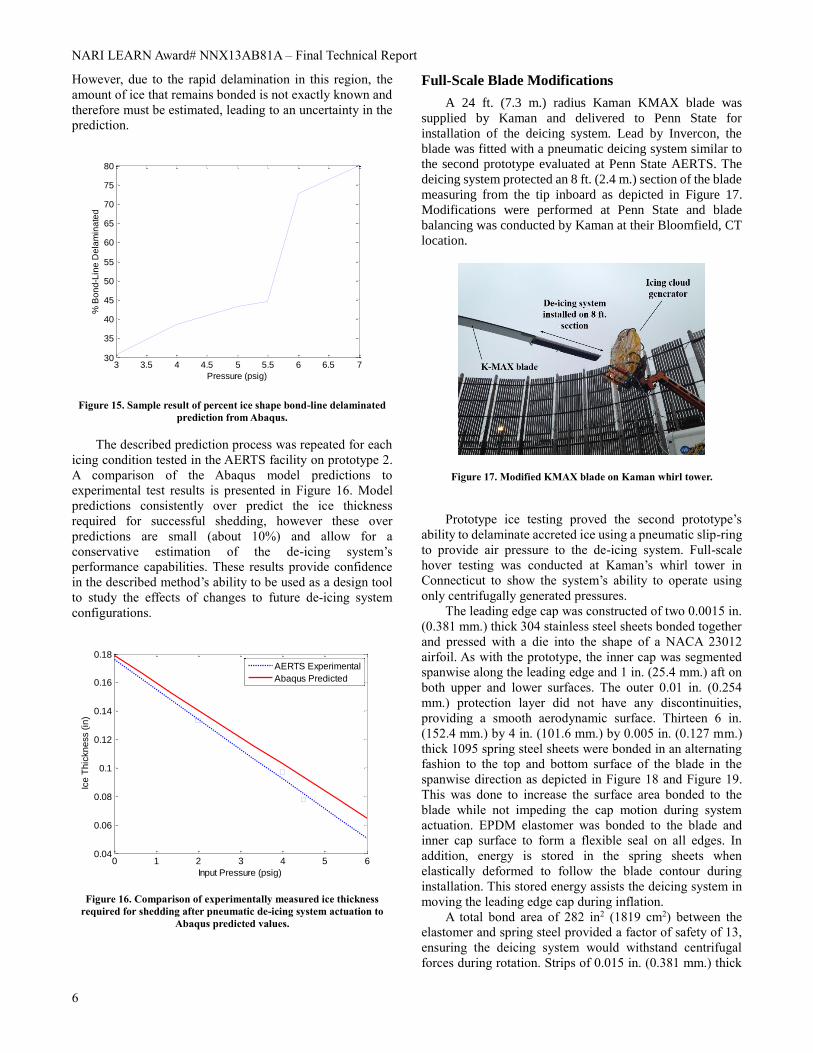
Figure 13 illustrates an example output from one Abaqus
delamination simulation at a single pressure. The horizontal
line represents the critical mixed-mode nodal separation, and
total separation is the magnitude of the Mode I and Mode
II/III separations. In Figure 13, for any portion of the total
separation curve that lies above the critical failure separation
value, this portion of the ice shape has delaminated.
Figure 13. Sample Abaqus delamination study output. Horizontal axis
represents the non-dimensional arc-length position along the ice shape.
With knowledge of the percent ice shape bond-line that
has not failed following de-icing system actuation and the
adhesion strength of ice to stainless steel, the centrifugal
forces required to shed the ice shape can be calculated and
compared to the centrifugal forces actually acting on the ice.
If the centrifugal forces acting on the ice are greater than
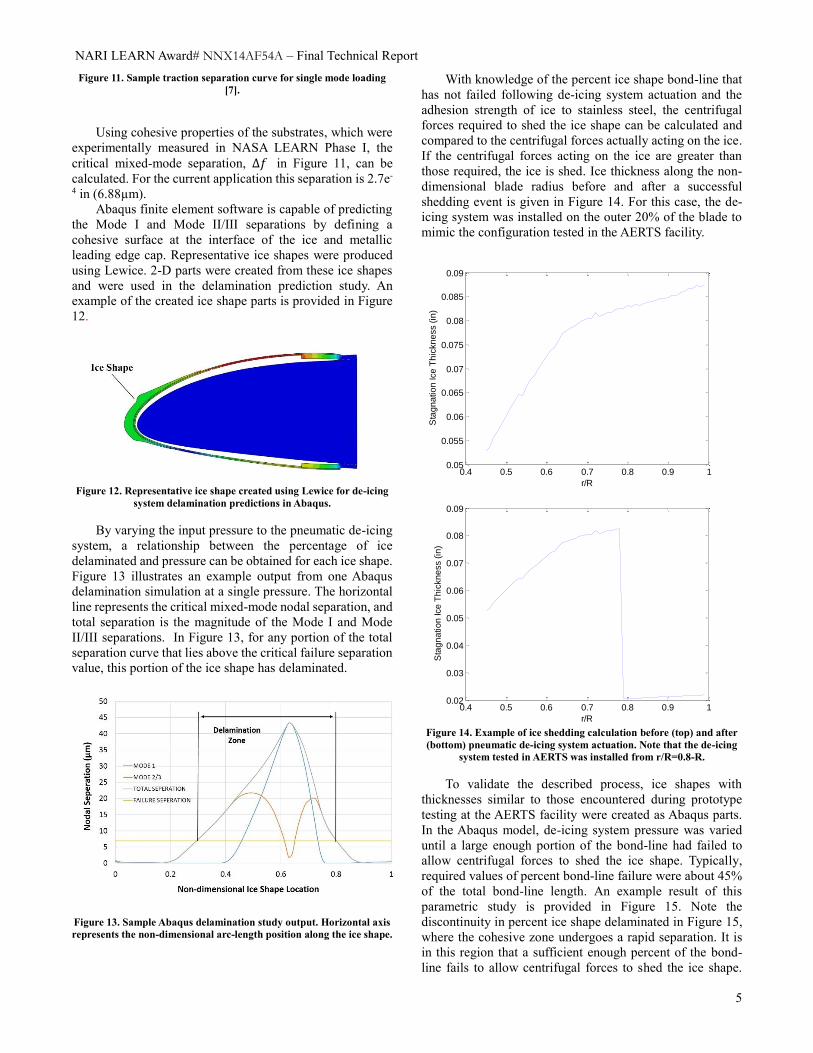
those required, the ice is shed. Ice thickness along the non-
dimensional blade radius before and after a successful
shedding event is given in Figure 14. For this case, the de-
icing system was installed on the outer 20% of the blade to
mimic the configuration tested in the AERTS facility.
Figure 14. Example of ice shedding calculation before (top) and after
(bottom) pneumatic de-icing system actuation. Note that the de-icing
system tested in AERTS was installed from r/R=0.8-R.
To validate the described process, ice shapes with
thicknesses similar to those encountered during prototype
testing at the AERTS facility were created as Abaqus parts.
In the Abaqus model, de-icing system pressure was varied
until a large enough portion of the bond-line had failed to
allow centrifugal forces to shed the ice shape. Typically,
required values of percent bond-line failure were about 45%
of the total bond-line length. An example result of this
parametric study is provided in Figure 15. Note the
discontinuity in percent ice shape delaminated in Figure 15,
where the cohesive zone undergoes a rapid separation. It is
in this region that a sufficient enough percent of the bond-
line fails to allow centrifugal forces to shed the ice shape.
0.4 0.5 0.6 0.7 0.8 0.9 10.05
0.055
0.06
0.065
0.07
0.075
0.08
0.085
0.09
r/R
Sta
gn
atio
n Ice
Th
ickn
ess (
in)
0.4 0.5 0.6 0.7 0.8 0.9 10.02
0.03
0.04
0.05
0.06
0.07
0.08
0.09
r/R
Sta
gn
atio
n Ice
Th
ickn
ess (
in)
NARI LEARN Award# NNX13AB81A – Final Technical Report
6
However, due to the rapid delamination in this region, the
amount of ice that remains bonded is not exactly known and
therefore must be estimated, leading to an uncertainty in the
prediction.
Figure 15. Sample result of percent ice shape bond-line delaminated
prediction from Abaqus.
The described prediction process was repeated for each
icing condition tested in the AERTS facility on prototype 2.
A comparison of the Abaqus model predictions to
experimental test results is presented in Figure 16. Model
predictions consistently over predict the ice thickness
required for successful shedding, however these over
predictions are small (about 10%) and allow for a
conservative estimation of the de-icing system’s
performance capabilities. These results provide confidence
in the described method’s ability to be used as a design tool
to study the effects of changes to future de-icing system
configurations.
Figure 16. Comparison of experimentally measured ice thickness
required for shedding after pneumatic de-icing system actuation to
Abaqus predicted values.
Full-Scale Blade Modifications
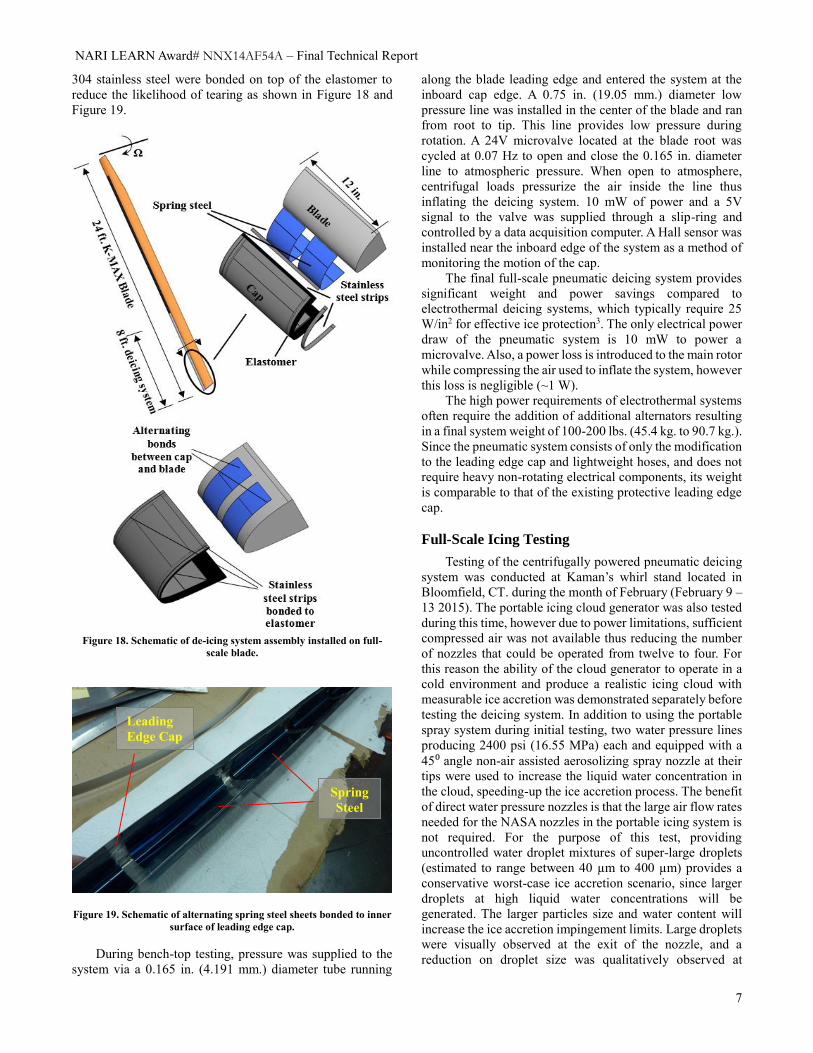
A 24 ft. (7.3 m.) radius Kaman KMAX blade was
supplied by Kaman and delivered to Penn State for
installation of the deicing system. Lead by Invercon, the
blade was fitted with a pneumatic deicing system similar to
the second prototype evaluated at Penn State AERTS. The
deicing system protected an 8 ft. (2.4 m.) section of the blade
measuring from the tip inboard as depicted in Figure 17.
Modifications were performed at Penn State and blade
balancing was conducted by Kaman at their Bloomfield, CT
location.
Figure 17. Modified KMAX blade on Kaman whirl tower.
Prototype ice testing proved the second prototype’s
ability to delaminate accreted ice using a pneumatic slip-ring
to provide air pressure to the de-icing system. Full-scale
hover testing was conducted at Kaman’s whirl tower in
Connecticut to show the system’s ability to operate using
only centrifugally generated pressures.
The leading edge cap was constructed of two 0.0015 in.
(0.381 mm.) thick 304 stainless steel sheets bonded together
and pressed with a die into the shape of a NACA 23012
airfoil. As with the prototype, the inner cap was segmented
spanwise along the leading edge and 1 in. (25.4 mm.) aft on
both upper and lower surfaces. The outer 0.01 in. (0.254
mm.) protection layer did not have any discontinuities,
providing a smooth aerodynamic surface. Thirteen 6 in.
(152.4 mm.) by 4 in. (101.6 mm.) by 0.005 in. (0.127 mm.)
thick 1095 spring steel sheets were bonded in an alternating
fashion to the top and bottom surface of the blade in the
spanwise direction as depicted in Figure 18 and Figure 19.
This was done to increase the surface area bonded to the
blade while not impeding the cap motion during system
actuation. EPDM elastomer was bonded to the blade and
inner cap surface to form a flexible seal on all edges. In
addition, energy is stored in the spring sheets when
elastically deformed to follow the blade contour during
installation. This stored energy assists the deicing system in
moving the leading edge cap during inflation.
A total bond area of 282 in2 (1819 cm2) between the
elastomer and spring steel provided a factor of safety of 13,
ensuring the deicing system would withstand centrifugal
forces during rotation. Strips of 0.015 in. (0.381 mm.) thick
3 3.5 4 4.5 5 5.5 6 6.5 730
35
40
45
50
55
60
65
70
75
80
Pressure (psig)
% B
on
d-L
ine
De
lam
ina
ted
0 1 2 3 4 5 60.04
0.06
0.08
0.1
0.12
0.14
0.16
0.18
Input Pressure (psig)
Ice
Th
ickn
ess (
in)
AERTS Experimental
Abaqus Predicted
NARI LEARN Award# NNX14AF54A – Final Technical Report
7
304 stainless steel were bonded on top of the elastomer to
reduce the likelihood of tearing as shown in Figure 18 and
Figure 19.
Figure 18. Schematic of de-icing system assembly installed on full-
scale blade.
Figure 19. Schematic of alternating spring steel sheets bonded to inner
surface of leading edge cap.
During bench-top testing, pressure was supplied to the
system via a 0.165 in. (4.191 mm.) diameter tube running
along the blade leading edge and entered the system at the
inboard cap edge. A 0.75 in. (19.05 mm.) diameter low
pressure line was installed in the center of the blade and ran
from root to tip. This line provides low pressure during
rotation. A 24V microvalve located at the blade root was
cycled at 0.07 Hz to open and close the 0.165 in. diameter
line to atmospheric pressure. When open to atmosphere,
centrifugal loads pressurize the air inside the line thus
inflating the deicing system. 10 mW of power and a 5V
signal to the valve was supplied through a slip-ring and
controlled by a data acquisition computer. A Hall sensor was
installed near the inboard edge of the system as a method of
monitoring the motion of the cap.
The final full-scale pneumatic deicing system provides
significant weight and power savings compared to
electrothermal deicing systems, which typically require 25
W/in2 for effective ice protection3. The only electrical power
draw of the pneumatic system is 10 mW to power a
microvalve. Also, a power loss is introduced to the main rotor
while compressing the air used to inflate the system, however
this loss is negligible (~1 W).
The high power requirements of electrothermal systems
often require the addition of additional alternators resulting
in a final system weight of 100-200 lbs. (45.4 kg. to 90.7 kg.).
Since the pneumatic system consists of only the modification
to the leading edge cap and lightweight hoses, and does not
require heavy non-rotating electrical components, its weight
is comparable to that of the existing protective leading edge
cap.
Full-Scale Icing Testing
Testing of the centrifugally powered pneumatic deicing
system was conducted at Kaman’s whirl stand located in
Bloomfield, CT. during the month of February (February 9 –
13 2015). The portable icing cloud generator was also tested
during this time, however due to power limitations, sufficient
compressed air was not available thus reducing the number
of nozzles that could be operated from twelve to four. For
this reason the ability of the cloud generator to operate in a
cold environment and produce a realistic icing cloud with
measurable ice accretion was demonstrated separately before
testing the deicing system. In addition to using the portable
spray system during initial testing, two water pressure lines
producing 2400 psi (16.55 MPa) each and equipped with a
45⁰ angle non-air assisted aerosolizing spray nozzle at their
tips were used to increase the liquid water concentration in
the cloud, speeding-up the ice accretion process. The benefit
of direct water pressure nozzles is that the large air flow rates
needed for the NASA nozzles in the portable icing system is
not required. For the purpose of this test, providing
uncontrolled water droplet mixtures of super-large droplets
(estimated to range between 40 µm to 400 µm) provides a
conservative worst-case ice accretion scenario, since larger
droplets at high liquid water concentrations will be
generated. The larger particles size and water content will
increase the ice accretion impingement limits. Large droplets
were visually observed at the exit of the nozzle, and a
reduction on droplet size was qualitatively observed at
Spring
Steel
Leading
Edge Cap
NARI LEARN Award# NNX13AB81A – Final Technical Report
8
approximately 20 ft. (6.09 m.) from the water output. The
water pressure lines were mounted on the ground providing
sufficient distance for the reduction in size of the water
droplets created. The cloud dissipation provided a more
realistic (but unmeasured) droplet size to enter the rotor
plane. The cloud LWC was calculated to be 0.6 g/cm3 with
an assumed MVD range of 40-200µm at the rotor plane. A
photograph of the final setup is shown in Figure 20. Tests
were conducted at static air temperatures ranging from -5ᵒC
to -15ᵒC, thus spanning a large portion of the Appendix C
icing envelope outlined in [8].
Figure 20. Final icing cloud set up for de-icing system testing.
Two different test methodologies for ice protection were
explored with the pneumatic deicing system: continuous ice
protection and single deicing occurrence. For the continuous
ice protection method, ice was allowed to accrete for a set
amount of time with the deicing system turned off. At set
time intervals the deicing system was turned on and cycled
three times at 0.07 Hz and subsequently turned off. This
process was repeated throughout the entire test multiple
times in an attempt to exercise the ability of the system to
operate as it is envisioned during flight (intermittent
operation post ice accretion for controlled time intervals).
The single deicing method tests consisted of accreting ice for
a set time length with the deicing system turned off followed
by a 30 second period of cycling the system once the pre-
determined icing time had elapsed. After the deicing system
was turned off, the rotor was also spun down. A schematic of
the test process for single-shot deicing is provided in Figure
21.
Figure 21. Method for single-shot de-icing testing.
For both deicing methods, system deployment was
monitored using real-time time data provided by a Hall
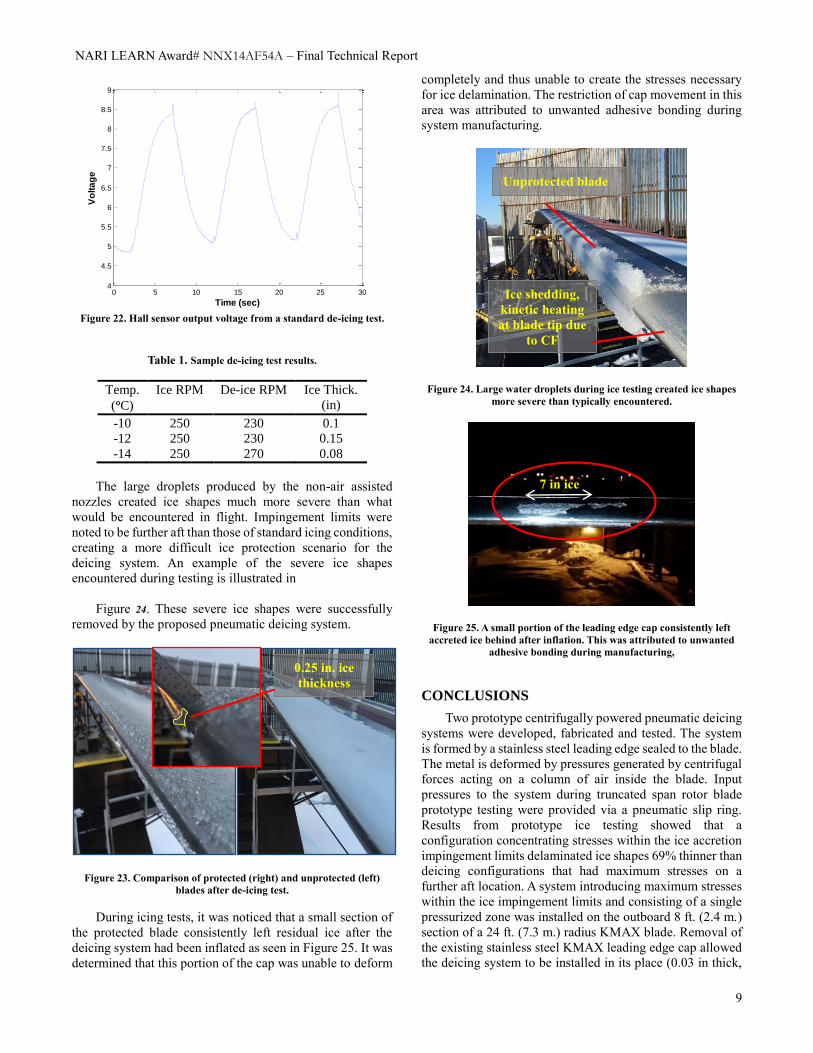
sensor. A sample of this output is displayed in Figure 22. In
the Hall sensor output, system inflation and deflation
corresponds to motion of the of airfoil surface. An increase
in voltage represents system inflation, while deflation causes
a decrease in voltage. Selected icing times were determined
by measuring accreted ice thicknesses in early tests. Rotor
speed for ice accretion was 250 RPM and was increased to
270 RPM for deicing system deployment in the single shot
deicing tests. Rotor speed was held constant at 270 RPM for
the continuous ice protection tests. Several tests were also
conducted at a deicing rotor speed of 230 RPM to observe
the deicing systems ability to operate at lower input pressures
and centrifugal forces acting on the ice. Both test methods
were successful to remove accreted ice and proved the ability
to protect full-scale rotor blades with semi-passive
centrifugally powered pneumatic deicing systems. Selected
successful deicing test results are presented in Table 1.
Detached ice thicknesses measured as small as 0.08 in.
(2.032 mm.), and were successfully shed during the single
shot deicing tests for a rotor speed of 270 RPM and at
temperatures as low as -15ᵒC. Ice thicknesses for a rotor
speed of 230 RPM were measured to be as small as 0.1 in.
(2.54 mm.). It is worth noting that the minimum thickness
required for electro thermal deicing systems is 0.3 in (7.62
mm) 3. A sample photograph of the protected result of semi-
continuous ice protection are shown in Figure 23.
NARI LEARN Award# NNX14AF54A – Final Technical Report
9
Figure 22. Hall sensor output voltage from a standard de-icing test.
Table 1. Sample de-icing test results.
Temp.
(ᵒC)
Ice RPM De-ice RPM
Ice Thick.
(in)
-10 250 230 0.1
-12 250 230 0.15
-14 250 270 0.08
The large droplets produced by the non-air assisted
nozzles created ice shapes much more severe than what
would be encountered in flight. Impingement limits were
noted to be further aft than those of standard icing conditions,
creating a more difficult ice protection scenario for the
deicing system. An example of the severe ice shapes
encountered during testing is illustrated in
Figure 24. These severe ice shapes were successfully
removed by the proposed pneumatic deicing system.
Figure 23. Comparison of protected (right) and unprotected (left)
blades after de-icing test.
During icing tests, it was noticed that a small section of
the protected blade consistently left residual ice after the
deicing system had been inflated as seen in Figure 25. It was
determined that this portion of the cap was unable to deform
completely and thus unable to create the stresses necessary
for ice delamination. The restriction of cap movement in this
area was attributed to unwanted adhesive bonding during
system manufacturing.
Figure 24. Large water droplets during ice testing created ice shapes
more severe than typically encountered.
Figure 25. A small portion of the leading edge cap consistently left
accreted ice behind after inflation. This was attributed to unwanted
adhesive bonding during manufacturing,
CONCLUSIONS
Two prototype centrifugally powered pneumatic deicing
systems were developed, fabricated and tested. The system
is formed by a stainless steel leading edge sealed to the blade.
The metal is deformed by pressures generated by centrifugal
forces acting on a column of air inside the blade. Input
pressures to the system during truncated span rotor blade
prototype testing were provided via a pneumatic slip ring.
Results from prototype ice testing showed that a
configuration concentrating stresses within the ice accretion
impingement limits delaminated ice shapes 69% thinner than
deicing configurations that had maximum stresses on a
further aft location. A system introducing maximum stresses
within the ice impingement limits and consisting of a single
pressurized zone was installed on the outboard 8 ft. (2.4 m.)
section of a 24 ft. (7.3 m.) radius KMAX blade. Removal of
the existing stainless steel KMAX leading edge cap allowed
the deicing system to be installed in its place (0.03 in thick,
0 5 10 15 20 25 304
4.5
5
5.5
6
6.5
7
7.5
8
8.5
9
Time (sec)
Vo
lta
ge
0.25 in. ice
thickness
7 in ice
Ice shedding,
kinetic heating
at blade tip due
to CF
Unprotected blade
NARI LEARN Award# NNX13AB81A – Final Technical Report
10
0.762 mm), thus maintaining the original aerodynamic shape
of the blade. Full-scale qualitative icing tests were
conducted at Kaman’s whirl stand. Unlike prototype testing
using truncated blades, input pressures to the system were
produced by centrifugal forces. The deicing system was
successfully tested at static air temperatures within the FAR
Part 25/29 Standard Icing Envelope and was able to
delaminate ice thicknesses as small as 0.08 in. (7.62 mm.)
Specific conclusions that can be drawn from the conducted
research are:
1) The current centrifugally powered pneumatic
deicing system is capable of delaminating ice
thicknesses as small as 0.08 in. (2.032 mm.) at
temperatures of -15ᵒC along a blade section
spanning 0.6r to the tip of a 24 ft. (7.3 m.) blade.
This ice thickness is 73% less than ice thickness
required by electro thermal deicing systems (0.3 in.,
7.62 mm.).
2) The developed pneumatic deicing system presents
significant power and weight savings compared to
electrothermal deicing systems. A microvalve
requiring 10mW and a small power loss due to air
compression (~1W) are the only power sources
required for the pneumatic deicing system. The
pneumatic system directly replaces existent leading
edge caps and introduces minimal weight related to
plastic pressure lines spanning the length of the
rotor. The system does not require heavy non-
rotating electrical components, and its weight is
negligibly more than that of the existing protective
leading edge cap.
3) A portable icing cloud generator was designed,
fabricated and tested. The system was able to
provide controllable water droplet size. The system
requires a 30 HP air compressor to power all twelve
nozzles needed to provide representative in-flight
liquid water concentrations.
Current TRL: Number. See NASA Systems Engineering
Handbook (NASA/SP-2007-6105) for more information on
Technology Readiness Level (TRL).
Publications and Patent Applications
Presented at the 71st AHS Forum in Virginia Beach,
VA
NARI LEARN Award# NNX14AF54A – Final Technical Report
11
Section 2:
Centrifugally Powered Swashplateless
Actuator
NASA Award Number: NNX14AF54A
Investigator(s): Dr. Joseph Szefi – Invercon LLC
Introduction
For several decades, the rotorcraft community has
recognized the potential performance benefits that could be
gained by incorporating active surfaces on rotor blades,
particularly trailing edge flaps [9]. Over the years, several
researchers have detailed the vibration control benefits
provided by flaps, while several also have envisioned rotors
that rely on trailing edge flaps to provide primary control,
thus completely eliminating the need for a mechanical
swashplate assembly. Analytical investigations in the
literature suggest that flap displacements of ±15° to ±20° are
required to achieve swashplateless forward flight [10]-[14] .
It must be noted that Kaman’s K-MAX helicopter already
achieves primary control through the motion of servoflaps,
although a mechanical linkage from the servoflap to the hub
is still required to achieve the required servoflap motion.
Moreover, several researchers have attempted to realize
flap motion through the use of on-blade actuators, mostly in
the form piezoelectric-based and electromechanical devices.
Both of these solutions, however, introduce a number of new
blade and aircraft design issues. In the case of piezoelectric
devices, the active PZT material is lead-based and has a
similar density to steel. In addition, piezoelectric devices
require an ancillary motion amplification system which also
adds unwanted blade weight. Because of this added weight,
blades must be reinforced in the area of installation to
accommodate the increased centrifugal forces (CF)
introduced by the system. On top of weight concerns, high
voltage must be routed to the device through advanced
electrical slip rings, and electrical amplifiers must be
onboard to generate the actuator signals, adding more
weight. Thus far, piezoelectric devices have also exhibited
limited stroke in the range of ± 3°. More traditional, and
often very complex, electromechanical design solutions also
have similar unwanted added weight and slip ring issues and
usually suffer from mechanical wear issues introduced by
increased internal mechanism friction caused by extreme CF
loading.
In the current work, Invercon has proposed a radical
departure from these design concepts, one which in which
the actuator output is powered using an on-blade,
centrifugally developed pressure differential, introducing
extremely little blade weight. In Figure 26, a schematic
illustrates this concept. It would be advantageous to utilize
the large centripetal acceleration created by the rotor to
generate an on-blade air pressure differential for actuation,
thus eliminating both the need to transmit high amounts of
electrical power to the rotating frame and the need for heavy,
traditional actuators that can negatively impact overall rotor
blade weight. A conceptual schematic of a centrifugally
powered pneumatic actuator that powers a trailing edge flap
is pictured in Figure 27. Invercon’s actuation concept is
directly aligned with the objectives of NASA’s Subsonic
Rotary Wing Project, having the potential to enable more
efficient flight, enhance vehicle maneuverability, allow for
multi-mission vehicle configurations, reduce exterior noise,
and generally enhance the competiveness of US rotary
winged vehicles in the civil sector.
Figure 26. a) Schematic of Invercon’s centrifugally generated pressure
differential concept for actuation, and b) predicted pressure and
experimentally measured pressure values (280 RPM, 24 ft. radius
rotor)
Figure 27. Conceptual centrifugally powered pneumatic actuator
powering a trailing edge flap
Objectives
Under Penn State’s Phase II LEARN program, entitled
“Centrifugally Powered Pneumatic De-Icing for Helicopter
Rotor Blades”, Invercon was a subcontractor and fabricated
and installed the pneumatic de-icing actuation system on the
KMAX blades. Incidentally, the blades that were used for
the Phase II de-icing test were the same blades that were
utilized for Invercon’s NASA LEARN Phase I pneumatic
2)( rrdr
dp
NARI LEARN Award# NNX13AB81A – Final Technical Report
12
actuator test. Therefore, significant NASA funding was
already allocated to modify these blades for trailing edge
pneumatic actuator testing. Invercon’s goal in the current
study was to concurrently test a next generation pneumatic
flap actuator along with the pneumatic de-icing actuator. The
objective of this additional test was to validate that next
generation, high flow, pneumatic valves are fully-functional
under full-scale CF. Ultimately, Invercon went further and
fabricated and tested a full-scale swashplateless actuator
sized for a UH-60 rotor. The actuator incorporates novel,
high flow pneumatic valves that were validated under full-
scale CF.
Approach
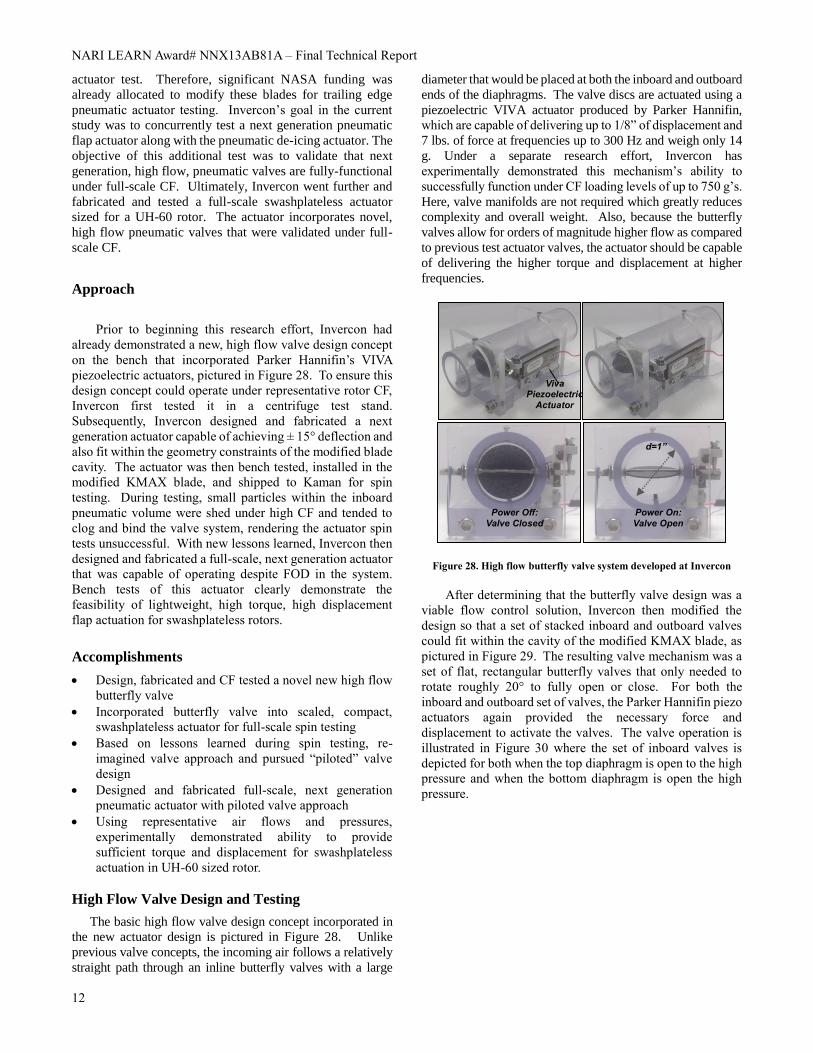
Prior to beginning this research effort, Invercon had
already demonstrated a new, high flow valve design concept
on the bench that incorporated Parker Hannifin’s VIVA
piezoelectric actuators, pictured in Figure 28. To ensure this
design concept could operate under representative rotor CF,
Invercon first tested it in a centrifuge test stand.
Subsequently, Invercon designed and fabricated a next
generation actuator capable of achieving ± 15° deflection and
also fit within the geometry constraints of the modified blade
cavity. The actuator was then bench tested, installed in the
modified KMAX blade, and shipped to Kaman for spin
testing. During testing, small particles within the inboard
pneumatic volume were shed under high CF and tended to
clog and bind the valve system, rendering the actuator spin
tests unsuccessful. With new lessons learned, Invercon then
designed and fabricated a full-scale, next generation actuator
that was capable of operating despite FOD in the system.
Bench tests of this actuator clearly demonstrate the
feasibility of lightweight, high torque, high displacement
flap actuation for swashplateless rotors.
Accomplishments
Design, fabricated and CF tested a novel new high flow
butterfly valve
Incorporated butterfly valve into scaled, compact,
swashplateless actuator for full-scale spin testing
Based on lessons learned during spin testing, re-
imagined valve approach and pursued “piloted” valve
design
Designed and fabricated full-scale, next generation
pneumatic actuator with piloted valve approach
Using representative air flows and pressures,
experimentally demonstrated ability to provide
sufficient torque and displacement for swashplateless
actuation in UH-60 sized rotor.
High Flow Valve Design and Testing
The basic high flow valve design concept incorporated in
the new actuator design is pictured in Figure 28. Unlike
previous valve concepts, the incoming air follows a relatively
straight path through an inline butterfly valves with a large
diameter that would be placed at both the inboard and outboard
ends of the diaphragms. The valve discs are actuated using a
piezoelectric VIVA actuator produced by Parker Hannifin,
which are capable of delivering up to 1/8” of displacement and
7 lbs. of force at frequencies up to 300 Hz and weigh only 14
g. Under a separate research effort, Invercon has
experimentally demonstrated this mechanism’s ability to
successfully function under CF loading levels of up to 750 g’s.
Here, valve manifolds are not required which greatly reduces
complexity and overall weight. Also, because the butterfly
valves allow for orders of magnitude higher flow as compared
to previous test actuator valves, the actuator should be capable
of delivering the higher torque and displacement at higher
frequencies.
Figure 28. High flow butterfly valve system developed at Invercon
After determining that the butterfly valve design was a
viable flow control solution, Invercon then modified the
design so that a set of stacked inboard and outboard valves
could fit within the cavity of the modified KMAX blade, as
pictured in Figure 29. The resulting valve mechanism was a
set of flat, rectangular butterfly valves that only needed to
rotate roughly 20° to fully open or close. For both the
inboard and outboard set of valves, the Parker Hannifin piezo
actuators again provided the necessary force and
displacement to activate the valves. The valve operation is
illustrated in Figure 30 where the set of inboard valves is
depicted for both when the top diaphragm is open to the high
pressure and when the bottom diaphragm is open the high
pressure.
Viva Piezoelectric
Actuator
Power Off: Valve Closed
Power On: Valve Open
d=1”
NARI LEARN Award# NNX14AF54A – Final Technical Report
13
Figure 29. Scaled, compact actuator designed to fit within existing
modified blade cavity.
Figure 30. High flow butterfly valve system incorporated into compact
actuator
Subsequent to testing this valve design on the bench to
confirm it can control flow under representative pressures,
Invercon then tested its operation in a centrifuge test stand,
as pictured Figure 31, under representative CF loading.
Using a hall sensor to measure valve displacement, Invercon
confirmed that the valve setup could operate under 500 g’s,
which is the amount of CF the valves would be subject to on
the KMAX blade. Upon confirming the proper motion of the
butterfly flaps under CF, Invercon then completed the overall
actuator design, which was similar to the Phase I actuator and
included a set of flexible top and bottom diaphragms, a center
divider to output displacement, a torque shaft to apply
variable output resistance, and a rotary motion sensor. The
actuator fabrication was then completed and initial bench
testing was conducted to confirm actuator performance given
a representative flow and pressure source. Cross-sectional
views of the actuator’s extreme displacements of ±15º are
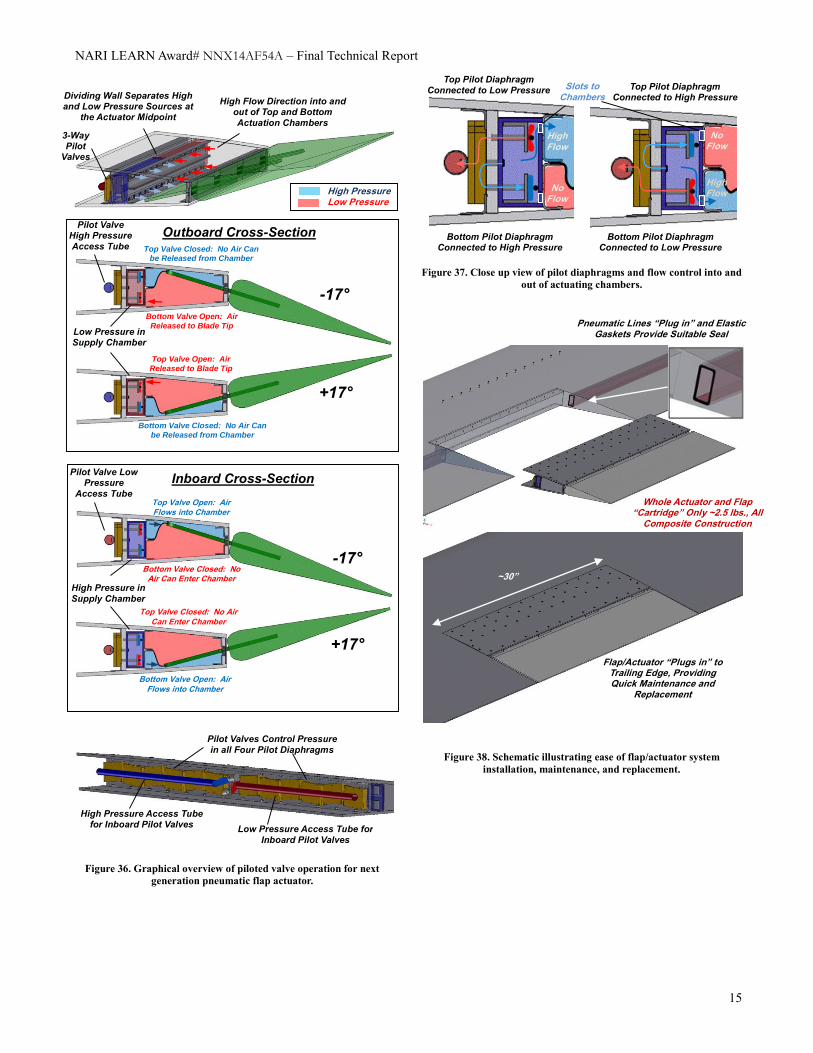
depicted in Figure 32. Additionally, a picture of the actuator
installed in the modified KMAX blade cavity is shown in
Figure 33.
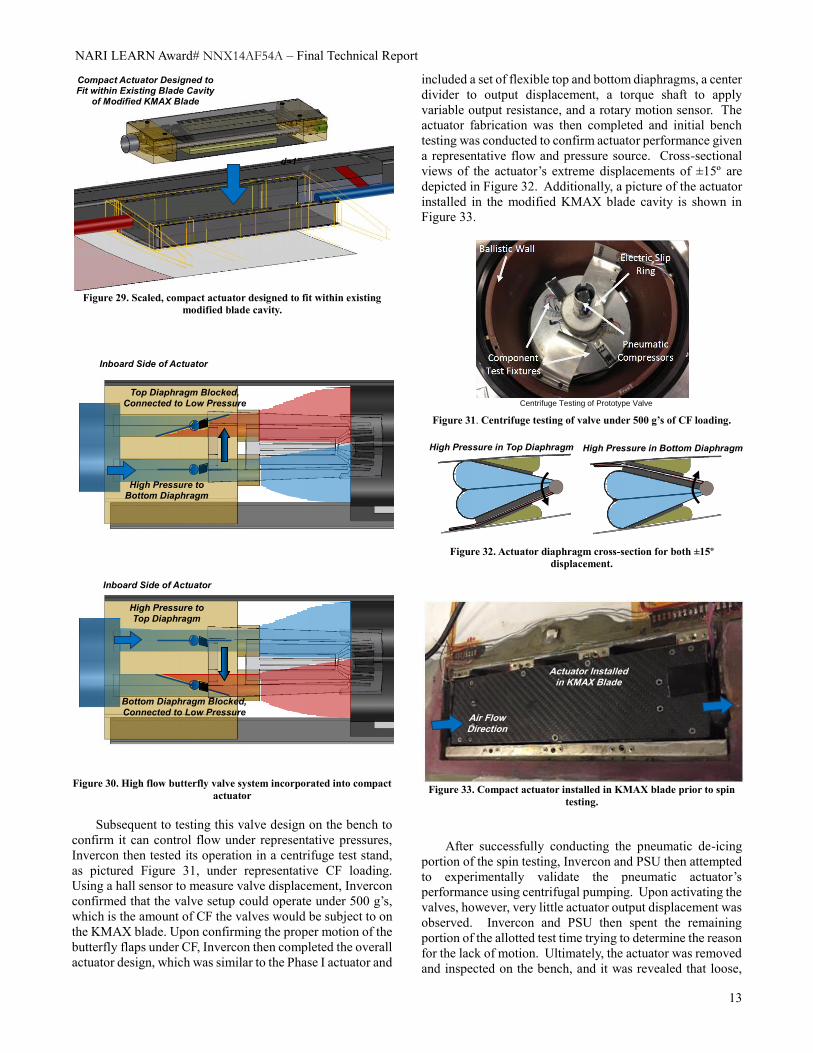
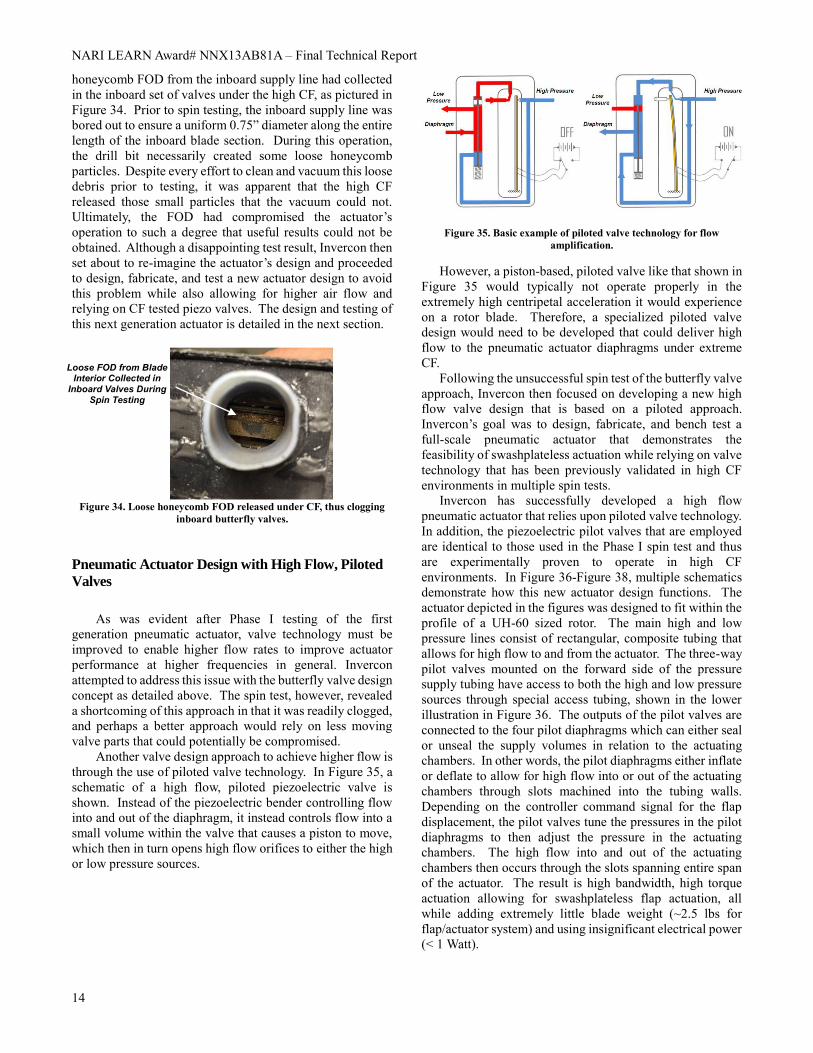
Figure 31. Centrifuge testing of valve under 500 g’s of CF loading.
Figure 32. Actuator diaphragm cross-section for both ±15º
displacement.
Figure 33. Compact actuator installed in KMAX blade prior to spin
testing.
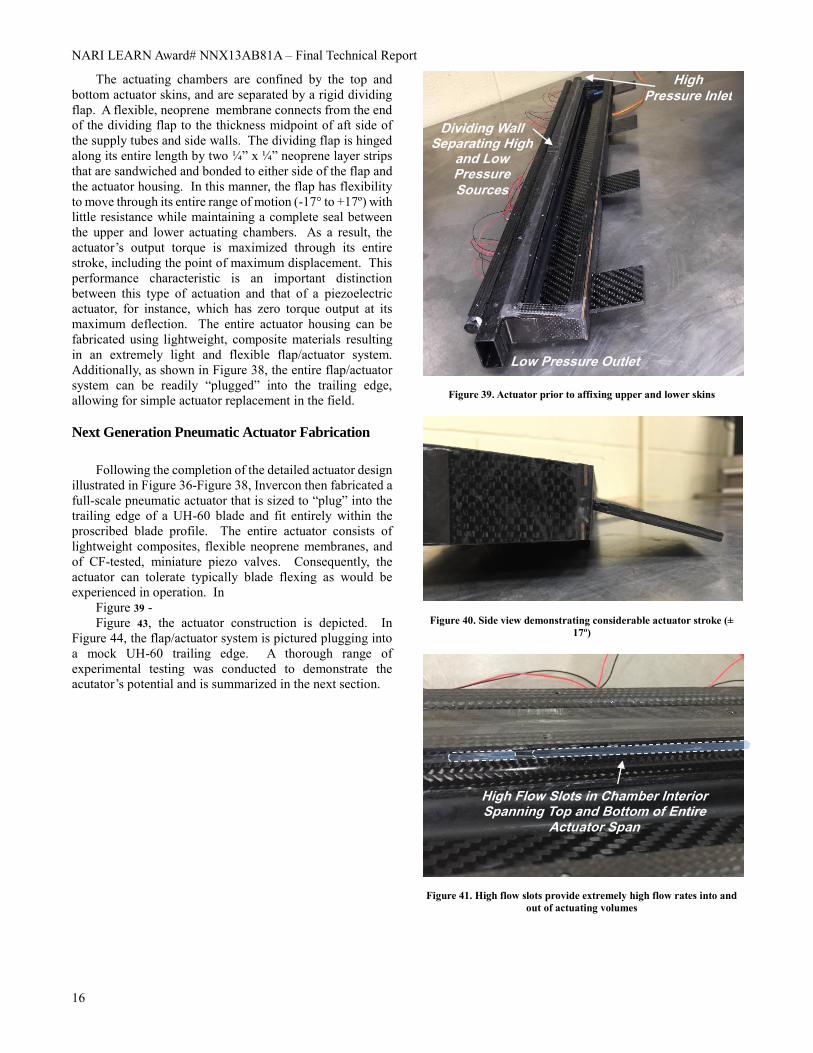
After successfully conducting the pneumatic de-icing
portion of the spin testing, Invercon and PSU then attempted
to experimentally validate the pneumatic actuator’s
performance using centrifugal pumping. Upon activating the
valves, however, very little actuator output displacement was
observed. Invercon and PSU then spent the remaining
portion of the allotted test time trying to determine the reason
for the lack of motion. Ultimately, the actuator was removed
and inspected on the bench, and it was revealed that loose,
Centrifuge Testing of Prototype Valve
Actuator Installed in KMAX Blade
Air Flow Direction
High Pressure in Top Diaphragm High Pressure in Bottom Diaphragm
Inboard Side of Actuator
High Pressure to Bottom Diaphragm
Top Diaphragm Blocked, Connected to Low Pressure
High Pressure to Top Diaphragm
Bottom Diaphragm Blocked, Connected to Low Pressure
Inboard Side of Actuator
Compact Actuator Designed to Fit within Existing Blade Cavity
of Modified KMAX Blade
d=1”
NARI LEARN Award# NNX13AB81A – Final Technical Report
14
honeycomb FOD from the inboard supply line had collected
in the inboard set of valves under the high CF, as pictured in
Figure 34. Prior to spin testing, the inboard supply line was
bored out to ensure a uniform 0.75” diameter along the entire
length of the inboard blade section. During this operation,
the drill bit necessarily created some loose honeycomb
particles. Despite every effort to clean and vacuum this loose
debris prior to testing, it was apparent that the high CF
released those small particles that the vacuum could not.
Ultimately, the FOD had compromised the actuator’s
operation to such a degree that useful results could not be
obtained. Although a disappointing test result, Invercon then
set about to re-imagine the actuator’s design and proceeded
to design, fabricate, and test a new actuator design to avoid
this problem while also allowing for higher air flow and
relying on CF tested piezo valves. The design and testing of
this next generation actuator is detailed in the next section.
Figure 34. Loose honeycomb FOD released under CF, thus clogging
inboard butterfly valves.
Pneumatic Actuator Design with High Flow, Piloted
Valves
As was evident after Phase I testing of the first
generation pneumatic actuator, valve technology must be
improved to enable higher flow rates to improve actuator
performance at higher frequencies in general. Invercon
attempted to address this issue with the butterfly valve design
concept as detailed above. The spin test, however, revealed
a shortcoming of this approach in that it was readily clogged,
and perhaps a better approach would rely on less moving
valve parts that could potentially be compromised.
Another valve design approach to achieve higher flow is
through the use of piloted valve technology. In Figure 35, a
schematic of a high flow, piloted piezoelectric valve is
shown. Instead of the piezoelectric bender controlling flow
into and out of the diaphragm, it instead controls flow into a
small volume within the valve that causes a piston to move,
which then in turn opens high flow orifices to either the high
or low pressure sources.
Figure 35. Basic example of piloted valve technology for flow
amplification.
However, a piston-based, piloted valve like that shown in
Figure 35 would typically not operate properly in the
extremely high centripetal acceleration it would experience
on a rotor blade. Therefore, a specialized piloted valve
design would need to be developed that could deliver high
flow to the pneumatic actuator diaphragms under extreme
CF.
Following the unsuccessful spin test of the butterfly valve
approach, Invercon then focused on developing a new high
flow valve design that is based on a piloted approach.
Invercon’s goal was to design, fabricate, and bench test a
full-scale pneumatic actuator that demonstrates the
feasibility of swashplateless actuation while relying on valve
technology that has been previously validated in high CF
environments in multiple spin tests.
Invercon has successfully developed a high flow
pneumatic actuator that relies upon piloted valve technology.
In addition, the piezoelectric pilot valves that are employed
are identical to those used in the Phase I spin test and thus
are experimentally proven to operate in high CF
environments. In Figure 36-Figure 38, multiple schematics
demonstrate how this new actuator design functions. The
actuator depicted in the figures was designed to fit within the
profile of a UH-60 sized rotor. The main high and low
pressure lines consist of rectangular, composite tubing that
allows for high flow to and from the actuator. The three-way
pilot valves mounted on the forward side of the pressure
supply tubing have access to both the high and low pressure
sources through special access tubing, shown in the lower
illustration in Figure 36. The outputs of the pilot valves are
connected to the four pilot diaphragms which can either seal
or unseal the supply volumes in relation to the actuating
chambers. In other words, the pilot diaphragms either inflate
or deflate to allow for high flow into or out of the actuating
chambers through slots machined into the tubing walls.
Depending on the controller command signal for the flap
displacement, the pilot valves tune the pressures in the pilot
diaphragms to then adjust the pressure in the actuating
chambers. The high flow into and out of the actuating
chambers then occurs through the slots spanning entire span
of the actuator. The result is high bandwidth, high torque
actuation allowing for swashplateless flap actuation, all
while adding extremely little blade weight (~2.5 lbs for
flap/actuator system) and using insignificant electrical power
(< 1 Watt).
Loose FOD from Blade Interior Collected in
Inboard Valves During Spin Testing
NARI LEARN Award# NNX14AF54A – Final Technical Report
15
Figure 36. Graphical overview of piloted valve operation for next
generation pneumatic flap actuator.
Figure 37. Close up view of pilot diaphragms and flow control into and
out of actuating chambers.
Figure 38. Schematic illustrating ease of flap/actuator system
installation, maintenance, and replacement.
Whole Actuator and Flap “Cartridge” Only ~2.5 lbs., All
Composite Construction
Pneumatic Lines “Plug in” and Elastic Gaskets Provide Suitable Seal
Flap/Actuator “Plugs in” to Trailing Edge, Providing Quick Maintenance and
Replacement
~30”
Top Pilot Diaphragm Connected to Low Pressure
Bottom Pilot Diaphragm Connected to High Pressure
High Flow
No Flow
Top Pilot Diaphragm Connected to High Pressure
Bottom Pilot Diaphragm Connected to Low Pressure
High Flow
No Flow
Slots to Chambers High Flow Direction into and
out of Top and Bottom Actuation Chambers
Dividing Wall Separates High and Low Pressure Sources at
the Actuator Midpoint
Outboard Cross-Section
Inboard Cross-Section
3-Way Pilot
Valves
-17°
+17°
-17°
+17°
Low Pressure in Supply Chamber
High Pressure in Supply Chamber
Top Valve Closed: No Air Can be Released from Chamber
Bottom Valve Open: Air
Released to Blade Tip
Bottom Valve Closed: No Air Can
be Released from Chamber
Top Valve Open: Air
Released to Blade Tip
Bottom Valve Closed: No Air Can Enter Chamber
Top Valve Open: Air Flows into Chamber
Top Valve Closed: No Air
Can Enter Chamber
Bottom Valve Open: Air
Flows into Chamber
Pilot Valve Low Pressure
Access Tube
Pilot Valve High Pressure Access Tube
High Pressure Low Pressure
Low Pressure Access Tube for Inboard Pilot Valves
High Pressure Access Tube for Inboard Pilot Valves
Pilot Valves Control Pressure in all Four Pilot Diaphragms
NARI LEARN Award# NNX13AB81A – Final Technical Report
16
The actuating chambers are confined by the top and
bottom actuator skins, and are separated by a rigid dividing
flap. A flexible, neoprene membrane connects from the end
of the dividing flap to the thickness midpoint of aft side of
the supply tubes and side walls. The dividing flap is hinged
along its entire length by two ¼” x ¼” neoprene layer strips
that are sandwiched and bonded to either side of the flap and
the actuator housing. In this manner, the flap has flexibility
to move through its entire range of motion (-17° to +17º) with
little resistance while maintaining a complete seal between
the upper and lower actuating chambers. As a result, the
actuator’s output torque is maximized through its entire
stroke, including the point of maximum displacement. This
performance characteristic is an important distinction
between this type of actuation and that of a piezoelectric
actuator, for instance, which has zero torque output at its
maximum deflection. The entire actuator housing can be
fabricated using lightweight, composite materials resulting
in an extremely light and flexible flap/actuator system.
Additionally, as shown in Figure 38, the entire flap/actuator
system can be readily “plugged” into the trailing edge,
allowing for simple actuator replacement in the field.
Next Generation Pneumatic Actuator Fabrication
Following the completion of the detailed actuator design
illustrated in Figure 36-Figure 38, Invercon then fabricated a
full-scale pneumatic actuator that is sized to “plug” into the
trailing edge of a UH-60 blade and fit entirely within the
proscribed blade profile. The entire actuator consists of
lightweight composites, flexible neoprene membranes, and
of CF-tested, miniature piezo valves. Consequently, the
actuator can tolerate typically blade flexing as would be
experienced in operation. In
Figure 39 -
Figure 43, the actuator construction is depicted. In
Figure 44, the flap/actuator system is pictured plugging into
a mock UH-60 trailing edge. A thorough range of
experimental testing was conducted to demonstrate the
acutator’s potential and is summarized in the next section.
Figure 39. Actuator prior to affixing upper and lower skins
Figure 40. Side view demonstrating considerable actuator stroke (±
17º)
Figure 41. High flow slots provide extremely high flow rates into and
out of actuating volumes
High Flow Slots in Chamber Interior Spanning Top and Bottom of Entire
Actuator Span
Low Pressure Outlet
High Pressure Inlet
Dividing Wall Separating High
and Low Pressure Sources
NARI LEARN Award# NNX14AF54A – Final Technical Report
17
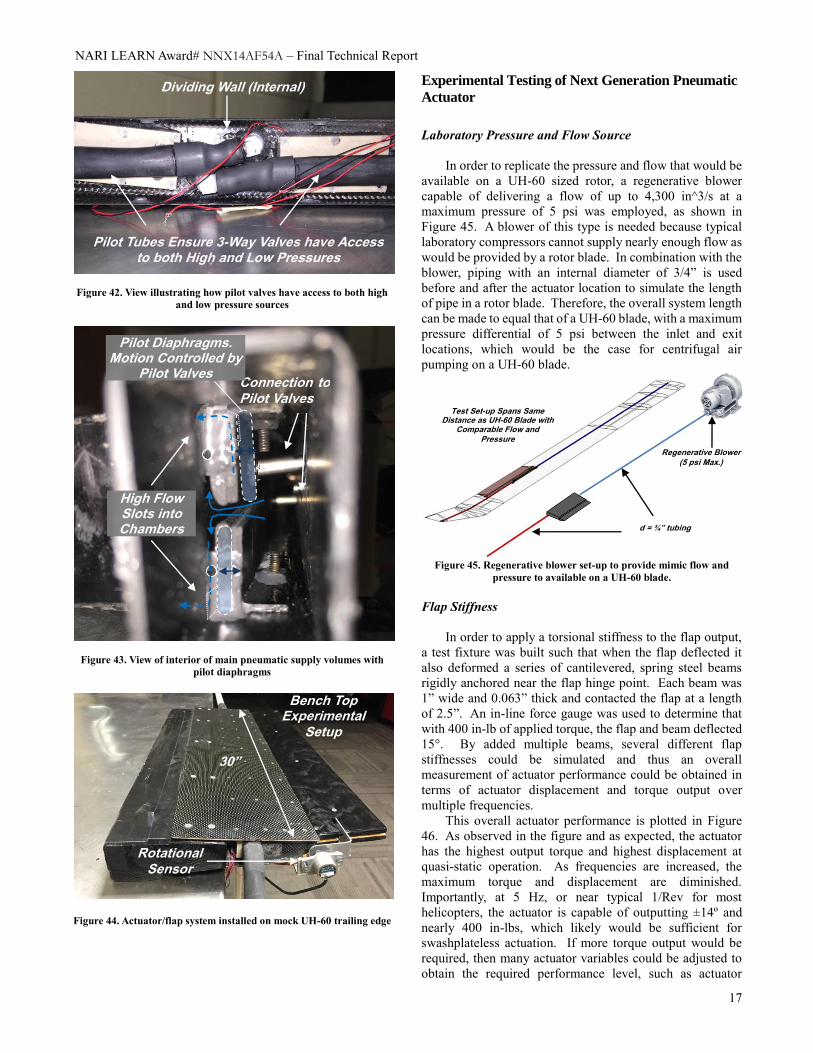
Figure 42. View illustrating how pilot valves have access to both high
and low pressure sources
Figure 43. View of interior of main pneumatic supply volumes with
pilot diaphragms
Figure 44. Actuator/flap system installed on mock UH-60 trailing edge
Experimental Testing of Next Generation Pneumatic
Actuator
Laboratory Pressure and Flow Source
In order to replicate the pressure and flow that would be
available on a UH-60 sized rotor, a regenerative blower
capable of delivering a flow of up to 4,300 in^3/s at a
maximum pressure of 5 psi was employed, as shown in
Figure 45. A blower of this type is needed because typical
laboratory compressors cannot supply nearly enough flow as
would be provided by a rotor blade. In combination with the
blower, piping with an internal diameter of 3/4” is used
before and after the actuator location to simulate the length
of pipe in a rotor blade. Therefore, the overall system length
can be made to equal that of a UH-60 blade, with a maximum
pressure differential of 5 psi between the inlet and exit
locations, which would be the case for centrifugal air
pumping on a UH-60 blade.
Figure 45. Regenerative blower set-up to provide mimic flow and
pressure to available on a UH-60 blade.
Flap Stiffness
In order to apply a torsional stiffness to the flap output,
a test fixture was built such that when the flap deflected it
also deformed a series of cantilevered, spring steel beams
rigidly anchored near the flap hinge point. Each beam was
1” wide and 0.063” thick and contacted the flap at a length
of 2.5”. An in-line force gauge was used to determine that
with 400 in-lb of applied torque, the flap and beam deflected
15°. By added multiple beams, several different flap
stiffnesses could be simulated and thus an overall
measurement of actuator performance could be obtained in
terms of actuator displacement and torque output over
multiple frequencies.
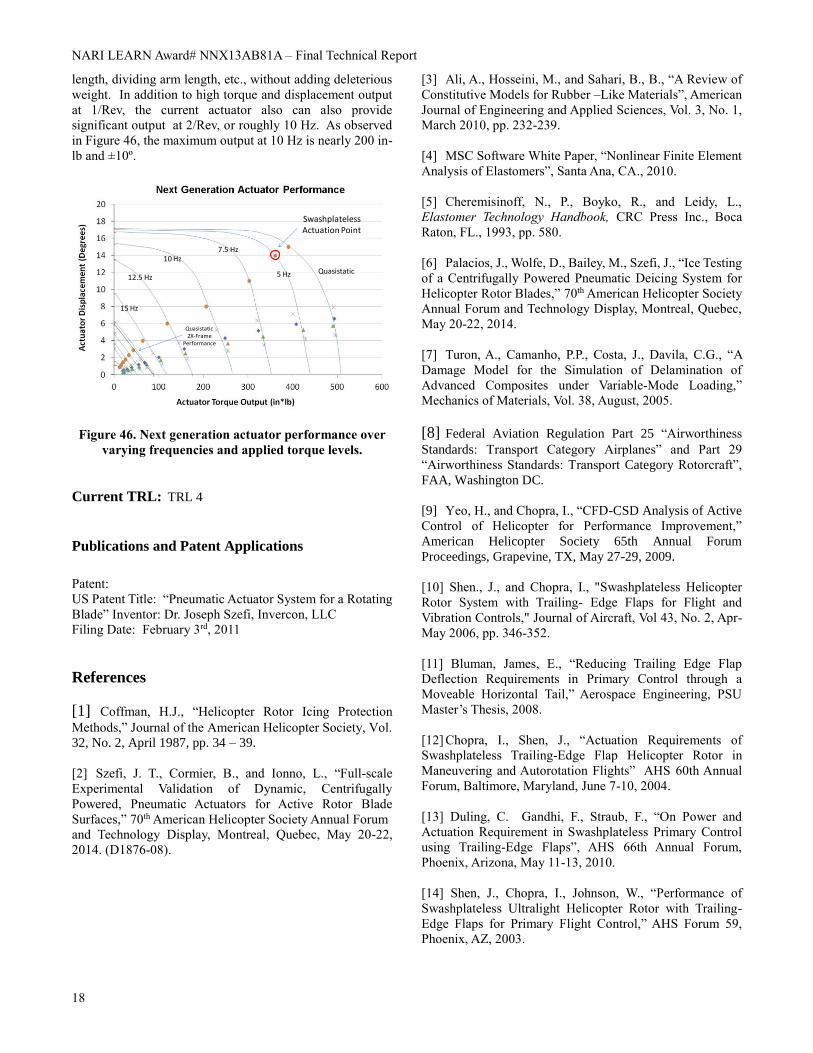
This overall actuator performance is plotted in Figure
46. As observed in the figure and as expected, the actuator
has the highest output torque and highest displacement at
quasi-static operation. As frequencies are increased, the
maximum torque and displacement are diminished.
Importantly, at 5 Hz, or near typical 1/Rev for most
helicopters, the actuator is capable of outputting ±14º and
nearly 400 in-lbs, which likely would be sufficient for
swashplateless actuation. If more torque output would be
required, then many actuator variables could be adjusted to
obtain the required performance level, such as actuator
Dividing Wall (Internal)
Pilot Tubes Ensure 3-Way Valves have Access to both High and Low Pressures
Connection to Pilot Valves
High Flow Slots into Chambers
Pilot Diaphragms. Motion Controlled by
Pilot Valves
Bench Top Experimental
Setup
Rotational Sensor
30”
Regenerative Blower
(5 psi Max.)
d = ¾” tubing
Test Set-up Spans Same Distance as UH-60 Blade with
Comparable Flow and Pressure
NARI LEARN Award# NNX13AB81A – Final Technical Report
18
length, dividing arm length, etc., without adding deleterious
weight. In addition to high torque and displacement output
at 1/Rev, the current actuator also can also provide
significant output at 2/Rev, or roughly 10 Hz. As observed
in Figure 46, the maximum output at 10 Hz is nearly 200 in-
lb and ±10º.
Figure 46. Next generation actuator performance over
varying frequencies and applied torque levels.
Current TRL: TRL 4
Publications and Patent Applications
Patent:
US Patent Title: “Pneumatic Actuator System for a Rotating
Blade” Inventor: Dr. Joseph Szefi, Invercon, LLC
Filing Date: February 3rd, 2011
References
[1] Coffman, H.J., “Helicopter Rotor Icing Protection
Methods,” Journal of the American Helicopter Society, Vol.
32, No. 2, April 1987, pp. 34 – 39.
[2] Szefi, J. T., Cormier, B., and Ionno, L., “Full-scale
Experimental Validation of Dynamic, Centrifugally
Powered, Pneumatic Actuators for Active Rotor Blade
Surfaces,” 70th American Helicopter Society Annual Forum
and Technology Display, Montreal, Quebec, May 20-22,
2014. (D1876-08).
[3] Ali, A., Hosseini, M., and Sahari, B., B., “A Review of
Constitutive Models for Rubber –Like Materials”, American
Journal of Engineering and Applied Sciences, Vol. 3, No. 1,
March 2010, pp. 232-239.
[4] MSC Software White Paper, “Nonlinear Finite Element
Analysis of Elastomers”, Santa Ana, CA., 2010.
[5] Cheremisinoff, N., P., Boyko, R., and Leidy, L.,
Elastomer Technology Handbook, CRC Press Inc., Boca
Raton, FL., 1993, pp. 580.
[6] Palacios, J., Wolfe, D., Bailey, M., Szefi, J., “Ice Testing
of a Centrifugally Powered Pneumatic Deicing System for
Helicopter Rotor Blades,” 70th American Helicopter Society
Annual Forum and Technology Display, Montreal, Quebec,
May 20-22, 2014.
[7] Turon, A., Camanho, P.P., Costa, J., Davila, C.G., “A
Damage Model for the Simulation of Delamination of
Advanced Composites under Variable-Mode Loading,”
Mechanics of Materials, Vol. 38, August, 2005.
[8] Federal Aviation Regulation Part 25 “Airworthiness
Standards: Transport Category Airplanes” and Part 29
“Airworthiness Standards: Transport Category Rotorcraft”,
FAA, Washington DC.
[9] Yeo, H., and Chopra, I., “CFD-CSD Analysis of Active
Control of Helicopter for Performance Improvement,”
American Helicopter Society 65th Annual Forum
Proceedings, Grapevine, TX, May 27-29, 2009.
[10] Shen., J., and Chopra, I., "Swashplateless Helicopter
Rotor System with Trailing- Edge Flaps for Flight and
Vibration Controls," Journal of Aircraft, Vol 43, No. 2, Apr-
May 2006, pp. 346-352.
[11] Bluman, James, E., “Reducing Trailing Edge Flap
Deflection Requirements in Primary Control through a
Moveable Horizontal Tail,” Aerospace Engineering, PSU
Master’s Thesis, 2008.
[12] Chopra, I., Shen, J., “Actuation Requirements of
Swashplateless Trailing-Edge Flap Helicopter Rotor in
Maneuvering and Autorotation Flights” AHS 60th Annual
Forum, Baltimore, Maryland, June 7-10, 2004.
[13] Duling, C. Gandhi, F., Straub, F., “On Power and
Actuation Requirement in Swashplateless Primary Control
using Trailing-Edge Flaps”, AHS 66th Annual Forum,
Phoenix, Arizona, May 11-13, 2010.
[14] Shen, J., Chopra, I., Johnson, W., “Performance of
Swashplateless Ultralight Helicopter Rotor with Trailing-
Edge Flaps for Primary Flight Control,” AHS Forum 59,
Phoenix, AZ, 2003.
Swashplateless Actuation Point
Quasistatic5 Hz
7.5 Hz10 Hz
12.5 Hz
15 Hz
Quasistatic 2X-Frame
Performance

NARI LEARN Award# NNX14AF54A – Final Technical Report
19