INVESTIGATION THE EFFECT OF PARTICLE SIZE ... THE EFFECT OF PARTICLE SIZE DISTRIBUTION ON PROCESSING...
12
INVESTIGATION THE EFFECT OF PARTICLE SIZE DISTRIBUTION ON PROCESSING PARAMETERS OPTIMISATION IN SELECTIVE LASER MELTING PROCESS Bochuan Liu, Ricky Wildman, Christopher Tuck, Ian Ashcroft, Richard Hague Additive Manufacturing Research Group, Loughborough University Abstract Selective Laser Melting is an efficient process for producing metal parts with minimal subtractive post-processing required. Analysis of the parameters controlling the part quality has been performed focussing on the energy intensity during processing and the effect of the particle size distribution on factors such as ultimate tensile strength and surface finish. It is shown that the controlling the energy intensity is key to quality and can be affected by varying, for example, laser beam diameter or the scanning rate. Keywords: Particle size distribution; Powder bed; Processing parameters; Quality of finishing parts; Selective Laser Melting 1 Introduction Selective laser melting (SLM) is a laser based additive manufacturing (AM) technique, which is able to build complex geometries directly from 3D CAD (computer-aided design) models, thereby allowing for great design freedom, and without the need of tooling [1-3] . As a process similar to laser sintering (LS), SLM uses a higher energy input to enable full melting of the powder bed materials, in order to build full dense parts without post-processing. Optimal fabrication of parts using SLM requires a comprehensive understanding of the main processing parameters. In SLM, energy input, powder bed properties and build conditions are three leading factors that can affect the part‟s quality, which can be measured in various ways, including final part density, surface finishing and mechanical properties. Laser energy density, E ρ , is a key factor that affects the final part‟s quality in the SLM process to quantify energy input [1] . It is defined by the laser power, P (W), laser scanning speed, u (mm/s) and laser beam diameter, δ (mm) in the equation below. 227
Transcript of INVESTIGATION THE EFFECT OF PARTICLE SIZE ... THE EFFECT OF PARTICLE SIZE DISTRIBUTION ON PROCESSING...

INVESTIGATION THE EFFECT OF PARTICLE SIZE DISTRIBUTION ON
PROCESSING PARAMETERS OPTIMISATION IN SELECTIVE LASER MELTING
PROCESS
Bochuan Liu, Ricky Wildman, Christopher Tuck, Ian Ashcroft, Richard Hague
Additive Manufacturing Research Group, Loughborough University
Abstract
Selective Laser Melting is an efficient process for producing metal parts with minimal subtractive
post-processing required. Analysis of the parameters controlling the part quality has been
performed focussing on the energy intensity during processing and the effect of the particle size
distribution on factors such as ultimate tensile strength and surface finish. It is shown that the
controlling the energy intensity is key to quality and can be affected by varying, for example,
laser beam diameter or the scanning rate.
Keywords: Particle size distribution; Powder bed; Processing parameters; Quality of finishing
parts; Selective Laser Melting
1 Introduction
Selective laser melting (SLM) is a laser based additive manufacturing (AM) technique, which is
able to build complex geometries directly from 3D CAD (computer-aided design) models,
thereby allowing for great design freedom, and without the need of tooling [1-3]
. As a process
similar to laser sintering (LS), SLM uses a higher energy input to enable full melting of the
powder bed materials, in order to build full dense parts without post-processing.
Optimal fabrication of parts using SLM requires a comprehensive understanding of the main
processing parameters. In SLM, energy input, powder bed properties and build conditions are
three leading factors that can affect the part‟s quality, which can be measured in various ways,
including final part density, surface finishing and mechanical properties.
Laser energy density, Eρ, is a key factor that affects the final part‟s quality in the SLM process to
quantify energy input [1]
. It is defined by the laser power, P (W), laser scanning speed, u (mm/s)
and laser beam diameter, δ (mm) in the equation below.
227
Powder bed properties, including bulk density and thermal properties, affect the final part
properties. Powder particle size distribution plays an important role in sintering kinetics and
powder bed formation [4, 5]
. Investigations on the effect of particle size and size distribution have
been carried out for sintering ceramics [6-8]
. However, the effect of particle size distribution on
laser sintering has not been well documented, especially in direct metal laser fabrication area [9, 10]
.
Also, investigations which compare the laser sintering behaviour of powders with similar average
size, but different size distribution range are very limited.
In this paper, the effect of various process parameters, both relating to the powder and the laser
properties, on final build quality is observed. In particular the effects on mechanical properties,
which are ultimately what defines performance in use, are considered.
2 Experimental procedures
2.1 Initial characterisation
Two sets of gas atomised Stainless Steel 316L powders were obtained from two suppliers,
Sandvik Osprey Ltd and LPW Technology Ltd. These were chosen for their similar chemical
composition (data provided by the suppliers), but different particle size distribution (as measured
by the suppliers). Supplier data indicated that Sandvik Osprey (SO) particle size was in the range
0-45µm and LPW Technology (LPW) in the range 15-45µm. Upon receipt, the powders were
characterised in house using a LEO 440 Scanning Electron Microscope (SEM) and a Malvern
Mastersizer 2000 laser diffraction based particle size analyser with a Scirocco dry dispersion
accessory.
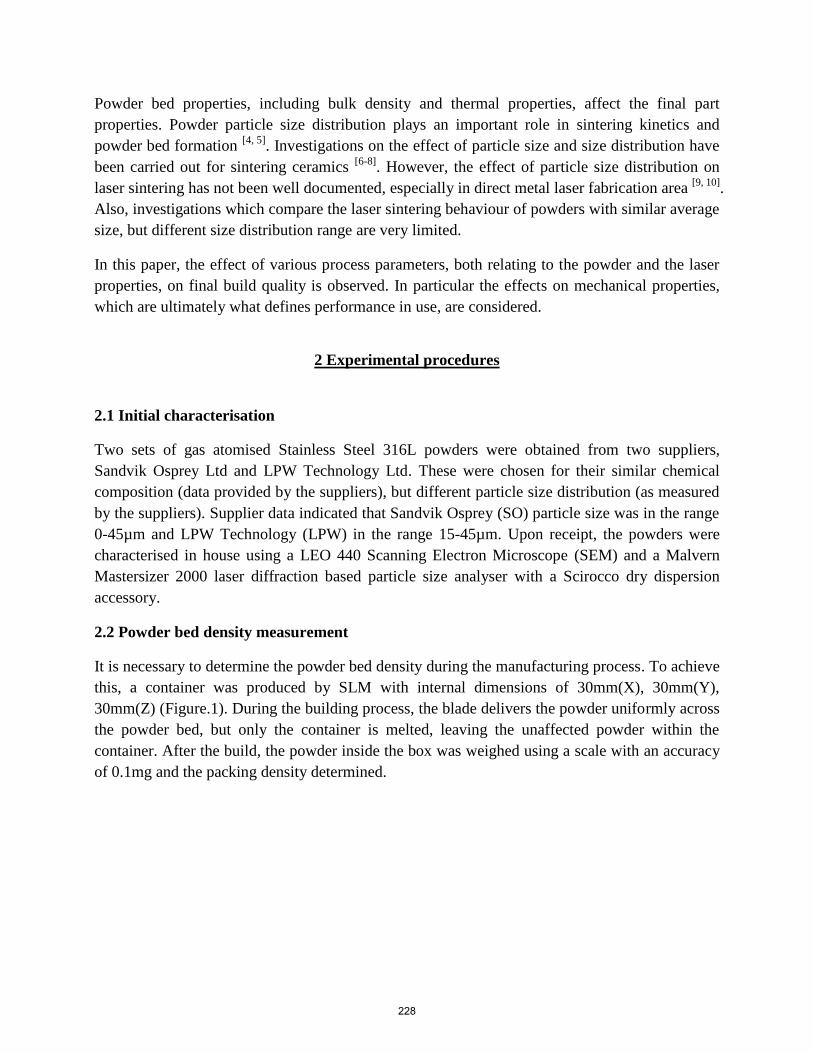
2.2 Powder bed density measurement
It is necessary to determine the powder bed density during the manufacturing process. To achieve
this, a container was produced by SLM with internal dimensions of 30mm(X), 30mm(Y),
30mm(Z) (Figure.1). During the building process, the blade delivers the powder uniformly across
the powder bed, but only the container is melted, leaving the unaffected powder within the
container. After the build, the powder inside the box was weighed using a scale with an accuracy
of 0.1mg and the packing density determined.
228

Figure.1 Design of container built for powder bed density measurement
2.3 Powder flowability measurement
The powder flowability is a powder characteristic which can affect the particle distribution on the
powder bed, is itself affected by the powder particle size distribution. In SLM process, good
powder flowability is required to achieve uniform thickness of powder layers, which allows
uniform laser energy absorption in the processing area.
The Hausner ratio is a number which is correlated to the powder flowability. It is calculated using
the equation shown below [11]
:
where ρT is tapped density of powder, and ρA is apparent density of powder. A Hausner ratio
greater than 1.25 is considered to be an indication of poor flowability [11]
. Powder apparent and
tapped densities were measured according to ASTM D7481 to calculate the Hausner ratio.
Since moisture can affect the flowability of the powder, all powders used in this study were
heated within a sample oven (80⁰C) to reduce the humidity until the relative humidity was less
than 0.01% (measured by A&D MS-70 moisture analyser) before put inside the processing
chamber, which has a strict humidity controlled environment.
2.4 Finishing parts quality comparison
Tensile test specimens with a gauge length of 25mm and thickness of 3mm, designed according
to ASTM E8-09, were built using a commercial Selective Laser Melting workstation „MCP
SLM-Realizer 100‟ developed by MCP-HEK Tooling GmbH, which is equipped with a 50W
229

continuous wave fibre laser with a beam diameter down to 0.026mm. For each brand‟s powder,
five groups of specimens were built using five different scanning speeds: 100mm/s, 150mm/s,
200mm/s, 250mm/s and 300mm/s. Another five groups of specimens were built with five
different laser beam diameters (measured using a camera based laser beam profiler) 0.026mm,
0.028mm, 0.030mm, 0.035mm, 0.048mm. Within each group the processing parameters were
same for all 5 specimens; the building chamber had an Argon atmosphere, which enabled an
oxygen content of less than 0.1%. Laser beam diameter and scanning speed can be parameterised
into a laser energy density using the equation above, and these are shown for each experiment in
in Tables 1 and 2.
Scanning speed variation
Laser power 50W
Laser beam diameter 0.028mm
Scanning speed 100mm/s, 150mm/s, 200mm/s, 250mm/s,
300mm/s
Layer thickness 0.05mm
Hatch distance 0.08mm
Scanning strategy One scan each layer
Pre-heating substrate Non
Table.1 Specimens built parameters using different scanning speeds
Laser beam diameter variation
Laser power 50W
Laser beam diameter 0.026mm, 0.028mm, 0.030mm, 0.035mm,
0.048mm
Scanning speed 200mm/s
Layer thickness 0.05mm
Hatch distance 0.08mm
Scanning strategy One scan each layer
Pre-heating substrate Non
Table.2 Specimens built parameters using different laser beam diameters
Final part density was measured by cross sectioning specimens and examining the porosity using
an optical microscope. Five cross sections were examined to obtain average density value for
each sample. Surface roughness was measured by Talylor Hobson Form Talysurf 50. Tensile
strength (UTS) and elongation at break were tested using an Instron 3369 and hardness was
measured using a Rockwell hardness testing machine (Avery 6402).
230

3 Results and discussions
3.1 Particle shape, size and size distribution
Particle shapes examined by SEM are shown in Figure.2. Both the SO and the LPW powder
appear to be close to spherical with smooth surfaces. Visual inspection suggests that the SO
powder consists of a wider range of particle sizes than the LPW.
Figure.2 Left-Osprey, right-LPW powder under SEM, mag=500
Measured particle size distributions of SO and LPW powders are shown in Figure.3. The clearly,
the two powders have a distinctly different distribution. The SO powder has a wider range and
contains significantly more fine particles (<10µm). The mean sizes are close, 27.533µm (SO) and
29.294µm (LPW).
Figure.3 Particle size distribution measured by Mastersizer 2000
3.2 Powder bed density and powder flowability
Apparent density, powder bed density and tapped density of the powders are shown in Table.3. A
wider range of particle sizes usually allows a higher density to be achieved as the smaller
particles can fit in the gaps between the larger particles and this is reflected in the generally
231

higher bed density observed for the SO powder. This is likely to be beneficial for the final part.
However, the higher density will result in great friction and more possibilities for particles to
“lock” together during flow, and thus reduced flowability is seen for the SO powder, shown in
Table 4.
Brand Apparent density
(g/ml)
Powder bed
density (g/ml)
Tapped density
(g/ml)
Osprey 4.54 5.312 5.54
LPW 4.33 4.88 5.03
Table.3 Measured apparent density, powder bed density and tapped density
Brand Hausner ratio
Osprey 1.22
LPW 1.16
Table.4 Measured powder flowability
3.3 Density of the finishing parts
Scanning
Speed 100mm/s 150mm/s 200mm/s 250mm/s 300mm/s
Osprey 99.45% 99.93% 99.55% 99.37% 99.30%
LPW 99.85% 99.65% 99.02% 97.91% 97.22%
Table.5 Average density of parts built using different scanning speeds
Table 5 shows the measured density of the final parts, as a percentage of the full density, i.e., the
density achievable with zero porosity. Generally a downward trend in density is observed with
increasing scanning speed, reflecting the reduced energy input into the material [12-14]
. In addition,
the LPW, which was previously observed to have a lower powder bed density, is typically found
to have a lower part density than the SO parts, suggesting a possible link between the powder bed
density (and thus the particle size distribution) and the final part density. Typical cross-sections
of the samples are shown in Figure.4. There is a small drop in average density for SO parts from
150mm/s to 100mm/s with even more energy delivered, and can be caused by fine particles
vaporise due to the high temperature generated on the powder bed [13]
.
232

Figure.4 Cross section of parts built on 300mm/s, left-Osprey, right-LPW
Table 6 shows the average density of parts built using five laser beam diameters.
Beam
diameter 0.026mm 0.028mm 0.030mm 0.035mm 0.048mm
Osprey 99.90% 99.55% 99.45% 99.26% 98.53%
LPW 99.93% 99.02% 98.63% 97.98% 96.72%
Table.6 Average density of parts built using different laser beam diameters
A similar trend is observed for laser beam diameter. As the diameter is increased, then for the
same power, the density tends to decrease. This reflects the same trend in the energy intensity as
the beam diameter is increased or the scanning speed increased. Same trend was observed for
samples built under different scanning speeds: the Osprey samples perform better than LPW‟s
when using larger laser beam diameters. Again, the LPW parts are typically found to have a
lower part density than the SO parts.
3.4 Surface roughness of the finishing parts
Figure 5 and Figure 6 show measured side and top surface roughness Ra for both SO and LPW
parts.
233

.
Figure.5 Side surface roughness for both SO and LPW parts
Figure.6 Top surface roughness for both SO and LPW parts
3
4
5
6
7
8
9
10
11
4 9 14 19
Sid
e S
urf
ace
ro
ugh
ne
ss R
a(µ
m)
Laser energy density (J/mm²)
LPW (varying scanning speed)
Osprey (varying scanning speed)
LPW (varying diameter)
Osprey (varying diameter)
8
10
12
14
16
18
20
22
24
26
28
30
4 9 14 19
Top
Su
rfac
e r
ou
ghn
ess
Ra(
µm
)
Laser energy density (J/mm²)
LPW (varying scanning speed)
Osprey (varying scanning speed)
LPW (varying diameter)
Osprey (varying diameter)
234

The results for roughness are more confused. There are suggestions of an increase in roughness
as the laser energy intensity is decreased, though there is some significant variation from this,
particularly for the top surface roughness of parts built using both SO and LPW powder.
SO parts have better side surface finishing than LPW parts, suggesting a possible link between
the particle size distribution and the final parts side surface finishing.
Top surface is usually rougher than side surface on SLM built parts, as can be seen from Figure 5
and 6. Lowest Ra of top surface was observed between the input laser energy density from
7J/mm2 to 10J/mm
2 for both SO and LPW parts. Higher energy intensity input introduced
rougher top surface due to high thermal stresses and non-uniform solidification rate across the
powder bed. Top surface roughness of SO parts varies in smaller range compared with LPW parts.
3.5 Tensile strength and elongation of the finishing parts
Figure 7 and Figure 8 show Ultimate Tensile Strength (UTS) and elongation at failure of the
samples built using both SO and LPW powders.
Figure.7 UTS of both SO and LPW parts
Both SO and LPW parts experienced a first increase and then decrease in UTS with increasing
the laser energy density. Observed from Figure 7, LPW parts have higher tensile strength than
SO parts. A drop in UTS under higher energy intensity input was also observed for both SO and
LPW parts.
500
525
550
575
600
625
650
675
700
4 9 14 19
UTS
(M
Pa)
Laser energy density (J/mm²)
LPW (varying scanning speed)
Osprey (varying scanning speed)
LPW (varying diameter)
Osprey (varying diameter)
235

Figure.8 Elongation of both SO and LPW parts
The results for elongation show the similar trend as UTS of both SO and LPW parts, except for
LPW parts under high laser energy density. SO parts have higher elongation than LPW parts in
most energy intensity, as can be seen from Figure 8.
3.6 Hardness of the finishing parts
Figure.9 shows measured Rockwell B hardness of both SO and LPW parts.
0
10
20
30
40
50
4 9 14 19
Elo
nga
tio
n (
%)
Laser energy density (J/mm²)
LPW (varying scanning speed)
Osprey (varying scanning speed)
LPW (varying diameter)
Osprey (varying diameter)
236

Figure.9 Hardness under different scanning speeds
The results for hardness are more confused. These are suggestions of an increase in hardness as
the energy intensity is increased, although there is significant variation for parts using SO powder.
Rockwell B hardness of SO parts stayed in a small range between 68 and 72, but didn‟t form a
clear trend under different laser energy density, observed from Figure 9. LPW parts have larger
hardness than SO parts when high energy intensity was delivered.
4 Summary conclusions
Powders with different particle size distribution behave differently in selective laser melting
process, and introduce differences in powder bed distribution and built part‟s quality.
Powder with wider range of particle size provides higher powder bed density, generates higher
density parts under low laser energy intensity, and generates smoother side surface finishing parts.
Powder with narrower range of particle size provides better flowability, generates parts with
higher UTS and larger hardness.
References
60
65
70
75
4 9 14 19
Har
dn
ess
(R
ock
we
ll B
)
Laser energy density (J/mm²)
LPW (varying scanning speed)
Osprey (Varying scanning speed)
LPW (varying diameter)
Osprey (varying diameter)
237

[1] J.J. Beaman, J.W. Barlow, D.L. Bourell, R.H. Crawford, H.L. Marcus, K.P. McAlea, Solid
Freeform Fabrication: A New Direction in Manufacturing, Kluwer Academic Publishers, 1997.
[2] L. Lu, J. Fuh, Y.S. Wong, Laser Induced Materials and Processes for Rapid Prototyping,
Kluwer Academic Publishers, 2001, ISBN: 0792374002.
[3] R.Hague, S. Mansour and N. Saleh, Material and design considerations for Rapid
Manufacturing. International Journal of Production Research, 42(22), 2004, 4691.
[4] Randall M. German, Powder Metallurgy Science – 2nd Edition, Metal Powder Industries
Federation, 1994, ISBN: 1878954423.
[5] M.J. O‟Hara, I.B. Cutler, Sintering Kinetics of binary mixtures of alumina powders.
Proceedings of the British Ceramic Society, 12, 1969, pp.145-154.
[6] H.M. Lee, C.Y. Huang, C.J. Wang, Forming and sintering behaviours of commercial α-Al2O3
powders with different particle size distribution and agglomeration, Journal of materials
processing technology, 209, 2009, pp.714-722.
[7] Baoshan Li, Guorong Li, WangZhong Zhang, AiLi Ding, Influence of particle size on the
sintering behaviour and high-power piezoelectric properties of PMnN-PZT ceramics, Materials
science and engineering, B 121, 2005, pp.92-97.
[8] Ken Darcovich, Floyd Toll, Pierre Hontanx, Virginie Roux, Kazunari, Shinagawa, An
experimental and numerical study of particle size distribution effects on the sintering of porous
ceramics, Materials science and engineering, A 348, 2003, pp.76-83.
[9] J.S. Chappell, T.A. Ring, J.D. Birchall, Particle size distribution effects on sintering rates,
Journal of Applied Physics, 60 (1) 1986, pp.383-391.
[10] T.S. Yeh, M.D. Sacks, Low-temperature sintering of aluminium oxide, Journal of the
American ceramic society, 71 (10) 1988, pp.841-844.
[11] http://en.wikipedia.org/wiki/Hausner_ratio
[12] T.H.C. Childs, Raster scan selective laser melting of the surface layer of a tool steel powder
bed. Proc. IMechE, 219(B), 2005, pp.109-115.
[13] J.P. Kruth, P. Mercelis, J.V. Vaerenbergh, L. Froyen, M. Rombouts, Binding mechanisms in
selective laser sintering and selective laser melting, Rapid Prototyping Journal, 11(1), 2005,
pp.26-36.
[14] R. Morgan, C.J. Sutcliffe, W. O‟Neill, Density analysis of direct metal laser re-melted 316L
stainless steel cubic primitives, Journal of Materials Science, 39(4), 2004, pp.1195-1205.
238