Investigation of tumour characteristics and treatment ...
59
Investigation of tumour characteristics and treatment strategies in animal models using multiparametric MRI and novel contrast agents Cecilie Brekke Rygh Dissertation for the degree philosophiae doctor (PhD) University of Bergen, Norway 2007 CORE Metadata, citation and similar papers at core.ac.uk Provided by NORA - Norwegian Open Research Archives
Transcript of Investigation of tumour characteristics and treatment ...
Investigation of tumour characteristics and treatment strategies in animal
models using multiparametric MRI and novel contrast agents
Cecilie Brekke Rygh
Dissertation for the degree philosophiae doctor (PhD)
University of Bergen, Norway
2007
CORE Metadata, citation and similar papers at core.ac.uk
Provided by NORA - Norwegian Open Research Archives
2
Acknowledgements
This thesis is based on work carried out at the Department of Biomedicine, University of
Bergen, at FUGE Molecular Imaging Center, Department of Circulation and Medical
Imaging, Norwegian University of Science and Technology, and at Neuroimaging Group,
Institute of Psychiatry, King’s College London. I would like to express my sincere gratitude
to all those who have contributed to this work in various ways. In particular I would like to
thank my colleagues and friends:
Frits Thorsen, my main supervisor during the last two years of my PhD, for invaluable
discussions about science and every-day life, his encouragement, support and optimism, and
for understanding the trouble of juggling work and parenthood.
Arvid Lundervold, my main supervisor during the first two years of my PhD, for introducing
me to the interesting field of MRI and physiology, programming help, his many ideas, and
fruitful discussions.
Rolf Bjerkvig, my co-supervisor, for his support when I most needed it, and for his belief in
me.
Mike Modo, who supervised me during my stay at IoP, for introducing me to cellular MRI,
his patience, and invaluable help with experiments and finishing papers.
Steve Williams, the head of the NeuroImaging group at IoP, for letting me stay and work in
his group, his positive attitude, and for providing money necessary to conduct my
experiments.
Jack Price for good collaboration and for providing facilities at IoP.
Martha Enger for taking me onboard on her “baby” (the NG2 project) when I was a fresh
PhD student, for sharing her enormous amount of knowledge, her friendship and support
throughout my PhD.
Sarah Morgan for her friendship, invaluable help and endless patience and great effort in
changing me from a “lab disaster” (when it comes to cell culture work) to someone who
actually felt that working with cells was joy-bringing.

3
Christian Brekken, my very knowledgeable co-worker in Trondheim, who is great fun to
work with.
My esteemed colleagues at the NeuroImaging group at IoP; Jasdeep Sandhu, Diana Cash,
Maria Ashioti, Andrew Lowe, Martina Mitterschiffthaler, Aisling Köning, and the other
members of the ratpack for making my stay in London very exciting, fun, and fruitful. Their
scientific input and friendship are very much appreciated!
The members of Bjerkvig’s lab who immediately made me feel welcome and patiently
answered all my stupid questions.
Renate Grüner for reading through my thesis, her superb MR expertise, and encouraging
words when needed.
Lars Ersland for his support during hard times and his great sense of humour.
Kenneth Hugdahl, the head of Bergen fMRI group, for financial support to attend HBM
2003 in New York and to buy software.
The personnel at MIC, especially Endy Spriet, for excellent technical assistance.
My good friends and colleagues at BBB; Hilde Gundersen, Eldbjørg Fiske, and Tine Karlsen
for discussions about everything but science and for creating such a nice atmosphere at
work.
Finally, I would express my gratitude to my family and friends. A warm thank to Kristin and
Helge, my dear parents who always have supported me and had strong faith in me, and who
have been babysitting Linus every time we have asked for it (and making it sounds like we
are doing them a favour). A special thank to Lars Jørgen for being such a fantastic husband
and friend. And Linus, my wonderful son, who has taught me the joy of being childish again.
Cecilie Brekke Rygh Bergen, March 2007

4
Table of contents
ACKNOWLEDGEMENTS................................................................................................................. 2
LIST OF PAPERS ............................................................................................................................... 6
ABBREVIATIONS AND GLOSSARY ............................................................................................. 7
INTRODUCTION................................................................................................................................ 9
1.1 BASIC PRINCIPLES OF MRI ...................................................................................................... 9
1.1.1 Nuclear spin ............................................................................................................... 10
1.1.2 Intrinsic contrast mechanisms.................................................................................... 11
1.2 MR CONTRAST AGENTS IN NEUROIMAGING ........................................................................... 13
1.2.1 Paramagnetic contrast agents.................................................................................... 14
1.2.2 Superparamagnetic contrast agents........................................................................... 15
1.3 PRIMARY BRAIN TUMOURS .................................................................................................... 16
1.3.1 WHO classification .................................................................................................... 16
1.3.2 The cellular origin of gliomas.................................................................................... 17
1.3.3 Brain tumour biology ................................................................................................. 18
1.4 CONVENTIONAL AND EXPERIMENTAL TREATMENT STRATEGIES ............................................ 19
1.4.1 Neural stem cells as a potential treatment modality .................................................. 20
1.4.2 NG2 progenitor cells as a potential target for brain tumour therapy........................ 21
1.5 EXPERIMENTAL GLIOMA MODELS .......................................................................................... 22
1.6 MR IMAGING OF BRAIN TUMOURS ......................................................................................... 22
1.6.1 Conventional MR imaging ......................................................................................... 23
1.6.2 Functional MR imaging of brain tumours ................................................................. 25
1.7 CELLULAR MR IMAGING ....................................................................................................... 28
1.7.1 Contrast agents for cellular labelling ........................................................................ 28

5
1.7.2 Cellular uptake ...........................................................................................................30
1.7.3 Implications of cellular MRI of the CNS using animal models...................................31
1.7.4 Clinical implications of cellular MRI .........................................................................32
2.0 AIMS OF THE THESIS ..........................................................................................................33
3.0 DISCUSSION ...........................................................................................................................34
3.1 EXPERIMENTAL DESIGN..........................................................................................................34
3.1.1 Experimental glioma models.......................................................................................34
3.1.2 Quantification of microvascular parameters..............................................................35
3.1.3 Multiparametric imaging and data analyses ..............................................................37
3.1.4 Contrast agents ...........................................................................................................39
3.2 EXPERIMENTAL FINDINGS ......................................................................................................40
3.2.1 NG2 expression mediates an aggressive glioma phenotype .......................................40
3.2.2 Signal enhancement with differently sized contrast agents.........................................41
3.2.3 GRID visualises cells both in vitro, in vivo and ex vivo..............................................42
3.2.4 GRID does not impair cellular functions of labelled cells in vitro .............................43
3.2.5 NSCs as a therapeutic modality in brain tumours ......................................................43
3.3 CONCLUDING REMARKS .........................................................................................................44
4.0 FUTURE PROSPECTS ...........................................................................................................45
REFERENCES ...................................................................................................................................46

6
List of papers
This thesis is based upon the following papers, which are referred to in the text by their Roman numerals.
I. Brekke C, Lundervold A, Enger, PØ, Brekken C, Stålsett E, Pedersen TB, Haraldseth O, Krüger PG, Bjerkvig R, and Chekenya M.
NG2 expression regulates vascular morphology and function in human brain tumours.
NeuroImage. 2006 Feb 1;29(3):965-76; Epub ahead of print 2005 Oct 24
II. Brekke C, Morgan SC, Lowe AS, Meade TJ, Price J, Williams SC, and Modo M.
The in vitro effects of a bimodal contrast agent on cellular functions and relaxometry.
NMR in Biomedicine. Epub ahead of print 2006 Sep 1
III. Brekke C, Williams SC, Price J, Thorsen F, and Modo M.
Cellular multiparametric MRI of neural stem cell therapy in a rat glioma model. Submitted, 2007
7
Abbreviations and glossary
ADC Apparent diffusion coefficient
BBB Blood-brain-barrier
BTSC Brain tumour stem cell
CT Tissue concentration of a tracer
CBV Cerebral blood volume
CNR Contrast-to-noise ratio
CNS Central nervous system
CNS-1 Rat astrocytoma cell line
CSC Cancer stem cell
CSF Cerebral spinal fluid
D0 Fractional blood volume, i.e. fraction of perfused blood volume [mM] (Su’s model)
D1 Describes the permeability between the vessels and tissue, is proportional to the transfer constant between vessels and tissue [mM min-1] (Su’s model)
DCE-MRI Dynamic contrast enhanced MRI
DSC-MRI Dynamic susceptibility contrast MRI
DWI Diffusion weighted imaging
EES Extravascular extracellular space
ECF Extracellular fluid
FDA US Food and Drug Administration
FLAIR Fluid attenuated inversion recovery, MRI sequence
Gd Gadolinium
GE Gradient echo, MRI sequence
GBM Glioblastoma multiforme
GRID Gadolinium Rhodamine Dextran
ICP-MS Inductively coupled plasma – mass spectrometry
IR Inversion recovery, MR sequence
i.v. Intravenous
K2 Rate constant between EES and blood plasma [min-1] (Su’s model)
Ktrans Transfer rate, volume transfer constant between blood plasma and EES, [min-1] (Tofts’ model)
kep Rate constant, rate constant between EES and blood plasma [min-1] (Tofts’ model)
M Molar
M Bulk magnetisation vector
M0 Magnitude of magnetisation vector prior to excitation pulse
Mx, My, Mz Directional components of M

8
MION Monocrystalline iron-oxide particles
MPIO Micrometer-sized iron-oxide particles
MRI Magnetic resonance imaging
MVD Microvessel density
NG2 Neuron-glial 2
NMR Nuclear magnetic resonance
NSC Neural stem cell
PD Proton density
Pixel Picture element
R Relaxation rate [s-1]
r Relaxivity of the contrast agent [mM-1 s-1]
RARE Rapid acquisition with relaxation enhancement, MRI sequence
ROI Region of interest
RF Radiofrequency
SE Spin echo, MRI sequence
SPIO Superparamagnetic iron-oxide particles
TE Echo time
T Tesla
T1 Longitudinal relaxation time constant [s]
T2 Transverse relaxation time constant [s]
TR Repetition time
U251 Human glioblastoma cell line
U251-NG2 U251 cells that are modified genetically to express NG2
U251-WT The wild type counterpart to U251-NG2
USPIO Ultrasmall superparamagnetic iron-oxide particles
ve EES, volume of extravascular extracellular space per unit volume of tissue, i.e. volume fraction of EES or leakage space (Tofts’ model).
Voxel Volume element
WHO World Health Organization
WT Wild type

9
Introduction
Preface
Magnetic resonance imaging (MRI) has emerged as a powerful and robust tool in the
identification and study of diseases in the central nervous system (CNS) since it was first
introduced in 1970s. MRI is in many cases the method of choice in diagnosis and treatment
evaluation, due to its unique soft tissue contrast, high spatial resolution and physiological
sensitivity. Also, as it is non-invasive and utilises non-ionising radiation, MRI is considered
as a safe and reliable imaging method (2).
Magnetic resonance is based on the magnetic properties of atomic nuclei, and this
phenomenon was first described in 1938 (3). A few years later, Felix Bloch and Edward
Purcell independently reported detections of magnetic resonance in bulk matter (4-6). In
1971, the American physician Raymond Damian stated that nuclear magnetic resonance
(NMR) could distinguish between cancerous and healthy tissue, and for the first time a clear
biological application of NMR was shown (7). The first MR image was generated in 1972 by
Paul Lauterbur, and reported in Nature in 1973 (8) after first being rejected by the same
journal due to lack of wide significance. Improvements of image formation by Peter
Mansfield in 1976 greatly improved the feasibility of MRI. In 1977, the first human
magnetic resonance scanner was developed by Damadian’s FONAR Corporation (2). The
US Food and Drug Administration (FDA) approved MRI scanners for clinical use in 1985
(2). The first MRI scanner in Norway was installed at Stavanger University Hospital in
1986. Over the years, the number of MRI scanners has exploded, and are extensively used
both in clinical and research settings. In 2003, Peter Mansfield and Paul Lauterbur were
awarded with the Nobel Prize (Medicine/Physiology) for applying the fundamental
discoveries of NMR to medical imaging.
1.1 Basic principles of MRI
To introduce the basic concepts and terminology, the basic principles of magnetic resonance
imaging are briefly described below. For a thorough description of the physical principles,
readers should be referred to standard MRI textbooks, e.g. (9)

10
1.1.1 Nuclear spin
For MRI to provide tomographic images a strong magnetic field is required combined with
application of smaller local fields (gradients) and electromagnetic transmit- and receive-
coils. The technique utilizes electromagnetic properties of specific nuclei naturally abundant
in body tissues. So far the hydrogen nucleus, H+ (which is a proton), is the most interesting
nucleus because of its high abundance (about 2/3 of body weight is water), and because it
gives the strongest signal. The proton is a charged particle with spin, and exhibits the
electromagnetic properties of a dipole magnet. In the absence of an external magnetic field,
the directions of the protons are random and thus no net magnetization is produced. When
body tissue is placed in an external magnetic field B0, the direction of the protons is either
parallel or anti-parallel with B0. They not only rotate about their own axis but also precess
about the axis of the external magnetic field with a specific rate. This can be expressed by
the Larmor equation:
ω0 = γB0
where ω0 is the angular precessional frequency, γ is the gyromagnetic ratio specific for the
nuclei, and B0 is the strength of the external magnetic field. The gyromagnetic ratio is a
proportionality constant dependent on the kind of nucleus, where the hydrogen nucleus has
the highest gyromagnetic ratio. A net magnetization M0 is produced in the same direction as
B0 because of an excess of parallel protons compared to anti-parallel protons. The direction
of B0 and M0 is defined as the z-axis in a 3-dimensional coordinate system.
An electromagnetic wave, a pulse of radiofrequency (RF) energy, with the same
frequency as the precessing protons, is then applied to the body tissue. This generates a
resonance condition which excites the protons. As a consequence, the M0 vector along the z-
axis is flipped into the x-y plane. There is now a magnetization vector, Mxy, in the x-y plane
with an initial value equal to M0, precessing around the axis of the external magnetic field. A
receiver coil placed in the xy plane measures the net magnetization as the oscillating nature
of Mxy induces a current in the coil. This measured signal, which is referred to as the free
induction decay (FID), will reduce or decay due to proton relaxation processes which are
further described below. The time between each successive excitation pulse is termed the
repetition time, TR. For each RF pulse, the MR signal is sampled after a given delay (~ms),
which is referred to as the echo time, TE. The MR signal may be manipulated or sampled in

11
many different ways by multiple combinations of pulses and sampling processes, referred to
as pulse sequences.
1.1.2 Intrinsic contrast mechanisms
The versatility of MRI is achieved by exploiting contrast mechanisms to generate images.
The contrast mechanisms in MR imaging are based on tissue-specific parameters, utilized
with appropriate pulse sequence choice, sometimes with the application of a contrast agent.
Only the intrinsic and static contrast mechanisms T1, T2/T2* and proton density (PD) will
be presented below.
T1 relaxation time
The protons are in a state of high energy when excited and when the RF pulse is turned off,
they return to their equilibrium state which is by definition the lowest energy state of the two
possible. The protons release all their excess energy and realign with the axis of the external
magnetic field B0. Hence, the Mz vector will grow with a time constant T1, which is called
the longitudinal relaxation time or the spin-lattice relaxation time. T1 is tissue dependent and
is one of the main contrast parameters in MRI. The chemical environment the protons
experience in the tissue determines the rate of the relaxation of the protons (T1 relaxation
rate, R1, is defined as 1/T1). Free water molecules have a longer relaxation time than bound
or structured water molecules, resulting in different T1 values for the different types of
tissue. Fat and free water, such as the cerebrospinal fluid (CSF), are the two contrary tissues
when it comes to T1 relaxation rate. Strong tissue contrast on T1-weighted images is
obtained by choosing an optimal TR that maximises the contrast between tissues with a
slightly different T1 value (Figure 1). To obtain images with a strong T1 contrast, a short TR
and a short TE is normally chosen. In addition to being tissue-specific, the T1 relaxation rate
is also dependent on field strength, with shorter T1 at lower field strengths. Thus, the TR
must be optimised for the field strength applied.

12
Figure 1: T1 contrast
T2 relaxation time
One of the other main contrast parameters is the T2 relaxation time. When the RF pulse is
applied to the system and the longitudinal magnetic vector is flipped into the xy plane, all
the rotating protons are in the same phase and the net magnetization Mxy has its maximum
value. Immediately after the RF pulse is turned off the protons will start to dephase and Mxy
starts to decrease with a time constant T2. This effect is primarily related to the intrinsic
field variations due to adjacent protons, and is therefore referred to as spin-spin relaxation
time, or transverse relaxation time, since it takes place in the transverse (xy) plane. The
effect of the spin-spin interaction depends on the proximity of the protons to each other. In
water, the protons are separated more widely than in solid tissue and thus the dephasing
effect is not that prominent in water as in solid tissue. T2-weighting of an image is
emphasised by using long TR and long TE (Figure 2). The second cause of dephasing is due
to external magnetic field in-homogeneities. This makes the protons at different locations
precessing at different frequencies because each proton is exposed to a slightly different
external magnetic field strength. When this cause of dephasing is emphasised, the image is
T2*-weighted.
Figure 2: T2 contrast
The figure shows a T1-weighted image acquired on a 1.5 T system. The graphs to the left illustrate the tissue specific speed of T1 (recovery of Mz) and T2 relaxation (decrease of Mxy), and the optimum TR and TE for gray and white matter differentiation on T1-weighted images. Adapted from (1).
The figure shows a T2-weighted image acquired on a 1.5 T system. The graphs to the left illustrate the tissue specific speed of T1 (recovery of Mz) and T2 relaxation (decrease of Mxy), and the optimum TR and TE for gray and white matter differentiation on T2-weighted images. Adapted from (1).

13
Proton density
One of the simplest forms of MR contrast is PD imaging. The net magnetisation of each
voxel is composed of individual spins within that voxel. As the name implies, tissue contrast
is provided based on the sheer number of protons within a voxel, which differs across tissue
types. To maximise the proton density weighting of an image, the effects of T1 and T2 are
minimised by using long TR and short TE.
1.2 MR contrast agents in neuroimaging
In the early days of MRI, it was believed that there was no need for external contrast agents
in MR examinations. However, in the late eighties, the development of MR contrast agents
started in order to improve the definition of the internal structures and function of the body,
thereby making the method even more sensitive and the diagnosis more specific (10). MRI is
very sensitive to the effects of the contrast agent, allowing a significant reduction in contrast
agent dose compared to what is used in conventional X-ray imaging modalities. Contrary to
radiographic contrast agents, which change the local density and thus create a direct change
of the contrast in the image, MR contrast agents induce a change in the local magnetisation
in its surrounding tissue. Hence they have an indirect effect on the image contrast. It is the
magnetic properties of the contrast agent that is explored by MRI, and contrast agents affect
hydrogen magnetisation in two primary ways i) through direct relaxivity effects (changing
T1 and T2 relaxation rates of the tissue) or ii) through indirect susceptibility effects (11).
The contrast agent’s ability to induce signal changes through direct interactions with protons
in surrounding tissue is described by its relaxivity. The increase in relaxation rate (R1 = 1/T1
or R2 = 1/T2) per unit concentration of tracer (i.e. contrast agent) is the relaxivity r1,2= (R1,2b-
R1,2a)/ΔC, where r1,2 is measured in mM-1 s-1. Susceptibility relaxation is caused by
differences between the paramagnetic contrast and the surrounding tissue protons. This
contrast mechanism influences relaxation effects in tissue at longer distances than dipolar
relaxation. Due to its sensitivity to field inhomogeneities, it is primarily the transverse
relaxation rate that is affected by susceptibility relaxation (12).
Most contrast agents can be used to produce both effects, but in general one effect
dominates, depending on the concentration of the contrast agent, MR imaging techniques,
and tissue distribution properties. Contrast agents are often grouped into paramagnetic or

14
superparamagnetic contrast agents based on their magnetic properties. At present,
paramagnetic contrast agents are the most frequently used and have become an integrated
part of the daily practise of MRI (13, 14). Contrast agents are also termed positive and
negative contrast agents, due their dominating effect on the signal on the MR image (i.e.
signal enhancing due to dominating T1 effect or signal attenuating due to dominating T2
effect, respectively). Furthermore, MR contrast agents can be grouped according to their
biological distribution; extracellular fluid-contrast agents (ECF-agents), blood-pool agents or
targeted/tissue-specific agents. Low-molecular contrast agents are classified as ECF-agents
as they rapidly equilibrate between the intravascular and extravascular spaces. However, the
brain is different from the body as the contrast agent is retained intravascularly in the case of
an intact blood-brain-barrier (BBB). Contrast agents for cellular MR imaging are further
described in section 1.7.1.
1.2.1 Paramagnetic contrast agents
Gadolinium (Gd) is a lanthanide metal with paramagnetic properties and is the most
commonly used compound in MR contrast agents. As Gd is toxic, the compound is chelated,
and Gd-based contrast agents are regarded as safe and are well tolerated when injected
intravenously (i.v.) (15). First generation, or low-molecular weight Gd-based contrast agents
(~500 Da), such as Gd-DTPA (Magnevist, Schering/Berlex), Gd-DTPA-BMA (Omniscan,
Amersham Health), Gd-DO3A-butrol (Gadovist, Schering) and GdHP-DO3A (ProHance,
Bracco) share similar distribution and enhancement properties at lower field strengths (16)
(r1 ranging between and 3.4-3.8 mM-1 s-1 at 1.0 T). The typical relaxivity dependence on the
magnetic field for Gd-compounds is a maximum followed by a decline as the field strength
increases. The Gd-based agents are regarded as positive contrast agents as their predominant
effect is shortening of the T1 relaxation time, seen as hyperintensity on the MR image.
In the case of highly malignant brain tumours, the contrast agent leaks out into the
tumour tissue due to disruption of the BBB, and the regions with contrast enhancement may
correspond well with the solid tumour mass. However, Gd-enhancement is relatively non-
specific. For instance, it may be difficult to differentiate between radiation necrosis and
recurrent tumour after radiation therapy (17). More innovative developments in MR contrast
agent design have led to the emergence of new second generation Gd-based compounds
which differ from currently available agents in possessing markedly increased in vivo T1

15
relaxivity. Generally, second generation contrast agents also have a higher molecular weight
than the first generation Gd-based agents, and are regarded as blood-pool contrast agents.
The use of high relaxivity agents in diagnosis of brain tumours may improve detection and
delineation of the tumours, hence improving the sensitivity and differential diagnostic
processes (16). Macromolecular contrast agents may also give a better correlation between
histologic tumour grade and permeability parameters assessed by dynamic contrast enhanced
(DCE) imaging as demonstrated in animal models using albumin-Gd-DTPA-30 (18).
Gadomer (Schering AG, Germany) has also proved to be a promising contrast agent for early
detection of treatment effects or residual disease in tumours (19-21) and is suggested as an
important tool in future clinical settings (22). The role of MR imaging in the diagnosis and
follow-up of brain tumours is further described in section 1.6.
1.2.2 Superparamagnetic contrast agents
Iron-oxide or dysprosium based contrast agents are regarded as superparamagnetic contrast
agents. They are often termed negative contrast agents as their predominant effect is signal
attenuation due to shortening of the T2 relaxation time or susceptibility effect.
Superparamagnetic iron-oxide (SPIO) or ultrasmall SPIO (USPIO) are the most commonly
used negative contrast agents and the T2 and T1 relaxivity of a typical (U)SPIO is
substantially larger than the relaxivity of paramagnetic compounds (23). The observed
effects on signal intensity depend on several factors, including particle composition, particle
size, and concentration within a voxel. Most (U)SPIOs are classified as blood-pool contrast
agents and do not play a significant role in neuroimaging and brain tumour diagnosis yet.
However, the potential of using USPIOs in this regard has been investigated. Enochs and co-
workers observed that compared to Gd-chelates, long circulation SPIOs can provide
prolonged delineation of the margins of human brain tumours on MR images, which has
implications for the targeting of diagnostic biopsies and the planning of surgical resections
(24). Others have reported that USPIOs can not replace Gd-based contrast agents in the
diagnosis of brain tumours as the tumour volumes visualised on USPIO contrast enhanced
T1-weighted images do not correlate with contrast enhancement with Gd-based agents (17).
In a study where the tumour delineation was evaluated by T2 pulse sequences, demarcation
of the tumour border was difficult due to a blooming effect, but USPIOs seemed to enhance
delineation of neovascularisation (17). Zimmer and co-workers reported that phagocytosis of

16
monocrystalline iron-oxide particles (MION) by glioma cells has been observed in a rat
glioma model, which permitted determination of tumour margins (25). The role of (U)SPIOs
in cellular MR imaging is described in 1.7.1.
1.3 Primary brain tumours
Gliomas are tumours derived from glial cells (i.e. astrocytic, oligodendrocytic, ependymal or
mixed origin). Astrocytoma is the most frequently observed and accounts for approximately
65% of primary brain tumours. The most malignant of these, is the glioblastoma multiforme
(GBM). There are regional variances in the tumour incidence, with a higher frequency in
Europe, Australia and North-America (26). Within the Western world there are usually
around 6-11 new cases of primary intracranial tumours reported per 100.000 capita in men
and 4-11 in women, with an increasing frequency with increasing age (26). There has been a
growing number of gliomas reported per year in industrialised countries, which has been
attributed to the development of high-resolution neuroimaging techniques such as computer
assisted tomography (CT) and MRI. In the Nordic countries, the increase in incidence was
confined to the late 1970s, which coincided with the introduction of improved diagnostic
methods (27).
1.3.1 WHO classification
In keeping with the degree of aggressiveness, gliomas are divided into four grades according
to their biological behaviour. As different gliomas show a heterogeneous histological
appearance, the final classification includes both histological features and degree of
malignancy or anaplasia. At present, the classification system of the World Health
Organization (WHO) is used. Gliomas of astrocytic origin (astrocytomas) are classified into
pilocytic astrocytoma (Grade I), low-grade astrocytoma (Grade II), anaplastic astrocytoma
(Grade III), and GBM (Grade IV) (28). The significant indicators of anaplasia include
nuclear i) atypia, ii) brisk mitotic activity, iii) increased cellularity, iv) vascular proliferation,
and v) necrosis (see Table 1.3.1). Two distinct types of GBMs are recognised, based on their
clinical history. Primary GBMs are characterised by a very rapid development of clinical
symptoms, where approximately 50 % of the patients have a history of less than six months,
whereas secondary GBMs evolve from progression of low-grade astrocytoma and anaplastic

17
astrocytoma in the course of several years (mean 4-5 years) (29). Primary GBMs tend to
develop in older patients (mean age 50-55 years), while secondary GBMs have a peak at a
lower age (i.e. 40 years) (29).
Table 1: The WHO classification system of astrocytomas
WHO grade WHO designation Histological criteria
I Pilocytic astrocytoma None of the below criteria
II Astrocytoma (low-grade diffuse) Nuclear atypia
III Anaplastic astrocytoma Nuclear atypia and mitotic activity
IV Glioblastoma multiforme Nuclear atypia, mitosis, endothelial proliferation and/or necrosis
Neurological symptoms from glioma development depend mainly on the location of the
tumour within the brain. However, each glioma subtype has a specific prognosis that dictates
the clinical management. The length of the patient’s clinical history and the chance of a
long, recurrence-free survival are closely related to the histopathological characteristics of
the neoplasm. Despite advances in surgical and clinical neuro-oncology, mortality rates are
still high and GBM patients have a mean survival of less than a year after diagnosis. Also,
higher age is the strongest prognostic factor of poor survival of these patients (30).
1.3.2 The cellular origin of gliomas
The somatic mutation hypothesis
The predominant theory about the origin of gliomas is that these tumours develop from
somatic mutations in differentiated mature astrocytes or oligodendrocytes, which
subsequently undergo series of transformation steps to a less differentiated phenotype (31).
However, the somatic mutation hypothesis does not explain the perplexing paradox that
whilst normal glial cells tend to be morphologically homogeneous, malignant gliomas,
which are presumed to be of clonal lineage, display striking cellular heterogeneity.
Furthermore, the prognostic power of the WHO classification nomenclature relies mostly on
the tumour architectural features (28) (Table 1). There exists an inconsistency when lower
grade gliomas, exhibiting endothelial proliferation, are not classified as GBMs. Moreover,
18
not only are gliomas heterogeneous in their cellular morphology, but individuals with
malignant gliomas show marked variations in response to current treatment modalities.
The cancer stem cell hypothesis
An alternative hypothesis posits that subpopulations of cancer cells within tumours reflect
the developmental hierarchy of the normal tissue from which the tumour arose. This model
suggests that tumours are driven and maintained by a small subpopulation of cells that have
the capacity to self-renew and to generate a more differentiated progeny, which make up the
tumour mass (32, 33). This cell population has been termed cancer stem cells (CSC),
tumourigenic cancer cells, or tumour-initiating cells. Brain tumours could thus arise from
transformed neuroepithelial stem cells or glia precursor cells, which show capabilities of
self-renewal by asymmetric cell division. This may lead to a variety of brain tumour types
that harbour cell types that show different stages of cellular differentiation. In vitro analyses
of brain tumour cells sorted for CD133 expression (cell surface protein which is a marker for
stem cells such as NSCs), indicated that the capacity of self-renewal and proliferation
exclusively resides in the minority of CD133+ cell fraction, which may imply that this
surface protein may be a new cell surface marker for brain tumour stem cells (BTSC) (34).
In vivo experiments conducted by the same group showed that only the CD133+ cells were
capable of tumour initiation in the NOD-SCID (non-obese diabetic, severe combined
immunodeficient) mouse brain (35). The identification of brain tumour initiating cells may
provide insights into human brain tumour pathogenesis, giving strong support to the CSC
hypothesis as the basis for many solid tumours, and establishes a previously un-identified
cellular target for more effective cancer therapies (32, 36).
1.3.3 Brain tumour biology
To describe the biological properties of brain tumours in detail is beyond the scope this
thesis. However, some key features such as invasion and angiogenesis will be presented in
the following sections.
Diffuse invasion
Primary brain tumours are characterised by a diffuse local invasion of migrating tumour
cells that leads to a poor demarcation of the neoplasm. Invasion of tumour cells into normal
19
tissue is thought to be a multi-factorial process involving changes in cell morphology, cell-
cell and cell-extracellular matrix (ECM) adhesion interactions, and remodelling of the
extracellular space by proteases (37, 38). Migratory tumour cells exhibit a different
phenotype from non-migrating tumour cells as they may show reduced proliferation and loss
of normal cell regulatory mechanisms (38). These migrating cells represent a therapeutic
challenge as they give rise to recurrent tumours following surgical and chemo- and
radiotherapeutic interventions as further described in section 1.4.
Angiogenesis
Angiogenesis plays a key role in the pathogenesis of tumours and is essential for tumour
growth (31). Without angiogenesis, most solid tumours can not grow beyond 1-2 mm in
diameter. Normally there is a fine balance between stimulators and inhibitors of
angiogenesis but in malignant tumours, pro-angiogenic factors prevail, where vascular
endothelial growth factor (VEGF) is among one of the key stimulators of endothelial cell
proliferation (31, 39). The tumour tissue can recruit its blood supply through different
pathways such as i) vascular sprouting from pre-existing host vessels in the surrounding
normal tissues, ii) cooption of pre-existing host vessels, i.e. the tumour cells survive under
the existing host vasculature, and iii) recruitment of circulating bone-marrow derived
endothelial cells that develop new blood vessels within the tumour (39, 40). Angiogenesis is
usually linked to tumour aggressiveness. For gliomas there is a clear increase in
angiogenesis from low- to high-grade tumours (41).
1.4 Conventional and experimental treatment strategies
The current standard treatment approach for patients with high-grade gliomas consists of
surgical resection, preferably a gross-total resection of the solid tumour mass, followed by
radiotherapy and/or chemotherapy (42, 43). In general, the effect of treatment on the overall
prognosis has been limited, and the expected postoperative survival for GBM patients is less
than a year (30). GBMs are difficult to treat and represent a special treatment challenge due
to the following characteristics (44): i) invasive growth and spread of malignant cells into
brain parenchyma, ii) intrinsic resistance to conventional therapy, iii) the localisation of
tumours may preclude surgical resection, iv) limited capacity of the brain to repair itself, v)

20
variably disrupted BBB complicating effective drug-delivery, vi) tumour capillary leakage
with resulting peritumoural oedema and intracranial hypertension, and vii) neurotoxicity as a
result of aggressive treatment procedures. At present, there is a need for new and more
effective therapeutic modalities for malignant brain tumours, and a better understanding of
the biological properties of the tumour is essential. It may be that recent advances in
neuroimaging will give some answers regarding biological parameters related to a treatment
response. With a continued improvement in treatment and imaging techniques, there is a
hope that GBM may be a controllable disease. Research in gene therapy, antiangiogenic
therapy, and immunotherapies holds some promise (45) but to address these issues in detail
is beyond the scope of this thesis.
1.4.1 Neural stem cells as a potential treatment modality
The discovery and characterisation of a pool of neural stem cells (NSC) that persists into
adulthood and retain the capacity to self-renew and differentiate, has provided new avenues
for researchers to investigate mechanisms of brain tumour formation and treatment response.
To date, the neuro-biological findings using stem cells have been applied i) towards a better
classification of tumours to hopefully improve prognostics (46) and ii) as a potential vehicle
to improve delivery of therapeutic agents into brain tumours (47-50). Due to the inherent
pluripotency of NSCs, another potential role of such cells may be to repair tissue damage
caused by the brain tumours in situ and the neurological impairment that is frequently
associated with traditional cancer treatment approaches (51, 52).
The main characteristic of NSCs that make them attractive vehicles for targeted
delivery, is their tropism towards neoplasms. Aboody and colleagues where the first to
describe that modified exogenous NSCs injected at various sites (both ipsilateral and
contralateral hemisphere to the brain tumour, into the cerebral ventricles, and into systemic
circulation) had the capability to migrate over long distances towards the glioma. They also
reported that NSCs positioned themselves juxtaposed to glioma cells migrating away from
the main tumour mass (47), indicating that NSCs may mimic the migratory pattern of
infiltrating glioma cells (48). This can be exploited to target minute brain metastases and
infiltrating malignant satellites after tumour resection (53). NSCs also have the potential to
integrate into the host brain without disrupting normal tissue function (53). Exogenous NSCs
may be clonally expanded in tissue culture, providing a renewable supply of material for

21
transplantation. As they can be propagated for long periods, it also makes them amenable
genetic manipulation. Several groups have in recent years reported promising results using
NSC-based gene therapy in animal models of high-grade gliomas and different therapeutic
strategies have been developed, resulting in reduced tumour growth (47, 49, 54-56) and
extended survival (48, 57, 58). An intrinsic tumour-inhibitory effect of neural stem cells has
also been reported when NSCs were co-inoculated with glioma cells (59) or grafted into
established gliomas (48). NSCs may represent a vehicle for the delivery of genes and
proteins to brain tumours and the use of such cells also represent a targeted delivery
approach for substances that require distribution throughout the brain.
1.4.2 NG2 progenitor cells as a potential target for brain tumour therapy
Neuron-glial 2 (NG2)-expressing cells are the largest proliferating cell population in the
adult CNS (60). NG2 is a highly conserved chondroitin sulfate transmembrane proteoglycan
that is expressed on oligodendrocyte precursor cells of the developing and mature CNS (61).
The function of NG2-expressing cells is largely unknown but the cells are activated to
proliferate following different forms of CNS damage, such as mechanical injury,
excitotoxicity, viral infections and tumour development (62). Chekenya and co-workers have
previously reported increased NG2 expression in 13 out of 18 human GBMs. NG2 was
found to be expressed on both the tumour cells and by the associated vasculature (63). NG2
has also been shown to increase tumour cell proliferation in vitro, and to promote
angiogenesis in vivo, which predisposes animals to poorer survival outcomes by binding
angiostatin (64, 65). High NG2 expression also coincides with resistance to chemotherapy,
where it may be a novel regulator of chemoresistance (Chekenya et al, submitted). Thus,
NG2 plays a major role in tumour-stroma activation through alterations in cellular adhesion,
migration, proliferation, and vascular morphogenesis, and increased NG2 expression
correlates with an aggressive disease course (63). NG2 is expressed on the cell surface, and
due to its putative role in tumour-host interactions, it is suggested as an attractive candidate
for targeted brain tumour therapy (66-69).

22
1.5 Experimental glioma models
There is a considerable need for appropriate animal models in experimental neuro-oncology
(70). By using valid model systems, the genetic events leading to oncogenesis can be
studied, possible targets for tumour therapy can be identified, and knowledge about tumour
angiogenesis and invasion can be provided (71). Another rationale for using in vivo animal
models is to assess the efficacy of innovative treatment approaches. Rat brain tumour models
have extensively been used since the mid 1970’s (70). Initially, the tumours were induced by
using various neurotrophic carcinogens, later cell lines were generated from human GBMs
and then transplanted into the CNS of immunodeficient rats (71). The advantage of cell line-
based models is high efficacy with reproducible growth rate, survival time, and tumour
location. Moreover, immortalised cell lines are readily expanded in vitro, allowing almost
unlimited amounts of tumour material for experimental use. A major disadvantage of using
cell line-based systems is genetic and phenotypic deviations caused by the tissue culture
environment. To circumvent this problem GBM models have been initiated by short term
cultures of the patient’s biopsy material in the form of multicellular spheroids without
previous passaging in monolayers (72). When transplanted into the rat brain, tumours will
develop that show several biological features reflecting the original tumours in situ such as
extensive cell invasion and angiogenesis (72, 73). Another attractive approach for studying
brain tumours and treatment modalities is the use of transgenic animals but such models will
not be addressed in the current work.
1.6 MR imaging of brain tumours
The crucial role of neuroimaging in neuro-oncology include refinement of pre-operative
differential diagnosis, precise anatomical localisation, detection of response to treatment and
tumour progression, and recognition of treatment related side-effects (74). Cranial CT and
MRI are widely used for primary diagnosis of brain tumours (75), but MRI is the method
that provides the most comprehensive imaging information needed for patient diagnosis and
treatment evaluation, due to its high spatial resolution and high tissue contrast (75, 76).

23
1.6.1 Conventional MR imaging
The diagnosis of brain tumours by MRI is usually based on basic pre-contrast T1-weighted
and T2-weighted images and post-contrast T1-weighted images in one or two orthogonal
directions (76). Standard T1- and T2-weighted sequences detect brain tumours with high
sensitivity (75). The recognition of neoplasms is mainly based on the mass effect and signal
alterations caused by pathological processes due to tumour formation and progression. Most
tumours appear as hypointense on pre-contrast T1-weighted images (Figure 3 A) and
hyperintense on T2-weighted images (Figure 4 B) due to elongation of T1 and T2 relaxation
times caused by the presence of vasogenic oedema and/or tumour infiltration (75). On PD-
weighted images, brain tumours appear as hyperintense (75) (Figure 4 A). I.v. injections of a
positive contrast agent will in cases of a disrupted BBB cause a signal enhancement on T1-
weighted images due to leakage of the contrast agent from blood vessels into tumour tissue
(Figure 3 B-D). Secondary effects of a tumour, such as necrosis, haemorrhage, and
formation of cysts, modulate the appearance of tumours on MR images, which may make
them more conspicuous but at the same time more easily to be mistaken for non-neoplastic
lesions (76).
Figure 3: T1-weighted MR images of a patient with GBM
The figure shows T1-weighted MR images of a 53 year old male patient with GBM, acquired with a 3T GE Signa Excite (Haukeland University Hospital, images kindly provided by Turid Randa and Roger Barndon). A) a pre-contrast axial slice showing a hypointense region in the frontal lobe. B) corresponding slice acquired after i.v. injection of a Gd-based contrast agent, showing a non-enhancing central necrosis surrounded by a ring enhancement. C) and D) coronal and sagittal slices of the same patient, respectively.
24
These conventional MR imaging techniques are not sufficient for the grading and
specification of brain tumours but there are correlations between the appearance on MR
images and the histological features of gliomas, as a set of various MRI acquisition
parameters give a characteristic pattern of each tumour depending on tumour type and grade
(74, 75). Low-grade diffuse astrocytomas (WHO grade II) most often appear as homogenous
hyperintense on T2-weighted images and peritumoural oedema is usually not present. T1
post-contrast images do not give any evidence of abnormal contrast enhancement, which
indicates absence of tumour angiogenesis in these tumours. WHO grade III gliomas
(anaplastic astrocytomas) show typically nodular areas of contrast enhancement, moderate
expansion of affected brain regions due to increased cellularity, and in some cases vasogenic
oedema surrounding the main tumour mass (74). GBMs (WHO grade IV) show signs of
widespread peritumoural oedema and tumour infiltration, appearing as strongly hyperintense
areas on T2-weighted images. A distinct mass effect which may cause a mid-line shift
visible in all imaging sequences and a heterogeneous signal enhancement on T1 post-
contrast images are other typical GBM imaging characteristics. Areas of necrosis appear as
hypointense on T1 post-contrast images and if cystic, strongly hyperintense on T2-weighted
images. The presence and degree of tumour necrosis visible on MR images correlates with
clinical outcome and survival of patients with GBM (77).
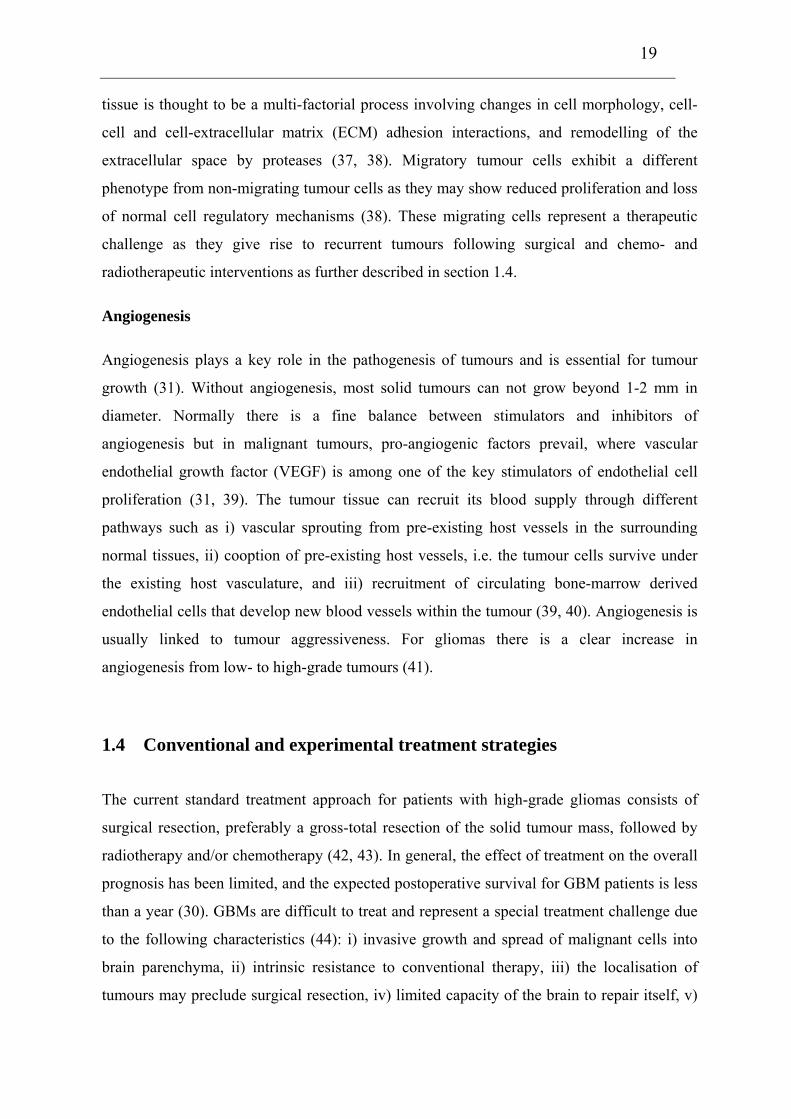
Figure 4: PD-weighted, T2-weighted and T2 FLAIR images of a patient with GBM
The figure shows MR images of the same patient as in figure 3 (images acquired at the same time-point). A) PD-weighted image with a modest hyperintense region, B) T2-weighted image where the tumour and the peritumoural oedema appear as hyperintense, C) the tumour region appear as hyperintense on the T2-weighted FLAIR image. The MR images are kindly provided by Turid Randa and Roger Bandon at Haukeland University Hospital.
Another MR imaging technique, suggested as a valuable tool for tumour diagnosis and
grading, is the fluid attenuated inversion recovery (FLAIR) sequence (78) (Figure 2 C). The

25
FLAIR sequence is either T1- or T2-weighted, with an inversion recovery which eliminates
the signal from cerebral spinal fluid (CSF). T2-weighted FLAIR is extensively used for
diagnosis of for example multiple sclerosis. In the case of low-grade astrocytomas, lesions
have been demonstrated with greater conspicuity than with conventional T2-weighted
sequences (79). T2-weighted FLAIR can also be used to differentiate the tumour mass from
oedema in cases where the solid tumour induces a strong hyperintensity in T2-weighted
images (78). Recent studies have reported that post-contrast FLAIR sequences due to a
marked T1 effect, may improve the depiction of brain tumours by a distinct contrast
enhancement, resulting in higher tumor-to-background contrast ratio compared with standard
imaging techniques (80, 81).
1.6.2 Functional MR imaging of brain tumours
Advances in MRI allow studies of physiological processes in time and analysis of tumour
tissue properties such as perfusion, angiogenesis and water mobility within the tissue.
Morphologic imaging may not always meet the need for characterising biological processes,
and the above mentioned parameters may serve as surrogate markers for these (82).
Functional MRI methods such as dynamic contrast enhanced T1-weighted imaging (DCE-
MRI), dynamic susceptibility contrast imaging (DSC-MRI), and diffusion weighted imaging
(DWI) are presented below.
DCE-MRI and DSC-MRI
Quantification of the tumor angiogenesis status might serve both as a prognostic index for
the specific tumour examined and as a tool for monitoring effects of antiangiogenic or
antivascular treatment (83-86). To assess angiogenesis, DCE-MRI or DSC-MRI can be
applied to quantitatively characterize certain tumor microvascular properties, including
richness of vascular supply and vascular endothelial leakiness or permeability.
DCE-MRI is performed in order to achieve non-invasive assessment of vascular
permeability. After baseline images are acquired, the contrast agent is injected i.v. and the
time course of the tracer is followed by dynamic T1-weighted imaging. T1-weighted kinetic
enhancement curves have three distinct phases; the up-slope, maximum enhancement and
the wash-out. It is generally recognised that the up-slope gradient in tumours is highly
dependent on tissue perfusion and permeability. Maximum enhancement is related to the

26
total uptake of the contrast medium in the extravascular extracellular space (EES) and the
wash-out rate is associated with the decrease of tissue contrast agent concentration and is
related to vascular permeability (83). Depending on the molecular size of the contrast agent
used, the acquisition time needed to follow the course of the tracer varies from 3-4 to 30
minutes with a typical temporal resolution of 10-30 seconds.
Quantification of microvascular permeability parameters is done by implementing
pharmacokinetic models that estimates the permeability of the tracer as a surrogate marker.
Three major models have been reported for leakage studies (87-89). The methodologies for
permeability quantification have been reviewed and a consensus has been reached (90).
Common parameters to describe permeability are Ktrans and kep, where the former is related
to the product of vessel surface and vessel permeability, and kep reflects transfer from the
EES to the plasma. Newly formed vessels exhibit transendothelial leakage and the rate of
diffusion of the tracer from the vessels is a reflection of the integrity of the microvessel wall.
As a consequence of high angiogenic activity, high-grade tumours may have more leaky
vessels (41). Increased vessel permeability is related to the histological grade of the glioma,
and positive correlations between vascular parameters assessed by DCE-MRI and glioma
aggressiveness (91, 92) and length of patient survival have been reported (92). Parametric
maps of permeability transfer constants and blood volume may display regional differences
in the distribution of kinetic parameters within brain tumours (91, 93, 94), and provide
unique insights into tumour structure, function and response to treatment. DCE-MRI is
increasingly being used to evaluate antiangiogenic and antivascular therapy agents in early
stage clinical trials, and guidelines to perform clinical trials effectively with DCE-MRI have
been made (85, 86).
Dynamic T2/T2*-weighted sequences can be designed to be sensitive to the vascular
phase of contrast agent delivery. Signal changes reflect tissue perfusion and cerebral blood
volume (CBV). In recent years, assessment of vascular permeability has also been achieved
by DSC-MRI, and a positive correlation between tumour aggressiveness and vessel leakiness
using this method have been reported (95-97). CBV obtained with DSC-MRI can be used to
predict the histopathological grade of tumours as CBV is generally higher in high-grade
gliomas (grade III and IV) than in grade II gliomas (95, 98, 99). DSC-MRI is mainly carried
out by rapid T2/T2*-weighted acquisitions following the first pass of a contrast agent bolus
through the microcirculation of the region of interest (ROI), with a typical temporal

27
resolution of 1-2 seconds. As the contrast agent follows the blood through the capillaries, it
induces a susceptibility effect seen as signal attenuation on the T2/T2*-weighted images. To
date, MR measurements of CBV have been evaluated for assessment of tumour
aggressiveness, selection of biopsy location, evaluation of treatment response, and
differentiation of recurrent tumour from treatment effects such as radiation necrosis (82).
DWI
DWI is sensitive to the microscopic Brownian movement of water molecules in tissues.
Recently, DWI has gained considerable interest in the field of brain tumour imaging. Even
though there are conflicting results regarding the clinical implications of DWI and
quantification of the apparent diffusion coefficient (ADC), a general assumption is that
necrotic or cystic regions of a tumour appear to be hypointense on DW images. An increased
ADC in these regions has been reported (100-102), which may be used to differentiate brain
tumours from brain abscesses. Lower tumoural ADC values have been linked to high-grade
gliomas, whereas higher ADC values indicated low-grade gliomas (103, 104). Replacement
of the normal tissue with numerous tumour cells is likely to restrict the diffusion of water,
and a reduced ADC has been found in regions with higher cell densities (105). Also,
components of the extracellular matrix may influence the ADC values in gliomas. A
relationship between hyaluronan levels in the extracellular matrix and ADC values has been
proposed for both high-grade and low-grade gliomas (106). Regions with vasogenic oedema
have revealed increased diffusion properties compared to normal and tumour tissue (107,
108) (Figure 5). Pre-clinical settings have also shown that diffusion MRI is an effective tool
for evaluation of treatment response and development of drug resistance (109, 110) and may
serve as and indicator of survival (110).
Figure 5: ADC map of a patient with GBM
The figure shows a parametric ADC map of the same patient as in Figure 3 and 4. The ADC map reveals an increased diffusion in the tumour region, indicating high degree of vasogenic oedema. The images are kindly provided by Turid Randa and Roger Barndon, Haukeland University Hospital.

28
1.7 Cellular MR imaging
Cellular and molecular imaging is a relatively young but rapidly emerging field. In contrast
to conventional diagnostic imaging, it aims at identifying cellular or molecular abnormalities
that represent the basis of disease, rather than to image the end effect of these alternations
(111). In addition to MRI, a broad range of imaging modalities provides possibilities to
assess information related to physiology and pathology at a microscopic level, such as
magnetic resonance spectroscopy (MRS), positron emission tomography (PET), single
photon emission tomography (SPECT), optical imaging (OI), and bioluminescence imaging
(BLI).
The boundary between cellular and molecular imaging is not distinct and areas of
overlap exists. In this context MRI can be classified into two categories, i.e. cellular MRI
and molecular MRI. Cellular MRI is less specific than molecular MRI, and can be defined as
the non-invasive and repetitive imaging of targeted cells and cellular processes in living
organisms, whereas molecular MRI refers to imaging of subcellular components in living
organisms (112). The development of in vivo cellular imaging by MRI allows the repeated
measurements of specific cell loss, cell migration and regeneration (113). Until recently, in
vivo studies of particular cell populations has been precluded by lack of appropriate
technology as snapshot images from ex vivo histological sections have provided the only
source to broaden our understanding of cellular dynamics. MRI-based tracking of specific
cell populations in animals was first described in 1990 (114) and has been further developed
in a number of laboratories (115-122).
1.7.1 Contrast agents for cellular labelling
The imaging techniques used in cellular MRI do not differ from conventional MRI
techniques as T1-weighted or T2-/T2*-weighted sequences are commonly used to visualise
cells. It is thus the target and not necessarily the technique that differentiates between the
two. The cells must be labelled with MR contrast agents to distinguish them from the
surrounding tissue. As the incorporation of MR contrast agents into cells renders them
distinct from the surrounding tissue, it allows the in vivo identification and tracking of these
targeted cells by MRI. Cells can either be labelled in vitro prior to transplantation, or in vivo
by contrast agent injection into the blood stream or the ventricles of the brain (113).

29
Iron-oxide based contrast agents
Superparamagnetic iron-oxide (SPIO) or ultrasmall SPIO (USPIO) are the most commonly
used contrast agents for cell labelling, and the predominant effect of iron-oxide labelled cells
is signal attenuation on T2- or T2*-weighted images. The advantage of (U)SPIO particle
labelling is mainly due to i) the largest change in signal intensity per unit of metal, ii) iron is
biodegradable and can therefore be re-used or recycled by cells, iii) their surface coating,
mainly dextran, allows straightforward chemical linkage between functional groups and
ligands, iv) they can be detected by light and electron microscopy using staining techniques
such as Prussian Blue, and v) their magnetic properties can be changed by varying their size.
Recently, several groups reported in vivo tracking of single cells by incorporation of
micrometer-sized iron-oxide particles (MPIOs) (123) or SPIOs (124, 125) into cells. This
may lead to the early detection of cancer cell migration and more detailed information about
stem cell migration and homing. Generally, a drawback of using (U)SPIOs for cell labelling
is the blooming susceptibility artefact that involves an area substantially larger than the
localisation of labelled cells, due to clustering of iron-oxide particles within the endosomes
of the cells. The “black holes” induced by iron-oxide labelled cells also may be difficult to
differentiate from signal loss due to susceptibility artefacts or imperfect pulse sequences
(112). Moreover, distinguishing (U)SPIO-labelled cells from haemorrhage or necrosis is
difficult on T2-/T2*-weighted images due to similar signal characteristics and partial volume
effects from surrounding tissue (126).
Gd-based contrast agents
Contrast agents based on gadolinium or manganese represent an alternative labelling
method, as these contrast agents are predominantly positive, and signal gain is easier to
interpret than signal loss (113). Anderson and co-workers have reported promising results by
using gadolinium-fullerenol compounds (Gd@C82) for cellular labelling and detection with
MRI, also at high field strengths (126). The development of bimodal and multimodal
contrast agents may be of added value; for instance can contrast agents containing a
fluorescent dye provide the possibility to detect labelled cells with both MRI, fluorescent
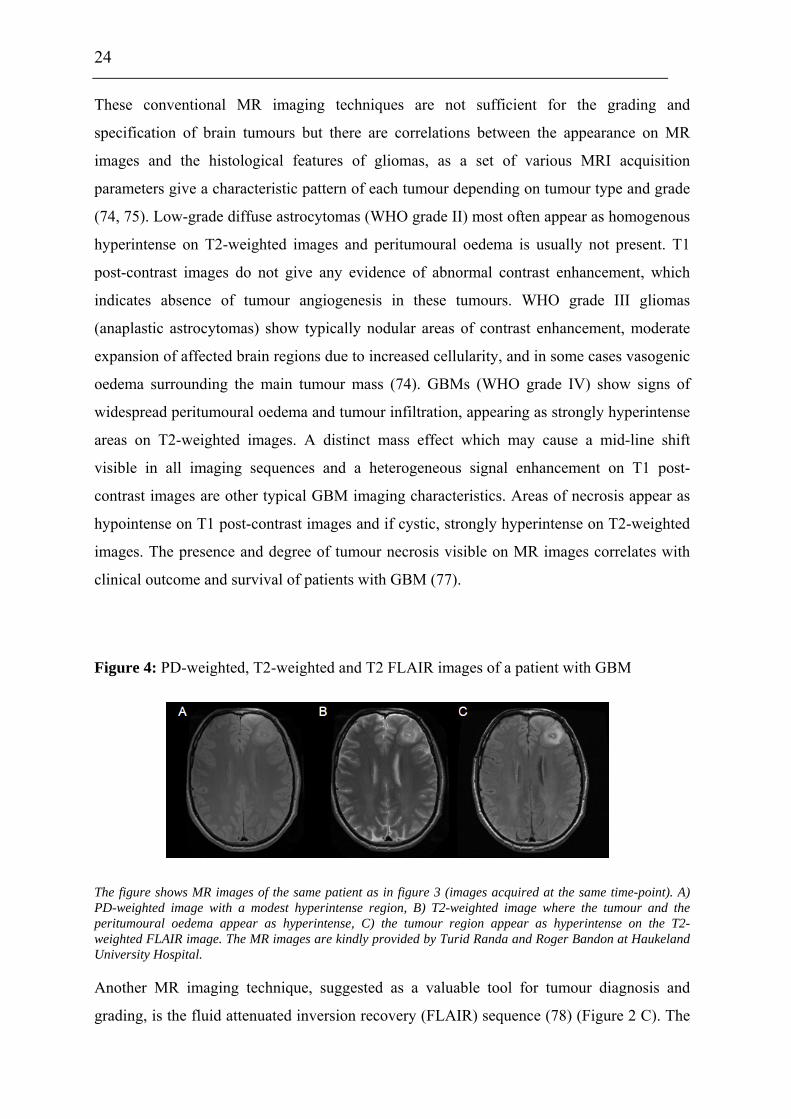
histology, and/or optical imaging (127, 128). Gadolinium Rhodamine Dextran (GRID) is an
example of a bimodal contrast agent with both paramagnetic and fluorescent properties
(127). GRID consists of a dextran polymer backbone, amino-modified (CH2)4-NH2 with
30
covalently attached Gd3+ chelates and tetramethylrhodamine and with a total molecular
weight of ~ 17 kDa (Figure 6). GRID has been used for tracking grafted NSCs in stroke
models (122, 129). The functional status of cells can be investigated by cellular
incorporation of responsive contrast agents that only influence the signal intensity after
enzymatic cleavage of the Gd-compound (130). Despite the versatility of Gd-based contrast
agents, the magnetic momentum of paramagnetic compounds is smaller than for iron-oxide
based agents, and hence a greater number of labelled cells is normally required to induce
signal change (131).
Generally, for both paramagnetic and superparamagnetic compounds, the detection
limits depend mainly on the concentration of the intracellular label and the spatial resolution
of the MR image, which is largely determined by the external field strength. In the case of
(U)SPIO, the detectability of labelled cells may be improved by modification of inhalation
gases, as the intrinsic T2* effect of large vessels is reduced by increasing the oxygen content
(132).
Figure 6: The bimodal Gd-based contrast agent GRID (gadolinium rhodamine dextran)
1.7.2 Cellular uptake
For cellular imaging, contrast agents are generally taken up by cells through: i)
phagocytosis, ii) receptors or receptor mediated endocytosis, or iii) pinocytosis. When cells
are incubated for several hours with high concentrations of Gd-based agents in the growth
The figure shows the molecular structure of GRID (kindly provided by Professor Tom Meade, Northwestern, Evanston, Il.).
31
medium, pinocytosis has shown to be an important mechanism for cellular uptake (133).
However, cells do not readily take up large compounds, but coating of particles with contrast
agents can significantly improve cellular uptake (134, 135). By mixing the (U)SPIO
formulation and the transfection agent, complexes of the two are formed through
electrostatic interactions (136). The complex is taken up by the cells through formation of
endosomes when added into the cell culture. Among commercially available (U)SPIO
formulations used for cell labelling are Feridex, Endorem, and Sinerem (137).
Regardless of the labelling method or type of contrast agent used, labelling of cells
should not impair cellular functions such as viability, proliferation, metabolism, migration
and differentiation (113) and this issue should be thoroughly addressed prior to in vivo
cellular imaging. Even though Gd-based contrast agents are chelated and non-toxic when
administered, a potential biological degradation will expose the cells to toxic metals. Further
work has to be done regarding the determination of long-term effects of cellular
incorporation of iron-oxide- or Gd-based contrast agents (112), and the long-term stability of
these compounds should be thoroughly investigated prior to clinical trials using cellular
imaging with MRI.
1.7.3 Implications of cellular MRI of the CNS using animal models
Stem cell-based therapy is currently finding its translation from bench to bedside (138-141).
As a part of this process, it is important to monitor the survival and differentiation of
transplanted cells, as well as the accuracy of cell delivery. Cellular MRI is in the process of
developing tools making this happen, and numerous studies have been performed to image
the fate of transplanted stem cells and immune cells in different animal models. In this
respect, prelabelling of cells with contrast agents is the most widely used method for cellular
imaging, and enables the detection of grafted cells by MRI. The early visualisation of
pathogenesis and evolution in an autoimmune condition, multiple sclerosis, was achieved by
prelabelling T-lymphocytes and then tracking the grafted cells in mice by in vivo MRI (142,
143). The capacity of magnetically labelled transplanted oligodendrocytes and their
precursor cells to (re)myelinate axons was demonstrated by Bulte and colleagues using
cellular MRI (116). Jendelova and co-workers visualised the fate of transplanted or i.v.
injected bone marrow stromal cells after inducing photochemical lesions in the cortex of the
rat brain (144). Several research groups have tracked the migration of magnetically labelled
32
stem cells of different origin from the seeding site over corpus callosum to the damaged
tissue in the contralateral hemisphere in rat brain with induced stroke (118, 122, 145). The
tropism of labelled neural progenitor cells to gliomas has also been evaluated by cellular
MRI (120), and tumour angiogenesis and neovasculature has been directly identified by
tracking the labelled endothelial precursor cells in glioma models (115, 146). Also, Jiang and
colleagues showed that neural progenitor cell induced angiogenesis after embolic stroke in
the rat brain (147).
Imaging of endogenous cells requires in vivo labelling of cells with contrast agents.
Shapiro and co-workers tracked the migratory pathway of endogenous neural precursor cells
in the rat brain by direct injection of MPIOs in the lateral ventricles near the subventricular
zone (148). Visualisation of damaged and regenerating optic nerves has been achieved by in
vivo labelling with manganese following intraocular injection of the contrast agent (149).
1.7.4 Clinical implications of cellular MRI
Direct imaging of pathological changes at the cellular/molecular level may provide a better
detection of the disease which may have an impact on treatment strategies and patient care
(111). So far, cellular MRI has mainly been used in experimental settings, but some clinical
trials have been conducted. de Vries and co-workers demonstrated the potential of using
cellular MRI for tracking therapeutic cells in melanoma patients as they were able to detect
Endorem-labelled T-cells in lymph nodes (150). Zhu et al. were able to track Feridex-
labelled NSC in a patient with brain trauma (151). However, an essential prerequisite of
cellular MRI of patients is that cellular tracking can not interfere with the routine assessment
of the disease. It is envisioned that cellular MRI will be a valuable tool for evaluating the
efficacy of cell-based therapy strategies in the future (113).
33
2.0 Aims of the thesis
Based on the introduction, it is clear that there is still a lack of knowledge in understanding
the progression and biological behaviour of glioma growth, as well as their response to new
treatment modalities. Therefore, the main aim of this thesis was to investigate brain tumour
phenotypes and brain tumour therapy strategies in animal models using forefront MR
imaging techniques, novel contrast agents and advanced data analysis strategies.
Paper I: To investigate brain tumour characteristics using multiparametric MR imaging and
subsequent multiparametric data analyses to identify NG2 as a mediator of aggressive
tumour cell behaviour in vivo.
Paper II: To evaluate the potential of GRID for cell tracking with cellular MRI by
investigating its relaxivity and its effects on labelled NSCs in vitro.
Paper III: To investigate the potential of NSCs as a vehicle for targeted therapy of brain
tumours using a rat glioma model and in vivo cellular multiparametric MRI.

34
3.0 Discussion
In this thesis, a broad range of MR imaging techniques has been applied to assess tumour
progression longitudinally and to evaluate cell-based treatment strategies. In vivo MR
findings have been corroborating ex vivo histological data, which is regarded as the method
of choice when evaluating tumour aggressiveness and tumour grading. MRI proved to be a
valuable tool for achieving both structural and functional information and provided
important information about the biological status of the gliomas. Also, we were able to track
the migration of magnetically labelled NSCs from the seeding site to the glioma region.
3.1 Experimental design
3.1.1 Experimental glioma models
In paper I, the U251 human glioma cell line was used. This cell line was initiated from a
biopsy taken from a 57 year old male patient diagnosed with GBM (152). To avoid rejection
of the grafted cells, human derived cell lines are usually xenotransplanted into immuno-
compromised mice or rats. The U251 tumour are pleomorphic, induce angiogenesis,
necrosis, and show progressive growth when injected into congenitally athymic animals
(152). This cell line was genetically modified to express NG2 (U251-NG2) (64).
Xenografted U251-NG2 cells give rise to more vascularised, structurally distinct lesions in
vivo (64). This model is therefore well suited to investigate whether the vasculature of NG2
positive tumours was structurally and functionally distinct from the NG2 negative tumour
vasculature.
In paper II and III, the CNS-1 rat glioma cell line was used in both in vitro and in
vivo assessments of the migratory potential of GRID-labelled NSCs. The CNS-1
astrocytoma is a chemically induced tumour derived from an inbred Lewis rat that had
received i.v. injection of N-nitroso-N-methylurea (NNU) weekly during a period of six
months (153). The CNS-1 tumour has been characterised as an astrocytoma based on its
immunoreactivity for glial fibrillary acidic protein (GFAP) and S100 protein. When
implanted intracranially into rats, the histopathological characteristics of the CNS-1 tumours
show many histopathological characteristics similar to those of human GBMs. CNS-1
35
tumours are highly angiogenic, show perivascular infiltration, and single cell migration into
brain parenchyma (153, 154), as well as necrosis with palisading cells in the tumour centre
(154). CNS-1 tumours also show extensive macrophage infiltration (155), as also seen in
human GBMs (156). All these biological characteristics make CNS-1 tumours an attractive
model for studying underlying mechanisms behind tumour progression, as well as novel
treatment strategies. Also, since the CNS-1 tumours exhibited many of the same
heterogeneous signal changes on MR images as detected in human GBMs, the model is well
suited for evaluating the applicability of using GRID for cell tracking.
3.1.2 Quantification of microvascular parameters
Perfusion is central to our understanding of the tumour microenvironment, and DCE-MRI is
one method that may provide this information. However, there are both biological and
methodological issues that may complicate accurate measurements of microvessel
permeability parameters. Tumour vasculature is highly disorganised, vessels are tortuous and
dilated with uneven lumen diameters and the blood flow may be chaotic and dysfunctional.
The vasculature in and around brain tumours exhibits a wide range of permeabilities, from
normal capillaries with essential no BBB leakage to tumour vasculature that freely passes
even large molecules. Thus, an important step towards measurements that are closely linked
to the underlying pathophysiology is to choose appropriate data analysis methods.
The enhancement kinetics of a tumour seen on T1-weighted images are dependent on
several factors, including tissue blood flow, capillary permeability to the contrast agent,
volume of extracellular space, inherent T1 relaxation time of the tissue, type and dose of
contrast agent used, as well as imaging sequence and parameters (157). Another important
issue is the potential occurrence and degree of spatial misregistation between image frames
in the dynamic imaging time series. To reduce a potential bias, the animals were carefully
immobilised. Thereafter post acquisition image co-registration and realignment were
performed (using corresponding control points with a normalised cross-correlation
technique, followed by conformal transformation from pairs of control points). The resulting
cine loops of dynamic images were then inspected visually.

36
Objective analyses of microvascular parameters can be performed by
semiquantitative analysis (measuring changes in signal intensity) or by fitting
pharmacokinetic models to tissue contrast agent concentration-time curves (converting
signal intensities to tissue concentrations). Semiquantitative parameters are relatively
straightforward to calculate but an important limitation is that they do not accurately reflect
the contrast agent concentration, are strongly dependent on acquisition parameters, and may
not be physiologically based (157).
Paper I was aimed at describing the functional status of vessels in tumours by
quantifying microvascular parameters using two different pharmacokinetic models
developed by Su and co-workers (19, 158, 159) and Tofts and colleagues (89, 90, 160). The
signal intensity curve was converted to tissue concentration based on the assumption that the
increase in T1 relaxation rate is proportional to the concentration of the tracer:
CT = [1/T1c – 1/T10] .1/r1,
where CT is the tissue concentration of the tracer in the tissue, T1c is the relaxation time at a
given tracer concentration, T10 is the relaxation time in the absence of the tracer, and r1 is the
contrast agent’s T1-relaxivity. Both models are also based on the following biological
assumptions: i) the tracer is well mixed in the plasma, ii) there are two compartments
available for the tracer; blood plasma and extravascular extracellular space (EES), and iii)
flow is larger then the depletion of the tracer due to leakage (i.e. permeability-limited
models). Also, they assume that there is a bi-directional exchange between the vessels and
EES, where D1 and Ktrans describe vessel-tissue leakage and K2 and kep the tracer’s wash-out
rate or rate constant from EES to blood (90, 158).
Su's model assumes that there is a slow to intermediate water exchange between the
vascular and extravascular compartments. Therefore, the intra- and extravascular spaces
relax with separate time constants. This allows an estimation of the fractional blood volume,
D0, which is related to the initial slope of the concentration-time curve (158). There may be
some concerns regarding the validity of the analysis. First, quick leakage of the contrast
agent into the extravascular space will lead to an over-estimation of the vascular space.
Second, the assumption of slow water exchange is not always correct. In the case of a
disrupted BBB, the transcapillary water exchange between intravascular and extravascular
spaces increases (161). With an i.v. bolus injection, the longitudinal relaxation rate of water

37
protons in blood immediately increases and may also initially elevate the R1 in tissue. Tofts'
model assumes fast water exchange between the intravascular and extravascular
compartments. This results in a uniform T1 relaxation in the tissue as the tissue relaxes
mono-exponentially with a relaxation rate given by the volume-weighted average of the
compartment's relaxation rates. Thus, the total tissue concentration is estimated and the
contribution of the intravascular tracer is neglected. However, in some cases such as brain
tumours with increased blood volume, the intravascular tracer could contribute to a large
portion of the observed tissue signal and give errors in the estimates of Ktrans (90).
Based on these issues, we implemented both models to see whether our findings were
mainly model dependent or if they could reflect genuine biological processes. When
evaluating the suitability of the models on our data, pixel-wise numerical "goodness-of-fit"
for the two pharmacokinetic models in different ROIs revealed that both models were well
fitted to the time-concentration curves. However, Su's models showed a better fit at higher
contrast agent concentrations, indicating that this model may be better in some cases (162).
Since there was a good correlation between the permeability parameters obtained with the
different pharmacokinetic models employed (i.e. D1 versus Ktrans, and K2 versus kep, (162)),
we were able to confirm that our findings are based on the biological differences between the
two glioma phenotypes. Also, estimates of the fractional blood volumes based on MRI data
were in concordance with estimates of MVD based on histological data. However, as we
presented our data as mean values of the total tumour region, the heterogeneity of
microvascular permeability may be masked. Tumour heterogeneity may be better visualised
when presenting data as the distribution of the microvascular parameters in histograms and
as voxel-wise parametric maps.
3.1.3 Multiparametric imaging and data analyses
Discrimination of the boundaries between malignant and normal tissue, and the evaluation of
cellular heterogeneity in lesions, has proven to be a limitation in conventional MRI. The use
of multiparametric or multispectral imaging and subsequent post image acquisition
processing techniques, such as multiparametric data analysis, may provide more accurate
information and hence, better tumour lesion characteristics. Multiparametric data analysis
refers to simultaneous image analysis of multiple images that provide complementary
information about the same scene (163, 164). After co-registration of the images as

38
described in section 3.1.2, we generated colour-coded images (RGB) from T2- (red channel),
FLAIR (green channel), and T1-weighted post-contrast (blue channel) images based on the
signal intensities (paper I). Each of the imaging sequences produced different tissue contrast.
Classification and estimation of tumour lesion subvolumes such as peritumoural oedema,
solid tumour tissue, and necrosis was performed by manual delineation on RGB images.
Three-dimensional scatter plots or feature maps derived from the multiparametric images,
displayed the simultaneous combination of the observed signal intensities, and were used as
a visual control for the classification of the different subvolumes. However, the manual part
of this procedure may induce interobserver or intraobserver variability, and automated
methods such as segmentation based on global or local thresholding, or seed growing
methods may be preferable (165).
In our multiparametric analysis of structural images we used three inputs (paper I),
based on the assumption that separation of different tumour subvolumes will be improved
using multiple imaging sequences. Because many tissues have overlapping MR signal
intensities in a given channel, the use of three input images will increase the discrimination
ability of different tumour subcompartments (165, 166).
When comparing contrast enhancement patterns of differently sized contrast agents
(paper I), two input channels were used. Regions within the tumour with signal enhancement
with Gadomer (green channel) and/or Gd-DTPA-BMA (red channel) were compared to
visualise the differences in vessel permeability of high- and low-molecular weight tracers,
respectively. A potential over- or under-estimation of the areas with signal enhancement
after Gadomer injection is possible due to partial volume effects induced by poor spatial
resolution of the DCE-MRI sequence. However, as differences in signal enhancement
patterns between the two contrast agents were striking, the multiparametric voxel-wise maps
may demonstrate important underlying biological mechanisms.
Multiparametric imaging also proved to be an important tool when evaluating tumour
progression and cell migration of magnetically labelled stem cells in paper III. The contrast-
to-noise ratio (CNR) was estimated in specific ROIs in different imaging sequences (i.e. T2-,
T2*-, and T1-weighted pre-contrast images) to visualise and quantify signal changes caused
by the labelled stem cells in specific areas. Albeit we did not perform multiparametric
analysis in terms of generating multiparametric maps, we were able to combine the
39
information obtained from the different imaging sequences, and demonstrate that changes in
CNR on the images were most likely due the migration and homing of magnetically labelled
cells into tumour tissue. Multiparametric imaging and subsequent CNR measurements also
revealed signal changes due to migration of labelled cells that were not easily detected by
the human eye.
3.1.4 Contrast agents
Due to their versatile properties, Gd-based contrast agents were used in all three studies.
Post-contrast T1-weighted images after i.v. injections of Gd-DTPA-BMA (molecular weight
= 0.58 kDa) were employed for tumour detection, delineation of the solid tumour, and
estimation of tumour volumes in paper I and III. While low-molecular weight Gd-based
contrast agents are effective in distinguishing defective and leaky tumour endothelium from
the normal counterparts, they only marginally discriminate the vasculature of distinct tumour
types (159). Gadomer was therefore used as a tracer in DCE-MRI for evaluation of the
microvascular permeability in tumours (paper I). This contrast agent is a dendritic
gadolinium chelate containing 24 Gd-ions with a molecular weight of 17 kDa but because of
its globular configuration, it has an apparent molecular weight of 30-35 kDa (167).
Microvascular permeability assays using macromolecular contrast agents correlates well
with histologic tumour grade (18), and seem to better reveal variations in tumour
permeability than contrast agents with lower molecular weight (19, 168). Our results (paper
I) support that notion. Earlier detection of changes in microvascular parameters after
treatment have also been reported using macromolecular contrast agents (19, 20, 169).
Moreover, high-molecular weight tracers as Gadomer may be more suitable for assessment
of microvascular parameters using permeability-limited, pharmacokinetic models since their
transport across the tumour vessels is slower than with low-molecular weight Gd-based
contrast agents (170).
Cells were labelled with the bimodal contrast agent GRID to detect grafted NSCs in
the rat brain (paper III). As Gd-based contrast agents have an effect on both T1 and T2
relaxation rates, signal changes in both T1-weighted and T2-weighted images could be
expected. This may be of advantage when evaluating homing of labelled cells in tumour
regions with very heterogeneous MR signals. However, previous in vivo studies using GRID
reported signal attenuation on T2-weighted images but no signal enhancement on T1-
40
weighted images (122). This coincided with the in vitro signal intensity measurements in
paper II. Despite relatively high T1 relaxivity of GRID at 4.7 T, no signal changes where
detected in gels with labelled cells. This may be the result of sequestration, possible steric
changes, and other impediments to water access and favourable motion characteristics of the
contrast agent in the intracellular environment (126). However, the effect of intracellular
GRID on T1-weighted images may evolve over time as higher concentrations of Gd inside
the cells may quench the observed relaxivity (171). Despite being conditionally
immortalised, the murine neural stem cells MHP36 may undergo 2-3 cell divisions before
ceasing to proliferate in non-permissive conditions. This will result in a lower intracellular
Gd-concentration over time before stabilising. Although it has been previously demonstrated
that GRID does not leak from viable cells (119), the death of cells can result in GRID being
present in the extracellular environment. It is therefore possible that signal increase on T1-
weighted images was partly due to GRID that has been released by the death of some NSCs.
Although cells labelled with GRID were detected by multiparametric imaging, it would be
beneficial if the effects on image contrast on T1-weighted images were more pronounced,
especially in pathological processes that exhibit a heterogeneous appearance on MR images.
It is therefore desirable to identify an agent that will exert a strong T1 effect intracellularly
as well as a T2 effect, allowing detection of cells in disease models in which the cells need
to be conspicuous versus the tissue, and where cell numbers of interest may be low.
3.2 Experimental findings
3.2.1 NG2 expression mediates an aggressive glioma phenotype
In paper I, the effects of NG2 on tumour progression were investigated. The tumours were
longitudinally monitored in vivo using multiparametric MRI to assess vascular permeability,
solid tumour volumes, vasogenic oedema and necrosis. This was done to determine whether
NG2 expressing tumours showed different growth characteristics compared to its U251-WT
(WT) wild type counterparts. The microvasculature of U251-NG2 tumours exhibited
increased vessel leakiness expressed by higher D1- and Ktrans - values compared to WT
tumours. Also, estimates of D0 as a measure of fractional blood volume revealed that NG2
expressing tumours had a larger blood supply than WT tumours. Immunohistochemistry and

41
electron-microscopy showed that the U251-NG2 tumours had a higher microvascular density
(MVD) with vessels that displayed larger gaps between endothelial cells. Thus, tumour cells
can regulate both the function and structure of the host derived tumour vasculature through
NG2 expression, suggesting a role of NG2 in the cross-talk between tumour-host
compartments.
NG2 expressing tumours also exhibited different features compared to WT tumours
regarding tumour growth, vasogenic oedema and necrosis. U251-NG2 tumours rapidly
developed with an accelerated expansion of the solid tumour mass, reflected by a shorter
tumour volume doubling time than WT tumours. Development of MR visible necrotic foci
correlated well with shorter survival of the U251-NG2 animals compared to the WT
recipients. Our results showed that U251-NG2 tumour bearing animals developed vasogenic
oedema in the surrounding brain parenchyma to a larger extent than WT animals, indicating
that NG2 may play a role in the disruption of the BBB. This is an important finding as
mechanisms of oedema formation in brain tumours are linked to tumourigenesis, and
peritumoural oedema is a significant source of morbidity and mortality (172).
3.2.2 Signal enhancement with differently sized contrast agents
Qualitative analysis of the contrast enhancement pattern using different contrast agents
revealed spatial heterogeneity in uptake depending on their molecular size (paper I). There is
a spatial heterogeneity in blood supply of the solid tumour mass. Coupled with increased
interstitial pressure centrally in the tumour, which lowers the extravasation of fluid and
blood-borne molecules especially for macromolecular substances (173), it may explain the
different contrast enhancement pattern between Gd-DTPA-BMA and Gadomer in these
regions. Contrast enhancement with Gd-DTPA-BMA revealed a more homogeneous pattern,
most likely due to a more rapid diffusion of smaller particles from the well-perfused
peripheral region towards low-perfused central regions. These differences in the spatial
tissue distribution of Gd-DTPA-BMA and Gadomer may indicate distinctive roles of the
contrast agent in characterisation and estimation of tumour microvascular function.
Treatment strategies based on blood-borne molecules are dependent on microvascular
perfusion, permeability, and finally, the diffusion of the substance through the interstitium
(174). Knowledge about spatial distribution of macromolecular particles is important for
treatment planning and for the prediction of treatment response to blood-borne therapeutic

42
agents. The pattern of contrast enhancement in solid tumour tissue after administration of
Gadomer may indicate the spatial distribution of therapeutic agents, and if so, it can be a
valuable tool in treatment planning of blood-borne substances. Our results also indicate that
Gd-DTPA-BMA, most likely due to higher permeability and faster diffusion, is better for the
delineation and visualisation of viable tumour tissue. Qualitative analysis of contrast
enhancement pattern also revealed pronounced differences in the uptake of different contrast
agents in the WT compared to the U251-NG2 tumours. This may be explained by a lower
permeability of large molecules in less aggressive tumours.
3.2.3 GRID visualises cells both in vitro, in vivo and ex vivo
The bimodal properties of GRID both allowed visualisation of labelled cells with
fluorescence microscopy and MRI, as well as investigations of the migratory potential of
labelled NSCs in vivo and ex vivo (paper III). In vitro identification of GRID-labelled cells
in gels was also possible with MRI (paper II). The cells were fully saturated with GRID
(100% labelling efficacy) after 16 hours of incubation as detected with both relative
fluorescence measurements and ICP-MS. This is important when evaluating the fate and
potential effects of the grafted labelled cells in vivo as the unlabelled fraction of cells will
not induce signal changes and can therefore not be detected by cellular MRI. A minimum
incubation time is desirable, and we found that 16 hours of incubation is acceptable. In
comparison, cell labelling with the iron-oxide based contrast agent Endorem required up to
72 hours of incubation to obtain sufficient uptake of the contrast agent (144). Fluorescent
micrographs demonstrated that intracellular GRID was located in the cytoplasm of MHP36
cells, and that cells could be detected up to one week after labelling in both permissive and
non-permissive conditions (paper II). In vivo experiments showed that signal changes
induced by labelled cells were detected by MRI 9 days after grafting, indicating good
cellular preservation of the contrast agent (paper III). These results are consistent with
previous findings (122, 129). GRID-labelled cells induced signal attenuation on T2-weighted
images and a modest signal enhancement on T1-weighted images, which were quantified by
CNR measurements (paper III).

43
3.2.4 GRID does not impair cellular functions of labelled cells in vitro
Attractive properties of NSCs in stem cell-based therapies are their potential to generate a
more differentiated progeny, capacity of self-renewal, and their motility as a response to
pathological cues. These issues were addressed in paper II. MHP36 cells showed preserved
differentiation after labelling with GRID as these cells developed into oligodendrocytes,
astrocytes and neurons under appropriate conditions. Compared to PKH26 labelled NSCs,
the migratory potential of GRID-labelled NSCs were not affected, indicating that labelled
cells keep their ability to respond to pathological processes.
The toxicity of GRID was also investigated in terms of viability, proliferation, and
metabolism. A significantly increased level of reactive oxygen species was seen in labelled
cells but this was not reflected in s decrease in viability. However, proliferation of GRID-
labelled NSCs dependent on the length of incubation, and cell counting revealed significant
decrease in proliferation after 16 and 24 hours of labelling. Confirming these results, a 3-
(4,5-dimethylthiazol-2-yl)-2,5 diphenyltetrazolium bromide (MTT) assay, showed a
reduction of mitochondrial activity after 24 hours of labelling. Decreased MTT ratio of
labelled cells with Gd-based agents compared with unlabelled cells has also been observed
by others (126). Decreased proliferation/metabolism in cells after labelling of Gd-based
agents may be due to possible interactions of released Gd-ions with calcium channels and an
interference with electron transport and mitochondrial function (175). However, high
viability of labelled cells indicates that Gd-ions are not released in cells, and that the reduced
mitochondrial activity is induced by other properties of GRID. The biological impact of the
reduction in mitochondrial activity may not be of biological significance as cellular
functions of labelled cells were not impaired. Based on this, GRID may be regarded as a
safe and reliable method for labelling cells in animal models. However, potential long-term
toxicity and the in vivo cellular effects of GRID and other Gd-based contrast agents should
be thoroughly investigated before employing this contrast agent as a cellular tracer in
humans.
3.2.5 NSCs as a therapeutic modality in brain tumours
GRID-labelled NSCs exhibited transhemispheric migration from the seeding site to the
tumour regions in rat brains as demonstrated both with in vivo serial cellular MRI and with

44
ex vivo histological assessments (paper III). This confirms previous observations showing
that NSCs are attracted by signals derived from the tumour (47, 55). NSCs respond to three
physiological processes that are common to many brain pathologies: inflammation, reactive
astrocytosis and angiogenesis (53). A potential intrinsic tumour-inhibitory effect of grafted
NSCs was observed, reflected by a decreased tumour doubling time and reduced vasogenic
oedema in NSCs treated animals. The exact molecular mechanism for this intrinsic effect of
NSCs is not known but our findings confirm previous reports (48, 59). Cytolytic viruses and
genes coding for anti-tumor cytokines, pro-drug converting enzymes, and various
neurotrophic factors have all been engineered into engraftable NSCs for targeted delivery to
tumours (140). However, genetically modified, transplanted NSCs may persist in brain well
after their therapeutic action and continued expression of therapeutic molecules may show
negative effects on normal neighbouring tissues.
3.3 Concluding remarks
The recognition of NG2 as a progenitor/stem cell marker (69, 176) and its role in tumour
progression, illustrates the dual role of such immature cells in healthy and diseased CNS.
This thesis integrated both the pathological and the therapeutic effects of such cells in
gliomas.
Multiparametric MR imaging and data analyses revealed that the NG2 expressing
tumours have an increased vascular permeability and blood fraction, more prominent
vasogenic oedema and necrosis, as well as an accelerated tumour growth. Based on these
findings, we postulate that NG2 expression mediates a more aggressive glioma phenotype.
Its involvement in multiple facets of tumour cell biology, underlines its potential as a
possible therapeutic target.
MRI proved to be an important tool in evaluating NSCs as a vehicle to target the
tumour. Cellular MRI visualised the migration and homing of GRID-labelled NSC to brain
tumours. The Gd-based bimodal contrast agent GRID proved to be an efficient method to
label cells and allowed the detection of grafted cells by MRI both in vitro and in vivo. GRID
did not change the biological behaviour of labelled cells in vitro underlining the attractive
role of NSCs as therapeutic vehicles.

45
4.0 Future prospects
The potential use of NSCs in brain tumour therapy will most likely represent a
supplementary treatment approach that should not substitute conventional treatment
strategies (177). However, the unique ability of NSCs to "home in" on tumour cells followed
by the delivery of a desired gene product makes NSCs a very promising agent in brain
tumour therapy. An interesting strategy is to use genetically engineered NSCs to target
BTSCs which are believed to initiate tumourigenesis and maintain tumour growth. Normal
stem cells share many properties with cancer stem cells, most notably the trait of self-
renewal, and the question whether BTSCs are diseased NSCs has been raised (178, 179).
Thus, it will be imperative to secure that grafted cells can not be transformed into tumour-
initiating cells. Most stem cell-based gene therapy concepts are still in the preclinical
evaluation phase and will have to pass significant hurdles to become viable therapeutic
options. In this context it is important to assess potential hazards and outline safety measures
related to cell therapy approaches.
In vivo evaluation of the efficacy of stem cell-based therapy is possible using cellular
MRI and further developments of contrast agents for cellular labelling and FDA-approval of
these, will emphasise the role of cellular MRI. Functional MRI will most likely be an
integrated part in monitoring tumour progression and treatment response. More extensive
use of (semi)automated pattern recognition techniques for multispectral data analyses, where
conventional images are combined or replaced with pharmacokinetic maps and/or ADC
maps to generate multidimensional feature maps, will also provide valuable information.

46
References
1. Nitz WR, Reimer P. Contrast mechanisms in MR imaging. Eur Radiol 1999;9(6):1032-1046.
2. Huettel SA, Song AW, McCarthy G. Functional Magnetic Resonance Imaging. First ed. Sunderland, Massachusetts, USA: Sinauer Associates Inc., 2004.
3. Rabi II, Zacharias JR, Millmann S, Kush P. A new method of measuring nuclear magnetic moments. Phys Rev 1938;53:318.
4. Purcell EU, Torry HC, Pound RV. Resonance absorption by nuclear magnetic resonance in solids. Phys Rev 1946;69:37-38.
5. Bloch F. Nuclear Induction. Phys Rev 1946;70:460-474.
6. Bloch F, Hansen WW. Nuclear Induction. Phys Rev 1946;69:127.
7. Damadian R. Tumor detection by nuclear magnetic resonance. Science 1971;171(976):1151-1153.
8. Lauterbur PC. Image formation by induced local interactions: examples employing nuclear magnetic resonance. Nature 1973;242:190-191.
9. Haacke EM, Brown RW, Thompson MR, Venkatesan R. Magnetic Resonance Imaging ~ Physical Principles and Sequence Design. First ed: Wiley-Liss, 1999.
10. Brasch RC. Rationale and applications for macromolecular Gd-based contrast agents. Magn Reson Med 1991;22(2):282-287; discussion 300-283.
11. Donahue KM, Weisskoff RM, Burstein D. Water diffusion and exchange as they influence contrast enhancement. J Magn Reson Imaging 1997;7(1):102-110.
12. Barbier EL, den Boer JA, Peters AR, Rozeboom AR, Sau J, Bonmartin A. A model of the dual effect of gadopentetate dimeglumine on dynamic brain MR images. J Magn Reson Imaging 1999;10(3):242-253.
13. Weinmann HJ, Ebert W, Misselwitz B, Schmitt-Willich H. Tissue-specific MR contrast agents. Eur J Radiol 2003;46(1):33-44.
14. Bock JC, Henrikson O, Gotze AH, Wlodarczyk W, Sander B, Felix R. Magnetic resonance perfusion imaging with gadolinium-DTPA. A quantitative approach for the kinetic analysis of first-pass residue curves. Invest Radiol 1995;30(12):693-699.
15. Felix R, Heshiki A, Hosten N, Hricak H. Safety and risk of Gadolinium-GDTPA: Extended clinical experience after more than 20 million applications. In: Magnevist monograph. Berlin: Blackwell Wissenschafts-Verlag, 1998.
16. Essig M. MR imaging of CNS tumors: are all contrast agents created the same? Neuroradiology 2006;48 Suppl 1:3-8.

47
17. Taschner CA, Wetzel SG, Tolnay M, Froehlich J, Merlo A, Radue EW. Characteristics of ultrasmall superparamagnetic iron oxides in patients with brain tumors. AJR Am J Roentgenol 2005;185(6):1477-1486.
18. Daldrup H, Shames DM, Wendland M, Okuhata Y, Link TM, Rosenau W, et al. Correlation of dynamic contrast-enhanced MR imaging with histologic tumor grade: comparison of macromolecular and small-molecular contrast media. AJR Am J Roentgenol 1998;171(4):941-949.
19. Su MY, Wang Z, Nalcioglu O. Investigation of longitudinal vascular changes in control and chemotherapy-treated tumors to serve as therapeutic efficacy predictors. J Magn Reson Imaging 1999;9(1):128-137.
20. Kim YH, Choi BI, Cho WH, Lim S, Moon WK, Han JK, et al. Dynamic contrast-enhanced MR imaging of VX2 carcinomas after X-irradiation in rabbits: comparison of gadopentetate dimeglumine and a macromolecular contrast agent. Invest Radiol 2003;38(9):539-549.
21. Roberts TP, Turetschek K, Preda A, Novikov V, Moeglich M, Shames DM, et al. Tumor microvascular changes to anti-angiogenic treatment assessed by MR contrast media of different molecular weights. Acad Radiol 2002;9 Suppl 2:S511-513.
22. Goldberg SN. Science to practice: can we differentiate residual untreated tumor from tissue responses to heat following thermal tumor ablation? Radiology 2005;234(2):317-318.
23. Jung CW. Surface properties of superparamagnetic iron oxide MR contrast agents: ferumoxides, ferumoxtran, ferumoxsil. Magn Reson Imaging 1995;13(5):675-691.
24. Enochs WS, Harsh G, Hochberg F, Weissleder R. Improved delineation of human brain tumors on MR images using a long-circulating, superparamagnetic iron oxide agent. J Magn Reson Imaging 1999;9(2):228-232.
25. Zimmer C, Weissleder R, Poss K, Bogdanova A, Wright SC, Jr., Enochs WS. MR imaging of phagocytosis in experimental gliomas. Radiology 1995;197(2):533-538.
26. Ohgaki H, Kleihues P. Epidemiology and etiology of gliomas. Acta Neuropathol (Berl) 2005;109(1):93-108.
27. Lonn S, Klaeboe L, Hall P, Mathiesen T, Auvinen A, Christensen HC, et al. Incidence trends of adult primary intracerebral tumors in four Nordic countries. Int J Cancer 2004;108(3):450-455.
28. Kleihues P, Louis DN, Scheithauer BW, Rorke LB, Reifenberger G, Burger PC, et al. The WHO classification of tumors of the nervous system. J Neuropathol Exp Neurol 2002;61(3):215-225; discussion 226-219.
29. Kleihues P, Ohgaki H. Primary and secondary glioblastomas: from concept to clinical diagnosis. Neuro-oncol 1999;1(1):44-51.

48
30. Ohgaki H, Dessen P, Jourde B, Horstmann S, Nishikawa T, Di Patre PL, et al. Genetic pathways to glioblastoma: a population-based study. Cancer Res 2004;64(19):6892-6899.
31. Hanahan D, Weinberg RA. The hallmarks of cancer. Cell 2000;100(1):57-70.
32. Singh SK, Clarke ID, Hide T, Dirks PB. Cancer stem cells in nervous system tumors. Oncogene 2004;23(43):7267-7273.
33. Clarke MF, Fuller M. Stem cells and cancer: two faces of eve. Cell 2006;124(6):1111-1115.
34. Singh SK, Clarke ID, Terasaki M, Bonn VE, Hawkins C, Squire J, et al. Identification of a cancer stem cell in human brain tumors. Cancer Res 2003;63(18):5821-5828.
35. Singh SK, Hawkins C, Clarke ID, Squire JA, Bayani J, Hide T, et al. Identification of human brain tumour initiating cells. Nature 2004;432(7015):396-401.
36. Schulenburg A, Ulrich-Pur H, Thurnher D, Erovic B, Florian S, Sperr WR, et al. Neoplastic stem cells: a novel therapeutic target in clinical oncology. Cancer 2006;107(10):2512-2520.
37. Pilkington GJ. Tumour cell migration in the central nervous system. Brain Pathol 1994;4(2):157-166.
38. Berens ME, Giese A. "...those left behind." Biology and oncology of invasive glioma cells. Neoplasia 1999;1(3):208-219.
39. Carmeliet P, Jain RK. Angiogenesis in cancer and other diseases. Nature 2000;407(6801):249-257.
40. Folkman J, Beckner K. Angiogenesis imaging. Acad Radiol 2000;7(10):783-785.
41. Hashizume H, Baluk P, Morikawa S, McLean JW, Thurston G, Roberge S, et al. Openings between defective endothelial cells explain tumor vessel leakiness. Am J Pathol 2000;156(4):1363-1380.
42. Burton EC, Prados MD. Malignant gliomas. Curr Treat Options Oncol 2000;1(5):459-468.
43. Rainov NG, Soling A, Heidecke V. Novel therapies for malignant gliomas: a local affair? Neurosurg Focus 2006;20(4):E9.
44. Chamberlain MC. Treatment options for glioblastoma. Neurosurg Focus 2006;20(4):E2.
45. Hou LC, Veeravagu A, Hsu AR, Tse VC. Recurrent glioblastoma multiforme: a review of natural history and management options. Neurosurg Focus 2006;20(4):E5.
46. Recht L, Jang T, Savarese T, Litofsky NS. Neural stem cells and neuro-oncology: quo vadis? J Cell Biochem 2003;88(1):11-19.

49
47. Aboody KS, Brown A, Rainov NG, Bower KA, Liu S, Yang W, et al. Neural stem cells display extensive tropism for pathology in adult brain: evidence from intracranial gliomas. Proc Natl Acad Sci U S A 2000;97(23):12846-12851.
48. Benedetti S, Pirola B, Pollo B, Magrassi L, Bruzzone MG, Rigamonti D, et al. Gene therapy of experimental brain tumors using neural progenitor cells. Nat Med 2000;6(4):447-450.
49. Ehtesham M, Kabos P, Gutierrez MA, Chung NH, Griffith TS, Black KL, et al. Induction of glioblastoma apoptosis using neural stem cell-mediated delivery of tumor necrosis factor-related apoptosis-inducing ligand. Cancer Res 2002;62(24):7170-7174.
50. Herrlinger U, Woiciechowski C, Sena-Esteves M, Aboody KS, Jacobs AH, Rainov NG, et al. Neural precursor cells for delivery of replication-conditional HSV-1 vectors to intracerebral gliomas. Mol Ther 2000;1(4):347-357.
51. Noble M. Can neural stem cells be used to track down and destroy migratory brain tumor cells while also providing a means of repairing tumor-associated damage? Proc Natl Acad Sci U S A 2000;97(23):12393-12395.
52. Noble M, Dietrich J. Intersections between neurobiology and oncology: tumor origin, treatment and repair of treatment-associated damage. Trends Neurosci 2002;25(2):103-107.
53. Muller FJ, Snyder EY, Loring JF. Gene therapy: can neural stem cells deliver? Nat Rev Neurosci 2006;7(1):75-84.
54. Barresi V, Belluardo N, Sipione S, Mudo G, Cattaneo E, Condorelli DF. Transplantation of prodrug-converting neural progenitor cells for brain tumor therapy. Cancer Gene Ther 2003;10(5):396-402.
55. Schmidt NO, Przylecki W, Yang W, Ziu M, Teng Y, Kim SU, et al. Brain tumor tropism of transplanted human neural stem cells is induced by vascular endothelial growth factor. Neoplasia 2005;7(6):623-629.
56. Shah K, Bureau E, Kim DE, Yang K, Tang Y, Weissleder R, et al. Glioma therapy and real-time imaging of neural precursor cell migration and tumor regression. Ann Neurol 2005;57(1):34-41.
57. Ehtesham M, Kabos P, Kabosova A, Neuman T, Black KL, Yu JS. The use of interleukin 12-secreting neural stem cells for the treatment of intracranial glioma. Cancer Res 2002;62(20):5657-5663.
58. Lee J, Elkahloun AG, Messina SA, Ferrari N, Xi D, Smith CL, et al. Cellular and genetic characterization of human adult bone marrow-derived neural stem-like cells: a potential antiglioma cellular vector. Cancer Res 2003;63(24):8877-8889.
59. Staflin K, Honeth G, Kalliomaki S, Kjellman C, Edvardsen K, Lindvall M. Neural progenitor cell lines inhibit rat tumor growth in vivo. Cancer Res 2004;64(15):5347-5354.

50
60. Thallmair M, Ray J, Stallcup WB, Gage FH. Functional and morphological effects of NG2 proteoglycan deletion on hippocampal neurogenesis. Exp Neurol 2006;202(1):167-178.
61. Levine JM, Beasley L, Stallcup WB. Localization of a neurectoderm-associated cell surface antigen in the developing and adult rat. Brain Res 1986;392(1-2):211-222.
62. Chekenya M, Rooprai HK, Davies D, Levine JM, Butt AM, Pilkington GJ. The NG2 chondroitin sulfate proteoglycan: role in malignant progression of human brain tumours. Int J Dev Neurosci 1999;17(5-6):421-435.
63. Chekenya M, Enger PO, Thorsen F, Tysnes BB, Al-Sarraj S, Read TA, et al. The glial precursor proteoglycan, NG2, is expressed on tumour neovasculature by vascular pericytes in human malignant brain tumours. Neuropathol Appl Neurobiol 2002;28(5):367-380.
64. Chekenya M, Hjelstuen M, Enger PO, Thorsen F, Jacob AL, Probst B, et al. NG2 proteoglycan promotes angiogenesis-dependent tumor growth in CNS by sequestering angiostatin. Faseb J 2002;16(6):586-588.
65. Goretzki L, Lombardo CR, Stallcup WB. Binding of the NG2 proteoglycan to kringle domains modulates the functional properties of angiostatin and plasmin(ogen). J Biol Chem 2000;275(37):28625-28633.
66. Winkler F, Kozin SV, Tong RT, Chae SS, Booth MF, Garkavtsev I, et al. Kinetics of vascular normalization by VEGFR2 blockade governs brain tumor response to radiation: role of oxygenation, angiopoietin-1, and matrix metalloproteinases. Cancer Cell 2004;6(6):553-563.
67. Chekenya M, Pilkington GJ. NG2 precursor cells in neoplasia: functional, histogenesis and therapeutic implications for malignant brain tumours. J Neurocytol 2002;31(6-7):507-521.
68. Chekenya M, Immervoll H. NG2/HMP Proteoglycan as a Cancer Therapeutic Target. In: Sioud M, ed. Target discovery and validation reviews and protocols - Emerging molecular targets and treatment options. Totowa, New Jersey: Humana Press, 2007: 93-118.
69. Shoshan Y, Nishiyama A, Chang A, Mork S, Barnett GH, Cowell JK, et al. Expression of oligodendrocyte progenitor cell antigens by gliomas: implications for the histogenesis of brain tumors. Proc Natl Acad Sci U S A 1999;96(18):10361-10366.
70. Barth RF. Rat brain tumor models in experimental neuro-oncology: the 9L, C6, T9, F98, RG2 (D74), RT-2 and CNS-1 gliomas. J Neurooncol 1998;36(1):91-102.
71. Holland EC. Brain tumor animal models: importance and progress. Curr Opin Oncol 2001;13(3):143-147.
72. Bjerkvig R, Tonnesen A, Laerum OD, Backlund EO. Multicellular tumor spheroids from human gliomas maintained in organ culture. J Neurosurg 1990;72(3):463-475.

51
73. Sakariassen PO, Prestegarden L, Wang J, Skaftnesmo KO, Mahesparan R, Molthoff C, et al. Angiogenesis-independent tumor growth mediated by stem-like cancer cells. Proc Natl Acad Sci U S A 2006;103(44):16466-16471.
74. Henson JW, Gaviani P, Gonzalez RG. MRI in treatment of adult gliomas. Lancet Oncol 2005;6(3):167-175.
75. Jacobs AH, Kracht LW, Gossmann A, Ruger MA, Thomas AV, Thiel A, et al. Imaging in neurooncology. NeuroRx 2005;2(2):333-347.
76. Sartor K. MR imaging of the brain: tumors. Eur Radiol 1999;9(6):1047-1054.
77. Hammoud MA, Sawaya R, Shi W, Thall PF, Leeds NE. Prognostic significance of preoperative MRI scans in glioblastoma multiforme. J Neurooncol 1996;27(1):65-73.
78. Husstedt HW, Sickert M, Kostler H, Haubitz B, Becker H. Diagnostic value of the fast-FLAIR sequence in MR imaging of intracranial tumors. Eur Radiol 2000;10(5):745-752.
79. Hajnal JV, Bryant DJ, Kasuboski L, Pattany PM, De Coene B, Lewis PD, et al. Use of fluid attenuated inversion recovery (FLAIR) pulse sequences in MRI of the brain. J Comput Assist Tomogr 1992;16(6):841-844.
80. Kubota T, Yamada K, Kizu O, Hirota T, Ito H, Ishihara K, et al. Relationship between contrast enhancement on fluid-attenuated inversion recovery MR sequences and signal intensity on T2-weighted MR images: visual evaluation of brain tumors. J Magn Reson Imaging 2005;21(6):694-700.
81. Essig M, Knopp MV, Schoenberg SO, Hawighorst H, Wenz F, Debus J, et al. Cerebral gliomas and metastases: assessment with contrast-enhanced fast fluid-attenuated inversion-recovery MR imaging. Radiology 1999;210(2):551-557.
82. Cao Y, Sundgren PC, Tsien CI, Chenevert TT, Junck L. Physiologic and metabolic magnetic resonance imaging in gliomas. J Clin Oncol 2006;24(8):1228-1235.
83. Padhani AR. MRI for assessing antivascular cancer treatments. Br J Radiol 2003;76 Spec No 1:S60-80.
84. Preda A, van Vliet M, Krestin GP, Brasch RC, van Dijke CF. Magnetic resonance macromolecular agents for monitoring tumor microvessels and angiogenesis inhibition. Invest Radiol 2006;41(3):325-331.
85. Leach MO, Brindle KM, Evelhoch JL, Griffiths JR, Horsman MR, Jackson A, et al. Assessment of antiangiogenic and antivascular therapeutics using MRI: recommendations for appropriate methodology for clinical trials. Br J Radiol 2003;76 Spec No 1:S87-91.
86. Leach MO, Brindle KM, Evelhoch JL, Griffiths JR, Horsman MR, Jackson A, et al. The assessment of antiangiogenic and antivascular therapies in early-stage clinical trials using magnetic resonance imaging: issues and recommendations. Br J Cancer 2005;92(9):1599-1610.

52
87. Brix G, Semmler W, Port R, Schad LR, Layer G, Lorenz WJ. Pharmacokinetic parameters in CNS Gd-DTPA enhanced MR imaging. J Comput Assist Tomogr 1991;15(4):621-628.
88. Larsson HB, Stubgaard M, Frederiksen JL, Jensen M, Henriksen O, Paulson OB. Quantitation of blood-brain barrier defect by magnetic resonance imaging and gadolinium-DTPA in patients with multiple sclerosis and brain tumors. Magn Reson Med 1990;16(1):117-131.
89. Tofts PS, Kermode AG. Measurement of the blood-brain barrier permeability and leakage space using dynamic MR imaging. 1. Fundamental concepts. Magn Reson Med 1991;17(2):357-367.
90. Tofts PS, Brix G, Buckley DL, Evelhoch JL, Henderson E, Knopp MV, et al. Estimating kinetic parameters from dynamic contrast-enhanced T(1)-weighted MRI of a diffusable tracer: standardized quantities and symbols. J Magn Reson Imaging 1999;10(3):223-232.
91. Roberts HC, Roberts TP, Brasch RC, Dillon WP. Quantitative measurement of microvascular permeability in human brain tumors achieved using dynamic contrast-enhanced MR imaging: correlation with histologic grade. AJNR Am J Neuroradiol 2000;21(5):891-899.
92. Mills SJ, Patankar TA, Haroon HA, Baleriaux D, Swindell R, Jackson A. Do cerebral blood volume and contrast transfer coefficient predict prognosis in human glioma? AJNR Am J Neuroradiol 2006;27(4):853-858.
93. Ludemann L, Grieger W, Wurm R, Budzisch M, Hamm B, Zimmer C. Comparison of dynamic contrast-enhanced MRI with WHO tumor grading for gliomas. Eur Radiol 2001;11(7):1231-1241.
94. Zhu XP, Li KL, Kamaly-Asl ID, Checkley DR, Tessier JJ, Waterton JC, et al. Quantification of endothelial permeability, leakage space, and blood volume in brain tumors using combined T1 and T2* contrast-enhanced dynamic MR imaging. J Magn Reson Imaging 2000;11(6):575-585.
95. Law M, Yang S, Babb JS, Knopp EA, Golfinos JG, Zagzag D, et al. Comparison of cerebral blood volume and vascular permeability from dynamic susceptibility contrast-enhanced perfusion MR imaging with glioma grade. AJNR Am J Neuroradiol 2004;25(5):746-755.
96. Cao Y, Shen Z, Chenevert TL, Ewing JR. Estimate of vascular permeability and cerebral blood volume using Gd-DTPA contrast enhancement and dynamic T2*-weighted MRI. J Magn Reson Imaging 2006;24(2):288-296.
97. Provenzale JM, Wang GR, Brenner T, Petrella JR, Sorensen AG. Comparison of permeability in high-grade and low-grade brain tumors using dynamic susceptibility contrast MR imaging. AJR Am J Roentgenol 2002;178(3):711-716.

53
98. Aronen HJ, Gazit IE, Louis DN, Buchbinder BR, Pardo FS, Weisskoff RM, et al. Cerebral blood volume maps of gliomas: comparison with tumor grade and histologic findings. Radiology 1994;191(1):41-51.
99. Donahue KM, Krouwer HG, Rand SD, Pathak AP, Marszalkowski CS, Censky SC, et al. Utility of simultaneously acquired gradient-echo and spin-echo cerebral blood volume and morphology maps in brain tumor patients. Magn Reson Med 2000;43(6):845-853.
100. Park SH, Chang KH, Song IC, Kim YJ, Kim SH, Han MH. Diffusion-weighted MRI in cystic or necrotic intracranial lesions. Neuroradiology 2000;42(10):716-721.
101. Lai PH, Ho JT, Chen WL, Hsu SS, Wang JS, Pan HB, et al. Brain abscess and necrotic brain tumor: discrimination with proton MR spectroscopy and diffusion-weighted imaging. AJNR Am J Neuroradiol 2002;23(8):1369-1377.
102. Kim YJ, Chang KH, Song IC, Kim HD, Seong SO, Kim YH, et al. Brain abscess and necrotic or cystic brain tumor: discrimination with signal intensity on diffusion-weighted MR imaging. AJR Am J Roentgenol 1998;171(6):1487-1490.
103. Kono K, Inoue Y, Nakayama K, Shakudo M, Morino M, Ohata K, et al. The role of diffusion-weighted imaging in patients with brain tumors. AJNR Am J Neuroradiol 2001;22(6):1081-1088.
104. Yamasaki F, Kurisu K, Satoh K, Arita K, Sugiyama K, Ohtaki M, et al. Apparent diffusion coefficient of human brain tumors at MR imaging. Radiology 2005;235(3):985-991.
105. Sugahara T, Korogi Y, Kochi M, Ikushima I, Shigematu Y, Hirai T, et al. Usefulness of diffusion-weighted MRI with echo-planar technique in the evaluation of cellularity in gliomas. J Magn Reson Imaging 1999;9(1):53-60.
106. Sadeghi N, Camby I, Goldman S, Gabius HJ, Baleriaux D, Salmon I, et al. Effect of hydrophilic components of the extracellular matrix on quantifiable diffusion-weighted imaging of human gliomas: preliminary results of correlating apparent diffusion coefficient values and hyaluronan expression level. AJR Am J Roentgenol 2003;181(1):235-241.
107. Sinha S, Bastin ME, Whittle IR, Wardlaw JM. Diffusion tensor MR imaging of high-grade cerebral gliomas. AJNR Am J Neuroradiol 2002;23(4):520-527.
108. Muti M, Aprile I, Principi M, Italiani M, Guiducci A, Giulianelli G, et al. Study on the variations of the apparent diffusion coefficient in areas of solid tumor in high grade gliomas. Magn Reson Imaging 2002;20(9):635-641.
109. Chenevert TL, McKeever PE, Ross BD. Monitoring early response of experimental brain tumors to therapy using diffusion magnetic resonance imaging. Clin Cancer Res 1997;3(9):1457-1466.

54
110. Chenevert TL, Stegman LD, Taylor JM, Robertson PL, Greenberg HS, Rehemtulla A, et al. Diffusion magnetic resonance imaging: an early surrogate marker of therapeutic efficacy in brain tumors. J Natl Cancer Inst 2000;92(24):2029-2036.
111. Weissleder R, Mahmood U. Molecular imaging. Radiology 2001;219(2):316-333.
112. Bulte JW, Kraitchman DL. Iron oxide MR contrast agents for molecular and cellular imaging. NMR Biomed 2004;17(7):484-499.
113. Modo M, Hoehn M, Bulte JW. Cellular MR imaging. Mol Imaging 2005;4(3):143-164.
114. Ghosh P, Hawrylack N, Broadus J, Greenough WT, Lauterbur PC. NMR imaging of transplanted iron-oxide labelled cells in the brain. In: Proceeding of the 9th ISMRM; 1990, 1990: 1193.
115. Anderson SA, Glod J, Arbab AS, Noel M, Ashari P, Fine HA, et al. Noninvasive MR imaging of magnetically labeled stem cells to directly identify neovasculature in a glioma model. Blood 2005;105(1):420-425.
116. Bulte JW, Zhang S, van Gelderen P, Herynek V, Jordan EK, Duncan ID, et al. Neurotransplantation of magnetically labeled oligodendrocyte progenitors: magnetic resonance tracking of cell migration and myelination. Proc Natl Acad Sci U S A 1999;96(26):15256-15261.
117. Bulte JW, Douglas T, Witwer B, Zhang SC, Strable E, Lewis BK, et al. Magnetodendrimers allow endosomal magnetic labeling and in vivo tracking of stem cells. Nat Biotechnol 2001;19(12):1141-1147.
118. Hoehn M, Kustermann E, Blunk J, Wiedermann D, Trapp T, Wecker S, et al. Monitoring of implanted stem cell migration in vivo: a highly resolved in vivo magnetic resonance imaging investigation of experimental stroke in rat. Proc Natl Acad Sci U S A 2002;99(25):16267-16272.
119. Modo M, Cash D, Mellodew K, Williams SC, Fraser SE, Meade TJ, et al. Tracking transplanted stem cell migration using bifunctional, contrast agent-enhanced, magnetic resonance imaging. Neuroimage 2002;17(2):803-811.
120. Zhang Z, Jiang Q, Jiang F, Ding G, Zhang R, Wang L, et al. In vivo magnetic resonance imaging tracks adult neural progenitor cell targeting of brain tumor. Neuroimage 2004;23(1):281-287.
121. Shapiro EM, Skrtic S, Sharer K, Hill JM, Dunbar CE, Koretsky AP. MRI detection of single particles for cellular imaging. Proc Natl Acad Sci U S A 2004;101(30):10901-10906.
122. Modo M, Mellodew K, Cash D, Fraser SE, Meade TJ, Price J, et al. Mapping transplanted stem cell migration after a stroke: a serial, in vivo magnetic resonance imaging study. Neuroimage 2004;21(1):311-317.

55
123. Shapiro EM, Sharer K, Skrtic S, Koretsky AP. In vivo detection of single cells by MRI. Magn Reson Med 2006;55(2):242-249.
124. Heyn C, Ronald JA, Ramadan SS, Snir JA, Barry AM, MacKenzie LT, et al. In vivo MRI of cancer cell fate at the single-cell level in a mouse model of breast cancer metastasis to the brain. Magn Reson Med 2006;56(5):1001-1010.
125. Heyn C, Ronald JA, Mackenzie LT, MacDonald IC, Chambers AF, Rutt BK, et al. In vivo magnetic resonance imaging of single cells in mouse brain with optical validation. Magn Reson Med 2006;55(1):23-29.
126. Anderson SA, Lee KK, Frank JA. Gadolinium-fullerenol as a paramagnetic contrast agent for cellular imaging. Invest Radiol 2006;41(3):332-338.
127. Huber MM, Staubli AB, Kustedjo K, Gray MH, Shih J, Fraser SE, et al. Fluorescently detectable magnetic resonance imaging agents. Bioconjug Chem 1998;9(2):242-249.
128. Daldrup-Link HE, Rudelius M, Metz S, Piontek G, Pichler B, Settles M, et al. Cell tracking with gadophrin-2: a bifunctional contrast agent for MR imaging, optical imaging, and fluorescence microscopy. Eur J Nucl Med Mol Imaging 2004;31(9):1312-1321.
129. Modo M, Roberts TJ, Sandhu JK, Williams SC. In vivo monitoring of cellular transplants by magnetic resonance imaging and positron emission tomography. Expert Opin Biol Ther 2004;4(2):145-155.
130. Himmelreich U, Aime S, Hieronymus T, Justicia C, Uggeri F, Zenke M, et al. A responsive MRI contrast agent to monitor functional cell status. Neuroimage 2006;32(3):1142-1149.
131. Daldrup-Link HE, Rudelius M, Oostendorp RA, Settles M, Piontek G, Metz S, et al. Targeting of hematopoietic progenitor cells with MR contrast agents. Radiology 2003;228(3):760-767.
132. Himmelreich U, Weber R, Ramos-Cabrer P, Wegener S, Kandal K, Shapiro EM, et al. Improved stem cell MR detectability in animal models by modification of the inhalation gas. Mol Imaging 2005;4(2):104-109.
133. Aime S, Barge A, Cabella C, Crich SG, Gianolio E. Targeting cells with MR imaging probes based on paramagnetic Gd(III) chelates. Curr Pharm Biotechnol 2004;5(6):509-518.
134. Bulte JW, Laughlin PG, Jordan EK, Tran VA, Vymazal J, Frank JA. Tagging of T cells with superparamagnetic iron oxide: uptake kinetics and relaxometry. Acad Radiol 1996;3 Suppl 2:S301-303.
135. Arbab AS, Bashaw LA, Miller BR, Jordan EK, Bulte JW, Frank JA. Intracytoplasmic tagging of cells with ferumoxides and transfection agent for cellular magnetic resonance imaging after cell transplantation: methods and techniques. Transplantation 2003;76(7):1123-1130.

56
136. Kalish H, Arbab AS, Miller BR, Lewis BK, Zywicke HA, Bulte JW, et al. Combination of transfection agents and magnetic resonance contrast agents for cellular imaging: relationship between relaxivities, electrostatic forces, and chemical composition. Magn Reson Med 2003;50(2):275-282.
137. Wang YX, Hussain SM, Krestin GP. Superparamagnetic iron oxide contrast agents: physicochemical characteristics and applications in MR imaging. Eur Radiol 2001;11(11):2319-2331.
138. Goldman S. Stem and progenitor cell-based therapy of the human central nervous system. Nat Biotechnol 2005;23(7):862-871.
139. Boyle AJ, Schulman SP, Hare JM, Oettgen P. Is stem cell therapy ready for patients? Stem Cell Therapy for Cardiac Repair. Ready for the Next Step. Circulation 2006;114(4):339-352.
140. Yip S, Aboody KS, Burns M, Imitola J, Boockvar JA, Allport J, et al. Neural stem cell biology may be well suited for improving brain tumor therapies. Cancer J 2003;9(3):189-204.
141. Lindvall O, Kokaia Z, Martinez-Serrano A. Stem cell therapy for human neurodegenerative disorders-how to make it work. Nat Med 2004;10 Suppl:S42-50.
142. Anderson SA, Shukaliak-Quandt J, Jordan EK, Arbab AS, Martin R, McFarland H, et al. Magnetic resonance imaging of labeled T-cells in a mouse model of multiple sclerosis. Ann Neurol 2004;55(5):654-659.
143. Oweida AJ, Dunn EA, Foster PJ. Cellular imaging at 1.5 T: detecting cells in neuroinflammation using active labeling with superparamagnetic iron oxide. Mol Imaging 2004;3(2):85-95.
144. Jendelova P, Herynek V, DeCroos J, Glogarova K, Andersson B, Hajek M, et al. Imaging the fate of implanted bone marrow stromal cells labeled with superparamagnetic nanoparticles. Magn Reson Med 2003;50(4):767-776.
145. Zhang ZG, Jiang Q, Zhang R, Zhang L, Wang L, Arniego P, et al. Magnetic resonance imaging and neurosphere therapy of stroke in rat. Ann Neurol 2003;53(2):259-263.
146. Arbab AS, Pandit SD, Anderson SA, Yocum GT, Bur M, Frenkel V, et al. Magnetic resonance imaging and confocal microscopy studies of magnetically labeled endothelial progenitor cells trafficking to sites of tumor angiogenesis. Stem Cells 2006;24(3):671-678.
147. Jiang Q, Zhang ZG, Ding GL, Zhang L, Ewing JR, Wang L, et al. Investigation of neural progenitor cell induced angiogenesis after embolic stroke in rat using MRI. Neuroimage 2005;28(3):698-707.
148. Shapiro EM, Gonzalez-Perez O, Manuel Garcia-Verdugo J, Alvarez-Buylla A, Koretsky AP. Magnetic resonance imaging of the migration of neuronal precursors generated in the adult rodent brain. Neuroimage 2006;32(3):1150-1157.

57
149. Thuen M, Singstad TE, Pedersen TB, Haraldseth O, Berry M, Sandvig A, et al. Manganese-enhanced MRI of the optic visual pathway and optic nerve injury in adult rats. J Magn Reson Imaging 2005;22(4):492-500.
150. de Vries IJ, Lesterhuis WJ, Barentsz JO, Verdijk P, van Krieken JH, Boerman OC, et al. Magnetic resonance tracking of dendritic cells in melanoma patients for monitoring of cellular therapy. Nat Biotechnol 2005;23(11):1407-1413.
151. Zhu J, Zhou L, XingWu F. Tracking neural stem cells in patients with brain trauma. N Engl J Med 2006;355(22):2376-2378.
152. Bigner DD, Bigner SH, Ponten J, Westermark B, Mahaley MS, Ruoslahti E, et al. Heterogeneity of Genotypic and phenotypic characteristics of fifteen permanent cell lines derived from human gliomas. J Neuropathol Exp Neurol 1981;40(3):201-229.
153. Kruse CA, Molleston MC, Parks EP, Schiltz PM, Kleinschmidt-DeMasters BK, Hickey WF. A rat glioma model, CNS-1, with invasive characteristics similar to those of human gliomas: a comparison to 9L gliosarcoma. J Neurooncol 1994;22(3):191-200.
154. Regina A, Demeule M, Berube A, Moumdjian R, Berthelet F, Beliveau R. Differences in multidrug resistance phenotype and matrix metalloproteinases activity between endothelial cells from normal brain and glioma. J Neurochem 2003;84(2):316-324.
155. Kielian T, van Rooijen N, Hickey WF. MCP-1 expression in CNS-1 astrocytoma cells: implications for macrophage infiltration into tumors in vivo. J Neurooncol 2002;56(1):1-12.
156. Giometto B, Bozza F, Faresin F, Alessio L, Mingrino S, Tavolato B. Immune infiltrates and cytokines in gliomas. Acta Neurochir (Wien) 1996;138(1):50-56.
157. Brasch RC, Li KC, Husband JE, Keogan MT, Neeman M, Padhani AR, et al. In vivo monitoring of tumor angiogenesis with MR imaging. Acad Radiol 2000;7(10):812-823.
158. Su MY, Jao JC, Nalcioglu O. Measurement of vascular volume fraction and blood-tissue permeability constants with a pharmacokinetic model: studies in rat muscle tumors with dynamic Gd-DTPA enhanced MRI. Magn Reson Med 1994;32(6):714-724.
159. Su MY, Muhler A, Lao X, Nalcioglu O. Tumor characterization with dynamic contrast-enhanced MRI using MR contrast agents of various molecular weights. Magn Reson Med 1998;39(2):259-269.
160. Tofts PS. Modeling tracer kinetics in dynamic Gd-DTPA MR imaging. J Magn Reson Imaging 1997;7(1):91-101.
161. Cao Y, Nagesh V, Hamstra D, Tsien CI, Ross BD, Chenevert TL, et al. The extent and severity of vascular leakage as evidence of tumor aggressiveness in high-grade gliomas. Cancer Res 2006;66(17):8912-8917.

58
162. Stålsett E. In vivo mapping of tumour microcirculation parameters using dynamic contrast enhanced MR imaging [Cand. scient thesis]. Bergen: University of Bergen, 2004.
163. Carano RA, Ross AL, Ross J, Williams SP, Koeppen H, Schwall RH, et al. Quantification of tumor tissue populations by multispectral analysis. Magn Reson Med 2004;51(3):542-551.
164. Duda RO, Hart. PE, Stork DG. Pattern Classification. 2nd ed. New York: Wiley-Liss, 2001.
165. Gordon J, Mohamed F, Vinitski S, Knobler RL, Curtis M, Faro S, et al. Utililization of experimental animal model for correlative multispectral MRI and pathological analysis of brain tumors. Magn Reson Imaging 1999;17(10):1495-1502.
166. Vinitski S, Gonzalez C, Mohamed F, Iwanaga T, Knobler RL, Khalili K, et al. Improved intracranial lesion characterization by tissue segmentation based on a 3D feature map. Magn Reson Med 1997;37(3):457-469.
167. Misselwitz B, Schmitt-Willich H, Ebert W, Frenzel T, Weinmann HJ. Pharmacokinetics of Gadomer-17, a new dendritic magnetic resonance contrast agent. Magma 2001;12(2-3):128-134.
168. Roberts TP. Physiologic measurements by contrast-enhanced MR imaging: expectations and limitations. J Magn Reson Imaging 1997;7(1):82-90.
169. Brasch R, Turetschek K. MRI characterization of tumors and grading angiogenesis using macromolecular contrast media: status report. Eur J Radiol 2000;34(3):148-155.
170. Verhoye M, van der Sanden BP, Rijken PF, Peters HP, Van der Kogel AJ, Pee G, et al. Assessment of the neovascular permeability in glioma xenografts by dynamic T(1) MRI with Gadomer-17. Magn Reson Med 2002;47(2):305-313.
171. Crich SG, Biancone L, Cantaluppi V, Duo D, Esposito G, Russo S, et al. Improved route for the visualization of stem cells labeled with a Gd-/Eu-chelate as dual (MRI and fluorescence) agent. Magn Reson Med 2004;51(5):938-944.
172. Papadopoulos MC, Saadoun S, Davies DC, Bell BA. Emerging molecular mechanisms of brain tumour oedema. Br J Neurosurg 2001;15(2):101-108.
173. Jain RK. Transvascular and interstitial transport in tumors. Adv Exp Med Biol 1988;242:215-220.
174. Jain RK. Delivery of novel therapeutic agents in tumors: physiological barriers and strategies. J Natl Cancer Inst 1989;81(8):570-576.
175. Tresley RM, Stone LA, Fields N, Maloni H, McFarland H, Frank JA. Clinical safety of serial monthly administrations of gadopentetate dimeglumine in patients with multiple sclerosis: implications for natural history and early-phase treatment trials. Neurology 1997;48(4):832-835.

59
176. Dore-Duffy P, Katychev A, Wang X, Van Buren E. CNS microvascular pericytes exhibit multipotential stem cell activity. J Cereb Blood Flow Metab 2006;26(5):613-624.
177. Yip S, Sabetrasekh R, Sidman RL, Snyder EY. Neural stem cells as novel cancer therapeutic vehicles. Eur J Cancer 2006;42(9):1298-1308.
178. Reya T, Morrison SJ, Clarke MF, Weissman IL. Stem cells, cancer, and cancer stem cells. Nature 2001;414(6859):105-111.
179. Bjerkvig R, Tysnes BB, Aboody KS, Najbauer J, Terzis AJ. Opinion: the origin of the cancer stem cell: current controversies and new insights. Nat Rev Cancer 2005;5(11):899-904.