INVESTIGATION OF COMBUSTION CHARACTERISTICS OF …
218
INVESTIGATION OF COMBUSTION CHARACTERISTICS OF INDIGENOUS LIGNITE IN A 150 KWT CIRCULATING FLUIDIZED BED COMBUSTOR A THESIS SUBMITTED TO THE GRADUATE SCHOOL OF NATURAL AND APPLIED SCIENCES OF THE MIDDLE EAST TECHNICAL UNIVERSITY BY AYKAN BATU IN PARTIAL FULFILLMENT OF THE REQUIREMENTS FOR THE DEGREE OF DOCTOR OF PHILOSOPHY IN CHEMICAL ENGINEERING MARCH 2008
Transcript of INVESTIGATION OF COMBUSTION CHARACTERISTICS OF …

INVESTIGATION OF COMBUSTION CHARACTERISTICS OF
INDIGENOUS LIGNITE IN A 150 KWT CIRCULATING FLUIDIZED BED COMBUSTOR
A THESIS SUBMITTED TO THE GRADUATE SCHOOL OF NATURAL AND APPLIED SCIENCES
OF THE MIDDLE EAST TECHNICAL UNIVERSITY
BY
AYKAN BATU
IN PARTIAL FULFILLMENT OF THE REQUIREMENTS FOR
THE DEGREE OF DOCTOR OF PHILOSOPHY IN
CHEMICAL ENGINEERING
MARCH 2008

Approval of the thesis:
INVESTIGATION OF COMBUSTION CHARACTERISTICS OF INDIGENOUS LIGNITE IN A 150KWT CIRCULATING
FLUIDIZED BED COMBUSTOR submitted by AYKAN BATU in partial fulfillment of the requirements for the degree of Doctor of Philosophy in Chemical Engineering Department, Middle East Technical University by,
Prof. Dr. Canan Özgen __________________ Dean, Graduate School of Natural and Applied Sciences Prof. Dr. Gürkan Karakaş __________________ Head of Department, Chemical Engineering Prof. Dr. Nevin Selçuk Supervisor, Chemical Engineering Dept., METU __________________ Assist. Prof. Dr. Görkem Külah Co-Supervisor, Chemical Engineering Dept., METU __________________ Examining Committee Members: Prof. Dr. İnci Eroğlu __________________ Chemical Engineering Dept., METU Prof. Dr. Nevin Selçuk __________________ Chemical Engineering Dept., METU Prof. Dr. Yavuz Samim Ünlüsoy __________________ Mechanical Engineering Dept., METU Assoc. Prof. Dr. Murat Köksal __________________ Mechanical Engineering Dept., Hacettepe University Assoc. Prof. Dr. Göknur Bayram __________________ Chemical Engineering Dept., METU
Date: 14.03.2008

iii
I hereby declare that all information in this document has been obtained and presented in accordance with academic rules and ethical conduct. I also declare that, as required by these rules and conduct, I have fully cited and referenced all material and results that are not original to this work.
Name, Last name : Aykan Batu Signature :

iv
ABSTRACT
INVESTIGATION OF COMBUSTION
CHARACTERISTICS OF INDIGENOUS
LIGNITE IN A 150 KWT CIRCULATING
FLUIDIZED BED COMBUSTOR
Batu, Aykan
Ph.D., Department of Chemical Engineering
Supervisor : Prof. Dr. Nevin Selçuk
Co-Supervisor : Assist. Prof. Dr. Görkem Külah
March 2008, 194 pages
Coal is today the fossil fuel which offers the greatest proven reserves. Due to
increasingly stringent environmental legislation, coal fired combustion systems
should be based on clean coal combustion technologies. For clean and efficient
energy generation from coal reserves, the most suitable technology known to date
is the ‘Fluidized Bed Combustion’ technology. Applications of circulating
fluidized bed combustion (CFB) technology have been steadily increasing in both
capacity and number over the past decade for the utilization of this resource.
Designs of these units have been based on the combustion tests carried out in pilot
scale facilities to determine the combustion and desulfurization characteristics of
the coals and limestones in CFB conditions. However, utilization of Turkish
v
lignites with high ash, volatile matter and sulfur contents in CFB boilers
necessitates adaptation of CFB combustion technology to these resources.
Therefore, it has been the objective of this study to investigate combustion
characteristics of an indigenous lignite in a circulating fluidized bed combustor.
In this study, a 150 kWt Circulating Fluidized Bed (CFB) Combustor Test Unit
was designed and constructed in Chemical Engineering Department of Middle
East Technical University, based on the extensive experience acquired at the
existing 0.3 MWt Bubbling Atmospheric Fluidized Bed Combustor (AFBC) Test
Rig. Following the commissioning tests, combustion tests were carried out for
investigation of combustion characteristics of Çan lignite in CFB conditions and
for comparison of the design of the test unit with experimental findings.
The steady state results of the combustion tests reveal that Çan lignite is fired with
high combustion efficiency. Temperature profile along the riser is achieved to be
almost uniform by good control of cooling system. Pressure drop through the
dilute zone is found to be negligible because of low solid hold up in this zone. CO
and NO concentrations within the flue gas are fairly lower, whereas N2O
concentration is higher compared to the ones obtained in the bubbling AFBC test
rig firing the same lignite. The deviation of particle size distributions of bottom
ash and circulating ash among the tests are in line with the deviation of superficial
velocity. In order to assess the validity and predictive accuracy of the pressure
balance model, it was reapplied to the test unit utilyzing the revised input data
based on the results of the combustion tests. Comparison of the model predictions
with experimental results revealed that the predictions have acceptable agreement
with the measurements. In conclusion, the performance of 150 kW CFBC Test
Unit was found to be satisfactory to be utilized for the long term research studies
on combustion and desulfurization characteristics of indigenous lignite reserves in
circulating fluidized bed combustors.
Keywords: CFBC, Combustion Test Unit, Turkish Lignites

vi
ÖZ
150 KWT DOLAŞIMLI AKI ŞKAN YATAKLI
YAKICIDA YERL İ LİNYİTİN YANMA
ÖZELL İKLER İNİN İNCELENMESİ
Batu, Aykan
Doktora, Kimya Mühendisliği Bölümü
Tez Yöneticisi : Prof. Dr. Nevin Selçuk
Ortak Tez Yöneticisi : Yrd. Doç. Dr. Görkem Külah
Mart 2008, 194 sayfa
Kömür, bugün en yüksek rezervlere sahip fosil yakıttır. Giderek katılaşan çevresel
mevzuatlardan dolayı, kömür yakıtlı yakma sistemlerinde temiz kömür yakma
teknolojileri kullanılmalıdır. Kömür kaynaklarından temiz ve verimli enerji eldesi
için en uygun teknoloji “Akışkan Yataklı Yakma” teknolojisidir. Bu kaynağın
değerlendirilmesinde dolaşımlı akışkan yataklı (DAY) yakıcı teknolojisinin
uygulamaları son on yılda hem kapasite hem de sayı olarak sürekli artmaktadır.
Bu ünitelerin tasarımı, DAY şartlarında yakıt ve kireçtaşının yanma ve
desülfürizasyon özelliklerinin belirlenmesi için pilot ölçekli tesislerde
gerçekleştirilen yakma testlerine dayandırılmıştır. Ancak, yüksek uçucu madde,
kükürt ve kül içeriği ile Türk linyitlerinin DAY kazanlarında değerlendirilmesi,
DAY yakma teknolojisinin bu yakıtlara adapte edilmesini gerektirmektedir. Bu

vii
nedenle, bu çalışmanın amacı yerli bir linyit kaynağının dolaşımlı akışkan yataklı
yakıcıda yanma özelliklerinin belirlenmesi olmuştur.
Bu çalışmada, mevcut 0,3 MWt Kabarcıklı Atmosferik Akışkan Yataklı Yakıcı
(AAYY) Test Ünitesi’nde elde edilen kapsamlı deneyimlere dayanarak bir adet
150 kWt Dolaşımlı Akışkan Yataklı Yakıcı Test Ünitesi tasarlanmış ve Orta Doğu
Teknik Üniversitesi Kimya Mühendisliği Bölümü’nde kurulmuştur. Devreye alma
testlerini takiben, Çan linyitinin DAY şartlarında yanma özelliklerini incelemek
ve test ünitesinin tasarım verilerini deneysel bulgularla karşılaştırmak için yakma
testleri gerçekleştirilmi ştir.
Yakma testlerinin yatışkın durum sonuçları, Çan linyitinin yüksek yanma
verimliliği ile yakıldığını göstermektedir. Soğutma sisteminin iyi idare edilmesi
sayesinde yakıcı boyunca sıcaklık profilinin neredeyse sabit olması sağlanmıştır. Seyrek bölgedeki düşük katı derişimi sebebiyle bu bölgedeki basınç düşümünün
kayda değer olmadığı bulunmuştur. Kabarcıklı AAYY test ünitesinde aynı linyit
yakılırken edinilen tecrübelerle karşılaştırıldığında, baca gazındaki CO ve NO
derişimleri oldukça düşük, N2O derişimi ise yüksektir. Yatak altı külü ve dolaşan
külün boyut dağılımlarındaki değişimler, deneyler arasındaki kolon hızı farkıyla
iyi bir uyum içindedir. Basınç denkliği modelinin geçerliliği ve öngörü
doğruluğunu test etmek amacıyla, test çalışmalarının sonuçlarına dayanan
düzeltilmiş girdi verileri kullanılarak model test ünitesine tekrar uygulanmıştır. Model öngörülerinin deneysel sonuçlarla karşılaştırılması, öngörülerin ölçümlerle
kabul edilebilir bir uyum içinde olduğunu göstermiştir. Sonuç olarak, 150 kWt
DAYY Test Ünitesinin başarımı, yerli linyit kaynaklarının dolaşımlı akışkan
yataklı yakıcılardaki yanma ve kükürt giderme özellikleri üzerine yapılacak uzun
dönemli araştırma çalışmalarında kullanım için tatmin edici bulunmuştur.
Anahtar Kelimeler: DAYY, Yakma Testi Ünitesi, Türk Linyitleri

viii
To Firuze

ix
ACKNOWLEDGMENTS I would like to express my deepest gratitude to my supervisor Prof. Dr. Nevin
Selçuk for all motivation and guidance she provided during this study and my
entire graduate study. I wish to show my appreciation to my co-supervisor, Assist.
Prof. Dr. Görkem Külah for her valuable efforts throughout the study. Thanks for
her support and patience during the completion of this thesis.
I also would like to thank to my friends in the FBC research team for their support
for completion of the study; Yusuf Göğebakan, Zuhal Göğebakan, Işıl Ayrancı,
Ahmet Bilge Uygur, Mehmet Moralı and the others that had worked in this
research team.
Special thanks to Dr.Olcay Oymak and Ümit Kırmızıgül for their endless support
till the end. The support by TÜBİTAK – TEYDEB supplied through R&D project
No. 3040029 executed by Mimag-Samko Inc., namely ‘Circulating Fluidized Bed
Combustor Test Unit’, is greatly acknowledged.
I would like to thank especially to my wife Firuze for her patience and support.
Finally, sincere thanks to my parents for their great support during all the study
and especially for their lifetime effort on me. My brother, Dr. Tuğkan Batu,
deserves special thanks for his guidance.

x
TABLE OF CONTENTS
ABSTRACT ......................................................................................................... iv
ÖZ ........................................................................................................................ vi
ACKNOWLEDGMENTS..................................................................................... ix
TABLE OF CONTENTS....................................................................................... x
LIST OF TABLES.............................................................................................. xvi
LIST OF FIGURES ............................................................................................ xix
LIST OF SYMBOLS ......................................................................................... xxii
CHAPTER
1. INTRODUCTION ...................................................................................... 1
1.1 Energy Review .....................................................................................2
1.1.1 World Energy Review................................................................ 2
1.1.1.1 World Energy Demand ................................................. 2
1.1.1.2 World Energy Resources .............................................. 3
1.1.2 Turkey Energy Review............................................................... 4
1.1.2.1 Energy Demand and Generation Projections ................. 4
1.1.2.2 Coal Reserves in Turkey ............................................... 5
1.1.2.3 Coal Fired Power Plants of Turkey ............................... 6
1.1.3 Fluidized Bed Combustion (FBC) Technology............................ 7
1.1.3.1 General Characteristics ................................................. 7
1.1.3.2 Advantages of FBC Technology ................................... 8
1.1.3.3 Types of FBCs.............................................................. 8
1.2 Literature Survey .................................................................................. 9

xi
1.2.1 CFB Boiler Design...................................................................... 9
1.2.2 CFB Test Facilities.................................................................... 11
1.3 Scope Of The Thesis........................................................................... 12
2. DESIGN STUDIES................................................................................... 17
2.1 Basic Design Studies .......................................................................... 17
2.1.1 Fuel Range Determination......................................................... 17
2.1.2 Design Basis And Assumptions................................................. 19
2.1.3 Mass Balance............................................................................ 25
2.1.3.1 Solid Input .................................................................. 25
2.1.3.2 Combustion Air .......................................................... 25
2.1.3.3 Flue Gas ..................................................................... 26
2.1.3.4 Flue Gas Composition................................................. 28
2.1.3.5 Ash Content................................................................ 28
2.1.3.6 Species Balance .......................................................... 28
2.1.3.7 Discussions On Mass Balance..................................... 29
2.1.4 Heat Balance............................................................................. 29
2.2 Detailed Design Studies ..................................................................... 32
2.2.1 Process And Instrumentation..................................................... 32
2.2.1.1 Flue Gas System......................................................... 33
2.2.1.2 Combustion Air System.............................................. 34
2.2.1.3 CFB Combustor.......................................................... 36
2.2.1.4 Solids Handling and Feeding System.......................... 37
2.2.1.5 Gas Analysis System .................................................. 39
2.2.2 Control System ......................................................................... 41
2.2.3 Equipment Design..................................................................... 42
2.2.3.1 Furnace....................................................................... 42
2.2.3.2 Cyclone ...................................................................... 42
2.2.3.3 Coal and Limestone Silos............................................ 46
2.2.4 Solids Holdup Profile snd Pressure Balance .............................. 46
2.2.4.1 Pressure Balance Model.............................................. 47
2.2.4.2 Pressure Drop Through Riser (∆Pr ) ............................ 48

xii
2.2.4.3 Pressure Drop Through Cyclone (∆Pc ) ....................... 53
2.2.4.4 Pressure Drop In The Loop Seal (∆Pls) ....................... 53
2.2.4.5 Pressure Balance For Downcomer (∆Pdc ) ................... 56
2.2.4.6 Solid Mass In Riser And Loop Seal ............................ 57
2.2.4.7 Input Data To The Pressure Balance Model ................ 58
2.2.4.8 Results Of The Pressure Balance Model...................... 59
2.2.4.9 Pressure Drop Profile.................................................. 60
2.2.5 Heat Transfer Analysis.............................................................. 62
2.2.5.1 Modules Without Cooling........................................... 63
2.2.5.2 Modules With Cooling................................................ 68
2.2.6 Detailed Design of Combustor .................................................. 70
2.2.6.1 Windbox Module ........................................................ 71
2.2.6.2 Distributor .................................................................. 71
2.2.6.3 Module-1 .................................................................... 73
2.2.6.4 Module-2 .................................................................... 73
2.2.6.5 Module-3 .................................................................... 73
2.2.6.6 Module-4 .................................................................... 74
2.2.6.7 Exit Module................................................................ 74
2.2.6.8 Instrument Ports.......................................................... 74
3. PROCUREMENT and INSTALLATION ................................................. 75
3.1 Procurement Activities........................................................................ 75
3.1.1 Steel Structure........................................................................... 75
3.1.2 Circulating Fluidized Bed Combustor Riser .............................. 75
3.1.2.1 Distributor and Bearing Plates .................................... 76
3.1.2.2 Module – 1 ................................................................. 77
3.1.2.3 Module – 2 ................................................................. 77
3.1.2.4 Module – 3 ................................................................. 79
3.1.2.5 Module – 4 ................................................................. 79
3.1.2.6 Exit Module................................................................ 79
3.1.3 Cyclone..................................................................................... 79
3.1.4 Start-Up Burner......................................................................... 80

xiii
3.1.5 Piping ....................................................................................... 83
3.1.6 Combustion Air Fan.................................................................. 83
3.1.7 Solids Handling and Feeding..................................................... 84
3.1.7.1 Solids Handling .......................................................... 84
3.1.7.2 Solids Feeding ............................................................ 85
3.1.8 Instrumentation ......................................................................... 85
3.1.8.1 Pressure Transmitters (PT).......................................... 85
3.1.8.2 Delta Pressure Transmitters (DPT).............................. 86
3.1.8.3 Air Flow Rate Transmitters (FT)................................. 86
3.1.8.4 Air Rotameters (RM) .................................................. 86
3.1.8.5 Water Flowmeters (FT)............................................... 86
3.1.8.6 Temperature Transmitters (TT)................................... 86
3.1.8.7 Air Flow Control Valves (FCV).................................. 86
3.1.8.8 Load Cells (WT)......................................................... 87
3.1.8.9 Load Cell Current Transformers ................................. 87
3.1.8.10 Oxygen Analyzer ...................................................... 87
3.1.8.11 Purge System............................................................ 89
3.1.9 Electrical System ...................................................................... 90
3.1.9.1 Motor Control Hardware............................................. 90
3.1.9.2 Motor Control and Auxiliary Loads Panel................... 90
3.1.9.3 Motor Protection and Isolation Reactors ..................... 91
3.1.9.4 Cabling ....................................................................... 91
3.1.10 Insulation ................................................................................ 92
3.2 INSTALLATION ACTIVITIES ........................................................ 93
3.2.1 Combustion Air System ............................................................ 93
3.2.2 Instrumentation ......................................................................... 94
3.2.2.1 Temperature Transmitters ........................................... 94
3.2.2.2 Differential Pressure Transmitters............................... 95
3.2.2.3 Load Cells .................................................................. 95
3.2.2.4 Water Flowmeters....................................................... 98
3.2.3 Control System ......................................................................... 98

xiv
3.2.4 Summary of Installation and Commissioning Works................103
4. OPERATION...........................................................................................110
4.1 Refractory Drying..............................................................................110
4.1.1 Procedure.................................................................................110
4.1.2 Drying Operation .....................................................................113
4.2 Coal Fired Combustion Test ..............................................................116
4.2.1 Commissioning Tests ...............................................................116
4.2.1.1 Procedure..............................................................................117
4.2.1.2 Operation ..............................................................................117
4.2.2 Combustion Tests ....................................................................123
4.2.2.1 Procedure..............................................................................125
4.2.2.2 Operation ..............................................................................125
4.2.2.3 Coal Properties......................................................................129
4.2.2.4 Initial Bed Material ...............................................................131
4.2.2.5 Operating Conditions ............................................................132
5. RESULTS AND DISCUSSION...............................................................137
5.1 Temperature Profiles..........................................................................137
5.2 Pressure Profiles ................................................................................139
5.3 Flue Gas Emissions............................................................................144
5.4 Ash Compositions..............................................................................146
5.5 Ash Split............................................................................................148
5.6 Particle Size Distributions..................................................................149
5.7 Heat Transfer Analysis ......................................................................152
5.7.1 Heat Transfer In Cooled Modules.............................................153
5.7.2 Overall Heat Balance ...............................................................155
5.8 Combustion Efficiency .....................................................................156
5.9 Pressure Balance Model ....................................................................157
6.CONCLUSIONS.......................................................................................162
6.1 General..............................................................................................162
6.2 Suggestions For Future Work ............................................................163

xv
REFERENCES ...................................................................................................165
APPENDICES....................................................................................................170
A. ENERGY FIGURES ..........................................................................170
B. BASIC DESIGN.................................................................................171
C. DETAILED DESIGN .........................................................................174
D. PROCUREMENT and INSTALLATION...........................................180
E. RESULTS...........................................................................................189
VITA..................................................................................................................194

xvi
LIST OF TABLES
Table 1.1 Design Parameters................................................................................ 11
Table 1.2 Specifications of Circulating Fluidized Bed Combustor Test Units ....... 13
Table 2.1 Range of Coal Analysis ........................................................................ 18
Table 2.2 Mass Balance Results ........................................................................... 29
Table 2.3 Heat Balance Results............................................................................ 31
Table 2.4 Unit Dimensions of Cyclone................................................................. 43
Table 2.5 Particle Capture Efficiency................................................................... 45
Table 2.6 Design Basis for Pressure Balance Model............................................. 58
Table 2.7 Calculated Input Data for Pressure Balance Model ............................... 59
Table 2.8 Results of Pressure Balance Model (Gs = 15 kg/m²s)............................ 59
Table 2.9 Pressure Drop Within the CFBC Loop (Gs = 15 kg/m²s) ...................... 61
Table 2.10 Solid Mass Within the CFBC Loop .................................................... 62
Table 2.11 Input Data for Heat Transfer Analysis of Modules w/o Cooling.......... 67
Table 2.12 Results for Heat Transfer Analysis of Modules w/o Cooling............... 67
Table 4.1 Time Schedule for Drying ...................................................................112
Table 4.2 Steps of Coal Fired Complementary Operation for Drying...................117
Table 4.3 Coal Analysis for Combustion Test-1 ..................................................129
Table 4.4 Coal Analysis for Combustion Test-2 ..................................................130
Table 4.5 Particle Size Distribution of Bed Material............................................132
Table 4.6 Operating Conditions of the Combustion Tests....................................133
Table 5.1 Overall Pressure Drop Values Through Main Parts..............................140
Table 5.2 Flue Gas Emissions for Test-2 (dry basis) ...........................................145
Table 5.3 Chemical Analysis of Bottom Ash and Bag Filter Ash.........................147
Table 5.4 Particle Size Distribution of Loop Seal Ash.........................................149
Table 5.5 Particle Size Distribution of Bottom Ash .............................................150
Table 5.6 Heat Transfer Data for Cooled Modules ..............................................154
Table 5.7 Heat Balance Analysis.........................................................................155

xvii
Table 5.8 Combustion Efficiency Analysis..........................................................157
Table 5.9 Deviated Input Parameters of Pressure Balance Model ........................159
Table 5.10 Solid Holdup Values Predicted by Pressure Balance Model...............160
Table 5.11 Pressure Drops within the CFBC Loop .............................................160
Table A.1 World Total Energy Consumption By Fuel (2001 – 2025) ..................170
Table A.2 World Energy Consumption For Electricity Generation By Fuel.........170
Table B.1 Analysis of Beypazarı Lignite.............................................................171
Table B.2 Coal and Limestone Consumptions.....................................................171
Table B.3 Oxygen Demand and Combustion Air Data ........................................171
Table B.4 Flue Gas Data .....................................................................................172
Table B.5 Cross Sectional Area and Dimensions.................................................172
Table B.6 Flue Gas Composition ........................................................................172
Table B.7 Ash Generation and Contents..............................................................173
Table C.1 Cyclone Inlet Duct Data......................................................................174
Table C.2 Cyclone Dimensions (cm)...................................................................174
Table C.3 Physical Properties for Pressure Balance Model..................................174
Table C.4 Calculated Parameters of Pressure Balance Model (Gs = 15 kg/m²s) ...175
Table C.5 Air Box Module Ports.........................................................................175
Table C.6 Module-1 Ports ...................................................................................175
Table C.7 Module-2 Ports ...................................................................................176
Table C.8 Module-3 Ports ...................................................................................176
Table C.9 Module-4 Ports ...................................................................................176
Table C.10 Exit Module Ports.............................................................................177
Table C.11 Temperature Transmitters .................................................................177
Table C.12 Pressure/Delta Pressure Transmitters ................................................178
Table C.13 Gas Probes........................................................................................178
Table D.1 Specifications of Screw Conveyors And Air Lock ..............................186
Table D.2 Pressure Transmitters .........................................................................186

xviii
Table D.3 Delta Pressure Transmitters ................................................................186
Table D.4 Air Flow Rate Transmitters ................................................................187
Table D.5 Air Rotameters ...................................................................................187
Table D.6 Water Flowmeters ..............................................................................187
Table D.7 Temperature Transmitters...................................................................187
Table D.8 Air Flow Control Valves.....................................................................188
Table E.1 Steady State Temperature Measurements along the Combustor ...........189
Table E.2 Steady State Pressure Measurements along the Combustor..................190
Table E.3 Particle Size Distributions of Bag Filter Ash .......................................191

xix
LIST OF FIGURES Figure 2.1 Schematic Diagram of METU CFBC Test Rig .................................... 19
Figure 2.2 Process Diagram of the Test Unit ........................................................ 32
Figure 2.3 PID of the Flue Gas System ................................................................ 33
Figure 2.4 PID of Combustion Air System........................................................... 35
Figure 2.5 PID of CFB Combustor.......................................................................36
Figure 2.6 PID of Solids Handling System and Feeding System........................... 38
Figure 2.7 PID of Gas Analysis System ............................................................... 40
Figure 2.8 Schematic Diagram of Control System................................................ 41
Figure 2.9 CFB Cyclone ...................................................................................... 43
Figure 2.10 Schematic Diagram for Pressure Balance Analysis ............................ 47
Figure 2.11 Schematic Diagram of Loop Seal (1.Weir, 2.Vertical aeration).......... 54
Figure 2.12 Solid Hold Up Profile for Dilute Zone (Gs = 15 kg/m²s).................... 60
Figure 2.13 Pressure Loop Profile (Gs = 15 kg/m²s)............................................. 61
Figure 2.14 Schematic Heat Transfer Diagram for First and Fourth Modules ....... 64
Figure 2.15 Schematic Diagram for Cooled Second and Third Modules............... 69
Figure 2.16 Detailed Design Drawing for the CFBC ............................................ 72
Figure 3.1 Main Steel Structure of the Test Unit ................................................. 76
Figure 3.2 Inner Views of Modules 1 and 2.......................................................... 78
Figure 3.3 Schematic Diagram of Start-up Burner System.................................... 80
Figure 3.4 Start-up Natural Gas/LPG Burner........................................................ 82
Figure 3.5 Trimox ZrO2 Oxygen Analyzer .......................................................... 88
Figure 3.6 Sample Diagram for Purge System...................................................... 89
Figure 3.7 Load Cell Installation ......................................................................... 96
Figure 3.8 Screw Feeders of Fuel and Limestone Silos......................................... 97
Figure 3.9 DeltaV Controller and I/O Cards ......................................................... 99
Figure 3.10 Main Display Page of Control Computer..........................................100
Figure 3.11 Test Unit - Elevation: 0 m ................................................................105
Figure 3.12 Test Unit - Elevation: 5.5 m .............................................................106

xx
Figure 3.13 CFBC and BFBC Test Units.............................................................107
Figure 3.14 Test Unit – Elevation 9.5 m (1) ........................................................108
Figure 3.15 Test Unit – Elevation 9.5 m (2) ........................................................109
Figure 4.1 Typical Drying Schedule for Castable Refractories ............................111
Figure 4.2 Average Temperature Profiles during Drying Process ........................114
Figure 4.3Average Temperature Profiles for Commissioning Run-1....................118
Figure 4.4 Average Temperature Profiles for Commissioning Run-2...................120
Figure 4.5 Maximum Temperature Profiles - Drying and Commissioning Runs ..121
Figure 4.6 Schematic Diagram for Vacuum System in Solids Feeding Leg .........123
Figure 4.7 Average Temperature Profiles for Combustion Test-1........................126
Figure 4.8 Average Temperature Profiles for Combustion Test-2........................126
Figure 4.9 Dense Bed Pictures During Operation ................................................128
Figure 5.1 Steady State Temperature Profile for Combustion Test-1 ...................138
Figure 5.2 Steady State Temperature Profile for Combustion Test-2 ...................138
Figure 5.3 Steady State Pressure Profile for Combustion Test-1..........................142
Figure 5.4 Steady State Pressure Profile for Combustion Test-2..........................142
Figure 5.5 Particle Size Distributions of all Solid Streams..................................151
Figure 5.6 Predicted and Measured Pressure Profiles for Combustion Test-1 ......158
Figure 5.7 Predicted and Measured Pressure Profiles for Combustion Test-2 ......158
Figure A.1 Distribution of world fossil fuel reserves ...........................................170
Figure C.1 Instrument Ports ................................................................................179
Figure D.1 Distributor Plate ............................................................................... 180
Figure D.2 Bearing Plate ....................................................................................180
Figure D.3 Module – 1........................................................................................181
Figure D.4 Module – 2........................................................................................182
Figure D.5 Modules 3 and 4................................................................................183
Figure D.6 Cyclone.............................................................................................184
Figure D.7 Windbox after Burner Valve Train is Installed...................................184
Figure D.8 Solids Handling and Feeding.............................................................185

xxi
LIST OF SYMBOLS Als : cross sectional area of the loop seal, m²
Ar : cross sectional area of riser, m²
Ac : inlet area of cyclone, m²
Adc : cross sectional area of downcomer, m²
a : decay constant in the dilute zone, m-1
ae : decay constant affected by the exit geometry, m-1
Cbot : carbon content of bottom ash, %
Ccy : empirical coefficient for velocity head at cyclone
Ce : reflux constant
CD : Drag coefficient
Cfly : carbon content of fly ash, %
Cp : specific heat, kcal/kg °C
D : diameter of particle, µm
Dcut : diameter of particle for which the capture efficiency is 50%, µm
De : diameter equivalent of the riser exit, m
Dr : diameter of riser, m
Dls : diameter of loop seal, m
dp : particle diameter, mm
Gs : solid circulation rate, kg/m² s
Gsh : solid mass flux based on horizontal section area of cyclone duct, kg/m² s
Gsd : solid mass flux based on loop seal area, kg/m² s
Hf : height of the dilute zone, m
Hdc : height of the solid bed in the downcomer, m
He : projected height of the riser exit, m
hi : heat transfer coefficient to combustor wall, W/m² K
ho : heat transfer coefficient for external surface, W/m² K
∆Hrxn : heat of reaction, kcal/kg
K : velocity head multiplier

xxii
k1 : thermal conductivity for refractory layer, W/m K
Lva : length of vertical aeration section, m
Lw : length of weir section, m
L ls : total length of the loop seal (Lls = Lw + Lva), m
M : solid mass, kg
m : mass flow rate, kg/h
N : number of rotation that the gas stream makes in the cyclone
n : molar flow rate, mol/h
∆P : pressure drop, mmH2O
Rep : Reynolds number for particles
T : temperature, °C
Tw : Temperature of cooling water, °C
Tc : Temperature in the combustor, °C
Tc-s : Temperature at inner surface of refractory, °C
Ta : Ambient temperature, °C
Ts : External surface temperature of insulation, °C
Tr1 : Temperature at outer surface of refractory, °C
Ud : superficial solid velocity (Gs/ρs), m/s
Ug : gas velocity, m/s
Ut : terminal velocity of particles, m/s
Ugh : average velocity at cyclone duct, m/s
Uo : fluidizing gas velocity at loop seal, m/s
Vc : velocity along the circular path, m/s
z : height in the riser, m
zd : height of the dense bed, m
zf : height in the dilute zone, m
Greek Letters
∆εsr : deviation of solid holdup by particle reflux
εse : solid hold up at the exit
εs : solid hold up in the dilute zone

xxiii
εs∞ : average solid hold up at dilute zone
εsd : solid hold up in the dense bed of riser
εs* : solid holdup at uniform flow with the slip velocity = Ut
εdc : voidage of solid bed in downcomer
εls : voidage of the solid bed in the loop seal
φs : particle sphericity
µ : gas viscosity, kg/m s
ρs : particle density, kg/m³
ρg : gas density, kg/m³
ρbulk : bulk density of fly ash, kg/m³
ηcomb : combustion efficiency, %
Subscripts
c : cyclone
dc : downcomer
dense : dense zone
dilute : dilute zone
h : cyclone duct
ls : loop seal
Abbreviations
AI : analog input
AO : analog output
AT : analyzer with anolog output signal
DCS : distributed control system
DI : digital input
DO : digital output
DPT : pressure difference transmitter
FC : fixed carbon, %
FCV : flow control valve

xxiv
FID : frequency invertor driver
FT : flow transmitter
HMI : human-machine interface
LHV : lower heating value, kcal/kg
LMTD : log mean temperature difference, K
LS : level switch
PID : process and instrumentation diagram
PT : pressure transmitter
SOV : solenoid valve
TCV : temperature control valve
TT : temperature transmitter
UPS : uninterrupted power supply
VM : volatile matter, %
WT : weight transmitter
ZV : sliding gate valve

1
CHAPTER 1
INTRODUCTION
Coal is today the fossil fuel which offers the greatest proven reserves. Due to
increasingly stringent environmental legislation, coal fired combustion systems
should be based on clean coal combustion technologies. For clean and efficient
energy generation from coal reserves, the most suitable technology known to date
is the ‘Fluidized Bed Combustion’ technology. Applications of circulating
fluidized bed combustion (CFB) technology have been steadily increasing in both
capacity and number over the past decade for the utilization of this resource.
Designs of these units have been based on the combustion tests carried out in pilot
scale facilities to determine the combustion and desulfurization characteristics of
the coals and limestones in CFB conditions. However, adaptation of CFB
combustion technology to Turkish lignites with high ash, volatile matter and
sulfur contents necessitates presence of a local CFBC test facility, where CFB
combustion characteristics of indigenous reserves can be determined.
Therefore, the objective of this study have been to design and construct a 150 kWt
CFB combustor and perform a combustion test with a typical Turkish lignite. For
this purpose, the steps to be covered were defined as; i. Basic design of the 150
kWt METU CFB combustor test unit, ii. Detailed design of the test unit, iii.
Equipment and material purchasing and construction, iv. Combustion test with a
typical Turkish lignite and generating data for the design of a commercial unit.
In this chapter, introduction of energy review for Turkey and the world including
energy demand, projections, and coal reserves of Turkey, followed by the
problems of coal fired power plants of Turkey. Then, the general characteristics,

2
advantages and types of fluidized bed combustion are summarized. In literature
survey section, required data for CFB boiler design, and the specifications of
some CFB test facilities around the world are presented.
This study covers basic and detailed design of the CFB combustor test unit,
manufacturing and installation activities, combustion test run with a typical
Turkish lignite, and by employing the experimental data; validation of design for
the test unit, and generation of data that can be used as basis for design of
commercial boilers.
1.1 Energy Review
1.1.1 World Energy Review
1.1.1.1 World Energy Demand
World energy demand has been increasing tremendously as a result of population
increase, industrialization and technological development. Energy consumption;
the most important indicator of the industrial and technological development, is
expected to increase in 2020 to 1.5 times of the amount in 1999 [1]. The most
significant share in this increase will belong to developing countries. The
dominancy of fossil fuels’ share for meeting this demand will continue in the
future as it is today. Fossil fuels still conserve their total share of more than 85%
in world energy consumption at the end of next 25 years period (Table A.1 - App.
A). Examining the amounts and shares of resources consumed for world
electricity generation (Table A.2 - App. A), share of petroleum products is very
low, since this resource is mostly utilized in petrochemical industry and
transportation. In the next 20 years, it is expected that the generation capacity of
nuclear energy will remain constant, and the coal based generation will keep on
being the dominant resource.

3
1.1.1.2 World Energy Resources
Global distribution of petroleum, natural gas and coal reserves shows that the
resources other than coal are concentrated in certain areas [2] (Figure A.1 –
App.A). As a result of this, petroleum and natural gas reserves are under control
of limited number of countries, and in consequence their strategic importance is
maximum.
On petroleum equivalent basis, shares of fossil fuel reserves around the world are
68% for coal, %18 for petroleum and %14 for natural gas [3]. Another important
parameter for the energy reserves is the life-span of the resources based on the
ratio of proved reserves and annual consumption rates. According to this
calculation, the life-span of the recoverable reserves based on 2003 figures is 41
years for petroleum, 67 years for natural gas and 192 years for coal [2].
By the year 2003, the states in the Middle East, having the 63% of the total
petroleum reserves, are socially and politically unstable, and dealing with many
problems which prevent these countries from developing.
Similarly, natural gas reserves are concentrated in two areas; like the Middle East,
the states in the Caspian region are still not reliable in terms of economy and
administration. Consequently, the problems that may occur as the natural gas
reserves get less in the future is unpredictable. However, the production of coal in
more than 100 countries in all continents, and the reserve/production ratio for coal
resulting in more than 3 times life-span compared to others, guarantee the
cheapest price and continuity of the supply of coal [4].
Coal is not only used for steam generation in industrial processes and heating, but
also is the resource in many countries that significant share of the electricity
generation is based on. The share of coal fired power plants in electricity
generation is 53% in USA, 51% in Germany, 65% in Greece, 77% in China, 52%
in Denmark, %78 in Australia, 92% in South Africa and 95% in Poland [5,6].

4
However, only 25% of the total electricity is generated by the coal fired power
plants in Turkey.
1.1.2 Turkey Energy Review
1.1.2.1 Energy Demand and Generation Projections
When the situation in Turkey is examined, energy demand in 2025 is expected to
increase to 1.7 times the demand in 2000 [1], and the electricity consumption will
be approximately doubled from 114 to 226 billion kWh for the same period [7].
Installed power generation capacity of Turkey is dominantly based on
hydroelectricity followed by natural gas and coal fired power plants. The
breakdown of the capacity based on fossil fuels shows that the share of natural gas
is 52%, and is expected to conserve its share against coal and petroleum for the
following 20 years, similar to the trend in the last decade [8-10].
As a result of the contribution of such high amount of natural gas and coal import,
dependency of total energy consumption on imported sources is expected to be
about 75% in 2020, which is presently 65% [11].
This switch from indigenous energy sources to imported ones is claimed to result
in significant imbalance in foreign trade of Turkey. Unless there appears a
significant technological development resulting in a fuel switch especially in
transportation sector and petrochemical industry, dependency on petroleum import
cannot be expected to decrease. Also, because of environment and efficiency
concerns, natural gas use in residential heating is an acceptable choice against coal
and petroleum products. In power generation, coal utilization is still the dominant
application all around the world, on the other hand a switch from coal to natural
gas occurred in Turkey in the last decade.
However, considering that it is a preferable energy policy to diversify the type of
resources and to employ indigenous reserves, lignite reserves should be utilized to

5
balance the actual natural gas dominancy for electricity generation in Turkey. For
this purpose, lignite and hard coal reserves should be examined.
1.1.2.2 Coal Reserves in Turkey
Lignite
Lignite reserves that are dispersed throughout the country have heating values
varying between 1,000–5,000 kcal/kg. Lower calorific values of lignite reserves
have a breakdown as follows: 6.9% over 3,000 kcal/kg, 13.2% between 2,500 and
3,000 kcal/kg, and 79.9% below 2,500 kcal/kg [12].
Geographical distribution of lignite reserves with a total amount of 9.3 billion tons
can be found elsewhere [12]. It must be noted that regional distribution data in
different sources is for the reserves operated by Turkish Coal Enterprises (TKİ), but some significant amount of reserves owned by private companies are known
to be present.
Hard Coal
Most of the hard coal reserves of Turkey are in Zonguldak region. Total amount
of hard coal reserves discovered in that region is about 1.1 billion tons. Average
chemical characteristics of the coal reserves is about 55% fixed carbon (FC), 26%
volatile matter (VM), 11% ash, 8% moisture resulting in a calorific value of about
5,500 – 6,000 kcal/kg. Other than Zonguldak region, some other hard coal
reserves are present with insignificant amounts of reserves. Considerable
utilization of hard coal in power plants other than the one located in Çatalağzı is
not expected in the near future due to high costs for mining of this resource.
Turkey has asphaltite reserves about 79 million tons, most of which are located in
the southeastern part of the country. This resource is characterized by high
calorific value of about 5,500 kcal/kg like hard coal, but also high sulfur content
like lignite. There is also significant amount of bituminous shale reserves adding

6
up to 1.1 billion tons. However, the calorific value of the reserves are in between
800 and 1,100 kcal/kg.
Consequently, lignite seems to be the only indigenous coal reserve in Turkey that
plays an important role in power generation considering the amount of reserves,
and these reserves have been mainly employed in pulverized coal fired power
plants.
1.1.2.3 Coal fired power plants of Turkey
Power plants of Turkey based on pulverized coal (PC) technology have serious
problems. This technology was developed by the countries who have high quality
coal reserves. However, Turkish lignite reserves have high ash, moisture and
sulfur contents and low calorific value. It is worth noting that ash fusion
temperature of these lignites are low enough to soften at 1000°C and especially
the particles having dimension of microns start to melt in regions close to
pulverized coal burners. Whenever one single particle melts and sticks on cooling
surfaces (water-wall), many others rapidly follows and a glassy layer is formed on
the water-walls within a short time. This formation creates resistance against the
heat transfer from combustion side to water in the tubes, which results in less
steam production under-design conditions, change in physical behaviour of the
system, and finally necessitates additional coal consumption to generate same
amount of energy (electricity, heat etc.).
This additional coal consumption causes also an increase in emissions per unit
energy generation [4]. That’s why, clean coal technologies, formerly developed
and continuing their growth in terms of application and capacity, should be
introduced to Turkey’s energy profile.
For clean and efficient energy generation from indigenous lignite reserves, the
most suitable technology known to date is the ‘Fluidized Bed Combustion’
technology that has been applied at a capacity to generate steam for 300MW

7
electrical power at one unit [13], where conceptual design for 600MWe units are
under progress. In Turkey, a power plant based on this application, Çan Thermal
Power Plant with a capacity of 2 x 160 MW, is now under operation [14].
1.1.3 Fluidized Bed Combustion (FBC) Technology
In 1930s and 1940s, after extensive research and development activities, many
advantages of fluidized beds were recognized. These reactors were first employed
in catalytic cracking processes. Afterwards, they were utilized in many other
industries.
At the beginning of 1960s, the necessity to decrease the emissions of sulfur
dioxide (SO2) and nitrogen oxides (NOx) emitted from coal fired power plants,
and the potential of fluidized bed reactor process to decrease these emissions,
initiated the research on the coal fired fluidized bed combustors (FBC). As a result
of these studies, following the introduction of bubbling fluidized bed boilers in
1970s, the applications moved towards circulating fluidized bed boiler technology
in 1980s, and since then increasing number of successful power plant applications
have been taken into operation.
1.1.3.1 General Characteristics
FBC systems are attractive because better control over combustion is realized so
that peak flame temperatures are avoided. Slagging of the ash is eliminated,
corrosion problems and nitrogen oxide emissions are reduced, and sulfur control
with limestone addition to the bed is possible. Since in-bed heat transfer
coefficients are high, fluidized bed boilers are more compact than PC systems.
Mixing rate of particles is significant because of high turbulence, enabling close
contact between particles and gas.
Consequently, bed temperature and associated heat fluxes are uniform. Moreover
fuel particle residence times are longer about ten times than those of the PC

8
technology. A wide range of fuels including high-ash, high-moisture fuels can be
used. The main disadvantage is that the pressure drop across the bed is greater.
1.1.3.2 Advantages of FBC Technology
FBC technology is characterized by many advantages that are given below:
• High combustion efficiency and high heat transfer coefficient
• Ease of fuel preparation
• High availability
• Fuel flexibility
• Low SO2 and NOx emissions
• Ash Utilization
1.1.3.3 Types of FBCs
Depending on the state of fluidization, there are two basic types of FBCs;
Bubbling FBC (BFBC) and Circulating FBC (CFBC).
Bubbling Fluidized Bed Combustor (BFBC)
In a BFBC, the combination of larger particle diameter and low gas velocity is
such that minimum entrainment and carryover of solids occurs. Gas in excess of
that required to provide the minimum for fluidization rises through the bed in the
form of bubbles. The bed has a discernable surface. Fuel and sorbent particles that
are entrained in the gas flow leaving the bed can be captured in dust collectors
downstream the combustor. In BFBCs, small particles such as char near burnout
tend to be blown out of the bed before combustion is complete. Furthermore, a
feed point is needed for approximately every 1 m² for good mixing of the coal,
which is a limitation for large systems. Circulating fluidized beds have been
developed to overcome the tendency for high carbon carryover of bubbling beds
and to facilitate fuel feeding.

9
Circulating Fluidized Bed Combustor (CFBC)
In CFBCs, velocity is increased beyond the particle entrainment velocity, so that
the solids are transported up the full height of the chamber and returned in the
downward leg of a cyclone separator. The pressure drop across the system is a
function of the velocity and the particle loading. This type of fluidization is
characterized by high turbulence, solids back mixing, and the absence of a defined
bed level.
A small amount of air is usually introduced near the bottom of the cyclone
downcomer to control the return rate of the solids. Mixing of fuel with bed
material is rapid due to the high turbulence. Although there is no definite fixed
bed depth, the density of the bed varies throughout the system, with the highest
density near the grid plate.
Secondary air is used to ensure adequate air for combustion of fines in the upper
part of the combustion chamber. The chamber may have waterwalls, although the
lower portion near the inlet air grid is usually covered with refractory. The
cyclone collectors, located at the outlet of the combustion chamber, are steel
vessels lined with hard-faced refractory backed by lightweight insulating
refractory. Char and bed particles continue to circulate until they are reduced to 5-
10 µm, at which point they escape the cyclone collector. The fuel feed rate and
airflow rates are adjusted depending on the steam load so that combustion takes
place near 850°C. Turndown of 3:1 can be achieved by reducing the air and fuel
flow rates.
1.2 Literature Survey
1.2.1 CFB Boiler Design
The primary function of a CFB boiler is to transform and transfer the chemical
energy of a fuel into useful heat using the CFB mode of gas-solid contacting. This

10
transformation should be efficient and have minimum effect on the environment.
For this purpose, the following parameters should be considered in a CFB boiler
design [16,18]:
� Heat generation demand defined in terms of thermal power requirement,
MWt.
� Fuel analysis:
o Heating value
o Elementary Analysis (C, H, N, O)
o Ash content
o Water content
o Volatile matter/fixed carbon content
o Sulfur content
o Ash analysis
o Physical characteristics (Particle size distribution, grindability etc.)
� Limestone Analysis
o CaCO3 content
o Reactivity
o Pore structure
The most of the analyses given above are determined by standard analytical
methods and devices. However, the combustion and desulfurization characteristics
of the fuel and limestone in CFB conditions can only be determined by a
combustion test prior to detailed design of the boiler and its auxiliary systems.
The combustion and desulfurization characteristics acquired from combustion
tests lead to the prediction of the following design parameters:

11
Table 1.1 Design Parameters Obtained from Combustion Tests
Combustion Test Data Design Parameter
Combustion efficiency Prediction of thermal efficiency
Fly/Bottom ash split Capacity of fly and bottom ash removal systems
Fly / Bottom ash
composition
(leads to heat capacity
of ash streams)
Ash utilization potential
Trace elements content
Cooling capacities of ash removal equipment
Prediction of thermal efficiency
Fly/Bottom ash particle
size distribution
Cyclone design
Design of particle removal device
Design of ash removal systems
Limestone utilization Limestone consumption and feeding system
Selection of the most suitable limestone
Best particle size distribution for limestone
Mechanical attrition Cyclone design
Design of particle removal device
Fly ash resistivity ESP design
Pollutant gas
formation/emission
Secondary air ratio and location for NOx removal
Combustion control
Optimum Ca/S ratio
The parameters given above are necessary in the design of CFB boilers in order to
have high operation performance. Therefore, any coal reserve should be tested in
a CFB combustor test facility prior to boiler design.
1.2.2 CFB Test Facilities
Applications of circulating fluidized bed combustion technology developed for
burning coal with high efficiency and within acceptable levels of gaseous
pollutant emissions have been steadily increasing in both capacity and number
over the past decade. Utilization of different kind of solid fuels and gradual

12
introduction of increasingly restrictive legislations on emissions from combustion
sources has been keeping the topic attractive for further research.
A number of CFB combustor test units have been constructed by research centers,
universities and companies manufacturing CFBCs around the world, and these
facilities are still being utilized for the investigation of different fuels and further
development of the technology. Table 1.2 provides a compilation of relevant test
facilities and their main specifications. Specifications of these facilities
summarized in the table are utilized as reference for design of CFBC Test Unit.
1.3 Scope Of The Thesis
As summarized above, Turkish lignite reserves are characterized by high
moisture, ash and sulfur contents, high VM/FC ratio and low calorific value.
Circulating fluidized bed technology is the only available application for the
utilization of these low quality resources efficiently and environmentally friendly.
For the adaptation of this technology to Turkish lignite reserves, METU 150 kWt
CFB combustor is designed and constructed, combustion test with a typical
Turkish lignite is performed for the assesment of test unit design, and generation
of data that can be used as basis for design of commercial boilers. During the
progress of this study, following phases are accomplished:
• Basic design of the system
• Detailed design of the equipment
• Equipment and material purchase/manufacture and installation
• Combustion test with a typical Turkish lignite
The first phase; basic design studies include fuel range determination,
stochiometric calculations, heat and mass balance, integration requirements with
the auxiliaries of the existing system.

Tab
le 1
.2 S
peci
ficat
ions
of C
ircul
atin
g Fl
uidi
zed
Bed
Com
bust
or T
est U
nits
Faci
lity
Pow
er
Furn
ace
Dia
. H
eigh
t M
easu
rem
ents
R
emar
ks
Nie
dera
usse
m
Pow
er P
lant
of
RW
E,
Rhe
inbr
aun,
G
erm
any
[14]
1,20
0 kW
N
ozzl
e gr
id:
0.45
x 0
.39
m
Upp
er fu
rnac
e:
0.81
x 0
.54
m
Unc
oole
d:
3.5
m
With
tube
s:
6.0
m
CO
, CO
2, SO
2, N
Ox,
O2
- Fue
l and
circ
ulat
ing
solid
s mix
ed b
efor
e en
terin
g co
mbu
stio
n ch
ambe
r - V
eloc
ity in
the
furn
ace
at o
pera
ting
tem
pera
ture
, 5.
8 m
/s
- Par
ticle
size
; <15
mm
for b
row
n co
al, <
10 m
m
for b
itum
inou
s coa
l - C
ross
sect
iona
l are
a he
at re
leas
e, 2
.7 M
W/m
² - C
ombu
stio
n ai
r war
med
up
with
a tu
bula
r air
heat
er
- Com
bust
ion
air c
an b
e di
lute
d by
reci
rcul
ated
flu
e ga
s - S
olid
s dis
char
ged
by a
wat
er c
oole
d sc
rew
co
nvey
or
- On-
line
mea
sure
men
ts o
f gas
con
cent
ratio
ns a
t th
e cy
clon
e ex
it
Dal
hous
ie
Uni
vers
ity,
Nov
a Sc
otia
, C
anad
a [1
9]
250
kW
0.23
x 2
3 m
6.
5 m
- Tw
o w
ater
wal
ls, 1
.7 m
tall
- Dis
tribu
tor p
late
com
pose
d of
9 n
ozzl
es w
ith 1
8 or
ifice
s in
each
- S
econ
dary
air
port
at 1
.5 m
abo
ve d
istri
buto
r - P
rimar
y an
d se
cond
ary
air s
uppl
ied
by a
6 p
si
blow
er
- Sol
ids m
ixtu
re fe
d by
a sc
rew
feed
er
- 28
pres
sure
, 30
tem
pera
ture
mea
sure
men
t
13

Tab
le 1
.2 S
peci
ficat
ions
of C
ircul
atin
g Fl
uidi
zed
Bed
Com
bust
or T
est U
nits
(con
t.’d)
Faci
lity
Pow
er
Furn
ace
Dia
. H
eigh
t M
easu
rem
ents
R
emar
ks
Can
met
O
ttaw
a,
Can
ada
[20]
800
kW
0.40
5 m
ID
1.02
m O
D
6.7
m
CO
, CO
2, SO
2, N
Ox,
O2
- Ref
ract
ory
lined
stee
l pip
e - S
crew
con
veyo
r for
solid
s fee
ding
- S
econ
dary
air
supp
lied
at fi
ve e
leva
tions
- F
our r
etra
ctab
le w
ater
coo
led
tube
s - F
eed
0.48
m a
bove
air
dist
ribut
ion
nozz
les
- Alt.
feed
por
t 1.5
2 m
abo
ve d
istri
buto
r - F
uel a
nd so
rben
t fee
d sy
stem
s sep
arat
e - H
ot c
yclo
ne ID
, 0.6
m
- Cyc
lone
des
ign;
cap
ture
95%
of >
50µm
Cie
mat
Sp
ain
[21]
300
kW
0.2
m
6.5
m
CO
, CO
2, SO
2, N
Ox,
O2
- Sol
ids f
eedi
ng b
y sc
rew
feed
er
- Dis
tribu
tor p
late
with
bub
ble
caps
- S
econ
dary
air
1.5
m a
bove
dis
tribu
tor p
late
- R
efra
ctor
y lin
ed in
the
botto
m
- Wat
er w
alls
in th
e up
per 2
m
- Rec
ycle
line
, 0.0
9 m
I.D
. - G
as c
ompo
sitio
n an
d te
mpe
ratu
re m
easu
rem
ents
at
diff
eren
t hei
ghts
Tam
pella
Po
wer
W
illia
msp
ort,
Penn
sylv
ania
, U
SA [2
2]
3,00
0 kW
0.
91 m
18
.29
m
CO
, CO
2, SO
2, N
Ox,
O2,
HC
- R
efra
ctor
y lin
ed c
ombu
stio
n ch
ambe
r - R
efra
ctor
y lin
ed h
ot c
yclo
ne
- Sep
arat
e bu
nker
s and
feed
syst
ems f
or fo
ssil
fuel
, so
rben
t, an
d bi
omas
s - H
igh
degr
ee o
f ins
trum
enta
tion
and
fully
au
tom
ated
14

Tab
le 1
.2 S
peci
ficat
ions
of C
ircul
atin
g Fl
uidi
zed
Bed
Com
bust
or T
est U
nits
(con
t.’d)
Faci
lity
Pow
er
Furn
ace
Dia
. H
eigh
t M
easu
rem
ents
R
emar
ks
EER
C
Uni
vers
ity o
f N
orth
Dak
ota,
G
rand
For
ks,
USA
[23]
1,00
0 kW
0.
508
m
12.8
m
- R
efra
ctor
y lin
ed c
ombu
stio
n ch
ambe
r - 6
3.5
cm ID
Ref
ract
ory
lined
cyc
lone
- 4
5.7
cm ID
seco
ndar
y st
ainl
ess s
teel
cyc
lone
for
fly a
sh re
cycl
e - 1
2 he
at e
xcha
nge
pane
ls
- Fue
l and
sorb
ent f
eed
by g
ravi
ty fr
om a
ho
rizon
tal a
uger
- C
ombu
stio
n ai
r pre
heat
ed to
315
°C
- Sec
onda
ry a
ir fe
ed a
t 1.8
m o
r 3.3
5 m
abo
ve
dist
ribut
or p
late
15

16
During detailed design phase, furnace, cyclone, fuel and limestone handling and
feeding, ash removal, air and flue gas systems, circulation system (loop seal),
distributor plate, automation, electrical system, bearing structure and insulation
application are designed.
Following the design activities, equipment and material purchase/manufacture and
installation works, including the circulating fluidized bed combustor furnace, air
blower, refractory, combustion air and flue gas ducts, coal, limestone and bed ash
silos, insulation material, instrumentation, control system, motor control unit,
electrical equipment are completed.
Finally, the combustor is taken into operation by carrying out a combustion test
with a typical Turkish lignite to determine combustion characteristics, flue gas
emissions, bottom/fly ash split, and to validate the design of the system.

17
CHAPTER 2
DESIGN STUDIES
2.1 Basic Design Studies
Basic design studies of METU 150kWt CFB combustor test unit includes: (i)
determination of fuel range; (ii) definition of design basis and assumptions; (iii)
the mass balance and heat balance.
2.1.1 Fuel Range Determination
In order to determine the range of fuels for the basic design calculations, different
coal resources in Turkey having enough reserves for establishing utility power
plants were taken into account. Examining the analysis of these resources [23],
the following fourteen lignite reserves from different origins all around Turkey
were selected:
o Silopi, Şırnak
o Beypazarı, Ankara
o Saray, Tekirdağ
o Keles, Bursa
o Söke, Aydın
o Göynük, Bolu
o Ilgın, Konya
o Kangal, Sivas
o Gölbaşı, Adıyaman
o Elbistan, Kahramanmaraş o Tufanbeyli, Adana
o Çomaklı, Çanakkale

18
o Eynez, Manisa
o Deniş-II, Manisa
In addition to the above mentioned Turkish lignite reserves, an imported hard coal
reserve was also included in the fuel range to take into account the possibility of
firing low quality lignite and imported hard coal mixture. For the basic design
studies, following fuel data were obtained from the database of Turkish lignite
reserves [23] and steam coal:
o Lower heating value
o Ultimate Analysis (C, H, N, S, O)
o Proximate Analysis (moisture, volatile matter, fixed carbon, ash)
The ranges of the contents and heating values of the selected coal reserves are
given in Table 2.1. As can be seen from the table, the coal reserves selected for
basic design studies are representative of a wide range of coal analyses.
Table 2.1 Range of coal analyses
Range
Lower heating value, kcal/kg 1,273 – 6,000
Carbon, % 17.94 – 63.77
Hydrogen, % 1.55 – 5.07
Nitrogen, % 0.25 – 1.44
Oxygen, % 3.36 – 18.47
Combustible Sulfur, % 0.49 – 5.28
Ash, % 8.31 – 34.60
Moisture, % 0.41 – 52.00
Volatile matter, % 20.24 – 45.00
Fixed carbon, % 10.91 – 45.00

19
2.1.2 Design Basis and Assumptions
Before starting stoichiometric calculations for each coal reserve to obtain the
ranges of input and output streams, the design basis and preliminary assumptions
were defined based on the extensive experience and data accumulated during the
last decade at the METU 0.3 MWt bubbling atmospheric fluidized bed combustor
(AFBC) test rig which was later converted to a hybrid AFBC with the provision of
recycle leg.
Physical System
In order to simplify the physical system for which the heat and mass balance
analyses were carried out, a schematic diagram for METU 150 kWt CFBC Test
Unit given in Figure 2.1 was prepared. As can be seen from the diagram, CFBC
combustor is comprised of a furnace with a cooling system and a cyclone.
Mass balance and heat balance analyses were carried out around the combustor
system (furnace and cyclone) to determine the input and output flow rates of solid
and gas streams and cooling water flow rates, respectively.
Air
Coal
Limestone
Furnace
Cyclone
Cooling Water
To Bag Filter
Flue gas
Bottom ash
Fly ash
Figure 2.1 Schematic diagram of METU 150 kWt CFBC Test Unit

20
Basis
Basic design studies were executed on hourly basis for a steady-state operation.
Thermal input of the test unit: 150 kW
For the purpose of combustion tests, capacities of majority of test facilities
installed to date are less than 1 MWt [13,18-22]. Based on the experiences gained
from the existing 0.3 MWt AFBC Test Rig, 150 kW thermal input capacity was
selected for this study as it was considered that this size is large enough to
generate reliable data for basic design of industrial CFB boilers and small enough
to operate at a lower cost with a few personnel.
However, the design of combustor should be based on one single coal reserve for
which thermal load of fuel input is 150 kWt, while this input is needed to be
varied for other coals. The reason for this variation of thermal input is the
necessity for keeping superfical velocity in the riser – one of the leading design
parameters – at 5 m/s, a typical operating parameter for CFBCs [15]. As the
velocity in the combustor depends on total gas flow, which is mainly determined
by combustion air demand and water content of the fuel, 5 m/s can only be
achieved at different thermal fuel inputs for different coals. Therefore, thermal
load is variable for different coals to keep hydrodynamic parameters like gas
velocity, volume fraction of solids, particle load, pressure distribution etc. at
design conditions. In conclusion, thermal input of the test unit; 150 kW, is only
valid for design coal, and there is a range for other coals under consideration.
Furnace temperature: 850°C
Typical operating temperature of CFB furnaces is 850°C, which brings in many
advantages to this technology. At this temperature, there is no ash fusion, sulfur
capture reaction is optimum, alkali metals are not vaporized so that risk of fouling
on boiler tubes is reduced, and conversion of nitrogen in the combustion air to
NOx is negligible [15]. Therefore, furnace temperature was considered to be
uniform throughout the riser of CFBC and was taken as 850°C in the calculations.

21
Furnace pressure: 1 atm
Furnace pressure throughout the combustor varies around atmospheric pressure
from slightly positive pressure at the distributor plate to a near vacuum condition
at the cyclone exit. Therefore, assuming the furnace pressure to be atmospheric is
acceptable for basic design calculations, as it is only used in volumetric flow rate
conversion between Nm³ and m³. Pressure distribution was predicted in the
detailed design studies, and it was observed that this asssumption was still
acceptable.
Excess air ratio: 20%
Excess air ratio, which is the ratio of air in excess of what is required theoretically
for stoichiometric combustion, is typically kept at 20% in CFBC applications
[13,15]. Although the design is based on this value for normal operating
conditions, design range considers excess air ratios up to 50% for experimental
purposes.
Superficial velocity: 5 m/s
The superficial velocity range for the CFB boilers is given as 4 – 8 m/s [14].
Typical operating data for the superficial velocity is generally 5 m/s for CFBCs,
because of the general norm for the avoidance of furnace erosion [15]. Moreover,
as the test unit can not be as tall as a commercial unit, it is not prefered to enhance
entrainment of particles and to decrease residence time by increasing the
superficial velocity.
Desulfurization characteristics
One of the most important advantages of fluidized bed combustion technology is
the in-situ desulfurization. Sulfur dioxide (SO2) produced by the oxidation of
combustible sulfur reacts with calcium oxide (CaO) particles produced by the
calcination of limestone that is fed to the combustor together with coal. As a result
of this mechanism, one of the leading pollutant gases emitted from coal fired

22
power plants is transformed to solid phase (CaSO4) before leaving the combustor.
The reactions of this sulfur capture mechanism are given in the mass balance
section.
The determining parameter for this in-situ desulfurization mechanism is the
temperature within the combustor. The optimum temperature range for the sulfur
capture reactions is 800 – 850 °C, as the ractivity is reduced at lower
temperatures, whereas CaSO4 is decomposed at higher temperatures [15]. This
fact is the leading motivation for the furnace temperature to be 850°C. In addition
to this, Ca/S molar ratio and CaCO3 content of the limestone are also effective on
sulfur dioxide capture and the design basis for these parameters were determined.
The effect of some other parameters like physical structure of limestone particles
(size, pore characteristics, etc.), circulation rate, residence time, etc. on sorbent
utilization was included in one parameter defined as desulfurization efficiency.
Calcination efficiency: 100%
The first step of sulfur capture mechanism in CFBC conditions is the calcination
of CaCO3 (calcium carbonate), which is the major component of limestone fed to
the combustor. The calcination reaction is the release of carbon dioxide by an
endothermic reaction which produces CaO. Since limestone is easily calcined at
operating temperatures of CFBC [15] and the residence time of the particles
within the CFB combustors is pretty high, it is assumed that all the CaCO3 reacts
to CaO (100% calcination efficiency) which then reacts with sulfur dioxide and
oxygen to form CaSO4 that leaves the combustor in solid phase within bottom and
fly ash streams.
Ca/S molar ratio: 2.2
Ca/S molar ratio is an indication of operating conditions regarding the
desulfurization process. It is the ratio of calcium fed to the combustor to sulfur on
molar basis. In this study, Ca/S ratio is based on the calcium coming from the
limestone and the combustible sulfur. When this ratio is defined for a system,

23
limestone consumption is determined by multiplying the ratio with molar sulfur
content of the coal and dividing by molar composition of Ca in limestone.
Although Ca/S ratios within 1.5 – 2.5 are typical operational ranges for CFBCs
[15], a number of physico-chemical parameters like the reactivity of CaCO3
particles at CFBC conditions are the determining factors for desulfurization.
Therefore, for basic design calculations, a typical value of 2.2 can be utilized.
Although sulfur dioxide capture behavior of each limestone source can be
estimated by laboratory reactivity tests, actual performance can only be
determined by fluidized bed combustion tests. Considering the experimental
requirements, maximum value of Ca/S ratio is taken as 8 for the design basis.
Desulfurization efficiency: 90%
Desulfurization efficiency is the ratio of SO2 captured by limestone to the SO2
generated during combustion. It is reported that sulfur capture of 95% and more
has been achieved in CFB boilers [13]. Turkish environmental regulations for
high capacity utility boilers necessitate at least 90% removal of SO2 [24].
Therefore, 90% desulfurization efficiency is not only a typical value, but also a
low limit for a coal combustor. Although this efficiency can be improved by
adding more limestone, this improvement may not be feasible for commercial
plants because of thermal efficiency and operational cost concerns. The aim of
using this value in the basic design study is to predict SO2 emissions at a typical
desulfurization performance. Actual efficiency values will be observed during the
test runs in the future with limestone addition, and will be tested against limestone
flow rate, i.e. Ca/S ratio.
CaCO3 content of the limestone: 95%
Similar to the coal reserves, there are many different limestone reserves, with
different CaCO3 content, reactivities, etc. However, 95% purity for a limestone
has been a typical value in many experiments utilizing limestone from different
sources at the existing AFBC test rig [25]. On the other hand, limestone utilization
with slightly lower purity does not have a disturbance on the design and operation

24
of combustor. Therefore, this value was used in the basic design calculations.
Ash Split: Bottom Ash / Total Ash = 40%
The solid streams leaving a CFB combustor are composed of incombustible solids
mainly and unburnt combustible particles with a small portion. The incombustible
solids include the ash entering within the coal, impurities in limestone and CaO
and CaSO4 particles. Ash split is the distribution of total ash between bottom and
fly ash streams while leaving the combustor. The output stream composed of fine
ash particles that are entrained from the cyclone are named as fly ash, whereas the
coarse particles leaving the system from the bottom of riser are named as bottom
ash. A significant portion of bottom ash stream is composed of the particles for
which the terminal velocity is higher than the superficial velocity. Therefore, these
particles stay in the riser and are discharged from the bottom of riser.
The split between bottom and fly ash depends on the nature of the ash and the
conditions within the combustor. It is an important parameter in combustor design
because of its effect on heat transfer, bed material generation, pressure distribution
etc. Ash split at the existing AFBC test rig was generally in the range of 20% –
40% for bottom ash generation [26]. For CFB combustors, 20% of total ash is
reported to leave the furnace as bottom ash [15]. In order to have a margin, CFBC
test unit design was based on a maximum ash split value of 40% for bottom ash,
and minimum value of 60% for fly ash. The design ranges of ash split was defined
to be 0 – 40% for bottom ash, and 60 – 100% for fly ash.
Unburnt carbon in bottom and fly ash streams: Cbot = 1% , Cfly = 2%
In the design study, carbon contents of bottom and fly ash were utilized for the
prediction of the combustion efficiency. Tests carried out with lignite on the
AFBC test rig operated under bubbling mode revealed that carbon in fly ash
varied in the range 1.6% to 4.5% [27]. However, tests carried out with the same
lignite on the AFBC test rig operated under circulating mode resulted in lower
unburnt carbon contents in both bottom and fly ashes [35]. Based on these data,

25
design basis for carbon content of bottom ash and fly ash has been defined as 1%
and 2%, respectively. However, unburnt carbon contents of bottom and fly ashes
are functions of a number of design and operating parameters. Therefore, higher
and lower carbon losses and different combustion efficiencies can be observed
while firing different coals at different operating conditions.
2.1.3 Mass Balance
Based on the assumptions and design basis given above, stoichiometric
calculations were carried out for all of the coal reserves. As the analysis of
Beypazarı lignite falls in the middle of the fuel range, this reserve is chosen as the
design coal. The analysis and the results of basic design based on Beypazarı
lignite are given in Appendix B.
2.1.3.1 Solid input
The starting point of mass balance was the thermal input of the fuel which is 150
kWt. Flow rate of coal was calculated by dividing the heat input by LHV of the
coal. Flow rates of components present in coal; ash, water, sulfur, carbon,
hydrogen, oxygen and nitrogen, were obtained by multiplying the composition of
each ingredient by the flow rate of coal. Limestone consumption was calculated
by utilizing the sulfur content of coal, Ca/S ratio and limestone purity.
2.1.3.2 Combustion air
Combustion air requirement was calculated from oxygen demand of the reactions
given below:
C(s) + O2 (g) → CO2 (g) (rxn.1)
H2 (g) + ½ O2 (g) → H2O (g) (rxn.2)
S (g) + O2 (g) → SO2 (g) (rxn.3)

26
CaO (s) + SO2 (g) + ½ O2 (g) → CaSO4 (s) (rxn.4)
Although the Carbon in coal is not completely converted to CO2 by reaction#1,
stoichiometric air requirement is calculated by assuming complete conversion
based on the definition of theoretical air requirement which is the dry air required
for complete combustion of a defined weight of coal [15]. In order to obtain
combustion air flow rate, oxygen demand is calculated by subtracting the oxygen
in the coal from the oxygen demand of the reactions given above. Theoretical air
flow rate was calculated by dividing this oxygen demand by oxygen percentage in
air (21%). Total combustion air flow was obtained by adding the amount of
excess air to the theoretical air flow rate.
2.1.3.3 Flue gas
After obtaining the input terms, flow rates of products within flue gas were
calculated. In addition to the products of reactions #1 to #4, there are other
sources of gaseous species within the flue gas: (i) calcination of limestone; (ii)
reactions of coal nitrogen; (iii) unreacted input streams.
In addition to the combustion reaction, the calcination reaction of limestone given
below also produces carbon dioxide.
CaCO3 (s) → CaO (s) + CO2 (g) (rxn.5)
Regarding the reactions of coal nitrogen, only the reactions for NO and N2
formation are taken into account to calculate flue gas flow rate and gas
composition. The representative reactions for coal-N conversion to NO and N2 are
given below, and the complicated reaction mechanisms of nitrogen species and its
oxides can be found elsewhere [25].

27
N + ½ O2 (g) → NO (g) (rxn.6)
2 N → N2 (g) (rxn.7)
Unreacted gaseous species originating from the input streams are; (i) nitrogen in
combustion air; (ii) moisture in coal and combustion air; (iii) oxygen that remains
after the reactions.
Based on input, generation and consumption rates of nitrogen, water vapor, sulfur
dioxide and oxygen, flow rates of these gaseous species within the flue gas were
calculated. On the other hand, the exact flow rate of CO2 could not be calculated
at this stage bacause of the fact that the conversion of carbon to CO2 is not
complete. A small portion of unreacted carbon produces carbon monoxide by the
following reaction, whereas the rest of the unreacted carbon leaves the combustor
within fly ash and bottom ash streams.
C(s) + ½O2 (g) → CO (g) (rxn.8)
In order to calculate the exact flow rate of CO2, it was required to calculate the
amount of carbon that does not react to CO2. This deviation from complete
conversion is defined as incomplete combustion, and it results in less generation
than the theoretical thermal input based on the heating value of the coal. In order
to describe the degree of the completeness of combustion, combustion efficiency
is defined as ratio of total energy generation by combustion reactions to the
theoretical heat input by the fuel. Combustion efficiency (ηcomb) is calculated
from the following equation, which is based on subtracting the ratio of
combustion enthalpies of unreacted carbon species in the output streams to the
total heat input from unity.
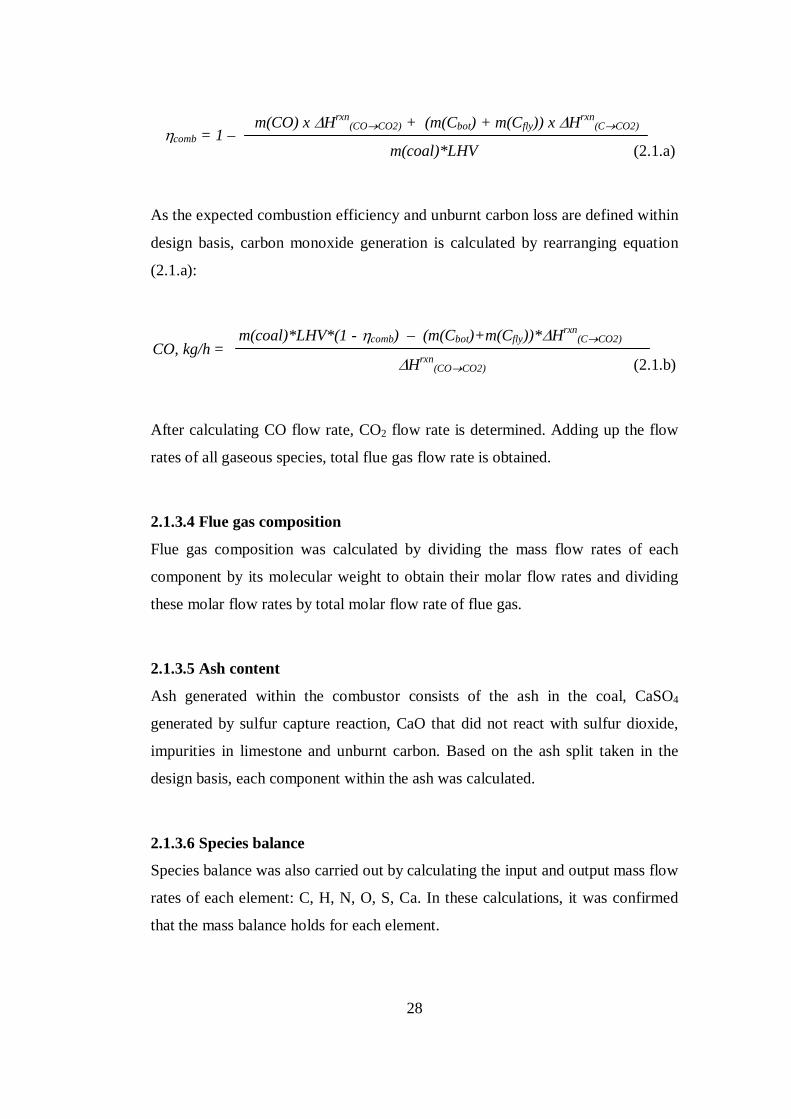
28
m(CO) x ∆Hrxn(CO→CO2) + (m(Cbot) + m(Cfly)) x ∆Hrxn
(C→CO2)
m(coal)*LHV (2.1.a)
As the expected combustion efficiency and unburnt carbon loss are defined within
design basis, carbon monoxide generation is calculated by rearranging equation
(2.1.a):
m(coal)*LHV*(1 - ηcomb) – (m(Cbot)+m(Cfly))*∆Hrxn(C→CO2)
∆Hrxn(CO→CO2) (2.1.b)
After calculating CO flow rate, CO2 flow rate is determined. Adding up the flow
rates of all gaseous species, total flue gas flow rate is obtained.
2.1.3.4 Flue gas composition
Flue gas composition was calculated by dividing the mass flow rates of each
component by its molecular weight to obtain their molar flow rates and dividing
these molar flow rates by total molar flow rate of flue gas.
2.1.3.5 Ash content
Ash generated within the combustor consists of the ash in the coal, CaSO4
generated by sulfur capture reaction, CaO that did not react with sulfur dioxide,
impurities in limestone and unburnt carbon. Based on the ash split taken in the
design basis, each component within the ash was calculated.
2.1.3.6 Species balance
Species balance was also carried out by calculating the input and output mass flow
rates of each element: C, H, N, O, S, Ca. In these calculations, it was confirmed
that the mass balance holds for each element.
CO, kg/h =
ηcomb = 1 –
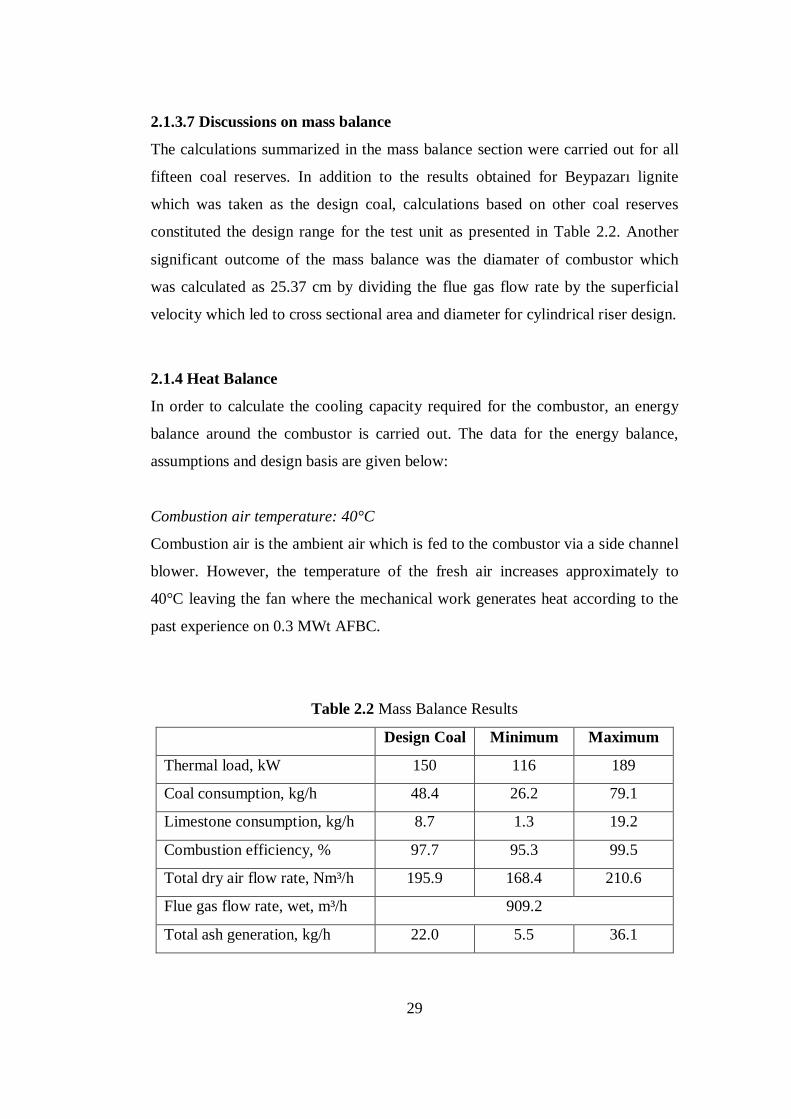
29
2.1.3.7 Discussions on mass balance
The calculations summarized in the mass balance section were carried out for all
fifteen coal reserves. In addition to the results obtained for Beypazarı lignite
which was taken as the design coal, calculations based on other coal reserves
constituted the design range for the test unit as presented in Table 2.2. Another
significant outcome of the mass balance was the diamater of combustor which
was calculated as 25.37 cm by dividing the flue gas flow rate by the superficial
velocity which led to cross sectional area and diameter for cylindrical riser design.
2.1.4 Heat Balance
In order to calculate the cooling capacity required for the combustor, an energy
balance around the combustor is carried out. The data for the energy balance,
assumptions and design basis are given below:
Combustion air temperature: 40°C
Combustion air is the ambient air which is fed to the combustor via a side channel
blower. However, the temperature of the fresh air increases approximately to
40°C leaving the fan where the mechanical work generates heat according to the
past experience on 0.3 MWt AFBC.
Table 2.2 Mass Balance Results
Design Coal Minimum Maximum
Thermal load, kW 150 116 189
Coal consumption, kg/h 48.4 26.2 79.1
Limestone consumption, kg/h 8.7 1.3 19.2
Combustion efficiency, % 97.7 95.3 99.5
Total dry air flow rate, Nm³/h 195.9 168.4 210.6
Flue gas flow rate, wet, m³/h 909.2
Total ash generation, kg/h 22.0 5.5 36.1

30
Flue gas temperature at the cyclone exit: 850°C
The temperature in the furnace, 850°C, is maintained in the cyclone. Therefore,
flue gas temperature at the cyclone exit is taken to be same as the temperature in
the cyclone.
Bottom ash temperature: 850°C
It was assumed that the bottom ash leaves the system at furnace temperature.
Overall heat transfer coefficient for surface heat loss: 8.6 kcal/h m² K
This data is based on heat loss from 60°C aluminum cover sheet surface to
ambient air. During detailed design, this value was checked for insulation
thickness calculations, and it was found that the assumption was valid.
Cooling water inlet and outlet temperatures: 20°C – 60°C
Cooling water inlet temperature was assumed to be maximum 20°C. To prevent
evaporation in tubes that can cause water hammer, exit temperature should not be
allowed to exceed 60°C. Therefore, cooling load was calculated accordingly.
Defining the assumptions and design basis for heat balance, input, output and
generation terms were calculated. Inputs in energy balance are flow enthalpies of
coal, limestone, air and cooling water.
Generation term of energy balance consists of the reaction enthalpies of:
• Calcination: CaO formation (n * ∆Hrxn)
#5 CaCO3 (s) → CaO (s) + CO2 (g) (41.6 kcal/gmol)
• Sulfation; CaSO4 formation (n * ∆Hrxn)
#4 CaO(s) + SO2(g) + ½ O2(g) → CaSO4(s) (-114.1 kcal/gmol)
• Combustion (mcoal * LHV)

31
Outputs in energy balance are flow enthalpies of bed ash, fly ash, flue gas, cooling
water (hot) and heat loss from the outer surfaces of combustor.
As specific heats of coal and flue gas vary significantly with their water content,
water within input and output species was included separately and all other
species were included in dry basis during the heat balance.
Mass flow rates of all streams except the cooling water flow rate were calculated
during mass balance. Therefore, the heat balance around the combustor was
carried out to determine the cooling water flow rate by following the below steps:
• Energy input and output terms (except cooling water) were calculated.
• Generation terms were calculated; calcination(endothermic), sulfation
(exothermic), combustion(endothermic)
• All the terms were inserted into the energy balance equation.
• Heat to be removed by cooling water in the furnace was obtained.
• Heat removal requirement was divided by the enthalpy difference of inlet
and outlet cooling water streams to obtain cooling water flow rate.
As a result, heat removal requirement and cooling water flow rate for the design
coal and the range of these parameters when different coals are fired were
obtained and are tabulated in Table 2.3.
Table 2.3 Heat Balance Results
Design Coal Minimum Maximum
Total generation, kcal/h 126,519 96,708 161,787
Enthalpy difference (Out – In), kcal/h 70,392 66,662 75359
Heat loss to surroundings, kcal/h 8,256
Heat removal at combustor, kcal/h 47,872 13,094 86,370
Cooling water flow rate, kg/h 1,197 327 2,159

32
2.2 Detailed Design Studies
Following the completion of basic design, detailed design studies were started
which included process and instrumentation design, preliminary equipment
design, development of pressure balance model, detailed equipment design and
cooling system design.
2.2.1 Process and Instrumentation
150 kWt Circulating Fluidized Bed Combustor Test Unit is comprised of not only
the combustor but also the auxiliary systems like air and flue gas systems, solids
handling and feeding systems and gas analysis system. Schematic of the process
flow diagram of the test unit is given in Figure 2.2. Following this general process
diagram, process and instrumentation diagrams (PID) for each system were
prepared.
Figure 2.2 Process Diagram of the Test Unit
12
3
2
4
6
7
9
1
10
11
5
8

33
The components of the test unit given in Figure 2.2 are listed below:
1. Combustion air supply
2. Coal handling
3. Limestone handling
4. Solids feeding
5. CFB combustor
6. Bottom ash withdrawal system
7. Cyclone
8. Loop seal
9. Bag filter
10. Induced draft fan
11. Stack
12. Control room
2.2.1.1 Flue Gas System
Flue gas system is defined to start from the exit of the CFB combustor’s cyclone
and goes up to the stack. This system is composed of a bag filter, an induced draft
fan and flue gas lines. PID of the system is given in Figure 2.3.
BAG
FILTER
TT TC TT PT M FCV TC FT
Flue Gas Duct of BFBC Test Rig
CFBC cyclone 3-way
valve
Figure 2.3 PID of the Flue Gas System

34
Connection to the Existing Flue Gas System of Bubbling AFBC Test Rig
The flue gas line connects the cyclone to the flue gas line of existing test rig
where there is a 3-way valve to by-pass the bag filter when the gas temperature is
outside the limits of bag filter. Starting from this by-pass valve, the flue gas
system of the existing unit is utilized. Therefore, process and instrumentation
diagram is the same as the existing installation starting from that point.
Existing Flue Gas System
Through the existing flue gas system, there are thermocouples of bag filter to
measure the flue gas temperature to control by-pass valve, and there are pressure,
temperature and flow transmitters, flue gas damper control valve and induced
draft fan before the stack.
Control Philosophy
Flow control valve before the induced draft fan is utilized to balance the pressure
at the exit of combustor together with the blower. For this purpose, the data
obtained from the pressure transmitter before the damper valve and the
transmitters within the furnace are used as control parameters for the system.
2.2.1.2 Combustion Air System
Combustion air system is the section from the fresh air inlet of blower up to the
combustion air inlets of the CFB combustor; windbox (primary air), and
secondary air collector. In between, there are blower, combustion air piping,
valves, rotameters and instruments for flow measurement. PID of the combustion
air system is given in Figure 2.4.
At the exit of blower, the line is divided into two, to primary and secondary air
control valves. After the valves, pressure and flow rates are measured.
Temperature is only measured on primary air piping, as no deviation is expected
between the two streams. Primary air enters the windbox and secondary air is
divided into two, to collector feeding the injection tubes and loop seal windbox.

35
Control Philosophy
Air flow required by the combustor is a function of coal flow rate and excess air
ratio. In order to keep the air flow rate at the required value, control valves are
regulated. The control parameter for the valves are the air flow rates that are
calculated by using the pressure drop through a flow element and applying
temperature and pressure corrections to these data.
Secondary air flow control is based on the ‘Primary air / Secondary air’ ratio that
is defined by the operator. The control system calculates the secondary air flow
rate requirement by multiplying this ratio with total combustion air flow rate and
regulates the valve accordingly to obtain this calculated flow rate
Similar to the control philosophy of total air flow rate, the control system
regulates secondary air control valve based on the data obtained from the flow
transmitter.
As the secondary air ratio is defined as the control parameter, the control system
keeps the ratio at the required value, regardless of the variations in the total air
flow rate.
Figure 2.4 PID of Combustion Air System
TT PT M
Fresh air
Primary air Windbox
Sec. air collector
FCV
Secondary air
FT
FCV FT PT
Loop seal

36
2.2.1.3 CFB Combustor
CFB combustor is composed of the furnace, cyclone and circulation system.
Furnace is divided into modules for ease of manufacturing, installation, future
revisions and temperature control during operation. At the return leg of cyclone,
there is a J-valve for sealing the return leg and maintaining the circulation.
If the return leg can not isolate the furnace from cyclone by the weight of
particles, combustion air by-passes the furnace and flows through the cyclone and
leaves the combustor. PID of the system is given in Figure 2.5.
Figure 2.5 PID of CFB combustor
TT
TT
TT
TT
TT
TT
TT
TT
TT
TT
TT
TT
TT
FT
PT
DPT
DPT
DPT
DPT
DPT
DPT
DPT
DPT
DPT
DPT
TT
TT
PT
PT
DPT
DPT
DPT
SOV
FT
37
Control Philosophy
There are temperature, pressure and pressure difference transmitters along the
combustor. All the signals received from these transmitters are logged into the
control system’s computer not only for process control but also for evaluation of
the combustion test results.
The measurements collected from pressure and differential pressure transmitters
are used in determining particle load distribution along the combustor. The
pressure data serve as control parameters for control valves of blower and induced
draft fan.
Control parameters for combustion chamber temperature control are temperature
along the combustor (850°C), and cooling water outlet temperatures (to be max.
60°C). The operator checks both temperature data and regulates the manual valves
of cooling water accordingly. Cooling water inlet temperature and flow rate data
shall be logged to be utilized in heat transfer studies after test runs.
For particle recirculation in the J-valve, when the particles can not flow into the
furnace because of the pressure inside the combustor, the solenoid valve (SOV) of
compressed air shall be opened to convey the particles into the furnace. This valve
shall be activated manually by the operator when the particle level in the
downcomer leg is high.
2.2.1.4 Solids Handling and Feeding System
Solids handling and feeding system is composed of coal, limestone and bed
material handling, solids feeding, solids circulation and ash removal systems.
Solids in the silos flow through screw feeders that are connected to a main bunker
for mixing. At the bottom of this bunker, there is an air lock type main feeder
which feeds the solids to an inclined leg that is connected to the furnace. This
main feeder is selected as air lock to isolate the furnace from solids feeding
system. PID for the system is given in Figure 2.6.

38
At the bottom of the combustor, there is a discharge line for bed ash removal. The
bed ash system is designed to discharge the particles by the help of compressed air
conveying system.
The J-valve has an outlet pipe for particle discharge in case it is necessary to
decrease the particle load in the system. This outlet line also helps draining of the
system after test run is finalized.
Control Philosophy
Coal and limestone silos are equipped with load cells. Weight signals received
from load cells are utilized to calculate the solid streams’ flow rates. The
difference in silo weight within a specific time interval is converted to flow rate of
each species.
M
WT
FID
COAL SILOS
M
WT
FID
LIMESTONE SILO
M
BED MATERIAL
SILO
M
FID
Furnace
Figure 2.6 PID of Solids Handling System and Feeding System

39
At the same time, operator can regulate the flow rate of coal according to the
variations in many parameters like furnace temperature, pressure (particle load),
CO and O2 concentrations etc. The limestone flow rate should also be changed to
control sulfur dioxide emissions. The operator regulates frequencies of the screw
feeder motors at the bottom of each silo to feed the solids at required flow rates.
Operation of bed drain discharge system is based on the differential pressure data
within the dense zone combustor. The system is turned on when the particle load
in the furnace increases.
If the particle accumulation in the downcomer is higher than required, fly ash
particles have to be drained from the system. For this purpose, the J-valve
discharge system is utilized.
2.2.1.5 Gas Analysis System
The system is designed to have 6 ports for sampling combustion gas along the
furnace. All sampling ports are connected to a line heading to the analyzers for
CO, NOx, SO2 and O2 concentration measurements via the existing gas
conditioning system. There should also be another analyzer for O2 measurement
on wet basis at the exit of furnace for combustion control. PID of this system is
given in Figure 2.7.
Control Philosophy
Gas concentration data continuously received from the analyzer at the furnace exit
should be utilized for combustion control. Oxygen concentration measured at the
exit of cyclone is an indicator for excess air ratio in the furnace. This data helps
regulating coal and air flow rates throughout the test runs.
The procedure for sampling flue gas along the combustor is as follows: Operator
shall first select the port to sample the combustion gas. Then, all the valves other
than the one at the selected port shall be closed. Flue gas is sampled from that port

40
and flows through gas conditioning system and analyzers. After the operator
decides to pass to another sampling port, sampling valves are regulated again as
described above. Gas concentrations shall be logged to the computer and
displayed on the monitor for the operator to take actions when necessary.
2.2.2 Control System
Control system is composed of DCS (distributed control system) based process
control hardware, a computer (PC) and a UPS. Control hardware panel is
comprised of a termination panel for signal cables, input and output cards,
Figure 2.7 PID of Gas Analysis System
GAS
CONDITIONING
SOV
SOV
SOV
SOV
SOV
SOV AT CO
AT NOx
AT SO2
AT O2
AT O2
Stack
SOV

41
controller, power and PC communication modules. Schematic diagram for control
system hardware is given in Figure 2.8.
Based on the instrumentation study summarized above, number of input and
output signals of the control hardware was determined, including at least 30%
spare I/O for each type of signal.
After installation works for the instruments and cabling were completed, the
control system hardware was programmed based on the control philosophy
summarized in the previous sections.
2.2.3 Equipment Design
2.2.3.1 Furnace
Although the commercial combustors have rectangular cross-section, because of
its size and ease of manufacture, the combustor of the test unit was designed to
have cylindirical structure, with an internal diameter of 25 cm, which was
obtained in the basic design studies.
HMI
TTPTFT
FCVATWT
SOVTCV
M
DCS INSTRUMENTS
Figure 2.8 Schematic Diagram of Control System

42
Test units at similar capacity have been reported to have furnace heights up to 6.5
m [18-22, 28-30]. As this test unit was designed to fire mainly low quality lignite,
furnace height in this study was chosen as 8 m to be able to use less reactive
limestone and yet obtain high sulfur capture by providing more residence time.
Furnace is comprised of 5 modules. Design details of the modules are given in
section 2.2.6. Combustion takes place and flue gas flows at the inner part of the
modules (D=25 cm). Surrounding this combustion chamber, there is a refractory
layer which is integrated with a cylindrical shell (pipe) outside. For two of the
modules, there is a water channel system at the outside of this shell.
Detailed design of furnace, including the windbox, distributor plate, air and solids
feeding points, bottom ash discharge line, exact locations of instrument and
sampling ports, external insulation, and manufacturing details for all these items
are given in related sections.
2.2.3.2 Cyclone
For the design of the cyclone, design procedure proposed for a general purpose
cyclone is followed [15,31]. According to this procedure, if one of the dimensions
of the cyclone was determined, the others can be calculated from Table 2.4 given
next to the schematic diagram in Figure 2.9. Proportions given in the table are the
dimensions when Do (cyclone diameter) is taken as 1 unit.
The diagram given in Figure 2.9 was prepared in conformity with these
proportions, however, the streamlines in the drawing showing the rotation of gas
flow are representative. Following the design procedure, it was assumed that the
actual number of rotations that the gas stream makes within the cyclone is 5 [31].
In order to follow the design procedure, one of the dimensions had to be specified.
For this purpose, inlet cross-section, which sets the value of W and Hi, was
selected as it can be determined from flue gas volumetric flow rate which was

43
calculated during basic design studies. In this calculation, inlet velocity of the gas
was chosen to be 20 m/s, typical design parameter for general purpose cyclones
[15,31]. Deciding on the inlet velocity, inlet cross section was calculated from the
following formula:
Inlet cross section = Flue gas vol. flow rate / Inlet velocity (2.2)
Effect of inlet velocity was also studied in terms of pressure drop and particle
capture efficiency, and this initial assumption was found to be optimum. As the
cyclone inlet has a rectangular cross section, with one side being two times the
other side (H/Wi = 2), cross sectional area is defined as ‘a x 2a = 2a²’ where a is
the dimension of Wi. Equalizing this value to the value found from eqn. (2.2),
Table 2.4 Unit Dimensions of Cyclone [31]
Figure 2.9 CFB cyclone
Dimension Proportion
Do 1
Wi 0.25
H 0.5
H1 2
H2 2
De 0.5
S 0.625
Dd 0.25
H 2
H 1
S H
Wi
D o D e
d

44
dimensions of the inlet duct of cyclone were calculated as 7.95 cm x 15.90 cm (H
x Wi) for 20 m/s inlet velocity.
Once the inlet dimensions are calculated, rest of the cyclone dimensions can be
calculated by utilizing the unit dimensions given in Table 2.4. According to this
procedure, the cyclone of CFBC was designed to have a diameter of 31.8 cm and
a total height of 127.2 cm. The other dimensions of the cyclone are given in
Appendix C. Once the dimensions were determined, particle capture efficiency
and pressure drop throughout the cyclone were calculated.
Particle capture efficiency
Fraction of particles that will be captured at the cyclone is predicted by the
following equations [31];
for block flow assumption, (2.3)
for mixed flow assumption, (2.4)
where N is the number of rotations that the gas makes, Vc is the velocity along the
circular path, D is the diameter of particle under consideration, ρpart is the density
of particle, Wi is the width of the inlet cross-section, and µ is the viscosity of gas.
Block flow and mixed flow assumptions are the limits of cyclone separators, and
the real case is in between. For this purpose, the efficiency is defined by an
alternative totally emprical data-fitting equation where the experimental data is
represented with satisfactory accuracy:
(2.5)
η =π N Vc D² ρ part
9 Wi µ
)η =π N Vc D² ρ part
9 Wi µ1- exp-(
η = (D / D cut )²
1 + (D / D cut)²

45
The three efficiency definitions given above are utilized for various particle
diameters and the results are given in Table 2.5.
Cut diameter
It is the diameter of the particle for which the capture efficiency has the value of
0.50 (50%). Putting Dcut instead of D and 0.50 instead of capture efficiency into
the equation for block flow, Dcut is calculated from the equation given below.
(2.6)
From this equation, cut diameter for the cyclone was calculated to be 7.0 µm. For
a typical cyclone size and the most common cyclone velocity and gas viscosity,
the cut diameter is about 5 µm. [31]
Pressure drop
The pressure drop can be calculated by an equation of the form [31],
(2.7)
Table 2.5 Particle Capture Efficiency
Particle Diameter, µ
ηblock ηmixed ηemprical
0.1 1.02E-04 1.02E-04 2.05E-04
1 0.010 0.010 0.020
2 0.041 0.040 0.076
5 0.256 0.226 0.339
8 0.656 0.481 0.567
10 1.025 0.641 0.672
12 1.475 0.771 0.747
15 2.305 0.900 0.822
D cut = ( 2π N Vc ρ part
9 Wi µ ) 1/2
V i ² ρ g
2∆ P = K
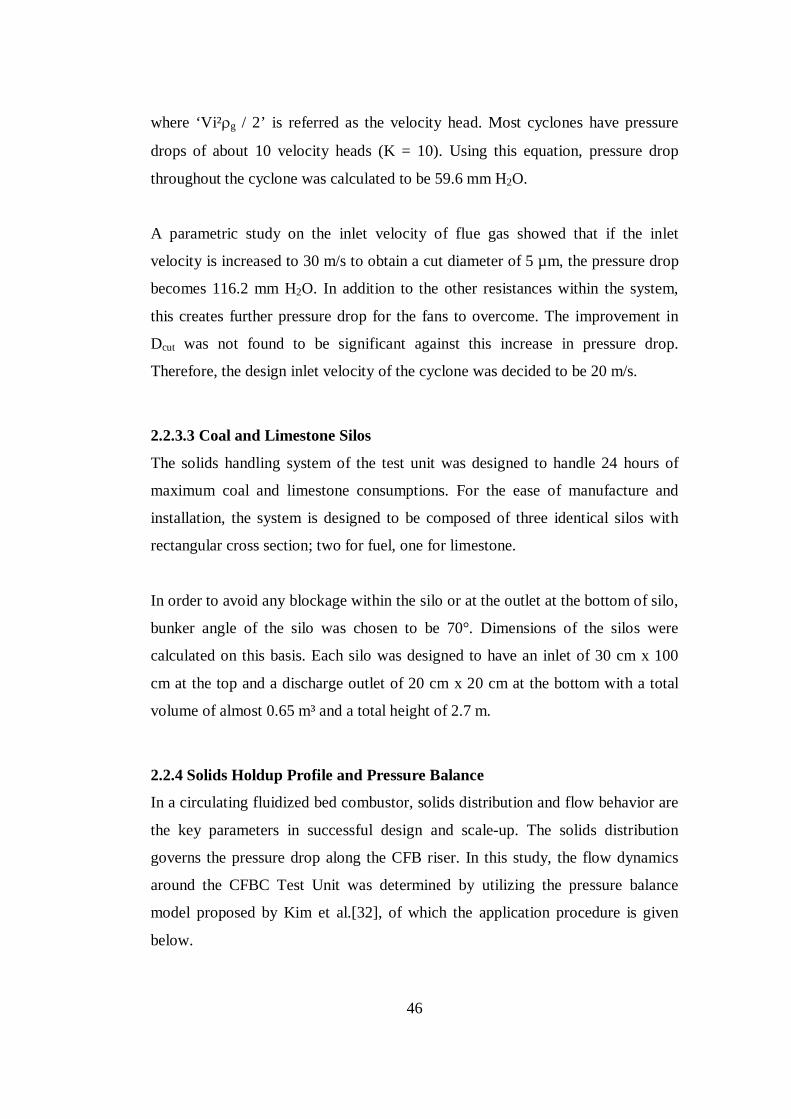
46
where ‘Vi²ρg / 2’ is referred as the velocity head. Most cyclones have pressure
drops of about 10 velocity heads (K = 10). Using this equation, pressure drop
throughout the cyclone was calculated to be 59.6 mm H2O.
A parametric study on the inlet velocity of flue gas showed that if the inlet
velocity is increased to 30 m/s to obtain a cut diameter of 5 µm, the pressure drop
becomes 116.2 mm H2O. In addition to the other resistances within the system,
this creates further pressure drop for the fans to overcome. The improvement in
Dcut was not found to be significant against this increase in pressure drop.
Therefore, the design inlet velocity of the cyclone was decided to be 20 m/s.
2.2.3.3 Coal and Limestone Silos
The solids handling system of the test unit was designed to handle 24 hours of
maximum coal and limestone consumptions. For the ease of manufacture and
installation, the system is designed to be composed of three identical silos with
rectangular cross section; two for fuel, one for limestone.
In order to avoid any blockage within the silo or at the outlet at the bottom of silo,
bunker angle of the silo was chosen to be 70°. Dimensions of the silos were
calculated on this basis. Each silo was designed to have an inlet of 30 cm x 100
cm at the top and a discharge outlet of 20 cm x 20 cm at the bottom with a total
volume of almost 0.65 m³ and a total height of 2.7 m.
2.2.4 Solids Holdup Profile and Pressure Balance
In a circulating fluidized bed combustor, solids distribution and flow behavior are
the key parameters in successful design and scale-up. The solids distribution
governs the pressure drop along the CFB riser. In this study, the flow dynamics
around the CFBC Test Unit was determined by utilizing the pressure balance
model proposed by Kim et al.[32], of which the application procedure is given
below.
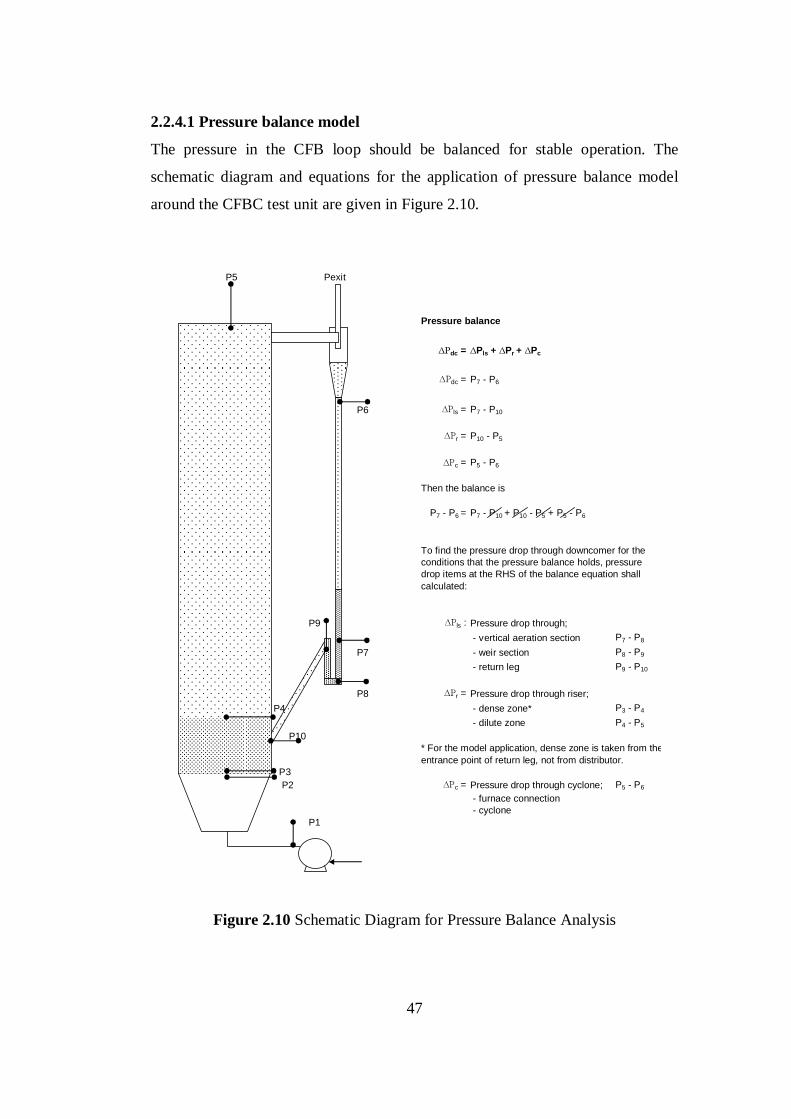
47
2.2.4.1 Pressure balance model
The pressure in the CFB loop should be balanced for stable operation. The
schematic diagram and equations for the application of pressure balance model
around the CFBC test unit are given in Figure 2.10.
Figure 2.10 Schematic Diagram for Pressure Balance Analysis
P5 Pexit
Pressure balance
∆Ρdc = ∆Pls + ∆Pr + ∆Pc
∆Ρdc = P7 - P6
P6 ∆Ρls = P7 - P10
∆Ρr = P10 - P5
∆Ρc = P5 - P6
Then the balance is
P7 - P6 = P7 - P10 + P10 - P5 + P5 - P6
To find the pressure drop through downcomer for the conditions that the pressure balance holds, pressure drop items at the RHS of the balance equation shallcalculated:
P9 ∆Ρls : Pressure drop through;
- vertical aeration section P7 - P8
P7 - weir section P8 - P9
- return leg P9 - P10
P8 ∆Ρr = Pressure drop through riser;
P4 - dense zone* P3 - P4
- dilute zone P4 - P5
P10* For the model application, dense zone is taken from theentrance point of return leg, not from distributor.
P3P2 ∆Ρc = Pressure drop through cyclone; P5 - P6
- furnace connection - cyclone
P1

48
2.2.4.2 Pressure drop through riser (∆Pr )
The pressure balance around the CFB loop is directly related with the voidage
profile. For calculation of pressure drop through riser, pressure drops through
dense zone and dilute zone are separately analyzed. For this analysis, particle
holdup profile within the riser is required.
Solid hold up in the dense bed of riser (εsd)
Particle hold up is assumed to be constant within the dense zone [33]. Then, solid
hold up for the dense bed is determined by the following equation:
= 1 + 0.103 ( )1.13 ( ) -0.013 (2.8)
where,
εs* = Gs/(ρs(Ug - Ut)): solid holdup at uniform flow with slip velocity = Ut (2.9.a)
Ud = Gs/ρs: superficial solid velocity (2.9.b)
and,
Ug : gas velocity in the dense zone
ρs-dense : dense zone particle density
ρg : gas density
Gs : solid circulation rate
Ut : terminal velocity of particles
Solid hold up at uniform flow, εs*, which is defined by (2.9.a) is related with the
hold up in the dilute zone. Therefore, the variables in (2.9.a) are based on dilute
zone, that is mainly composed of circulating fly ash particles. Then, to be
employed in (2.9.a), the terminal velocity for circulating fly ash is calculated
from: [34]
= ( ) 1/2 (2.10.a)
εsd
εs*
Ug
Ud ρs-dense - ρg ρg
Ut 4 dp-dilute (ρs-dilute - ρg ) g
3 ρg CD

49
where,
24 73.69(e-5.0748φs)Rep CD =
Rep (1 + (8.1716e-4.0655φs)Rep
0.0964+0.5565φs) + Rep + 5.378e-6.2122φs
(2.10.b)
dp ug ρg Rep = µ
(2.10.c)
and,
φs : sphericity for circulating fly ash
ug : superficial velocity at dilute zone
ρs-dilute : dilute zone particle density
dp-dilute : dilute zone particle size
µ : gas viscosity
Putting Ut into (2.9.a) with the input data given previously, solid hold up at
uniform flow, εs*, is obtained. Then using (2.8), solid hold up within dense zone is
obtained.
Solid hold up in the dilute zone of riser (εs)
Following equation is used for calculating the solid holdup at any height (z) in the
dilute zone:
εs - εs∞ εsd - εs∞ = exp(-a (z - zd)) (2.11)
where,
z : height in the riser (variable)
zd : height of the dense bed
εsd : solid hold up at dense zone (2.8)
a : decay constant in the riser
εs∞ : average solid hold up at dilute zone
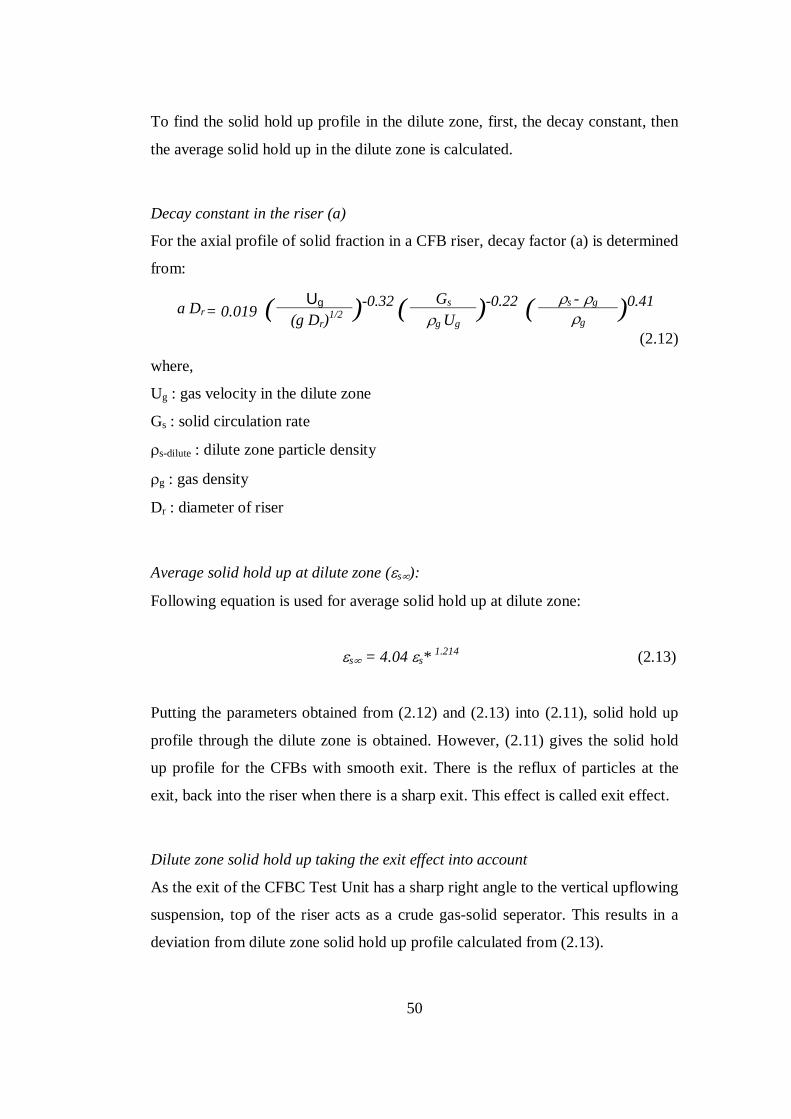
50
To find the solid hold up profile in the dilute zone, first, the decay constant, then
the average solid hold up in the dilute zone is calculated.
Decay constant in the riser (a)
For the axial profile of solid fraction in a CFB riser, decay factor (a) is determined
from:
Ug Gs ρs - ρg a Dr= 0.019 ( (g Dr)1/2 )-0.32 ( ρg Ug )
-0.22 ( ρg )0.41 (2.12)
where,
Ug : gas velocity in the dilute zone
Gs : solid circulation rate
ρs-dilute : dilute zone particle density
ρg : gas density
Dr : diameter of riser
Average solid hold up at dilute zone (εs∞):
Following equation is used for average solid hold up at dilute zone:
εs∞ = 4.04 εs* 1.214 (2.13)
Putting the parameters obtained from (2.12) and (2.13) into (2.11), solid hold up
profile through the dilute zone is obtained. However, (2.11) gives the solid hold
up profile for the CFBs with smooth exit. There is the reflux of particles at the
exit, back into the riser when there is a sharp exit. This effect is called exit effect.
Dilute zone solid hold up taking the exit effect into account
As the exit of the CFBC Test Unit has a sharp right angle to the vertical upflowing
suspension, top of the riser acts as a crude gas-solid seperator. This results in a
deviation from dilute zone solid hold up profile calculated from (2.13).

51
Deviation of solid holdup by particle reflux (∆εsr)
The deviation of solid hold up as a result of exit effect is defined by the following
equation:
∆εsr = Ce εse exp(-ae(Hf - zf)) (2.14)
where,
Ce : reflux constant
εse : solid hold up at the exit (obtained from (2.6) @z = 8 m)
ae : decay constant affected by the exit geometry of the riser
Hf : height of the dilute zone
zf : height in the dilute zone (variable)
Reflux constant (Ce)
Reflux constant is obtained from,
(Ug - Ut)² Gs He De Ce = 0.046( g Dr
)1/2 ( ρs (Ug - Ut) )-1/3( dp
)1/3 ( Dr )-3/4
(2.15)
where,
Ug : gas velocity in the dilute zone
Ut : terminal velocity of the dilute zone particles
Gs : solid circulation rate
ρs : dilute zone particle density
ρg : gas density
Dr : diameter of riser
De : diameter equivalent of the riser exit
dp : dilute zone particle diameter
He : projected height of the riser exit

52
Decay constant affected by the exit geometry of the riser (ae)
Decay constant affected by the exit geometry of the riser is defined by the
following equation:
(Ug - Ut)² Gs De ρs - ρg aeDr = 1.27(
g Dr )1/2 ( ρs (Ug - Ut) )
-1/2 ( Dr
)-1/2 ( ρg )-1 (2.16)
Then, the deviation of solid holdup within the dilute zone is calculated from
(2.14) taking the zf values in the range of 0 m to dilute zone height. Then, solid
holdup profile within the dilute zone including exit effect is calculated by the
equation below:
(εsi )corrected = εs
i + ∆εsri (2.17)
where the superscript i stands for any point along the height of dilute zone.
Pressure drop through riser (∆Pr )
Pressure drop through the riser is calculated from the equation given below by
using solid holdup in the dense zone and by integrating corrected solid holdup
profile in dilute zone:
∆Pr = ρs g (εsd zd + ∫εs dz) (2.18)
However, as there are two type of particles within the system under consideration,
the equation is rewritten as follows:
∆Pr = ρs-dense g εsd zd + ρs-dilute g ∫εs dz (2.18.a)
Then, for the input data and parameters calculated above, and by integrating the
corrected profile of dilute zone solid hold up given by (2.17), riser pressure drop
is calculated.

53
2.2.4.3 Pressure drop through Cyclone (∆Pc )
In this analysis, the connection between riser and cyclone is also included in the
pressure drop term for the cyclone.
Pressure drop in the horizontal section between Riser and Cyclone (∆Ph)
Pressure drop through the connecting duct between riser and cyclone is calculated
by the following equation:
∆Ph = Gsh ( 2.84 + 0.0108 Ugh² ) (2.19)
where,
Gsh : solid mass flux based on horizontal section area of cyclone connection
Ugh : average velocity at cyclone connection
Pressure drop through the Cyclone (∆Pc)
Although it was calculated during cyclone design, pressure drop through the
cyclone is calculated again as a part of this model from the following equation:
[31,32]
∆Pc = Ccy (Ar/Ac)² ρg Ug² / 2 (2.20)
where,
Ccy : velocity head coefficient
Ar : cross sectional area of riser
Ac : inlet area of cyclone
Ug : superficial velocity at riser
2.2.4.4 Pressure drop in the Loop seal (∆Pls)
For pressure balance analysis, the loop seal is divided into two sections: Vertical
aeration and weir sections:

54
Figure 2.11 Schematic diagram of loop seal (1.Weir, 2.Vertical aeration)
Pressure drop through the loop seal is simply obtained from the addition of
pressure drop values at weir and vertical aeration sections:
∆Pls = ∆Pw + ∆Pva (2.21)
In the weir section, solid flow is in a fluidizing state so that the pressure drop is
defined as:
(∆P/L)w = ρs-ls (1 - ε) g (2.22)
where,
Lw : length of weir section - design basis (see Figure 2.11)
ε : voidage in loop seal and downcomer
ρs-ls : particle density in the loop seal
D ls
Vertical aeration L w
L va
H dc
A B Bottom aeration
1
2
To riser

55
To obtain voidage of fluidized bed in weir section, following correlation is
adopted: [32]
1 µ ρg Uo ε = 2.1
(0.4+ (4 ( dp² (ρg (ρs - ρg))φs
²g )0.43)1/3) (2.23)
where,
Uo : fluidizing gas velocity at loop seal
ρs-ls : particle density in the loop seal
ρg : gas density in the loop seal
µ : gas viscosity in the loop seal
φs : particle sphericity
Then voidage of weir section is obtained from (2.23) and put into (2.22) to obtain
pressure drop.
For the pressure drop in the vertical aeration section, following equation is used:
[32]
(∆P/L)va = 0.0056Gsd0.51ρbulk
2.01dp-0.97Dls
-0.76 (2.24)
where,
Dls : diameter of loop seal
Lva : length of vertical aeration section (see Figure 2.11)
ρbulk : bulk density of dilute zone particles
Gsd : solid mass flux based on loop seal area
Obtaining the pressure drops through vertical aeration and weir sections, pressure
drop through loop seal is calculated from (2.21).

56
2.2.4.5 Pressure balance for downcomer (∆Pdc )
Pressure drop through downcomer, thus the solid mass and height is obtained
from pressure balance. This procedure gives the height of accumulated fly ash at
the downcomer leg to keep the system in balance.
Pressure drop through downcomer
Pressure drop through downcomer is obtained from the following balance
equation:
∆Pdc = ∆Pls + ∆Pr + ∆Pc (2.25)
As the entrance of loop seal leg into the riser is almost at the middle of the dense
zone, pressure drop through dense zone is multiplied by 0.5 and then the pressure
drop through riser is recalculated to be used in (2.25).
∆Pr = ∆Pdense / 2 + ∆Pdilute (2.26)
Then from (2.25), pressure drop through downcomer is obtained.
Solid mass in downcomer
Having found the pressure drop through downcomer, solid mass is calculated:
Mdc = ∆Pdc Adc / g (2.27)
where,
Adc : cross sectional area of downcomer (Ddc = Dls in Figure 2.11)
Solid height in downcomer
Solid height in downcomer is obtained from the following equation given for solid
mass in downcomer:

57
Mdc = ρs-dc (1 - εdc) Hdc Adc (2.28)
where,
ρs-dc : particle density in the downcomer
εdc : voidage of solid bed in downcomer (same as loop seal)
Hdc : height of the solid bed in the downcomer (see Figure 2.11)
As Mdc is found from (2.27) and the other parameters in (2.28) are known, only
unknown, Hdc, is obtained by rearranging the equation.
2.2.4.6 Solid mass in riser and loop seal
Similar to the calculation of solid mass in downcomer, solid mass in riser and
loop seal are obtained.
Solid mass in riser
Solid mass in riser is calculated from:
Mr = ∆Pr Ar / g (2.29)
Putting the pressure drop values for dense and dilute zones instead of ∆Pr, solid
mass in dense and dilute zones are also obtained.
Solid mass in loop seal
Solid mass in loop seal is calculated from:
Mls = ρs-ls (1 - εls) Lls Als (2.30)
where,
ρs-ls : particle density in the loopseal
εls : voidage of the solid bed in the loop seal (2.23)

58
L ls : total length of the loop seal (Lls = Lw + Lva) (see Figure 2.11)
Als : cross sectional area of the loop seal (downcomer)
2.2.4.7 Input Data to the Pressure Balance Model
The input data for the application of pressure balance model is composed of
design basis, physical properties and some parameters calculated from these data.
Operating conditions and dimensions of the system are defined as design basis in
Table 2.6. Particle properties are obtained from the experimental studies
previously carried out on the 0.3 MWt bubbling fluidized bed combustor test rig
firing the design coal for the CFBC test unit under consideration [35-37]. Physical
properties of air and combustion gas are based on the data from reference
literature [38, 39]. Physical properties for pressure balance model are given in
App. C. Based on the design basis and physical properties, input data given in
Table 2.7 is obtained. Although the pressure balance model is applied for various
solid circulation rates within the range of 5 – 25 kg/m²s, for illustration purpose,
the results of the pressure balance model is presented here for Gs = 15 kg/m²s.
Some of the input parameters and results varies for different Gs values.
Table 2.6 Design Basis for Pressure Balance Model
Superficial velocity in the riser Ug 5 m/s
Superficial velocity in dense zone ug 3 m/s
Diameter of the riser Dr 0.25 m
Height of the riser z 8 m
Height of the dilute zone Hf 7 m
Cross sectional area of riser Ar 0.0491 m²
Length of weir section Lw 0.5 m
Diameter of loop seal Dls 0.1 m
Length of vertical aeration section Lva 0.5 m
Cross sectional area of downcomer Adc 0.0079 m²

59
Table 2.7 Calculated Input Data for Pressure Balance Model
Solid circulation rate (variable parameter) Gs 15 kg/m²s
Solid mass flux at cyclone connection Gsh 39.95 kg/m² s
Solid mass flux at loop seal Gsd 93.75 kg/m² s
Diameter equivalent of the riser exit De 0.18 m
Projected height of the riser exit He 0.2 m
Gas velocity at loop seal Uo 0.01 m/s
Average velocity at cyclone connection Ugh 15 m/s
Empirical coefficient for velocity head at cyclone Ccy 10
Inlet area of cyclone Ac 0.0126 m²
2.2.4.8 Results of the Pressure Balance Model
Using the input data given above, the pressure balance model is applied to the 150
kWt CFBC Test Unit Design. During the progress of pressure balance model
application, it is also required to calculate some parameters given in App. C. The
pressure balance model resulted in the operating parameters given in Table 2.8.
Solid hold up profile in the dilute zone (εs)
Solid hold up profile through dilute zone is obtained from (2.11) without
considering the effect of sharp turn at riser exit. The deviation of dilute zone solid
hold up profile by particle reflux as a result of exit effect is obtained from (2.14).
Table 2.8 Results of Pressure Balance Model (Gs = 15 kg/m²s)
Results for Gs = 15 kg/m²s Solid hold up in the dense bed of riser εsd 0.25487
Average solid hold up at the dilute zone εs∞ 0.004106
Voidage of solid bed in downcomer εdc 0.20
Voidage in loop seal εls 0.20
Solid height in downcomer, m Hdc 2.10

60
The array of the results of both equations are added to each other and the solid
hold up profile through the dilute zone, including exit effect is given in Figure
2.12.
2.2.4.9 Pressure drop profile
Following the solid holdup profile through the riser, the pressure drop values for
riser, cyclone, downcomer and loop seal are obtained. The results are given in
Table 2.9. Starting from the outlet of air blower, pressure loop profile for the solid
circulation rate of 15 kg/m²s is obtained and shown in Figure 2.13.
0
2
4
6
8
0.0 0.1 0.2 0.3 0.4
Solid hold-up
Hei
ght,
m (
z=0
@ d
istr
ibut
or p
late
).
w/o reflux w/ reflux
Figure 2.12 Solid Holdup Profile Prediction for Dilute Zone (Gs = 15 kg/m²s)

61
Table 2.9 Pressure Drops within the CFBC Loop (Gs = 15 kg/m²s)
Dense zone ∆Pdense 471.8 mmH2O Dilute zone ∆Pdilute 740.4 mmH2O Cyclone duct ∆Ph 21.5 mmH2O Cyclone ∆Pc 59.6 mmH2O Loop seal ∆Pls 508.4 mmH2O Downcomer ∆Pdc 1565.8 mmH2O
-2
0
2
4
6
8
0 400 800 1200 1600 2000
Pressure, mm H2O(g)
Hei
ght,
m (
z=0
@ d
istri
buto
r pl
ate)
.
Figure 2.13 Pressure Loop Profile (Gs = 15 kg/m²s)
As can be seen from the figure, combustion air at the outlet of the blower is at a
pressure of 1590 mmWG. Calculation procedure of this value is based on the
design criteria that the pressure at the cyclone exit is approximately balanced or is
slightly negative. To be on the safe side, design basis for the pressure at the

62
cyclone exit is taken as 0 mmWG. Then, adding up the pressure resistances from
cyclone back to the blower outlet – dilute zone, dense zone, distributor, air piping
– leads to pressure requirement at the blower exit. The pressure values displayed
in Figure 2.13 stands for the points given in Figure 2.10 as explained below:
The data point at the bottom of the profile given in Figure 2.13 is the pressure
value at the blower exit (P1=1590mmWG). From the blower to the air box of the
combustor, ∆P through the piping is approximately 200 mmWC (P2 = 1390
mmWG). Then, air passes through the distributor plate designed to have a ∆P of
0.2 times that of dense zone [15, 34], 94.2 mmWC, and it enters the combustor
(P3=1345mmWG). As given in Table 2.9, with ∆P values of 471.8 mmWC and
740.4 mmWC through the riser, pressure decreases first to 823 mmWG (P4) after
dense zone and then to 81 mmWG (P5) at the riser exit. Passing through the
cyclone duct and the cyclone, pressure at the cyclone exit drops to 0 mmWG (P6),
where pressure is balanced as it is the design basis. As a result of the particle hold
up within the downcomer having a height of 2.1 m, the pressure at the entrance of
loop seal increases to 1615 mmWG (P7). At the exit of loop seal, where the
particles enter the combustor, pressure is 1107 mmWG (P9), balanced with the
pressure of dense zone at the height of recycle leg. Pressure drop through CFBC
loop leads to the amount of solids in the system as given below:
Table 2.10 Solid mass within the CFBC loop
Dense zone Mdense 23.14 kg
Dilute zone Mdilute 36.32 kg
Downcomer Mdc 12.29 kg
Loop seal Mls 5.85 kg

63
2.2.5 Heat Transfer Analysis
As given in ‘detailed design of combustor’, the combustor is composed of five (5)
modules, each having 47.5 mm refractory lining at the inner surface. Second and
third modules along the combustor are cooled, and the others are only insulated
from outside.
2.2.5.1 Modules without Cooling
First, fourth and fifth modules of the combustor, designed without cooling system,
are insulated with ceramic fiber blanket from outside to have an external surface
temperature of 60°C, and these modules only have heat loss from the external
surface to the surroundings. The schematic diagram, summarizing the heat
transfer analysis for this design is given in Figure 2.14. As can be seen from the
figure, heat transfer through the pipe material is not taken into account. It is
assumed that the resistance of carbon steel pipe to heat transfer is negligible
compared to other layers.
As 60% of the combustion air is fed from the bottom as primary air, combustion
reaction will not be complete within the dense zone. Based on the heat transfer
analysis over the dense zone module (module-1), even 60% of the combustion
reaction takes place within module-1, temperature within the module does not
exceed 850°C, typical operating temperature of CFBCs. As a result of this, there
need not be any cooling along this module as the dense zone will be cooled by the
primary air entering the combustor from the bottom. Considering the cooling duty
in second and third modules, it is not required to design the fourth and fifth
modules with cooling systems, either. Therefore, for the modules without cooling,
following heat transfer analysis is carried out based on Figure 2.14.
Heat balance for combustor inner surface leads to the equation for module surface
temperature at R1, following the procedure below:
Qconv-in = Qcond1 (2.31)

64
Inserting the equations given in Figure 2.14 into (2.31):
hi Ro (Tc - Tc-s) = - k1 r1 (dT1 / dr1) (2.32)
Rearranging (2.32):
Ro
R1
R2
EQUATIONS
Qconv-in = hi 2π Ro L (Tc - Tc-s)
Qcond1 = k1 2π r1 L (dT1 / dr1)
Qcond2 = k2 2π r2 L (dT2 / dr2)
Qconv-out = ho 2π R2 L (Ts - Ta)
Qconv-in
Qcond1
Qconv-out
Qcond2
Layer 1(refractory)
Layer 2(insulation)
25 cm
Figure 2.14 Schematic Heat Transfer Diagram for First and Fourth Modules

65
(2.33)
Then the equation for Tr1, temperature at R1, in terms of temperatures within
combustor and at inner wall of combustor is obtained by integrating (2.33):
(2.34)
On the other hand, heat balance for outer surface of the insulation leads to the
second equation for Tr1, but in terms of ambient air temperature at the laboratory
and temperature of outer surface of insulation:
Qconv-out = Qcond2 (2.35)
Inserting the equations given in Figure 2.14 into (2.35):
ho R2 (Ts - Ta) = - k2 r2 (dT2 / dr2) (2.36)
Rearranging (2.36):
(2.37)
Then the second equation for Tr1 is obtained by integrating (2.37):
T r1 R1
dr 1
r 1
Tc-s Ro
h i Ro (T c - Tc-s) - k1
dT1 = ∫ ∫
T r1 = T c-s -h i Ro (T c - Tc-s)
ln ( R1 / Ro )k 1
T s R2
dr 2
r 2
Tr1 R1
dT2 h o R2 (T s - Ta )
- k2∫ ∫

66
(2.38)
Heat balance over the whole system of refractory, pipe and insulation, leads to the
equation for inner surface of refractory:
Qconv-out = Qconv-in (2.39)
Inserting the equations given in Figure 2.14 into (2.39):
ho R2 (Ts - Ta) = hi Ro (Tc - Tc-s) (2.40)
Then the equation for Tc-s is obtained by rearranging (2.40):
(2.41)
Employing (2.34), (2.38) and (2.41) with the following procedure, temperutare
values at the boundaries and insulation thickness is obtained:
1. Guess a value for the thickness of insulation.
2. Calculate the inner surface temperature of combustor from (2.41).
3. Calculate temperature at R1 (carbon steel surface) from (2.34) and (2.38).
4. Check if the results of (2.34) and (2.38) are equal to eachother.
5. Calculate error between two values.
6. Guess a new insulation thickness with respect to error calculated at step 5
and restart the procedure from step 2.
Input data for the application of this procedure is given in Table 2.11.
T r1 = T s +h o R2 (T s - Ta )
ln ( R2 / R1 )k 2
Tc-s = T c -h o R2 (T s - Ta )
h i Ro

67
Table 2.11 Input Data for Heat Transfer Analysis of Modules w/o Cooling
Temperature in the combustor, Tc 850 °C
External surface temperature of insulation, Ts 60 °C
Ambient temperature, Ta 15 °C
Heat transfer coefficient to combustor wall, hi 80 W/m²K
Heat transfer coefficient for external surface, ho 15 W/m²K
Thermal conductivity for layer 1 (refractory), k1 1 W/mK
Thermal conductivity for layer 2 (ceramic fiber), k2 0.06 W/mK
Radius of combustion chamber, Ro 0.125 m
Thickness of refractory, δ1 0.0475 m
Radius of module excl. insulation, R1 0.1725 m
Inserting the input data into equations, results given in Table 2.12 are obtained. As
can be seen from the table, modules without cooling should be insulated with a
5.6 cm thick ceramic fiber, resulting in a total diameter of 45.7 cm. However, as it
is also explained in insulation section at Chapter III, standard ceramic blanket
thickness starts from 25 mm and increases by factors of this value. As a result of
this, application thickness is revised to 5.0 cm that also reduced total diameter of
modules approximately to 45 cm. This 6 mm decrease in insulation thickness is
expected to be covered by the natural insulation effect of air cavities between
combustor, ceramic blanket and aluminum cover sheet. These cavities generally
arise from wrapping practice that is not perfect at small diameter applications.
Table 2.12 Results for Heat Transfer Analysis of Modules w/o Cooling
Temperature at inner surface of refractory, Tc-s 834.6 °C
Temperature at outer surface of refractory, Tr1 784.9 °C
Thickness of layer 2 (insulation), δ2 5.6 cm
Diameter of insulated module, D2 45.7 cm

68
2.2.5.2 Modules with Cooling
Second and third modules of the combustor with cooling system, are designed to
have a number of cooling water channels vertically welded to the external surface
of module. Then the surrounding of the cooling channels and module surface
should be insulated with ceramic fiber blanket from outside to have an external
surface temperature of 60°C. These modules are cooled by water with an inlet
temperature of 15°C, and the design criteria for the maximum outlet temperature
of cooling water is 60°C, not to have evaporation and water hammer in the pipes.
The schematic diagram, summarizing the heat transfer analysis for this design is
given in Figure 2.15. Heat transfer resistance of pipe is neglected also for these
modules, and the combination of pipe surface and cooling water channels is
treated as an equivalent annular cooling water layer.
As the design basis for the combustor is to feed 40% of the combustion air from
the top of first module as secondary air, combustion reaction is expected to
continue within the second module and the third module. However, energy
generation is reduced as there is less combustible material going up the riser. This
results in different cooling duties for module-2 and module-3. In order to have
different amounts heat transfer area in these modules, and based on the heat
transfer analysis over dilute zone modules (module-2 and module-3), the modules
are designed to supply 70% of total cooling duty in module-2, and 30% in
module-3. For this purpose, cooling water surface areas of modules should differ
from eachother. Heat transfer analysis to calculate these surface areas of cooled
modules is carried out based on the schematic diagram and heat balance equations
given in Figure 2.15.
Similar to the approach for uncooled modules, heat balance for combustor inner
surface leads to the equation for module surface temperature:
(2.42)
T r1 = T c-s -h i Ro (T c - Tc-s)
ln ( R1 / Ro )k 1
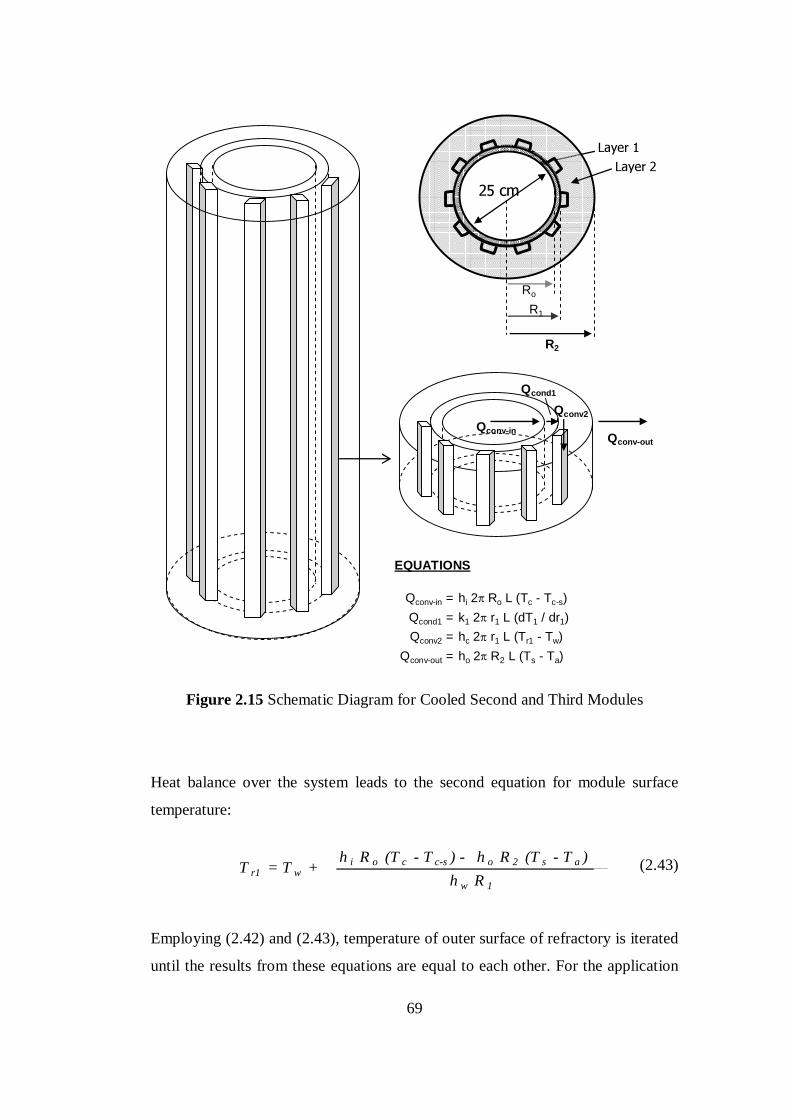
69
Figure 2.15 Schematic Diagram for Cooled Second and Third Modules
Heat balance over the system leads to the second equation for module surface
temperature:
(2.43)
Employing (2.42) and (2.43), temperature of outer surface of refractory is iterated
until the results from these equations are equal to each other. For the application
Ro
R1
R2
EQUATIONS
Qconv-in = hi 2π Ro L (Tc - Tc-s)
Qcond1 = k1 2π r1 L (dT1 / dr1)
Qconv2 = hc 2π r1 L (Tr1 - Tw)
Qconv-out = ho 2π R2 L (Ts - Ta)
Qconv-in
Qcond1
Qconv-out
Qconv2
Layer 1 Layer 2
25 cm
T r1 = T w +
h i Ro (T c - Tc-s) - ho R2 (T s - Ta )
h w R1

70
of this procedure, some of the input data in Table 2.11 and the equivalent heat
transfer coefficients of 125 W/m²K and 80 W/m²K obtained from the correlation
for flow in cooling tubes [40], for cooling water channels of module-2 and
module-3, respectively, are used.
According to these analysis, cooling water flow rates at module-2 and module-3
are predicted to be 890 kg/h and 420 kg/h, respectively, and the number of cooling
water channels on the modules are ten (10) pieces for module-1, and six (6) pieces
for module-3.
2.2.6 Detailed Design of Combustor
As an outcome of the basic design studies, the height of the combustor (riser) was
chosen to be 8 m where as the cross sectional area was calculated to be 0.25 m to
have a superficial velocity of 5 m/s within the riser.
As there is no waterwall within the furnace, the inner surface of modules is
directly exposed to combustion and erosion effects. Then, no common pipe
material, carbon steel or stainless/alloy steel is resistant to these conditions.
Although the unit will not operate frequently, pipe material may be incandescent,
deformed and eroded during operation, if there is no refractory layer inside the
inner surface of the steel pipe. Then there need to be a refractory layer inside,
resistant to erosion. However, refractory is not a good insulator, so that it is not
required to have a thick refractory layer. As a result, the thickness is determined
by the manufacturing limitations as 4.75 cm.
The combustor is required to be manufactured as smaller modules to be
integrated. The reason for this design is as follows: Refractory layer is 4.75 cm
thick and there are a number of ports along the combustor for instruments, solids
feeding, circulation leg etc. Therefore, if refractory is casted into 8 m long pipe,
the refractory layer may not be homogeneous while there are so many obstacles
(ports). In addition, regarding the modularity of the system in terms of flexibility

71
for modifications in the future and ease of installation and dismantling, 8 m
combustor as a single piece would not be effective.
Based on the explanations given above, the combustor riser is decided to be
composed of 6 pieces given below. Air box module is not referred as combustor
module within the text, so that numbering starts from dense zone module as
module-1 and ends up with exit module as fifth module, where from module – 2
to exit module are totally referred as dilute zone modules:
1. air box module (height : 400 mm)
2. module – 1 (dense zone module) (height : 1500 mm)
3. module – 2 (cooled module-1) (height : 2000 mm)
4. module – 3 (cooled module-2) (height : 2000 mm)
5. module – 4 (height : 2000 mm)
6. exit module (height : 500 mm)
The detailed design drawing of the combustor is given in Figure 2.16.
2.2.6.1 Windbox module
The height of this module is 400 mm and the outer diameter of the pipe used for
manufacturing is 273 mm. As there is only the start-up burner in this module, not
to be operated continuously through the test runs, no refractory layer is casted.
Primary air enters the air box from the side through a pipe with a size of DN 100.
On the other side, there is a port for pressure (PT) and delta pressure transmitters
(DPT). Instrument ports of windbox and other modules are given in Appendix C.
2.2.6.2 Distributor
Distributor plate is manufactured from a 5 mm thick plate of AISI 304 material
and it is integrated to a flange to be installed between windbox and dense zone
module. Distributor plate has 645 holes of 2 mm size to have an orifice velocity of
33.6 m/s and creating a pressure drop of 99 mmWC that is approximately 21% of

72
Figure 2.16 Detailed design drawing for the CFBC

73
dense zone pressure drop. At the center of the distributor plate, there is an opening
for a 1” size pipe to discharge the bed material to control the pressure drop within
dense zone during operation and to empty the riser after shut down
2.2.6.3 Module-1
The height of module-1 is 1500 mm and pipe diameter is 355 mm as there is a
refractory layer of 47.5 mm thick at the inner surface of pipe, resulting in a riser
diameter of 250 mm. Bottom of the module is connected to distributor and
windbox module. Solid feed enters from 250 and 500 mm height through DN 80
pipes from the eastern side with an angle of 60°. On the western and northern
sides, there are ports for transmitters and gas probes. The circulating particles
coming from loop seal enters the combustor at 250 and 750 mm height through
DN100 pipes with an angle of 60°. At 1200 mm, secondary air enters the
combustor through a collector surrounding the combustor that feeds
symmetrically located 8 pieces of ½” pipes having an angle of 60° with the
horizontal axis. There are no cooling water pipes at this module. There are ports
for transmitters and a gas probe along the height. (Appendix C)
2.2.6.4 Module-2
The height of module-2 is 2000 mm and pipe diameter is 355 mm. Bottom of the
module is connected to module-1. There is a refractory layer of 47.5 mm inside
the pipe. At the outside wall of the pipe, 10 pieces of vertical cooling water
channels with 50 mm width are almost symmetrically welded, and there are
collectors at the top and bottom that are connected to cooling water pipes. There
are also ports for transmitters and gas probes along the height. (Appendix C)
2.2.6.5 Module-3
The height of module-3 is 2000 mm and pipe diameter is 355 mm. Bottom of the
module is connected to module-2. There is a refractory layer of 47.5 mm inside
the pipe. At the outside wall of the pipe, 6 pieces of 50 mm vertical cooling water

74
channels are symmetrically welded, and there are collectors at the top and bottom
that are connected to cooling water pipes. As explained before, cooling
requirement is expected to differ along the combustor, as combustion takes place
all over the height. This brings different cooling duties with respect to height and
different number of cooling channels. There are also ports for transmitters and gas
probes along the height of this module, too. (Appendix C)
2.2.6.6 Module-4
The height of this module is also 2000 mm and pipe diameter is 355 mm. Bottom
of the module is connected to module-3. There is a refractory layer of 47.5 mm
inside the pipe. There are also ports for transmitters and gas probes (Appendix C).
There are no cooling water pipes at this module as the cooling duty is at the
second and third modules.
2.2.6.7 Exit module
The height of exit module is 500 mm and pipe diameter is 355 mm. Bottom of the
module is connected to module-4. Top of the module is covered and the cyclone
exit is at the southern side. There is a refractory layer of 47.5 mm inside the side
walls and top cover of the module. There are also ports for transmitters and a gas
probe (Appendix C). There is no cooling at this module.
2.2.6.8 Instrument Ports
In order to summarize the distribution of each type of port, height and distance
with previous instrument along the combustor for pressure, differential pressure,
temperature and gas probes are tabulated, and the layout of instruments and gas
probe ports with respect to their axis are given in Appendix C.

75
CHAPTER 3
PROCUREMENT and INSTALLATION
3.1 Procurement Activities
The procurement activities include detailed design and manufacture of
components and purchase of some of the equipment.
3.1.1 Steel Structure
Based on the loads of riser, silos and other auxiliary equipment, the steel structure
was designed. The structure was manufactured of 80mmx80mm profiles as main
column and beams, and 40mmx40mm profiles as transversal components. The
structure was designed to be composed of two parts; main body as the structure up
to 5500 mm elevation, and the upper element to be connected to main body going
up to 9500 mm elevation. 3-D view of structural design and picture of main body
before installation are given in Figure 3.1.
3.1.2 Circulating Fluidized Bed Combustor Riser
As previously given in ‘Detailed Design’ section of Chapter 2, the insertion ports
at appropriate size and for functions given below were welded to each module.
• Temperature, pressure, delta pressure and gas probe ports
• Solids feeding pipes (Fuel, limestone, bed material)
• Solids recycle pipes (Fly ash)
• Secondary air ports
• Riser-cyclone connection

76
Details of the components like distributor and bearing plates, combustor modules,
cyclone and loop seal are given in the following sections.
3.1.2.1 Distributor and Bearing Plates
Distributor plate, which is a key component for the fluidization of the bed, is a
perforated plate composed of 645 orifices with 2 mm diameter. It was designed to
Figure 3.1 Main Steel Structure of the Test Unit

77
fit on a bearing plate that also takes on all the load of combustor modules. This
design gives the capability to dismantle the windbox module from the bottom
without disturbing the bearing system of combustor modules at the upper levels.
The pictures of distributor and bearing plates, and combustor modules are given in
Appendix D.
3.1.2.2 Module – 1
This first module of the combustor, standing on the distributor plate, bearing plate
and windbox module is the dense zone module within which the dense bed will be
formed. This module is separated from other modules because of the number of
insertion ports.
There are two alternative feed points for fuel and limestone at eastern axis, two
alternative feed points made of stainless steel for circulating fly ash at southern
axis, eight ports symmetrically distributed to the axis covered with a collector for
secondary air injection, and various temperature, pressure and gas probe ports
distributed along the height of module at other axes. The ports described above
are stainless steel pipes for which the 47.5 mm of their length was inserted into
the module to be embedded in the refractory layer, and the outer part to be
embedded in the insulation that is 50 mm thick. After welding the pipes, a
template with a diameter of 250 mm was coaxially fixed to the module, and the
refractory was casted under vibration in between the module and the template.
After the template was removed, a refractory layer having a smooth surface with
an inner diameter of 250 mm was obtained as shown at Figure 3.2 (a) and (b).
3.1.2.3 Module – 2
Module-2, standing on the dense zone module (module-1) has instrument ports
and it is the first module with cooling system. There are ten (10) vertical water
channels with 5 cm width, welded almost symmetrically to the outer surface of the
module. The top and bottom of the cooling water pipes are connected to feed and
discharge collectors of cooling water, that surrounds the module.

78
Figure 3.2 Inner views of Modules 1 and 2
(a) (b) (c)

79
Similar to the other combustor modules, pipes for instruments are welded to this
module prior to refractory casting. The picture showing the inner view of this
module is also given at the bottom of Figure 3.2 (c).
3.1.2.4 Module – 3
Module-3 is the third module along the combustor, has instrument ports and it is
the second and the last module with cooling system. As a result of the cooling
duty assumed to vary along the height of combustor, there are six (6) vertical
water channels and two collectors at the outer surface of this module for feeding
and discharge. The instrument pipes and water channels were welded, then the
refractory was casted, same as the application in previous module.
3.1.2.5 Module – 4
Module-4, being the fourth module along the combustor and the last one before
the short exit module, has instrument ports but there is no cooling system, as the
unit was designed for absorbing the heat of whole system in the previous two
modules. The instrument pipes were welded and the refractory was casted, same
as the other modules.
3.1.2.6 Exit Module
Exit module, having the connection to the cyclone is the fifth and the last module
along the combustor. There are three ports in total; one for temperature
transmitter, one for pressure impulse line and one for gas probe. After welding the
cyclone duct to the southern axis with a cross section of 220 x 110 mm, and
welding the instrument ports, refractory was also casted to this short module
having a height of 500 mm.
3.1.3 Cyclone
Detailed design of cyclone, which has a total height of 1,270 mm was presented in
the previous chapter. Based on this design, cyclone was manufactured of stainless

80
steel to resist the high temperature and abrasive fly ash particles. The connecting
duct between riser and cyclone was designed to have 10 m/s gas velocity at riser
exit and get narrower to reach 20 m/s at the cyclone inlet within a small distance.
The picture of cyclone prior to installation is given in Appendix D.
3.1.4 Start-Up Burner
The start-up burner was not only required for heating up the combustor before
feeding coal to the system, but also for supplying the necessary heat during the
refractory drying operation. As the heat loads required for drying and start-ups are
lower and the design of the combustor is not similar to conventional boilers,
industrial start-up burners can not be used in this test unit. Therefore, a start-up
burner to fire natural gas and LPG was designed to be integrated to the wind box
of the combustor having a similar function to a duct burner in a conventional
boiler. This start-up burner heats up the combustion air before entering the
furnace through the distributor. The schematic diagram of the burner is given
below in Figure 3.3.
IgnitorPilot light burner
Nat.Gas/LPG. Ejector
Compressed Air
Gas+Air Mixture
Needlevalve
Ejector N.Gas/LPGBall Valve
Regulator
Compressed airNeedle valve
Figure 3.3 Schematic Diagram of Start-up Burner System

81
As can be seen from the figure, compressed air and fuel are mixed at the ejectors
and fed to the burner from the bottom for main flame and to the pilot light burner
that is for ignition and flame continuity.
Start-up burner was designed for firing pressurized natural gas and liquified
petroleum gas (LPG) with compressed air to prevent breaking off the flame by the
flow of fresh air coming from the blower at a pressure slightly higher than
atmospheric. However, unless necessary measures are taken, compressed air
limits the gas flow at the mixing point because of pressure dominancy of
compressed air over fuel. Therefore, the ejectors also given in Figure 3.3 were
manufactured to generate a suction of fuel by using pressure of compressed air.
In order to achieve efficient reaction, a reservoir is located at the bottom of
burner, where compressed air and gas is mixed prior to combustion. As the
temperature at the core of flame is expected to be over 1000°C at the burner, alloy
steel material of AISI 310 standard was used for main body.
As the burner was integrated to the windbox, and the distributor is located at the
top of burner at an elevation of 25 cm from the burner throat, it was required to
limit the expansion of flame to minimize direct exposion of distributor plate to the
flame. For this purpose, top of the burner was covered with a stainless steel sieve
as seen from the picture given in Figure 3.4. During operation of burner, steel
sieve becomes incandescent and it enhances the combustion while unburnt fuel
passes through it.
Pilot flame is ignited with an electrical lighter, continuously generating an arc at a
high frequency to guarantee the flame, not only for the initial ignition of burner
but also for system safety. An observation window is located at windbox for
watching both flame contact with distributor plate and flame break off during
combustion test start-ups.

82
Figure 3.4 Start-up Natural Gas/LPG Burner
As can be seen from the top in Figure 3.4, start-up burner was integrated to the
windbox from inside, primary air inlet is at the right below the burner, observation
window is in the middle at the top, and the pilot light burner is at the left which is
located at the exit of burner.
The regulators, connections, ejectors and ball and needle valves for compressed
air and gas that are shown in schematic diagram were installed outside the
windbox.
After the gas and compressed air valve train were integrated with the burner,
ignition tests were carried out before the windbox was connected to the bearing
plate at the bottom of combustor. As the tests were successfully completed, the
windbox was installed. The final picture of windbox is given in Appendix D.

83
3.1.5 Piping
The piping system for air, gas and water connections including pipes, elbows,
Te’s, flanges and other elements, are composed of the following lines with given
materials:
• Primary and secondary air lines for combustion air (carbon steel)
• Flue gas line (carbon steel)
• Cooling water lines for cooled combustor modules (standard water piping
and flexible hydraulic hoses)
• Cooling water lines for gas sampling probes (standard water piping)
• Process connections for differential pressure transmitters (stainless steel)
• Compressed air lines (carbon steel)
• Purge tubing (stainless steel)
• Gas lines for start-up burner (standard natural gas pipes and stainless steel
tubes)
3.1.6 Combustion Air Fan
Combustion air flow rate requirement was presented in the basic design section.
The relevant data from that section for combustion air fan selection is given
below.
The maximum dry air flow rate based on an excess air ratio of 20% is 210.66
Nm³/h. For experimental purposes, excess air ratio may be increased up to 60%
temporarily. Therefore, maximum air flow rate based on 60% excess air was
calculated as 280 Nm³/h.
The other important parameter for fan design is the discharge pressure. Although
the exact pressure drop of the combustor will be observed during the operation,
modeling studies predicts the maximum pressure requirement to be in the range of
1800 – 2000 mmWC. Then the main operating conditions for the fan are; air flow
rate: 280 Nm³/h, and discharge pressure: 2000 mmWG.

84
For the conditions given above, conventional centrifugal fan designs are not
suitable. Conventional fans for the discharge pressure given above need to have a
design capacity of almost 2000 Nm³/h. Using that kind of a fan, it is required to
control the flow with a damper, which would be working at 10% open position
that would be creating a pressure drop exceeding the operation pressure limits of
the fan, and there would be no flexibility for controlling the flow rate. Therefore,
it was required to install an equipment that gives higher pressure at lower flow
rates, and has an identical characteristic to that of a centrifugal fan. The best
solution was found to be the equipment defined as ‘Side Channel Blower’.
There need to be a butterfly valve installed at the discharge of the blower to
control the flow of the combustion air by creating an additional pressure to that of
the system. Thus, at normal operating conditions (200 Nm³/h = 3.33 Nm³/min),
the blower discharge pressure will be increased to almost 300 mbar by the help of
this valve. The driver of the blower was selected to be CT VFD – Constant torque,
variable frequency driver, to control the speed of motor for better tuning of the air
flow in addition to air flow control valve.
3.1.7 Solids Handling and Feeding
3.1.7.1 Solids Handling
Fuel and limestone handling system is composed of three (3) identical silos, each
with a capacity of 0.65 m³. As given in detailed design section, rectangular part of
the silos have a cross section of 300mm x 1000 mm and a height of 1600 mm.
Bottom part of the silos has a slope of 70° with the normal and the discharge cross
section of the silos has the dimension of 200mm x 200mm. The silos were
manufactured from carbon steel sheet with a thickness of 3 mm. The picture of the
silos before installation are given in Appendix D.
85
3.1.7.2 Solids Feeding
Fuel and limestone stored in the silos are discharged by screw conveyors having
frequency invertor drivers. The flow rate of the solids are determined by the
variation of weight of the silo, then the frequency of the electric motor is to be
varied to reach the target flow rate.
The screw conveyors at the bottom of each silo are connected to an intermediate
bunker of an air lock that will feed the solids and isolate the combustor from the
solids feeding system. Otherwise, the pressure at the dense zone of combustor
results in backflow of solids and combustion gas out of the system. Solids feeding
system is composed of 2 (two) screw conveyors of 50 kg/h capacity for fuel, 1
(one) of 10 kg/h capacity for limestone, 1 (one) for bed material silo with 150
kg/h capacity, and 1 (one) air lock as main feeder with 150 kg/h capacity. Details
and pictures can be found in Appendix D.
3.1.8 Instrumentation
Process instruments for which the specifications were presented in the previous
chapter were purchased and the details are presented in this section. The
specifications of all instruments are given in Appendix D.
3.1.8.1 Pressure transmitters (PT)
Gage pressure transmitters for absolute pressure determination were supplied
from Dwyer Instruments Inc. These transmitters are for measuring combustion air
pressure at primary and secondary air lines to correct air flow rate calculations and
for pressure at the windbox.
3.1.8.2 Delta Pressure transmitters (DPT)
Delta pressure transmitters for measuring the pressure drop at various points
within the system were supplied from Dwyer Instruments Inc. These transmitters
are required for the measurements along the riser and downcomer and at the riser
exit, cyclone exit and distributor plate.

86
3.1.8.3 Air flow rate transmitters (FT)
Air flow rate is determined by the combination of flow sensors and delta pressure
transmitters supplied from Dwyer Instruments Inc. Two flow sensors and their
differential pressure transmitters are required for determining the air flow rate
through primary and secondary air lines.
3.1.8.4 Air rotameters (RM)
Fluidizing and conveying air required for J-valve is measured and manually
controlled by rotameters supplied from Dwyer Instruments Inc.
3.1.8.5 Water flowmeters (FT)
Cooling water flow rates at the cooled modules of the combustor (module-2 and
module-3) are determined by the flow sensors supplied from Teksan.
3.1.8.6 Temperature transmitters (TT)
Temperature of air, cooling water, flue gas, combustion chamber and circulation
system are measured by temperature transmitters of K type T/C and Pt100
temperature elements supplied by EPA Ltd.
3.1.8.7 Air flow control valves (FCV)
Air flow rates are controlled by the pneumatically actuated control valves
supplied from MCS Ltd. The butterfly valves, actuated by double effect
pneumatic piston actuators with analog I/P positioners are located on primary and
secondary air pipes right after the lines are separated at blower exit.
3.1.8.8 Load Cells (WT)
Solid flow rates are determined by continuously measuring the weight of silos by
the load cells supplied from ZEMIC Inc. The weight of each silo is measured by
two off model L6G load cells with a capacity of 600 kg and C3 accuracy level.

87
3.1.8.9 Load Cell Current Transformers
As the load cells generate electrical signals (mVolts/Volt ) directly proportional to
the load that it is weighing, it is required to add up the signals from two load cells
of each silo, and to convert that electrical signal to an analog signal with the range
of 4-20 mA that is convenient for the DCS. For this purpose, three (3) separate
current transformers, model ST-50811, manufactured by Sistek Electronic
Systems are purchased for each silo, and the signals coming from load cells of
each silo were connected in parallel to a single transformer that generates 4-20
mA analog signal against silo weight within the range of 0 – 1200 kg.
3.1.8.10 Oxygen Analyzer
The aim of combustion control in a furnace is mainly maximizing the combustion
efficiency. One of the most important indicators for efficient combustion is the
oxygen concentration within flue gas leaving the furnace. Professional experience
on industrial boilers resulted in oxygen concentration ranges for efficient
combustion of different type of fuels ranging from coal to natural gas and fuel oil.
For a circulating fluidized bed boiler operation, it is recommended that flue gas
oxygen concentration on wet basis should be kept in the range of 3.5 – 4% to
achieve maximum combustion efficiency. It has been experienced that, below this
range, oxygen concentration within the furnace is not sufficient to complete the
combustion reactions, and on the contrary, over the range, excessive amount of air
enters the system, and some amount of combustion energy generation is
consumed for heating up this excess air. In order to attain oxygen concentration
for most efficient combustion, fuel and combustion air flow rates are adjusted. For
this combustion control, common application is to employ an on-line oxygen
analyzer with ZrO2 (zirconium oxide) cell at the exit of furnace.
Oxygen concentration of flue gas entering the zirconia cell affects the
conductivity of the cell, and this change in the conductivity is transformed into an
analog signal by a transmitter standing for the oxygen concentration within the
range of 0 – 21%.

88
As there is not a long gas sampling system including gas sampling probes, suction
lines, gas conditioning system and analyzers, this type of online analyzers
simultaneously transmits the oxygen concentration on wet basis to the control
system without any lag in measurements.
For this purpose, TRIMOX ZrO2 Oxygen/Temperature Analyzer Model YTK-400
was purchased to be integrated to the Test Unit, for which the picture is given in
Figure 3.5. As the temperature limit for the analyzer is 400°C, it was installed on
the flue gas line at a point that the cooling analysis for flue gas gives a
temperature lower than this limit.
In addition, as the zirconia cell of the analyzer operates at 600°C, the cell is
heated up with a resistance fed by a 10VDC power supply. Besides, the
transmitter of the analyzer for generating analog signal for oxygen concentration
Figure 3.5 Trimox ZrO2 Oxygen Analyzer

89
requires 24VDC power supply. Both of these external power supply systems were
manufactured and installed within the control system panel.
3.1.8.11 Purge System
Process connections of gage and differential pressure transmitters that were
installed on systems containing particles have a considerable potential to be
blocked by the solids within the stream. Accumulation of these particles in the
process impulse lines results in unreliable measurements. Therefore, process
connections of pressure transmitters in any industrial application having the risk
of blockage, are installed together with a purge system. Therefore, a purge system
for which the schematic diagram is given in Figure 3.6 was designed for the riser
and downcomer of the Test Unit.
As can be seen from the diagram, solenoid valves of type 3/2 (2 of 3 channels
open) were located between the combustor and the transmitters. Each stainless
steel impulse line inserted to a pressure port along the combustor, enters solenoid
Figure 3.6 Sample Diagram for Purge System
DPT
Compressed Air
CFB Riser
3/2 SOV
3/2 SOV
DPT
DPT

90
valve, and in normal position of valve, the piston in the valve is in the position to
keep the line to the transmitter open. When the valve is energized, piston within
the valve switches to the other line, which is connected to compressed air piping.
By this way, compressed air purges the impulse line up to the combustor to avoid
any accumulation within the tubing for pressure measurement.
3.1.9 Electrical System
3.1.9.1 Motor Control Hardware
The requirement for fine tuning of combustion air blower, solids feeders and bed
drain necessitates utilizing frequency invertor drivers (FID) for the motor control
of these equipment. The FIDs and other auxiliary contactors and hardware were
donated by Schneider Electric company for the Test Unit Project. In the scope of
donation, Telemecanique products of main thermic magnetic switch, 1 off 7.5
kW, 2 off 0.55 kW and 3 off 0.37 kW FIDs, magnetic circuit breakers of these
drivers, contactors, relays, selector switchs and other accessories were supplied by
the company.
3.1.9.2 Motor Control and Auxiliary Loads Panel
In addition to the motor control hardware, there are auxiliary loads within the
system, like lighting, field energized tranmitters, purge system and local electrical
network. For feeding all of these loads and for installing the motor control
hardware, a motor control and auxiliary panel was designed and manufactured by
Eptim Electric Ltd. Company.
The panel has selector switches at the front panel for the control of motors either
from the panel (local) or directly from DCS computer (remote). By this function,
the start/stop commands and motor frequencies can be dictated from the DCS
computer in the control room.

91
3.1.9.3 Motor Protection and Isolation Reactors
During commissioning tests of the Test Unit, it was realized that there appears a
typical problem that is experienced in facilities using frequency invertors (FID).
The harmonic signals generated as a result of electrical load accumulated on the
FIDs are reported to affect the transmitters within any system, unless necessary
measures are taken. Although compensation panels for electrical side and
isolation filters for instrumentation side are typical precautions for industrial
applications, these methods are not convenient for this simple design of electrical
system of the Test Unit. Moreover, after diagnostic tests, it was concluded that
only the temperature transmitters in contact with the metal body of combustor
modules are affected from the harmonic signals generated by FIDs. After this
conclusion was reached, first of all, earthing application for these thermocouple
transmitters was improved, then a research was carried out on the methods of
reducing harmonic signals. As a result, it was decided to use motor protection
reactors before feeding, and isolation reactors at the outlet of FIDs. By this way, it
was aimed at absorbing the harmonic signals generated by the noisy voltage
output of FIDs.
The reactors were supplied from ERGUN Electric Ltd. and installed in the motor
control panel. Reactors were connected to input and output of all motor feeders
having FID. During the tests and combustion runs, it was observed that the error
of temperature readings (8-10°C), was at least 95% reduced for each transmitter.
3.1.9.4 Cabling
The application details for the cabling were determined based on the requirement
for the separation of the routes of electrical cables and signal cables not to have
any impact of AC current on the 24VDC analog signals. Based on these details,
necessary cables, cable trays, covers, conduits and other cable laying accessories
were supplied.
For electrical cabling works, cross section of each cable was chosen to be
appropriate for the power of the motor. Then, cable trays between motor control

92
panel and the consumers, hangers, cables for lighting and 220 V distribution,
distribution boxes, lighting elements, sockets with suitable protection class, spiral
conduits for connection to every consumer, cabling for low load field energized
instruments like solenoid valves, load cell current transformers and oxygen
analyzer, and glands and connection elements for all these cabling works were
supplied and installed due to the application plan.
For control cabling works, multi channel cables were used for reducing the
number of cables. Then, for collecting and distributing these multi channel cables,
a central junction box was installed. From the central junction box, 6-channel
cables were laid to local junction boxes, that are connected to the nearby
transmitters by one-channel control cables. Moreover, a switch box was designed
for selecting the control system of the instruments commonly used with the 0,3
MWt BFBC Unit. Similar to electrical cabling, cable trays, hangers, spiral
connections and other accessories for signal cable laying were used.
3.1.10 Insulation
In order to insulate the combustor, the material should be resistant to the high
temperature at the outer surface of combustor, minimum 900°C, and should have
superior thermal insulation characteristics to result in minimum thickness. The
research for the commercial product to fit this requirement was found to be the
ceramic based blankets which belongs to the class of refractory fiber blankets.
Ceramic fiber blanket that has a classification temperature of 1260°C, also has
excellent insulating performance and thermal stability. For this application,
ceramic blankets with 96 kg/m³ density, 7320 mm long with 25 mm thickness and
3660 mm long for 50 mm thickness, both having 61 cm width were supplied. For
covering the insulation material, aluminum sheets of 1000 mm x 2000 mm having
0.8 mm thickness were used.

93
3.2 Installation Activities
3.2.1 Combustıon Air System
The combustion air system starts from the blower, and ends with the windbox and
secondary air collecter inlets. Within the scope of this system, following
equipment were installed and tested:
• Side Channel Blower
• Primary and Secondary Air Control Valves
• Instrumentation – Temperature, Pressure and Flow Rate Measurements
As the noise level was lower than expected, side channel blower was installed
indoors, and the piping at the outlet of blower was divided into two for feeding
primary and secondary air lines having diameters of 4 inches and 3 inches,
respectively. In order to control the flow through these pipes, pneumatically
operated butterfly valves with I/P positioners were installed on each line.
Both valves were set to operate linearly in between 0% - 100% opening range
according to the analog output signal generated by the DCS depending on the
command given by the operator. However, as the valves are butterfly type, the
flow passing through the valve is not linearly proportional with percent opening.
For this reason, it is not reliable to depend on the position of valves to predict
flow rates. Then, it was required to have continuous measurements on primary
and secondary air lines and to control the valve position manually or
automatically from the DCS to attain the set point of air flow.
For air flow rate measurement, flow sensors at appropriate size were installed on
both pipes. Impulse lines coming from two flow sensors at different locations
along the pipe cross section were connected to the low and high pressure sockets
of Magnesense differential pressure transmitter manufactured by Dwyer.
Moreover, gage pressure transmitters and a temperature transmitter is located on
94
the lines for the correction of flow rate calculation. The analog signals generated
by these transmitters are logged by the DCS, and are employed in the flow rate
expression. Based on air flow rates calculated from this expression, control valves
are adjusted for supplying required amount of primary and secondary air.
3.2.2 Instrumentation
The instruments for which the details were given in previous sections were
installed, and cabling works and signal tests were completed. The integration
activities are presented in this section for the following instrument groups:
• Temperature Transmitters
• Pressure Transmitters
• Differential Pressure Transmitters
• Load Cells
• Cooling Water Flowmeters
3.2.2.1 Temperature Transmitters
Temperature transmitters (TT) with K type thermocouple were installed into
stainless steel insertion tubes for TTs along the combustor. The transmitters were
inserted into the combustor through tubings such that the the tip of stainless steel
thermowell is at the center line. Then, the threaded fitting on each transmitter was
screwed tightly to its counterpart at the insertion tube providing sealing of
insertion port against gas leakage to the outside of combustor.
Similarly, transmitters of Pt100 type resistance thermometers were installed
tightly to inlet and outlet collectors of water cooled combustor modules, and to
primary air pipe.

95
3.2.2.2 Differential Pressure Transmitters
As it is described within purge system section, differential pressure transmitters
were installed along the combustor to measure the pressure drop. In addition
identical transmitters were connected to the impulse lines along the downcomer to
determine the height of particles accumulated within the pipe. For this purpose,
one of the ports of the transmitter was connected to the process (downcomer
pipe), and the other is left open to the atmosphere. By this way, the transmitter
connected to the level higher than particle bed in the downcomer senses the
vacuum created by induced draft fan, as the downcomer is directly connected to
the cyclone. Then it can be realized that the particle level within the downcomer is
at an elevation in between two differential pressure transmitters; one measuring
vacuum pressure and the other measuring atmospheric pressure. Three differential
pressure transmitters were connected to three different levels along the
downcomer. Similar to combustor riser, the process connections of these
transmitters also pass through solenoid valves, as there are only particles within
downcomer pipe expected to block the impulse lines unless purged.
3.2.2.3 Load Cells
Installation of load cells were done after the mechanical installation works of the
test unit were completed. The reason for this is that it is not allowed to carry out
any welding work at anywhere of the system, as the load cells can be damaged by
welding. This is because load cells are made of metal, directly in contact with the
carbon steel silos touching the steel structure, and they are generating mV signals.
For the mounting of load cells, steel profiles were located at both sides of three
silos for fuel and limestone. On this structure, base plates were welded for each
load cell. At the front side of the load cell, the silo is hanged to the load cell by a
chain as seen in Figure 3.7. The design of this hanging system prevents the silo
from transferring any portion of its load to the steel structure of test unit, and it
provides bearing of the silos only by the load cells. However, it is required to
absorb the side loads on the silos that can be generated by any external effect, and

96
can result in weighing failure. In order to prevent this failure, special components
were manufactured and the silos were fixed to one of the main columns of test
unit. It is worth noting that these connection parts do not take any vertical load on
themselves or transfer it to the column, which can otherwise result in
measurement error.
On the other side, in order to weigh the silo accurately, the feeder located at the
bottom of each silo for discharging the solids should not contact with the platform
under it. Otherwise, some of the load of solid material is transferred to the feeder
via the outlet of silo, then to the platform, which will result in lower reading of
silo weight.
This deviation from the real load can not be expected to be constant that the error
varies with the total amount of solids in the silo and prevents a reliable correction
of the measurement. Therefore, as it was decided during detailed design studies,
the feeders were integrated to the silos via flange connections, thus the weights of
motor, gearbox and the screw feeder are transferred to the load cells. The
Figure 3.7 Load Cell Installation

97
installation works for the solids handling system were completed in accordance
with this design approach, and the picture of the feeders are given in Figure 3.8.
In addition to these three (3) silos designed for handling fuel and limestone, a
smaller silo was manufactured for bed material. As the bed material consumption
was not required to be logged, it was not required to have a load cell system for
this silo to measure its weight continuously. Instead, bed material flow is
determined by weighing the solids before loading into the silo.
After the installation works were completed, the feeder rotation speeds were
tested for variable solid flow rate for fuel and limestone silos, and the silo weights
were followed from the DCS computer. All motors including bed material feeder
that only has start/stop control, were also tested for remote control from DCS.
The outlet of these four (4) screw feeders integrated to the silos were directly
connected to the bunker of main feeder by flexible pipes. As described previously,
main feeder, which extracts the solid mixture in its bunker and feeds into the
combustor, is air lock type, and it prevents leakage of combustion gases through
Figure 3.8 Screw Feeders of Fuel and Limestone Silos

98
the solid feeding leg. Even there is a trace amount of clearance within the main
feeder for leakage, the screw feeders under the silos were designed to operate
fully charged by particles, which seals the solids feeding system. Although there
are two solid feeding points with different elevations at the first module of
combustor for experimental testing purposes, there is only one main feeder for
solids feeding. As the main feeder was fixed in position to the steel structure, two
different connection parts were designed and manufactured. Each one of these
parts is suitable for connecting one of the feeding points to main feeder. This
design gives the flexibility for switching between solid feeding heights.
3.2.2.4 Water Flowmeters
Cooling requirement for the combustor is met by the cooling water channels
vertically placed on the external surface of modules 2 and 3. In order to determine
the water flow rate through each moule, water flowmeters were installed upstream
the inlet collector of each module. Based on the analog signals generated by these
flowmeters and by Pt100 transmitters at hot water outlet collector of each module,
heat transfer analysis for cooling was carried out. Water flow rate to the modules
were manually controlled by ball valves at the drainage pipe of each module,
based on the temperature readings within the combustor and within hot water
collectors displayed on computer screen.
3.2.3 Control System
The signal cables coming from each instrument of the test unit were collected in
local junction boxes, each grouping six (6) signals. The group of signals from
each local box were carried by a single cable having six channels, to the central
junction box installed at 5.0 m elevation nearby the test unit. From the central
box, the signals were carried to the control room via identical multi-channel
cables and each channel was terminated at the DCS panel. Each signal cable
coming from a local junction box was labeled with a unique cable number at the
instrument connection, and this label was kept unchanged at local boxes, central
junction box, and upto the termination modules at DCS panel. By this approach,

99
input of the instruments at the DCS panel were easily tracked by following the
cable number of any device. During the progress of cabling works for control
signals, DCS cabinet of DeltaV control system and its desktop PC donated by
Emerson Process Management Ltd. were also installed in the control room.
DCS hardware including controller, analog input, analog output, digital input and
digital output cards were installed on the card carrier by following the instructions
supplied with the hardware. Following that, the PC, by which control
programming and system operation is executed, was installed, and the
communication functions between PC and DCS were tested. After the diagnostic
tests of control cards were completed, the input location of each signal coming
from the test unit was verified by cross check of cable number and performing
loop-check tests. Following verification, signals were entered to the control
software installed in the computer to define their tag names, signal types and
physical ranges. The picture of controller and I/O cards installed on DCS panel is
given in Figure 3.9.
The next step for control system set up was to program the DeltaV controller to
perform the following functions for process control, data acquisition and logging:
Figure 3.9 DeltaV Controller and I/O Cards

100
• It is provided that all the instrument signals due to I/O lists based on
process and instrumentation diagrams of test unit, and the data to be
calculated by the control system are logged within control computer.
• A representative diagram of the test unit and other pages were prepared for
displaying on-line data coming from the instruments and calculated
parameters, and also for input data entry, start/stop functions and set point
definition of motors, control valves, solenoid valves etc. The list of display
screens are as follows:
o Main page representing the general view of the test unit (Figure
3.10), displaying online data necessary for operator.
o Solids handling and feeding system page, displaying the weight of
silos and allowing start/stop commands and frequency entry for
screw feeders and main feeder.
o Analysis entry page for entering ultimate analysis of fuel(s) and
limestone handled in each of three (3) silos.
Figure 3.10 Main Display Page of Control Computer
101
• Graphical displays for process history view, and instantaneous data of
main parameters were prepared for the following data allowing the
operator to follow the trends even months old:
o Temperature history for each transmitter at dense zone (first
module of combustor)
o Temperature history for each transmitter at lean zone (rest of the
modules of combustor)
o Differential pressure history for each transmitter at dense zone
(first module of combustor)
o Differential pressure history for each transmitter at lean zone (rest
of the modules of combustor)
o Weight history for each silo
o Solid flow rate history for each silo
In addition to these graphical displays prepared for following a group of
data from instruments/equipment simultaneously, historical view for any
other data that is logged by the PC can be displayed on the screen.
• For output signals, modules for set point and status entry were located on
the screens. The set point entries that can be made via the control
computer are as follows:
o Solids feeding and discharge system: Start/stop commands and
frequency set points for screw feeders and main feeder.
o Combustion air and flue gas systems: Start/stop commands and
frequency set point for blower, and set point for percent opening of
air and flue gas flow control valves.
o Purge system: Start/stop commands for energizing each group of
solenoid valves connected to differential pressure transmitters.

102
• Control system was programmed to calculate some parameters, display
them on the screen, and log to the control computer to help operation by
employing measurements and input data entered by the operator. These
calculated parameters and how they are obtained are as follows:
o Primary and secondary air and flue gas flow rates: Differential
pressure through the flow elements and static line pressure and
temperature of these streams, are employed in the equations of the
flow elements to reach volumetric flow rate in terms of m³/h unit.
o Average temperatures of dense and lean zone: Temperature data
from transmitters within both zones are separately sent to
averaging modules to obtain a average temperature for each zone.
o Superficial velocity: Based on primary and secondary air flow rates
and average temperatures for each zone, superficial velocity within
the zones are calculated to help the operator keep the velocity
within design conditions for a circulating fluidized bed combustor.
o Solids flow rates: The decrease in the weight of each silo in a
specified time is converted to flow rate of each solid stream
extracted by its screw feeder. As the sensitivity of silo weighing is
not appropriate for short term differentials, this calculation is done
by long term averaging of silo weight signals going up to 1 min.
o Excess air: Based on coal flow rate, theoretical air demand for the
combustor is calculated. Then, dividing actual total air flow rate by
the air demand, actual excess air entering the system is determined.
o Ca/S ratio: For each fuel, the flow rate and combustible sulphur
content is multiplied and total sulphur is converted to molar basis.
Then, amount of calcium entering the system is calculated from its
flow rate and analysis, followed by conversion to molar basis.
Division of calcium by sulphur amount in molar basis gives
instantaneous Ca/S ratio of the solid feed. This parameter helps the
operator to get an idea about actual sulphur capture efficiency.

103
• For a stable operation, automatic control loops were programmed for some
of the main output parameters as given below:
o ID Fan damper control: One PID loop was programmed to control
existing ID fan damper to be automatically commanded by the
DCS to keep the pressure in balance at a defined location like
furnace exit or cyclone exit.
o Solids flow rates: Three PID loops were programmed to control the
frequencies of screw feeders for each solid stream to be
automatically commanded by the DCS to keep the flow rate at the
set point entered by the operator to the control module on the
screen.
o Secondary air ratio: One PID loop was programmed to control the
opening of secondary air flow control valve to be automatically
commanded by the DCS to keep the ratio of secondary air to total
air flow rate, when the frequency of blower or primary air valve
position is changed.
In addition to the functions summarized above, minor improvements were done
on the control system based on the operational experiences gathered during
refractory drying and coal combustion test runs.
3.2.4 Summary of Installation and Commissioning Works
Installation of 150 kWt Circulating Fluidized Bed Combustor Test Unit was
completed with small deviations from detailed design. Then, the auxiliary
equipment and instruments were tested for operation.
The pictures of the facility after installation are given in Figures 3.11 to 3.15.
Figure 3.11 is the picture taken from ground floor. The next picture given as
Figure 3.12, is taken from 5.5 m elevation (1st floor) of Unit Operations
Laboratory. This elevation is the level where the silos were installed. The picture

104
of CFBC together with existing BFBC Test Units can be seen in Figure 3.13,
which was taken from 9.5 m elevation (2nd floor). Another picture taken from the
same level but from a different angle is in Figure 3.14. The final picture of the test
unit is also given from 9.5m level, from an opposite angle of the previous one.
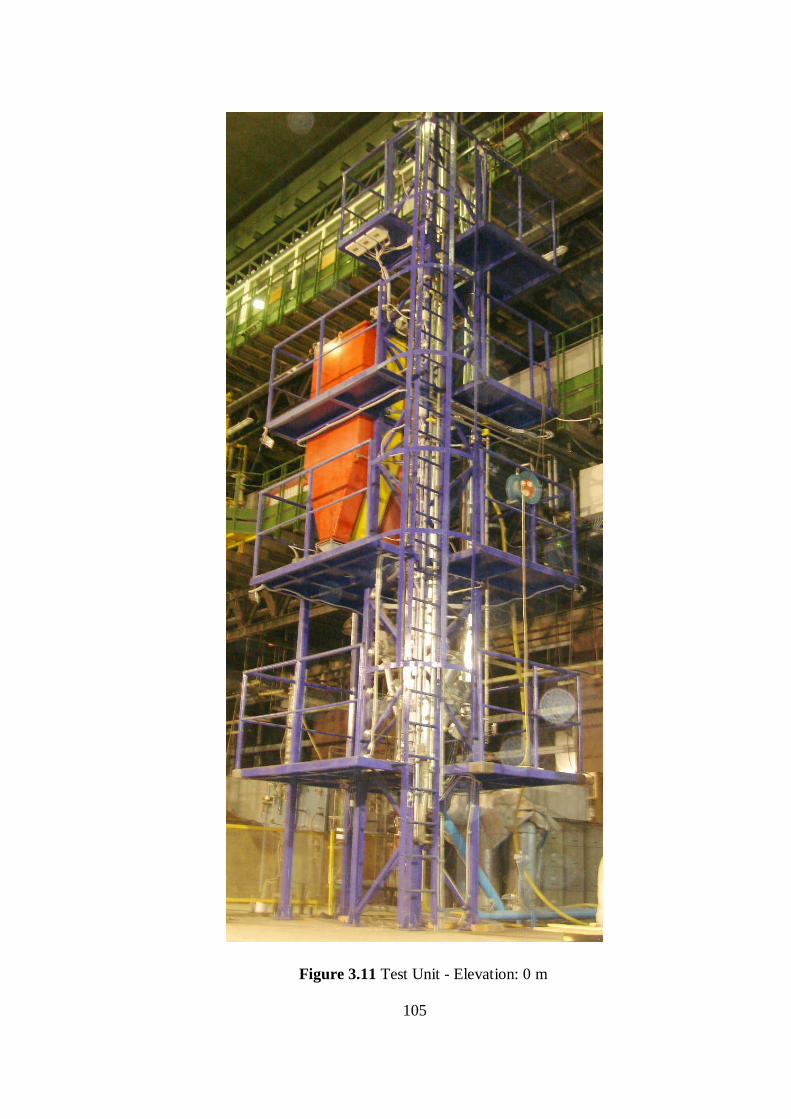
105
Figure 3.11 Test Unit - Elevation: 0 m

106
Figure 3.12 Test Unit - Elevation: 5.5 m

107
Figure 3.13 CFBC and BFBC Test Units

108
Figure 3.14 Test Unit – Elevation 9.5 m (1)

109
Figure 3.15 Test Unit – Elevation 9.5 m (2)

110
CHAPTER 4
OPERATION
The operation of the Test Unit is executed in two steps. The first step is refractory
drying done by firing LPG at the start-up burner for 39 hours, and second step is
the commissioning and combustion tests firing Çan lignite for design assesment of
Test Unit and for investigating combustion characteristics of this lignite.
4.1 Refractory Dryıng
4.1.1 Procedure
As given in detailed design section, inner surface of the combustor is lined with
castable refractory with a thickness of 4.75 cm, from dense zone module up to the
exit module. The refractory material with high coldcrushing strength and
resistance to erosion effects caused by high temperature and high particle
concentration, is supplied from KIL&TAS company. The brand name of
refractory is HyCast NG which is characterized by high alumina and moderate
silica content.
After the refractory powder is mixed with 10% water by weight, casting process is
applied to each module separately. Each module is installed in its place after the
template is dismantled and setting time of at least 24 hours have passed. Setting
time is defined as the time required for the refractory to become physically stable.
After casting, the refractory contains very fine pores filled with water. Therefore,
it needs to be carefully dried to remove the contained moisture to avoid cracking
and explosive spalling when exposed to a rapidly elevated temperature during

111
operation. Initial heating of the refractory causes the contained moisture to
evaporate in the pores and produces pore steam pressure. When the temperature of
the refractory is raised too fast, the contained moisture does not have enough time
to dissipate to the outer surface. This can result in excessive pore steam pressure
buildup causing cracking and explosive spalling. To avoid these problems and to
have a good quality refractory, a carefully planned drying procedure suggested by
refractory manufacturer must be followed. A typical drying schedule for castable
refractories is illustrated in Figure 4.1.
Refractory drying procedure supplied by refractory manufacturer suggests three
holding periods. First one is around 150°C which is slightly higher than the boiling
point of water. The second one is around 300°C, which is the expansion
temperature that is critical for alumina rich refractories. The third one is around
800°C.
0
200
400
600
800
1000
0 20 40 60 80Time, h
Tem
pera
ture
, °C
Figure 4.1 Typical Drying Schedule for Castable Refractories

112
According to refractory supplier, the durations for constant temperature drying
change depending on the amount of refractory, heat dissipation and steam release
rates from the surface. Based on these criteria, a detailed refractory drying
procedure given in Table 4.1 was prepared for 150kWt CFBC Test Unit, where
the holding times at critical temperatures are revised.
The fuel for drying operation was chosen as LPG, as it is not prefered to fire the
combustor with coal because of two main reasons: (i) coal can not be fired stably
at temperatures lower than 600°C; (ii) even at higher temperatures, it is not
recommended to use coal because of its physical interactions with the porous
surface of refractory. However, it could not have been estimated whether the
combustor can reach 850°C from the bottom to the module at the top while firing
LPG at the start-up burner located in the windbox. In addition to this, another
unknown was that at what extent the uniformity of temperature could be achieved
along the combustor throughout the phases of drying run. Both questions found
their answers during the drying operation that lasted 39 hours long, covering all
the phases of the schedule.
Table 4.1 Ideal Time Schedule for Drying Operation
Phase Temperature
(°C)
Heating rate
(°C / min)
Duration
(hours)
Heating No.1 20 – 150 0.6 3.5
Constant T - 1 150 - 12
Heating No.2 150 – 300 0.5 5
Constant T – 2 300 - 12
Heating No.3 300 – 600 0.7 7
Heating No.4 600 – 800 1 3.5
Constant T – 3 800 - 5
Heating No.5 800 – 900 1 1.5
Cooling 900 – 150 –1 12.5
113
4.1.2 Drying Operation
The stages of drying operation are summarized in this section. In order to display
the progress of temperature values along the combustor throughout the operation,
average temperatures of dense zone (module-1) and dilute zone modules
(modules-2 to 5) are illustrated in Figure 4.2. Although the drying operation was
intended to be executed according to the schedule, the operating conditions,
especially the significant variation of temperature along the height made some
modifications inevitable during operation.
Initially, ID fan and FD blower were started up to sweep away the unburnt gas in
case complete combustion can not be achieved at the burner. However, both ID
fan damper and primary air control valves were adjusted for low flow rate to
prevent burner flame from blowing off. Then the pilot light was ignited by
supplying LPG and compressed air at low flow rates. Following the pilot light,
gas and air valves for main flame were gradually opened to achieve minimum heat
input with stable combustion.
Heating Phase No.1 (30 – 150°C)
Ignition of pilot light and main flame both resulted in a sudden increase in the
temperature with a higher slope than the rate defined for the first heating phase. In
order to compensate this, air flow rate was increased to cool down the combustion
gas generated at the burner. As a result of this, the proposed rate, 35°C/h, was
achieved as an overall average throughout the phase. From start-up of the system,
first heating stage was completed by reaching 150°C at dense zone module in 210
minutes. However, average temperature of the dilute zone modules was 132°C
and it was intended to be increased to the target value during the next phase.
Constant Temperature Phase - 1 (150°C)
This phase of drying was especially for vaporizing the water within the refractory.
Holding time for this phase was determined by the progress of steam release. The
system was kept at constant temperature for 4 hours. Then the burner load was

114
0
200
400
600
800
1000
0 6 12 18 24 30 36 42
Time, h
Tem
pera
ture
, °C
Dense Zone Dilute Zone
increased to reach the average temperature of 150°C along the dilute zone
modules. In response to the temperature increase at the bottom of the combustor,
air flow rate was increased to have better heat dissipation from bottom to top. This
action helped preserving the slight variation of temperature along the riser. After
10 hours of total duration, next phase was started.
Heating Phase No.2 (150 – 300°C)
After the completion of Constant Temperature Phase-1, the system was heated
with a rate of 30°C/h to reach 300°C at the dense zone module in 4 hours.
However, the gap between the average temperatures increased to 70°C. Although
the air flow rate was increased, average temperature of the dilute zone modules
only reached to 230°C by the end of heating. Similar to the previous heating
phase, it was intended to reach the target value for dilute zone during the next
constant temperature phase.
Figure 4.2 Average Temperature Profiles during Drying Process

115
Constant Temperature Phase - 2 (300°C)
This phase of drying is for controlled expansion of the refractory and also for
vaporizing the remaining water. From the end of previous stage, the system was
kept at constant temperature for 4 hours, and then the temperature was increased
for 150 minutes to reach an average of 300°C at the dilute zone modules.
Although the average temperature reached 300°C, the measurement at the exit
module was 267.4°C. Therefore, it was continued to heat up the system for
another 150 minutes to have the exit module reach target temperature for this
phase. However, the gap between bottom and top of the combustor increased
significantly after this heating operation. Total duration for this phase was 10
hours.
Heating Phases No.3 and No.4 (300 – 600°C and 600 – 800°C)
As the dense zone module reached 542°C while bringing exit module to 300°C
during the previous phase, consequent heating phases were merged. After the
previous phase was completed, the system was heated with an average rate of
60°C/h for reaching 800°C at the dense zone by the end of 4 hours. Although the
temperatures at the dense zone module were increased within the limits of
recommended heating rate, upper modules could not reach the temperatures
required by the procedure. As a result of this, following heating and constant
temperature phases were also merged.
Constant Temperature Phase No.3 (800°C) and Heating Phase No.5 (800-900°C)
As the increase in the average temperature of dilute zone was experienced to be
half of the rate of dense zone module, it was required to close the gap between the
temperatures along the combustor. For this purpose, burner load and air flow rate
were increased to their maximum levels which helped better heat dissipation
provided by high velocity within combustor. Temperature within first three
modules reached values over 600°C. However, the target temperature could not be
attained by dilute zone average, as it was reduced by the lower values at the last
three meters of combustor.

116
As the temperature of the upper modules could not reach 850°C, it was decided to
end the drying operation and cool down the combustor. The cooling process was
executed by reducing the burner load initially, then by shutting down the burner,
blower and ID fan for free cooling. Although it was intended to carry out the
cooling phase at the proposed rate, a higher cooling rate reaching up to more than
3°C/min was experienced.
For the uppermost two modules, the drying process had to be finalized during
commissioning tests with coal firing, as the operating temperature of FBCs could
not be attained even at maximum capacity of start-up burner. By firing coal, it was
aimed to take advantage of dispersion of heat generation through the riser, as the
combustion of coal particles takes place along the height rather than gas
combustion at the bottom of riser. In addition to combusting coal particles,
circulating solids originating from inert material and coal ash, help enhanced heat
transfer throughout the combustor, also at the uppermost modules.
4.2 Coal Fired Combustion Tests
4.2.1 Commissioning Tests
As the refractory drying process did not go to completion by firing LPG at the
start-up burner, coal fired commissioning tests were planned to include
finalization of drying procedure for modules 4 and 5. For this purpose, two
separate commisioning test runs were carried out by firing Çan lignite that had
recently been fired in METU 0.3 MWt Bubbling AFBC Test Rig as a part of an
extensive research study on cofiring biomass with this lignite [41].
During the commissioning runs, not only the drying process was completed, but
also the performance of combustor, auxiliary equipment, instrumentation and
control system were tested for combustion test operations.

117
4.2.1.1 Procedure
As the phases of refractory drying procedure up to 600°C was finished at all the
modules of combustor, initial heating of the unit before feeding the coal was not
required to be at slow rates. Therefore, the procedure for these complementary
coal fired drying operations was prepared accordingly. The main phases of
operation are given in Table 4.2. As can be seen from the table, it was planned to
start-up the system by firing gas at the burner, followed by feeding bed material to
be heated up prior to coal feed to combustor. After reaching 600°C while the bed
material was fluidizing, coal feeding was started while the combustion was still
supported by firing LPG until the temperature reached 800°C. The final step was
constant temperature operation at 850°C for finalizing refractory drying and also
for observing coal fired operation performance of the system with respect to
design outputs. After this phase was finalized, the system was shut down.
4.2.1.2 Operation
The profiles of average temperatures within dense and dilute zones, and solids
temperature at loop seal during commissioning run-1 are given in Figure 4.3 from
which the phases of operation can be followed from start-up to shut down.
The system was started up by igniting the gas burner and the temperatures started
to increase along the height of the combustor. After the temperature within dense
zone module exceeded 300°C, bed material was started to be fed into the
combustor.
Table 4.2 Phases of Coal Fired Complementary Operation for Drying
Phase Temperature Fuel
Heating 30 – 300 °C Nat. Gas / LPG
Bed Material Feeding 300 – 600 °C Nat. Gas / LPG
Coal Feeding 600 – 850 °C LPG + Coal
Drying and Operation 850 °C Coal

118
0
200
400
600
800
1000
0 2 4 6 8Time, h
Tem
pera
ture
, °C
Dense Zone Dilute Zone Loop Seal
Resulting in the first peak at dense and dilute zone profiles, cold bed material
absorbed the heat accumulated within the system and reduced the temperature. In
order to balance this decrease and to cover additional heat capacity arised from
bed material, heat input supplied via the burner was increased. Reaching 600°C at
the dense zone module, small amount of coal was fed to the system to observe
whether the conditions within dense zone was appropriate for coal combustion or
not. As the temperatures increased rapidly to 750°C at the dense zone and the flue
gas oxygen concentration decreased simultaneously, it was realized that the
conditions within the system was appropriate for continuous coal feeding. After
the coal feeding was started, the temperature increased to 850°C within the dense
zone. However, as the circulation was started by feeding fluidization air to loop
seal, cold particles in the loop seal destroyed the conditions within the dense zone.
This resulted in sharp decrease of temperature along the riser forming the second
peak after two hours from start-up as shown in Figure 4.3.
Figure 4.3 Average Temperature Profiles for Commissioning Run-1

119
The reason for the circulated particles not being at high temperature is as follows:
Fine particles filled in the downcomer leg and loop seal before start-up were
initially not recycled until the system was heated up. Then, the circulation of these
cold particles was started at a low rate, such that the particles collected by the
cyclone spent too much time to cool down within the downcomer leg which was
not insulated during these trial operations.
As a result of cold inert material flow into the dense bed, interruptions of coal
combustion was experienced and start-up burner was taken into operation for
number of times. At the same time, by increasing coal flow rate, it took more than
two hours for the whole system to recover from this temperature drop, of which
the minimum value can be seen from the figure at a point before the fourth hour of
operation. After 800°C was reached at the dense zone again, heat input support by
start-up burner was ended, then the combustor was operated by firing coal only.
By the end of almost 7 hours of total operation time, it was realized that the loop
seal and dilute zone temperatures would not increase to required values at this
heating rate within a short period of time. Due to this reason and requirements of
some minor revisions on the test unit, the system was shut down to finalize drying
procedure at the next run.
Based on the experiences gathered from the first coal fired run, another
commissioning run was carried out by revising the procedure to start solid
circulation at a higher rate than the first run once dense zone temperature reaches
600°C. Except this revision, the same procedure was followed for this run too.
Average temperature profile of dense and dilute zones and loop seal during
commissioning run-2 are given in Figure 4.4. As can be seen from the figure,
temperature dropped after bed material feeding, forming the first peak. Then the
second peak was observed after circulation was started. Then, the temperatures at
loop seal and dilute zone rapidly increased and got closer to dense zone values
compared to previous drying and coal fired runs.
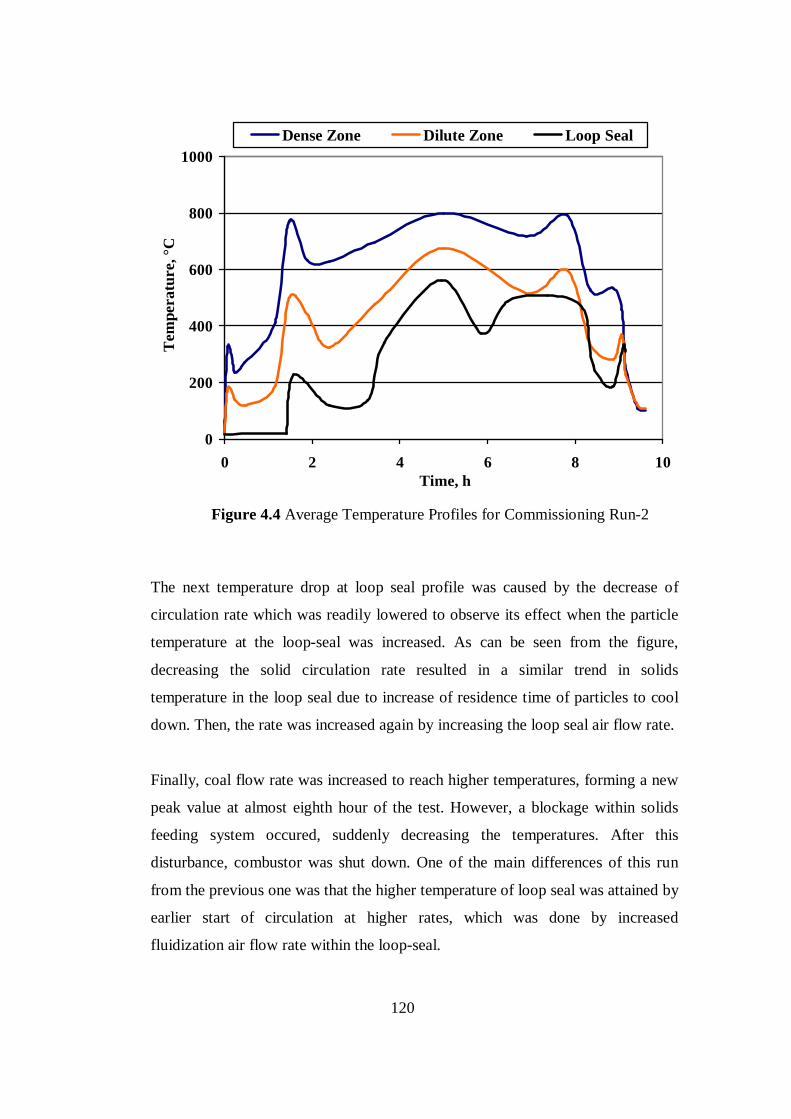
120
0
200
400
600
800
1000
0 2 4 6 8 10Time, h
Tem
pera
ture
, °C
Dense Zone Dilute Zone Loop Seal
The next temperature drop at loop seal profile was caused by the decrease of
circulation rate which was readily lowered to observe its effect when the particle
temperature at the loop-seal was increased. As can be seen from the figure,
decreasing the solid circulation rate resulted in a similar trend in solids
temperature in the loop seal due to increase of residence time of particles to cool
down. Then, the rate was increased again by increasing the loop seal air flow rate.
Finally, coal flow rate was increased to reach higher temperatures, forming a new
peak value at almost eighth hour of the test. However, a blockage within solids
feeding system occured, suddenly decreasing the temperatures. After this
disturbance, combustor was shut down. One of the main differences of this run
from the previous one was that the higher temperature of loop seal was attained by
earlier start of circulation at higher rates, which was done by increased
fluidization air flow rate within the loop-seal.
Figure 4.4 Average Temperature Profiles for Commissioning Run-2

121
The other achievement of this run was the higher dilute zone temperatures, where
every measurement point within the dilute zone including the riser exit exceeded
680°C. This improvement can be explained with the circulation of hot particles
through loop seal that reached 600°C, which did not cool down the dense bed, and
resulted in more heat generation by increased combustion of circulating fine
particles at hotter upper modules. In order to investigate this effect, maximum
temperature profiles along the combustor during drying and commissioning runs
are given in Figure 4.5. As can be seen from the figure, the profile for maximum
temperatures at each measurement point attained during commissioning run-2 had
the smallest slope compared to the previous runs, as a result of solid circulation
rate at high temperature. In light of this investigation, it was determined that the
temperatures at the dilute zone are higher for both coal fired commissioning runs
compared to drying process.
0
200
400
600
800
1000
0 1 2 3 4 5 6 7 8Furnace Height, m
Tem
pera
ture
, °C
Drying Comm. Run-1 Comm. Run-2
coolingsurfaces
coolingsurfaces
Figure 4.5 Maximum Temperature Profiles - Drying and Commissioning Runs

122
It can be seen that from first coal fired run to second one, maximum temperature
profile was improved to be closer to a uniform trend as in ideal CFB combustors.
On the other hand, these temperature profiles of coal fired runs are not acceptable
for a combustion test in a CFB. The reason is that the temperature drop going up
the riser was mostly caused by the lack of insulation. Insulation was not
completed at this stage, as the drying process at upper modules were not finalized.
Since there were many small holes drilled to the external surface of combustor for
helping the refractory loose its water, it was required to keep the combustor
uncovered from outside. As a result of the significant heat loss from external
surface, typical operation temperature (850°C) for a CFBC could not be reached
at the top modules, but considerably higher values could be attained by coal firing
compared to gas fired run and coal fired run with limited solids circulation.
Examining the operating data of these three runs, it is concluded that refractory
drying was completed, drying holes can be sealed and insulation application can
be done. Furthermore, the system proved its performance for a complete coal fired
combustion test with minor revision requirements.
Before the coal fired combustion test, all of the drying holes were welded and the
system was inspected for any leakage prior to wrapping the ceramic fiber
insulation blanket around the combustor. After insulation works were finished, the
system was prepared for the operation. Regarding the revision requirements, the
following works were carried out:
• A venturi was manufactured and installed in the solids feeding leg as
shown in Figure 4.6. The leg was drilled to insert a stainless steel tube for
feeding air to the venturi. The venturi was manufactured by welding two
reduction elements to eachother from the narrow sides. One reduction had
the dimensions of Ø76mm x Ø48mm with a length of 90 mm. The
dimensions of the short reduction was Ø60mm x Ø48mm with a length of
75 mm. Total length of the venturi is 165 mm.

123
This system was designed to generate vacuum at the outlet of main feeder
to prevent combustion gases from reaching the feeding system, which was
experienced during commissioning runs. For this sealing purpose, air was
supplied from secondary air line through a flexible tubing.
• In order to see the dense bed during test runs, an observation window was
installed on the top of upper loop-seal connection leg. Cooling air for the
glass was also supplied from the secondary air line.
• As the support air for solids feeding and cooling air for observation
window are supplied from the same point connected to secondary air line,
diameter of flexible tubings for loop-seal fluidization air were increased
to lower the resistance of the lines feeding the windbox of loop seal.
4.2.2 Combustion Tests
After the commissioning tests were completed satisfactorily, the next and the
main step of operation phase was the combustion tests firing a typical Turkish
Coal (from Air Lock)
Air
Figure 4.6 Schematic Diagram for Vacuum System in Solids Feeding Leg

124
lignite for design assessment of the Test Unit and for investigation of the
combustion characteristics of this lignite at CFBC conditions.
The design fuel for the test unit was selected to be Çayırhan lignite, as its analysis
can be accepted as an average for the main lignite reserves within Turkey.
However, another lignite reserve from Çan town of Çanakkale province in
northwestern Turkey, which is also within the design range of the unit was
prefered for these coal fired combustion tests. There were two main motivations
underlying this decision:
• The lignite under consideration in this study was recently fired in
bubbling mode in METU 0.3 MWt AFBC Test Rig as a part of an
extensive research study including biomass cofiring tests [41]. As an
outcome of this study, comprehensive sets of data and results about
this lignite and its combustion characteristics within BFBC conditions
were generated. Therefore, it is considered advantageous to fire Çan
lignite in the METU 150 kWt CFBC Test Unit based on these
extensive experiences. In addition, it is considerably valuable to have
combustion test results for the same coal, at bubbling and circulating
FBCs for comparison studies.
• Çan lignite is already being fired at 2 x 160 MWe Çan Power Plant that
is located at the town of Çan, which is the first large scale utility power
plant in Turkey that is based on CFBC technology. The boilers with a
steam capacity of 490 t/h each are under operation since 2003 [13].
Therefore, data generated from combustion tests with this lignite may
be of future use in the mentioned power plant.
After the lignite to be fired was determined, preperation works before the tests
were started: Test procedure was formed, coal was analysed for ultimate and

125
approximate analysis, mass and heat balances were carried out resulting in the
predictions for steady state operating conditions.
4.2.2.1 Procedure
The procedure for the coal combustion test is mainly the same as the one given in
Table 4.2 for commissioning runs. The only difference is that there is no drying
phase but only the steady state operation at 850°C. This procedure includes burner
ignition, heating up of the combustor, feeding bed material followed by coal,
reaching 850°C and examining the operating data for the steady state.
4.2.2.2 Operation
In the scope of this study, two combustions tests were carried out. Average
temperature profiles for dense and dilute zones and loop seal are given in Figure
4.7 and Figure 4.8 for combustion test-1 and combustion test-2, respectively.
The first stage of the test runs; heating up the combustor to 300°C, was carried out
by firing LPG at the start-up burner, following a procedure similar to the one
given before, but with a higher heating rate.
After the target temperature was reached, mixture of the bed material generated
during the previous test runs with Çan lignite at bubbling test rig and during
commissioning runs at CFBC were fed to the combustor. The amount of material
in the dense bed was followed from the pressure drop through dense zone. As the
bed material absorbs the heat within the system, energy input through the start-up
burner was increased to continue with the same heating rate. During this stage,
bed material, of which the fine particles started circulation via the cyclone and
loop seal, was heated up and the average temperature along the riser was brought
to 600°C to start feeding coal.

126
0
200
400
600
800
1000
0 2 4 6 8Time, h
Tem
pera
ture
, °C
Dense Zone Dilute Zone Loop Seal
0
200
400
600
800
1000
0 2 4 6 8Time, h
Tem
pera
ture
, °C
Dense Zone Dilute Zone Loop Seal
Figure 4.7 Average Temperature Profiles for Combustion Test-1
Figure 4.8 Average Temperature Profiles for Combustion Test-2

127
Coal was fed to the combustor with bed material as transient injections to keep
coal particle concentration within the limits, to make sure combustion was
complete, and to control temperature rise. At the same time, the heat input from
the start-up burner was decreased and finally it was shut down for coal
combustion to take over all the heat input requirement. As a result, temperature
along the combustor was increased and kept at 850°C. The trends of online data
logged by control system was checked to see whether steady state conditions were
achieved.
During steady state, operational data was followed carefully not to have
significant fluctuations at the conditions throughout the system. After the
collection of data for a certain time and investigating the operation of combustor
and its auxiliaries in terms of achieving their design functions, the system was
shut down and cooled.
The physical condition within dense zone module was continuously followed
from the observation window installed on the top of upper circulation leg. The
pictures of red-hot fluidized bed taken from this window are given in Figure 4.9.
During both test runs, especially in run-2, all the temperatures rapidly converged
to each other after feeding coal, as the particles provided dispersion of heat to
whole system. Since a time lag for the increase in loop seal temperature was
experienced during Test-1, amount of inert material initially fed to loop seal was
increased in Test-2 . The source of this material was the particles extracted from
the bottom of loop seal at previous runs. As a result of this increased amount fed
to the loop seal, temperature of circulating particles in Test-2 had a more similar
trend to riser temperatures. However, the main reason for having higher
temperatures at dilute zone and loop seal, closer to dense zone values compared to
commissioning runs was the presence of insulation during these combustion tests.
By the help of insulation, heat loss to the surroundings were kept within design
limits, forming almost uniform temperature profiles along the height of riser.

128
Figure 4.9 Dense Bed Pictures During Operation
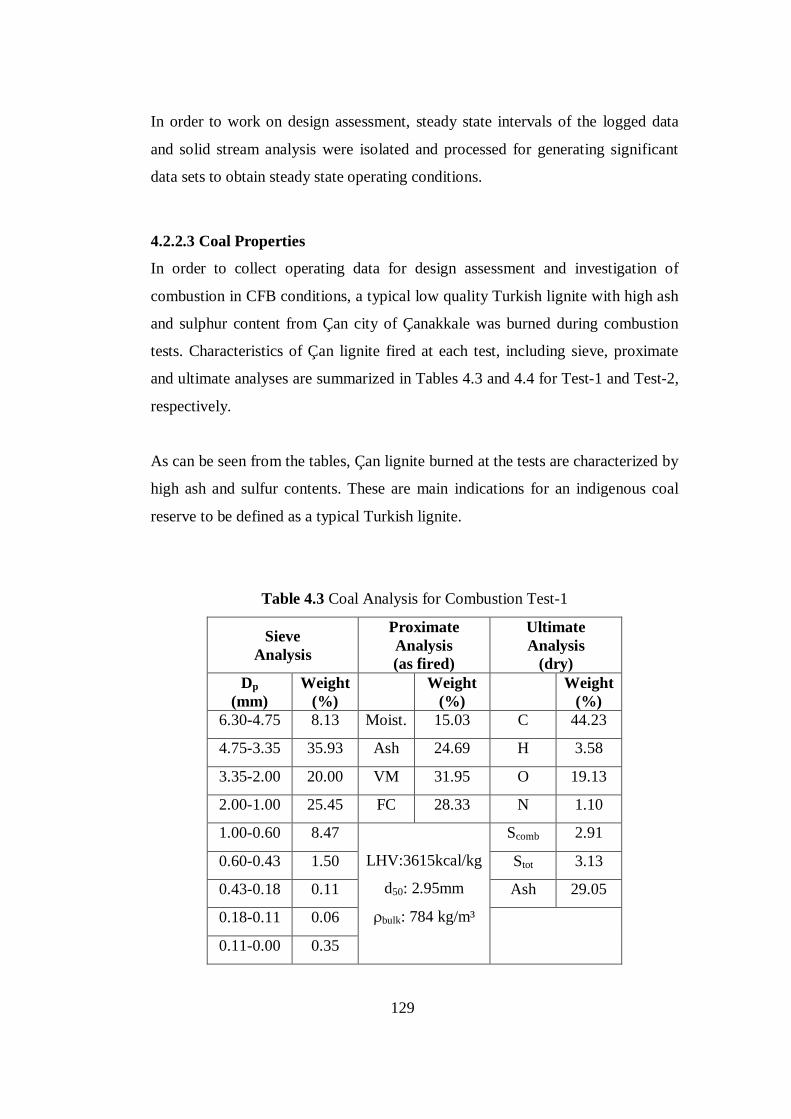
129
In order to work on design assessment, steady state intervals of the logged data
and solid stream analysis were isolated and processed for generating significant
data sets to obtain steady state operating conditions.
4.2.2.3 Coal Properties
In order to collect operating data for design assessment and investigation of
combustion in CFB conditions, a typical low quality Turkish lignite with high ash
and sulphur content from Çan city of Çanakkale was burned during combustion
tests. Characteristics of Çan lignite fired at each test, including sieve, proximate
and ultimate analyses are summarized in Tables 4.3 and 4.4 for Test-1 and Test-2,
respectively.
As can be seen from the tables, Çan lignite burned at the tests are characterized by
high ash and sulfur contents. These are main indications for an indigenous coal
reserve to be defined as a typical Turkish lignite.
Table 4.3 Coal Analysis for Combustion Test-1
Sieve Analysis
Proximate Analysis (as fired)
Ultimate Analysis
(dry) Dp
(mm) Weight
(%)
Weight (%)
Weight
(%) 6.30-4.75 8.13 Moist. 15.03 C 44.23
4.75-3.35 35.93 Ash 24.69 H 3.58
3.35-2.00 20.00 VM 31.95 O 19.13
2.00-1.00 25.45 FC 28.33 N 1.10
1.00-0.60 8.47 Scomb 2.91
0.60-0.43 1.50 Stot 3.13
0.43-0.18 0.11 Ash 29.05
0.18-0.11 0.06
0.11-0.00 0.35
LHV:3615kcal/kg
d50: 2.95mm
ρbulk: 784 kg/m³

130
Table 4.4 Coal Analysis for Combustion Test-2
Sieve Analysis
Proximate Analysis (as fired)
Ultimate Analysis
(dry) Dp
(mm) Weight
(%) Weight
(%) Weight
(%) 6.30-4.75 5.88 Moist. 16.24 C 41.05
4.75-3.35 15.64 Ash 32.72 H 3.31
3.35-2.00 12.65 VM 29.20 O 12.18
2.00-1.00 22.27 FC 21.44 N 1.10
1.00-0.60 11.02 Scomb 3.30
0.60-0.43 6.68 Stot 4.59
0.43-0.18 10.72 Ash 39.06
0.18-0.11 5.11
0.11-0.00 10.02
LHV:3085kcal/kg
d50: 1.29mm
ρbulk: 932 kg/m³
The discrepancies between the analyses can not be explained only by the
heterogeneous characteristic of coal resources, but also by the distinction between
particle size distributions. For experimental purposes, the lignite was resized to
have different particle size distributions by using different sieve combinations for
each test. Although the lignite fired at both tests was from the same origin, there
occured different coal analysis in each run. As the contents of each size range of
coal may differ from eachother, the resizing process resulted in distinct coal
analysis.
The reason for resizing raw lignite was the high d50 value of the fuel as received,
reaching up to 3.60 mm. For the commissioning runs, enough amount of raw
lignite stock which was delivered in 1 m³ capacity big bags was sieved to
eliminate coarse particles larger than 5.6 mm. This screening operation resulted in
a d50 of 1.06 mm that was lower than expected. However, as it was required to
have increased heat generation by finer particles at the upper modules for
completion of drying process, this lower average size was acceptable. In addition,

131
those runs were done for investigating the performance of the whole system, so
that it was not required to have well defined coal PSD. However, average size of
coal should be higher than that value for a real combustion test.
Based on the experience at commissioning runs, coal was sieved to get rid of
coarse particles with a size higher than 6.3mm and fine particles smaller than 0.5
mm for the first combustion test. This resulted in a size distribution to be mainly
within 1.00 – 4.75 mm range with a d50 of 2.95mm that is higher than typical
value for commercial units. Then, for the next test run, only the coarse fraction
with a size larger than 6.3 mm was eliminated and a d50 value of 1.29 mm was
obtained.
4.2.2.4 Initial Bed Material
Commissioning and combustion test runs were performed by burning the lignite
in its own ash. As mentioned before, bed material was initially supplied from the
bottom ash generated while firing Çan lignite at the 0.3 MWt AFBC test rig.
Similar to coal, there exist large particles within this bottom ash compared to the
requirements of the CFBC test unit. Therefore, the bottom ash was also sieved to
obtain initial bed material with appropriate size distribution and average size.
Based on the experience from commissioning runs, sizing of the bed material was
changed for combustion tests. The sieve analysis of the initial bed material for
commissioning runs and combustion test runs are given in Table 4.5.
Regarding the commissioning runs, d50 of the initial bed material prepared by
sieving the bottom ash of bubbling test unit was 1.157 mm. After these runs, it is
observed that it takes more than the duration of one test run for the required
amount of circulating fine particles to accumulate in the loop seal. Although 5-6
kg of fly ash was filled into the loop seal at each run, the particle size of fly ash
was small to stay within the system until the end of the operation without escaping
from the cyclone.

132
Table 4.5 Particle Size Distribution of Bed Material
Sieve Analysis Weight (%)
Dp (mm)
Commissiong Runs
Combustion Tests
6.30 – 4.75 2.41 1.21
4.75 – 3.35 15.14 8.22
3.35 – 2.00 12.67 8.07
2.00 – 1.00 23.46 25.96
1.00 – 0.60 16.80 19.46
0.60 – 0.43 10.19 18.68
0.43 – 0.18 9.47 10.73
0.18 – 0.11 5.03 4.41
0.11 – 0.00 4.81 3.28
d50, mm 1.16 0.87
Therefore, it was decided to increase the fraction of fine particles within the initial
bed material to increase the amount of ash to be circulated through loop seal. In
light of these discussions, bed material for combustion test runs was prepared to
have particles with a d50 of 0.87 mm. By this resizing process performed before
combustion tests, the portion of particles under 1 mm size was increased. The
bottom ash generated during commissioning runs of CFBC was mixed with the
sieved material that was generated in the bubbling unit. The sieve analysis of bed
material given in Table 4.5 for the combustion tests belong to this mixture.
4.2.2.5 Operating Conditions
During the steady state operation of the unit, operating parameters including
temperature and pressure drop along the combustor; coal, fresh air, flue gas and
cooling water flow rates were logged continuously. Steady state operating
conditions for both combustion tests are presented in Table 4.6.

133
Table 4.6 Operating Conditions of the Combustion Tests
Parameter Test-1 Test-2
Thermal fuel input, kW 157.5 174.1
Coal flow rate, kg/h 37.45 48.55
Fly ash flow rate, kg/h not available 7.04
Primary air flow rate, kmol/h 7.21 7.95
Secondary air flow rate, kmol/h 1.12 1.01
Total air flow rate, kmol/h 8.33 8.96
Excess air, % 20.9 16.5
Primary air : Secondary air, % in total 86.6 : 13.4 88.7 : 11.3
Superficial Velocity at dense zone, m/s 4.07 4.63
Superficial Velocity at dilute zone, m/s 4.33 5.07
Flue gas oxygen concentration, % (in wet basis) 5.27 3.25
Average dense zone temperature, °C 834.7 861.5
Average dilute zone temperature, °C 747.1 828.7
Average Loop seal temperature, °C 700.9 762.7
Cooling water flow rate at module-2, L/h 805.6 695.4
Cooling water flow rate at module-3, L/h 746.2 570.8
Cooling water inlet temperature, °C 13.8 16.7
Cooling water exit temperature at module-2, °C 53.5 64.8
Cooling water exit temperature at module-3, °C 47.2 64.9
Thermal Fuel Input
As can be seen from the table, each operating condition of Test-1 differ from
those of Test-2. One of the determining parameters of this discrepancy is the
thermal fuel input which was significantly increased in the second test to reach
higher temperatures throughout the system; not only in the dense and dilute zones,
but also in the loop seal.
134
Coal Flow Rate
It should be noted that almost 30% increase in the coal flow rate resulted in only
10% increase in thermal input because of the decrease in lower heating value,
approximately by 17%, from Test-1 to Test-2 as given in Table 4.3 and Table 4.4.
Fly Ash Flow Rate
Regarding the fly ash flow rate at Test-1, the data is reported as not available, as
the fly ash accumulation under the bag filter during steady state operation could
not be determined exactly. The procedure was modified for the next test run, and
the flow rate shown in the table was determined.
Combustion Air
As a requirement for the change in fuel input, combustion air flow rate was
increased, but this increase was limited by the decrease in excess air ratio. The
difference between the superficial velocities attained at the tests was not only
because of this increase in total air flow rates, but also was a result of the
difference between average temperatures within dense and dilute zones.
Primary : Secondary Air Ratio
Examining the ratio of primary and secondary air flow rates to total flow rate, it is
obvious that the secondary air ratios at both runs are too small compared to the
design value of test unit, 40%, which is a typical operating parameter for CFB
boilers. Although the Test Unit was operated at 11.3% and 13.4% of secondary air
ratio, this low ratios were inevitable for uninterrupted flow of air to loop seal to
provide continuous particle circulation. In order to discuss the relationship
between circulation and secondary air system, it is required to explain the
interaction of these systems of the Test Unit. All the auxiliary air including loop
seal air is supplied from the secondary air line as the air flow rate entering the
combustor through this line is continuously measured. The impact of auxiliary air
on secondary air flow rate is as follows:

135
Auxiliary air is fed to: (i) loop seal for fluidization; (ii) solids feeding leg for
sealing; (iii) observation window for cooling, via small diameter (8 mm) lines. In
addition to line resistance, most significant pressure drop within these consumers
is at the loop seal that contains a solid bed with high pressure drop. However, as
the secondary air piping up to the combustor has significantly lower pressure drop
compared to auxiliary air, the efforts to increase secondary air flow rate prevented
auxiliary air from flowing to loop-seal and to the other points mentioned above.
Therefore, high secondary air ratio was sacrificed for stable circulation of
particles, which is prior in terms of achieving CFB combustion conditions. On the
other hand, as a future work, the design of auxiliary air supply system should be
modified, either by isolating it from secondary air system or improving the
pressure control of secondary air line.
Flue Gas Oxygen Concentration
Another parameter that requires detailed discussion is the deviation of oxygen
concentration within the flue gas given on wet basis. Refering to the mass balance
results, 5.27% of oxygen concentration measured during Test-1 can not be
attained with 20% excess air, so that it was required to investigate the reasons
underlying this measurement. Finally, it was found that the gasket in between the
connection flanges at the exit of combustor was slightly damaged during the test.
This resulted in dilution of flue gas by fresh air suction from the surroundings. It
was concluded that this failure had an effect only on oxygen measurement in the
positive direction, and this deviation was taken into account in the mass balance
studies within design assessment. Before the second test run, damaged gasket was
replaced with a new one, and necessary measures were taken to prevent the same
failure. The flange was checked during Test-2, and no more problem is observed
at that point.
Cooling Water
In addition to increased heat input, decreasing the cooling water flow rates also
helped reaching increased temperatures, but not that much significant as heat

136
input. Decreasing the cooling load at second and third modules, significantly
reduced the temperature difference between dense and dilute zones. As expected,
this reduction increased exit temperatures of cooling water streams of both
modules as given at the bottom of table.
Coal Feeding Point
An important distinction between the tests that is not displayed in Table 4.6 was
the coal feeding point. As given in the design chapter, there are two solids feeding
ports entering the dilute zone module from the same axis, at the heights of 25 cm
and 50 cm from the distributor plate. Lower feeding port was employed for the
first combustion test. However, it was observed that high pressure of combustion
gases prevent the solids from flowing through feeding leg after some hours of
operation, even the feeder is an air lock type. In order to reduce this effect, the
feeding point was switched to the upper port before the second test. By this
modification, solids feeding system was connected to the combustor at a level
where pressure is lower than the previous setup.
Based on the discussions given above, it was concluded that Test-2 was more
satisfactory than Test-1, as an outcome of the experiences gathered during the first
test. However, this conclusion did not prevent Test-1 from being presented as a
part of this study, despite the fact that fly ash flow rate could not be determined
and there has been a dilution at the flue gas line.
In conclusion, after refractory drying operation and coal fired commissioning
tests, two combustion tests were carried out to generate the extensive set of data
given above. Based on this experimental data, further results were generated and
utilized in the analysis for design assessment and for investigating combustion
characteristics of the lignite.

137
CHAPTER 5
RESULTS AND DISCUSSION
Following satisfactory combustion tests executed at the METU 150 kWt CFBC
Test Unit, the experimental data was not only rearranged for generating extensive
results, but also utilized as input data for design assessment. In the extent of these
studies, performance of the combustor was analyzed with respect to temperature
profiles, pressure profiles, flue gas emissions, ash compositions and particle size
distributions. In addition, operation performance was compared with the design
data by reperforming heat and mass balances and pressure balance model.
5.1 Temperature Profiles
Temperature measurements were carried out on a discrete grid of points along the
combustor. The temperature profiles at steady state operation along the riser are
given in Figures 5.1 and 5.2 for each combustion test. Tabulated data for the
temperature profiles are given in Appendix E.
As discussed and shown in the relevant figures in Chapter 4, steady state
temperatures along the combustor are lower for Test-1 compared to Test-2.
Examination of Figure 5.1 reveals that dense zone temperatures are slightly lower
than the operating temperature of 850°C typical for CFBCs. In addition, the
inflection of the profile at the entrance of first cooled module determines the
profile within dilute zone. The effect of cooling at these modules clearly shows
that a uniform profile with a lower temperature compared to the bottom section of
the riser was obtained at the upper half of riser.
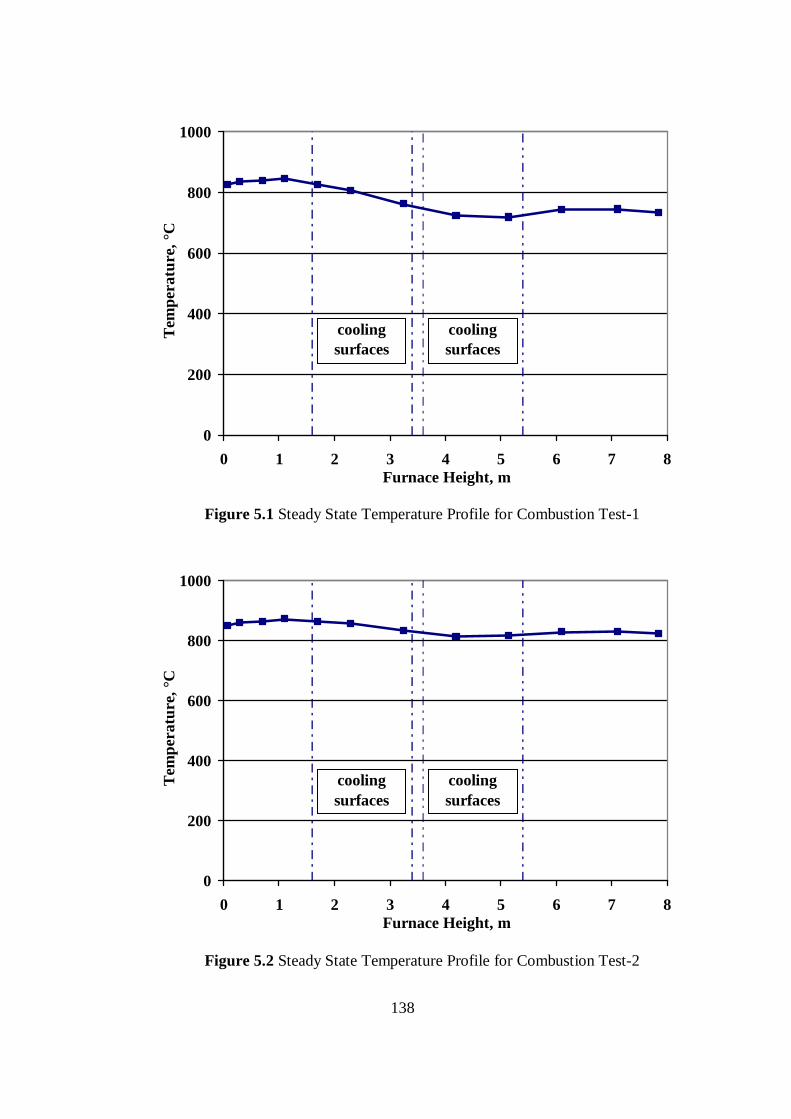
138
0
200
400
600
800
1000
0 1 2 3 4 5 6 7 8Furnace Height, m
Tem
pera
ture
, °C
coolingsurfaces
coolingsurfaces
0
200
400
600
800
1000
0 1 2 3 4 5 6 7 8Furnace Height, m
Tem
pera
ture
, °C
coolingsurfaces
coolingsurfaces
Figure 5.1 Steady State Temperature Profile for Combustion Test-1
Figure 5.2 Steady State Temperature Profile for Combustion Test-2

139
Although coal flow rate could have been increased and cooling load could have
been lowered to reach higher temperatures with a more uniform profile, they were
not performed not to destroy the steady state. The conditions of this steady state
were found to be acceptable in terms of experimental purposes.
Temperature profile for Test-2 given in Figure 5.2 shows that the temperatures
were higher than 815°C throughout the riser as a result of increased fuel input and
reduced cooling. This profile is an indication that ideal CFB combustor conditions
were attained in terms of temperature in the test unit.
5.2 Pressure Profiles
Differential pressure measurements were also carried out on a discrete grid of
points through pressure impulse lines along the combustor. Steady state
measurements logged during both runs were carefully averaged over the time as
the values fluctuate especially within dense bed, because of particle movement
along the riser. The average of measurements for distributor plate, dense zone,
dilute zone, cyclone, downcomer and loop seal are given in Table 5.1.
As the distributor plate was designed to have a pressure drop of 99 mmH2O, the
values given in the table can be accepted to be within the limits of design. One of
the most important assumptions made in distributor design was the temperature of
air flowing through the orifices which directly affects the orifice velocity.
Temperature of air flowing through distributor plate is affected by the metal
temperature of the distributor plate which is a function of dense bed temperature
and heat transfer from the bed to the plate. Comparison of the temperatures
measured at 7 cm above the distributor plate in both tests shows that this
temperature is approximately 26°C higher in Test-2 than Test-1. This difference
was assumed to be approximately valid for distributor plate temperature too.
Therefore, it is believed that the difference between pressure drops through the
distributor plate in two tests was due to the difference in the temperature of air
flowing through the orifices.
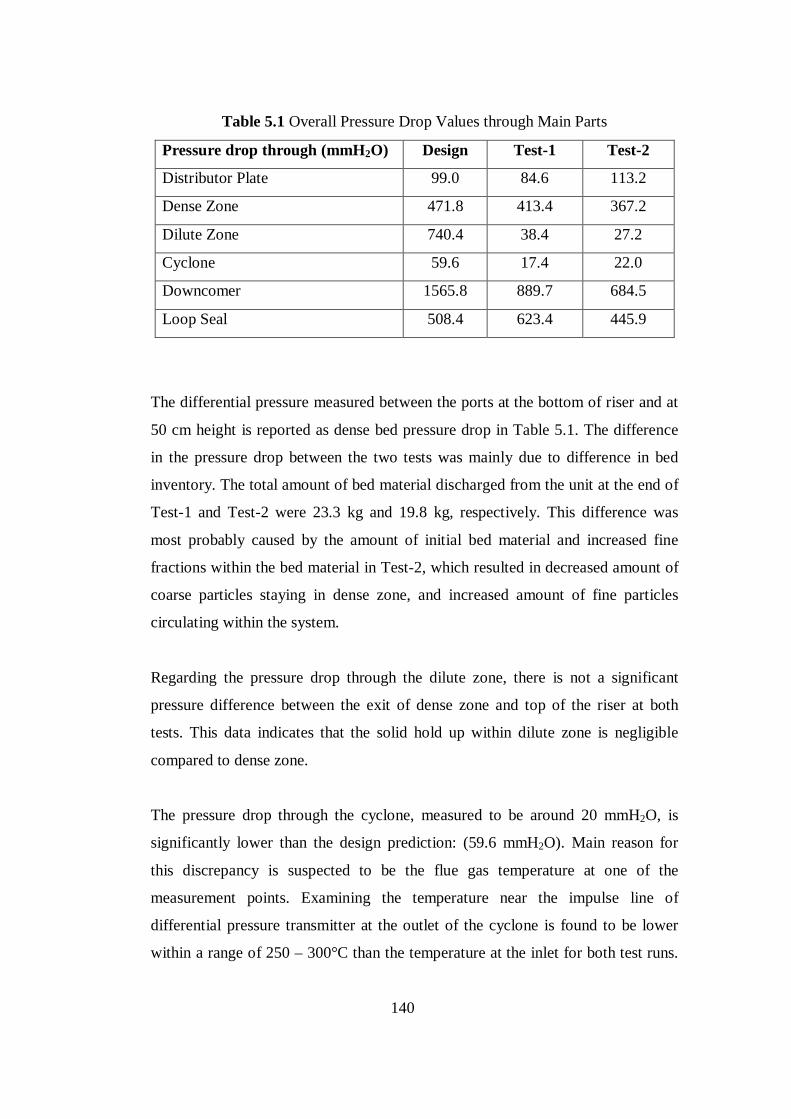
140
Table 5.1 Overall Pressure Drop Values through Main Parts
Pressure drop through (mmH2O) Design Test-1 Test-2
Distributor Plate 99.0 84.6 113.2
Dense Zone 471.8 413.4 367.2
Dilute Zone 740.4 38.4 27.2
Cyclone 59.6 17.4 22.0
Downcomer 1565.8 889.7 684.5
Loop Seal 508.4 623.4 445.9
The differential pressure measured between the ports at the bottom of riser and at
50 cm height is reported as dense bed pressure drop in Table 5.1. The difference
in the pressure drop between the two tests was mainly due to difference in bed
inventory. The total amount of bed material discharged from the unit at the end of
Test-1 and Test-2 were 23.3 kg and 19.8 kg, respectively. This difference was
most probably caused by the amount of initial bed material and increased fine
fractions within the bed material in Test-2, which resulted in decreased amount of
coarse particles staying in dense zone, and increased amount of fine particles
circulating within the system.
Regarding the pressure drop through the dilute zone, there is not a significant
pressure difference between the exit of dense zone and top of the riser at both
tests. This data indicates that the solid hold up within dilute zone is negligible
compared to dense zone.
The pressure drop through the cyclone, measured to be around 20 mmH2O, is
significantly lower than the design prediction: (59.6 mmH2O). Main reason for
this discrepancy is suspected to be the flue gas temperature at one of the
measurement points. Examining the temperature near the impulse line of
differential pressure transmitter at the outlet of the cyclone is found to be lower
within a range of 250 – 300°C than the temperature at the inlet for both test runs.

141
This temperature drop is considered to be due to uninsulated flue gas line at the
exit, and it was believed to be responsible for the reduced measurement of cyclone
pressure drop.
Pressure drop through loop seal and downcomer were not directly measured
values. They were calculated from the pressure measured at the air piping that
feeds the loop seal. By subtracting predicted values of resistances within the pipes
and pressure drop through loop seal distributor plate from line pressure, gage
pressure at the bottom of downcomer was obtained. Then the pressure drop for the
loop seal was calculated from the difference between downcomer pressure and
dense zone pressure at the level of circulation leg entrance to riser. This method
was same as the approach of pressure balance model for calculating ∆P through
loop seal. In conclusion, these calculated data given in the table is in line with the
requirement for balancing the pressure at the bottom of riser. As the ∆P through
riser was higher for Test-1, the values for downcomer and loop seal were also
higher compared to Test-2. These higher values of ∆P were also the indications of
the presence of increased amount of solids within downcomer, and higher solid
bed height as a result of that.
Regarding the pressure balance, it is more expressive to present overall pressure
profile within the system than giving each differential pressure value one by one.
Starting from the side channel blower and including the loop comprised of riser,
cyclone, downcomer and loop seal, pressure values are calculated and these data
are used as input data for the pressure and solid mass balance analysis. Pressure
profile of each run at steady state operation are given in Figures 5.3 and 5.4.
Steady state average values for the gage and differential pressure measurements
within the system are given in Appendix E.
As can be seen from both figures, the profile starts from the pressure at the exit of
the blower for which the value is displayed at the right bottom. As there is no
pressure transmitter right at the discharge of the blower, pressure at that point was

142
-2
0
2
4
6
8
0 400 800 1200 1600
Pressure, mm H2O(g)
Hei
ght,
m (
z=0
@ d
istr
ibut
or p
late
).
primary air loop seal
-2
0
2
4
6
8
0 400 800 1200 1600
Pressure, mm H2O(g)
Hei
ght,
m
(z=
0 @
dis
trib
utor
pla
te).
primary air loop seal
Figure 5.3 Steady State Pressure Profile for Combustion Test-1
Figure 5.4 Steady State Pressure Profile for Combustion Test-2

143
calculated from the operation curve, which displays the design performance of the
equipment. Knowing the blower motor frequency (around 40 Hz.) and total air
flow rate data logged during the tests, the pressure at the discharge line of the
blower was determined to be 1607 and 1555 mmH2O (g) for Test-1 and Test-2,
respectively. As the equipment was not operated for a long period of time since its
start-up, factory performance was accepted to be reliable for obtaining these data.
Following the blower, there comes the primary air flow control valve that was
operated around 30% open position during both runs. The significant resistance
created at this position of the valve was calculated from the difference between
the blower outlet pressure and the gage pressure transmitter downstream the
valve. Pressure drop arised through this valve was found to be 1050 mmH2O and
1019 mmH2O for Test-1 and Test-2, respectively.
Instead of operating the blower at high frequency and the valve at a position
creating higher resistance, motor speed could be decreased resulting in a reduction
in discharge pressure for the same air flow, and as a result of this the opening of
the valve could be increased. However, this change in the primary air valve
position prevents air flow via secondary air line to loop seal windbox that has a
high pressure solid bed over it and to highly resistant small diameter (8 mm) lines
for solids feeding support and observation window cooling. Therefore, primary air
control valve was operated at 30% open position, while the position of secondary
air valve is kept at 100% open to help the best distribution of air in both lines.
After the primary air valve, the pressure decreases to almost 540 mmH2O (g) at
both tests and flows to the riser through windbox and distributor plate whose
pressure drop was measured as 84.6 and 113.2 mmH2O in Test-1 and Test-2,
respectively.
Passing through the dense bed after the distributor plate, pressure reduces to
almost 40 mmH2O (g), and no significant change within dilute zone is observed.
144
This trend is an indication of low variation of particle load towards the riser exit
and negligible pressure drop values are explained by low solid hold-up within
dilute zone. However, this finding is in contradiction with the considerable
amount of solid hold-up predicted by the pressure balance model. Possible reasons
of this significant discrepancy are discussed in detail at section 5.8.
After leaving the riser there comes the measurements at the cyclone and the
downcomer leg. At this point the profile named as primary air is merged with the
loop seal air profile at the point corresponding to the bottom of downcomer.
Regarding the profile for loop seal air given in Figures 5.3 and 5.4, data points
start from the exit of blower at the right bottom of figures and is followed by the
gage pressure measurement at the exit of secondary air control valve. The rest of
the data points are; calculated data for auxiliary air coonection point on the
secondary air line, inlet of loop seal windbox and the bottom of downcomer, in
the order from right to left of profile. The origin of pressure drops resulting in
these data points are the resistances through secondary air piping and through air
supply tubing and distributor plate of loop seal. Finally, the loop seal pressure
profile is intersected with the dense bed at the point corresponding to the level of
circulation leg entrance to the riser. By this line closing the profile, pressure loop
is completed. However, this final line is displayed as dashed line, as there is not
any direct or indirect data for the pressure at the level of circulation leg entrance.
5.3 Flue Gas Emissions
The concentrations of O2, CO, CO2, SO2, NO and N2O within the flue gas were
measured at a point downstream the connection of CFBC flue gas line with the
existing flue gas system of Bubbling AFBC Test Rig. As this is an existing
sampling point of bubbling unit for emissions monitoring, gas conditioning and
analysis system of the existing unit were employed. In this system, combustion
gas is sampled from the flue gas line via a heated stainless steel tubing and
transferred to gas conditioning system to be filtered, dried and cooled. Sampled

145
gas then passes through two analyzers in series, ABB Advanced Optima 2000
including Magnos 106 analyzer module for O2 and Uras 104 analyzer module for
CO, CO2, NO and N2O, and Siemens Ultramat 6 for SO2. Output signals from
analyzers are logged to the PC of the existing data acquisition and control system
of the Bubbling AFBC test rig. Details of sampling, gas conditioning and analysis
system can be found elsewhere [41].
Gas analysis system was only used during Test-2. The steady state emission data
on dry basis is given in Table 5.2.
As explained before in Chapter 3, oxygen concentration was continuously
monitored on wet basis for combustion control by a zirconia cell oxygen analyzer
installed on the flue gas line. The locations of this analyzer and the sampling point
for the gas analysis system are separated by less than 4 meters, so that it is
expected to have similar results from zirconia analyzer and Magnos 106 analyzer
module of existing analysis system. As Zirconia analyzer measures O2
concentration in wet basis and Magnos analyzer measures it in dry basis, it was
required to convert one of the data to the basis of the other to check the reliability
of both analysis. For this conversion, water vapor concentration within the flue
gas was required. As there is no measurement for water vapor concentration, this
data was predicted from the mass balance model as 12.6%. In conclusion, it was
Table 5.2 Flue Gas Emissions for Test-2 (dry basis)
Concentration
O2 3.63 %
CO, ppm 108.0
CO2 15.87 %
SO2, ppm 4946.0
NO, ppm 29.8
N2O, ppm 57.0

146
found that the equivalent of zirconia output on dry basis is 3.71% and there is an
acceptable error of 2.35% between two measurements converted to same basis.
Regarding the other gaseous content of flue gas given in the table, CO and NO
emissions are fairly lower and N2O emission is higher compared to past
experiences when AFBC Test Rig firing Çan lignite was operated in bubbling
mode [41]. As there is no limestone addition, there is no SO2 capture so that the
emission is very high.
5.4 Ash Compositions
During the combustion tests, ash generated within the system is found in the form
of:
• dense bed ash: to be drained from the bottom of riser,
• circulating ash: to be drained from the bottom of loop seal,
• fly ash: to be collected at the bottom of bag filter.
Within these three forms, dense bed ash and circulating ash can be defined as
coarse and fine particle size fractions, respectively, originating from the mixture
of initial bed material and ash generated by the combustion of coal. First group of
this ash mixture, mostly composed of coarser particles within a certain size range,
stays in dense bed or moves between dilute and dense zones. This group of
particles are drained via the bottom ash removal system for balancing the excess
pressure drop within dense zone or for taking samples during steady state
operation to determine size distribution and chemical composition. The second
group is composed of finer particles that travel through dilute zone and leave the
riser but is captured by the cyclone to be recycled to the riser via the loop-seal.
Finest ash particles escape from the cyclone and this group of particles are defined
as fly ash. Considerable portion of these particles is captured by the bag filter
located upstream the ID fan and stack, and is collected in the bin at the bottom of
the filter. However, there is still a small portion of fly ash within the gas stream,

147
composed of finest particles that can not be captured by the bag filter. Other than
fine ash particles originating from bed material and coal ash, fine particles of
unburned carbon is also present in small amounts within the fly ash.
The chemical analyses of the samples taken during both tests from the dense bed
as defined as bottom ash and from the bag filter defined as fly ash were carried
out in the laboratories of Chemical Engineering Department and the results for
both runs are given in Table 5.3.
Examining the compositions given in the table, it can be seen that the
concentrations of compounds within bottom and fly ash streams of each test are
similar to each other. The deviation between the tests is attributed to the
heterogeneous characteristic of the lignite.
One of the most significant difference of composition between two ash streams of
each test is the higher Fe2O3 content in the bag filter ash. This difference, which is
Table 5.3 Chemical Analysis of Bottom Ash and Bag Filter Ash
Weight (%) Test-1 Test-2
Bottom Ash
Bag Filter Ash
Bottom Ash
Bag Filter Ash
SiO2 56.37 48.94 58.09 56.51
Al2O3 18.44 16.22 19.48 20.25
Fe2O3 6.71 12.10 7.10 12.27
CaO 2.11 2.32 1.84 0.41
MgO 1.21 1.08 1.34 0.64
SO3 9.76 11.39 7.29 5.24
Na2O 2.22 3.96 1.46 2.31
K2O 1.59 1.97 1.48 0.42
TiO2 1.59 2.02 1.93 1.97

148
typically due to higher concentration of this compund in fine particles, was also
observed in the previous research studies with the same and other lignites [41,
42]. Based on the experiences reported in these studies, another deviation between
the ash streams is expected to be in CaO concentrations during the combustion
tests with limestone addition that will be carried out in the future.
5.5 Ash Split
Ash generated during combustion splits to coarse and fine ash particles. As
discussed above, most of the coarse particles stays within the riser and are
discharged as bottom ash, whereas fine particles with appropriate size that are
captured by the cyclone are circulated within the system and most of fines that
escape from the cyclone are collected at the bag filter. Ash split is the percent
distribution of total ash between bottom and fly ash streams leaving the
combustor. Size distribution, grindability and nature of coal and its ash determines
the ash split.
Bottom ash is discharged from the center of distributor plate via an extraction
pipe. However, during the combustion tests, it was not required to discharge
bottom ash, as there was no significant increase in the pressure drop through the
dense zone. Therefore, the only solid output from the system was the fly ash
stream, most of which was collected by the bag filter.
As mentioned before within the discussions of operating conditions, fly ash
collection rate at the bag filter could only be determined during combustion Test-
2. Fly ash flow rate at steady state operation during this test is 7.04 kg/h. As the
ash input by coal was calculated to be 15.89 kg/h and no other ash stream was
drained from the system during the combustion test, the difference between these
values mostly stands for the accumulation rate of circulating particles but also
includes a small fraction of finest particles of fly ash within flue gas discharged
via the stack.

149
5.6 Particle Size Distributions
Particle size distribution (PSD) for the ash streams drained from the bottom of
loop-seal and riser at the end of both tests were determined by sieve analysis and
given in Tables 5.4 and 5.5, respectively. On the other hand, PSD of fly ash
collected at the bottom of bag filter was measured by Malvern Mastersizer 2000
equipment at the METU Central Laboratory. Measurement principle of this
equipment is based on Mie scattering theory, and the detectable particle size range
is 0.02 to 2000µm. Results of particle size analysis of fly ash generated during
both runs are given in Figure 5.5, which also displays the PSD of all other input
and output solid streams. Tabulated data for differential size distributions of fly
ash samples are given in Appendix E.
Table 5.4 Particle Size Distribution of Loop Seal Ash
Sieve Analysis Weight (%)
Dp, (mm) Test-1 Test-2
> 6.3 mm 0.00 0.00
6.30 – 4.75 0.04 0.00
4.75 – 3.35 0.54 0.17
3.35 – 2.00 0.66 0.36
2.00 – 1.00 2.10 4.04
1.00 – 0.85 0.56 1.87
0.85 – 0.60 9.32 15.97
0.60 – 0.43 31.66 31.03
0.43 – 0.36 14.60 12.79
0.36 – 0.18 28.25 23.12
0.18 – 0.11 6.48 6.66
0.11 – 0.00 5.79 4.00
d50, mm 0.40 0.44

150
Table 5.5 Particle Size Distribution of Bottom Ash
Sieve Analysis Weight (%)
Dp, (mm) Test-1 Test-2
> 6.3 mm 0.05 0.25
6.30 – 4.75 0.79 3.19
4.75 – 3.35 10.23 17.55
3.35 – 2.00 12.81 14.47
2.00 – 1.00 35.58 32.35
1.00 – 0.60 24.27 16.22
0.60 – 0.43 11.84 8.74
0.43 – 0.18 3.56 5.46
0.18 – 0.11 0.27 0.81
0.11 – 0.00 0.60 0.97
d50, mm 1.27 1.55
Examining the size distribution given in Table 5.4 for circulating ash drained from
the bottom of loop seal in Test-1, it is seen that the particle size is smaller than
0.85 mm for more than 96% of the sample. In order to analyze the significance of
this particle size, terminal velocity for each fraction of sieve analysis was
calculated. It was found that the average superficial velocity within dilute zone,
4.3 m/s for Test-1, is larger than the terminal velocity of particles smaller than
0.61 mm, showing that the possibility for these particles to be elutriated from the
riser is maximum. However, it was required to check the design efficiency of the
cyclone to find the captured fraction of these elutriated particles. Capture
efficiency, found to be higher than 99.9% for particles larger than 240µm and
decreasing to 98% for 55µm size, shows that the probability of particles larger
than 240µm for being captured by the cyclone was maximum. In conclusion, high
fraction of particles within 0.18 – 0.60 mm range determined by the sieve analysis
as 74.51%, is verified by the predictions for terminal velocity and cyclone
efficiency.

151
0102030405060708090100 0.
11.
010
.010
0.0
1000
.010
000.
0
Par
ticle
Siz
e, µ
m
Residue, %
bed
mat
eria
l
Test
-1 c
oal
Test
-2 c
oal
Test
-1 b
otto
m a
sh
Test
-2 b
otto
m a
sh
Test
-1 lo
op-s
eal
Test
-2 lo
op-s
eal
Test
-1 b
ag h
ouse
Test
-2 b
ag h
ouse
Fig
ure
5.5
Par
ticle
Siz
e D
istr
ibut
ions
of
all S
olid
Str
eam
s

152
On the other hand, size distribution of the loop seal ash of Test-2 reveals that the
fraction of particles in 0.18 – 0.60 mm range was lower (66.94%), but the fraction
in 0.85 – 0.60 mm range was significantly higher than that of Test-1. This
distinction resulted in a d50 value of 0.44 mm for the second test that is higher
than 0.40 mm calculated for the first one. This finding is in line with the
discussions given above for the elutriation effect of superficial velocity that is
higher in Test-2.
Regarding the particle size distribution for bottom ash given in Table 5.5, weight
fraction of particles within 0.425 – 3.35 mm size range is around 90% for both
tests. As the average superficial velocity within dense zone; 4.07 m/s for test-1,
was smaller than the terminal velocity of particles larger than 0.58 mm, the
possibility of these particles to stay in the riser was maximum. Corresponding
particle size for Test-2 is found to be 0.69 mm based on the higher superficial
velocity of 4.66 m/s in the dense zone during this test. These findings can be
observed from the sudden increase in weight fractions starting around 0.60 mm
and increasing with size. The smaller fractions experienced in Test-2 up to 1 mm
was an outcome of the increased superficial velocity at this run, resulting in
increased elutriation of the mentioned range. This effect was also observed at d50
values of each run.
As can be seen from Figure 5.5, particle size decreases in the order of coal,
bottom ash, loop seal ash and bag filter ash for each run, except the coal size in
Test-2, that was resized to reach a lower d50 than Test-1. Regarding the fly ash
size distribution, it is found to be increased from Test-1 to Test-2 for which the d50
values are 16.6 µ and 29.5 µ, respectively.
5.7 Heat Transfer Analysis
Heat transfer analysis is carried out in two parts: 1. Heat transfer in cooled
modules. 2. Heat balance over combustor.

153
5.7.1 Heat Transfer In Cooled Modules
The second third modules of the combustor were designed to have cooling water
channels at the external surface of module body. Based on the predictions for
dispersion of heat generation along the riser, 10 water channels were installed on
module-2, whereas 6 channels were installed on module-3. Cooling system was
designed to have countercurrent flow with respect to the flow within the riser.
During the combustion tests, flow rates and temperatures of cooling water streams
of both modules were logged by the control system. Based on these data, rate of
heat removal at each module was determined. These results and further analyses
are given in Table 5.6.
In order to obtain overall heat transfer coefficient from the inside of combustor to
the cooling water, log mean temperature difference (LMTD) for each module is
required. As furnace temperatures at the exact location of inlet and outlet of
cooled zones were not available, these data are calculated by interpolating the
temperature data measured by nearby transmitters.
Although total flow rate of water is decreased by 22.5% at Test-2, heat removal
rate is increased by 6.5% as a result of the increase in outlet temperature of water,
which also led to increased temperatures in dilute zone. On the other hand, heat
transfer coefficient at each module remains almost constant at both tests within
the range of 24.4 – 29.2 kcal/hm²K, which are lower than the values predicted at
the design phase. This may be due to the contribution of the heat loss to
surroundings to overall cooling that is predicted to be lower than the actual case.
Regarding the heat loss at cooled modules, it is calculated that approximately 42%
of heat input by fuel is removed by cooling water. Rest of the heat generated by
combustion leaves the system within solid and gas streams and as heat loss from
external surfaces. The ratios of flow enthalpies of output streams and by heat
transfer to surrroundings to total heat input were obtained from overall heat
balance.

154
Mod
ule-
3
570.
8
826.
3
819.
1
64.9
781.
71
2748
8
24.3
3
Tes
t-2
Mod
ule-
2
695.
4
863.
9
829.
2
16.7
64.8
805.
76
3343
0
6091
8
28.7
1
Mod
ule-
3
746.
2
748.
3
725.
0
47.2
706.
14
2491
8
24.4
2
Tes
t-1
Mod
ule-
2
805.
6
830.
7
754.
7
13.8
53.5
758.
89
1.45
3197
7
5689
5
29.1
6
Par
amet
er
Coo
ling
wat
er f
low
rat
e, k
g/h
Fur
nace
tem
pera
ture
at m
odul
e in
let,
°C
Fur
nace
tem
pera
ture
at m
odul
e ou
tlet,
°C
Coo
ling
wat
er t
empe
ratu
re a
t in
let c
olle
ctor
, °C
Coo
ling
wat
er t
empe
ratu
re a
t ou
tlet c
olle
ctor
, °C
Log
mea
n te
mpe
ratu
re d
iffer
ence
, °C
Hea
t tr
ansf
er a
rea
(int
erna
l sur
face
of r
efra
ctor
y), m
²
Hea
t re
mov
al r
ate
at e
ach
mod
ule,
kca
l/h
Tot
al h
eat r
emov
ed r
aate
from
coo
led
mod
ules
, kc
al/
h
Ove
rall
heat
tra
nsfe
r co
effic
ient
at e
ach
mod
ule,
kca
l/h m
²K
Tab
le 5
.6 H
eat T
rans
fer
Dat
a fo
r C
oole
d M
odul
es

155
5.7.2 Overall Heat Balance
Overall heat balance analysis was carried out around the combustor and the heat
balance terms are given in Table 5.7.
For the defined system of combustor, input terms are flow enthalpies of coal and
air, whereas output terms are flue gas and the fly ash particles. As there was no
reaction related with limestone in this study, only generation term was
combustion. Putting these terms into steady state energy balance equation, rate of
Table 5.7 Heat Balance Analysis
Test-1 Test-2
kcal/h
Input Terms
Dry coal 197.3 252.1
Dry air 2728.9 2529.5
Water in coal 112.6 157.7
Water vapor in Air 65.9 61.1
Total Input 3104.7 3000.4
Output Terms
Fly Ash 1410.6 1158.2
Dry Flue Gas 48002.3 57201.7
Water Vapor in Flue Gas 7357.9 11260.6
Total Output 56770.8 69620.5
Generation Terms
Combustion 134333.8 148596.7
Total Generation 134333.8 148596.7
Balance: Heat Removed at Furnace 80667.7 81976.6
Heat Removal by cooling water 56894.2 60918.2
Remainder: Heat Loss to Surroundings 23773.5 21058.4

156
heat removal from the combustor is obtained. This heat removal is provided by
cooling water and heat loss to the surroundings.
Energy supplied by coal combustion leaved the system within the flow enthalpies
of cooling water and particle laden flue gas with a ratio of approximately 42% for
each stream. The rest of heat input, almost 17%, was lost from the external
surface of the insulation by natural heat transfer mechanisms. According to initial
heat balance analysis at the design phase, heat loss by natural cooling mechanisms
was predicted to be lower; around 6% of heat input. As a result of this, cooling
requirement was predicted to be 47%, higher than experimental results. This
deviation is attributed to low overall heat transfer coefficient predicted at the
design phase for the heat loss to surroundings.
5.8 Combustion Efficiency
Combustion efficiency for both runs were calculated from the energy balance for
combustion, for which the details are given in Table 5.8.
In order to calculate combustion efficiency, reaction enthalpies for the complete
combustion of unburned carbon compunds within the output streams were added
for total combustion loss, and this value was divided by the total energy input
based on lower heating value of coal. Subtracting this percent loss from 100%,
combustion efficiency was obtained as 98.90% and 99.37% for Test-1 and Test-2,
respectively. However, although each terms for Test-2 given in the table was
based on experimental findings, the efficiency value for Test-1 was based on
some predictions as there was no experimental data for CO emissions and fly ash
flow rate for this run.

157
Table 5.8 Combustion Efficiency Analysis
Test-1 Test-2
Input Terms
Coal consumption, kg/h 37.45 48.55
Lower heating value, kcal/kg 3618 3085
Total Energy Input, kcal/h 135499.0 149765.8
Output Terms
CO, ppm 90.6 94.1
Combustion CO, kg/h 0.026 0.027
Incomplete combustion loss, kcal/h 62.3 65.6
Fly ash flow, kg/h 4.82 7.04
Unburnt carbon content, % 3.8 1.6
Carbon in fly ash, kg/h 0.183 0.111
Unburnt Carbon Loss, kcal/h 1434.0 871.8
Total Combustion Loss, kcal/h 1496.3 937.5
Combustion Efficiency, % 98.90 99.37
5.9 Pressure Balance Model
Based on the experimental data, pressure balance model is reapplied to the
combustor. The results of the model are displayed with the pressure measurements
for each test in the Figures 5.6 and 5.7.
Among the input data of pressure balance model, superficial velocity in the dense
zone, gas velocity at loop seal and the bulk density and particle size of circulating
ash were observed to deviate significantly from the design basis. In addition to
these data, superficial velocity in the dilute zone, average particle size of dense
bed, particle density of circulating ash and heights of dense and dilute zones were
also found to deviate from the design basis within acceptable ranges. The deviated
input parameters of pressure balance model are given in Table 5.9.

158
0
2
4
6
8
0 300 600 900 1200 1500 1800Pressure, mm H2O(g)
Hei
ght,
m
(z=
0 @
dis
trib
utor
pla
te).
experimental model design
0
2
4
6
8
0 300 600 900 1200 1500 1800Pressure, mm H2O(g)
Hei
ght,
m
(z=
0 @
dis
trib
utor
pla
te).
experimental model design
Figure 5.6 Predicted and Measured Pressure Profiles for Combustion Test-1
Figure 5.7 Predicted and Measured Pressure Profiles for Combustion Test-2

159
Table 5.9 Deviated Input Parameters of Pressure Balance Model
Parameter Design Test-1 Test-2
Superficial velocity in the dense zone, m/s 3.0 4.1 4.6
Superficial velocity in dilute zone, m/s 5.0 4.3 5.1
Gas velocity at loop seal, m/s 0.01 0.15 0.15
Height of the dense bed, m 1.0 0.7 0.7
Height of the dilute zone, m 7.0 7.3 7.3
Average particle size of dense bed, mm 1.16 1.27 1.55
Average particle size of circulating ash, mm 0.04 0.40 0.44
Bulk density circulating ash, kg/m³ 536 1030 1010
Particle density of circulating ash, kg/m³ 930 1200 1200
Average particle size of circulating ash is one of the most deviated parameters
among these input parameters, and it is also very effective on number of
parameters calculated within pressure balance model. This average particle size
was based on the cyclone ash of previous experiments in 0.3 MWt AFBC test rig
operated in recycling mode. The deviation is attributed to lower superficial
velocity and the presence of a cooler module at the exit in AFBC test rig. Based
on these, elutriation of coarser particles is reduced, resulting in significantly lower
particle size for circulating ash compared to CFBC test unit.
As a result of the deviation from the design basis, the parameters calculated from
these data also differed from each other. Consequently, the following parameters
were found to differ from the pressure balance model at the design stage: Solid
hold up in the dense bed (εsd); solid holdup at uniform flow with slip velocity
(εs*); average solid hold up at the dilute zone (εs∞); decay (a, ae) and reflux
constants (Ce); solid hold up at the exit (εse); variation of solid holdup by exit
effect (∆εsr). Among these parameters, the essential data are the solid holdup
values, which affect the pressure profile. Solid holdup values predicted at the
design stage and after combustion tests are given in Table 5.10

160
Table 5.10 Solid Holdup Values Predicted by Pressure Balance Model
Predicted Solid Holdup @ Design Test-1 Test-2
The dense zone, εsd 0.25 0.26 0.28
The dilute zone (average), εs∞ 0.0041 0.0003 0.0003
The exit, εse 0.0048 0.0003 0.0003
The dilute zone (asymptotic), εs* 0.0034 0.0004 0.0004
Comparing the predicted solid holdup values given in the table, it can be seen that
the predictions for the solid holdup of dense zone is in good agreement with each
other. However, solid holdup values for dilute zone predicted at the design stage
were higher than the predictions after combustion tests. This result was attributed
to the discrepancies between the input data and the parameters like decay and
reflux constants calculated from these input data.
In order to illustrate the effect of the input data and the predictive accuracy of
pressure balance model, measured and predicted pressure drop values are given in
Table 5.11. As can be seen from the table, predicted pressure drop values for
dense bed are in good agreement with measurements. However, there is a
significant discrepancy between design data and measurements for dilute zone.
Table 5.11 Pressure Drops within the CFBC Loop
Test-1 Test-2 ∆P through
(mmH2O)
Model
(design) Exp. Model Error Exp. Model Error
Dense zone 471.8 413.4 362.9 -12% 367.2 336.9 -8%
Dilute zone 740.4 38.4 152.5 297% 34.3 136.6 298%
Loop seal 508.4 623.4 487.6 83% 445.9 487.2 9%
Downcomer 1565.8 889.7 871.3 -2% 684.5 837.3 22%

161
This discrepancy was reduced for the predictions obtained after the revision of
input data based on experimental results. The remaining errors of these recent
predictions indicated that the solid hold up within dilute zone was still predicted
to be higher than the actual value at the combustion tests.
Regarding the pressure drop through loop seal, the constant values predicted for
all cases independent of input data, were attributed to the loop seal solid holdups
that were calculated to be identical.
The predictions of the pressure drop through downcomer is dependent on the
accuracy of other items, as the pressure balance model was set up based on the
equality of pressure drop through downcomer to the total of other pressure drop
items. This was the reason why the prediction of the model applied at the design
phase was fairly inaccurate. As the other pressure drop items were predicted with
poor accuracy, the errors of these predictions added up to result in a significant
discrepancy in the predicted pressure drop for downcomer. On the contrary, the
error for the downcomer in Test-1 was very low compared to the model
predictions at design phase and for Test-2. This was attributed to the
compensation of discrepancies in negative and positive directions for this test.
Therefore, it is concluded that the error for the pressure drop prediction through
downcomer may not be reliable for evaluating the accuracy of the model.
In conclusion, the predictions of the pressure balance model were improved to
have more favourable agreement with the measurements, after the input data for
the pressure balance model were revised based on the experimental results.
However, pressure balance model can be improved for predicting the pressure
profile througout the combustor with a better accuracy.

162
CHAPTER 6
CONCLUSIONS
6.1 General
In this study, a 150 kWt Circulating Fluidized Bed (CFB) Combustor Test Unit
was designed and constructed in Chemical Engineering Department of Middle
East Technical University, based on the extensive experience acquired at the
existing 0.3 MWt Bubbling Atmospheric Fluidized Bed Combustor Test Rig.
Following the commissioning tests, combustion tests were carried out for
investigation of combustion characteristics of Çan lignite in CFB conditions and
for comparison of the design of the test unit with experimental findings.
Based on the steady state results of the combustion tests and comparisons between
these results and predictions of the design models, the following conclusions have
been reached:
• Temperature profile was slightly far from being uniform in Test-1 due to
the excess cooling rate, which resulted in a low average temperature along
the riser (784°C). By better control of cooling water flow rate and the help
of higher fuel input in Test-2, almost uniform temperature profile along
the riser was achieved and the average temperature in the riser was
increased to 842°C.
• Pressure drop through the dilute zone was observed to be negligible
because of low solid hold up in the dilute zone.
163
• Based on the experimental results, the input data for the pressure balance
model were revised and the predictions of the model were improved to
have more favorable agreement with the measurements.
• The compositions of bottom and fly ash streams at each test were similar
to each other, except the Fe2O3 content which was higher in the bag filter
ash.
• Although the coal particle size was significantly differed between two
combustion tests, particle size distributions of ash streams were not
affected clearly from this deviation. On the other hand, the deviation
observed at the size distributions of bottom ash and circulating ash among
the tests were in line with the deviation of superficial velocity.
• Heat transfer coefficients observed at the cooled modules of the combustor
were within the range of 24.4 – 29.2 kcal/h m² K.
• The heat losses from the external surface of insulation during the tests
were observed to be higher than the values predicted during design studies.
• The combustion efficiencies of Test-1 and Test-2 were 98.90% and
99.37%, respectively.
In conclusion, the performance of 150 kW CFBC Test Unit was satisfactory to be
utilized for the long term research studies on combustion and desulfurization
characteristics of indigenous lignite reserves in circulating fluidized bed
combustors.
5.2 Suggestions For Future Work
Based on the experience gained in the present study, the following
recommendations for future extension of the work are suggested:
• Parametric studies can be carried out by firing Çan lignite and other
Turkish lignite reserves with limestone addition.
164
• The mathematical model recently developed in METU Chemical
Engineering Department for simulation of CFBCs can be applied to
prediction of steady state behavior of the Test Unit.
• Pressure balance model can be improved for predicting the pressure profile
throughout the combustor with a better accuracy.
• The design of downcomer leg can be modified for measuring solid
circulation rate.
• A separate air supply system can be designed for loop-seal air to control
the flow rates of secondary air and loop-seal independently. As a result of
this, secondary air ratio can be increased to typical operating values of
CFBCs.

165
REFERENCES
1. International Energy Outlook 2004, Energy Information Administration, Office of Integrated Analysis and Forecasting, U.S. Department of Energy, Washington, DC 20585, April 2004.
2. BP statistical review of world energy 2004, URL://www.bp.com/
statisticalreview2004. 3. Önal G., “Türkiye’nin Enerji Açığının Kapatılmasında Kömürün Önemi”,
TMMOB Elektrik Mühendisleri Odası Türkiye II. Enerji Sempozyumu, II. Baskı, s.131, Mayıs 2000.
4. Selçuk N., “Akışkan Yatakta Yakma Teknolojileri”, TMMOB Kimya
Mühendisleri Odası – TMMOB Maden Mühendisleri Odası, Türkiye’de Kömür Politikaları ve Temiz Kömür Teknolojileri Sempozyumu, Ankara, 21-22 Ekim 1999.
5. Annual Energy Outlook 2004 With Projections To 2025, Energy Information
Administration, Office of Integrated Analysis and Forecasting, U.S. Department of Energy, Washington, DC 20585, January 2004.
6. Diversity of fuels used to generate electricity in the UK, EU and other major
electricity producing countries, Energy Trends Special Features and Articles, The Department of Trade and Industry, U.K., December 2001 – URL://www.dti.gov.uk/energy/inform/energy_trends/electricity_art_dec2001.pdf
7. International Energy Outlook 2003, Energy Information Administration,
Office of Integrated Analysis and Forecasting, U.S. Department of Energy, Washington, DC 20585, April 2003.
8. Selçuk N., Arabul H., “Elektrik Enerjisinde Ulusal Politika – 2000 Yılında
Türkiye’de Elektrik Enerjisinde Mevcut Durum, Sorunlar ve Çözüm Önerileri”, Ekim 2000.

166
9. Türkyılmaz O., “Türkiye’nin Doğal Gaz Temin ve Tüketim Politikalarının Değerlendirilmesi”, TMMOB Elektrik Mühendisleri Odası Türkiye II. Enerji Sempozyumu, II. Baskı, s.183, Mayıs 2000.
10. Ünver T., Ünal V., “Türkiye’nin Enerji Planlamasında Linyit Kaynaklarının
Yeri”, TMMOB Elektrik Mühendisleri Odası Türkiye II.Enerji Sempozyumu, II. Baskı, p.137, Mayıs 2000.
11. 8. Beş Yıllık Kalkınma Planı, “Madencilik Özel İhtisas Komisyonu Enerji
Hammaddeleri Alt Komisyonu Kömür Çalışma Grubu Raporu”, Ocak, 2000. 12. JEA Large-Scale CFB Combustion Demonstration Project, Advanced Electric
Power Generation, Fluidized Bed Combustion, US Department of Energy, 1999.
13. Selçuk N., and Scheffknecht G., “Design of a 2 x 160 MWel CFB Boiler
Utilizing High Sulfur Turkish Lignite”, 17th FBC Conference, Jacksonville, FL, 18-21 May 2003.
14. Selçuk N., “Practical Combustion Systems and Pollution Regulations”,
Invited lecture of Nevin Selçuk for ICS Training Course on Laser Diagnostics of Combustion Processes NILES, Cairo, 18-22 November 2000.
15. Basu P. and Fraser S. A., “Circulating Fluidized Bed Boilers: Design and
Operations”, Butterworth-Heinemann, 1991. 16. Selçuk N., “Fluidized bed combustion of coal”, Y.Yürüm (ed.), New Trends
in Coal Science, 481-494, 1988. 17. Selçuk N., Atamer S., Eroğlu İ., Önal I., and Kırmızıgül Ü., "2 MWt Lignite
Fired Atmospheric Fluidized Bed Boiler: Fundamental Process Design Philosophy", 12th FBC Conference (ed.Rubow, L.N.), ASME, 1, 303-308, 1993.
18. Park C. K., “Dynamic Behavior of Circulating Fluidized Bed Boiler
Furnace”, Ph.D Thesis, Technical University of Nova Scotia, 1995.

167
19. Desai D. L., “Pilot Plant Investigation of N2O Emissions Including the Effect of Long Term Operation in Circulating FBC”, Proceedings of 13th FBC Conference, 1995.
20. Adanez J., Gayan P., Grasa G., de Diego L. F., Armesto L., and Cabanillas
A., “Circulating Fluidized Bed Combustion in the Turbulent Regime: Modelling of Carbon Combustion Efficiency and Sulphur Retention”, Fuel, Vol. 80, 1415 – 1414, 2001.
21. Alliston M. G., Probst S. G., Wu S., Edvardsson C. M., “Experience with the
Combustion of Alternate Fuels in a CFB Pilot Plant”, Proceedings of 13th FBC Conference, 1995.
22. Moe T. A., Mann M. D., Hajicek D. H., Weiss A. J., “Demonstration of
Pelletized Fly Ash Reinjection for Reduction of Limestone Consumption and Ash Disposal”, Proceedings of 13th FBC Conference, 1995.
23. Chemical and Technological Properties of Turkish Tertiary Coals, General
Directorate of Mineral Research and Exploration, Ankara, 2002. 24. Endüstriyel Kaynaklı Hava Kirliliğinin Kontrolü Yönetmeliği, 2004. 25. Selçuk N., Değirmenci E., Oymak O., and Organ L., “Determination of NOx
Emissions from a Lignite Fired Fluidized Bed Combustor,” TUBITAK-MISAG Project No: 89, ODTÜ, Ankara, Turkey, January 1998.
26. Değirmenci E., “Dynamic Simulation of Fluidized Bed Combustors”, Ph.D.
Thesis, Department of Chemical Engineering, Middle East Technical University, Ankara, Turkey, 2000.
27. Göğebakan Y., and Selçuk N., “Assessment of a model with Char Attrition
for a Bubbling Atmospheric Fluidized-Bed Combustor”, Combustion Science and Technology, Vol. 176, 799 – 818, 2004.
28. Adanez J., De Diego L. F., Gayan F., Armesto L., and Cabanillas A., “A
Model for Prediction of Carbon Combustion Effciency in Circulating Fluidized Bed Combustors”, Fuel, Vol. 74, No. 7, 1049 – 1056, 1995.

168
29. Ducarne E. D., Dolignier J. C., Marty E., Martin G., and Delfosse L.,
“Modelling of Gaseous Pollutants Emissions in Circulating Fluidized Bed Combustion of Municipal Refuse”, Fuel, Vol. 77, No. 13, 1399 – 1410, 1998.
30. Winaya N. S., Basu P., and Reddy B. V., “Experimental investigations on
heat transfer from suspension to impact separators in the riser column of a circulating fluidized bed combustor”, Int. Journal of Heat and Mass Transfer, Vol. 46, 71 – 75, 2003.
31. de Nevers N., “Air Pollution Control Engineering”, McGraw Hill Inc., 1995. 32. Kim S. W., Kim S. D., and Lee D. H., “Pressure Balance Model for
Circulating Fluidized Beds with a Loop-seal”, Ind. Eng. Chem. Res., Vol. 41, 4949-4956, 2002.
33. Bai D., and Kato K., “Quantitative Estimation of Solids Holdups at Dense
and Dilute Regions of Circulating Fluidized Beds”, Powder Technology, Vol. 101, 183 – 190, 1999.
34. Kunii D., and Levenspiel O., “Fluidization Engineering”, Second Ed.,
Butterworth-Heinemann, 1991. 35. Harmandar H., "Effect of Recycling on the Performance of Bubbling
Fluidized Bed Combustors", App. D, M. Sc. Thesis, Department of Chemical Engineering, METU, 2003.
36. Kozan M., Kırbaş G., Göğebakan Y., and Tarhan T., “Che.532 Fluidization
Course Term Project”, Chemical Engineering Department, METU, 1998. 37. Batu A., “Modeling of Radiative Heat Transfer in Freeboard of a 0.3 MW
AFBC Test Rig Using Zone Method Of Analysis”, M.Sc. Thesis, Middle East Technical University, 2001.
38. Perry R. H., and Green D. W., “Perry’s Chemical Engineer’s Handbook”,
Physical and Chemical Properties, Seventh Edition, McGraw-Hill, 1997.

169
39. Borman G. L., and Ragland K. W., “Combustion Engineering”, Appendix C, Mc-Graw-Hill, 1998.
40. Incropera F. P., and De Witt D. P., “Fundamentals of Heat and Mass
Transfer”, Second Ed., p.397, John Wiley & Sons, 1985. 41. Göğebakan Z., “Cofiring Biomass with Coal in Bubbling Fluidized Bed
Combustors”, Ph.D. Thesis, Middle East Technical University, 2007. 42. Altındağ H., “Mathematical Modeling of Sulfur Retention In Fluidized Bed
Combustors”, M.Sc. Thesis, Middle East Technical University, 2003.

170
APPENDIX A
ENERGY FIGURES
Table A.1 World Total Energy Consumption by Fuel (2001 – 2025) [1]
2001 2025 mill. toe % mill. toe % Petroleum 3943.5 38.7 6181.1 39.4 Natural Gas 2345.9 23.1 3943.5 25.1 Coal 2416.5 23.7 3532.8 22.5 Nuclear 665.2 6.5 1270.0 4.9 Others 811.4 8.0 19.8 8.1
Table A.2 World Energy Consumption for Electricity Generation by Fuel
(2001 – 2025) [1]
2001 2025 mill. toe % mill. toe % Petroleum 307.4 7.6 428.4 6.6 Natural Gas 745.9 18.4 1642.9 25.2 Coal 1539.6 38.1 2436.7 37.4 Nuclear 660.2 16.3 766.0 11.7 Others 793.7 19.6 1244.8 19.1
Figure A.1 Distribution of world fossil fuel reserves [2]
Africa7.8%
North America
4.2%
Europe &Eurasia35.4%
Asia Pacif ic7.7%
Sou.-Cent. America
4.1%
Middle East
40.8%MiddleEast
63.3%
Sou.-Cent. America
8.9%
Asia Pacif ic4.2%
Europe &Eurasia9.2%
North America
5.5% Africa8.9%
Sou.-Cent. America
2.2%
Asia Pacif ic29.7%
Europe&Eurasia36.1%
North America26.2%
Africa & Middle East
5.8%
Petroleum Natural Gas Coal

171
APPENDIX B
BASIC DESIGN
Table B.1 Analysis of Beypazarı lignite
Coal Analysis (as fired) Design Coal (Beypazari)
Carbon 31.68%
Hydrogen 2.58%
Oxygen 7.81%
Nitrogen 1.23%
Sulfur 2.49%
Ash 29.52%
Water 24.69%
LHV (kcal/kg) 2,669
Table B.2 Coal and limestone consumptions
Coal consumption, kg/h 48.36
Limestone consumption, kg/h 8.71
Table B.3 Oxygen demand and combustion air data
Oxygen demand, kg/h 52.68
Oxygen in coal, kg/h 3.78
Exact oxygen demand from air, kg/h 48.90
Theoretical air flow rate, kg/h 211.0
Total dry air flow rate, kg/h 253.2
Total dry air flow rate, Nm³/h 196.32

172
Table B.4 Flue gas data
CO, kg/h 0.07
CO2, kg/h 58.39
H2O, kg/h 26.46
SO2, kg/h 0.24
O2, kg/h 10.77
NO, kg/h 0.19
N2, kg/h 193.38
Flue gas flow rate, kg/h 289.51
Flue gas flow rate, dry, Nm³/h 192.25
Flue gas flow rate, wet, m³/h @ 850°C 909.92
Table B.5 Cross sectional area and dimensions
Cross sectional area, m² 0.051
Diameter, cm 25.37
Side, cm 22.48
Table B.6 Flue gas composition
CO2 13.2%
H2O 14.6%
SO2, ppm 374
O2 3.3%
N2 68.7%
CO, ppm 257.7
NO, ppm 633.9

173
Table B.7 Ash generation and contents
CaSO4, kg/h 4.61
CaO, kg/h 2.70
Total ash generation, kg/h 22.27
Bottom ash, kg/h 8.90
Fly ash, kg/h 13.40
C in bottom ash, kg/h 0.09
C in fly ash, kg/h 0.27

174
APPENDIX C
DETAILED DESIGN
Table C.1 Cyclone Inlet Duct Data
Cyclone inlet velocity, m/s 20
Flue gas volumetric flow rate (@850°C, wet), m³/h 910
Cyclone inlet cross section, m² (cm²) 0.013 (126.4)
Cyclone inlet dimension (H x Wi), cm 7.95 x 15.90
Table C.2 Cyclone Dimensions (cm)
Cyclone diameter, Do 31.80
Cyclone inlet width, Wi 7.95
Cyclone inlet height, H 15.90
Cylindrical part’s height, H1 63.60
Conical part’s height, H2 63.60
Gas outlet line’s diameter, De 15.90
Gas outlet line’s depth, S 19.87
Particle discharge line, Dd 7.95
Table C.3 Physical properties for pressure balance model
Combustion gas density [9] ρg 0.31 kg/m³
Combustion gas viscosity [8] µ 4.5 x 10⁻⁵ kg/ms
Dense zone particle density [5] ρs-dense 1,850 kg/m³
Dilute zone particle density [5] ρs-dilute 930 kg/m³
Fly ash particle bulk density [7] ρbulk 536 kg/m³
Particle size at dense zone [5] dp-dense 1.16 mm
Particle size at dilute zone [5] dp-dilute 0.042 mm
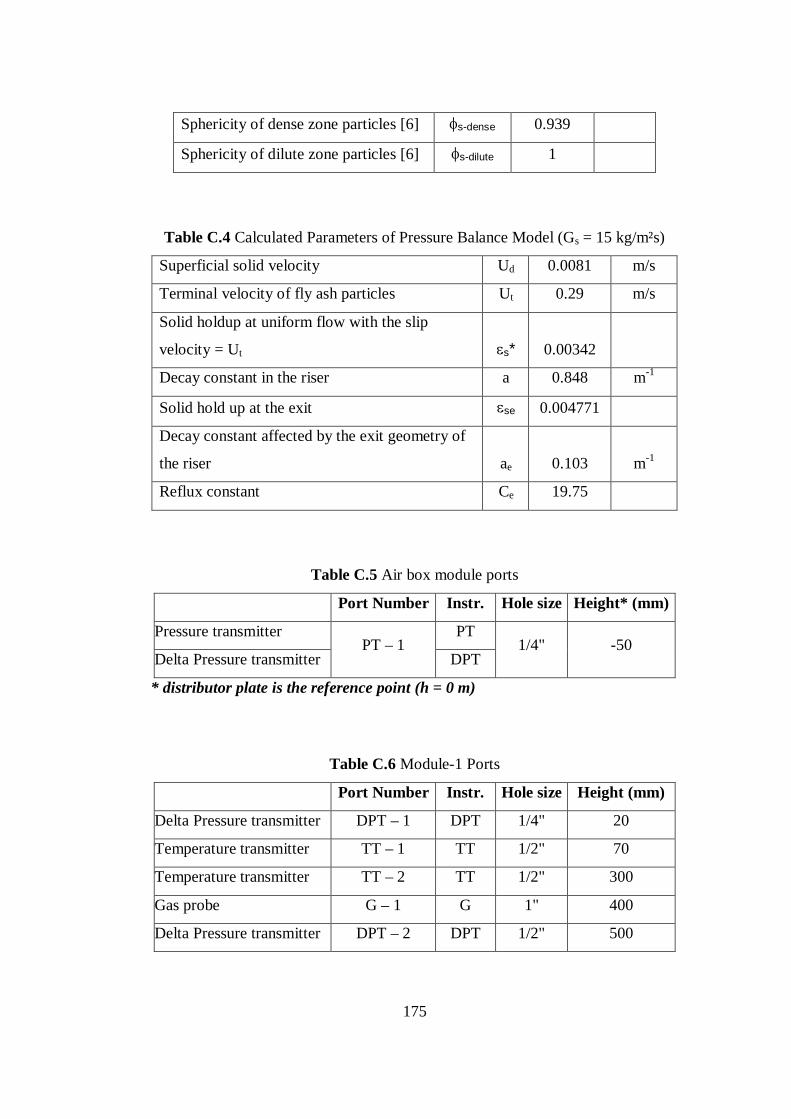
175
Sphericity of dense zone particles [6] φs-dense 0.939
Sphericity of dilute zone particles [6] φs-dilute 1
Table C.4 Calculated Parameters of Pressure Balance Model (Gs = 15 kg/m²s)
Superficial solid velocity Ud 0.0081 m/s
Terminal velocity of fly ash particles Ut 0.29 m/s
Solid holdup at uniform flow with the slip
velocity = Ut εs* 0.00342
Decay constant in the riser a 0.848 m-1
Solid hold up at the exit εse 0.004771
Decay constant affected by the exit geometry of
the riser ae 0.103 m-1
Reflux constant Ce 19.75
Table C.5 Air box module ports
Port Number Instr. Hole size Height* (mm)
Pressure transmitter PT
Delta Pressure transmitter PT – 1
DPT 1/4" -50
* distributor plate is the reference point (h = 0 m)
Table C.6 Module-1 Ports
Port Number Instr. Hole size Height (mm)
Delta Pressure transmitter DPT – 1 DPT 1/4" 20
Temperature transmitter TT – 1 TT 1/2" 70
Temperature transmitter TT – 2 TT 1/2" 300
Gas probe G – 1 G 1" 400
Delta Pressure transmitter DPT – 2 DPT 1/2" 500

176
Port Number Instr. Hole size Height (mm)
Temperature transmitter TT – 3 TT 1/4" 700
Delta Pressure transmitter DPT – 3 DPT 1/4" 1000
Temperature transmitter TT – 4 TT 1/2" 1100
Table C.7 Module-2 Ports
Port Number Instr. Hole size Height (mm)
Temperature transmitter TT – 5 DPT 1/2" 1700
Gas probe G – 2 TT 1" 1800
Delta Pressure transmitter DPT – 4 G 1/4" 2150
Temperature transmitter TT – 6 TT 1/2" 2300
Temperature transmitter TT – 7 DPT 1/2" 3250
Delta Pressure transmitter DPT – 5 TT 1/4" 3300
Table C.8 Module-3 Ports
Port Number Instr. Hole size Height (mm)
Gas probe G – 3 G 1" 3700
Temperature transmitter TT – 8 TT 1/2" 4200
Delta Pressure transmitter DPT – 6 DPT 1/4" 4450
Gas probe G – 4 G 1" 5000
Temperature transmitter TT – 9 TT 1/2" 5150
Table C.9 Module-4 Ports
Port Number Instr. Hole size Height (mm)
Delta Pressure transmitter DPT – 7 DPT 1/4" 5600
Temperature transmitter TT – 10 TT 1/2" 6100
Gas probe G – 5 G 1" 6400
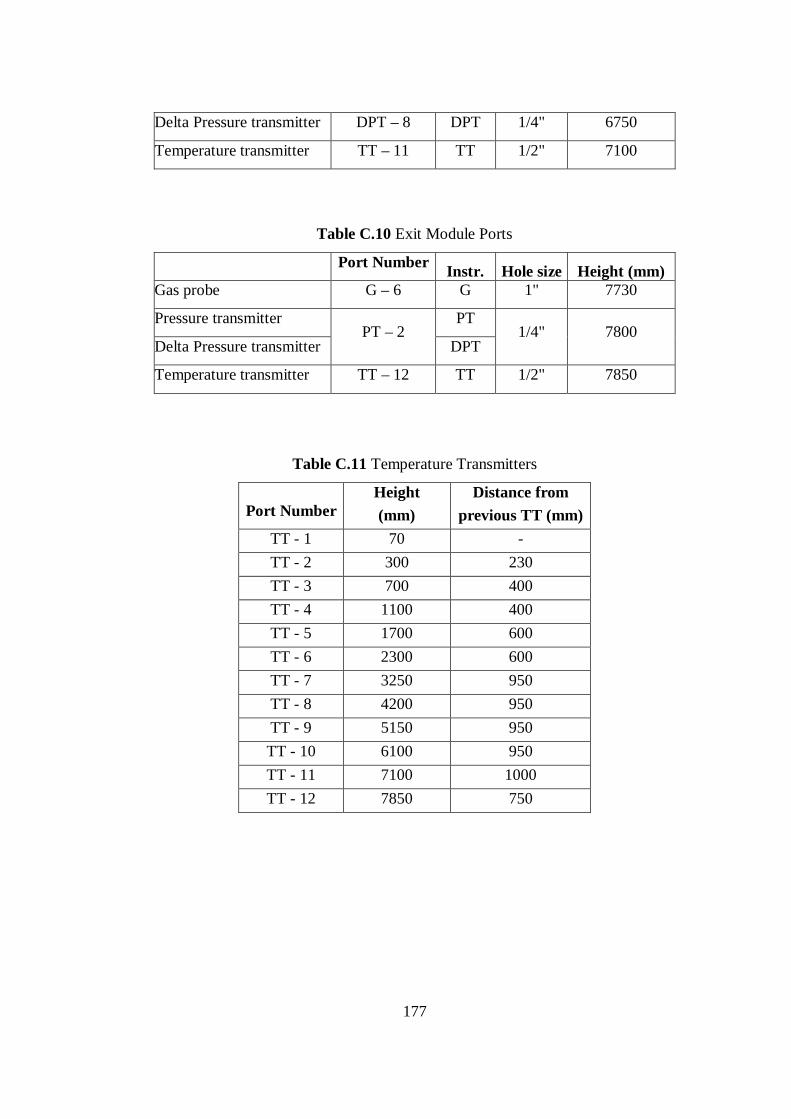
177
Delta Pressure transmitter DPT – 8 DPT 1/4" 6750
Temperature transmitter TT – 11 TT 1/2" 7100
Table C.10 Exit Module Ports
Port Number Instr. Hole size Height (mm)
Gas probe G – 6 G 1" 7730
Pressure transmitter PT
Delta Pressure transmitter PT – 2
DPT 1/4" 7800
Temperature transmitter TT – 12 TT 1/2" 7850
Table C.11 Temperature Transmitters
Port Number Height (mm)
Distance from previous TT (mm)
TT - 1 70 -
TT - 2 300 230
TT - 3 700 400
TT - 4 1100 400
TT - 5 1700 600
TT - 6 2300 600
TT - 7 3250 950
TT - 8 4200 950
TT - 9 5150 950
TT - 10 6100 950
TT - 11 7100 1000
TT - 12 7850 750

178
Table C.12 Pressure/Delta Pressure Transmitters
Port Number
Height
(mm)
Distance from
previous DP port (mm)
PT – 1 -50 -
DPT – 1 20 70
DPT – 2 500 480
DPT – 3 1000 500
DPT – 4 2150 1150
DPT – 5 3300 1150
DPT – 6 4450 1150
DPT – 7 5600 1150
DPT – 8 6750 1150
PT – 2 7800 1050
Table C.13 Gas Probes
Port Number
Height
(mm)
Distance from
previous gas probe (mm)
G – 1 400 -
G – 2 1800 1400
G – 3 3700 1900
G – 4 5000 1300
G – 5 6400 1400
G – 6 7730 1330

179
Figure C.1 Instrument Ports
P
ress
ure
Sol
ids
Fee
ding
T
empe
ratu
re
C
ircu
lati
on
G
as S
ampl
ing

180
APPENDIX D
PROCUREMENT and INSTALLATION
Figure D.1 Distributor Plate
Figure D.2 Bearing Plate

181
Figure D.3 Module – 1

182
Figure D.4 Module – 2

183
Figure D.5 Modules 3 and 4

184
Figure D.6 Cyclone
Figure D.7 Windbox after Burner Valve Train is Installed

185
Figure D.8 Solids Handling and Feesing

186
Table D.1 Specifications of Screw Conveyors and Air Lock
Quantity Specifications
Fuel silos discharge
screw conveyors 2
Capacity: 50 kg/h (25 kg/h - 80 kg/h)
Motor-Gearbox: 0.55kW 17 rpm
Limestone silo discharge
screw conveyor 1
Capacity: 10 kg/h (2 kg/h - 20 kg/h)
Motor-Gearbox: 0.37kW 11rpm
Bed material silo
discharge screw
conveyor
1 Capacity: 150 kg/h (constant speed)
Motor-Gearbox: 0.75kW 25rpm
Solids feeding air lock 1 Capacity: 150 kg/h (constant speed)
Motor-Gearbox: 0.37kW 11 rpm
Table D.2 Pressure Transmitters
Description Qty. Model Specifications
Combustion air
(fan exit)
1
Primary air (air
box)
1
Industrial Press.
Transmitter Model:
626-08-CH-P1-E5-S1
(0 – 30 psi,
4-20 mA output)
Table D.3 Delta Pressure Transmitters
Description Qty. Model Specifications
Riser exit 1
Cyclone exit 1
Bidirectional Range Diff. Press.
Transmitter Model: 668C-16
-10”/+10” WC
4-20 mA output
Distributor plate 1
Riser, downcomer 10
Magnasense DP Transmitter
Model: MS111
0 - 5" WC
4-20 mA output
Dense zone 2 Diff. Press. Transmitter
Model: 668C-7
0 – 25" WC
4-20 mA output

187
Table D.4 Air Flow Rate Transmitters
Description Qty. Model Specifications
1 In-Line Flow Sensor - DS300-4” line size: 4” Combustion
air 1 Magnasense DP Transmitter 0-5"WC / 4-20 mA
1 In-Line Flow Sensor - DS300-3” line size: 3” Secondary
air 1 Magnasense DP Transmitter 0-5"WC / 4-20 mA
Table D.5 Air Rotameters
Description Qty. Model Specifications
J-valve fluidization 2 Rate Master Flowmeters
Model: RMA-SSV-150
2” scale
10 – 100 cc/min
Solids feed conveying 2 Rate Master Flowmeters
Model: RMA-SSV-11
2” scale
30 – 240 cc/min
Table D.6 Water Flowmeters
Description Qty. Model Specifications
2nd module cooling water 1
3rd module cooling water 1
Digisens Flow Sensor
TRB DN20 brass 90°C
0 – 3 m³ / h
4 – 20 mA output
Table D.7 Temperature Transmitters
Description Qty. Model Specifications
Combustion air
Cooling water 6 Pt-100
0 – 100°C
4-20 mA output
Flue gas 5 T/C (K type)
Combustor 14 T/C (K type)
0 – 1000°C
4-20 mA output

188
Table D.8 Air Flow Control Valves
Description Qty. Model Specifications
Combustion air 1 DN 100
4 – 20 mA input
Secondary air 1
ASTEKNIK butterfly valve
Rilsan damper, Double effect
pneumatic piston actuator,
analog I/P positioner
DN 80
4 – 20 mA input

189
APPENDIX E
RESULTS
Table E.1 Steady State Temperature Measurements along the Combustor
Height* Test-1 Test-2
Tag (mm) °C °C
TTC01 70 824.6 850.8
TTC02 300 837.0 860.3
TTC03 700 839.4 862.9
TTC04 1100 845.5 871.4
TTC05 1700 827.0 862.1
TTC06 2300 806.8 856.7
TTC07 3250 761.5 832.3
TTC08 4200 723.5 815.0
TTC09 5150 718.3 815.5
TTC10 6100 742.0 828.4
TTC11 7100 744.1 830.3
TTC12 7850 733.8 822.6
* height above distributor plate
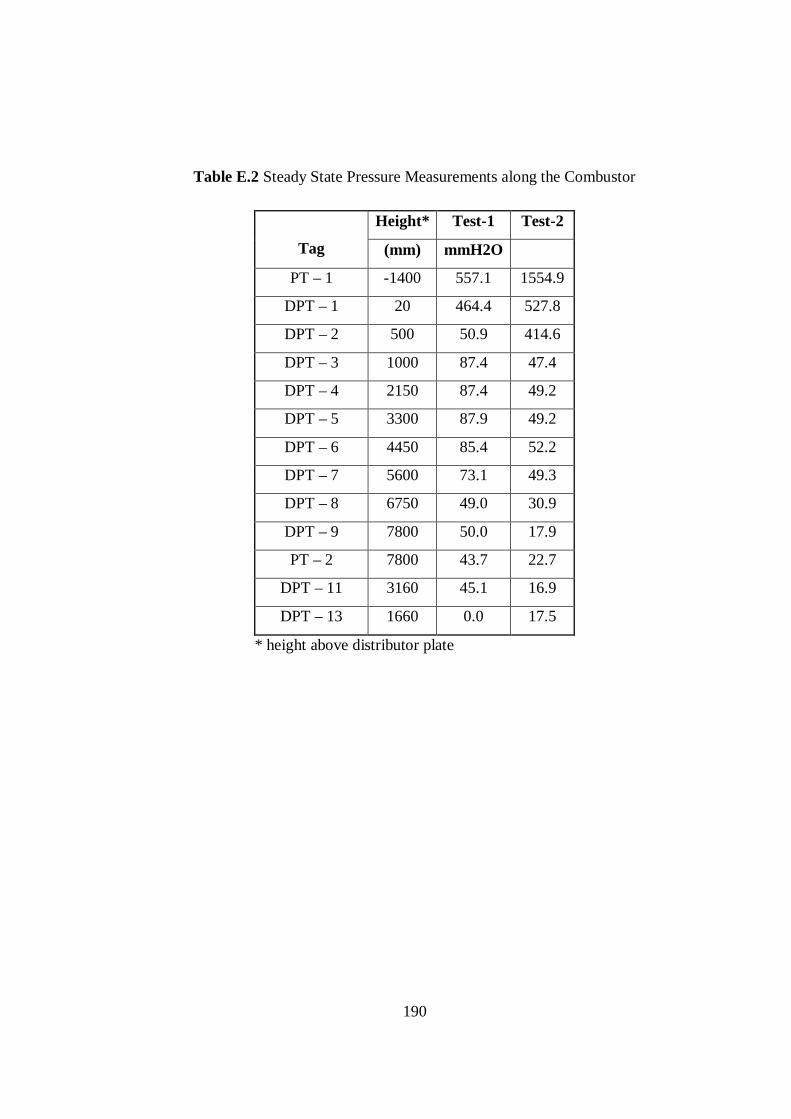
190
Table E.2 Steady State Pressure Measurements along the Combustor
Height* Test-1 Test-2
Tag (mm) mmH2O
PT – 1 -1400 557.1 1554.9
DPT – 1 20 464.4 527.8
DPT – 2 500 50.9 414.6
DPT – 3 1000 87.4 47.4
DPT – 4 2150 87.4 49.2
DPT – 5 3300 87.9 49.2
DPT – 6 4450 85.4 52.2
DPT – 7 5600 73.1 49.3
DPT – 8 6750 49.0 30.9
DPT – 9 7800 50.0 17.9
PT – 2 7800 43.7 22.7
DPT – 11 3160 45.1 16.9
DPT – 13 1660 0.0 17.5
* height above distributor plate

191
Table E.3 Particle Size Distributions of Bag Filter Ash
Test – 1 Test – 2
Dp (µm) Cumulative % Cumulative %
< 0.356 0.00 0.00
0.399 0.04 0.00
0.448 0.15 0.07
0.502 0.39 0.23
0.564 0.71 0.47
0.632 1.10 0.74
0.710 1.54 1.05
0.796 2.00 1.36
0.893 2.48 1.69
1.002 2.97 2.01
1.125 3.48 2.33
1.262 4.03 2.67
1.416 4.66 3.03
1.589 5.38 3.40
1.783 6.23 3.94
2.000 7.23 4.50
2.244 8.39 5.14
2.518 9.71 5.87
2.825 11.18 6.68
3.170 12.80 7.57
3.557 14.55 8.54
3.991 16.43 9.60
4.477 18.45 10.75
5.024 20.61 12.01
5.637 22.91 13.37

192
Test – 1 Test – 2
Dp (µm) Cumulative % Cumulative %
6.325 25.35 14.86
7.096 27.92 16.49
7.962 30.62 18.26
8.934 33.44 20.18
10.024 36.36 22.26
11.247 39.36 24.49
12.619 42.43 26.88
14.159 45.55 29.44
15.887 48.71 32.16
17.825 51.90 35.06
20.000 55.11 38.14
22.440 58.33 41.41
25.179 61.57 44.88
28.251 64.79 48.55
31.698 68.00 52.40
35.566 71.16 56.43
39.905 74.26 60.60
44.774 77.27 64.87
50.238 80.18 69.18
56.368 82.96 73.45
63.246 85.59 77.61
70.963 88.05 81.56
79.621 90.32 85.22
89.337 92.37 88.51
100.237 94.19 91.38
112.468 95.78 93.80
126.191 97.11 95.77
141.589 98.19 97.30

193
Test – 1 Test – 2
Dp (µm) Cumulative % Cumulative %
158.866 99.02 98.45
178.250 99.60 99.24
200.000 99.94 99.69
224.404 100.00 99.89
251.785 100.00 99.96
> 282.508 100.00 100.00

194
VITA
PERSONAL INFORMATION Surname, Name : Batu, Aykan Nationality : Turkish (TC) Date and Place of birth : 7 March 1978 Marital status : Married E-mail : [email protected] Tel: : +90 533 664 46 91 EDUCATION Degree Institution Year of Graduation M.Sc. METU Chemical Engineering 2001 B.Sc. METU Chemical Engineering 1999 High School Atatürk Anadolu High School, Ankara 1995 WORK EXPERIENCE Year Place Enrollment 2001 – present MİMAG-SAMKO Business Development
Enerji Teknolojileri A.Ş. Manager FOREIGN LANGUAGES Advanced English PUBLICATIONS 1. N. Selcuk, A. Batu and O. Oymak “NOx Emissions from Combustion of High Sulfur Lignite in an ABFBC Test Rig”, 17th International ASME Conference on Fluidized Bed Combustion, May 18 – 21, 2003, Jacksonville, FL. 2. A. Batu and N. Selçuk " Modeling of Radiative Heat Transfer in the Freeboard of a Fluidized Bed Combustor using the Zone Method of Analysis", Turk. J. Engin. Environ. Sci., 26, (2002), 49-58. 3. N. Selcuk, A. Batu and I. Ayrancı “Performance of Method of Lines Solution of Discrete Ordinates Method in the Freeboard of a Bubbling Fluidized Bed Combustor”, JQSRT, Vol. 73 (2-5), pp. 503-516, 2002.