Investigation of Roller Sliding in Wind Turbine Gearbox ... · related to dynamics at low-load...
28
NREL is a national laboratory of the U.S. Department of Energy Office of Energy Efficiency & Renewable Energy Operated by the Alliance for Sustainable Energy, LLC This report is available at no cost from the National Renewable Energy Laboratory (NREL) at www.nrel.gov/publications. Contract No. DE-AC36-08GO28308 Technical Report NREL/TP-5000-73286 May 2019 Investigation of Roller Sliding in Wind Turbine Gearbox High-Speed-Shaft Bearings David Vaes, 1 Yi Guo, 2 Pietro Tesini, 3 and Jonathan Keller 2 1 SKF Belgium NV/SA 2 National Renewable Energy Laboratory 3 SKF B.V.
Transcript of Investigation of Roller Sliding in Wind Turbine Gearbox ... · related to dynamics at low-load...
NREL is a national laboratory of the U.S. Department of Energy Office of Energy Efficiency & Renewable Energy Operated by the Alliance for Sustainable Energy, LLC This report is available at no cost from the National Renewable Energy Laboratory (NREL) at www.nrel.gov/publications.
Contract No. DE-AC36-08GO28308
Technical Report NREL/TP-5000-73286 May 2019
Investigation of Roller Sliding in Wind Turbine Gearbox High-Speed-Shaft Bearings David Vaes,1 Yi Guo,2 Pietro Tesini,3 and Jonathan Keller2
1 SKF Belgium NV/SA 2 National Renewable Energy Laboratory3 SKF B.V.
NREL is a national laboratory of the U.S. Department of Energy Office of Energy Efficiency & Renewable Energy Operated by the Alliance for Sustainable Energy, LLC This report is available at no cost from the National Renewable Energy Laboratory (NREL) at www.nrel.gov/publications.
Contract No. DE-AC36-08GO28308
Technical Report NREL/TP-5000-73286 May 2019
National Renewable Energy Laboratory 15013 Denver West Parkway Golden, CO 80401 303-275-3000 • www.nrel.gov
Investigation of Roller Sliding in Wind Turbine Gearbox High-Speed-Shaft Bearings David Vaes,1 Yi Guo,2 Pietro Tesini3, and Jonathan Keller2
1 SKF Belgium NV/SA 2 National Renewable Energy Laboratory3 SKF B.V.
Suggested Citation Vaes, David, Yi Guo, Pietro Tesini, and Jonathan Keller. 2019. Investigation of Roller Sliding in Wind Turbine Gearbox High-Speed-Shaft Bearings. Golden, CO: National Renewable Energy Laboratory. NREL/TP-5000-73286. https://www.nrel.gov/docs/fy19osti/73286.pdf.

NOTICE
This work was authored [in part] by the National Renewable Energy Laboratory, operated by Alliance for Sustainable Energy, LLC, for the U.S. Department of Energy (DOE) under Contract No. DE-AC36-08GO28308. Funding provided by the U.S. Department of Energy Office of Energy Efficiency and Wind Energy Technologies Office. The views expressed herein do not necessarily represent the views of the DOE or the U.S. Government.
This report is available at no cost from the National Renewable Energy Laboratory (NREL) at www.nrel.gov/publications.
U.S. Department of Energy (DOE) reports produced after 1991 and a growing number of pre-1991 documents are available free via www.OSTI.gov.
Cover Photos by Dennis Schroeder: (clockwise, left to right) NREL 51934, NREL 45897, NREL 42160, NREL 45891, NREL 48097, NREL 46526.
NREL prints on paper that contains recycled content.

iv This report is available at no cost from the National Renewable Energy Laboratory at www.nrel.gov/publications.
Acknowledgments This work was authored by the National Renewable Energy Laboratory, operated by Alliance for Sustainable Energy, LLC, for the U.S. Department of Energy (DOE) under Contract No. DE-AC36-08GO28308. Funding provided by the U.S. Department of Energy Office of Energy Efficiency and Renewable Energy Wind Energy Technologies Office and Cooperative Research and Development Agreements 16-608 with SKF GmbH and 17-694 with Flender Corporation.

v This report is available at no cost from the National Renewable Energy Laboratory at www.nrel.gov/publications.
List of Acronyms BEAST BEAring Simulation Tool CRB cylindrical roller bearing HSS high-speed shaft Nm newton-meter NREL National Renewable Energy Laboratory rpm revolutions per minute WEC white-etching crack
vi This report is available at no cost from the National Renewable Energy Laboratory at www.nrel.gov/publications.
Table of Contents Acknowledgments ..................................................................................................................................... iv List of Acronyms ......................................................................................................................................... v Table of Contents ....................................................................................................................................... vi List of Figures ............................................................................................................................................ vi 1 Introduction ........................................................................................................................................... 1 2 Measurement Campaign ...................................................................................................................... 2
2.1 Gearbox and Turbine Overview .................................................................................................... 2 2.2 Roller and Cage Speed Measurement ........................................................................................... 3
3 Analysis of Measured Roller Speed.................................................................................................... 5 3.1 Detection of Constant Speed Conditions ....................................................................................... 5 3.2 Averaging and Filtering the Measured Roller Speed .................................................................... 6 3.3 Measured Roller Speed Trends ..................................................................................................... 8
4 Bearing Models ................................................................................................................................... 10 4.1 Analytical Model ......................................................................................................................... 10 4.2 SKF BEAST Model .................................................................................................................... 12
5 Results and Discussion ..................................................................................................................... 14 5.1 Roller Speed, Roller Load, and Operating Clearance ................................................................. 14 5.2 Power Slip Density and Cumulative Frictional Energy .............................................................. 17
6 Conclusions ........................................................................................................................................ 19 References ................................................................................................................................................. 20
List of Figures Figure 1. Gearbox swap (left) and installation in turbine (right) ............................................................ 2 Figure 2. High-speed-shaft instrumentation schematic .......................................................................... 3 Figure 3. Proximity switch and coil voltage measurements (left) and resulting roller rotational
speed (right) .......................................................................................................................................... 4 Figure 4. Example of selected plateaus in the measured signal ............................................................ 6 Figure 5. “Folded” roller speeds with in-phase (left) and out of-phase (right) disturbances ............. 6 Figure 6. Four-slope, best-fit roller speed approximation with in-phase (left) and out-of-phase
(right) disturbances .............................................................................................................................. 8 Figure 7. Variation in loaded zone width with temperature differential (left) and torque (right) ........ 8 Figure 8. Temperature differential between the inner and outer bearing ring ...................................... 9 Figure 9. Roller speed down-slope in the unloaded zone ...................................................................... 9 Figure 10. Roller forces in a radially-loaded CRB ................................................................................. 11 Figure 11. Effect of clearance (left) and lubricant temperature (right) on analytic model roller speed
for 7,930 newton meters (Nm) of torque .......................................................................................... 12 Figure 12. BEAST high-speed-shaft model and bearing roller-raceway forces for 9,520 Nm torque
.............................................................................................................................................................. 13 Figure 13. Effect of clearance (left) and braking torque (right) on SKF BEAST model roller speed
for 7,930 Nm torque ............................................................................................................................ 13 Figure 14. Roller speed (left) and load (right) for 7,930 Nm torque and largest loaded zone .......... 16 Figure 15. Roller speed (left) and load (right) for 7,930 Nm torque and smallest loaded zone ........ 16 Figure 16. Roller speed (left) and load (right) for 9,520 Nm torque ..................................................... 17 Figure 17. Power slip density (left) and cumulative frictional energy (right) for 7,930 Nm torque and
largest loaded zone ........................................................................................................................... 18
1 This report is available at no cost from the National Renewable Energy Laboratory at www.nrel.gov/publications.
1 Introduction Failures in gearbox bearings have been a primary source of reliability issues for wind turbine drivetrains, leading to costly downtime and unplanned maintenance [1,2]. The most common failure mode is attributed to so-called white-etching cracks (WECs). “White-etching” refers to the appearance of the steel microstructure when the cracked bearing cross sections are polished, etched with chemicals, and examined under reflected light. These cracks tend to propagate to spalls or lead to a complete splitting of the inner ring. This mode of failure can occur at 5%–20% of the predicted design life and has been observed in many other industries, bearing locations, bearing types, bearing parts, and steel types [3–5].
The main drivers for the creation of WECs in steel specimens have been identified and verified by material testing. SKF has shown that the drivers can be stress related such as structural stresses and short time overloads, or they can be related to environmental weakening of the bearings because of hydrogen embrittlement, (standstill) corrosion, electrical currents, and the influence of the lubricant under mixed friction and slip conditions [6,7]. Argonne National Laboratory has also examined the physical mechanisms at the material level that lead to the formation of WECs, replicated WECs on a three-ring-on-roller benchtop test rig in highly loaded sliding conditions, and proposed cumulative frictional energy criteria to predict the occurrence of WECs [8–10]. In a full-scale wind turbine gearbox, however, the conditions leading to WECs, the process by which this failure culminates, and the reasons for their apparent prevalence are all still highly debated.
Bearing failures with WEC are typically seen in wind turbine gearboxes on the high-speed shaft (HSS) and high intermediate speed shaft and, in older designs, in the first planetary stage. One promising theory for HSS and high intermediate speed shaft bearing failures is that they are related to dynamics at low-load operating conditions that result in sliding of the rolling elements and stresses in the bearing steel. SKF has evaluated the roller slip losses in wind turbine gearbox HSS bearings for different arrangements and linked the presence of premature failures to higher power slip density [11]. Robustness increasing measures, such as black-oxidizing or special steel and heat treatments have been implemented and shown good performance in the field [12].
In a collaborative project, Flender Corporation, SKF, and the National Renewable Energy Laboratory (NREL) have instrumented a commercial drivetrain [13], installed it in a wind turbine at the National Wind Technology Center [14], and operated the turbine for more than a year [15]. The gearbox was specifically instrumented to measure high-speed bearing loads, sliding, and the lubricant environment. Commercial SKF black-oxide coated cylindrical-roller bearings were modified by magnetizing one roller and inserting a metal pin in the cage next to it to measure roller and cage speed, respectively, with an inductive coil [16] and a proximity switch. In this report, these measurements are used to validate two different modeling approaches for bearing sliding—one analytical dynamic model and one multibody model. Once validated, these models can be used to evaluate the roller slip losses or cumulative frictional energy that are considered potential driving factors for wind turbine gearbox HSS and high intermediate speed shaft bearing failures by WECs.

2 This report is available at no cost from the National Renewable Energy Laboratory at www.nrel.gov/publications.
2 Measurement Campaign The test article is a specially instrumented, Winergy 4410.4 gearbox with HSS bearings installed in a GE 1.5 SLE turbine. The drivetrain is mounted in a three-point configuration consisting of the main bearing, which largely supports the rotor weight and forces, and the two torque arms on the gearbox, which react the torque and any rotor moments. The gearbox and turbine measurements related to the WEC investigation are described in the following sections.
2.1 Gearbox and Turbine Overview The new drivetrain was installed on December 16, 2017, as shown in Figure 1, and commissioned on January 5, 2018. Through June 14, 2018, with periodic operations to support several research programs, the new drivetrain had produced 0.21 million kilowatt-hours of energy in 290 hours of grid operation time [15].
Figure 1. Gearbox swap (left) and installation in turbine (right). Photos by Dennis Schroeder,
NREL 49409 and 49413 The gearbox is a Winergy model PEAB 4410.4 produced by the Flender Corporation. It has a power rating of 1660 kilowatts. With a gearbox ratio of 78.292, it increases a main rotor speed of 18.39 revolutions per minute (rpm) to an output shaft speed of 1,440 rpm. The gearbox is composed of a single planetary stage followed by two parallel stages with helical gearing [15]. The primary gearbox instrumentation is focused on the HSS and supporting cylindrical roller bearings (CRBs) NU 2326 ECML/L4BC3 and NU 232 ECML/L4BC3 as shown in Figure 2. Hereafter, the NU 2326 rotor-side CRB is called bearing “A” and the NU 232 generator-side CRB is called bearing “B.” The shaft speed is measured with an encoder and torque and bending moments are measured with strain gages. The CRB cage and roller speed measurements are described in the next section. Additional instrumentation measures the tribological environment
3 This report is available at no cost from the National Renewable Energy Laboratory at www.nrel.gov/publications.
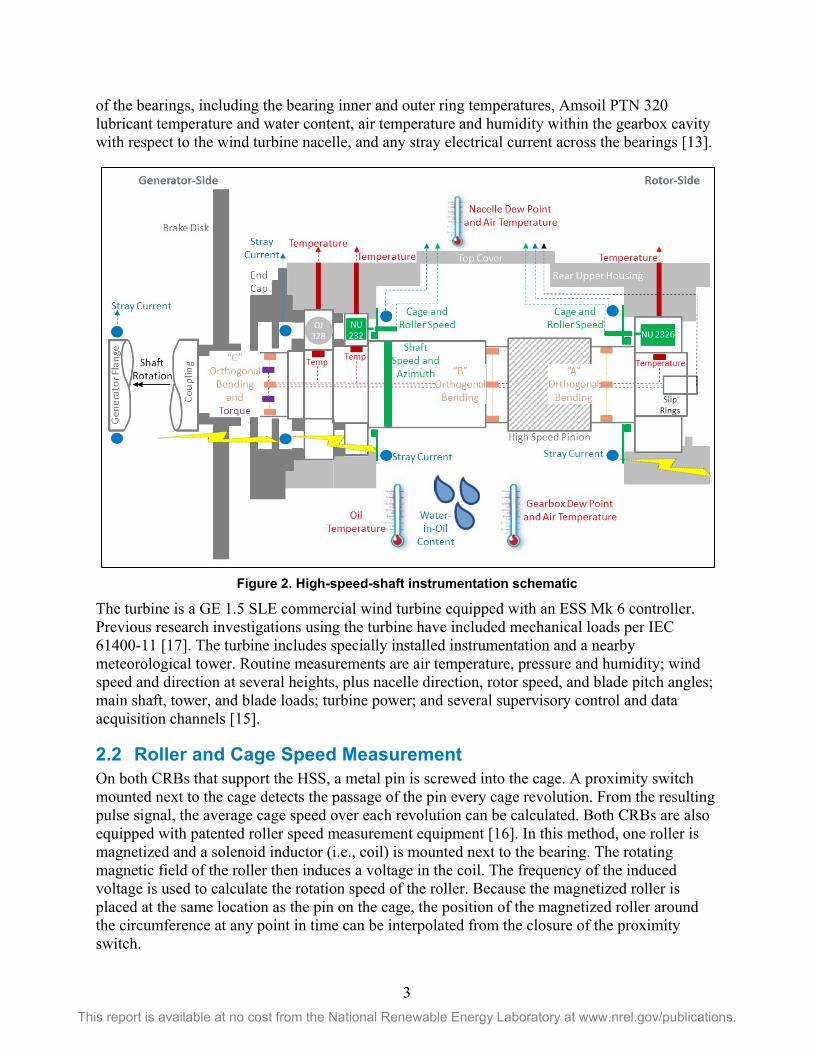
of the bearings, including the bearing inner and outer ring temperatures, Amsoil PTN 320 lubricant temperature and water content, air temperature and humidity within the gearbox cavity with respect to the wind turbine nacelle, and any stray electrical current across the bearings [13].
Figure 2. High-speed-shaft instrumentation schematic
The turbine is a GE 1.5 SLE commercial wind turbine equipped with an ESS Mk 6 controller. Previous research investigations using the turbine have included mechanical loads per IEC 61400-11 [17]. The turbine includes specially installed instrumentation and a nearby meteorological tower. Routine measurements are air temperature, pressure and humidity; wind speed and direction at several heights, plus nacelle direction, rotor speed, and blade pitch angles; main shaft, tower, and blade loads; turbine power; and several supervisory control and data acquisition channels [15].
2.2 Roller and Cage Speed Measurement On both CRBs that support the HSS, a metal pin is screwed into the cage. A proximity switch mounted next to the cage detects the passage of the pin every cage revolution. From the resulting pulse signal, the average cage speed over each revolution can be calculated. Both CRBs are also equipped with patented roller speed measurement equipment [16]. In this method, one roller is magnetized and a solenoid inductor (i.e., coil) is mounted next to the bearing. The rotating magnetic field of the roller then induces a voltage in the coil. The frequency of the induced voltage is used to calculate the rotation speed of the roller. Because the magnetized roller is placed at the same location as the pin on the cage, the position of the magnetized roller around the circumference at any point in time can be interpolated from the closure of the proximity switch.

4 This report is available at no cost from the National Renewable Energy Laboratory at www.nrel.gov/publications.
Figure 3 (left) shows an example of the cage and roller measurements for a test at low load and at the rated speed of 1,440 rpm. These measurement signals are also post-processed to show the roller speed around the circumference in Figure 3 (right). In this example, the roller speed is approximately 50% of the theoretical speed (i.e., the calculated speed for pure rolling and no sliding of the bearing rollers) inside the loaded zone and reduces to almost zero outside the loaded zone. The orientation of the load is toward an azimuth of 0 degrees, which is the calculated orientation of the load applied to the bearing resulting from the gear mesh load.
Figure 3. Proximity switch and coil voltage measurements (left) and resulting roller rotational
speed (right)
5 This report is available at no cost from the National Renewable Energy Laboratory at www.nrel.gov/publications.
3 Analysis of Measured Roller Speed In this section, the postprocessing of the cage and roller speed measurements is discussed. For validation with the numerical models, the analysis focuses on steady-state (stationary) operating conditions of the drivetrain. In future works, the models will be verified in dynamic and more extreme operating conditions and used to investigate bearing key performance parameters.
3.1 Detection of Constant Speed Conditions Because of the large amount of experimental data that was gathered during the test campaign in a wide variety of wind and turbine operating conditions, it is necessary to develop numerical screening methods. The screening methods identify time periods of constant bearing cage speed, or “plateaus,” as the ideal indicator of steady-state (stationary) operating conditions in the bearings as related to the following considerations:
• A stationary cage speed requires both the shaft speed and driving torque to be stationary, or the driving torque to be above a threshold value where the cage slip is zero.
• In these stationary cage speed conditions, the roller speed is periodic for every revolution of the cage (accelerating when entering the loaded zone and decelerating when leaving the loaded zone) and, therefore, it offers a good opportunity to filter noise from the measurement.
• In stationary cage speed conditions, the roller azimuth position can be determined with higher accuracy than in nonstationary conditions. This is related to the fact that the roller azimuth must be linearly interpolated between the points where the cage pin passes the proximity switch once each cage revolution.
Each cage speed plateau is selected using two parameters:
• A maximum permissible change in the cage speed (or “band”), which is defined as the maximum minus the minimum cage speed within the plateau
• A minimum desired number of revolutions of the cage within the plateau. These two parameters must additionally be valid for both CRBs at the same time for further analysis, because we want to select stationary conditions for the entire high-speed section.
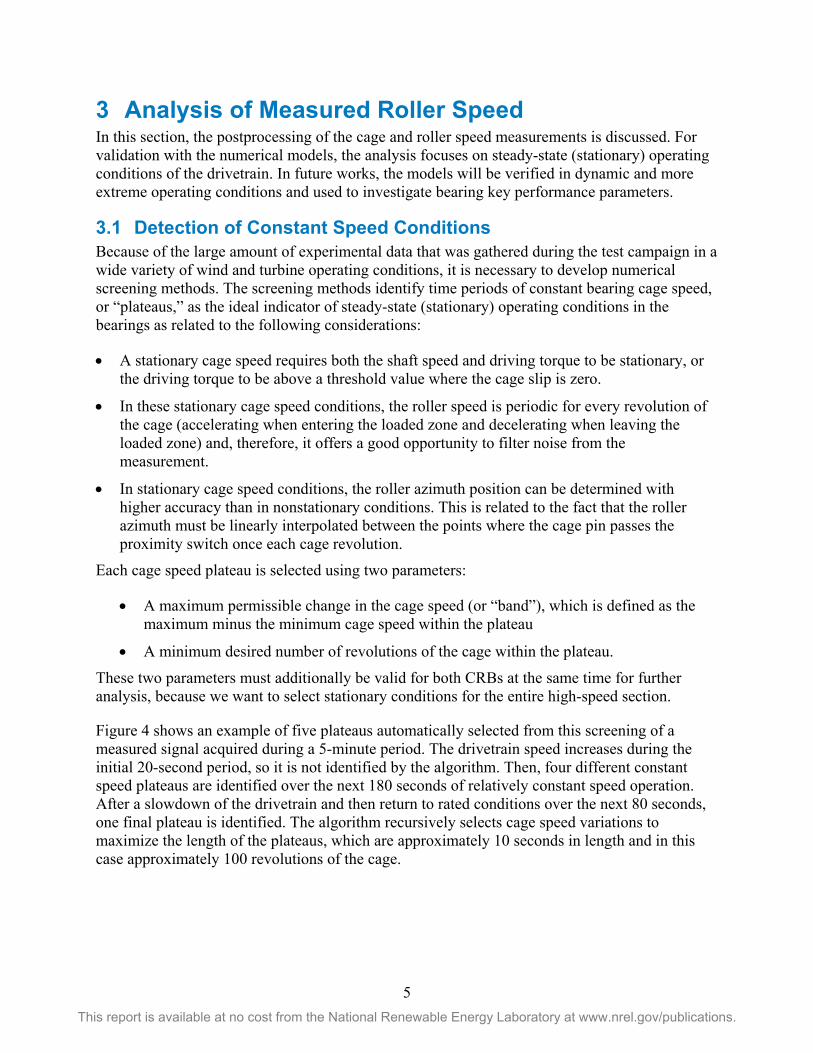
Figure 4 shows an example of five plateaus automatically selected from this screening of a measured signal acquired during a 5-minute period. The drivetrain speed increases during the initial 20-second period, so it is not identified by the algorithm. Then, four different constant speed plateaus are identified over the next 180 seconds of relatively constant speed operation. After a slowdown of the drivetrain and then return to rated conditions over the next 80 seconds, one final plateau is identified. The algorithm recursively selects cage speed variations to maximize the length of the plateaus, which are approximately 10 seconds in length and in this case approximately 100 revolutions of the cage.
6 This report is available at no cost from the National Renewable Energy Laboratory at www.nrel.gov/publications.
Figure 4. Example of selected plateaus in the measured signal
3.2 Averaging and Filtering the Measured Roller Speed In the previous section, the screening of the constant cage speed intervals from all the measured data was discussed. The approximate roller azimuthal position throughout each extracted time interval can be then interpolated from the cage proximity switch measurement. This then allows “folding” of the roller speed; that is, plotting it with respect to its position over all of the rotations of the cage within the interval.
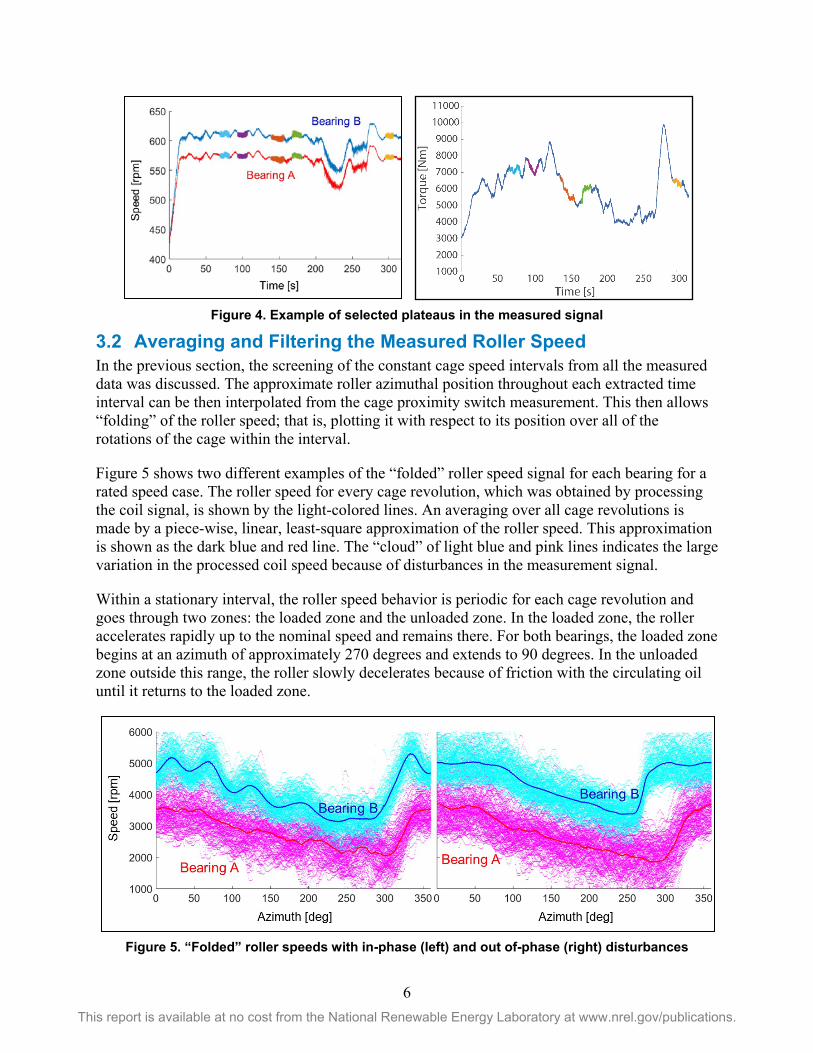
Figure 5 shows two different examples of the “folded” roller speed signal for each bearing for a rated speed case. The roller speed for every cage revolution, which was obtained by processing the coil signal, is shown by the light-colored lines. An averaging over all cage revolutions is made by a piece-wise, linear, least-square approximation of the roller speed. This approximation is shown as the dark blue and red line. The “cloud” of light blue and pink lines indicates the large variation in the processed coil speed because of disturbances in the measurement signal.
Within a stationary interval, the roller speed behavior is periodic for each cage revolution and goes through two zones: the loaded zone and the unloaded zone. In the loaded zone, the roller accelerates rapidly up to the nominal speed and remains there. For both bearings, the loaded zone begins at an azimuth of approximately 270 degrees and extends to 90 degrees. In the unloaded zone outside this range, the roller slowly decelerates because of friction with the circulating oil until it returns to the loaded zone.
Figure 5. “Folded” roller speeds with in-phase (left) and out of-phase (right) disturbances
7 This report is available at no cost from the National Renewable Energy Laboratory at www.nrel.gov/publications.
In examining the processed measurements and the approximation, there are clear differences in the two examples. The processed measurements contain a sizeable variation or “disturbance,” which is not a random measurement noise and is further discussed below. The frequency, the relative magnitude, and the phase of the disturbance have implications for determining the most accurate representation of the roller speed profile.
For the example on the left, the disturbance is strongly in-phase with the roller position. This means that for every cage revolution the disturbance is periodic, resulting in a sizable variation in the averaged signal as well. For the example on the right, the disturbance still exists, but because it is out-of-phase with the roller position, and therefore appears different in every revolution, it has very little effect on the averaged signal because it is filtered out by averaging over different cage revolutions.
This disturbance had not occurred in prior bench tests of the roller speed measurement technology, so it was not expected in this campaign. It manifests itself as a regular frequency that is rather constant through all the selected time intervals and at approximatively three times the HSS speed. However, it has slight deviations in frequency for different measurement intervals and for the two bearings. The nature of the disturbance could be either of electrical (e.g., stray current in the shaft, inducing voltage in the coil) or of mechanical origin (e.g., dynamics creating additional roller movements). Further investigations have been performed to determine its origin; however, because they are not fully conclusive, they will not be presented in this document. The remainder of this section focuses on the method developed to filter out this disturbance more than on the activities that are run in parallel to understand its source. In terms of the magnitude of the disturbance, it is quite large compared to the approximation even for this case at rated speed and near-rated torque. Therefore, at lower cage speeds, the disturbance might completely mask the signal. It has been observed that at low load, when the cage speed is below 200 rpm, the roller speed approximation is inaccurate and cannot be used without special treatment and a willingness to accept large uncertainties. In those cases, good numerical models are necessary to correctly interpret the measurements. In most cases at moderate loads and speeds, though, the disturbance is not in phase with the cage position and therefore the piece-wise, linear, least-square fit gives a good representation of the roller speed. For the out-of-phase example in Figure 5, the approximation shows clearly the acceleration when the roller is entering the loaded zone, the constant roller speed inside the loaded zone, and the slow deceleration outside the loaded zone. This allows a further evaluation of the size of the loaded zone, the friction with the lubricant, and the slip energy losses at different operating conditions. Several other filtering techniques have been evaluated; however, the acceleration of the rollers when entering the loaded zone is quick enough that any low-pass filtering smooths the graph and significantly influences the observed acceleration of the rollers.
Because of the inconsistent nature of the disturbance and its potential effect on the piece-wise, linear, least-square approximation, the approximated roller speed is further processed and simplified to best fit a four-slope linear model as shown in Figure 6. When the disturbance cannot be effectively filtered, the roller speed curve deviates considerably from the four-slope best fit. Therefore, the distance between the two can be used to quantify the quality of the filtering of the disturbance.

8 This report is available at no cost from the National Renewable Energy Laboratory at www.nrel.gov/publications.
Figure 6. Four-slope, best-fit roller speed approximation with in-phase (left) and out-of-phase
(right) disturbances
3.3 Measured Roller Speed Trends The four-slope best fit approximation, when close to the filtered signal, can be used to determine some important bearing operating characteristics, including:
• The width of the loaded zone, which is related to the operating bearing clearance and load
• The deceleration rate in the unloaded zone, which is related to the friction between the rollers and the circulating oil and therefore to the operating temperature and oil viscosity.
For the selected cases shown in Figure 7, the loaded zone widens when the difference between the outer ring and oil supply temperature increases. This trend, which is related to the change in the bearing clearance, is much more pronounced for bearing B than bearing A This could be related to several factors, such as the heat from the adjacent bearing, the split of the oil flow between the two bearings, or the smaller cross section of bearing B allowing less oil through the bearing.
Note that the inner ring temperature measurements are not available for most of the measurement campaign as a result of the deterioration of the slip ring. The temperature difference between outer ring and oil supply is therefore taken as a first indication of the temperature effect.
Figure 7. Variation in loaded zone width with temperature differential (left) and torque (right)
9 This report is available at no cost from the National Renewable Energy Laboratory at www.nrel.gov/publications.
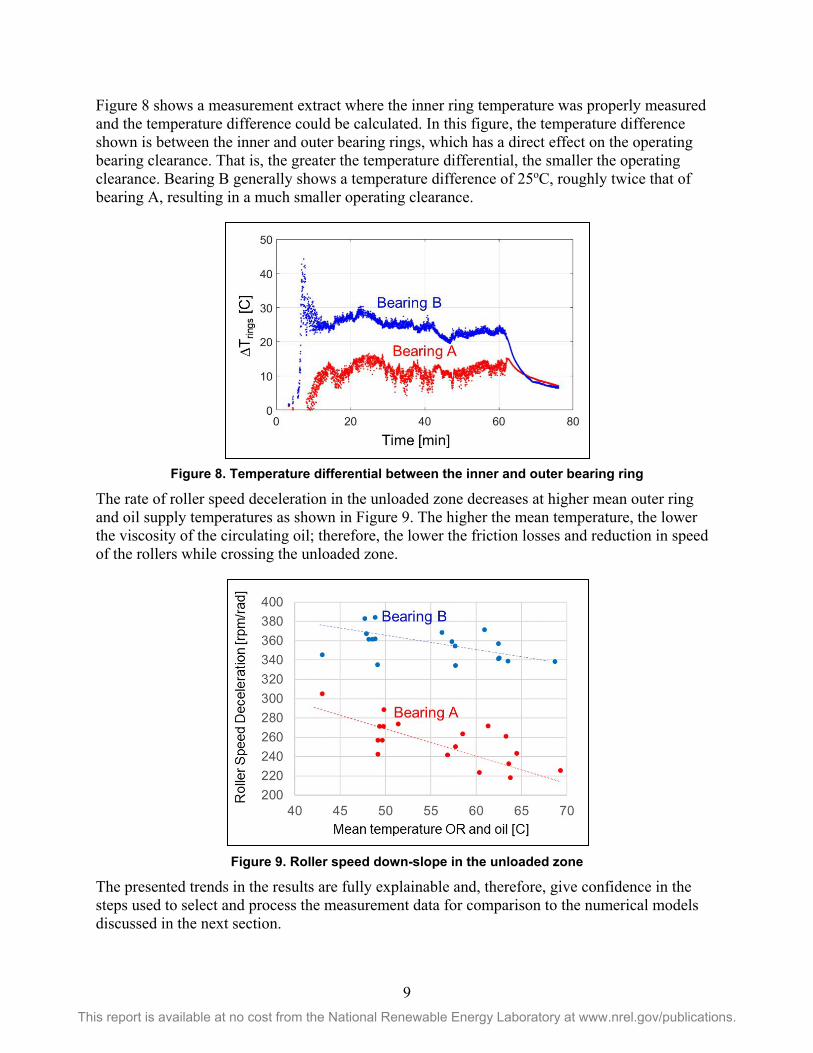
Figure 8 shows a measurement extract where the inner ring temperature was properly measured and the temperature difference could be calculated. In this figure, the temperature difference shown is between the inner and outer bearing rings, which has a direct effect on the operating bearing clearance. That is, the greater the temperature differential, the smaller the operating clearance. Bearing B generally shows a temperature difference of 25oC, roughly twice that of bearing A, resulting in a much smaller operating clearance.
Figure 8. Temperature differential between the inner and outer bearing ring
The rate of roller speed deceleration in the unloaded zone decreases at higher mean outer ring and oil supply temperatures as shown in Figure 9. The higher the mean temperature, the lower the viscosity of the circulating oil; therefore, the lower the friction losses and reduction in speed of the rollers while crossing the unloaded zone.
Figure 9. Roller speed down-slope in the unloaded zone
The presented trends in the results are fully explainable and, therefore, give confidence in the steps used to select and process the measurement data for comparison to the numerical models discussed in the next section.
10 This report is available at no cost from the National Renewable Energy Laboratory at www.nrel.gov/publications.
4 Bearing Models In Section 3.2, the roller speed was shown to be subject to disturbances. Although the disturbance could be effectively filtered out of the measurement in well-defined stationary operating conditions, the measurement of the roller speed still presents high uncertainties in dynamic and transient conditions. In order to increase accuracy and extract additional valuable information from the measured roller speed, a combination of simulation and data analysis is always best.
In this section, two models of the roller sliding behavior are discussed and compared to the measured stationary results. One is an analytic dynamic model based on classical bearing theory and extended by NREL, and the other is the SKF BEAring Simulation Tool (BEAST) multibody model. Once validated, these models can be used to evaluate the roller slip losses or cumulative frictional energy that are considered potential driving factors for WECs in wind turbine gearbox bearings.
4.1 Analytical Model Analytical modeling of roller sliding consists of two steps. The first step is to calculate the bearing and roller loads from a free-body model of the HSS and the measured torque and bending moments. Then, with the calculated roller loads and the measured HSS speed, a separate dynamic model calculates the speed of bearing cage and individual rollers. The analytic model can be used for nonstationary operating conditions, but only stationary conditions are presented here. Each modeling step is described in more detail in the following sections.
4.1.1 High-Speed-Shaft and Bearing Loads Model The total loads on the HSS bearings are calculated using a simple, semianalytic model of force and moment equilibrium for the HSS, using the measured shaft‐bending moments and torque as input [18,19]. The HSS is assumed to be a weightless, rigid beam supported by the generator coupling and three bearings. In this gearbox, the CRBs are assumed to support only radial forces while the four-point contact ball bearing only supports axial load. The brake disk weight and inertia are included in the model. Once the bearing loads are calculated and the operating clearance is specified, the load distribution across each roller can be estimated as it orbits around the raceway [20].
4.1.2 Bearing Roller Load, Speed, and Lubricant Model With the calculated roller loads, measured shaft rotation speed, and lubricant temperature as the inputs, a dynamic model of rolling elements has been developed to calculate bearing cage and roller speeds. This roller sliding model is based on analytic formulations [21,22] with improvements in lubrication and cage modeling. It considers roller dynamics and elasticity, lubricant temperature and hydrodynamics, and interactions between lubricant and rollers.
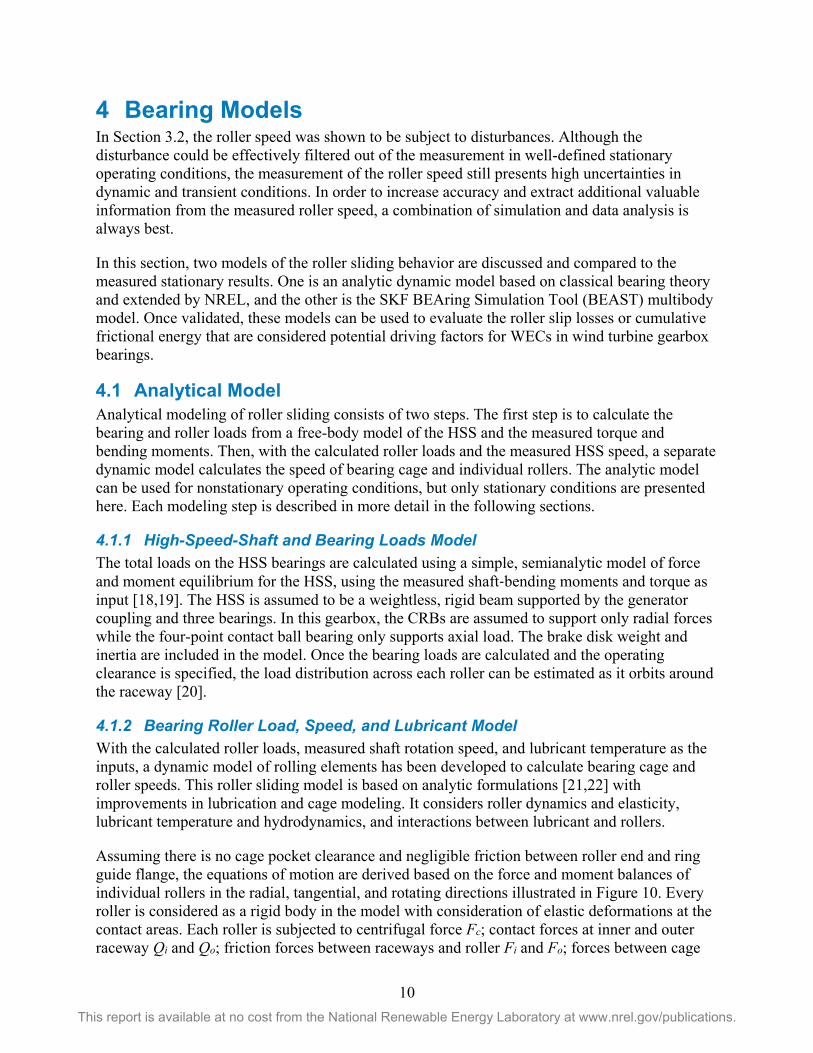
Assuming there is no cage pocket clearance and negligible friction between roller end and ring guide flange, the equations of motion are derived based on the force and moment balances of individual rollers in the radial, tangential, and rotating directions illustrated in Figure 10. Every roller is considered as a rigid body in the model with consideration of elastic deformations at the contact areas. Each roller is subjected to centrifugal force Fc; contact forces at inner and outer raceway Qi and Qo; friction forces between raceways and roller Fi and Fo; forces between cage
11 This report is available at no cost from the National Renewable Energy Laboratory at www.nrel.gov/publications.
and roller Qcg that constrain the roller motion; and forces and moments caused by lubricant, such as drag forces acting on the center of roller opposite to roller orbiting direction Fv and moments within the roller-raceway contact areas Mi and Mo because of surface friction shear stresses induced by lubricant. Formulations derived from test data in the literature were used to extract viscous drag coefficient and friction coefficients that are largely dependent on temperature, speed, and loads [23]. Calculating Fv, Mi, and Mo requires hydrodynamic and elastohydrodynamic analysis of the lubricant [24]. The resulting equations on all the rollers can then be solved simultaneously for the roller speed, ωr, and cage speed, ωc.
Figure 10. Roller forces in a radially-loaded CRB
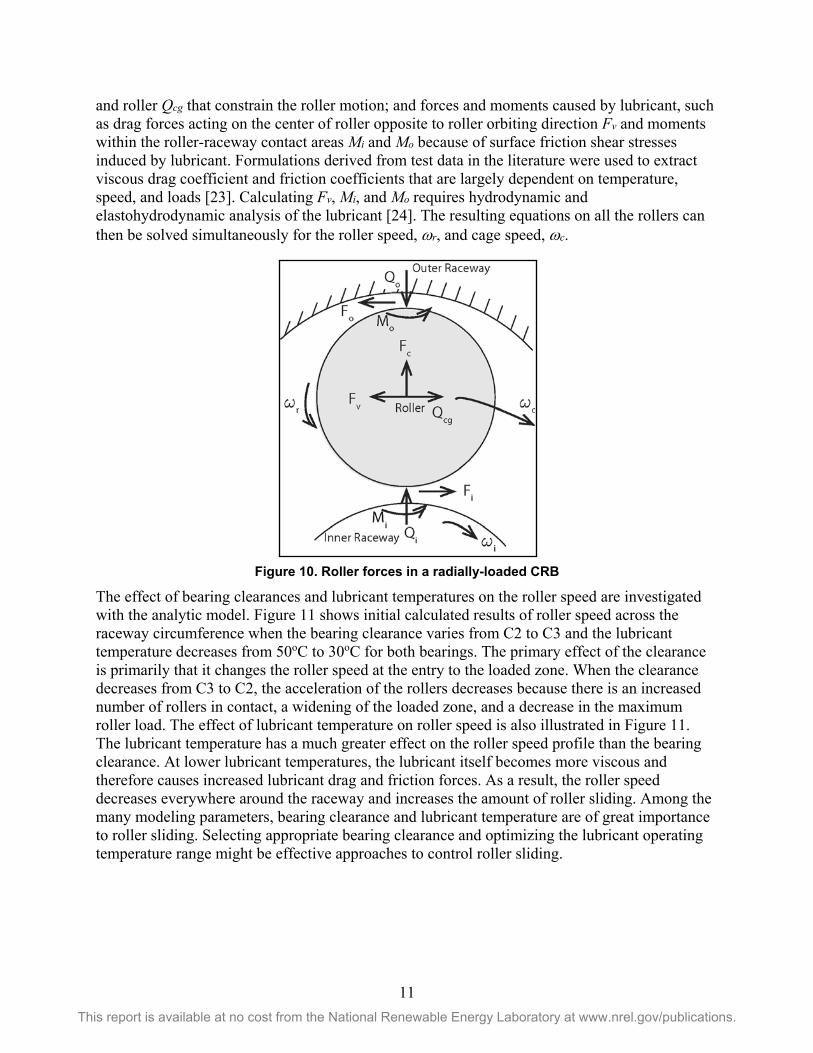
The effect of bearing clearances and lubricant temperatures on the roller speed are investigated with the analytic model. Figure 11 shows initial calculated results of roller speed across the raceway circumference when the bearing clearance varies from C2 to C3 and the lubricant temperature decreases from 50oC to 30oC for both bearings. The primary effect of the clearance is primarily that it changes the roller speed at the entry to the loaded zone. When the clearance decreases from C3 to C2, the acceleration of the rollers decreases because there is an increased number of rollers in contact, a widening of the loaded zone, and a decrease in the maximum roller load. The effect of lubricant temperature on roller speed is also illustrated in Figure 11. The lubricant temperature has a much greater effect on the roller speed profile than the bearing clearance. At lower lubricant temperatures, the lubricant itself becomes more viscous and therefore causes increased lubricant drag and friction forces. As a result, the roller speed decreases everywhere around the raceway and increases the amount of roller sliding. Among the many modeling parameters, bearing clearance and lubricant temperature are of great importance to roller sliding. Selecting appropriate bearing clearance and optimizing the lubricant operating temperature range might be effective approaches to control roller sliding.
12 This report is available at no cost from the National Renewable Energy Laboratory at www.nrel.gov/publications.
Figure 11. Effect of clearance (left) and lubricant temperature (right) on analytic model roller speed
for 7,930 newton meters (Nm) of torque
4.2 SKF BEAST Model This is ongoing work and, therefore, results of the complete procedure are not yet available. The complete numerical-experimental approach can be outlined as follows:
• Extract, from the complete measured signal, roller speed profiles in the largest number of operating conditions as described in Section 3.2.
• Use the measured roller speed to develop a model for the friction losses acting on the rollers in the unloaded zone.
• Extract, from the complete measured signal, the cage speed in low-loaded operating conditions.
• Develop a model for the friction losses acting on the cage from low load conditions with large cage slip.
• Extract the most critical transient conditions and simulate them to compute roller slip values.
Preliminary results in the development of the friction losses acting on the rollers in the unloaded zone are presented below.
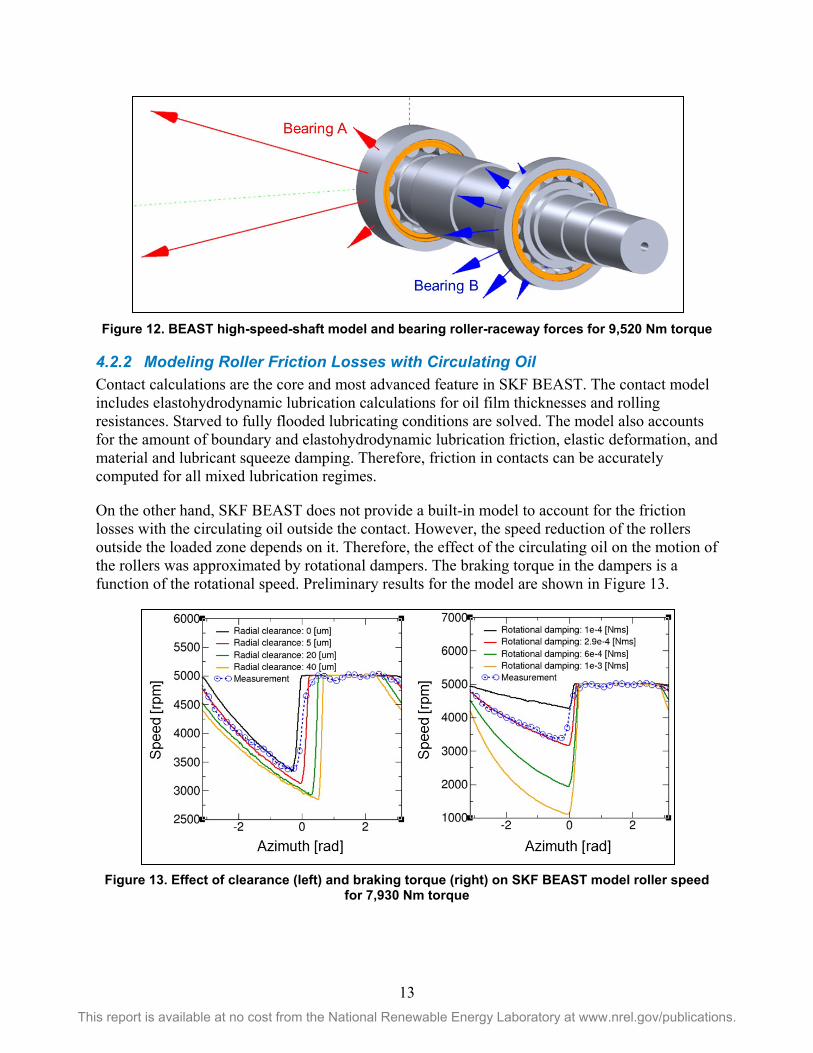
4.2.1 High-Speed-Shaft and Bearing Loads Model BEAST is an SKF proprietary software that can simulate systems of bodies in a fully transient domain. Each bearing component (rolling elements, cage, rings) is modeled as an independent body that interacts via contacts or simpler laws with the other bodies and the environment. The capability of simulating the interactions between bearing components in a transient environment is essential to predict the motion of the rollers and the cage in the unloaded zone or when the bearing is lightly loaded. For computational efficiency, it was decided to include only the two CRBs in the detailed model, while the four-point contact ball bearing was modeled with a nonlinear axial spring as shown in Figure 12. The shaft is considered rigid, with the gear loads and moments applied at the center line.
13 This report is available at no cost from the National Renewable Energy Laboratory at www.nrel.gov/publications.
Figure 12. BEAST high-speed-shaft model and bearing roller-raceway forces for 9,520 Nm torque
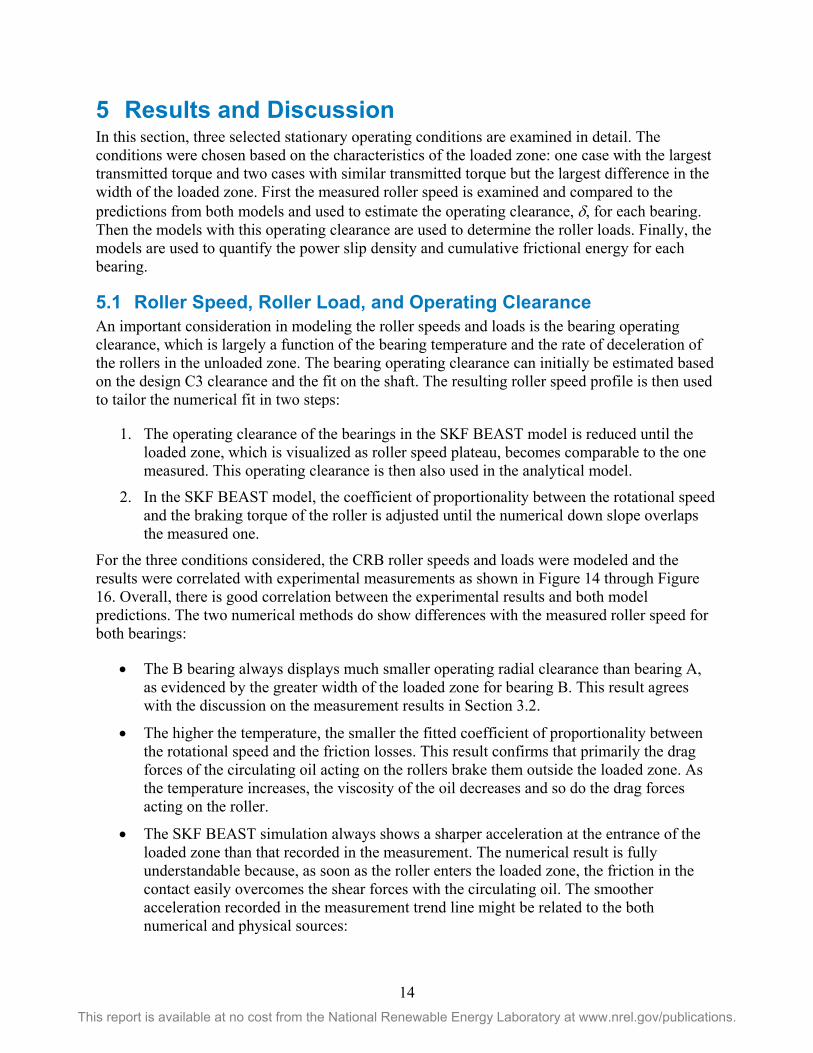
4.2.2 Modeling Roller Friction Losses with Circulating Oil Contact calculations are the core and most advanced feature in SKF BEAST. The contact model includes elastohydrodynamic lubrication calculations for oil film thicknesses and rolling resistances. Starved to fully flooded lubricating conditions are solved. The model also accounts for the amount of boundary and elastohydrodynamic lubrication friction, elastic deformation, and material and lubricant squeeze damping. Therefore, friction in contacts can be accurately computed for all mixed lubrication regimes.
On the other hand, SKF BEAST does not provide a built-in model to account for the friction losses with the circulating oil outside the contact. However, the speed reduction of the rollers outside the loaded zone depends on it. Therefore, the effect of the circulating oil on the motion of the rollers was approximated by rotational dampers. The braking torque in the dampers is a function of the rotational speed. Preliminary results for the model are shown in Figure 13.
Figure 13. Effect of clearance (left) and braking torque (right) on SKF BEAST model roller speed
for 7,930 Nm torque
14 This report is available at no cost from the National Renewable Energy Laboratory at www.nrel.gov/publications.
5 Results and Discussion In this section, three selected stationary operating conditions are examined in detail. The conditions were chosen based on the characteristics of the loaded zone: one case with the largest transmitted torque and two cases with similar transmitted torque but the largest difference in the width of the loaded zone. First the measured roller speed is examined and compared to the predictions from both models and used to estimate the operating clearance, δ, for each bearing. Then the models with this operating clearance are used to determine the roller loads. Finally, the models are used to quantify the power slip density and cumulative frictional energy for each bearing.
5.1 Roller Speed, Roller Load, and Operating Clearance An important consideration in modeling the roller speeds and loads is the bearing operating clearance, which is largely a function of the bearing temperature and the rate of deceleration of the rollers in the unloaded zone. The bearing operating clearance can initially be estimated based on the design C3 clearance and the fit on the shaft. The resulting roller speed profile is then used to tailor the numerical fit in two steps:
1. The operating clearance of the bearings in the SKF BEAST model is reduced until the loaded zone, which is visualized as roller speed plateau, becomes comparable to the one measured. This operating clearance is then also used in the analytical model.
2. In the SKF BEAST model, the coefficient of proportionality between the rotational speed and the braking torque of the roller is adjusted until the numerical down slope overlaps the measured one.
For the three conditions considered, the CRB roller speeds and loads were modeled and the results were correlated with experimental measurements as shown in Figure 14 through Figure 16. Overall, there is good correlation between the experimental results and both model predictions. The two numerical methods do show differences with the measured roller speed for both bearings:
• The B bearing always displays much smaller operating radial clearance than bearing A, as evidenced by the greater width of the loaded zone for bearing B. This result agrees with the discussion on the measurement results in Section 3.2.
• The higher the temperature, the smaller the fitted coefficient of proportionality between the rotational speed and the friction losses. This result confirms that primarily the drag forces of the circulating oil acting on the rollers brake them outside the loaded zone. As the temperature increases, the viscosity of the oil decreases and so do the drag forces acting on the roller.
• The SKF BEAST simulation always shows a sharper acceleration at the entrance of the loaded zone than that recorded in the measurement. The numerical result is fully understandable because, as soon as the roller enters the loaded zone, the friction in the contact easily overcomes the shear forces with the circulating oil. The smoother acceleration recorded in the measurement trend line might be related to the both numerical and physical sources:
15 This report is available at no cost from the National Renewable Energy Laboratory at www.nrel.gov/publications.
o First, the measurement trend line is not an instantaneous picture, but a least-square fit derived from many roller revolutions.
o Second, the sampling frequency might not be sufficient to catch the very steep roller acceleration.
o Finally, the oil circulating in the bearing could start accelerating the roller before it enters the loaded zone as the roller becomes close to the rings. This last phenomenon would not be modeled in SKF BEAST, because only a loaded contact is actively computed.
• The SKF BEAST model always predicts a sharp roller acceleration at the entrance of the loaded zone. The analytical model shows a smoother acceleration profile at the entrance of the loaded zone.
• The roller deceleration outside the loaded zone is comparable for the two models. However, with the analytical model the roller starts to decelerate earlier, while still in the loaded zone. In SKF BEAST, the roller begins decelerating just before leaving the loaded zone.
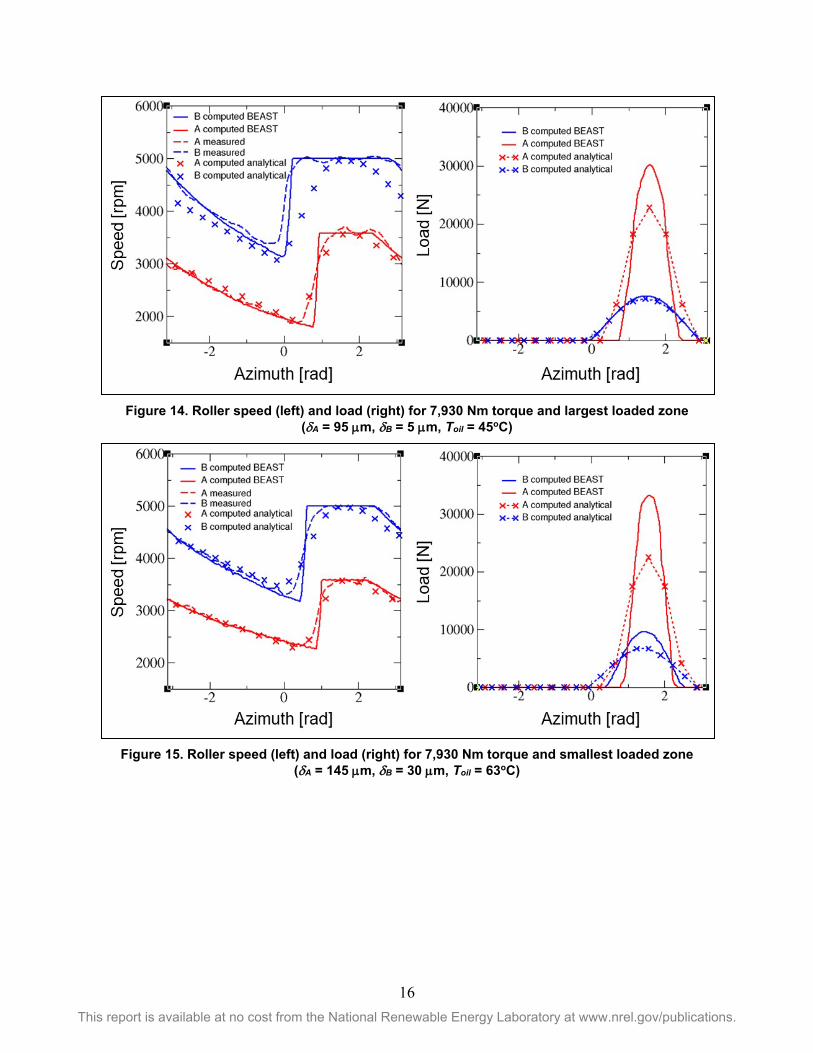
• For bearing B, the analytical results slightly deviate from experimental results for the case at 7930 Nm in Figure 14. Specifically, experimental results suggest rollers reached the maximum speed within the load zone and were able to remain at this value for a longer period before they left the load zone. The lubricant temperature is about 40oC, much colder than the other two cases. The analytical model might have overpredicted lubricant viscosity at lower temperature, resulting in large frictional forces at the roller contact surfaces.
The differences between the two numerical models favor a better fit of the measurement results by either of the two methods depending on the specific case. Nevertheless, additional effort has been made to understand the deviations between the two models. The measurement had to be filtered also in well-loaded stationary operating conditions, as shown in Section 3.2, because of significant disturbances. Therefore, it cannot be fully trusted as a reference, especially at the entrance of the loaded zone where the rate of change is the largest.
• The analytical model has not considered roller crowning details and bearing raceway deformations, which can be included in future versions. That causes wider loaded zones especially for larger clearances with fewer rollers in contact. This is the cause of the earlier acceleration of the roller compared to the SKF BEAST model; see both bearings in Figure 14.
• The analytical model predicts a slower acceleration of the roller than SKF BEAST for the same loaded zone, as can be seen for bearing B in Figure 15. This is very likely related to the different friction models in the two methods. Despite that, elastohydrodynamic lubrication theory is used to determine sliding and rolling contact friction for both models and lubricant drag forces and lubricant film thickness are treated differently, the latter of which is empirically estimated in the analytical model at current form. Further investigations on the differences between these two models will be necessary.
• The analytical model predicts the roller deceleration very well, while SKF BEAST makes use of a semiempirical approach that currently requires fitting with experimental results.
16 This report is available at no cost from the National Renewable Energy Laboratory at www.nrel.gov/publications.
Figure 14. Roller speed (left) and load (right) for 7,930 Nm torque and largest loaded zone
(δA = 95 µm, δB = 5 µm, Toil = 45oC)
Figure 15. Roller speed (left) and load (right) for 7,930 Nm torque and smallest loaded zone
(δA = 145 µm, δB = 30 µm, Toil = 63oC)

17 This report is available at no cost from the National Renewable Energy Laboratory at www.nrel.gov/publications.
Figure 16. Roller speed (left) and load (right) for 9,520 Nm torque
(δA = 145 µm, δB = 20 µm, Toil = 50oC)
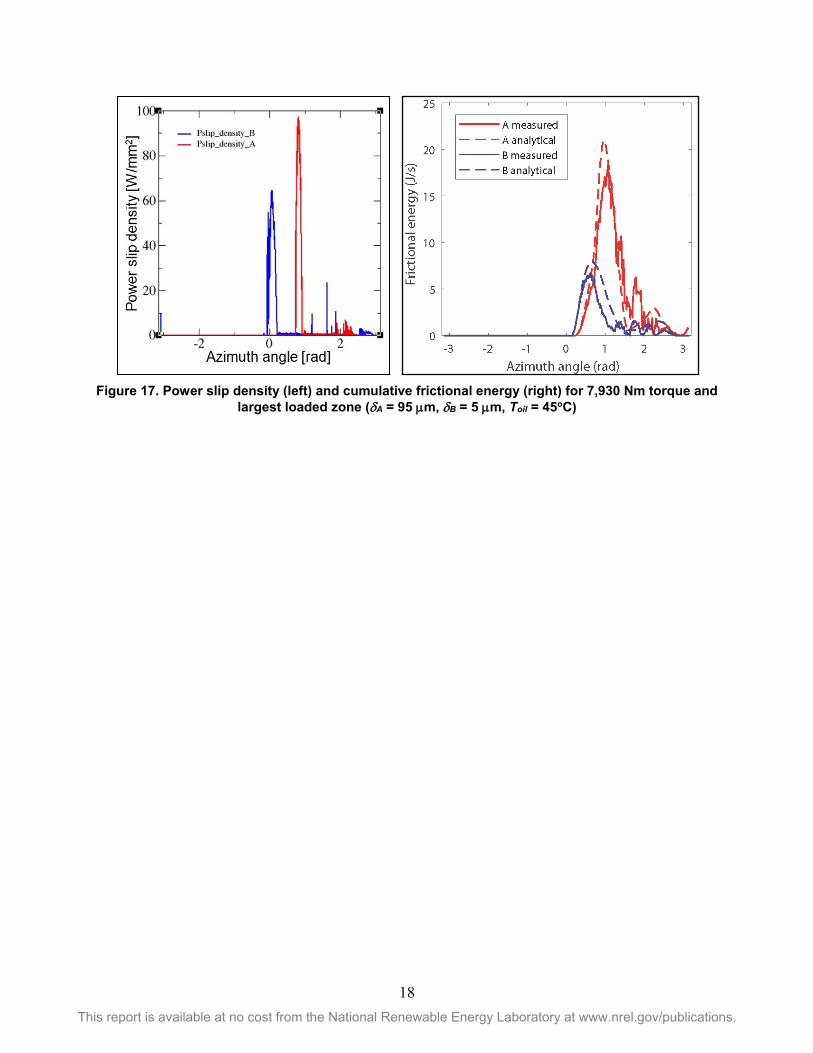
5.2 Power Slip Density and Cumulative Frictional Energy The goal of this research is to get a better understanding of the critical operating conditions in wind turbine drivetrains, related to the risk of premature failures with WEC. As a measure to evaluate the risk for roller slip induced failures, the power slip density in the contact [11] or cumulative frictional energy [9] has been used. These parameters can be extracted from both the BEAST and analytical models.
Once the model of the friction losses acting on the rollers in the unloaded zone characterizes the roller speed profile appropriately, SKF BEAST provides contact parameters. In Figure 17, the maximum power slip density is plotted as a function of the roller position. The larger power slip density peak is always at the entrance of the loaded zone where the acceleration is the largest. The power slip density is generally higher in bearing A because it has larger rollers that offer more inertia against the friction force in the contacts. This is an important result because it shows that, in the investigated range, the inertia of the rollers has more importance than the roller load. Nevertheless, the simulated power slip levels are not critical, as expected for fully loaded bearings at stationary conditions.
The cumulative frictional energy is a function of friction coefficient, normal load, and difference in velocity between two sliding surfaces over a period of time [9,10] and has recently been extended for wind turbine gearbox bearings [25]. Similar to the power slip density, both bearings accumulate the most frictional energy when entering the loaded zone because of the significant roller sliding. A much smaller amount of frictional energy is accumulated when exiting the load zone. The overall amount of energy accumulation in bearing A is more than twice bearing B.
18 This report is available at no cost from the National Renewable Energy Laboratory at www.nrel.gov/publications.
Figure 17. Power slip density (left) and cumulative frictional energy (right) for 7,930 Nm torque and
largest loaded zone (δA = 95 µm, δB = 5 µm, Toil = 45oC)

19 This report is available at no cost from the National Renewable Energy Laboratory at www.nrel.gov/publications.
6 Conclusions A Winergy PEAB 4410.4 wind turbine gearbox was instrumented to measure the speeds, loads, temperatures, and lubricant environment of the CRBs supporting the HSS and then operated in a GE 1.5 SLE wind turbine. In this paper, the measurements over the first wind season were used to validate an analytical dynamic model and the SKF BEAST multibody model predicting the roller speed at different operating conditions. These models are then used to evaluate two measures of roller slip losses that are considered as potential measures of the risk of creation of WECs. It was found that:
• The analytical and SKF BEAST models, using an operating clearance estimated from the bearing design parameters, fit, and temperature, reasonably accurately represent the roller speed profiles at different operating conditions.
• The roller speed profile is heavily influenced by the bearing ring and lubricant temperatures and the resulting effect on the bearing operating clearance in addition to bearing dimensions:
o At low operating temperature and hence higher oil viscosity, the deceleration of the roller speed in the unloaded zone is significantly faster than at higher temperature.
o Bearing B has a higher temperature difference between inner and outer ring than bearing A and, therefore, a lower operating clearance and wider loaded zone.
• The lubricant temperature and the temperature difference between inner and outer rings need to be included in the simulation model to accurately predict the roller behavior under various operating conditions.
• At normal operating conditions, the largest contributions to the power slip density and cumulative frictional energy are seen during the fast acceleration at the load-zone entry.
• On average, at nominal operating conditions, the rollers have slowed down to approximately 60% of the pure rolling speed after traversing the unloaded zone. However, there is very little contribution to the power slip density and cumulative frictional energy in the unloaded zone because of insignificant roller loads.
This collaborative research and development project has continued into 2019 with additional measurements and analysis of transient operations such as startup, shutdown, emergency stop, and grid events that can induce short-term, high loads and also very controlled curtailment conditions at low loads that can induce greater levels of roller sliding. The developed models will be used to evaluate the roller slip losses during these special events.
20 This report is available at no cost from the National Renewable Energy Laboratory at www.nrel.gov/publications.
References 1. Sheng, S. 2016. Wind Turbine Gearbox Reliability Database, Condition Monitoring, and
Operation and Maintenance Research Update (Presentation). NREL/PR-5000-66028. National Renewable Energy Laboratory (NREL), Golden, CO (US). http://www.nrel.gov/docs/fy16osti/66028.pdf.
2. Keller, J., S. Sheng, J. Cotrell, and A. Greco. 2016. Wind Turbine Drivetrain Reliability Collaborative Workshop: A Recap (Technical Report). DOE/GO-102016-4878. National Renewable Energy Laboratory (NREL), Golden, CO (US). http://www.nrel.gov/docs/fy16osti/66593.pdf.
3. Greco, A., S. Sheng, J. Keller, and A. Erdemir. 2013. “Material Wear and Fatigue in Wind Turbine Systems.” Wear. 302: 1583–1591. doi: 10.1016/j.wear.2013.01.060.
4. Evans, M.-H. 2016. “An Updated Review: White Etching Cracks (WECs) and Axial Cracks in Wind Turbine Gearbox Bearings.” Material Science and Technology. 32 (11): 1133–1169. doi: 10.1080/02670836.2015.1133022.
5. Gould, B., A. Greco, K. Stadler, and X. Xiao. 2017. “An Analysis of Premature Cracking Associated with Microstructural Alterations in an AISI 52100 Failed Wind Turbine Bearing Using X-ray Tomography.” Materials and Design. 117: 417–429. doi: 10.1016/j.matdes.2016.12.089.
6. Stadler K., Vegter E., Ersson M., Vaes D. 2016. “White Etching Cracks – A symptom of bearing failures.” FVA Bearing, World Conference, Hanover, Germany.
7. Stadler K., Vegter R.H., Vaes D. 2018. “White etching cracks – a consequence, not a root cause of bearing failure” Evolution, 2018 (1). http://evolution.skf.com/white-etching-cracks-a-consequence-not-a-root-cause-of-bearing-failure/.
8. Keller, J., B. Gould, and A. Greco. 2017. Investigation of Bearing Axial Cracking: Benchtop and Full-Scale Test Results (Technical Report). NREL/TP-5000-67523. National Renewable Energy Laboratory (NREL), Golden, CO (US). http://www.nrel.gov/docs/fy17osti/67523.pdf.
9. Gould, B., and A. Greco. 2015. “The Influence of Sliding and Contact Severity on the Generation of White Etching Cracks.” Tribology Letters. 60 (29). doi: 10.1007/s11249-015-0602-6.
10. Gould, B., and A. Greco. 2016. “Investigating the Process of White Etching Crack Initiation in Bearing Steel.” Tribology Letters, 62 (26). doi: 10.1007/s11249-016-0673-z.
11. Vaes, D., P. Tesini, and K. Stadler. 2017. “Evaluation of roller slip losses in wind turbine gearbox high speed shaft bearings.” VDI Gleit- und Wälzlagerungen, Schweinfurt, Germany.

21 This report is available at no cost from the National Renewable Energy Laboratory at www.nrel.gov/publications.
12. Stadler, K., B. Han, V. Brizmer, and R. Pasaribu, 2015. “Benefits of using black-oxidized bearings in wind applications.” Evolution, April 1. http://evolution.skf.com/us/benefits-ofing-black-oxidized-bearings-in-wind-applications/.
13. Keller, J., and S. Lambert. 2018. Gearbox Instrumentation for the Investigation of Bearing Axial Cracking (Technical Report). NREL/TP-5000-70639. National Renewable Energy Laboratory (NREL), Golden, CO (US). http://www.nrel.gov/docs/fy18osti/70639.pdf.
14. Keller, J. 2018. Investigating Main and High-Speed Shaft Bearing Reliability Through Uptower Testing (Presentation). NREL/PR-5000-70958. National Renewable Energy Laboratory (NREL), Golden, CO (US). http://www.nrel.gov/docs/fy18osti/70958.pdf.
15. Keller, J., Y. Guo, and L. Sethuraman. 2019. Uptower Test Report for the Investigation of Main and High-Speed Shaft Bearing Reliability (Technical Report). NREL/TP-5000-71529. National Renewable Energy Laboratory (NREL), Golden, CO (US). http://www.nrel.gov/docs/fy19osti/71529.pdf.
16. Volkmuth, M., K. Stadler, and R. Heemskerk. 2009. “Slippage Measurements in Roller Bearings.” Antriebstechnisches Kolloquium, Aachen, Germany.
17. Santos, R., and J. van Dam. 2015. Mechanical Loads Test Report for the U.S. Department of Energy 1.5-Megawatt Wind Turbine (Technical Report). NREL/TP-5000-63679. National Renewable Energy Laboratory (NREL), Golden, CO (US). http://www.nrel.gov/docs/fy15osti/63679.pdf.
18. Keller, J., and Y. Guo. 2016. Gearbox Reliability Collaborative Investigation of High-Speed-Shaft Bearing Loads (Technical Report). NREL/TP-5000-66175. National Renewable Energy Laboratory (NREL), Golden, CO (US). http://www.nrel.gov/docs/fy16osti/66175.pdf
19. Guo, Y., and J. Keller. 2017. “Investigation of High-Speed Shaft Bearing Loads in Wind Turbine Gearboxes Through Dynamometer Testing.” Wind Energy, 21 (2). doi: 10.1002/we.2150.
20. Harris, T., and M.N. Kotzalas. 2007. Rolling Bearing Analysis: Essential Concepts of Bearing Technology, 5th ed. Taylor & Francis.
21. Harris, T.A. 1966. “An analytical method to predict skidding in high speed roller bearings.” ASLE Transactions. 9 (3). doi: 10.1080/05698196608972139.
22. Harris, T.A., and M.H. Mindel. 1973. “Rolling element bearing dynamics.” Wear. 23 (3). doi: 10.1016/0043-1648(73)90020-3.
23. Bercea, I. et al. 1998. “Simulating roller – cage pocket friction in a tapered roller bearing.” European Journal of Mechanical and Environmental Engineering. 43 (4).
24. Dowson, D., and G.R. Higginson. 1960. “The effect of material properties on the lubrication of elastic rollers.” Journal of Mechanical Engineering Science. 2 (3). doi: 10.1243/JMES_JOUR_1960_002_028_02.

22 This report is available at no cost from the National Renewable Energy Laboratory at www.nrel.gov/publications.
25. Guo, Y., and J. Keller. 2019. Analysis of High-Speed-Shaft Bearing Roller Sliding and Frictional Energy in a Wind Turbine Gearbox (Technical Report). NREL/TP-5000-72415. National Renewable Energy Laboratory (NREL), Golden, CO (US). http://www.nrel.gov/docs/fy19osti/72415.pdf.
![Subsurface Stresses in Rolling & Sliding Machine Components [Sadeghi, Sui; Int.comp.Eng.conf., 1988]](https://static.fdocuments.in/doc/165x107/577cd14b1a28ab9e7894160a/subsurface-stresses-in-rolling-sliding-machine-components-sadeghi-sui.jpg)