Gearbox Reliability Collaborative Investigation of Gearbox ... · Gearbox Reliability Collaborative...
51
Gearbox Reliability Collaborative Investigation of Gearbox Motion and High-Speed-Shaft Loads Jon Keller, Yi Guo, and Latha Sethuraman National Renewable Energy Laboratory NREL is a national laboratory of the U.S. Department of Energy Office of Energy Efficiency & Renewable Energy Operated by the Alliance for Sustainable Energy, LLC This report is available at no cost from the National Renewable Energy Laboratory (NREL) at www.nrel.gov/publications. Technical Report NREL/TP-5000-65321 March 2016 Contract No. DE-AC36-08GO28308
Transcript of Gearbox Reliability Collaborative Investigation of Gearbox ... · Gearbox Reliability Collaborative...

Gearbox Reliability Collaborative Investigation of Gearbox Motion and High-Speed-Shaft Loads Jon Keller, Yi Guo, and Latha Sethuraman National Renewable Energy Laboratory
NREL is a national laboratory of the U.S. Department of Energy Office of Energy Efficiency & Renewable Energy Operated by the Alliance for Sustainable Energy, LLC
This report is available at no cost from the National Renewable Energy Laboratory (NREL) at www.nrel.gov/publications.
Technical Report NREL/TP-5000-65321 March 2016
Contract No. DE-AC36-08GO28308
National Renewable Energy Laboratory 15013 Denver West Parkway Golden, CO 80401 303-275-3000 • www.nrel.gov
Gearbox Reliability Collaborative Investigation of Gearbox Motion and High-Speed-Shaft Loads Jon Keller, Yi Guo, and Latha Sethuraman National Renewable Energy Laboratory
Prepared under Task No. WE15.3D10
NREL is a national laboratory of the U.S. Department of Energy Office of Energy Efficiency & Renewable Energy Operated by the Alliance for Sustainable Energy, LLC
This report is available at no cost from the National Renewable Energy Laboratory (NREL) at www.nrel.gov/publications.
Technical Report NREL/TP-5000-65321 March 2016
Contract No. DE-AC36-08GO28308

NOTICE
This report was prepared as an account of work sponsored by an agency of the United States government. Neither the United States government nor any agency thereof, nor any of their employees, makes any warranty, express or implied, or assumes any legal liability or responsibility for the accuracy, completeness, or usefulness of any information, apparatus, product, or process disclosed, or represents that its use would not infringe privately owned rights. Reference herein to any specific commercial product, process, or service by trade name, trademark, manufacturer, or otherwise does not necessarily constitute or imply its endorsement, recommendation, or favoring by the United States government or any agency thereof. The views and opinions of authors expressed herein do not necessarily state or reflect those of the United States government or any agency thereof.
This report is available at no cost from the National Renewable Energy Laboratory (NREL) at www.nrel.gov/publications.
Available electronically at SciTech Connect http:/www.osti.gov/scitech
Available for a processing fee to U.S. Department of Energy and its contractors, in paper, from:
U.S. Department of Energy Office of Scientific and Technical Information P.O. Box 62 Oak Ridge, TN 37831-0062 OSTI http://www.osti.gov Phone: 865.576.8401 Fax: 865.576.5728 Email: [email protected]
Available for sale to the public, in paper, from:
U.S. Department of Commerce National Technical Information Service 5301 Shawnee Road Alexandria, VA 22312 NTIS http://www.ntis.gov Phone: 800.553.6847 or 703.605.6000 Fax: 703.605.6900 Email: [email protected]
Cover Photos by Dennis Schroeder: (left to right) NREL 26173, NREL 18302, NREL 19758, NREL 29642, NREL 19795.
NREL prints on paper that contains recycled content.

iii
This report is available at no cost from the National Renewable Energy Laboratory (NREL) at www.nrel.gov/publications.
Acknowledgments This work was supported by the U.S. Department of Energy under Contract No. DE-AC36-08GO28308 with the National Renewable Energy Laboratory. Funding for the work was provided by the DOE Office of Energy Efficiency and Renewable Energy, Wind and Water Power Technologies Office.

iv
This report is available at no cost from the National Renewable Energy Laboratory (NREL) at www.nrel.gov/publications.
List of Acronyms CRB cylindrical roller bearing
GB gearbox
GRC Gearbox Reliability Collaborative
HSS high-speed shaft
kN kilonewton
kNm kilonewton-meter
m meter
mm millimeter
NREL National Renewable Energy Laboratory
NWTC National Wind Technology Center
TRB tapered roller bearing
v
This report is available at no cost from the National Renewable Energy Laboratory (NREL) at www.nrel.gov/publications.
Nomenclature
, ,,y z y zA B Stiffness coefficients for gearbox bushing
cd Distance from high-speed shaft end to location C
id Inner diameter of gearbox bushing
od Outer diameter of gearbox bushing
sd Distance from trunnion to downwind end of high-speed shaft
td Distance from main bearing to trunnion
, ,b
x y zF Forces induced by gearbox bushing
,c
y zF Forces induced by generator coupling
gzF Forces induced by generator misalignment
,by zk ′ ′ Linear stiffnesses of gearbox bushing in bushing coordinate system
, ,bx y zk Linear stiffnesses of gearbox bushing in gearbox coordinate system
, ,x y z
bkθ θ θ Rotational stiffnesses of gearbox bushing
,cy zk Linear stiffnesses of generator coupling
,y z
ckθ θ Rotational stiffnesses of generator coupling
bL Length of gearbox bushing
cL Length of generator coupling
sL Length of high-speed shaft
, ,bx y zM Moments induced by gearbox bushing
,cy zM Moments induced by generator coupling

vi
This report is available at no cost from the National Renewable Energy Laboratory (NREL) at www.nrel.gov/publications.
CyM Moments induced by brake disk and generator coupling weight
gyM Moments induced by generator misalignment
sr Distance from gearbox center to high-speed shaft center
tr Distance from gearbox center to trunnion center
dW Weight of brake disc
cW Weight of generator coupling
sW Weight of high-speed shaft
, ,x y z Displacements of gearbox
, ,, ,ts tp tp ts tpx y z Displacements of starboard and port gearbox bushings
,s sy z Displacements of high-speed shaft
gz Static vertical offset of generator
gφ Static misalignment angle of generator
oφ Operational misalignment angle of generator
, ,x y zθ θ θ Roll, pitch, and yaw angles of gearbox
vii
This report is available at no cost from the National Renewable Energy Laboratory (NREL) at www.nrel.gov/publications.
Table of Contents 1 Introduction ........................................................................................................................................... 1 2 Test Description.................................................................................................................................... 3
2.1 Test Article .................................................................................................................................... 3 2.1.1 Gearbox ............................................................................................................................ 3 2.1.2 Bushings ........................................................................................................................... 3 2.1.3 Gearbox Motion Instrumentation ..................................................................................... 5 2.1.4 High-Speed Shaft and Bearings ....................................................................................... 7 2.1.5 High-Speed-Shaft Instrumentation ................................................................................... 7 2.1.6 Brake Disk and Generator Coupling ................................................................................ 8
2.2 Dynamometer Testing ................................................................................................................... 9 2.2.1 Drivetrain Power Tests ..................................................................................................... 9 2.2.2 Rotor Moment Tests ......................................................................................................... 9 2.2.3 Generator Misalignment Tests ......................................................................................... 9
3 Model Description............................................................................................................................... 11 3.1 Gearbox ....................................................................................................................................... 11 3.2 Bushings ...................................................................................................................................... 11 3.3 High-Speed Shaft and Bearings .................................................................................................. 13 3.4 Brake Disk and Generator Coupling ........................................................................................... 13 3.5 Solution Determination ............................................................................................................... 14
4 Results ................................................................................................................................................. 15 4.1 Gearbox Motion .......................................................................................................................... 15
4.1.1 Vertical Displacement, Roll, and Pitch of the Gearbox ................................................. 15 4.1.2 Lateral Displacement and Yaw of the Gearbox ............................................................. 18 4.1.3 Operational Misalignment .............................................................................................. 19
4.2 High-Speed Pinion Loads ............................................................................................................ 21 4.2.1 High-Speed Shaft Torque ............................................................................................... 21 4.2.2 High-Speed Pinion Tooth Load Distribution ................................................................. 22
4.3 High-Speed-Shaft Bending Moments ......................................................................................... 24 4.3.1 Bearing Sensitivity Study ............................................................................................... 25 4.3.2 High-Speed-Shaft Bending Moments ............................................................................ 28
4.4 Effects of Induced Misalignment ................................................................................................ 31 4.4.1 High-Speed Shaft Motion and Effective Misalignment ................................................. 32 4.4.2 High-Speed Pinion Loads ............................................................................................... 33 4.4.3 High-Speed-Shaft Bending Moments ............................................................................ 34
5 Conclusions ........................................................................................................................................ 38 References ................................................................................................................................................. 39
viii
This report is available at no cost from the National Renewable Energy Laboratory (NREL) at www.nrel.gov/publications.
List of Figures Figure 1. Gearbox and rubber bushings ........................................................................................................ 3 Figure 2. Rubber bushing. Illustration by Aegis Rubber Engineering .......................................................... 4 Figure 3. Rubber bushing force-displacement curve. Illustration by Romax Technology [15] .................... 5 Figure 4. Port trunnion arm vertical displacement sensor. Photo by Robb Wallen, NREL 19259 ................ 6 Figure 5. Gearbox roll (left) and tilt (right) motion ...................................................................................... 6 Figure 6. Instrumented high-speed shaft. Photo by Jonathan Keller, NREL 27895 ..................................... 7 Figure 7. Brake disk and coupling. Photo by Joe Verrengia, NREL 16867 .................................................. 8 Figure 8. Induced generator misalignment ................................................................................................. 10 Figure 9. Generator shims for 3° misalignment. Photo by Jonathan Keller, NREL 32491 ........................ 10 Figure 10. Bushing linear (left) and rotational (right) stiffnesses ............................................................... 12 Figure 11. SIMBEAM model of the HSS ................................................................................................... 13 Figure 12. Gearbox displacements under combined torque and pitch moment .......................................... 15 Figure 13. Variation in vertical displacement (upper left), roll angle (upper right), and pitch angle
(bottom) with torque .............................................................................................................. 16 Figure 14. Variation in vertical displacement (upper left), roll angle (upper right), and pitch angle
(bottom) with pitch moment................................................................................................... 17 Figure 15. Gearbox displacements under combined torque and yaw moment ........................................... 18 Figure 16. Variation in lateral displacement (left) and yaw angle (right) with yaw moment ..................... 19 Figure 17. Variation in HSS lateral (left) and vertical (right) displacement with pitch moment ................ 20 Figure 18. Variation in HSS lateral (left) and vertical (right) displacement with yaw moment ................. 21 Figure 19. Variation in HSS torque with power ......................................................................................... 21 Figure 20. HSS pinion tooth strain measurements at 50% (top) and 100% (bottom) power ...................... 22 Figure 21. HSS tooth load distribution at 50% (left) and 100% (right) power ........................................... 23 Figure 22. HSS tooth load distribution with negative (left) and positive (right) pitch moment ................. 24 Figure 23. HSS bending moment sensitivity to CRB (left), upwind TRB (middle), and downwind TRB
(right) radial stiffness ............................................................................................................. 25 Figure 24. HSS bending moment sensitivity to CRB (left), upwind TRB (middle) and downwind TRB
(right) tilt stiffness .................................................................................................................. 26 Figure 25. Finite element model of the high speed shaft bearings .............................................................. 26 Figure 26. TRB load zones ......................................................................................................................... 27 Figure 27. HSS bending moment sensitivity to CRB (left), upwind TRB (middle), and downwind TRB
(right) location ........................................................................................................................ 27 Figure 28. Summary of HSS bending moment sensitivity study ................................................................ 28 Figure 29. Variation of HSS bending moments with power at location B (upper left), A (upper right), and
C (lower left) .......................................................................................................................... 29 Figure 30. Variation in HSS bending moment at location B (left) and A (right) with pitch and yaw
moments ................................................................................................................................. 30 Figure 31. Variation in HSS bending moment at location C with pitch (left) and yaw (right) moments ... 30 Figure 32. Variation of HSS displacement with power .............................................................................. 31 Figure 33. Effective misalignment angle .................................................................................................... 32 Figure 34. Variation in HSS torque with power ......................................................................................... 33 Figure 35. Variation in HSS tooth load distribution with generator misalignment .................................... 33 Figure 36. Variation in HSS bending moment at location B (left) and A (right) with misalignment ......... 34 Figure 37. Variation in HSS bending moment at location C with misalignment ........................................ 35 Figure 38. Variation in unfiltered location C bending moments at 25% (left) and 100% power (right) with
misalignment .......................................................................................................................... 36 Figure 39. Variation in filtered location C bending moments at 25% power (left) and 100% power (right)
with misalignment .................................................................................................................. 36 Figure 40. Variation in filtered HSS bending moment at location C with misalignment angle ................. 37

ix
This report is available at no cost from the National Renewable Energy Laboratory (NREL) at www.nrel.gov/publications.
List of Tables Table 1. Rubber Bushing Dimensions .......................................................................................................... 4 Table 2. Rubber Bushing Linear Stiffness Properties ................................................................................... 4 Table 3. Gearbox Dimensi ons ...................................................................................................................... 7 Table 4. High-Speed-Shaft Properties .......................................................................................................... 7 Table 5. Coupling Properties ........................................................................................................................ 8 Table 6. Measured Gearbox Efficiency ...................................................................................................... 11 Table 7. Baseline Stiffnesses of HSS Bearings ........................................................................................... 25
1
This report is available at no cost from the National Renewable Energy Laboratory (NREL) at www.nrel.gov/publications.
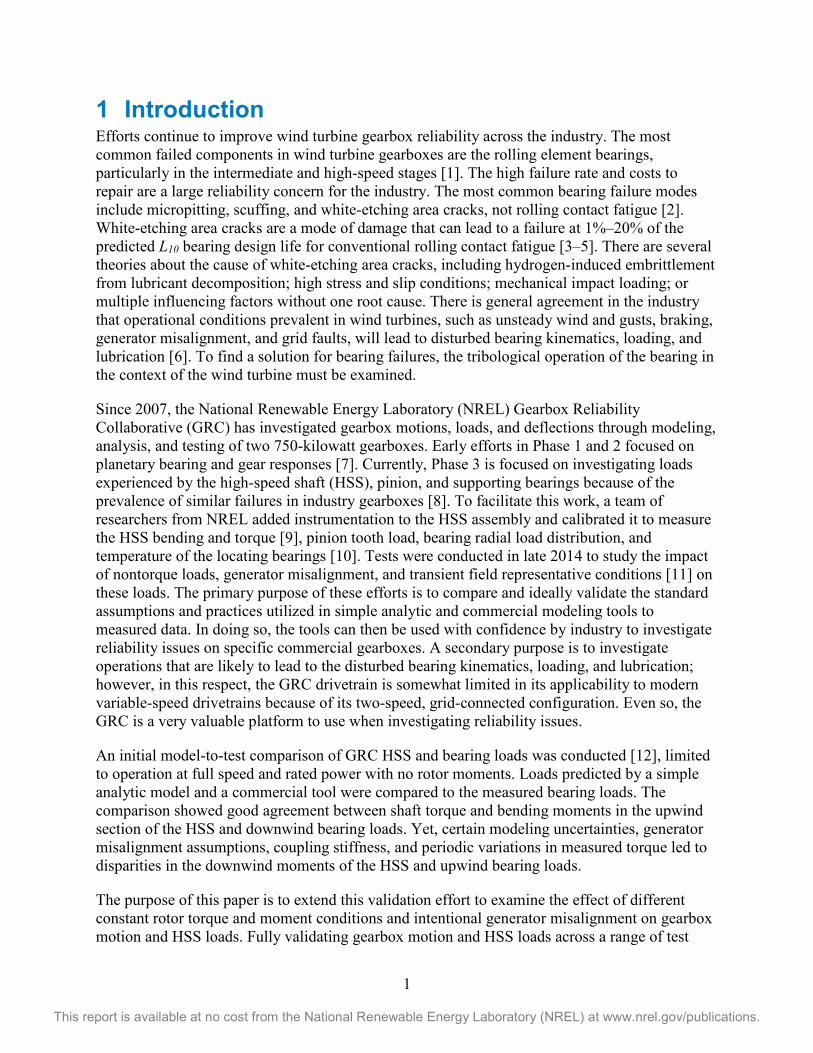
1 Introduction Efforts continue to improve wind turbine gearbox reliability across the industry. The most common failed components in wind turbine gearboxes are the rolling element bearings, particularly in the intermediate and high-speed stages [1]. The high failure rate and costs to repair are a large reliability concern for the industry. The most common bearing failure modes include micropitting, scuffing, and white-etching area cracks, not rolling contact fatigue [2]. White-etching area cracks are a mode of damage that can lead to a failure at 1%–20% of the predicted L10 bearing design life for conventional rolling contact fatigue [3‒5]. There are several theories about the cause of white-etching area cracks, including hydrogen-induced embrittlement from lubricant decomposition; high stress and slip conditions; mechanical impact loading; or multiple influencing factors without one root cause. There is general agreement in the industry that operational conditions prevalent in wind turbines, such as unsteady wind and gusts, braking, generator misalignment, and grid faults, will lead to disturbed bearing kinematics, loading, and lubrication [6]. To find a solution for bearing failures, the tribological operation of the bearing in the context of the wind turbine must be examined.
Since 2007, the National Renewable Energy Laboratory (NREL) Gearbox Reliability Collaborative (GRC) has investigated gearbox motions, loads, and deflections through modeling, analysis, and testing of two 750-kilowatt gearboxes. Early efforts in Phase 1 and 2 focused on planetary bearing and gear responses [7]. Currently, Phase 3 is focused on investigating loads experienced by the high-speed shaft (HSS), pinion, and supporting bearings because of the prevalence of similar failures in industry gearboxes [8]. To facilitate this work, a team of researchers from NREL added instrumentation to the HSS assembly and calibrated it to measure the HSS bending and torque [9], pinion tooth load, bearing radial load distribution, and temperature of the locating bearings [10]. Tests were conducted in late 2014 to study the impact of nontorque loads, generator misalignment, and transient field representative conditions [11] on these loads. The primary purpose of these efforts is to compare and ideally validate the standard assumptions and practices utilized in simple analytic and commercial modeling tools to measured data. In doing so, the tools can then be used with confidence by industry to investigate reliability issues on specific commercial gearboxes. A secondary purpose is to investigate operations that are likely to lead to the disturbed bearing kinematics, loading, and lubrication; however, in this respect, the GRC drivetrain is somewhat limited in its applicability to modern variable-speed drivetrains because of its two-speed, grid-connected configuration. Even so, the GRC is a very valuable platform to use when investigating reliability issues.
An initial model-to-test comparison of GRC HSS and bearing loads was conducted [12], limited to operation at full speed and rated power with no rotor moments. Loads predicted by a simple analytic model and a commercial tool were compared to the measured bearing loads. The comparison showed good agreement between shaft torque and bending moments in the upwind section of the HSS and downwind bearing loads. Yet, certain modeling uncertainties, generator misalignment assumptions, coupling stiffness, and periodic variations in measured torque led to disparities in the downwind moments of the HSS and upwind bearing loads.
The purpose of this paper is to extend this validation effort to examine the effect of different constant rotor torque and moment conditions and intentional generator misalignment on gearbox motion and HSS loads. Fully validating gearbox motion and HSS loads across a range of test

2
This report is available at no cost from the National Renewable Energy Laboratory (NREL) at www.nrel.gov/publications.
conditions is a critical precursor to examining the bearing loads, as the gearbox motion and HSS loads are the drivers of these loads.

3
This report is available at no cost from the National Renewable Energy Laboratory (NREL) at www.nrel.gov/publications.
2 Test Description In this section, the relevant properties of the gearbox, HSS, and instrumentation are presented, followed by a discussion of the dynamometer testing conducted over two separate periods from December 2013 to April 2014 and from November 2014 to January 2015 [11].
2.1 Test Article 2.1.1 Gearbox The GRC gearbox and instrumentation have been discussed in great detail [7, 8, 11]; however, the gearbox motion has not been studied extensively to date. The gearbox properties and instrumentation relevant to measuring this motion are discussed in this section. Also germane to the discussion is the GRC coordinate system convention, in which the positive x direction (axial) is downwind and aligned with the main shaft, the positive y direction (lateral, often called starboard) is to the right, and the positive z direction (vertical) is perpendicular to the main shaft (and mostly upward). Rotations about these axes follow the right-hand convention. This terminology will be used throughout the discussion.
2.1.2 Bushings The GRC drivetrain follows a common configuration of megawatt-scale turbines used in the industry today. The gearbox is mounted with a three-point configuration in which torque and rotor moments are transferred to the main frame through two torque arms, whereas the rotor forces are reacted mostly at the main bearing. The main shaft and gearbox weight are largely supported by the main bearing and the torque arms. Each torque arm contains an Aegis BA 2302 bushing, which consists of rubber sandwiched between two concentric steel sleeves, as shown in Figure 1.
Figure 1. Gearbox and rubber bushings
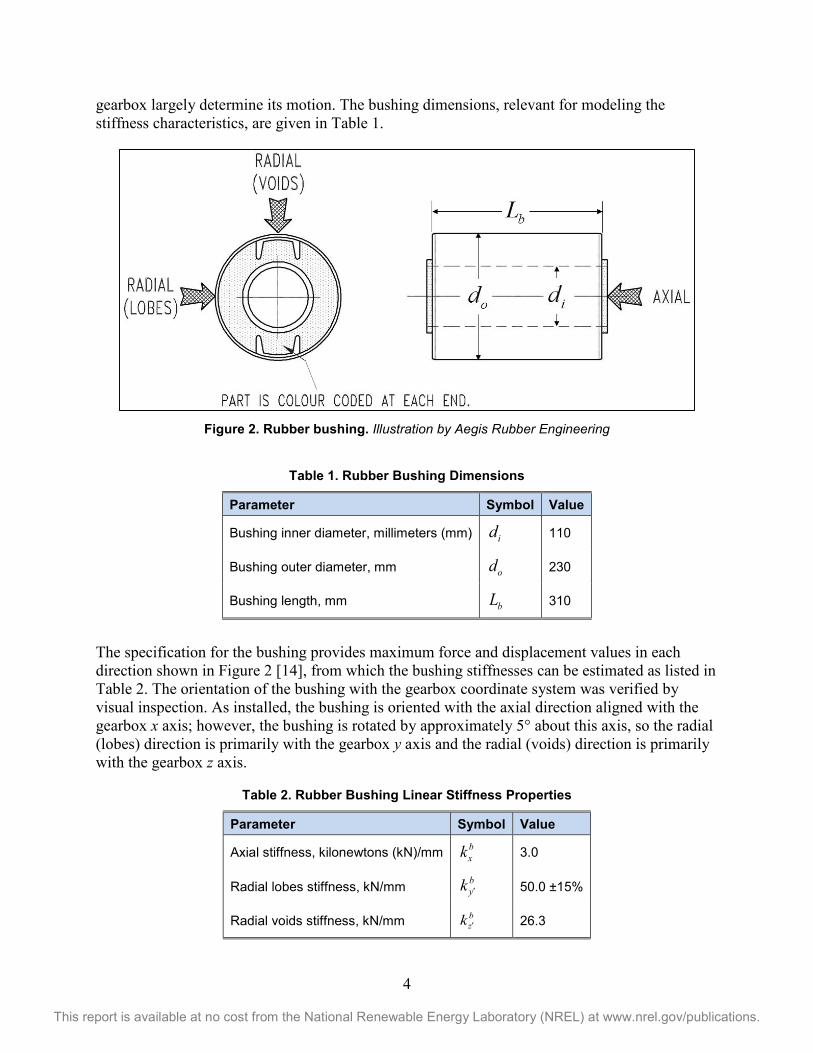
The rubber is bonded to the inner sleeve and interference fitted into the outer sleeve. The inner sleeve is mounted on pins that are mounted to the mainframe. The bushings primarily support the torque loads but also accommodate misalignment, provide noise and vibration isolation, and protect from shock loads. The rubber is prestressed to give a secure and high-duty bushing [13]. The bushing is not completely axisymmetric—it has voids on either side, as shown in Figure 2. The stiffness characteristics of these rubber bushings in conjunction with the applied loads to the
4
This report is available at no cost from the National Renewable Energy Laboratory (NREL) at www.nrel.gov/publications.
gearbox largely determine its motion. The bushing dimensions, relevant for modeling the stiffness characteristics, are given in Table 1.
Figure 2. Rubber bushing. Illustration by Aegis Rubber Engineering
Table 1. Rubber Bushing Dimensions
Parameter Symbol Value
Bushing inner diameter, millimeters (mm) id 110
Bushing outer diameter, mm od 230
Bushing length, mm bL 310
The specification for the bushing provides maximum force and displacement values in each direction shown in Figure 2 [14], from which the bushing stiffnesses can be estimated as listed in Table 2. The orientation of the bushing with the gearbox coordinate system was verified by visual inspection. As installed, the bushing is oriented with the axial direction aligned with the gearbox x axis; however, the bushing is rotated by approximately 5° about this axis, so the radial (lobes) direction is primarily with the gearbox y axis and the radial (voids) direction is primarily with the gearbox z axis.
Table 2. Rubber Bushing Linear Stiffness Properties
Parameter Symbol Value
Axial stiffness, kilonewtons (kN)/mm bxk 3.0
Radial lobes stiffness, kN/mm byk ′ 50.0 ±15%
Radial voids stiffness, kN/mm bzk ′ 26.3
5
This report is available at no cost from the National Renewable Energy Laboratory (NREL) at www.nrel.gov/publications.
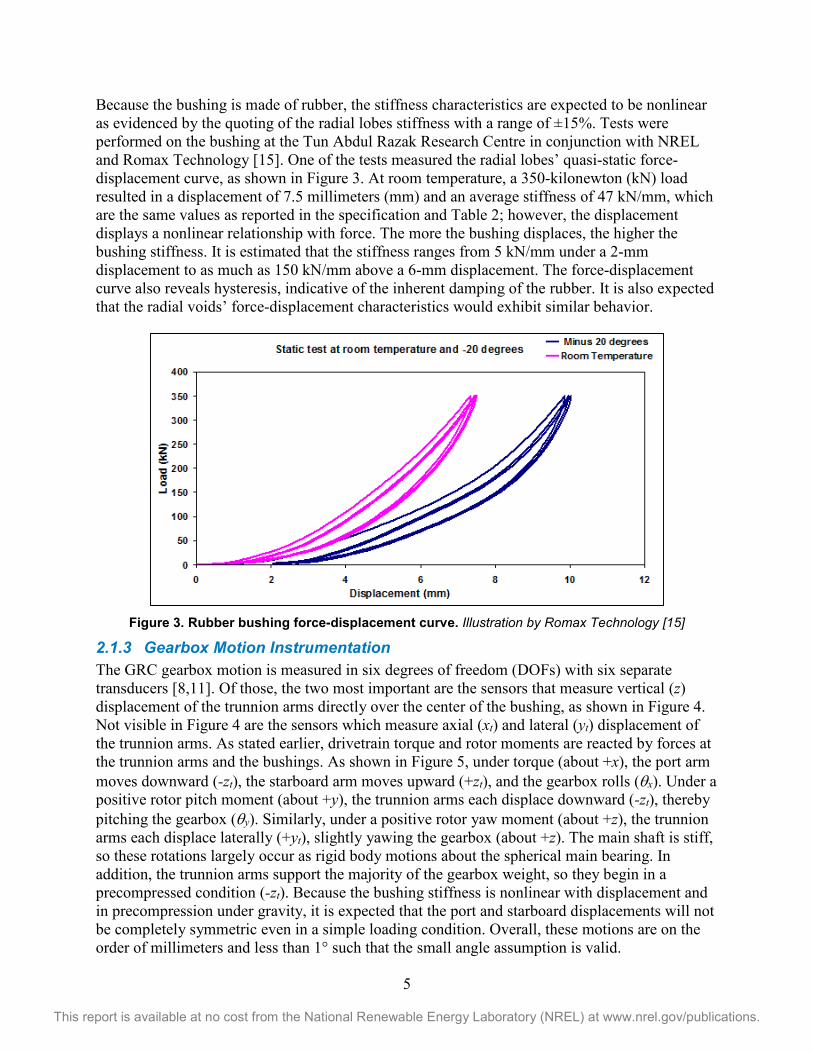
Because the bushing is made of rubber, the stiffness characteristics are expected to be nonlinear as evidenced by the quoting of the radial lobes stiffness with a range of ±15%. Tests were performed on the bushing at the Tun Abdul Razak Research Centre in conjunction with NREL and Romax Technology [15]. One of the tests measured the radial lobes’ quasi-static force-displacement curve, as shown in Figure 3. At room temperature, a 350-kilonewton (kN) load resulted in a displacement of 7.5 millimeters (mm) and an average stiffness of 47 kN/mm, which are the same values as reported in the specification and Table 2; however, the displacement displays a nonlinear relationship with force. The more the bushing displaces, the higher the bushing stiffness. It is estimated that the stiffness ranges from 5 kN/mm under a 2-mm displacement to as much as 150 kN/mm above a 6-mm displacement. The force-displacement curve also reveals hysteresis, indicative of the inherent damping of the rubber. It is also expected that the radial voids’ force-displacement characteristics would exhibit similar behavior.
Figure 3. Rubber bushing force-displacement curve. Illustration by Romax Technology [15]
2.1.3 Gearbox Motion Instrumentation The GRC gearbox motion is measured in six degrees of freedom (DOFs) with six separate transducers [8,11]. Of those, the two most important are the sensors that measure vertical (z) displacement of the trunnion arms directly over the center of the bushing, as shown in Figure 4. Not visible in Figure 4 are the sensors which measure axial (xt) and lateral (yt) displacement of the trunnion arms. As stated earlier, drivetrain torque and rotor moments are reacted by forces at the trunnion arms and the bushings. As shown in Figure 5, under torque (about +x), the port arm moves downward (-zt), the starboard arm moves upward (+zt), and the gearbox rolls (θx). Under a positive rotor pitch moment (about +y), the trunnion arms each displace downward (-zt), thereby pitching the gearbox (θy). Similarly, under a positive rotor yaw moment (about +z), the trunnion arms each displace laterally (+yt), slightly yawing the gearbox (about +z). The main shaft is stiff, so these rotations largely occur as rigid body motions about the spherical main bearing. In addition, the trunnion arms support the majority of the gearbox weight, so they begin in a precompressed condition (-zt). Because the bushing stiffness is nonlinear with displacement and in precompression under gravity, it is expected that the port and starboard displacements will not be completely symmetric even in a simple loading condition. Overall, these motions are on the order of millimeters and less than 1° such that the small angle assumption is valid.

6
This report is available at no cost from the National Renewable Energy Laboratory (NREL) at www.nrel.gov/publications.
Figure 4. Port trunnion arm vertical displacement sensor. Photo by Robb Wallen, NREL 19259
As the gearbox displaces and rotates, the HSS undergoes similar motions, as illustrated in Figure 5. As the gearbox rolls about the angle θx, it results in a horizontal offset of the HSS by ys. Likewise, as the gearbox pitches about the angle θy, it results in a vertical offset of the gearbox by zt and the HSS by zs. As the gearbox yaws about the angle θz, it results in an axial offset of the trunnion and the HSS by ys. These offsets can be determined by their relative distance from the main bearing or gearbox center, as given in Table 3. The magnitudes of these motions are governed by the drivetrain torque and rotor moments relative to the stiffness of the rubber bushings. These displacements and rotations must be understood and related to the static misalignment to fully describe the operational alignment of the gearbox and generator.
Figure 5. Gearbox roll (left) and tilt (right) motion
7
This report is available at no cost from the National Renewable Energy Laboratory (NREL) at www.nrel.gov/publications.
Table 3. Gearbox Dimensions
Parameter Symbol Value
Main bearing to trunnion arm length, mm td 1650
Trunnion arm to HSS length, mm sd 1250
Gearbox center to HSS radius, mm sr 520
Gearbox center to trunnion center radius, mm tr 750
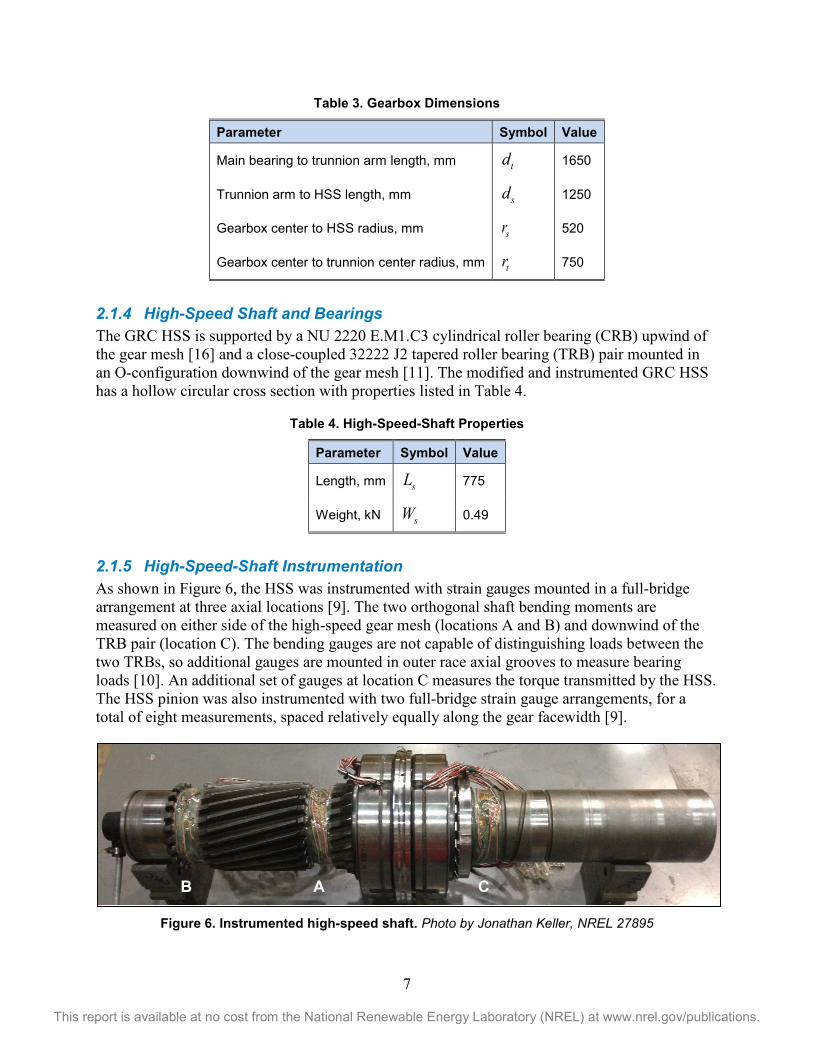
2.1.4 High-Speed Shaft and Bearings The GRC HSS is supported by a NU 2220 E.M1.C3 cylindrical roller bearing (CRB) upwind of the gear mesh [16] and a close-coupled 32222 J2 tapered roller bearing (TRB) pair mounted in an O-configuration downwind of the gear mesh [11]. The modified and instrumented GRC HSS has a hollow circular cross section with properties listed in Table 4.
Table 4. High-Speed-Shaft Properties
Parameter Symbol Value
Length, mm sL 775
Weight, kN sW 0.49
2.1.5 High-Speed-Shaft Instrumentation As shown in Figure 6, the HSS was instrumented with strain gauges mounted in a full-bridge arrangement at three axial locations [9]. The two orthogonal shaft bending moments are measured on either side of the high-speed gear mesh (locations A and B) and downwind of the TRB pair (location C). The bending gauges are not capable of distinguishing loads between the two TRBs, so additional gauges are mounted in outer race axial grooves to measure bearing loads [10]. An additional set of gauges at location C measures the torque transmitted by the HSS. The HSS pinion was also instrumented with two full-bridge strain gauge arrangements, for a total of eight measurements, spaced relatively equally along the gear facewidth [9].
Figure 6. Instrumented high-speed shaft. Photo by Jonathan Keller, NREL 27895
C A B
8
This report is available at no cost from the National Renewable Energy Laboratory (NREL) at www.nrel.gov/publications.
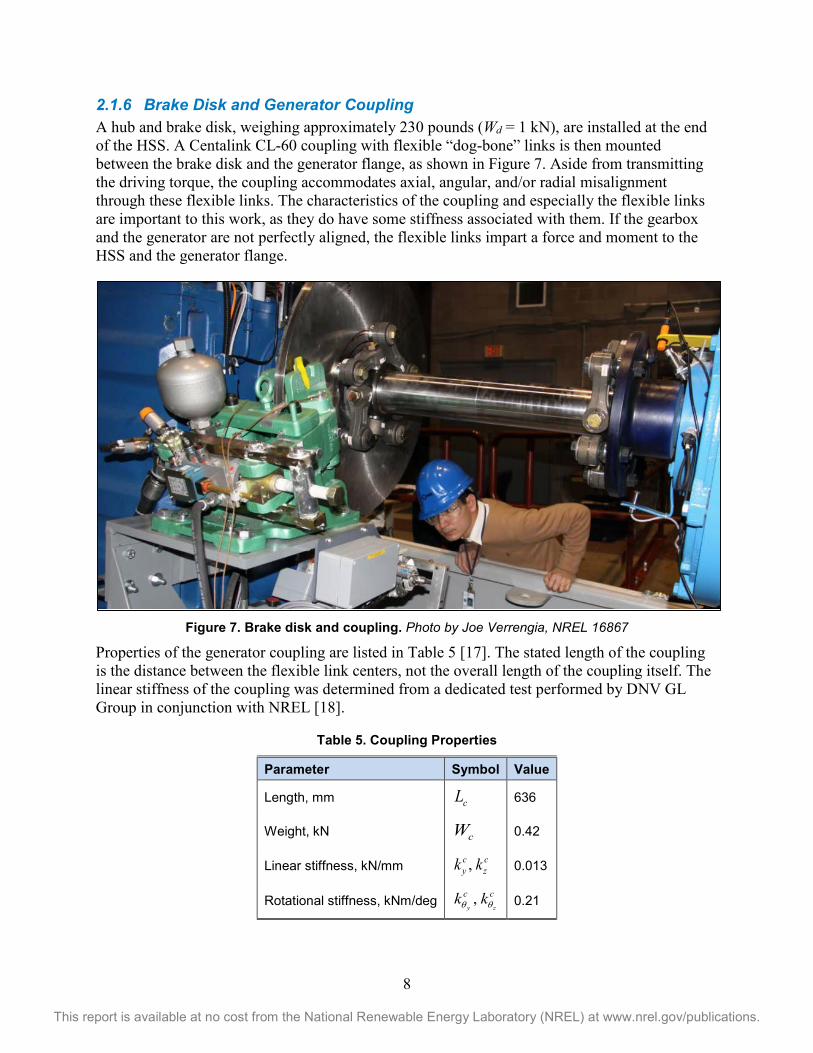
2.1.6 Brake Disk and Generator Coupling A hub and brake disk, weighing approximately 230 pounds (Wd = 1 kN), are installed at the end of the HSS. A Centalink CL-60 coupling with flexible “dog-bone” links is then mounted between the brake disk and the generator flange, as shown in Figure 7. Aside from transmitting the driving torque, the coupling accommodates axial, angular, and/or radial misalignment through these flexible links. The characteristics of the coupling and especially the flexible links are important to this work, as they do have some stiffness associated with them. If the gearbox and the generator are not perfectly aligned, the flexible links impart a force and moment to the HSS and the generator flange.
Figure 7. Brake disk and coupling. Photo by Joe Verrengia, NREL 16867
Properties of the generator coupling are listed in Table 5 [17]. The stated length of the coupling is the distance between the flexible link centers, not the overall length of the coupling itself. The linear stiffness of the coupling was determined from a dedicated test performed by DNV GL Group in conjunction with NREL [18].
Table 5. Coupling Properties
Parameter Symbol Value
Length, mm cL 636
Weight, kN cW 0.42
Linear stiffness, kN/mm ,c cy zk k 0.013
Rotational stiffness, kNm/deg ,y z
c ck kθ θ 0.21
9
This report is available at no cost from the National Renewable Energy Laboratory (NREL) at www.nrel.gov/publications.
2.2 Dynamometer Testing The NWTC 2.5-megawatt dynamometer test facility was used for Phase 3 testing to enable load application to the GRC drivetrain under controlled conditions. The Phase 3 test program includes steady-state and transient test conditions [11]. This report is limited to the steady-state conditions for various combinations of torque, rotor moments, and misalignment of the generator. All tests discussed herein were conducted while the drivetrain was operating at the full speed of 1,800 revolutions per minute on the HSS. In all cases, the HSS data were acquired at 2 kilohertz for 1 second, equating to 30 shaft revolutions. The following sections describe the specific test load cases that were investigated in this work.
2.2.1 Drivetrain Power Tests Testing occurred at five different power levels ranging from offline to the rated electrical power of 750 kilowatts in steps of 25%. Changes in torque were only expected to affect HSS loads in a proportionate manner, but form an important first step in model validation.
2.2.2 Rotor Moment Tests Rotor pitch and yaw moments were introduced to examine their influence on HSS torque and bending moments. One way rotor moments impart loads to the HSS section by affecting gearbox motion, which causes operational misalignment between the gearbox and generator. Among other things, these tests were used to identify the extent to which rotor moments affect gearbox motion and HSS loads. During dynamometer testing, pitch and yaw moments between ±300 kilonewton-meters (kNm) were applied to the drivetrain.
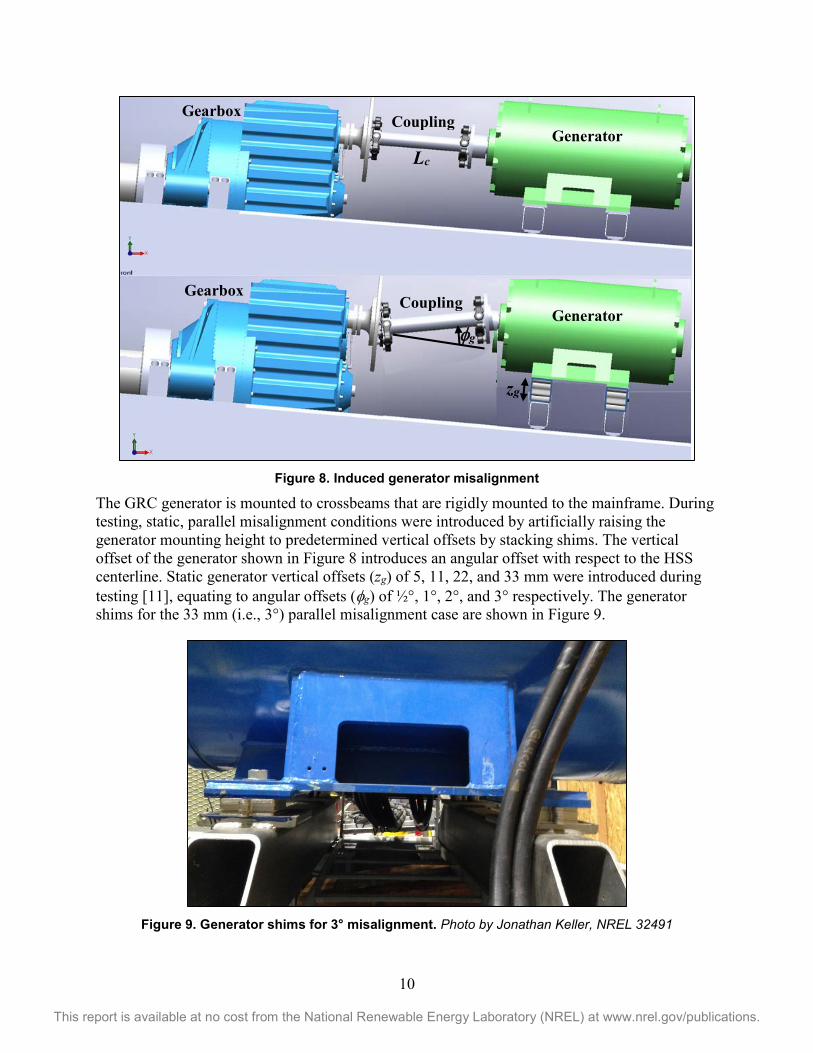
2.2.3 Generator Misalignment Tests One of the factors suspected to contribute to both gearbox HSS and generator bearing failures is misalignment between the gearbox and generator [19, 20]. Misalignment is a condition in which the centerlines of coupled shafts do not coincide, resulting in a deviation of relative shaft position from a collinear axis of rotation. Misalignment can be a pre-existing condition or can be induced during operation through relative motion of the coupling bodies, both statically and dynamically in operation. Operational misalignment between the gearbox and generator typically results from the compliance of the gearbox torque arm mounts [20]. For the GRC, the rubber bushings within the trunnion mounts deform during operation, causing the gearbox to both displace and rotate (subject to torque and rotor moments); thus, the gearbox and generator are typically not perfectly aligned in operation, as shown in Figure 8. Other reasons for operational misalignment include compliance in the main frame and the gearbox housing but these are not typically significant relative to motion of the gearbox [20]. Misalignment changes the loads on HSS bearings depending on the weight of the brake disk and the coupling stiffness.
10
This report is available at no cost from the National Renewable Energy Laboratory (NREL) at www.nrel.gov/publications.
Figure 8. Induced generator misalignment
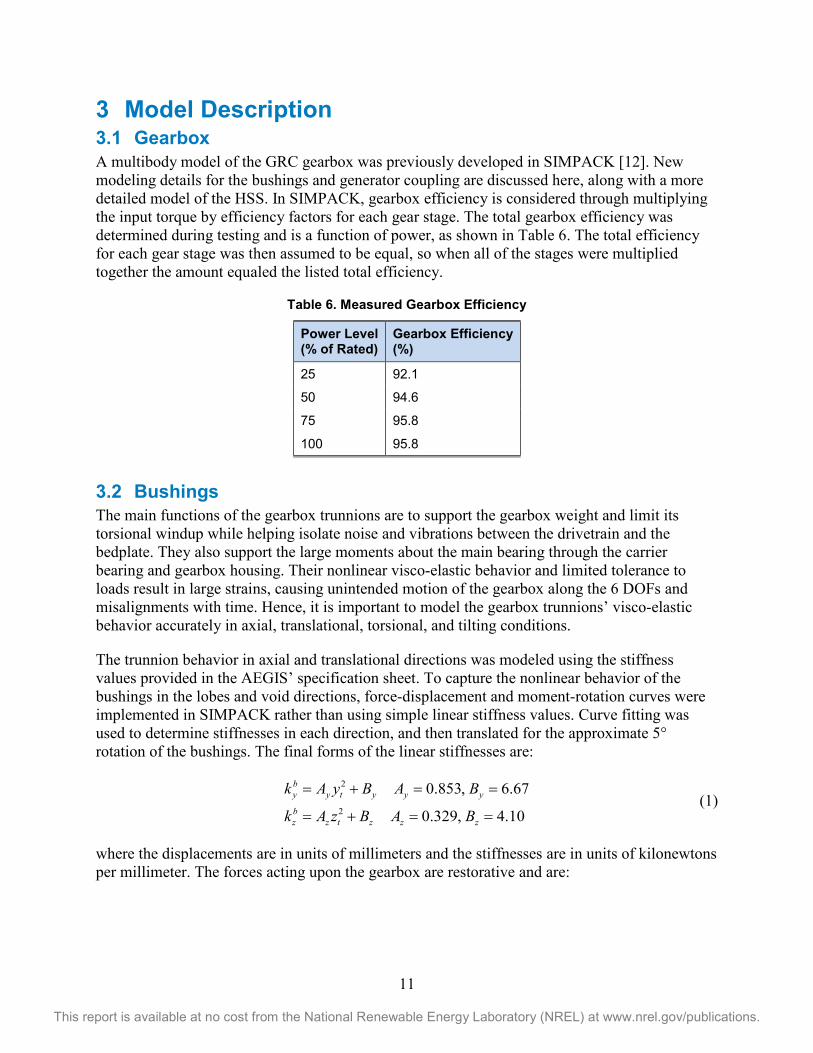
The GRC generator is mounted to crossbeams that are rigidly mounted to the mainframe. During testing, static, parallel misalignment conditions were introduced by artificially raising the generator mounting height to predetermined vertical offsets by stacking shims. The vertical offset of the generator shown in Figure 8 introduces an angular offset with respect to the HSS centerline. Static generator vertical offsets (zg) of 5, 11, 22, and 33 mm were introduced during testing [11], equating to angular offsets (φg) of ½°, 1°, 2°, and 3° respectively. The generator shims for the 33 mm (i.e., 3°) parallel misalignment case are shown in Figure 9.
Figure 9. Generator shims for 3° misalignment. Photo by Jonathan Keller, NREL 32491
Generator
Generator
Gearbox
Gearbox
φg
zg
Coupling
Coupling
Lc
11
This report is available at no cost from the National Renewable Energy Laboratory (NREL) at www.nrel.gov/publications.
3 Model Description 3.1 Gearbox A multibody model of the GRC gearbox was previously developed in SIMPACK [12]. New modeling details for the bushings and generator coupling are discussed here, along with a more detailed model of the HSS. In SIMPACK, gearbox efficiency is considered through multiplying the input torque by efficiency factors for each gear stage. The total gearbox efficiency was determined during testing and is a function of power, as shown in Table 6. The total efficiency for each gear stage was then assumed to be equal, so when all of the stages were multiplied together the amount equaled the listed total efficiency.
Table 6. Measured Gearbox Efficiency
Power Level (% of Rated)
Gearbox Efficiency (%)
25 92.1
50 94.6
75 95.8
100 95.8
3.2 Bushings The main functions of the gearbox trunnions are to support the gearbox weight and limit its torsional windup while helping isolate noise and vibrations between the drivetrain and the bedplate. They also support the large moments about the main bearing through the carrier bearing and gearbox housing. Their nonlinear visco-elastic behavior and limited tolerance to loads result in large strains, causing unintended motion of the gearbox along the 6 DOFs and misalignments with time. Hence, it is important to model the gearbox trunnions’ visco-elastic behavior accurately in axial, translational, torsional, and tilting conditions.
The trunnion behavior in axial and translational directions was modeled using the stiffness values provided in the AEGIS’ specification sheet. To capture the nonlinear behavior of the bushings in the lobes and void directions, force-displacement and moment-rotation curves were implemented in SIMPACK rather than using simple linear stiffness values. Curve fitting was used to determine stiffnesses in each direction, and then translated for the approximate 5° rotation of the bushings. The final forms of the linear stiffnesses are:
2
2
0.853, 6.67
0.329, 4.10
by y t y y y
bz z t z z z
k A y B A B
k A z B A B
= + = =
= + = = (1)
where the displacements are in units of millimeters and the stiffnesses are in units of kilonewtons per millimeter. The forces acting upon the gearbox are restorative and are:
12
This report is available at no cost from the National Renewable Energy Laboratory (NREL) at www.nrel.gov/publications.
b bx x tb by y t
b bz z t
F k xF k y
F k z
= −
= −
= −
(2)
Although not listed in the specification sheet, the bushing twist (about x), tilt (about y), and yaw (about z) stiffnesses can also be estimated assuming the stiffness is constant along the diameter or length of the bushing and integrating over the corresponding displacement.
( ) ( ) ( ) ( )2 5 5 2 3 3
2 4 2
2 4 2
1 1 180 12
1 180 121 1
80 12
x
y
z
by z x o i y z b o i
o
bz y b z b
by z b y b
k A A d d B B L d dd
k A L B L
k A L B L
θ
θ
θ
θ
θ
θ
= + − + + −
=
=
(3)
where the rotations are in units of radians and the stiffnesses are in units of kilonewton meters per radian. The moments acting upon the gearbox are restorative and are:
x
y
z
b bx x
b by y
b bz z
M k
M k
M k
θ
θ
θ
θ
θ
θ
= −
= −
= −
(4)
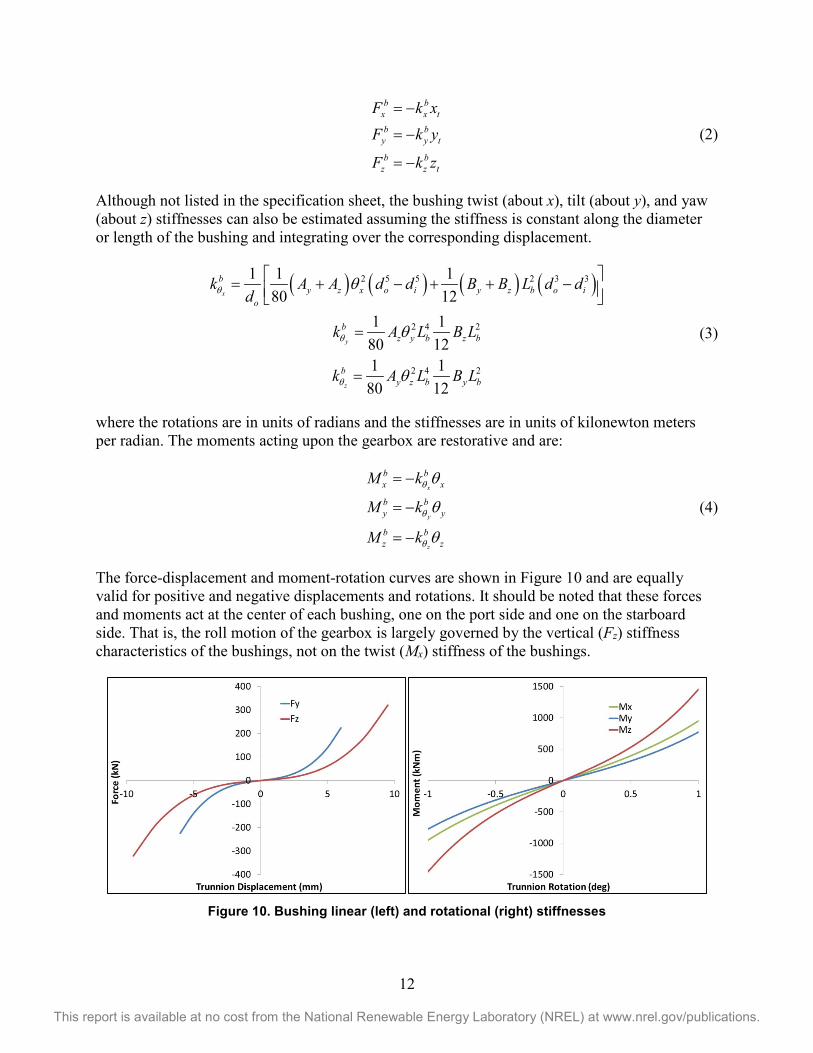
The force-displacement and moment-rotation curves are shown in Figure 10 and are equally valid for positive and negative displacements and rotations. It should be noted that these forces and moments act at the center of each bushing, one on the port side and one on the starboard side. That is, the roll motion of the gearbox is largely governed by the vertical (Fz) stiffness characteristics of the bushings, not on the twist (Mx) stiffness of the bushings.
Figure 10. Bushing linear (left) and rotational (right) stiffnesses
13
This report is available at no cost from the National Renewable Energy Laboratory (NREL) at www.nrel.gov/publications.
Based on previous testing, the trunnion vertical (z) displacement is expected to be as much as ±10 mm in the highest torque and pitch moment combinations so the nonlinear behavior of the vertical bushing force is important; however, the twist, pitch, and yaw angles are expected to be less than ±1°, resulting in only a ±3-mm deflection of the bushing so the rotational behavior of the bushings is largely linear. Similarly, even under extreme pitch moments the trunnion lateral (y) displacement is expected to be under ±3 mm so the lateral behavior of the bushings is also largely linear.
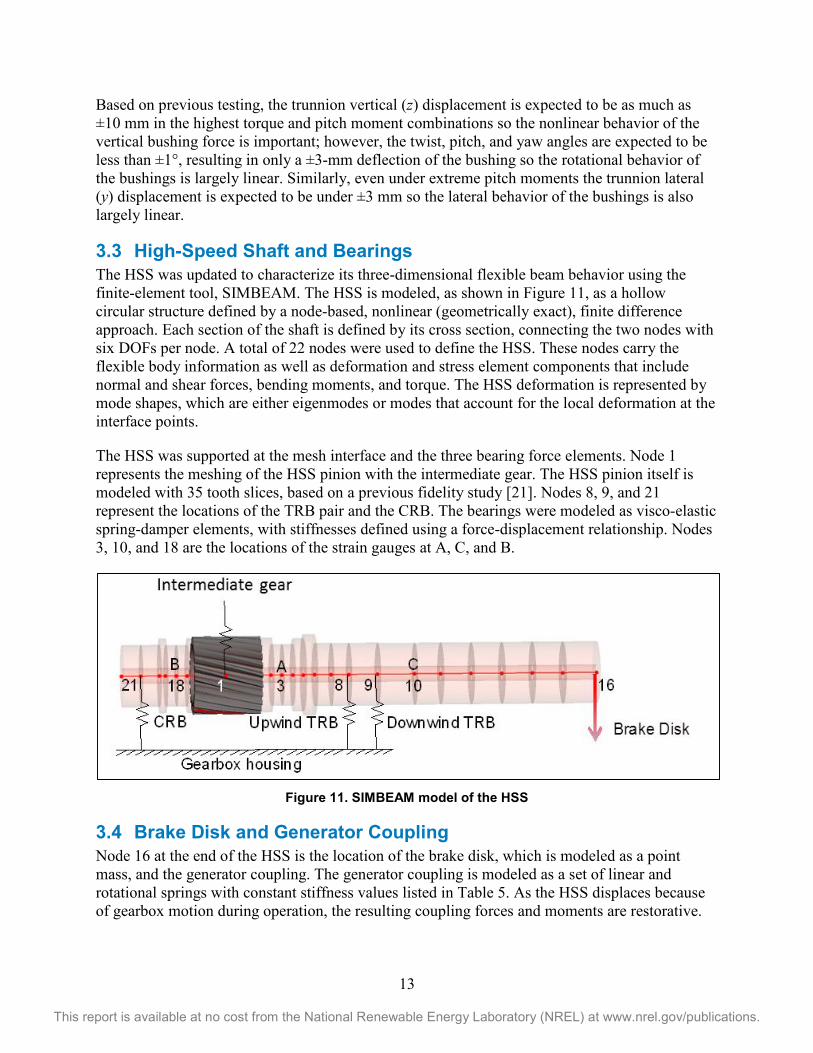
3.3 High-Speed Shaft and Bearings The HSS was updated to characterize its three-dimensional flexible beam behavior using the finite-element tool, SIMBEAM. The HSS is modeled, as shown in Figure 11, as a hollow circular structure defined by a node-based, nonlinear (geometrically exact), finite difference approach. Each section of the shaft is defined by its cross section, connecting the two nodes with six DOFs per node. A total of 22 nodes were used to define the HSS. These nodes carry the flexible body information as well as deformation and stress element components that include normal and shear forces, bending moments, and torque. The HSS deformation is represented by mode shapes, which are either eigenmodes or modes that account for the local deformation at the interface points.
The HSS was supported at the mesh interface and the three bearing force elements. Node 1 represents the meshing of the HSS pinion with the intermediate gear. The HSS pinion itself is modeled with 35 tooth slices, based on a previous fidelity study [21]. Nodes 8, 9, and 21 represent the locations of the TRB pair and the CRB. The bearings were modeled as visco-elastic spring-damper elements, with stiffnesses defined using a force-displacement relationship. Nodes 3, 10, and 18 are the locations of the strain gauges at A, C, and B.
Figure 11. SIMBEAM model of the HSS
3.4 Brake Disk and Generator Coupling Node 16 at the end of the HSS is the location of the brake disk, which is modeled as a point mass, and the generator coupling. The generator coupling is modeled as a set of linear and rotational springs with constant stiffness values listed in Table 5. As the HSS displaces because of gearbox motion during operation, the resulting coupling forces and moments are restorative.

14
This report is available at no cost from the National Renewable Energy Laboratory (NREL) at www.nrel.gov/publications.
( )( )
0
0y
z
c cy y s
c cz z s s
c cy y y
c cz z
F k y
F k z z
M k
M kθ
θ
θ θ
θ
= −
= − −
= − −
= −
(5)
As the generator itself is not modeled, for misalignment conditions an additional force and moment component are modeled from the known, intentional displacement of the generator.
y y
g cz z g
gg c cy g
c
F k zz
M k kLθ θφ
= +
= − = − (6)
3.5 Solution Determination SIMPACK solves the equations of motion by time integration and provides a time history of stress data at the nodes. The stress time history for selected nodes also contains the nodal deformation data, orthogonal bending moments, and torque. In many cases, the orthogonal bending moments are converted to an overall total bending moment magnitude and converted to a fixed frame from a rotating coordinate system.
15
This report is available at no cost from the National Renewable Energy Laboratory (NREL) at www.nrel.gov/publications.
4 Results This section discusses the results of the model-to-test validation for the steady-state test conditions discussed in Section 2.2. The discussion begins with an examination of the gearbox motion followed by a comparison of the HSS loads in the various test conditions.
4.1 Gearbox Motion Gearbox motion in six DOFs was quantified from the relevant displacement sensor measurements. It is sensitive to the combination of rotor torque and moments. Roll and pitch motions dominate under an applied rotor pitch moment, whereas roll and yaw motions dominate under an applied rotor yaw moment. All motion is reported relative to the “true zero” position of the gearbox prior to any deflection caused by gravity. When the gearbox and main shaft are initially installed the bushings compress and the gearbox sags under its own weight downward (zt) by -3.8 mm, resulting in an initial pitch angle θy of 0.13°. It is in this condition that the generator was initially aligned with the gearbox.
For SIMPACK simulations, the input torque was derived from the average measured torque during testing, which accounts for efficiency losses in the system. The input rotor pitch and yaw moments were derived by applying a specified force at the actuator force application point and adjusting the force until it resulted in a moment equal to the average measured bending moment on the main shaft. Although the actuator input forces are known, they are higher than what is required in SIMPACK simulations because the dynamometer shaft and coupling provide some resistance to bending.
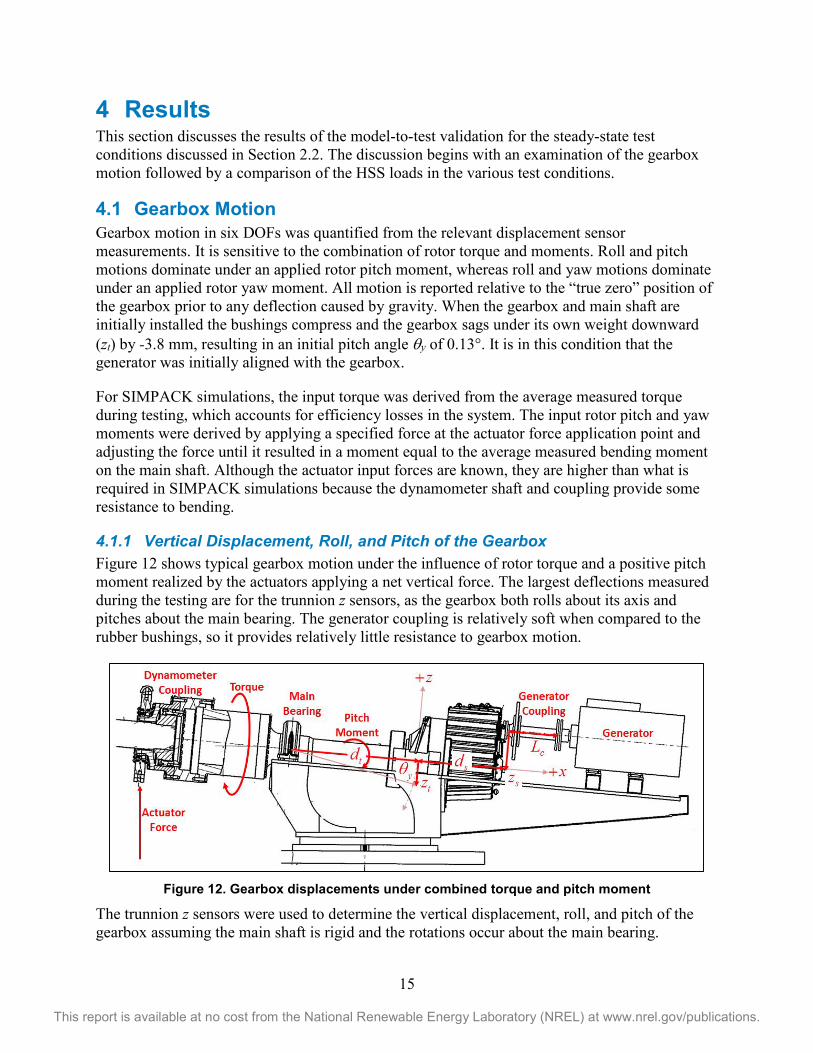
4.1.1 Vertical Displacement, Roll, and Pitch of the Gearbox Figure 12 shows typical gearbox motion under the influence of rotor torque and a positive pitch moment realized by the actuators applying a net vertical force. The largest deflections measured during the testing are for the trunnion z sensors, as the gearbox both rolls about its axis and pitches about the main bearing. The generator coupling is relatively soft when compared to the rubber bushings, so it provides relatively little resistance to gearbox motion.
Figure 12. Gearbox displacements under combined torque and pitch moment
The trunnion z sensors were used to determine the vertical displacement, roll, and pitch of the gearbox assuming the main shaft is rigid and the rotations occur about the main bearing.
16
This report is available at no cost from the National Renewable Energy Laboratory (NREL) at www.nrel.gov/publications.
2
2
ts tpt
ts tpx
t
ty
t
z zz
z zrzd
θ
θ
+=
−=
= −
(7)
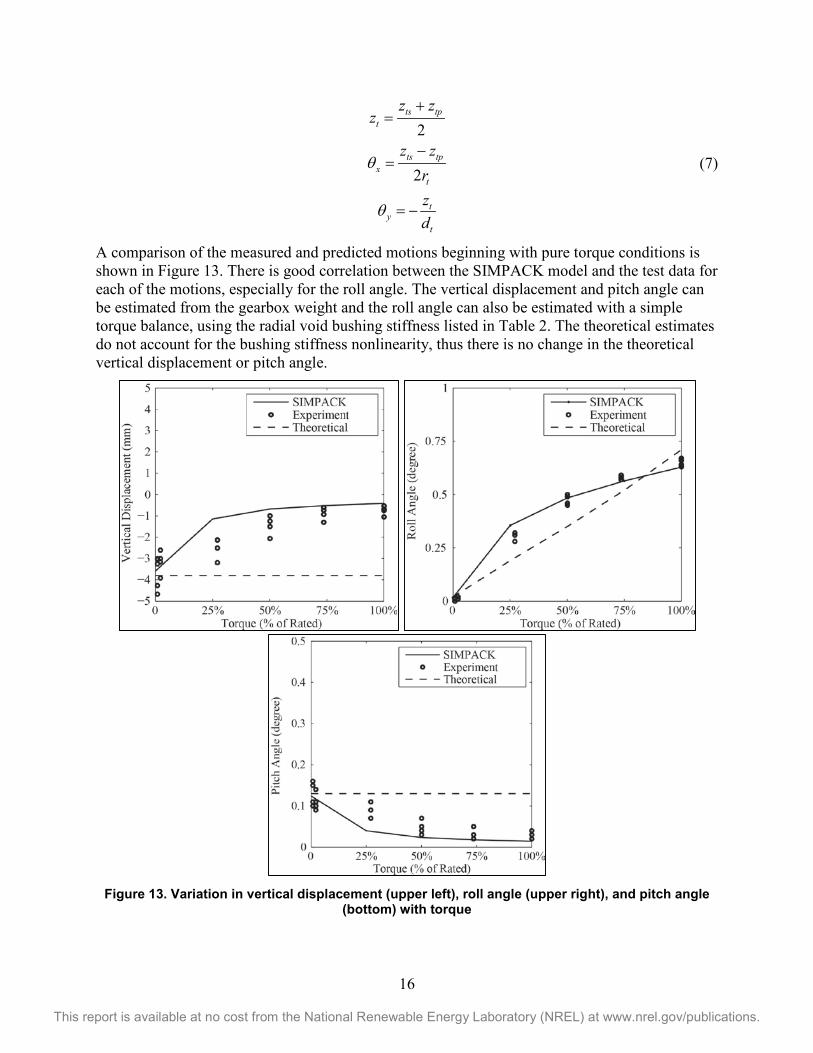
A comparison of the measured and predicted motions beginning with pure torque conditions is shown in Figure 13. There is good correlation between the SIMPACK model and the test data for each of the motions, especially for the roll angle. The vertical displacement and pitch angle can be estimated from the gearbox weight and the roll angle can also be estimated with a simple torque balance, using the radial void bushing stiffness listed in Table 2. The theoretical estimates do not account for the bushing stiffness nonlinearity, thus there is no change in the theoretical vertical displacement or pitch angle.
Figure 13. Variation in vertical displacement (upper left), roll angle (upper right), and pitch angle
(bottom) with torque

17
This report is available at no cost from the National Renewable Energy Laboratory (NREL) at www.nrel.gov/publications.
As stated earlier, the gearbox sags under its own weight. As torque is applied, the port trunnion is forced downward further and the starboard trunnion rises. The bushing stiffness is nonlinear, so the starboard trunnion moves upward more than the port trunnion moves downward, thereby effectively lifting the gearbox upward. At full power, the gearbox is rolled 0.64° and is lifted upward almost to the point of zero vertical displacement and zero pitch. The measured results do show some amount of scatter, especially at the lower torque levels for the vertical displacement. These data points were all gathered at zero-applied pitch or yaw moment, but some were gathered after very large pitch or yaw moments were applied. This scatter is a result of hysteresis in the gearbox bushings, as shown in Figure 3. When large pitch or yaw moments are applied to the test article and then removed, the bushings do not quite return to their original position. In offline conditions, this hysteresis is on the order of 1.5 mm. The hysteresis has a much smaller effect on the roll angle, as each bushing has roughly the same amount of hysteresis.
Rotor pitch moments strongly influence these motions, as shown in Figure 14. Offline, 50% and full power conditions were examined. For the vertical displacement, applying a positive pitch moment forces the gearbox further downward, whereas applying a negative pitch moment lifts it up.
Figure 14. Variation in vertical displacement (upper left), roll angle (upper right), and pitch angle
(bottom) with pitch moment
18
This report is available at no cost from the National Renewable Energy Laboratory (NREL) at www.nrel.gov/publications.
This behavior is also affected by torque, and the resulting roll of the gearbox and bushing displacement. When offline, the gearbox sags and each bushing is essentially compressed equally. Increasing the rotor pitch moment compresses each bushing into a stiffer state up to -8 mm—a change of 4 mm; however, if a negative rotor pitch moment is applied, the gearbox rapidly lifts upward up to 7 mm—a change of 11mm. At full power, each bushing is displaced to a stiffer state. Increasing the pitch moment only relieves the displacement on one bushing, so the effect on vertical displacement is about one-half that in offline conditions. The vertical displacement can also be estimated theoretically with a simple moment balance and using the radial void bushing stiffness listed in Table 2 and it corresponds to both the measured data and the SIMPACK model results.
Applying a pitching moment always lowers the roll angle. At full power, each bushing is displaced significantly: the port downward and the starboard upward. The port bushing is in a very stiff region, so a large positive pitch moment does not deflect it downward much more; however, the starboard trunnion moves downward quickly. This effectively unrolls the gearbox. The same effect occurs for a negative pitching moment. The starboard trunnion is in a very stiff region, so a large negative pitch moment does not deflect it upward much more; however, the port trunnion moves upward, again effectively unrolling the gearbox. This effect is most evident at 50% power. It is present but small in offline conditions, because each bushing is displaced almost equally. There is especially good correlation between the SIMPACK model and the test data for the roll motion to within 0.1°. A rotor pitch moment obviously changes the pitch angle in a proportional fashion. A positive pitch moment increases it and a negative pitch moment decreases it. The effect is again nonlinear though because of the nonlinearity in the bushing stiffness. In offline conditions, a negative pitch moment lifts the gearbox to a much greater extent than a positive pitch moment forces it downward. At full power, the bushings are displaced significantly, so increasing the pitch moment does not change the pitch angle much. The range of pitch angles is approximately ±0.3°. The pitch angle can also be estimated theoretically with a moment balance and using the radial void bushing stiffness listed in Table 2 and it corresponds to both the measured data and the SIMPACK model results.
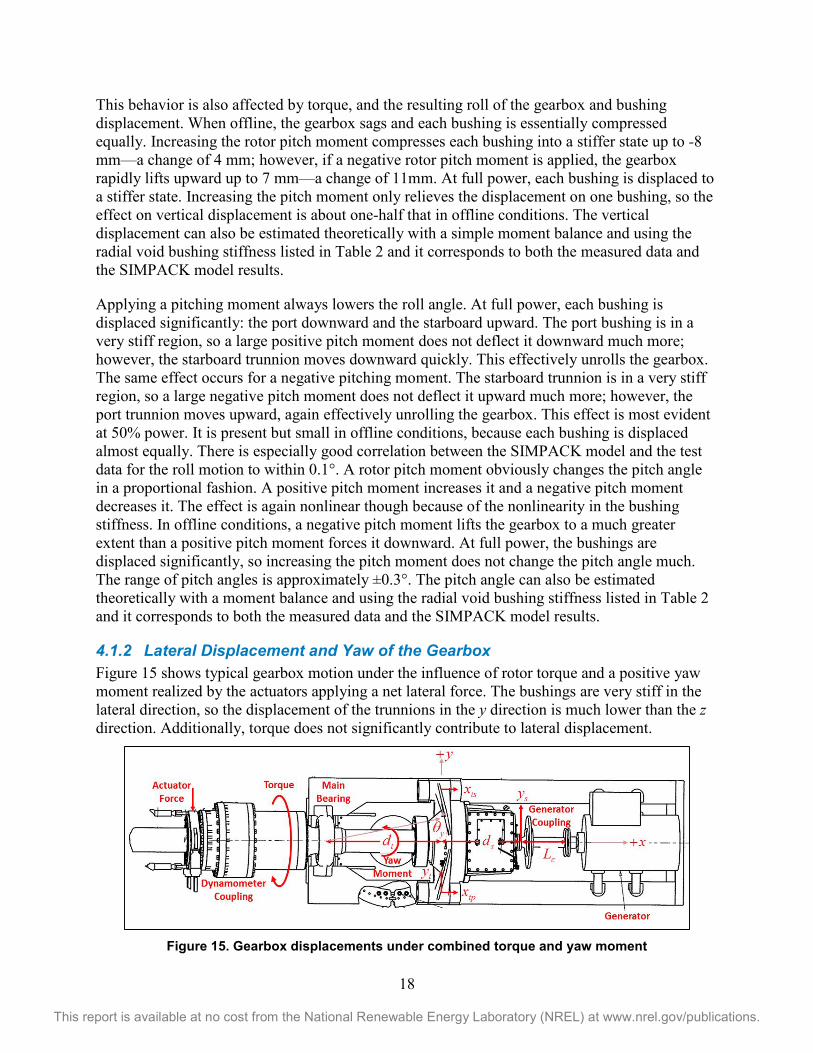
4.1.2 Lateral Displacement and Yaw of the Gearbox Figure 15 shows typical gearbox motion under the influence of rotor torque and a positive yaw moment realized by the actuators applying a net lateral force. The bushings are very stiff in the lateral direction, so the displacement of the trunnions in the y direction is much lower than the z direction. Additionally, torque does not significantly contribute to lateral displacement.
Figure 15. Gearbox displacements under combined torque and yaw moment
19
This report is available at no cost from the National Renewable Energy Laboratory (NREL) at www.nrel.gov/publications.
The trunnion y sensor measures the lateral displacement of the gearbox, whereas the yaw angle of the gearbox can be determined by either the differential of the trunnion x sensors or the trunnion y sensor alone when the yaw occurs about the main bearing.
2
t tp
ts tp tpz
t t
y yx x y
r dθ
=
−= − =
(8)
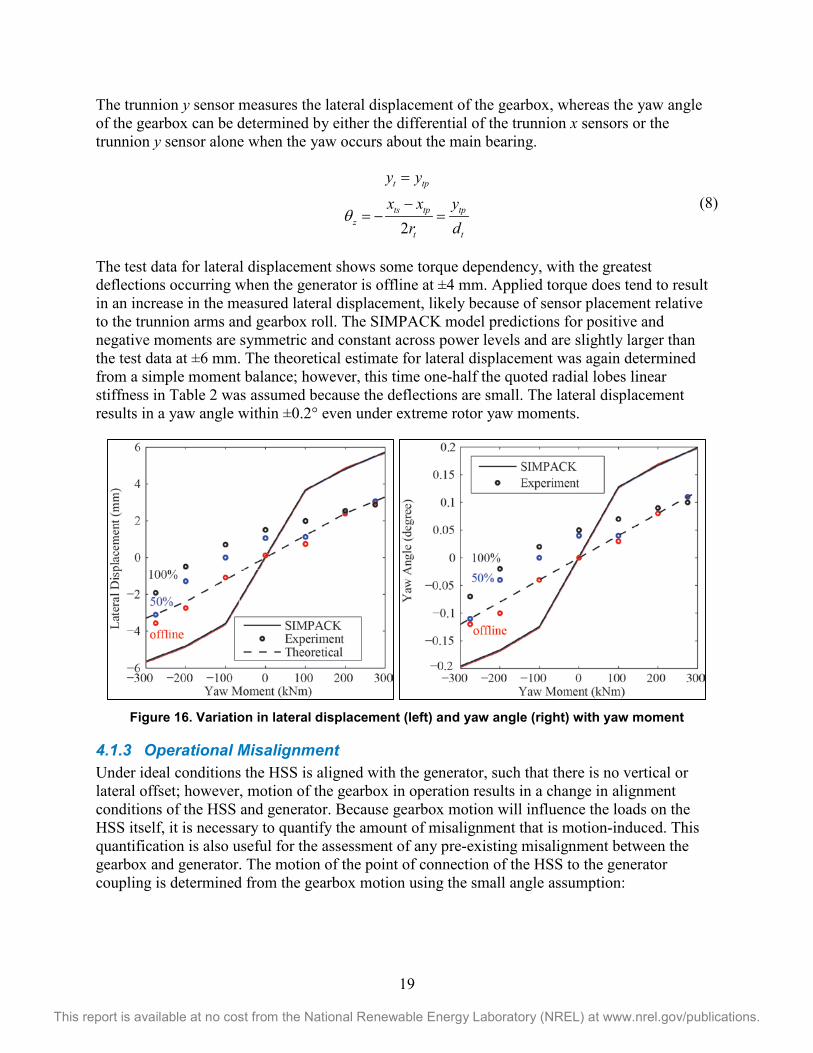
The test data for lateral displacement shows some torque dependency, with the greatest deflections occurring when the generator is offline at ±4 mm. Applied torque does tend to result in an increase in the measured lateral displacement, likely because of sensor placement relative to the trunnion arms and gearbox roll. The SIMPACK model predictions for positive and negative moments are symmetric and constant across power levels and are slightly larger than the test data at ±6 mm. The theoretical estimate for lateral displacement was again determined from a simple moment balance; however, this time one-half the quoted radial lobes linear stiffness in Table 2 was assumed because the deflections are small. The lateral displacement results in a yaw angle within ±0.2° even under extreme rotor yaw moments.
Figure 16. Variation in lateral displacement (left) and yaw angle (right) with yaw moment
4.1.3 Operational Misalignment Under ideal conditions the HSS is aligned with the generator, such that there is no vertical or lateral offset; however, motion of the gearbox in operation results in a change in alignment conditions of the HSS and generator. Because gearbox motion will influence the loads on the HSS itself, it is necessary to quantify the amount of misalignment that is motion-induced. This quantification is also useful for the assessment of any pre-existing misalignment between the gearbox and generator. The motion of the point of connection of the HSS to the generator coupling is determined from the gearbox motion using the small angle assumption:
20
This report is available at no cost from the National Renewable Energy Laboratory (NREL) at www.nrel.gov/publications.
1
1
ss t x s
t
ss t
t
dy y rd
dz zd
θ
= + −
= +
(9)
The effective misalignment angle is then:
2 2o y zφ φ φ= + (10)
where the angular components of misalignment are:
( )0s s
yc
sz
c
z zLyL
φ
φ
− −=
= (11)
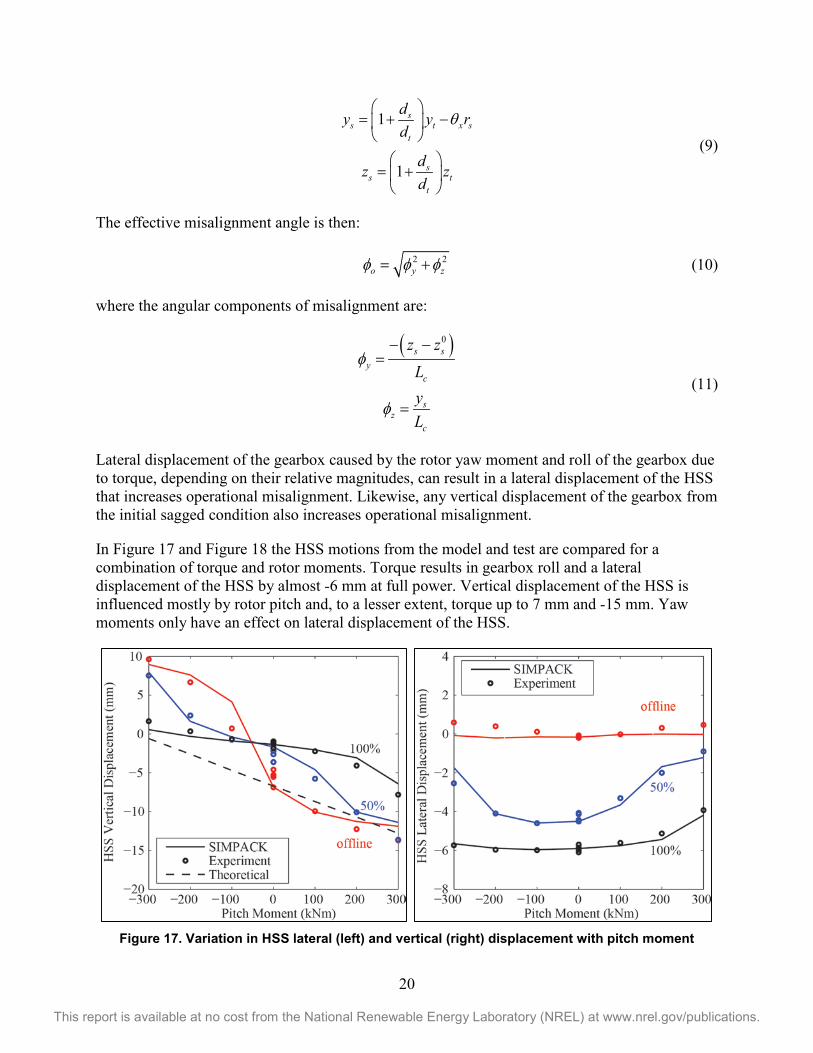
Lateral displacement of the gearbox caused by the rotor yaw moment and roll of the gearbox due to torque, depending on their relative magnitudes, can result in a lateral displacement of the HSS that increases operational misalignment. Likewise, any vertical displacement of the gearbox from the initial sagged condition also increases operational misalignment.
In Figure 17 and Figure 18 the HSS motions from the model and test are compared for a combination of torque and rotor moments. Torque results in gearbox roll and a lateral displacement of the HSS by almost -6 mm at full power. Vertical displacement of the HSS is influenced mostly by rotor pitch and, to a lesser extent, torque up to 7 mm and -15 mm. Yaw moments only have an effect on lateral displacement of the HSS.
Figure 17. Variation in HSS lateral (left) and vertical (right) displacement with pitch moment
21
This report is available at no cost from the National Renewable Energy Laboratory (NREL) at www.nrel.gov/publications.
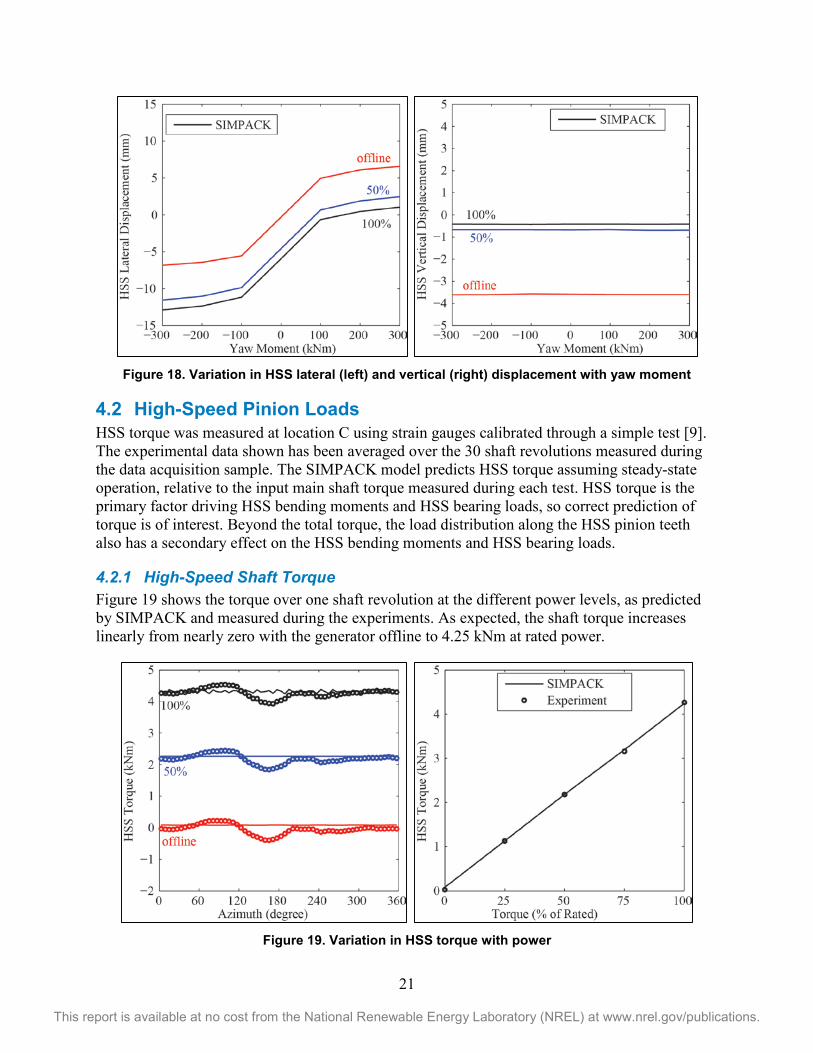
Figure 18. Variation in HSS lateral (left) and vertical (right) displacement with yaw moment
4.2 High-Speed Pinion Loads HSS torque was measured at location C using strain gauges calibrated through a simple test [9]. The experimental data shown has been averaged over the 30 shaft revolutions measured during the data acquisition sample. The SIMPACK model predicts HSS torque assuming steady-state operation, relative to the input main shaft torque measured during each test. HSS torque is the primary factor driving HSS bending moments and HSS bearing loads, so correct prediction of torque is of interest. Beyond the total torque, the load distribution along the HSS pinion teeth also has a secondary effect on the HSS bending moments and HSS bearing loads.
4.2.1 High-Speed Shaft Torque Figure 19 shows the torque over one shaft revolution at the different power levels, as predicted by SIMPACK and measured during the experiments. As expected, the shaft torque increases linearly from nearly zero with the generator offline to 4.25 kNm at rated power.
Figure 19. Variation in HSS torque with power
22
This report is available at no cost from the National Renewable Energy Laboratory (NREL) at www.nrel.gov/publications.
Although the SIMPACK results have an essentially constant magnitude over the shaft revolution, the experimental measurements show a consistent ±0.4 kNm variation (±10% of full power). A possible source for this variation has been hypothesized as tooth spacing errors on the high-speed pinion [22]. Regardless of its source, this variation is expected to drive a change in HSS bending moments and bearing loads. By modeling the efficiency as described earlier, there is excellent correlation between the predicted and average measured torque levels across the full range of test conditions.
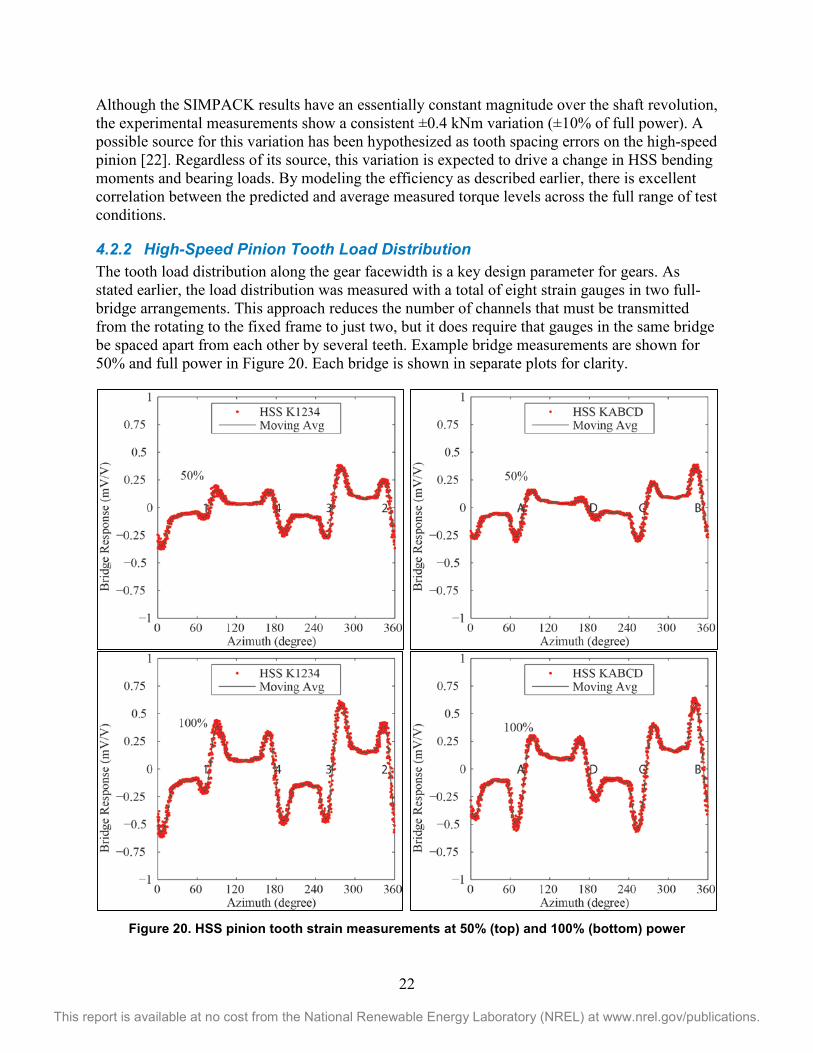
4.2.2 High-Speed Pinion Tooth Load Distribution The tooth load distribution along the gear facewidth is a key design parameter for gears. As stated earlier, the load distribution was measured with a total of eight strain gauges in two full-bridge arrangements. This approach reduces the number of channels that must be transmitted from the rotating to the fixed frame to just two, but it does require that gauges in the same bridge be spaced apart from each other by several teeth. Example bridge measurements are shown for 50% and full power in Figure 20. Each bridge is shown in separate plots for clarity.
Figure 20. HSS pinion tooth strain measurements at 50% (top) and 100% (bottom) power

23
This report is available at no cost from the National Renewable Energy Laboratory (NREL) at www.nrel.gov/publications.
Gauges 1, 4, A, and D are closer to the ends of the pinion and exhibit lower responses than gauges 2, 3, B, and C, which are closer to the middle of the pinion. These strain measurements are not calibrated, and are just intended to measure the shape of the distribution rather than the absolute forces. Thus, the magnitude of the strain measurement is not relevant, the quantity of interest is the change in strain measured as each gauge passes through the gear mesh relative to all the other gauges. This change in strain was derived by averaging over the 30 revolutions of the HSS in each data set at each of the marked gauge locations. For the experimental results, the tooth load distribution was then defined as the change in measured strain at each gauge location divided by the mean change in strain for all eight locations.
For SIMPACK results, the tooth load distribution is defined as the ratio of tooth load per unit length to the average load along the tooth flank. The SIMPACK and experimental tooth load distributions are then directly comparable. The tooth load distributions at 50% power and at full power are shown in Figure 21. There is good correlation between the SIMPACK predictions and the experimental data, although the data shows slightly higher magnitude at the center of the tooth and slightly lower magnitude at the ends of the tooth compared to SIMPACK. The HSS pinion has lead crowning, which is modeled in SIMPACK; and also end relief near tooth ends, which is not modeled in SIMPACK. The lack of end relief in the model is the likely source for the discrepancy in load distribution. At full power, the maximum load near the center of the tooth is approximately 1.25 times the mean value. This ratio is near 1.5 at 50% power; however, the total load in this condition is obviously only half that at full power. Also note that the distribution is not exactly centered—it is shifted slightly downwind as a result of the 4-mm axial offset of the HSS [11]. Also shown in Figure 21 is the load distribution calculated from the Load Distribution Program (LDP) software tool [23]. LDP shows better correlation with the experimental data, especially at full power.
Figure 21. HSS tooth load distribution at 50% (left) and 100% (right) power
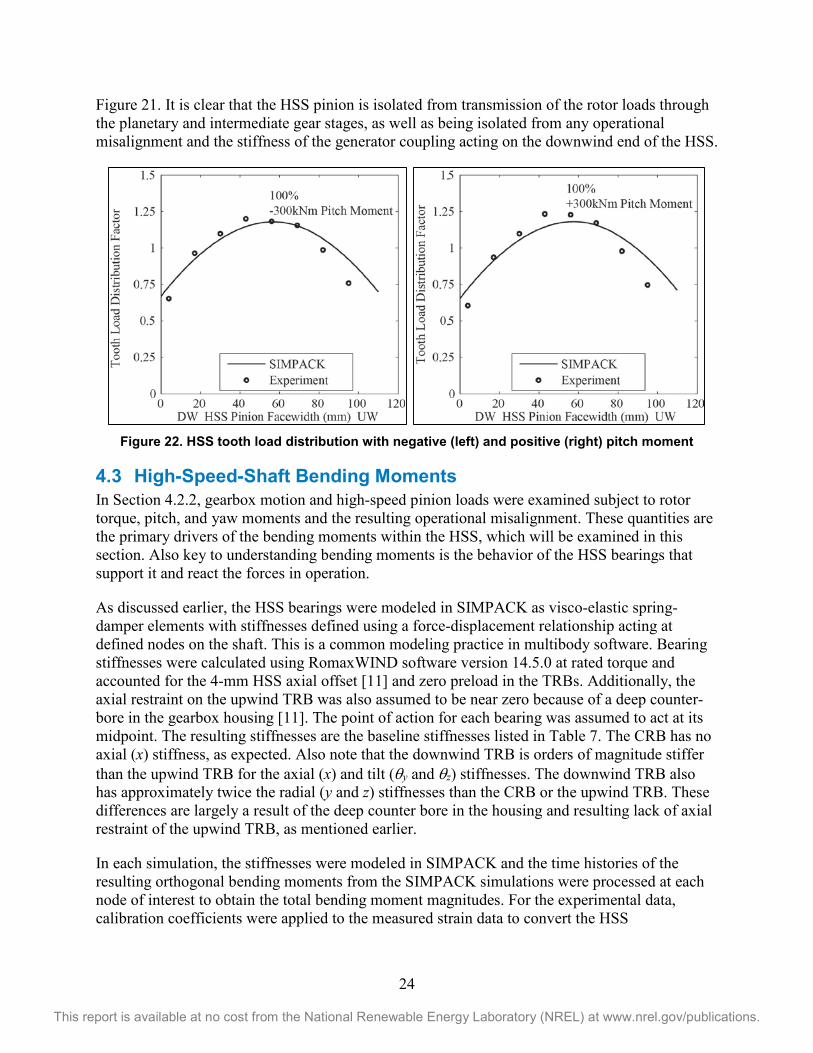
The previous section investigated the large effect that torque, rotor pitch, and yaw moment has on gearbox motion. Figure 22 is a brief investigation of the effect of rotor pitch moment on the tooth load distribution. Extreme rotor pitch moments of ±300 kNm had little-to-no effect on either the measured or predicted tooth load distribution at full power. In each case, the maximum load is 1.25 times the mean value—nearly identical to the value at zero pitch moment shown in
24
This report is available at no cost from the National Renewable Energy Laboratory (NREL) at www.nrel.gov/publications.
Figure 21. It is clear that the HSS pinion is isolated from transmission of the rotor loads through the planetary and intermediate gear stages, as well as being isolated from any operational misalignment and the stiffness of the generator coupling acting on the downwind end of the HSS.
Figure 22. HSS tooth load distribution with negative (left) and positive (right) pitch moment
4.3 High-Speed-Shaft Bending Moments In Section 4.2.2, gearbox motion and high-speed pinion loads were examined subject to rotor torque, pitch, and yaw moments and the resulting operational misalignment. These quantities are the primary drivers of the bending moments within the HSS, which will be examined in this section. Also key to understanding bending moments is the behavior of the HSS bearings that support it and react the forces in operation.
As discussed earlier, the HSS bearings were modeled in SIMPACK as visco-elastic spring-damper elements with stiffnesses defined using a force-displacement relationship acting at defined nodes on the shaft. This is a common modeling practice in multibody software. Bearing stiffnesses were calculated using RomaxWIND software version 14.5.0 at rated torque and accounted for the 4-mm HSS axial offset [11] and zero preload in the TRBs. Additionally, the axial restraint on the upwind TRB was also assumed to be near zero because of a deep counter-bore in the gearbox housing [11]. The point of action for each bearing was assumed to act at its midpoint. The resulting stiffnesses are the baseline stiffnesses listed in Table 7. The CRB has no axial (x) stiffness, as expected. Also note that the downwind TRB is orders of magnitude stiffer than the upwind TRB for the axial (x) and tilt (θy and θz) stiffnesses. The downwind TRB also has approximately twice the radial (y and z) stiffnesses than the CRB or the upwind TRB. These differences are largely a result of the deep counter bore in the housing and resulting lack of axial restraint of the upwind TRB, as mentioned earlier.
In each simulation, the stiffnesses were modeled in SIMPACK and the time histories of the resulting orthogonal bending moments from the SIMPACK simulations were processed at each node of interest to obtain the total bending moment magnitudes. For the experimental data, calibration coefficients were applied to the measured strain data to convert the HSS
25
This report is available at no cost from the National Renewable Energy Laboratory (NREL) at www.nrel.gov/publications.
measurements to engineering units [9]. Similar to previous sections, the experimental data shown has been averaged over the 30 shaft revolutions measured during the data acquisition sample.
Table 7. Baseline Stiffnesses of HSS Bearings
CRB Upwind TRB Downwind TRB
Axial Location,* mm 33 333.5 412.5
Axial Stiffness (N/m) 0 4.7×10⁸ 1.3×10⁹
Radial-y Stiffness (N/m) 4.7×10⁹ 3.1×10⁹ 8.0×10⁹
Radial-z Stiffness (N/m) 4.6×10⁹ 2.9×10⁹ 8.0×10⁹
Tilt-y Stiffness (Nm/rad) 2.9×10⁵ 0.9×10⁶ 3.3×10⁶
Tilt-z Stiffness (Nm/rad) 3.0×10⁵ 1.1×10⁶ 3.3×10⁶
*Location specified from the upwind end of the HSS
4.3.1 Bearing Sensitivity Study Both the stiffness characteristics and the point of action can be difficult to estimate and have an appreciable effect on load calculations, so this section begins with a sensitivity study.
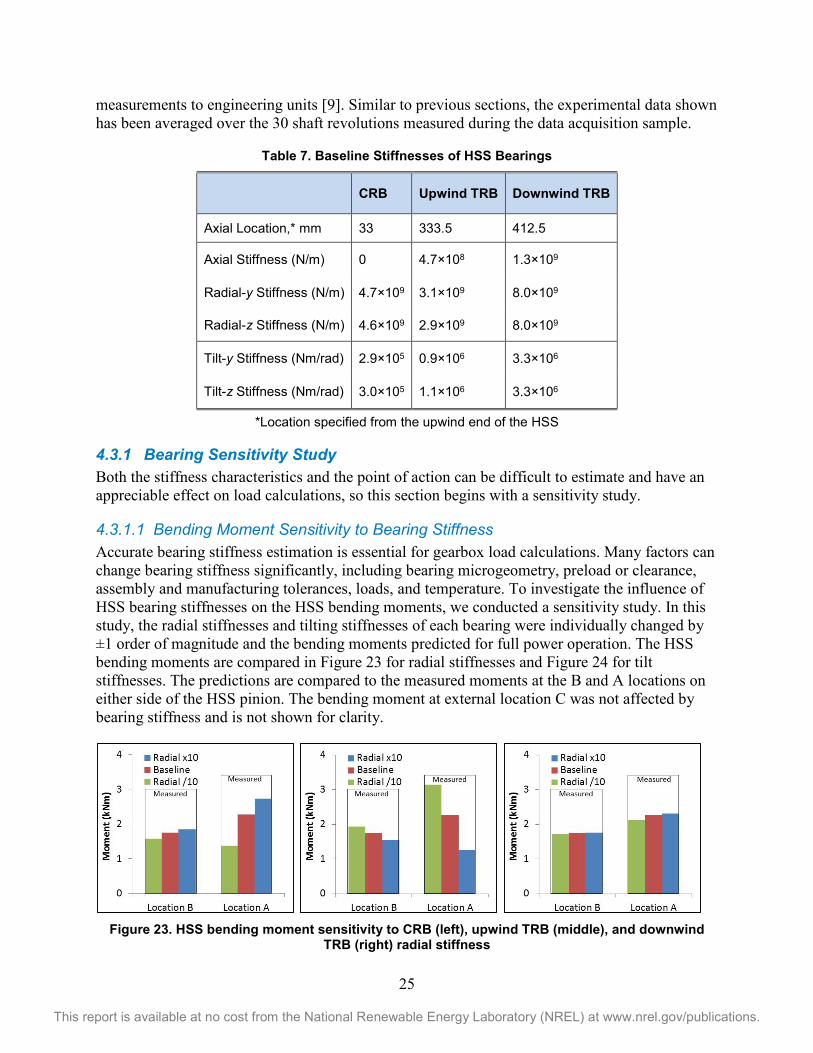
4.3.1.1 Bending Moment Sensitivity to Bearing Stiffness Accurate bearing stiffness estimation is essential for gearbox load calculations. Many factors can change bearing stiffness significantly, including bearing microgeometry, preload or clearance, assembly and manufacturing tolerances, loads, and temperature. To investigate the influence of HSS bearing stiffnesses on the HSS bending moments, we conducted a sensitivity study. In this study, the radial stiffnesses and tilting stiffnesses of each bearing were individually changed by ±1 order of magnitude and the bending moments predicted for full power operation. The HSS bending moments are compared in Figure 23 for radial stiffnesses and Figure 24 for tilt stiffnesses. The predictions are compared to the measured moments at the B and A locations on either side of the HSS pinion. The bending moment at external location C was not affected by bearing stiffness and is not shown for clarity.
Figure 23. HSS bending moment sensitivity to CRB (left), upwind TRB (middle), and downwind
TRB (right) radial stiffness

26
This report is available at no cost from the National Renewable Energy Laboratory (NREL) at www.nrel.gov/publications.
Figure 24. HSS bending moment sensitivity to CRB (left), upwind TRB (middle) and downwind TRB
(right) tilt stiffness
Several trends are worth discussing. First, the measured moment at location B, on the upwind side of the pinion and close to the CRB, is slightly lower than at location A, on the downwind side of the pinion and close to the TRB, at 3.0 and 3.4 kNm, respectively. The predicted bending moments using the baseline stiffnesses are approximately two-thirds of the measured data. Increasing the CRB radial stiffnesses and lowering the upwind TRB radial stiffnesses each significantly increased the predicted bending moments, especially for location A. Changing the radial stiffnesses of the downwind TRB had little effect. Similarly, changing the tilt stiffnesses of any bearing also had little effect. This sensitivity study indicates that the upwind TRB is carrying less load than anticipated, and is therefore softer, and the CRB is carrying more load than anticipated, and is therefore stiffer [24].
We conducted additional modeling using Transmission3D to examine if this situation can be explained. In Transmission3D, the surface contact is solved by an integral approach that analyzes the near-field contact mechanics by integrating the solution for a point load on a half space over the contact area [25]. Finite-element analysis calculates far-field elastic deformations starting a small distance away from the contact area. Matching of the contact deflections and finite-element solutions yields a combined contact solution for near-field surface deformations [26]. Figure 1 shows the bearing analysis results at full power. The contact pressure on individual rollers has been highlighted using colored bars. The downwind TRB rollers are all loaded, whereas less than half of the upwind TRB rollers are loaded. The load profile of the upwind TRB is actually similar to that of the CRB.
Figure 25. Finite-element model of the high-speed shaft bearings
CRB
Upwind TRB
Downwind TRB

27
This report is available at no cost from the National Renewable Energy Laboratory (NREL) at www.nrel.gov/publications.
The upwind and downwind TRB load profiles are illustrated in Figure 26. As expected, the upwind load zone is shallow and concentrated around 90° (+z). Only 7 out of 20 rollers are in contact; however, all the rollers of the downwind TRB are loaded and the load profile is close to an ellipse with the principle axis parallel to the +y direction. Furthermore, the maximum roller load of the upwind TRB is 32% less than the downwind TRB. Based on aforementioned analysis results, it is obvious that the upwind TRB carries very little load, therefore, its stiffness is much lower than the downwind TRB. These finite-element results lend evidence to tailor the CRB and upwind TRB bearing stiffnesses.
Figure 26. TRB load zones
4.3.1.2 Bending Moment Sensitivity to Bearing Location A common assumption in multibody modeling for the location of the bearing reaction force is that it can occur at either the midpoint of the bearing or its effective center based on the line of action of the bearing [27]. In this study, the location of the bearing reaction force was varied to the geometric ends of each bearing and compared to the baseline condition assumed at the bearing midpoint. The inner race of the CRB is 46 mm wide, whereas each TRB is 53 mm wide and separated by a 26-mm-wide spacer. Changing the location of the downwind TRB had the largest effect on bending moments, as it has the largest stiffness; however, it has an opposite effect on the bending moments at locations A and B. Changing the location of the upwind TRB had little effect, whereas changing the CRB point of action had no effect on the moments.
Figure 27. HSS bending moment sensitivity to CRB (left), upwind TRB (middle), and downwind
TRB (right) location
28
This report is available at no cost from the National Renewable Energy Laboratory (NREL) at www.nrel.gov/publications.
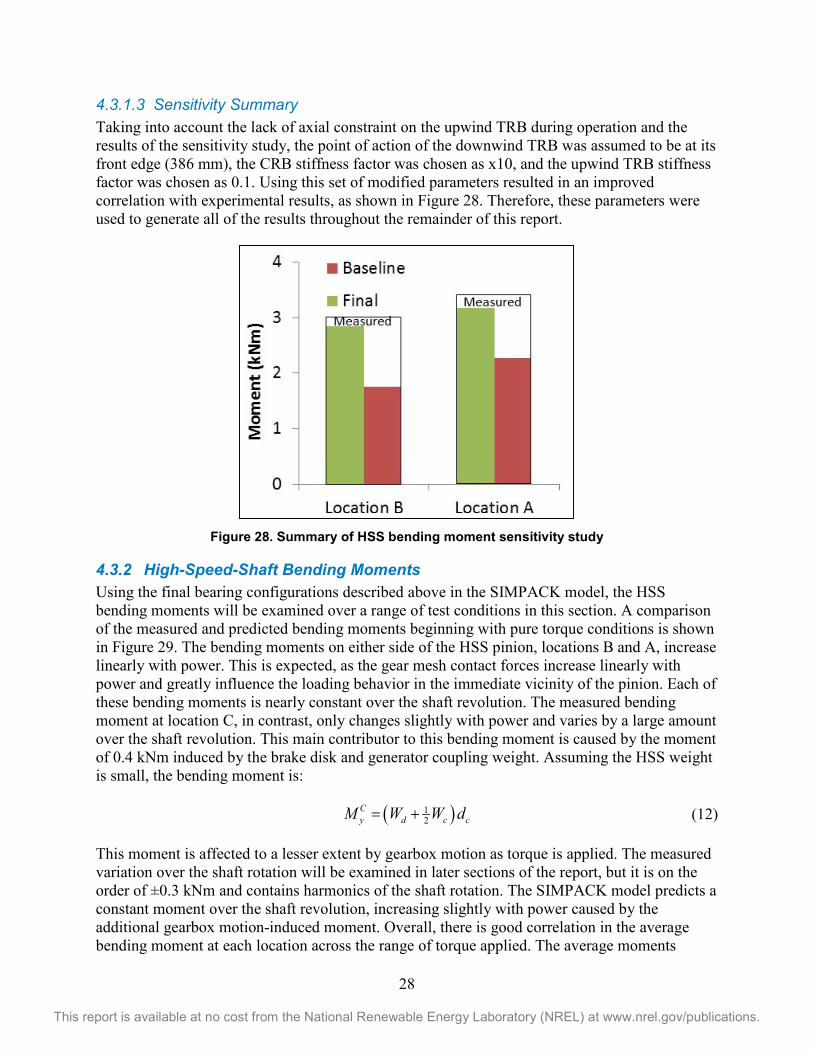
4.3.1.3 Sensitivity Summary Taking into account the lack of axial constraint on the upwind TRB during operation and the results of the sensitivity study, the point of action of the downwind TRB was assumed to be at its front edge (386 mm), the CRB stiffness factor was chosen as x10, and the upwind TRB stiffness factor was chosen as 0.1. Using this set of modified parameters resulted in an improved correlation with experimental results, as shown in Figure 28. Therefore, these parameters were used to generate all of the results throughout the remainder of this report.
Figure 28. Summary of HSS bending moment sensitivity study
4.3.2 High-Speed-Shaft Bending Moments Using the final bearing configurations described above in the SIMPACK model, the HSS bending moments will be examined over a range of test conditions in this section. A comparison of the measured and predicted bending moments beginning with pure torque conditions is shown in Figure 29. The bending moments on either side of the HSS pinion, locations B and A, increase linearly with power. This is expected, as the gear mesh contact forces increase linearly with power and greatly influence the loading behavior in the immediate vicinity of the pinion. Each of these bending moments is nearly constant over the shaft revolution. The measured bending moment at location C, in contrast, only changes slightly with power and varies by a large amount over the shaft revolution. This main contributor to this bending moment is caused by the moment of 0.4 kNm induced by the brake disk and generator coupling weight. Assuming the HSS weight is small, the bending moment is:
( )12
Cy d c cM W W d= + (12)
This moment is affected to a lesser extent by gearbox motion as torque is applied. The measured variation over the shaft rotation will be examined in later sections of the report, but it is on the order of ±0.3 kNm and contains harmonics of the shaft rotation. The SIMPACK model predicts a constant moment over the shaft revolution, increasing slightly with power caused by the additional gearbox motion-induced moment. Overall, there is good correlation in the average bending moment at each location across the range of torque applied. The average moments

29
This report is available at no cost from the National Renewable Energy Laboratory (NREL) at www.nrel.gov/publications.
increase linearly with torque at locations A and B, whereas the average moment at location C only increases slightly with torque and the resulting operational misalignment.
Figure 29. Variation of HSS bending moments with power at location B (upper left), A (upper right),
and C (lower left)
A comparison of the average measured and predicted bending moments is shown in Figure 30 when the drivetrain is subjected to rotor pitch and yaw moments. The bending moments at locations B and A are essentially insensitive to rotor moments, with the exception of a minor increase in bending moment in the measured moment in offline conditions at location A. Because neither the HSS pinion loads nor the bending moments are affected by rotor moments, it can be inferred that the loads for both the CRB and the upwind TRB should not be affected by rotor moments either.
30
This report is available at no cost from the National Renewable Energy Laboratory (NREL) at www.nrel.gov/publications.
Figure 30. Variation in HSS bending moment at location B (left) and A (right) with pitch and yaw
moments
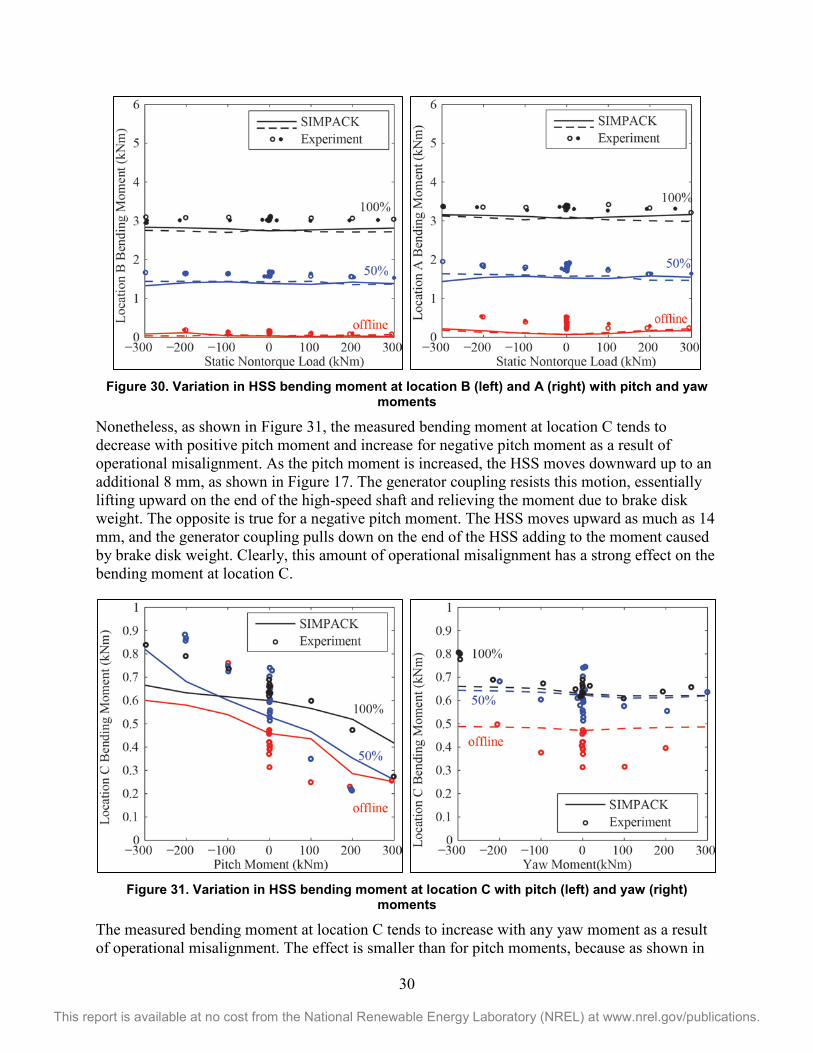
Nonetheless, as shown in Figure 31, the measured bending moment at location C tends to decrease with positive pitch moment and increase for negative pitch moment as a result of operational misalignment. As the pitch moment is increased, the HSS moves downward up to an additional 8 mm, as shown in Figure 17. The generator coupling resists this motion, essentially lifting upward on the end of the high-speed shaft and relieving the moment due to brake disk weight. The opposite is true for a negative pitch moment. The HSS moves upward as much as 14 mm, and the generator coupling pulls down on the end of the HSS adding to the moment caused by brake disk weight. Clearly, this amount of operational misalignment has a strong effect on the bending moment at location C.
Figure 31. Variation in HSS bending moment at location C with pitch (left) and yaw (right)
moments
The measured bending moment at location C tends to increase with any yaw moment as a result of operational misalignment. The effect is smaller than for pitch moments, because as shown in
31
This report is available at no cost from the National Renewable Energy Laboratory (NREL) at www.nrel.gov/publications.
Figure 18 the HSS only displaces ±6 mm. Furthermore, the yaw motion-induced bending moment is actually orthogonal to the weight-induced moment. It has a much smaller effect on the total moment than the pitch motion-induced bending moment does, because it is in the same direction as the weight moment and directly adds to it.
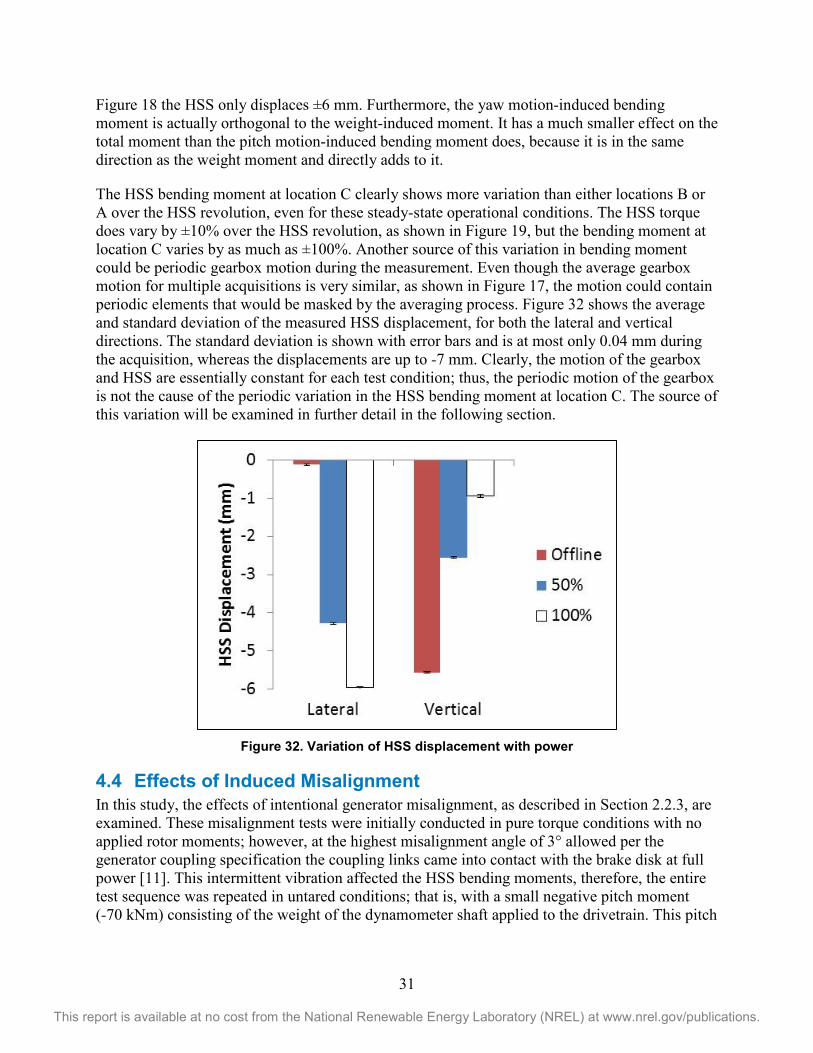
The HSS bending moment at location C clearly shows more variation than either locations B or A over the HSS revolution, even for these steady-state operational conditions. The HSS torque does vary by ±10% over the HSS revolution, as shown in Figure 19, but the bending moment at location C varies by as much as ±100%. Another source of this variation in bending moment could be periodic gearbox motion during the measurement. Even though the average gearbox motion for multiple acquisitions is very similar, as shown in Figure 17, the motion could contain periodic elements that would be masked by the averaging process. Figure 32 shows the average and standard deviation of the measured HSS displacement, for both the lateral and vertical directions. The standard deviation is shown with error bars and is at most only 0.04 mm during the acquisition, whereas the displacements are up to -7 mm. Clearly, the motion of the gearbox and HSS are essentially constant for each test condition; thus, the periodic motion of the gearbox is not the cause of the periodic variation in the HSS bending moment at location C. The source of this variation will be examined in further detail in the following section.
Figure 32. Variation of HSS displacement with power
4.4 Effects of Induced Misalignment In this study, the effects of intentional generator misalignment, as described in Section 2.2.3, are examined. These misalignment tests were initially conducted in pure torque conditions with no applied rotor moments; however, at the highest misalignment angle of 3° allowed per the generator coupling specification the coupling links came into contact with the brake disk at full power [11]. This intermittent vibration affected the HSS bending moments, therefore, the entire test sequence was repeated in untared conditions; that is, with a small negative pitch moment (-70 kNm) consisting of the weight of the dynamometer shaft applied to the drivetrain. This pitch
32
This report is available at no cost from the National Renewable Energy Laboratory (NREL) at www.nrel.gov/publications.
moment, coincidentally, is similar to the pitch moment caused by rotor weight in the actual turbine installation.
4.4.1 High-Speed Shaft Motion and Effective Misalignment As discussed in previous sections, torque causes the gearbox and HSS to roll and lift upward slightly, whereas a negative rotor pitch moment also causes the gearbox and HSS to lift upward. To fully study the effects of generator misalignment, these motions must be combined with the intentional generator misalignment to calculate the total effective misalignment:
( )0
2 2
g s sy
c
sz
c
o y z
z z zLyL
φ
φ
φ φ φ
− −=
=
= +
(13)
The resulting total effective misalignment for the intentional generator misalignment tests is shown in Figure 33 for both the experimental data and the SIMPACK model. Without any intentional generator misalignment, the gearbox is almost aligned with the generator in offline conditions, except for the lift of the gearbox caused by the weight-induced pitch moment. As torque is applied, the gearbox rolls and lifts even farther. Both effects increase the effective misalignment to just over ½° at full power. Conversely, at 3° intentional generator misalignment, where the generator is 33 mm higher than the gearbox, as torque is applied the lifting of the gearbox actually reduces the effective misalignment more than the roll increases it. At full power, the effective misalignment is actually reduced to 2.7°.
Figure 33. Effective misalignment angle
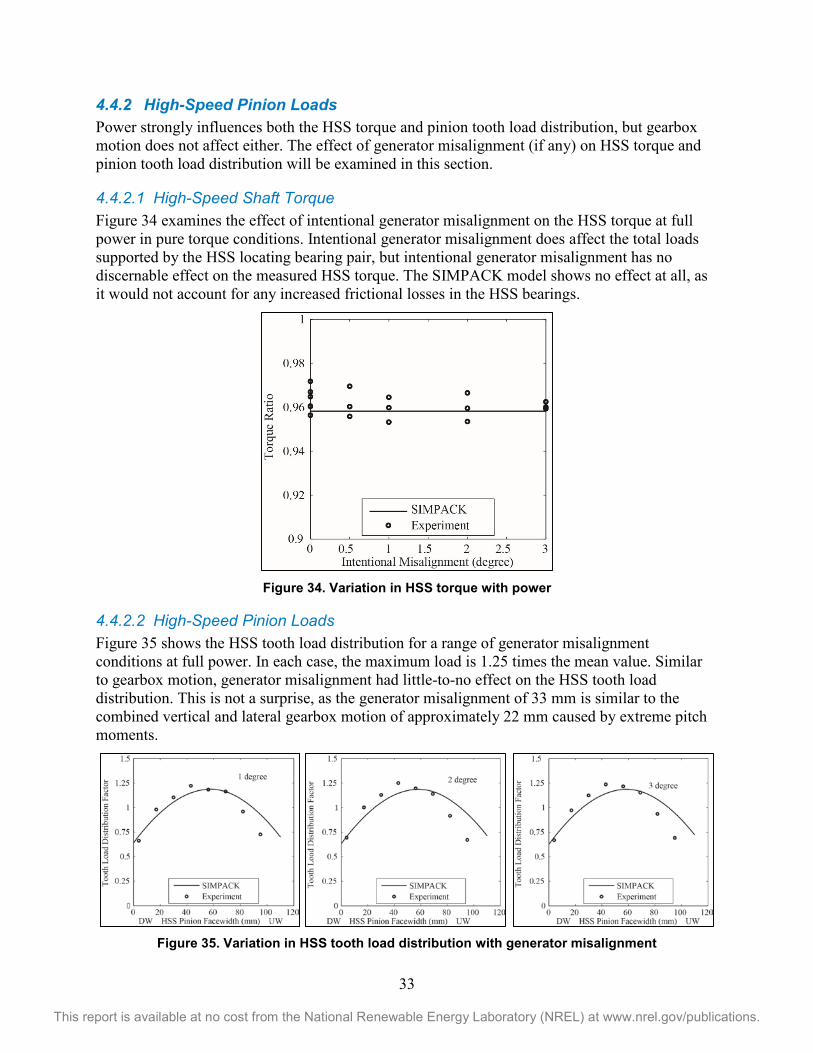
33
This report is available at no cost from the National Renewable Energy Laboratory (NREL) at www.nrel.gov/publications.
4.4.2 High-Speed Pinion Loads Power strongly influences both the HSS torque and pinion tooth load distribution, but gearbox motion does not affect either. The effect of generator misalignment (if any) on HSS torque and pinion tooth load distribution will be examined in this section.
4.4.2.1 High-Speed Shaft Torque Figure 34 examines the effect of intentional generator misalignment on the HSS torque at full power in pure torque conditions. Intentional generator misalignment does affect the total loads supported by the HSS locating bearing pair, but intentional generator misalignment has no discernable effect on the measured HSS torque. The SIMPACK model shows no effect at all, as it would not account for any increased frictional losses in the HSS bearings.
Figure 34. Variation in HSS torque with power
4.4.2.2 High-Speed Pinion Loads Figure 35 shows the HSS tooth load distribution for a range of generator misalignment conditions at full power. In each case, the maximum load is 1.25 times the mean value. Similar to gearbox motion, generator misalignment had little-to-no effect on the HSS tooth load distribution. This is not a surprise, as the generator misalignment of 33 mm is similar to the combined vertical and lateral gearbox motion of approximately 22 mm caused by extreme pitch moments.
Figure 35. Variation in HSS tooth load distribution with generator misalignment
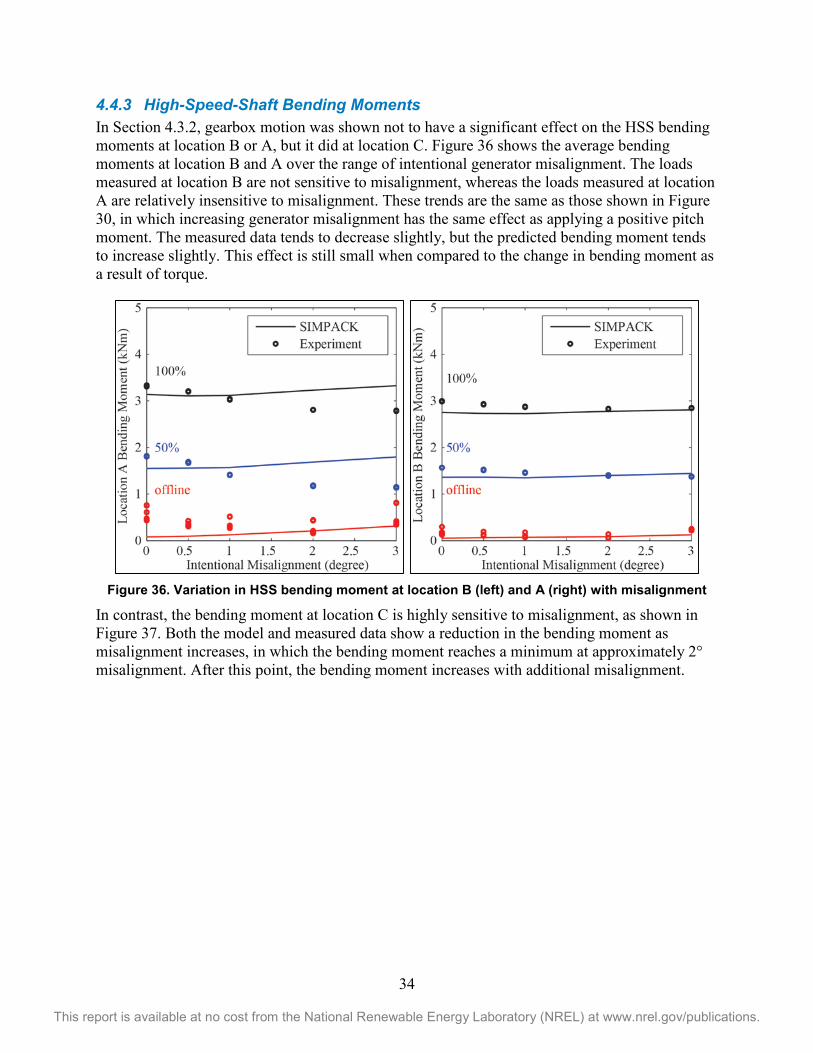
34
This report is available at no cost from the National Renewable Energy Laboratory (NREL) at www.nrel.gov/publications.
4.4.3 High-Speed-Shaft Bending Moments In Section 4.3.2, gearbox motion was shown not to have a significant effect on the HSS bending moments at location B or A, but it did at location C. Figure 36 shows the average bending moments at location B and A over the range of intentional generator misalignment. The loads measured at location B are not sensitive to misalignment, whereas the loads measured at location A are relatively insensitive to misalignment. These trends are the same as those shown in Figure 30, in which increasing generator misalignment has the same effect as applying a positive pitch moment. The measured data tends to decrease slightly, but the predicted bending moment tends to increase slightly. This effect is still small when compared to the change in bending moment as a result of torque.
Figure 36. Variation in HSS bending moment at location B (left) and A (right) with misalignment
In contrast, the bending moment at location C is highly sensitive to misalignment, as shown in Figure 37. Both the model and measured data show a reduction in the bending moment as misalignment increases, in which the bending moment reaches a minimum at approximately 2° misalignment. After this point, the bending moment increases with additional misalignment.
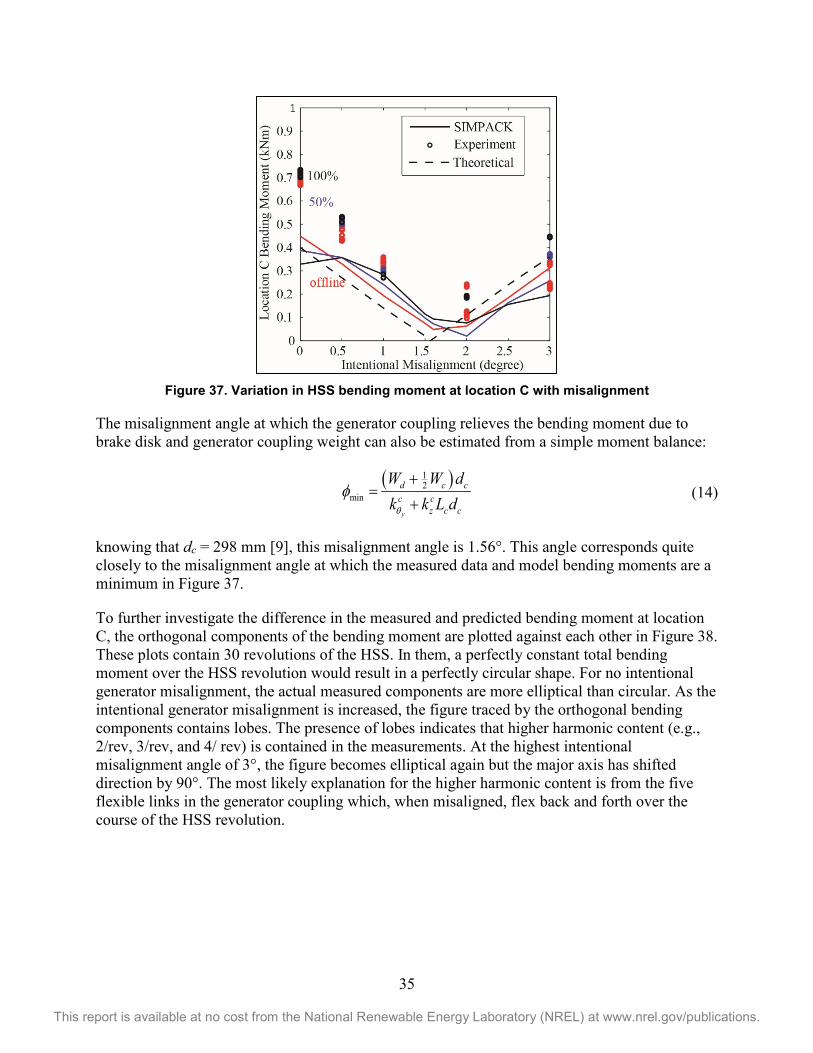
35
This report is available at no cost from the National Renewable Energy Laboratory (NREL) at www.nrel.gov/publications.
Figure 37. Variation in HSS bending moment at location C with misalignment
The misalignment angle at which the generator coupling relieves the bending moment due to brake disk and generator coupling weight can also be estimated from a simple moment balance:
( )1
2min
y
d c cc c
z c c
W W dk k L dθ
φ+
=+
(14)
knowing that dc = 298 mm [9], this misalignment angle is 1.56°. This angle corresponds quite closely to the misalignment angle at which the measured data and model bending moments are a minimum in Figure 37.
To further investigate the difference in the measured and predicted bending moment at location C, the orthogonal components of the bending moment are plotted against each other in Figure 38. These plots contain 30 revolutions of the HSS. In them, a perfectly constant total bending moment over the HSS revolution would result in a perfectly circular shape. For no intentional generator misalignment, the actual measured components are more elliptical than circular. As the intentional generator misalignment is increased, the figure traced by the orthogonal bending components contains lobes. The presence of lobes indicates that higher harmonic content (e.g., 2/rev, 3/rev, and 4/ rev) is contained in the measurements. At the highest intentional misalignment angle of 3°, the figure becomes elliptical again but the major axis has shifted direction by 90°. The most likely explanation for the higher harmonic content is from the five flexible links in the generator coupling which, when misaligned, flex back and forth over the course of the HSS revolution.
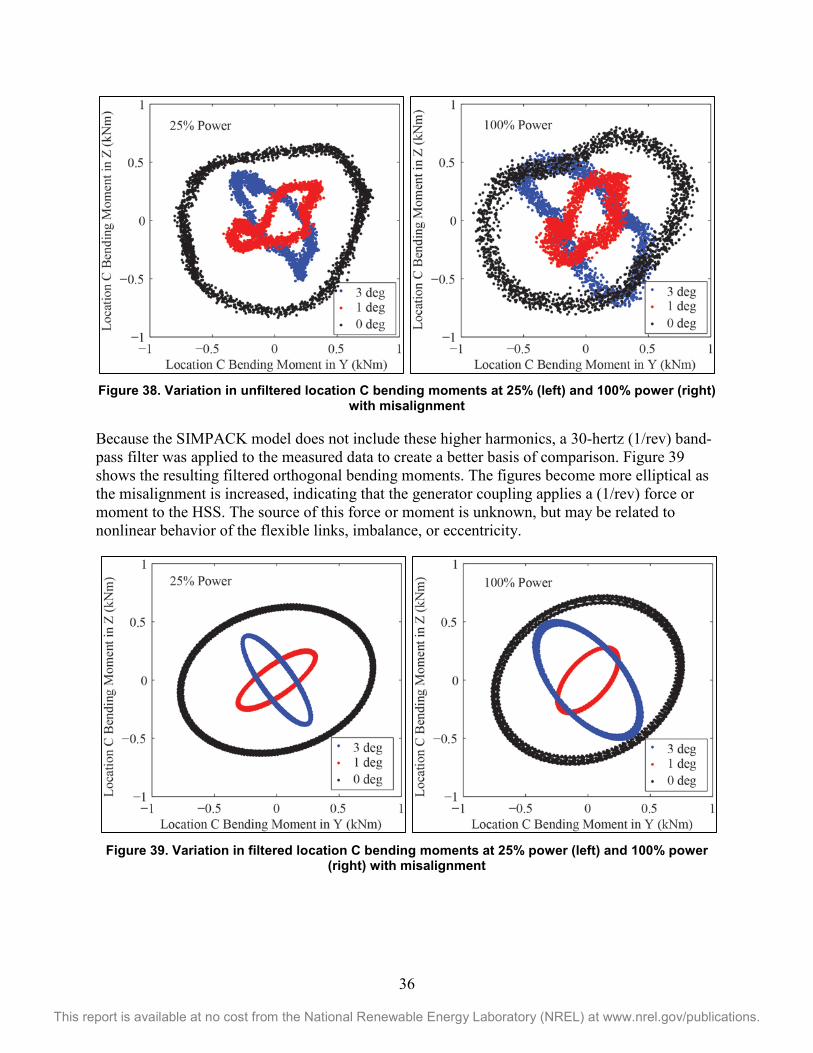
36
This report is available at no cost from the National Renewable Energy Laboratory (NREL) at www.nrel.gov/publications.
Figure 38. Variation in unfiltered location C bending moments at 25% (left) and 100% power (right)
with misalignment
Because the SIMPACK model does not include these higher harmonics, a 30-hertz (1/rev) band-pass filter was applied to the measured data to create a better basis of comparison. Figure 39 shows the resulting filtered orthogonal bending moments. The figures become more elliptical as the misalignment is increased, indicating that the generator coupling applies a (1/rev) force or moment to the HSS. The source of this force or moment is unknown, but may be related to nonlinear behavior of the flexible links, imbalance, or eccentricity.
Figure 39. Variation in filtered location C bending moments at 25% power (left) and 100% power
(right) with misalignment
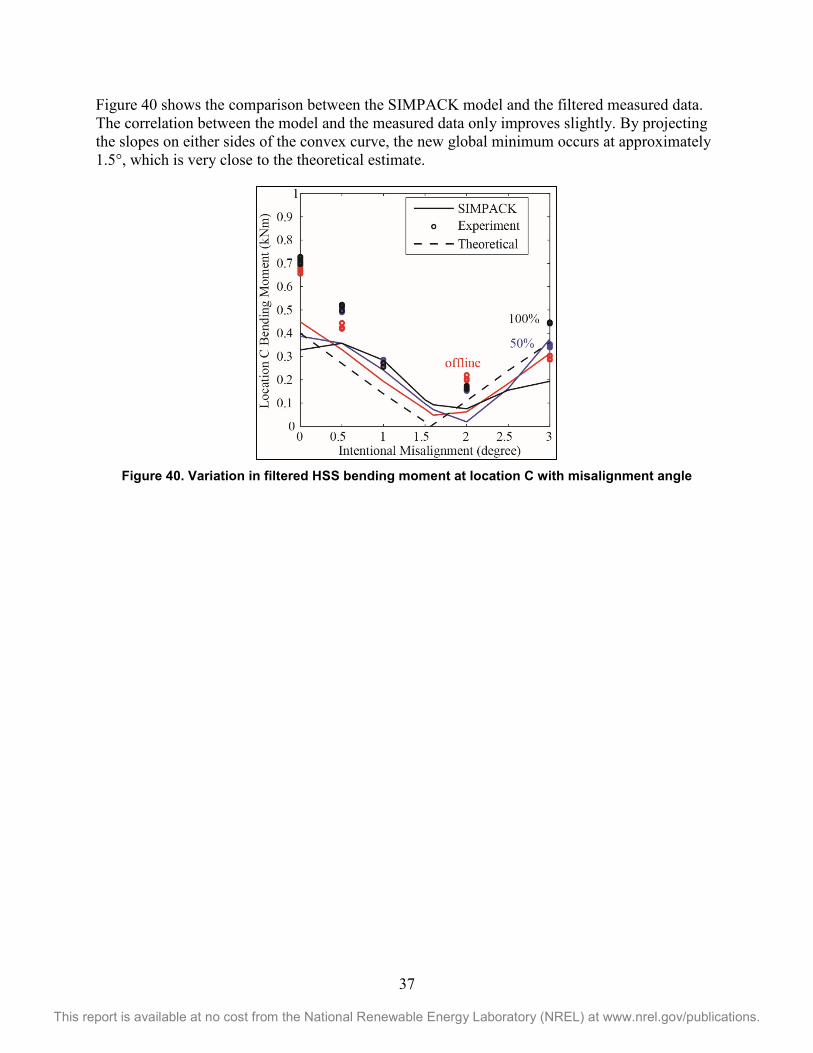
37
This report is available at no cost from the National Renewable Energy Laboratory (NREL) at www.nrel.gov/publications.
Figure 40 shows the comparison between the SIMPACK model and the filtered measured data. The correlation between the model and the measured data only improves slightly. By projecting the slopes on either sides of the convex curve, the new global minimum occurs at approximately 1.5°, which is very close to the theoretical estimate.
Figure 40. Variation in filtered HSS bending moment at location C with misalignment angle
38
This report is available at no cost from the National Renewable Energy Laboratory (NREL) at www.nrel.gov/publications.
5 Conclusions Gearbox motion, HSS torque, and bending loads were examined for the GRC gearbox under various combinations of torque, rotor moments, and intentional generator misalignment. Proximity sensor and strain gauge measurements from dynamometer testing of the GRC drivetrain were used to validate the GRC SIMPACK multibody model. The major observations from the validation exercise are summarized below:
• Gearbox motion. The gearbox and main shaft essentially pivot as a solid body about the main bearing. Gearbox roll increases with applied torque, whereas pitch and yaw motions depend on the direction of applied rotor moments. Modeling of the nonlinear behavior of the stiffness of the gearbox bushings in each direction was an important element in predicting gearbox motion with sufficient accuracy.
• HSS motion and operational misalignment. Gearbox motion significantly affects the alignment of the gearbox and generator. The operational misalignment angle at the coupling can be determined from the knowledge of gearbox motion. In the case of the GRC gearbox, the operational misalignment caused by torque and rotor moments was of a similar magnitude to that allowable per the generator coupling specification.
• HSS loads. Shaft torque and bending moments generally compare well with the SIMPACK multibody model at different power levels. The measured shaft torque displayed a ±10% variation per revolution, suggesting pinion tooth spacing errors. Loads upwind and downwind of the HSS pinion vary linearly with torque and are not sensitive to gearbox motion or generator misalignment. Loads downwind of the locating bearing pair are essentially independent of power levels, but are affected by gearbox motion and generator misalignment. Some misalignment can serve to relieve the HSS bending moment in this area by relieving brake disk weight. It is expected that the loads in the locating bearing pair will be most affected by misalignment.
The current model-to-test validation effort will be extended to investigate the loads on HSS bearings. Measured loads on the TRB pair will be analyzed and compared against analytic and multibody model predictions. Additional dynamic test cases including grid disconnect and braking events will be examined. The bearing load zone distribution and contact stress will be examined using finite-element models.
39
This report is available at no cost from the National Renewable Energy Laboratory (NREL) at www.nrel.gov/publications.
References 1. Sheng, Shawn. “Wind Turbine Gearbox Reliability Database, Condition Monitoring, and
O&M Research Update.” PR-5000-63868, National Renewable Energy Laboratory (NREL), Golden, CO (US), 2015.
2. Kotzalas, Michael N., and Doll, Gary L. “Tribological advancements for reliable wind turbine performance,” Phil. Trans. R. Soc. A 2010 368 (2010): 4829-4850, http://dx.doi.org/10.1098/rsta.2010.0194.
3. Errichello, R., S. Sheng, J. Keller, A. Greco 2012. Wind Turbine Tribology Seminar - A Recap. (Technical Report). NREL/TP-5000-53754. National Renewable Energy Laboratory (NREL), Golden, CO (US). DOE/GO-102011-3496. http://www.nrel.gov/docs/fy12osti/53754.pdf.
4. Greco, A., S. Sheng, J. Keller, A. Erdemir. “Material wear and fatigue in wind turbine Systems.” Wear. Vol. 302(1-2), April-May 2013; pp. 1583-1591. http://dx.doi.org/10.1016/j.wear.2013.01.060.
5. Benjamin Gould and Aaron Greco. “The Influence of Sliding and Contact Severity on the Generation of White Etching Cracks,” Tribology Letters (2015) 60:29, DOI 10.1007/s11249-015-0602-6.
6. Kenred Stadler and Arno Stubenrauch, “Premature Bearing Failures in Wind Gearboxes and White Etching Cracks,” Power Transmission Engineering, October 2014. Accessed December 10, 2015. http://www.powertransmission.com/issues/1014/Premature_Bearing_Failures_PTE1014.pdf.
7. Link, H., W. LaCava, J. van Dam, B. McNiff, S. Sheng, R. Wallen, M. McDade, S. Lambert, S. Butterfield, F. Oyague. 2011. Gearbox Reliability Collaborative Project Report: Findings from Phase 1 and Phase 2 Testing (Technical Report.) NREL/TP-5000-51885. National Renewable Energy Laboratory (NREL), Golden, CO (US). http://www.nrel.gov/docs/fy11osti/51885.pdf.
8. Link, H., J. Keller, J., Y. Guo, B. McNiff. 2013. Gearbox Reliability Collaborative Phase 3 Gearbox 2 Test Plan. (Technical Report). NREL/TP-5000-58190. National Renewable Energy Laboratory (NREL), Golden, CO (US). http://www.nrel.gov/docs/fy13osti/58190.pdf.
9. Keller, J. and B. McNiff. 2014. Gearbox Reliability Collaborative High-Speed Shaft Calibration (Technical Report). NREL/TP-5000-62373. National Renewable Energy Laboratory (NREL), Golden, CO (US). http://www.nrel.gov/docs/fy14osti/62373.pdf.
10. Keller, J., Y. Guo, B. McNiff. 2013. Gearbox Reliability Collaborative High Speed Shaft Tapered Roller Bearing Calibration. (Technical Report). NREL/TP-5000-60319. National Renewable Energy Laboratory (NREL), Golden, CO (US). http://www.nrel.gov/docs/fy14osti/60319.pdf.
40
This report is available at no cost from the National Renewable Energy Laboratory (NREL) at www.nrel.gov/publications.
11. Keller, J, and R. Wallen. 2015. Gearbox Reliability Collaborative Phase 3 Gearbox 2 Test Report (Technical Report). NREL/TP-5000-63693. National Renewable Energy Laboratory (NREL), Golden, CO (US). http://www.nrel.gov/docs/fy15osti/63693.pdf.
12. McNiff, B., Y. Guo, J. Keller, L. Sethuraman. 2014. High-Speed Shaft Bearing Loads Testing and Modeling in the NREL Gearbox Reliability Collaborative (Conference Paper). NREL/CP-5000-63277. National Renewable Energy Laboratory (NREL), Golden, CO (US). http://www.nrel.gov/docs/fy15osti/63277.pdf.
13. Aegis Rubber Engineering. 2014. Type BA – Semi Bonded Bush. Data Sheet. Accessed December 10, 2015. http://www.aegisrubberengineering.co.uk/storage/datasheets/datasheet_semibondedbushes_1404920760.pdf.
14. Aegis Rubber Engineering. 2009. Mechanical Specification, BB-2301-SPEC.
15. Crowther, A., Halse, C. 2010. Gearbox rubber mount: Characteristic on Test Bench and In Situ during Dynamometer Tests (presented at the NREL GRC Meeting, Golden, Colorado, February 17‒18, 2015).Romax Technology, Ltd., Boulder, CO.
16. Errichello, R. and J. Muller. 2012. Gearbox Reliability Collaborative Gearbox 1 Failure Analysis Report: December 2010 ‒ January 2011 (Technical Report). NREL/SR-5000-53062. National Renewable Energy Laboratory (NREL), Golden, CO (US). http://www.nrel.gov/docs/fy12osti/53062.pdf.
17. CENTA. “Product Catalog CL-07-08.” Accessed December 10, 2015. http://www.centa.info/data/products/43/int/cl-07-08_01.pdf.
18. Naucler, S. 2013. NREL Gearbox Reliability Collaborative Coupling Stiffness Test, DNV Kema Renewables Report. DDRP0105 (presented at the NREL GRC Meeting, Golden, Colorado, February 17‒18, 2015).
19. Whittle, M., Shin, W., Trevelyan, J., Wu, J. “A Parametric Study of the Effect of Generator Misalignment on Bearing Fatigue Life in Wind Turbine Generators” (paper presented at EWEA 2011, Brussels, Belgium, March 14‒17, 2011).
20. Matthew Whittle, Jon Trevelyan, Won Shin, Peter Tavner. “Improving wind turbine drivetrain bearing reliability through pre-misalignment,” Wind Energy, 17 (2013): 1217–1230. http://onlinelibrary.wiley.com/doi/10.1002/we.1629/full.
21. LaCava, W., Y. Xing, Y. Guo, Y., T. Moan. 2012. Determining Wind Turbine Gearbox Model Complexity Using Measurement Validation and Cost Comparison (Technical Report). NREL/TP-5000-54545. National Renewable Energy Laboratory (NREL), Golden, CO (US). http://www.nrel.gov/docs/fy12osti/54545.pdf.
22. Houser, D.R. ‟Causes of GRC High Speed Shaft Dynamic Torque Variations,” (presented at the NREL GRC Meeting, Golden, Colorado, February 17‒18, 2015).
http://www.aegisrubberengineering.co.uk/storage/datasheets/datasheet_semibondedbushes_1404920760.pdf

41
This report is available at no cost from the National Renewable Energy Laboratory (NREL) at www.nrel.gov/publications.
23. GearLab. “Load Distribution Program - WindowsLDP4,” Gear and Power Transmission Research Laboratory, accessed September 25, 2015. http://gearlab1.eng.ohio-state.edu/images/Software/Brochure_WindowsLDP.pdf.
24. B. McNiff, Y. Guo, J. Keller, and L. Sethuraman. 2015. High-Speed Shaft Bearing Loads Testing and Modeling in the NREL Gearbox Reliability Collaborative (Technical Report). NREL/CP-5000-63277. National Renewable Energy Laboratory (NREL), Golden, CO (US). http://www.nrel.gov/docs/fy15osti/63277.pdf.
25. S.M. Vijayakar. “A combined surface integral and finite element solution for a three dimensional contact problem,” International Journal for Numerical Methods in Engineering, 31 (1991) 524–546.
26. Y. Guo and R.G. Parker. “Stiffness matrix calculation of rolling element bearings using a finite element/contact mechanics model,” Mechanism and Machine Theory 51 (2012), 32-45.
27. Timken. “Timken Engineering Manual,” accessed http://www.timken.com/en-us/products/Documents/Timken-Engineering-Manual.pdf.


![Gearbox Reliability Collaborative Analytic Formulation for ... · 4], AGMA 6123-B06 [5], and IEC 61400-4 [6] address spline coupling design requirements in varying detail, with the](https://static.fdocuments.in/doc/165x107/5ea8e6f5ceac6677a1285bfb/gearbox-reliability-collaborative-analytic-formulation-for-4-agma-6123-b06.jpg)