Investigation of Multiphase Flow in a Packed Bed Reactor ... · Investigation of Multiphase Flow in...
13
1 Investigation of Multiphase Flow in a Packed Bed Reactor under Microgravity Conditions Yongsheng Lian 1 University of Louisville, Louisville, KY Brian Motil 2 , Enrique Rame 3 NASA Glenn Research Center, Cleveland, OH Abstract In this paper we study the two-phase flow phenomena in a packed bed reactor using an integrated experimental and numerical method. The cylindrical bed is filled with uniformly sized spheres. In the experiment water and air are injected into the bed simultaneously. The pressure distribution along the bed will be measured. The numerical simulation is based on a two-phase flow solver which solves the Navier-Stokes equations on Cartesian grids. A novel coupled level set and moment of fluid method is used to construct the interface. A sequential method is used to position spheres in the cylinder. Preliminary experimental results showed that the tested flow rates resulted in pulse flow. The numerical simulation revealed that air bubbles could merge into larger bubbles and also could break up into smaller bubbles to pass through the pores in the bed. Preliminary results showed that flow passed through regions where the porosity is high. Comparison between the experimental and numerical results in terms of pressure distributions at different flow injection rates will be conducted. Comparison of flow phenomena under terrestrial gravity and microgravity will be made. 1. Introduction Packed bed reactor (PBR) provides intimate contact between different phases and high rates of transport required for chemical or biological reactions [1]. In a typical two-phase PBR operation gas and liquid are injected into the bed simultaneously and they flow through a fixed bed of solid particles. The solid particles, whose sizes vary depending on applications, prompt the mixing of gas and liquid, and they sometimes also serve as catalyst materials. In general, there are four basic flow regimes in concurrent gas-liquid flow through packed beds: bubbly, trickle, pulse and spray. Each regime has its own unique characteristics [1]. Bubbly flow is characterized by gas bubbles dispersed throughout the continuous liquid phase and features low level of phase mixing. Trickle flow also has low mixing but is characterized by the liquid phase flowing down over the packed bed as a falling film. For trickle flow the liquid motion is mainly driven by gravity. Pulse flow has high level of mixing and is characterized by alternating gas-rich and liquid rich regions. Spray flow has high level of mixing but it occurs at very high gas-to-liquid ration. Spray flow is characterized by liquid droplets entrained in the packing by the highly turbulent gas flow. Each regime has distinct hydrodynamic characteristics which affect the heat and mass transfer rates, pressure drop, and liquid holdup. Extensive studies have been performed [2-4] to provide detailed descriptions of each regime. 1 Associate Professor, Mechanical Engineering Department, Senior Member AIAA 2 Deputy Chief, Fluid Physics and Transport Processes Branch 3 Fluid Physics and Transport Processes Branch https://ntrs.nasa.gov/search.jsp?R=20160010444 2018-06-26T12:53:48+00:00Z
Transcript of Investigation of Multiphase Flow in a Packed Bed Reactor ... · Investigation of Multiphase Flow in...

1
Investigation of Multiphase Flow in a Packed Bed Reactor under Microgravity Conditions
Yongsheng Lian1
University of Louisville, Louisville, KY
Brian Motil2, Enrique Rame3
NASA Glenn Research Center, Cleveland, OH
Abstract In this paper we study the two-phase flow phenomena in a packed bed reactor using an integrated experimental and numerical method. The cylindrical bed is filled with uniformly sized spheres. In the experiment water and air are injected into the bed simultaneously. The pressure distribution along the bed will be measured. The numerical simulation is based on a two-phase flow solver which solves the Navier-Stokes equations on Cartesian grids. A novel coupled level set and moment of fluid method is used to construct the interface. A sequential method is used to position spheres in the cylinder. Preliminary experimental results showed that the tested flow rates resulted in pulse flow. The numerical simulation revealed that air bubbles could merge into larger bubbles and also could break up into smaller bubbles to pass through the pores in the bed. Preliminary results showed that flow passed through regions where the porosity is high. Comparison between the experimental and numerical results in terms of pressure distributions at different flow injection rates will be conducted. Comparison of flow phenomena under terrestrial gravity and microgravity will be made.
1. Introduction
Packed bed reactor (PBR) provides intimate contact between different phases and high rates of transport required for chemical or biological reactions [1]. In a typical two-phase PBR operation gas and liquid are injected into the bed simultaneously and they flow through a fixed bed of solid particles. The solid particles, whose sizes vary depending on applications, prompt the mixing of gas and liquid, and they sometimes also serve as catalyst materials. In general, there are four basic flow regimes in concurrent gas-liquid flow through packed beds: bubbly, trickle, pulse and spray. Each regime has its own unique characteristics [1]. Bubbly flow is characterized by gas bubbles dispersed throughout the continuous liquid phase and features low level of phase mixing. Trickle flow also has low mixing but is characterized by the liquid phase flowing down over the packed bed as a falling film. For trickle flow the liquid motion is mainly driven by gravity. Pulse flow has high level of mixing and is characterized by alternating gas-rich and liquid rich regions. Spray flow has high level of mixing but it occurs at very high gas-to-liquid ration. Spray flow is characterized by liquid droplets entrained in the packing by the highly turbulent gas flow. Each regime has distinct hydrodynamic characteristics which affect the heat and mass transfer rates, pressure drop, and liquid holdup. Extensive studies have been performed [2-4] to provide detailed descriptions of each regime.
1 Associate Professor, Mechanical Engineering Department, Senior Member AIAA 2 Deputy Chief, Fluid Physics and Transport Processes Branch 3 Fluid Physics and Transport Processes Branch
https://ntrs.nasa.gov/search.jsp?R=20160010444 2018-06-26T12:53:48+00:00Z
2
NASA technologies include adiabatic two-phase flows or two-phase flows with heat transfer that are relevant to life support systems, fuel cells, in-situ resource utilization, heat pipes, materials processing, production of pharmaceutical grade water, and transport of nutrients in soils. A very important unit operation that involves gas-liquid flow through porous media is the fixed packed bed reactor. Due to its compactness and low power consumption in operation, PRB is an excellent candidate for space operations. Examples in which PBRs are used include the Volatile Removal Assembly (VRA), the Integrated Advanced Water Recovery System (AWRS), and IntraVenous Water GENeration system (IVGEN). NASA is currently operating systems with packed bed reactors for ground and flight-based testing. A basic understanding of two-phase flows through porous media is critical for these missions. However, current PRB designs rely on semi-empirical models which either ignore or insufficiently address the effects of gravity on flow distribution and pressure drop. Consequently, a thorough understanding of how the reduced gravity environment affects the performance and reliability of these reactors is especially critical when gas-liquid flows are involved. To address this need, NASA plans to fly and operate the Packed Bed Reactor Experiment (PBRE) on the ISS in early 2016. The PBRE is currently instrumented to obtain critical operating parameters such as pressure drop and flow visualization at the column wall. However, even with optically index-matched glass beads, it is not possible to visualize or measure the flow field throughout the entire column or even the average gas-liquid distribution. Development efforts to measure the phase distribution using capacitance or conductivity measurements are still under development and not available for the initial set of ISS flights. Without a direct measurement or a predictive method to determine the phase distribution throughout the column, it will be difficult to develop mass transfer coefficients, possible viscous fingering, or bubble occlusion-all of these are important to fully predict reactor bed performance.
An alternative to directly measuring the phase distribution is CFD. The CFD model can be validated through a combination of ground tests which can measure the average liquid holdup and the actual ISS pressure drop and flow regime measurements from the PBRE. In principle, the phase distribution can be predicted by solving the conservation equations of mass and momentum. However, because of the complex geometry, the interactions among gas, liquid and solid, and the nonlinear nature of the equations, it is difficult to obtain the complete solution. Simplified models were used in the early days. These models, after tuning model parameters to match the experimental results, can provide predictions of the overall qualities. However, since most of these models rely on assumed ideal flow patterns and are one-dimensional, they could not predict the flow distribution in the bed [6, 7]. The discrete-cell-model (DCM) [8], which assumes that flow can be determined by the minimum rate of total energy dissipation in the packed bed, represents a packed bed as a number of interconnected cells. DCM incorporates porosity variation into the model by assigning each cell with uniform structure and physical properties. The effect of particle wetting state on the liquid distribution is also incorporated into the model. It is shown that DCM can give quantitative prediction of the liquid upflow distribution in a packed bed without considering the complete characterization of the solid boundaries and void configuration. The K-fluid model [9, 10], an Eulerian approach derived from the volume averaging of the continuity and momentum equations, is able to provide reasonable predictions for global hydrodynamic quantities such as liquid holdup and pressure drop [11]. In the K-fluid model, some forces acting on a
3
representative volume are not calculated directly but are modeled. For multiphase flow problems the K-fluid model also requires closures which are often based on phenomenological models developed in bench-scale hydrodynamic experiments. The aforementioned models rely on a statistical approach and to some extend they can provide global quantities. However, the important fundamental phenomena such as the interactions among gas, liquid, and solid are not considered by these approach. A direct numerical simulation of the multiphase flow is required to have a thorough understanding of flow physics in a packed bed reactor. A direct numerical simulation of the PBRs remains challenging. In a typical PBR configuration, the inertial force, viscous force, interfacial capillary force, and gravitational force all contribute to the flow distribution. The influence of particle external wetting on liquid distribution can be significant [12, 13]. Experimental studies have shown that the interfacial forces and packing wettability are not only responsible for the liquid flow distribution [12], but for the hysteresis observed in the pressure drops and liquid holdup [14]. Therefore, it is critical to evaluate these forces to accurately capture the important flow phenomena in PBRs. In this paper we will conduct an integrated numerical and experimental study of the flow physics in two-phase PBRs. The two-phase flow phenomena inside cylindrical beds filled with uniformly sized spheres will be investigated. Pressure variation along the bed will be measured in the experiment under terrestrial gravity. The experiment will be used to validate the multiphase flow solver. In the simulation, spheres are numerically packed with a sequential method. The flow field is described by solving the Navier-Stokes equations on Cartesian grids. The coupled level set and moment of fluid method is used to capture the interfaces. Both terrestrial gravity and microgravity will be simulated. In the following we first introduce the key fluid parameters in the study of PBRs and then present the numerical method and sphere packing algorithm. We then compare the simulation directly with an identical packed column in the vertical down-flow configuration over a range of flow rates. The model will be evaluated against experimentally obtained flow regimes and pressure drop over the length of the column.
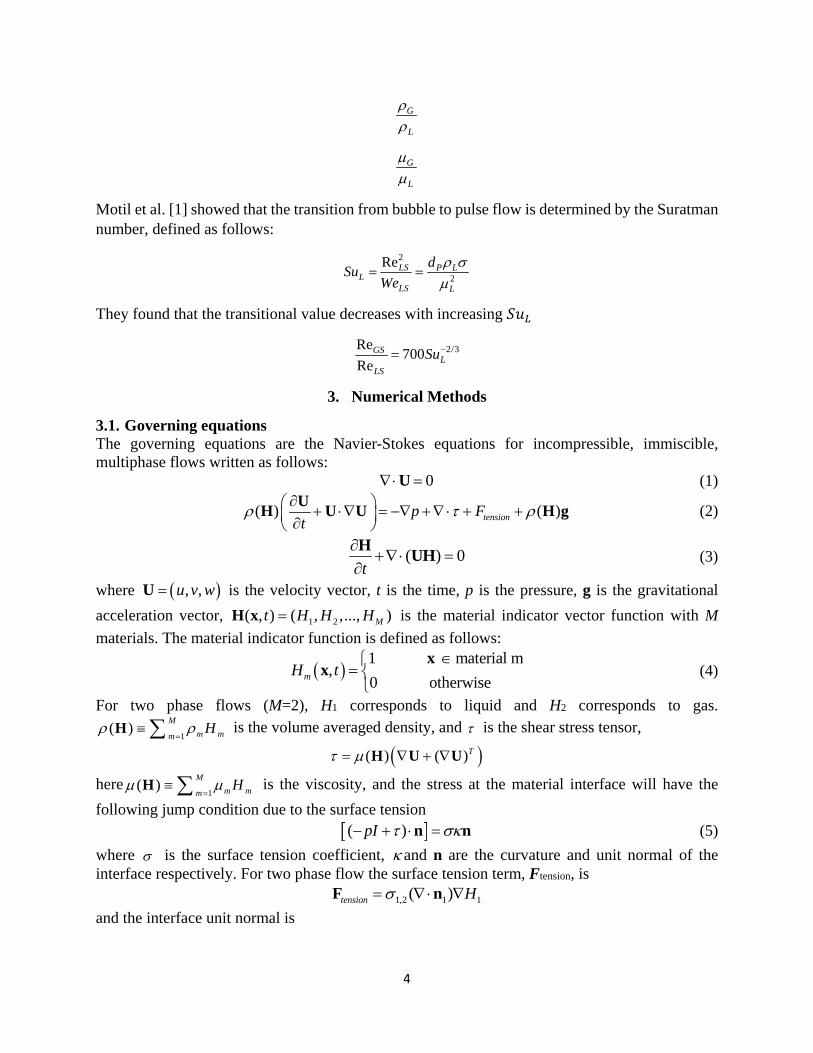
2. Key Parameters in two-phase PBRs
For two-phase flow packed bed reactor filled with uniformly sized spheres, the variables influencing the hydrodynamics are the liquid and gas superficial velocities ( , , viscosities
, and densities ( , , liquid-solid surface tension ( , the sphere diameter ( , the bed
diameter ( ,and the gravitational acceleration ( . The following dimensionless parameters characterize the two-phase flow
Re G GS pGS
G
U d
Re L LS pLS
L
U d
2
L LS pLS
U dWe
4
G
L
G
L
Motil et al. [1] showed that the transition from bubble to pulse flow is determined by the Suratman number, defined as follows:
2
2
ReLS P LL
LS L
dSu
We
They found that the transitional value decreases with increasing
2/3Re700
ReGS
LLS
Su
3. Numerical Methods
3.1. Governing equations The governing equations are the Navier-Stokes equations for incompressible, immiscible, multiphase flows written as follows: 0 U (1)
( ) ( )tensionp Ft
U
H U U H g (2)
( ) 0t
H
UH (3)
where , ,u v wU is the velocity vector, t is the time, p is the pressure, g is the gravitational
acceleration vector, 1 2( , ) ( , ,..., )Mt H H HH x is the material indicator vector function with M
materials. The material indicator function is defined as follows:
1 material m
,0 otherwisemH t
xx (4)
For two phase flows (M=2), H1 corresponds to liquid and H2 corresponds to gas.
1( )
M
m mmH
H is the volume averaged density, and is the shear stress tensor,
( ) ( )T H U U
here1
( )M
m mmH
H is the viscosity, and the stress at the material interface will have the
following jump condition due to the surface tension ( )pI n n (5)
where is the surface tension coefficient, and n are the curvature and unit normal of the interface respectively. For two phase flow the surface tension term, Ftension, is
1,2 1 1( )tension H F n
and the interface unit normal is
5
11
1
H
H
n
3.2. Moment of fluid interface reconstruction The moment of fluid method [15-19] has been developed for computing the motion of deforming boundary problems. In the MOF method, we represent the material m distribution with its volume fraction in each computational cell
1/2 1/2 1/2
1/2 1/2 1/2
, 1( )
i j k
i j k
x y zi mm mx y z
i
F H dzdydxx y z
x (6)
where , and i i m are the volume of cell (i,j,k) and volume of material m in the cell. The centroid
of the material in the cell
1/2 1/2 1/2
1/2 1/2 1/2
1/2 1/2 1/2
1/2 1/2 1/2
( )
( )
i j k
i j k
i j k
i j k
x y z
mx y z
m x y z
mx y z
H dzdydx
H dzdydx
x xx
x (7)
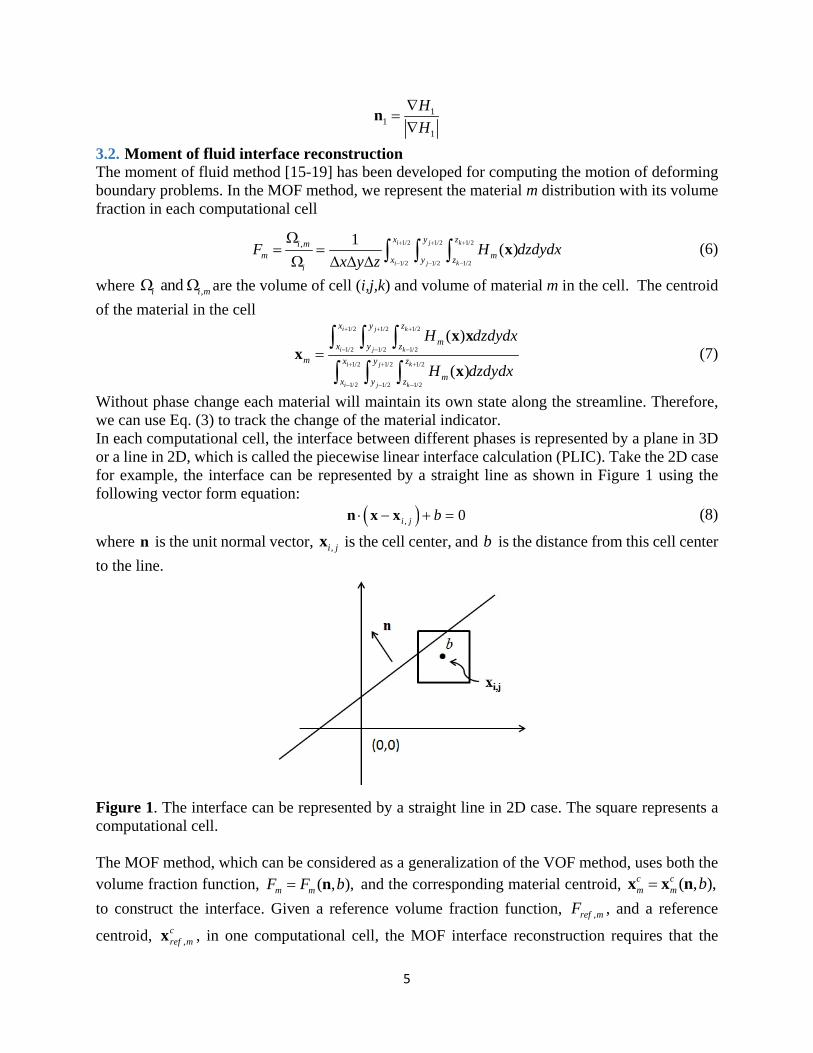
Without phase change each material will maintain its own state along the streamline. Therefore, we can use Eq. (3) to track the change of the material indicator. In each computational cell, the interface between different phases is represented by a plane in 3D or a line in 2D, which is called the piecewise linear interface calculation (PLIC). Take the 2D case for example, the interface can be represented by a straight line as shown in Figure 1 using the following vector form equation: , 0i j b n x x (8)
where n is the unit normal vector, ,i jx is the cell center, and b is the distance from this cell center
to the line.
Figure 1. The interface can be represented by a straight line in 2D case. The square represents a computational cell. The MOF method, which can be considered as a generalization of the VOF method, uses both the volume fraction function, ( , ),m mF F b n and the corresponding material centroid, ( , ),c c
m m bx x n
to construct the interface. Given a reference volume fraction function, ,ref mF , and a reference
centroid, ,cref mx , in one computational cell, the MOF interface reconstruction requires that the
6
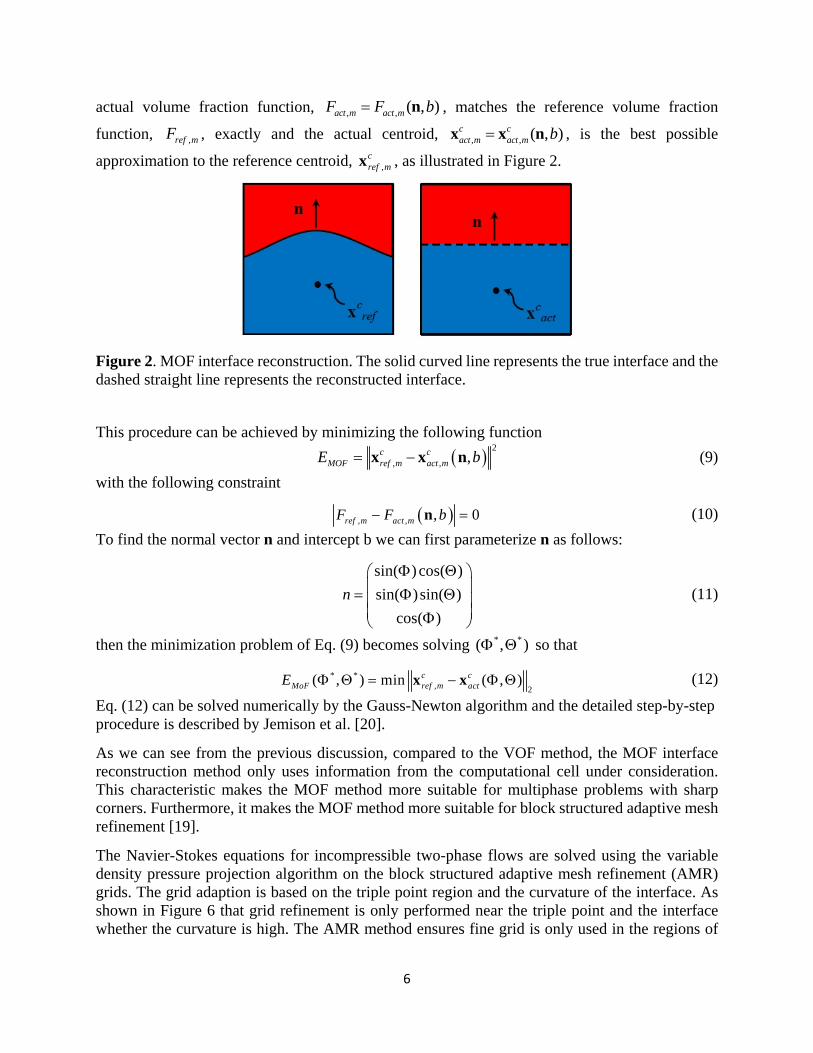
actual volume fraction function, , , ( , )act m act mF F b n , matches the reference volume fraction
function, ,ref mF , exactly and the actual centroid, , , ( , )c cact m act m bx x n , is the best possible
approximation to the reference centroid, ,cref mx , as illustrated in Figure 2.
Figure 2. MOF interface reconstruction. The solid curved line represents the true interface and the dashed straight line represents the reconstructed interface.
This procedure can be achieved by minimizing the following function
2
, , ,c cMOF ref m act mE b x x n (9)
with the following constraint
, , , 0ref m act mF F b n (10)
To find the normal vector n and intercept b we can first parameterize n as follows:
sin( ) cos( )
sin( )sin( )
cos( )
n
(11)
then the minimization problem of Eq. (9) becomes solving * *( , ) so that
* *, 2
( , ) min ( , )c cMoF ref m actE x x (12)
Eq. (12) can be solved numerically by the Gauss-Newton algorithm and the detailed step-by-step procedure is described by Jemison et al. [20].
As we can see from the previous discussion, compared to the VOF method, the MOF interface reconstruction method only uses information from the computational cell under consideration. This characteristic makes the MOF method more suitable for multiphase problems with sharp corners. Furthermore, it makes the MOF method more suitable for block structured adaptive mesh refinement [19].
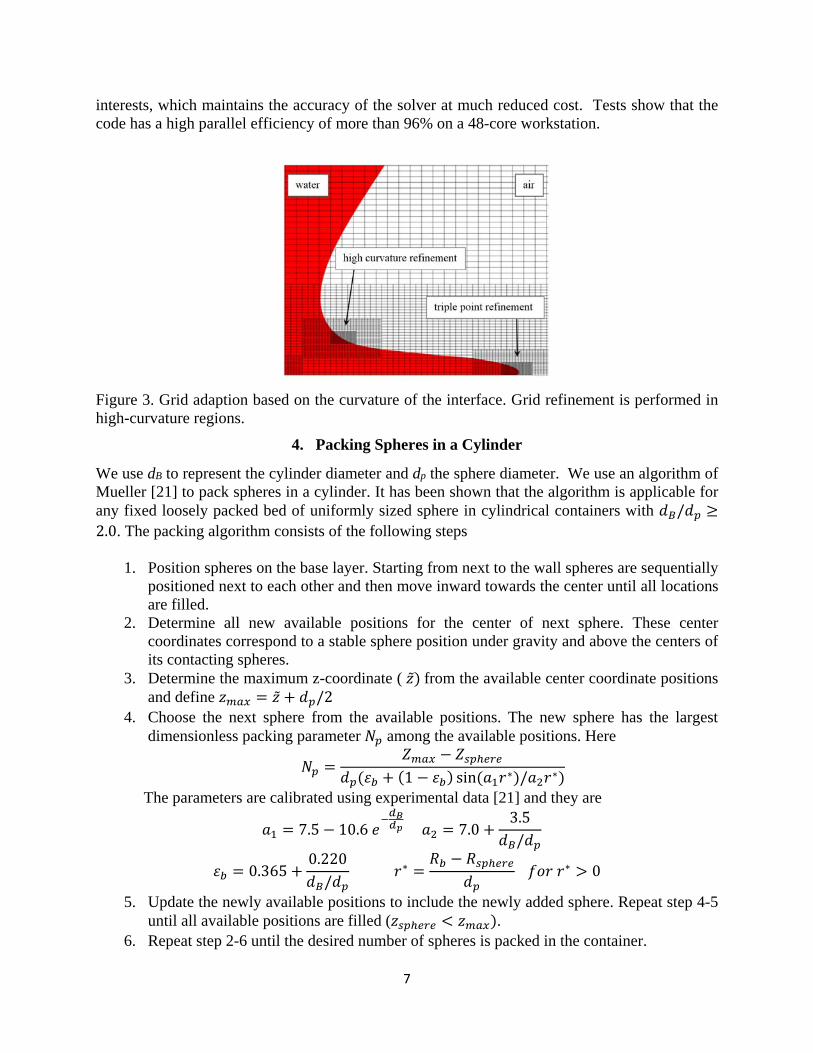
The Navier-Stokes equations for incompressible two-phase flows are solved using the variable density pressure projection algorithm on the block structured adaptive mesh refinement (AMR) grids. The grid adaption is based on the triple point region and the curvature of the interface. As shown in Figure 6 that grid refinement is only performed near the triple point and the interface whether the curvature is high. The AMR method ensures fine grid is only used in the regions of
7
interests, which maintains the accuracy of the solver at much reduced cost. Tests show that the code has a high parallel efficiency of more than 96% on a 48-core workstation.
Figure 3. Grid adaption based on the curvature of the interface. Grid refinement is performed in high-curvature regions.
4. Packing Spheres in a Cylinder
We use dB to represent the cylinder diameter and dp the sphere diameter. We use an algorithm of Mueller [21] to pack spheres in a cylinder. It has been shown that the algorithm is applicable for any fixed loosely packed bed of uniformly sized sphere in cylindrical containers with /2.0. The packing algorithm consists of the following steps
1. Position spheres on the base layer. Starting from next to the wall spheres are sequentially positioned next to each other and then move inward towards the center until all locations are filled.
2. Determine all new available positions for the center of next sphere. These center coordinates correspond to a stable sphere position under gravity and above the centers of its contacting spheres.
3. Determine the maximum z-coordinate ( ̃ from the available center coordinate positions and define ̃ /2
4. Choose the next sphere from the available positions. The new sphere has the largest dimensionless packing parameter among the available positions. Here
1 sin ∗ / ∗
The parameters are calibrated using experimental data [21] and they are
7.5 10.6 7.03.5/
0.3650.220/
∗ ∗ 0
5. Update the newly available positions to include the newly added sphere. Repeat step 4-5 until all available positions are filled ( .
6. Repeat step 2-6 until the desired number of spheres is packed in the container.
8
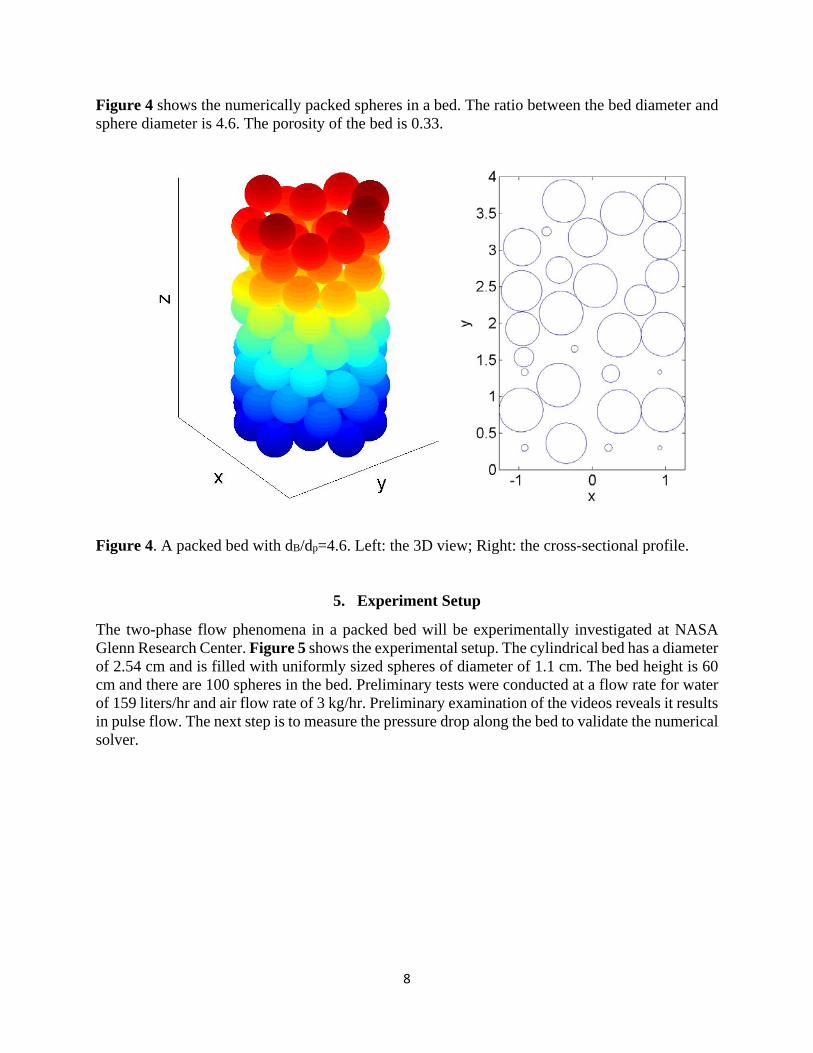
Figure 4 shows the numerically packed spheres in a bed. The ratio between the bed diameter and sphere diameter is 4.6. The porosity of the bed is 0.33. Figure 4. A packed bed with dB/dp=4.6. Left: the 3D view; Right: the cross-sectional profile.
5. Experiment Setup
The two-phase flow phenomena in a packed bed will be experimentally investigated at NASA Glenn Research Center. Figure 5 shows the experimental setup. The cylindrical bed has a diameter of 2.54 cm and is filled with uniformly sized spheres of diameter of 1.1 cm. The bed height is 60 cm and there are 100 spheres in the bed. Preliminary tests were conducted at a flow rate for water of 159 liters/hr and air flow rate of 3 kg/hr. Preliminary examination of the videos reveals it results in pulse flow. The next step is to measure the pressure drop along the bed to validate the numerical solver.

9
Figure 5. Experimental setup of the packed bed. The bed diameter is 2.54 cm and sphere diameter is 1.1 cm.
6. Preliminary Results
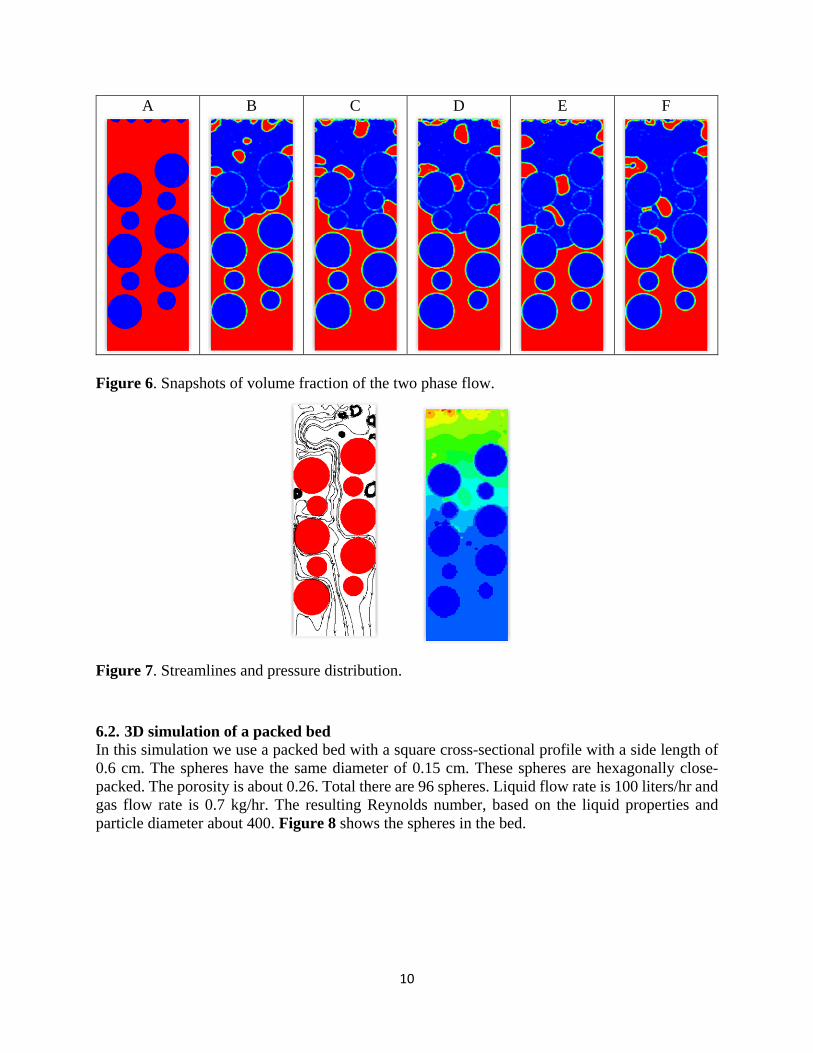
6.1. 2D simulation of a packed bed A cross section of a packed bed is chosen for simulation. The cylindrical bed has a diameter of 2.54 cm and the uniformly sizes spheres have a diameter of 1.1 cm. Only 10 spheres are used in the study. The cross section of the bed is shown in Figure 6. The sphere cross sections are shown in blue. The bed is initially filled with air (red). Water (blue) and air are injected from the top at the same speed of 3 cm/s (Figure 6A). Water is flowing downward due to gravity and air is pushed downward by the water downward and also toward the walls (Figure 6B). As shown in Figure 6C and D two air bubbles merge into one on the left side of the wall. The bigger air bubble remains attached to the wall and blocks the water flow. In Figure 6E and F one bigger air bubble breaks into two.
Figure 7 shows the streamlines and pressure distribution at one time instant. It is clear that flow passes through the bed mainly along the center line whether porosity is high. Behind the solid particles flow velocity is generally low and circulations are observed. Pressure gradient is observed along the bed: high pressure on the top portion of the bed and low pressure at the bottom.
10
A B C D E F
Figure 6. Snapshots of volume fraction of the two phase flow.
Figure 7. Streamlines and pressure distribution.
6.2. 3D simulation of a packed bed In this simulation we use a packed bed with a square cross-sectional profile with a side length of 0.6 cm. The spheres have the same diameter of 0.15 cm. These spheres are hexagonally close-packed. The porosity is about 0.26. Total there are 96 spheres. Liquid flow rate is 100 liters/hr and gas flow rate is 0.7 kg/hr. The resulting Reynolds number, based on the liquid properties and particle diameter about 400. Figure 8 shows the spheres in the bed.

11
Figure 8. Hexagonal close-packed spheres. The spheres have uniform diameter of 0.15 cm. The porosity is 0.26.
In the simulation both water and gas are injected from the inlet. The liquid jet is positioned at the center and has a diameter is 0.3 cm. Figure 9 shows the snapshots of gas distribution (in blue) at different time instants. Liquid is apt to move along the walls where the porosity is high.
Figure 9. Liquid distribution at different time instants. Shown is the iso-surface contours of the liquid. Liquid is moving along the walls where the porosity is higher than the central region.
12
7. Conclusions and Future Work
Packed bed reactor was studied using an integrated experimental and numerical method. Preliminary experimental results showed that operation resulted in pulse flow. Further experiments will be conducted to obtain the pressure distribution along the packed bed to validate the numerical solver. Preliminary numerical simulations revealed bubble merge and breakup when the air passed through the bed. Flow was observed to mainly go through regions of high porosity. Our next step is to compare the numerical results with the measured pressure distribution from the experiments. Different flow rates will be also tested. Comparisons will be made between terrestrial gravity and microgravity conditions.
References 1. Motil, B.J., V. Balakotaiah, and Y. Kamotani, Gas–liquid two‐phase flow through packed beds in
microgravity. AIChE journal, 2003. 49(3): p. 557‐565. 2. SATO, Y., et al., Flow pattern and pulsation properties of cocurrent gas‐liquid downflow in packed
beds. Journal of Chemical Engineering of Japan, 1973. 6(4): p. 315‐319. 3. Ng, K., A model for flow regime transitions in cocurrent down‐flow trickle‐bed reactors. AIChE
journal, 1986. 32(1): p. 115‐122. 4. Charpentier, J.C. and M. Favier, Some liquid holdup experimental data in trickle‐bed reactors for
foaming and nonfoaming hydrocarbons. AIChE Journal, 1975. 21(6): p. 1213‐1218. 5. Lockhart, R. and R. Martinelli, Proposed correlation of data for isothermal two‐phase, two‐
component flow in pipes. Chem. Eng. Prog, 1949. 45(1): p. 39‐48. 6. Khadilkar, M., et al., Comparison of trickle‐bed and upflow reactor performance at high pressure:
model predictions and experimental observations. Chemical Engineering Science, 1996. 51(10): p. 2139‐2148.
7. Wu, Y., et al., Comparison of upflow and downflow two‐phase flow packed‐bed reactors with and without fines: experimental observations. Industrial & engineering chemistry research, 1996. 35(2): p. 397‐405.
8. Holub, R.A., Hydrodynamics of trickle bed reactors. 1990. 9. Ishii, M., Thermo‐fluid dynamic theory of two‐phase flow. NASA STI/Recon Technical Report A,
1975. 75: p. 29657. 10. Drew, D.A., Mathematical modeling of two‐phase flow. Annual review of fluid mechanics, 1983.
15(1): p. 261‐291. 11. Jiang, Y., et al., CFD of multiphase flow in packed‐bed reactors: I. k‐Fluid modeling issues. AIChE
Journal, 2002. 48(4): p. 701‐715. 12. Lutran, P.G., K.M. Ng, and E.P. Delikat, Liquid distribution in trickle‐beds. An experimental study
using computer‐assisted tomography. Industrial & Engineering Chemistry Research, 1991. 30(6): p. 1270‐1280.
13. Ravindra, P., D. Rao, and M. Rao, Liquid flow texture in trickle‐bed reactors: an experimental study. Industrial & engineering chemistry research, 1997. 36(12): p. 5133‐5145.
14. Levec, J., K. Grosser, and R. Carbonell, The hysteretic behavior of pressure drop and liquid holdup in trickle beds. AIChE journal, 1988. 34(6): p. 1027‐1030.
15. Dyadechko, V. and M. Shashkov, Moment‐of‐fluid interface reconstruction. Los Alamos report LA‐UR‐05‐7571, 2005.
16. Ahn, H.T. and M. Shashkov, Multi‐material interface reconstruction on generalized polyhedral meshes. Journal of Computational Physics, 2007. 226(2): p. 2096‐2132.
13
17. Dyadechko, V. and M. Shashkov, Reconstruction of multi‐material interfaces from moment data. Journal of Computational Physics, 2008. 227(11): p. 5361‐5384.
18. Ahn, H.T. and M. Shashkov, Adaptive moment‐of‐fluid method. Journal of Computational Physics, 2009. 228(8): p. 2792‐2821.
19. Jemison, M., et al., A Coupled Level Set‐Moment of Fluid Method for Incompressible Two‐Phase Flows. Journal of Scientific Computing, 2012: p. 1‐38.
20. Jemison, M., M. Sussman, and M. Arienti, Compressible, Multiphase Semi‐Implicit Method with Moment of Fluid Interface Representation. Submitted to Journal of Computational Physics, 2013.
21. Mueller, G.E., Numerically packing spheres in cylinders. Powder technology, 2005. 159(2): p. 105‐110.