INVESTIGATION of DRY HORIZONTAL STIRRED MILLING ...
182
INVESTIGATION of DRY HORIZONTAL STIRRED MILLING APPLICATIONS FOR CEMENT GRINDING CIRCUITS KURU YATAY KARIŞTIRMALI DEĞİRMEN TEKNOLOJİSİNİN ÇİMENTO ENDÜSTRİSİNDE KULLANIM OLANAKLARININ ARAŞTIRILMASI OKAY ALTUN Prof. Dr. A. HAKAN BENZER Supervisor Submitted to Institute of Graduate Studies in Science of Hacettepe University as a partial fulfillment to the requirements for the award of the degree of DOCTOR OF PHILOSOPHY in MINING ENGINEERING 2013
Transcript of INVESTIGATION of DRY HORIZONTAL STIRRED MILLING ...

INVESTIGATION of DRY HORIZONTAL STIRRED MILLING
APPLICATIONS FOR CEMENT GRINDING CIRCUITS
KURU YATAY KARIŞTIRMALI DEĞİRMEN
TEKNOLOJİSİNİN ÇİMENTO ENDÜSTRİSİNDE KULLANIM OLANAKLARININ
ARAŞTIRILMASI
OKAY ALTUN
Prof. Dr. A. HAKAN BENZER
Supervisor
Submitted to Institute of Graduate Studies in Science
of Hacettepe University as a partial fulfillment
to the requirements for the award of the degree of
DOCTOR OF PHILOSOPHY
in
MINING ENGINEERING
2013

This study named “Investigation of Dry Horizontal Stirred Milling Applications for Cement Grinding Circuits” by OKAY ALTUN has been accepted as a thesis for the degree of DOCTOR OF PHILOSOPHY in MINING ENGINEERING by the below mentioned examining committee members.
Head
Prof. Dr. Ali İhsan AROL
Supervisor
Prof. Dr. A. Hakan BENZER
Member
Prof. Dr. Ş. Levent ERGÜN
Member
Prof. Dr. Zafir EKMEKÇİ
Member
Assist. Prof. Dr. İlkay Bengü ÇELİK
This thesis has been approved as a thesis for the degree of DOCTOR OF PHILOSOPHY in MINING ENGINEERING by the Board of Directors of the Institute of Graduate Studies in Science of Hacettepe University.
Prof. Dr. Fatma SEVİN DÜZ
Director of the Institute of
Graduate Studies in Science

In loving memory of my beloved father
İsmail Oktay ALTUN (1953-…)

ETHICS
In this thesis study, prepared in accordance with the spelling rules of Institute of Graduate Studies in Science of Hacettepe University,
I declare that
all the information and documents have been obtained in the base of the academic rules
all audio-visual and written information and results have been presented according to the rules of scientific standards
in case of using other works, related studies have been cited in accordance with the scientific standards
all cited studies have been fully referenced
I did not do any distortion in the data set
And any part of this thesis has not been presented as another thesis study at this or any other university
26 / 06 / 2013
Okay ALTUN
i
ABSTRACT
INVESTIGATION of DRY HORIZONTAL STIRRED MILLING
APPLICATIONS FOR CEMENT GRINDING CIRCUITS
OKAY ALTUN
Doctor of Philosophy, Mining Engineering Department
Supervisor: Prof. Dr. A. HAKAN BENZER
June 2013, 170 pages
Within the thesis study, possible applications of dry horizontal stirred mill were
investigated for cement industry where fine grinding is prominent with regards to
improved product quality. The main objectives of this work were to determine
grinding problems, to study the effects of design and operating variables on
grinding performance, to optimize the milling operation, to carry out modelling
studies and then use these models in order to simulate different cement grinding
circuit configurations where stirred mills were employed.
In this context, dry horizontal stirred mill was developed with the partnership of
Netzsch-Feinmahltechnik and commissioned at a cement plant. Different flow
streams of the grinding circuit were sampled and then subjected to grinding
operation under different operating conditions. Within the scope of the
experimental studies, the influences of the parameters affecting the specific
energy consumption of the mill such as stirrer speed, media filling, media size,
feed rate were investigated. In addition to those, the influences of material and
design variables i.e., feed size distribution, mill chamber geometry and stirrer type
were assessed. Throughout the studies, experimental studies were performed with
two chamber designs having 23 L and 42 L volume and three different stirrer
types.

ii
As a result of the experimental studies it was understood that, material
transportation was a parameter influencing the grinding performance directly and
in case of adjusting the grinding chemical type and dosage, besides the air flow
from the feed inlet properly, 18% improvement in product quality was achievable.
Stirrer speed affected the product fineness however below 4.34 m/s and above 6.5
m/s the effectiveness of the parameter decreased. Media loading of the mill was
needed to be maximized. The studies indicated that, in case the rest of the
operating parameters were constant, 50% increase in Blaine value could be
observed when media loading was changed from 30% to 60%. In this study, the
advantages of using fine media were reported. With this mill configuration and
material, it was determined that up to 27% energy saving was achievable with the
use of 4 mm media size when compared to 6 and 8 mm. The experimental studies
with different mill chamber geometries and stirrer types showed that 42 L mill had
better grinding performance (compared to 23 L) besides disc type stirrer provided
more energy efficient grinding operation.
Following the performance evaluation studies, the benefits of employing dry
horizontal stirred mill on cement grinding circuits were discussed with the aid of
simulation studies. In this context, simulation scenarios for open and closed circuit
grinding operations were prepared. The studies showed that energy saving up to
35% was achievable when dry horizontal stirred mill was used with open circuited
ball mill and 16% decrease in specific energy consumption could be observed with
the closed circuit configuration. In addition to energy saving, the overall circuit
production could be increased by %100.
Keywords: Dry stirred mill, stirred mill, cement grinding, fine grinding.

iii
ÖZET
KURU YATAY KARIŞTIRMALI DEĞİRMEN TEKNOLOJİSİNİN
ÇİMENTO ENDÜSTRİSİNDE KULLANIM OLANAKLARININ
ARAŞTIRILMASI
OKAY ALTUN
Doktora, Maden Mühendisliği Bölümü
Danışman: Prof. Dr. A. HAKAN BENZER
Haziran 2013, 170 sayfa
Bu tez çalışması kapsamında, kuru yatay karıştırmalı değirmen teknolojisinin ince
öğütmenin önem arz ettiği çimento endüstrisinde kullanım olanakları araştırılmıştır.
Çalışmanın temel amaçları, değirmende oluşabilecek öğütme sorunlarını tespit
etmek, tasarım ve işletme değişkenlerinin öğütme performansına olan etkilerini
incelemek, değirmen için en uygun işletme koşullarını belirlemek, modelleme
çalışmalarını yürütmek ve sonrasında bu modelleri farklı çimento öğütme devresi
alternatiflerinin simülasyonu sırasında kullanmak olarak sıralanabilir.
Bu amaçla Netzsch-Feinmahltechnik firması ile birlikte yatay karıştırmalı değirmen
geliştirilmiş ve çimento öğütme devresinde kurulmuştur. Halihazırda çalışan
çimento öğütme devresinde farklı akış kollarında örnekleme çalışmaları
yürütülmüş ve bu malzemeler farklı işletme koşullarında öğütme işlemine maruz
bırakılmıştır. Deneysel çalışmalar kapsamında, değirmende özgül enerji tüketimini
etkileyen karıştırıcı hızı, bilya doluluğu, bilya boyu, besleme hızı değişkenlerinin
etkileri incelenmiştir. Bunlara ek olarak malzeme ve tasarım değişkenleri olan
malzeme besleme boyu, değirmen haznesi ve karıştırıcı tipi etkileri de denemeler
kapsamında değerlendirilmiştir. Çalışmalar süresince 23 Litre ve 42 Litre hacim

iv
değerine sahip öğütme haznelerinde ve üç farklı karıştırıcı tipinde deneysel
çalışmalar gerçekleştirilmiştir.
Yürütülen çalışmalar neticesinde malzeme taşınmasının, kuru öğütmenin
verimliliğini etkileyen önemli bir değişken olduğu ve kimyasal tipi ve dozajının
ayrıca değirmen besleme bölümünden verilen havanın uygun oranlarda
ayarlanması durumunda ürün kalitesinde %18 değerine varan iyileştirme olduğu
belirlenmiştir. Karıştırıcı hızının değirmenden alınan ürünün inceliğini etkilediği
ancak 4.34 m/s değerinin altında ve 6.5 m/s değerinin üzerinde etkisini yitirdiği
tespit edilmiştir. Değirmende bilya doluluğunun olabilecek en yüksek seviyede
tutulması gerektiği belirlenmiştir. Diğer işletme koşulları sabit kalmak koşuluyla,
bilya doluluğunun %30 değerinden %60’a çıkarılması ile Blaine değerinde %50
oranında artış olduğu tespit edilmiştir. Çalışmalar neticesinde değirmende ince
bilya kullanımının avantajlı olduğu ve mevcut tasarım için kullanılabilecek en ince
bilya boyunun 4 mm olduğu belirlenmiştir. Ayrıca iri bilyaya kıyasla besleme
boyuna bağlı olarak %27’ye varan enerji tasarrufu sağladığı da gözlemlenmiştir.
Değirmen tasarım değişkenleri olan öğütme haznesi ve karıştırıcı tipinin de
öğütme performansını etkilediği, daha büyük hacim değerine sahip haznenin
öğütme performansının daha iyi olduğu (42 Litre) ve disk tipi karıştırıcının da diğer
tasarımlara oranla daha enerji verimli olduğu anlaşılmıştır.
Performans çalışmalarını takiben yürütülen simülasyon çalışmaları ile çimento
öğütme devresinde farklı noktalarda kullanılan kuru yatay karıştırmalı değirmenin
devreye sağladığı katkılar tartışılmıştır. Çalışmalar, açık devre çimento
öğütmelerinde karıştırmalı değirmenlerin son öğütmede kullanılması durumunda
%35, kapalı öğütme devrelerinde ise %16’ya varan enerji tasarrufu sağladığı
belirlenmiştir. Enerji tasarrufuna ek olarak devre üretim kapasitelerinde %100’e
varan artış tespit edilmiştir.
Anahtar kelimeler: Kuru karıştırmalı değirmen, karıştırmalı değirmen, çimento
öğütme, ince öğütme
v
ACKNOWLEDGEMENTS
I owe a debt of sincere thanks to;
The Head of Hacettepe University Mine Engineering Department who helped me
to benefit from the department’s resources,
Prof. Dr. A. Hakan BENZER, my distinguished thesis supervisor, who put forward
his both financial and moral support during thesis preparation phase and stated his
opinions during the process of adding value to this specific topic, Prof. Dr. Ş.
Levent ERGÜN and Prof. Dr. Zafir EKMEKÇİ, who are the thesis monitoring
committee members,
Udo ENDERLE, the Managing Director of Netzsch Feinmahltechnik, who provided
equipment and technical support, Levent ONAT, the previous Quality Manager of
Set Italcementi, who provided support in laboratory studies, Murat AKAY, the
quality chief of SET Ankara Cement Plant and Kerim DOĞAN, the plant production
manager of SET Ankara Cement Plant, Alper TOPRAK, Konuray DEMİR, Dr.
Namık AYDOĞAN, Dr. Hakan DÜNDAR and A. SARGIN, my valuable colleagues
who helped me in experimental studies and helped this thesis to develop,
Assoc. Prof. Dr. Abdullah OBUT and Assoc. Prof. Dr. Aubrey MAINZA, for their
valuable contributions during thesis writing process,
To F. Çiğdem ALTUN, my precious mother, who never avoided her financial and
moral support during my tiring studying period and made endless contributions to
my current success, Okan ALTUN my one and only brother who had stood by me
with his character-wise stance, Deniz ALTUN, my wife, who have been playing a
supportive role on my decisions with the love, respect and her objective attitude
since she walked into my life, and her precious family,
Emre YILMAZKAYA, Ediz KANBİR and Yelda YAMATMA, my distinguished
friends who always stood by me with their friendship, Dr. Serkan DİKMEN,
Neslihan TOK, department technicians Mustafa YILMAZ and Işın ASLIYÜKSEK,
department secretary Sıddık YILMAZOĞLU and Birgül ATAY,
I would like also to thank Hacettepe University Research Foundation Unit (Project
No: 013 T06 604 006) for their financial support.
vi
TABLE of CONTENTS
ETHICS ................................................................................................................... ii
ABSTRACT .............................................................................................................. i
ÖZET ...................................................................................................................... iii
ACKNOWLEDGEMENTS........................................................................................ v
TABLE of CONTENTS ........................................................................................... vi
1. INTRODUCTION ............................................................................................. 1
2. STIRRED MEDIA MILL ................................................................................... 8
2.1. Vertical Stirred Media Mills ........................................................................ 13
2.2. Horizontal Stirred Media Mills .................................................................... 18
2.3. Comparison between Vertical and Horizontal Stirred Mills ........................ 22
2.4. Operating Parameters and Their Influences on Grinding Performance of
Stirred Mill ......................................................................................................... 26
2.4.1. Stirrer Speed ....................................................................................... 26
2.4.2. Media Size and Density ....................................................................... 28
2.4.3. Media Filling ........................................................................................ 30
2.4.4. Feed Rate ........................................................................................... 31
2.4.5. Mill Geometry ...................................................................................... 31
2.4.6. Rheology of the material (Grinding aids) ............................................. 32
2.5. Motion of Suspension and Single Grinding Media ..................................... 33
2.5.1. Motion of Suspension .......................................................................... 33
2.5.2. Motion of Single Grinding Media ......................................................... 35
2.6. Modelling Studies ...................................................................................... 37
2.6.1. DEM Models ........................................................................................ 37
2.6.2. PEPT Technique ................................................................................. 38

vii
2.6.3. Stressing Models ................................................................................. 39
2.7. Scale-up of Stirred Mills ............................................................................. 44
3. EXPERIMENTAL STUDIES & INITIAL TESTWORKS .................................. 46
3.1. Description of the Experimental Apparatus ................................................ 46
3.1.1. Internal Structure of Dry Horizontal Stirred Mill ................................... 48
3.1.2. Power Draw Measurements ................................................................ 50
3.2. Sampling & Material Characterization Studies ........................................... 52
3.3. The Observations during Initial Test Works ............................................... 57
3.3.1. Grinding Problems with 23 L Mill ......................................................... 57
3.3.2. Grinding Problems with 42 L Chamber ................................................ 59
3.4. Reproducibility of the Grinding Results ...................................................... 62
4. INFLUENCES of OPERATING and DESIGN PARAMETERS on GRINDING
PERFORMANCE ................................................................................................. 64
4.1. The Effects of Grinding Chemicals ............................................................ 64
4.1.1. The tests with EPCT-04 (Glycol-based chemical) ............................... 65
4.1.2. The tests with EPCT-02 (Triethanolamine (TEA)-based chemical) ..... 67
4.1.3. The tests with EPCT-01 (Triisopropanolamine (TIPA)-based chemical)
...................................................................................................................... 69
4.1.4. Comparison of the Chemical Performances ........................................ 71
4.2. The Effects of Air Flow Rate ...................................................................... 73
4.3. The Effects of Stirrer Speed ....................................................................... 74
4.4. The Effects of Feed Rate ........................................................................... 79
4.5. The Effects of Media Filling ........................................................................ 81
4.6. The Effects of Ball Size .............................................................................. 84
4.6.1. 4-6 mm Comparison ............................................................................ 84
4.6.2. 4-6-8 mm Comparison ......................................................................... 85
4.6.3. 4-3 mm Comparison ............................................................................ 86

viii
4.7. The Effects of Feed Size Distribution ......................................................... 88
4.7.1. Grinding Tests Performed with Final Product Stream ......................... 89
4.7.2. Grinding Tests Performed with Separator Reject Stream .................... 93
4.7.3. Grinding Tests Performed with Mill Filter Return Stream .................... 97
4.7.4. Performance Evaluation of Stirred Mill at Different Feed Fineness ... 101
4.8. The Effects of Mill Geometry .................................................................... 104
4.9. The Effects of Stirrer Type ....................................................................... 108
5. MODELLING of DRY HORIZONTAL STIRRED MILL ................................. 112
6. SIMULATION STUDIES .............................................................................. 121
6.1. Selected Circuit Configurations for Simulation Studies ............................ 121
6.2. Mass Balance and Model Fitting of the Circuits ....................................... 125
6.3. Simulation Scenarios Prepared for Dry Stirred Mill Operation ................. 129
6.3.1. The Use of Dry Horizontal Stirred Mill in Finish Grinding .................. 129
6.3.2. The Use of Dry Horizontal Stirred Mill on Filter Return Stream ......... 133
7. RESULTS and DISCUSSIONS ................................................................... 136
8. CONCLUSIONS .......................................................................................... 143
REFERENCES ................................................................................................... 144
APPENDICES .................................................................................................... 152
CURRICULUM VITAE ........................................................................................ 169

1
1. INTRODUCTION
The purpose of this thesis study is to provide information on the design and
application of a new dry stirred fine grinding mill. The application of this mill was
focussed on the cement industry but can be extended to other commodities.
Cement production is an intensive energy use process. Nowadays the cement
manufacturers are pushing the operational limits of their existing cement grinding
circuits as the demand for high quality product and high production capacities
have steadily been increasing. These circumstances cause already inefficient
grinding circuits to be operated even more inefficiently that is thought to be
overcome by introducing innovative solutions.
Increased demand on efficient grinding technologies had pushed machine
manufacturers to search for new milling mechanisms. Until now wide varieties of
mill mechanisms have been developed to improve energy efficiency of
comminution operations. Napier-Munn et al. [1] classified the mills aiming to
process different types of materials according to their operating size ranges and
energy consumption values as given in Figure 1.1. As can be seen from Figure
1.1, many mills are available from coarse to fine end and the selection totally
depends on the application.
Figure 1.1. Energy figures of different mills [1]
Among the technologies given in Figure 1.1 , stirred media mills have been used in
fine and ultra-fine grinding applications. They are among the proven technologies
used in PGM, gold, copper-zinc processing plants for wet grinding purpose. In

2
particular, it had been reported that the use of IsaMill® in McArthur River and
George Fisher ores, where grind size P80 of 7 µm was required, improved flotation
recoveries for both zinc and lead ores by 5-10% [2]. Successive wet operations
raised the question as to whether it is applicable in dry milling which is expected to
be prominent in the future due to the environmental reasons (CO2 emissions,
water recovery and water efficiency). As mentioned previously cement industry is
in need of energy efficient equipment to reduce CO2 emissions and to decrease
energy consumptions. Therefore the use of stirred mill in cement grinding area can
be considered as one of the step changes. In this study, possible applications of
stirred mill technology on cement grinding circuits were investigated. For this
purpose a prototype dry stirred mill was developed and several experimental
studies were performed.
Dry stirred media mill technology can be employed where fine grinding is required.
It is possible to develop various circuit alternatives improving energy efficiency of
the circuit without deteriorating cement quality. Moreover, the quality deficiencies
coming from compression machines used in finish grinding (VRM or HPGR) could
be regulated by the use of stirred mills. In the following figures simplified flow
sheets of possible circuit configurations are illustrated.
In Figure 1.2, stirred milling application on mill filter return stream is illustrated. In
some of the cases the fineness of mill filter return stream does not meet the final
product specifications therefore it is fed to the separator feed stream again. It is
thought that the use of stirred mill on this stream would increase throughput rate of
the circuit up to a certain extent.
Figure 1.2. Filter return stream application of dry horizontal stirred mill

3
The use of a stirred mill on the separator reject stream may be another alternative
(Figure 1.3). In general, because of high circulating loads of the grinding circuits,
by-pass of the air separators may reach up to 30%. That means considerable
amount of unclassified material is recirculated back into the mill that overloads the
circuit. It is thought that stirred milling on this stream would grind that size of
material down to a finer size range thus improving the energy efficiency of the
operation.
Figure 1.3. Separator reject stream application of dry horizontal stirred mill
Stirred milling technology may also be applied on final product stream. In Figure
1.4 and Figure 1.5 possible circuit configurations are illustrated. In these
configurations, the grinding circuits would be pushed to produce coarser product
then stirred mill technology would perform further grinding to obtain the target size
resulting in increased capacity. It is thought that open circuit configuration (Figure
1.5) would benefit more from stirred milling compared to closed circuit. Because
such a circuit design would provide more flexible operation in terms of controlling
the product size and increasing throughput rate.

4
Figure 1.4. Final product stream application of dry horizontal stirred mill for closed circuit cement grinding
Figure 1.5. Final product stream application of dry horizontal stirred mill for open circuit cement grinding
Cement manufacturing process was used as a starting point of using dry
horizontal stirred mills. After successful application of the technology, the
experience would be transferred to the mineral grinding applications in circuits
where dry grinding is required. As the ultimate aim is to grind an ore in an efficient
way, in the near future it is highly possible to design flow sheets comprising only
HPGR, air classifier and dry stirred mill (Figure 1.6, Figure 1.7) [3] or VRM
followed by dry stirred milling (Figure 1.8).

5
Figure 1.6. Grinding circuit with closed circuited HPGR (VSK separator) and dry stirred mill
Figure 1.7. Grinding circuit with closed circuited HPGR (with two-stage air classifier) and dry stirred mill

6
Figure 1.8. Grinding circuit with VRM and dry stirred mill
As mentioned above, there would be wide range of applications for dry horizontal
stirred mill if it is operated efficiently and provide benefits to the grinding circuit in
terms of energy saving and production rate increase. Within the context of the
study several experimental studies were performed with a prototype dry horizontal
stirred mill developed by Netzsch-Feinmahltechnik GmbH. The mill was
commissioned at a cement plant where sampling campaigns were carried out at
different streams of the circuit, final product, separator reject, and mill filter return.
As a result, various feed size distributions were tested and the performance of the
mill was assessed. The sampling studies around stirred mill was performed when
the mill reached to a steady state condition which was understood by observing
power draw and production rate of the mill. Provided that both of the parameters
were steady, then the samples were collected and subjected to characterization
works. In terms of characterization, size distributions, surface area and strength
properties was determined.
Throughout comprehensive test studies, understanding the behaviour of milling
operations was aimed initially. In this context, grinding problems and solutions, the
influences of operating parameters, i.e., stirrer speed, media filling, material
rheology, air flow rate inside the mill, media size, feed size distribution, mill
geometry and stirrer type were investigated and compared with the related
literature. After all, the relationships between the energy utilization and size
reduction values were developed that was used to assess the mill performance.
The performance data was then used to optimize the milling conditions.

7
Within the context of the thesis, modelling of dry horizontal stirred mill was
accomplished with the perfect mixing approach. These model structures were
used to simulate various circuit configurations that stirred mills were employed. In
this context, the applications on finish grinding for open and closed cement
grinding circuits and mill filter return stream were investigated. The results were
promising that lead to save energy as well as the increase in production rate of the
overall grinding circuits. Finally, a scaling-up methodology was developed for dry
horizontal stirred mill irrespective of mill geometry.

8
2. STIRRED MEDIA MILL
Stirred media milling is not a new concept; it is a well-known process since 1928.
In 1928, Klein and Szegvari proposed a mill model operating in wet mode with
agitators on the shaft and using spherical grinding media inside. The first industrial
scale operation of stirred mills found in 1948 in pigment grinding for paint and
lacquer industries [4]. Since that time, many developments have taken place and
now many types are available for industrial use. In Table 2.1 the applications of
stirred media mills, where reducing feed size of 100 µm down to 1-10 µm is
required, are presented [4; 5].
Table 2.1. Stirred media milling applications
Industry Product
Paint + lacquer
primer coating
Lacquer
dispersion paints
Ink
printing inks
textile inks
activating pigment crudes
Food industry
cocoa nibs
milk chocolate
peanuts
Coal, energy
coal-oil mixture
coal-water slurries
gas turbines (micronized)
desulfurization
Minerals
limestone
filler industry
paper coatings
flue gas
kaoline
gypsum
aluminium oxide
precious metals liberation

9
Several types of stirred media mills have been developed so far for commercial
use. One of the earliest machines was a shot mill in which media size was in
range between 0.5 mm and 2 mm, and was fluidized by the disc type attritors
mounted on the shaft. Besides, a product separation zone was mounted inside of
the mill to prevent the discharge of media and unground material [6].
In the late 30’s, the USBM developed an attritor mill aiming to clean the surface of
minerals to improve their flotation efficiency (Figure 2.1). The attritor was then
used for grinding purpose. The USBM attritor mill had water jacket surrounding mill
shell and cage type rotor that turned in a stator. This machine was then modified
and patented by Union Process and named as Szegvari attritor system (Figure
2.2). Szegvari mill was also in a water jacketed container where the media was
fluidized by the attritors. The use of the water jacket was important especially
when processing heat sensitive materials such as metal oxide coatings.
Figure 2.1. USBM attritor grinding compartment [6]

10
Figure 2.2. Union process [6]
Stehr [4] illustrated modern stirred media mills of continuously operated as shown
in Figure 2.3. Those mills can be operated both in vertical and horizontal
configurations and the selection of the configuration depends on the process
variables such as viscosity, feed rate, density as well as the distribution of the
media along the mill chamber et cetera. The distribution of media directly affects
the performance of grinding operation therefore grinding chamber with equally
distributed media is the most preferable one.
Figure 2.3. Stirred media mill types [4]
In stirred mills, basically two types of agitators are available which are; perforated
disc and pinned agitator. The main difference between them is the method of
transferring the energy. The perforated discs transfer the energy to the

11
suspension–media mixture via adhesion forces while the pinned agitators transfer
the energy via force displacement. Because of its characteristics, the pinned type
agitator found its application in the processing of higher density media and high
viscosity material [4].
Innovation of the stirred media mills brought higher energy efficiencies, due to their
operational characteristics and particle breakage mechanism (mainly attrition), in
fine and ultrafine grinding applications when compared to conventional techniques
(ball mill). The energy efficiency of the stirred media milling is illustrated
graphically (Figure 2.4). The data gathered from vibratory ball mills, tumbling mills
and stirred media mills (in chalcopyrite grinding) indicate that at the same product
fineness, stirred media milling requires less amount of energy compared to the
vibrating ball mill and conventional ball mill in both wet and dry operation. Energy
efficient grinding operations at fine product sizes indicate these mills are well-
adapted to fine grinding applications [6].
Figure 2.4. Comparison of different grinding systems [6]
Energy efficient operation of stirred mills has been reported by different
researchers [7; 8; 9; 10; 11]. Figure 2.5 illustrates that the energy consumption of
the ball mill increases significantly below 75 µm product size and below 30 µm the
trend gets steeper compared to the stirred mills. Therefore, the stirred media mills
have found applications in regrinding, fine grinding and very fine grinding
operations. In addition to energy saving operations, some other properties of
stirred mills make them advantageous over ball mills. These are; lower capital
cost, lower installation cost, less floor space, fewer moving parts, less noise,
higher level of controllability, lower maintenance cost and greater operational
safety [12].

12
Figure 2.5. The energy comparison between ball mill and stirred mill [8]
Based on the features mentioned above, stirred media mill has proven its worth
and found worldwide applications in mineral industry. There are many types of
stirred mills available developed by different manufacturers which include;
Sala Agitated Mill or SAMTM (Grinding Division of Metso Group, UK)
MaxxMill® (Maschinenfabrik Gustav Eirich, Germany)
Vertimill®, SMD® (Metso)
Tower mill (Nippon Eirich , Japan)
IsaMillTM (Netzsch-Feinmahltechnik GmbH, Germany)
Referring to the list given above, the stirred media mills can be classified into two
[13] as shown in Figure 2.6.
Figure 2.6. The classification of stirred media mills [13]
13
2.1. Vertical Stirred Media Mills
In this section, the structures and operating principles of vertical stirred media mills
are explained briefly.
The history of vertical stirred media mills goes back to 1940’s when a prototype
mill was introduced into the Japanese mineral industry with financial support of
Asahi Glass Corp. Preliminary studies reported that less specific energy was
utilized when compared to the ball milling technology. Ultimately, a test mill was
manufactured and became a Tower Mill owned by Japan Tower Mill Company in
1965 [14]. Nowadays the Nippon Eirich has got the license for Tower Mill
production.
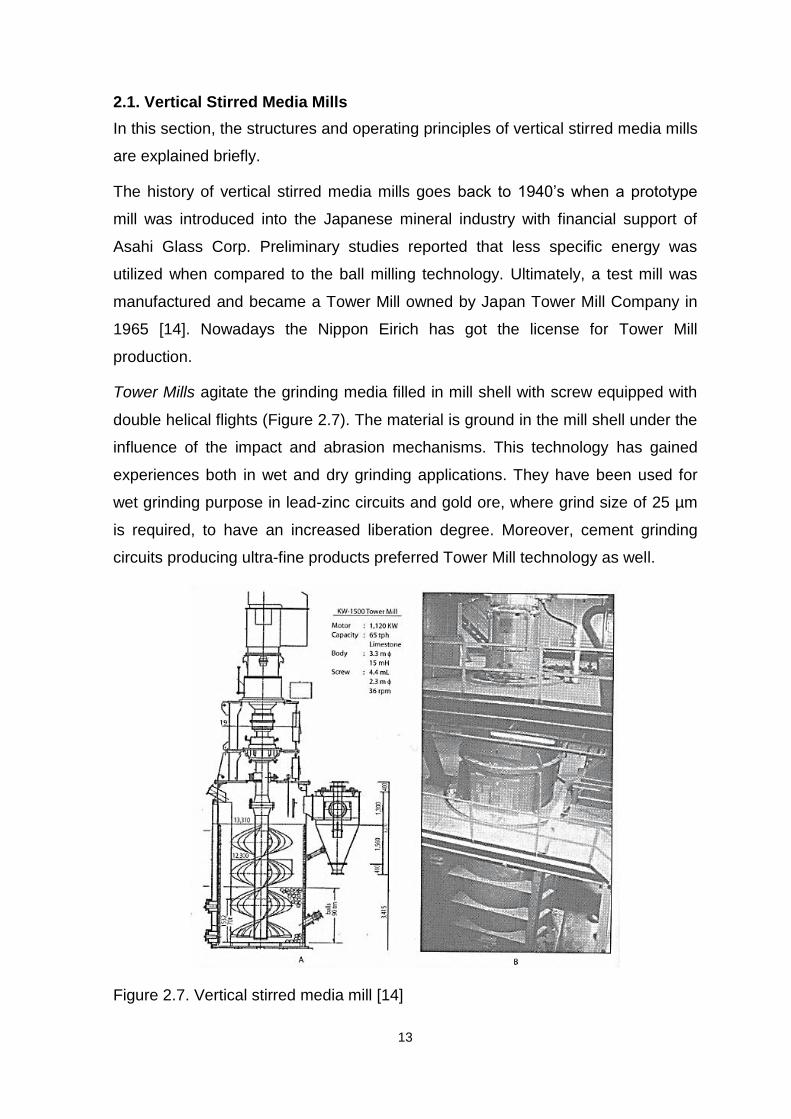
Tower Mills agitate the grinding media filled in mill shell with screw equipped with
double helical flights (Figure 2.7). The material is ground in the mill shell under the
influence of the impact and abrasion mechanisms. This technology has gained
experiences both in wet and dry grinding applications. They have been used for
wet grinding purpose in lead-zinc circuits and gold ore, where grind size of 25 µm
is required, to have an increased liberation degree. Moreover, cement grinding
circuits producing ultra-fine products preferred Tower Mill technology as well.
Figure 2.7. Vertical stirred media mill [14]

14
Eirich [15] reported that 242 mills had been sold in 15 different countries by the
end of 1998. The largest Tower Mill was manufactured for limestone grinding and
had a motor power of 1,120 kW and a capacity of 65 tph (Table 2.2).
Table 2.2. The specifications and the applications of Tower mill [15]
Type Power (kW)
Total Height (m)
Mill Diameter (m) Applications
ETM-20 22 5.6 0.7 Zinc ore/Slaked lime residue
ETM-50 55 6.9 1 Zinc oxide/Slaked lime
ETM-300 280 10.8 1.8 Limestone/Coaks/Zircon Sand
ETM-500 370 12.5 2.4 Limestone/Lead Zinc conc.
ETM-1500 1120 14.9 3.3 Limestone
SALA Agitated Mill (SAM) from Allis Mineral Systems GmbH (Figure 2.8) was
developed in 1986 to provide energy efficient grinding operation while producing
ultrafine particles. It was used both in wet and dry grinding applications. The mill
was limited with a maximum feed size of 0.5 mm so it was particularly preferred in
dry secondary grinding of high-strength cements, pigments and fillers down to P80
of 5 µm [16]. The SALA mill with motor power ranging from 7.5 to 200 kW and 50
tph maximum throughput was available for industrial use [16].

15
Figure 2.8. SALA agitated mill [16]
Metso Company [17] manufactured two stirred media mill models named as,
Vertimill® and SMD® (Figure 2.9). In the market Vertimills® with motor capacities
15 to 2240 kW and throughput rates up to 500 tph can be found and they are
capable of grinding material top size of 6 mm down to 20 µm [18].
Figure 2.9. The internal structure of Vertimill® (left) and SMD® [17]

16
Vertimills® (Figure 2.10) may be filled with different types of media, i.e., steel,
ceramic or natural pebbles, stirred by overhung double helix screw. The media is
risen within the screw flights and falls downward in the space between the flight
tips and the inside diameters of the mill body. The feed material enters into mill
body via a feed chute, which is placed on the top of the grinding chamber, and
initially subjected to a pre-classification by an uprising velocity provided by an
external recycle pump. In pre-classification process, the fine particles are removed
from inside the mill to prevent overgrinding, while the coarse particles are drawn
into the media and reground. The ground pulp overflows from the mill body and
moves into a splitter box. The splitter box is equipped with a dart valve and control
devices which splits the pulp into two streams; a process stream and a recycle
stream. The recycle stream is controlled to produce an optimum uprising velocity
in the mill body for the specific grinding application. Vertimills® can be operated
both in open and closed circuit configurations [19].
Figure 2.10. Vertimill® layout [19]
Metso company licensed the SMD® technology from ECC International and has
been in use since 1998 for submicron material production (<15 µm). SMD®
technology is able to process feed size up to 100 µm with slurry solid

17
concentration of 20-60% w/w [20]. The maximum installed power reported by the
manufacturers is 1,100 kW and depending on the ore type and the target fineness
specific energy consumptions range between 5-100 kWh/t. SMD® mills consist of
an octagonal body which supports the suspended internal multi-armed impeller.
Feed slurry enters through a port on the top of the detritor. The impellers
thoroughly mix the feed slurry with the media. A predominantly axial flow regime
throughout the grinding charge provides intense interparticle abrasion. This action
utilizes the applied energy and maximizes grinding efficiency. The axial flow within
the charge constantly circulates the particles across the media retention screens.
The milled product discharges through these screens that are located around the
top half of the unit. The launder collects the product as it flows through the screen.
The number of exit screens depends on the grinding requirements and the
required feed flow rate [20].
The MaxxMill® (Figure 2.11) manufactured by Maschinenfabrik Gustav Eirich
GmbH found applications in dry and wet fine grinding. The main internal
components of the mill are; rotating cylindrical grinding pan (1), one or two
eccentric agitators (2) and a static deflector of the material being ground
associated with the feeding tube (3). MaxxMills® may be operated at media fillings
up to 80% with media composition of 2-10 mm [21].
Figure 2.11. Schematic representation of MaxxMill® [21]
Feed material mixed with carrier fluid enters the machine through the pipe. The
fine material is sucked from the upper layer through the product outlet. The
coarser material of classifier together with fresh feed is fed to the mill from the
bottom of the chamber. Usually, the media inside the mill does not leave the

18
chamber, however, a sieve at the top is needed, in particular when processing
high viscous slurries, in order to prevent discharging of the media. MaxxMills® with
capacities ranging from 100 kg/h to 20 tph can be found depending both on the
material properties and the target fineness [3; 22; 23].
2.2. Horizontal Stirred Media Mills
In this section, operating principles and industrial applications of DRAIS mill and
IsaMill® are explained.
DRAIS (Direct Perl Horizontal Stirred Mill) mill was invented by Durr in 1976 [4].
Figure 2.12 illustrates auxiliary components and chamber of DRAIS mill [24].
Figure 2.12. DRAIS mill in wet grinding application [24]
In a DRAIS mill, the agitator having circumferential speed of 4 to 20 m/s is located
at the centre of the grinding chamber where media filling may reach up to 90% of
the effective volume. The water and solid components are fed separately then
conveyed via a screw feeder into the mill chamber. The pulp passing from the
inside of the mill is subjected to the grinding action and the product discharges
from the product outlet. Media types having various densities and diameters are
available for grinding purposes in a DRAIS mill (Table 2.3).

19
Table 2.3. The types of media
Density (g/cm3) Diameter (mm)
Sand 2.8 0.4-0.8
Hard glass 2.9 0.3-3.5
Zirconium oxide 5.4 0.5-3.5
Steel shot 7.6 0.2-1.5
Chrome steel 7.85 1-12
The largest DRAIS mill commissioned had 1000 L volume with motor power of 320
kW and throughput rate of 10 tph. They were employed for limestone, titanium
dioxide, barium sulfate and magnetic oxides grinding applications [4].
The IsaMill® was developed early in 1990s in a partnership between Netzsch-
Feinmahltechnik GmbH and McArthur River mine while aiming to find a solution for
an efficient fine grinding technique that would upgrade the concentrate and make
zinc deposit economical to mine. In order to upgrade the concentrate P80 of 7 µm
was targeted, where conventional grinding machines utilizes high specific energy
[25]. Therefore IsaMill® project was initiated. The chronology of the mill
development is given in Table 2.4.
Table 2.4. The chronology of IsaMill® development
Jan 1992 LME 100 model, powered by a 55 kW motor in pilot plant at Mt Isa
Nov 1992 LME 500 model, powered by 205 kW, then 250 kW at Hilton Concentrator, Mt Isa
Nov 1993 ISA 1500 model powered by a 900 kW motor installed in Lead/Zinc concentrator
Dec 1994 IsaMill M3000 powered by 1.1 mW motor installed in Lead/Zinc concentrator
Dec 2003 IsaMill M10000 powered by 2.6 MW motor installed at Anglo Platinum
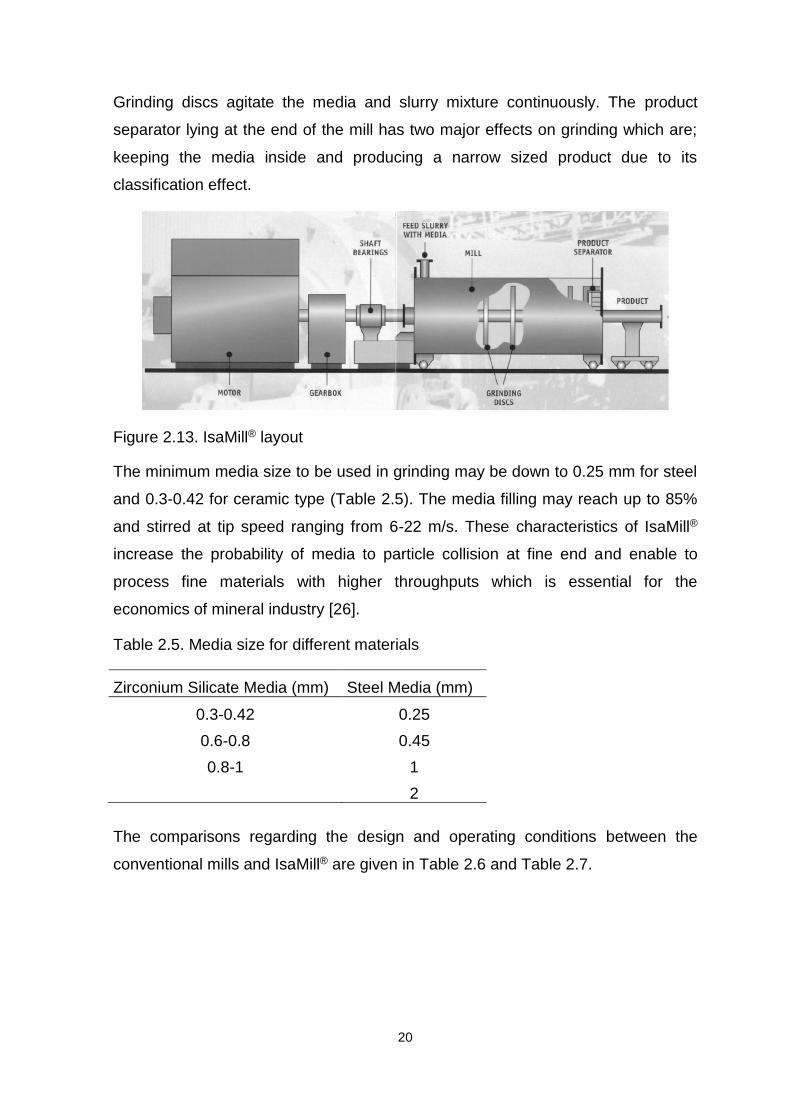
IsaMill® is a high speed horizontal mill having high power intensity. The layout of
IsaMill® is illustrated in Figure 2.13. The grinding shell, which can easily be moved
out for maintenance purpose, includes grinding discs mounted on the shaft.
20
Grinding discs agitate the media and slurry mixture continuously. The product
separator lying at the end of the mill has two major effects on grinding which are;
keeping the media inside and producing a narrow sized product due to its
classification effect.
Figure 2.13. IsaMill® layout
The minimum media size to be used in grinding may be down to 0.25 mm for steel
and 0.3-0.42 for ceramic type (Table 2.5). The media filling may reach up to 85%
and stirred at tip speed ranging from 6-22 m/s. These characteristics of IsaMill®
increase the probability of media to particle collision at fine end and enable to
process fine materials with higher throughputs which is essential for the
economics of mineral industry [26].
Table 2.5. Media size for different materials
Zirconium Silicate Media (mm) Steel Media (mm)
0.3-0.42 0.25
0.6-0.8 0.45
0.8-1 1
2
The comparisons regarding the design and operating conditions between the
conventional mills and IsaMill® are given in Table 2.6 and Table 2.7.

21
Table 2.6. Power intensities of different grinding devices [26]
Mill Diameter
(m)
Mill Length
(m)
Installed Power
(kW)
Mill Volume
(m3)
Power Intensity
(kW/m3)
Autogenous Mill 10 4.5 6400 353 18
Ball Mill 5 6.4 2600 126 21
Regrind Ball Mill 3.2 4.8 740 39 19
Tower Mill 2.5 2.5 520 12 42
IsaMill 1.3 3 1120 3 280
Table 2.7. Media size, power intensity and number of grinding balls for different mills
Media Size
(mm) No. Balls /
m3 Surface
Area
Ball Mill 20 95500 120
Tower Mill 12 440000 200
IsaMill 1 1150000000 3600
The agitator design affects the grinding performance of IsaMill® significantly. Up to
date, many types of agitators have been developed. The peg type agitator was
designed by Netzsch Feinmahltechnik and specifically used for grinding and
dispersing of carbon black heat set inks (Figure 2.14).
Figure 2.14. The John mill with short pegs [27]
A John mill [27] is another type of horizontal stirred mills which uses peg type
agitators. In contrast to other stirred mill geometries the grinding tank of John Mill

22
has counter pegs attached to it. As the media is accelerated by the pegs on the
shaft, it streams past the counter peg on the chamber wall creating extremely high
shearing and impact forces to tear the agglomerates apart. As the media streams
collide immediately after the peg, impact grinding occurs for particle size reduction.
This type is a proper selection for the operations with very high viscous pulps and
high solid rates. It can be operated up to 90% solid for industrial paint applications
[27].
In addition to peg type agitator, molinex type was also introduced into stirred
milling operations (Figure 2.15). Molinex discs are cast with half-moon shaped
cavity. The action of the discs is to accelerate the media centripetally from the
inner edge of the discs and centrifugally from the outer diameter of the disc. This
creates shearing and impact forces between the disc and the media next to the
disc. Molinex systems’ design is well adapted for ceramic applications or
processes requiring minimum contamination. In a typical grinding operation, solid
concentration ranges from 5 to 85% [27].
Figure 2.15. Molinex type agitator [27]
2.3. Comparison between Vertical and Horizontal Stirred Mills
As can be understood from Section 2.1 and Section 2.2, the main difference
between the vertical and horizontal structures comes from the operational
variations. Horizontal stirred mills can be operated at higher agitator speeds (6-22
m/s) and at lower media size (0.25 mm). These characteristics of horizontal mills
make them more energy efficient over the vertical configuration [26; 28]. In
addition to energy efficiency, the scaling-up of the mills is also an important
parameter for selecting the suitable configuration. The vertical stirred mills have

23
scale-up problems because of the start-up torque [26]. Manufacturers pointed out
that mechanical design of vertical mill was dominated by start-up torque on the
bottom stirrer after a shut-down. This dominated the design of stirrer and shaft. On
the other hand, in horizontal mills, many stirrers are available to stir the settled
load thus scale-up procedure was easier compared to vertical mills. Another
difference between the horizontal and the vertical configuration is the shape of the
product size distributions. It has been shown that the Tower Mill® produces
product with wider size distribution compared to IsaMill® at the same target size.
Because IsaMill® grinds coarser particles selectively and produces minimum
amount of fines resulting in producing product with narrow size distribution. This
behaviour of the mill provides better liberation of the valuable minerals and
maximizes the flotation recovery since the flotation feed is more uniform [26].
In the literature, the grinding performances of vertical and horizontal configurations
were compared. In one of the case studies, grinding performance of 4 L IsaMill®
and 40 L Tower Mill® were evaluated. IsaMill® was operated with 3.5 mm ceramic
media and the Tower Mill® was operated with 12 mm steel media. Each of the test
works was performed with feed material having 50% solid content [28]. Figure 2.16
illustrates the relationship between the specific energy consumption and P80 sizes
obtained from both mills. As can be seen from Figure 2.16, IsaMill® was able to
grind feed material down to 13 µm where the minimum product size that Tower
Mill® produced was 31 µm. Besides, IsaMill® utilized less energy in contrast to
Tower Milling® in particular below 65 µm range.

24
Figure 2.16. IsaMill® vs Tower Mill® in magnetite grinding [28]
The grinding performances of IsaMill® and Tower Mill® were also compared in lead
and zinc regrinding circuits. The regrind circuit shown in Figure 2.17 was part of
bulk lead/zinc retreatment circuit where the Tower Mill® was operated and there
were some over-grinding problems for galena-bearing minerals. Because of the
over-grinding problems, the circuit was modified and the IsaMill® followed by
Jameson Cell was commissioned (Figure 2.18). With the new configuration, the
overall lead recovery was increased by 5% [26].
Figure 2.17. Tower Mill® circuit configuration [26]

25
Figure 2.18. Modified lead regrind circuit [26]
In another case study, some laboratory tests were performed for a lead/zinc mine
demanding an increase in the overall throughput of the circuit (Figure 2.19) by
replacing the Tower Mill® technology with IsaMill® [29]. Preliminary laboratory tests
with 20 L IsaMill® implied that IsaMill® utilized less energy compared to the Tower
Milling (Figure 2.20). As can be seen from Figure 2.20, IsaMill® was able to
produce P80 of 45 µm to 50 µm, where the Tower Mill® produced P80 of 100 µm at
the same energy level.
Figure 2.19. Lead/zinc mine grinding section [29]

26
Figure 2.20. Energy-size reduction comparison between Tower Mill® and IsaMill®
[29]
2.4. Operating Parameters and Their Influences on Grinding Performance of Stirred Mill
Grinding in a stirred media mill is influenced by many parameters;
Stirrer type, speed
Media Size and density
Media filling
Throughput rate
Mill geometry
These parameters mainly affect the specific energy consumption of the mill that
ultimately influences the grinding performance [4; 11; 30; 31; 32].
In addition to design and operating conditions of the mill, slurry rheology should
also be taken into consideration while evaluating milling performance. In wet or dry
grinding processes, the slurry rheology can be modified by adding grinding
chemicals (grinding aid, dispersant) that affect the grinding operation directly.
2.4.1. Stirrer Speed
Stirrer speed mainly increases the probability of media to particle collision by
creating high energy intensity environment. It has been proved by many studies
that increasing stirrer speed increases the energy consumption and produces finer
product [3; 8; 32; 33; 34; 35; 36].
Sadler III et al. [36] in their study performed several grinding tests with batch
operated attrition mill at different stirrer speeds and measured the loss in weight of

27
(-400+350) µm fraction at different time intervals (Figure 2.21). They reported that
the higher the stirrer speed, the higher the loss in weight of fraction.
Figure 2.21. Effect of stirrer speed [36]
Fadhel and Frances [34] performed test works with horizontal Drais-Perl Mill and
plotted the grinding results at different stirrer speeds as a function of time of
grinding. As seen from Figure 2.22, increasing stirrer speed decreases the d50 of
the product.
Figure 2.22. Effect of stirrer speed [34]
Jankovic [8] from his studies on vertical stirred mills concluded that stirrer speed
and product size were inversely proportional to each other (Figure 2.23a) and also
showed that the use of smaller size media reduced the effect of stirrer speed
(Figure 2.23b).

28
Figure 2.23. Effect of stirrer speed (a) 1.7-1.2 mm media (b) 0.85-0.6 mm media [8]
2.4.2. Media Size and Density
Proper media size selection improves the efficiency of grinding process. In a
stirred mill operation, the use of smaller size media has two major effects on
grinding process which are; decreases the energy consumption due to the fluidity
of the bulk media and produces finer product [32; 37]. However, there is a lower
limit of media size that it becomes too small to grind the particles effectively.
Mankosa et al. [38] performed several test studies to investigate the influences of
media size on coal grinding. The results showed that the product size distribution
became finer and less energy was utilized when media size got finer. Fadhel and
Frances [34], Jankovic [8], Kwade et al. [39], Mende et al. [40], Persson and
Forssberg [41], Schollbach [42], Wang and Forssberg [43] also reported similar
results in their studies.
Figure 2.24. Effect of media size [38]

29
The grinding performance of media depends both on feed size and target size of
the product. Fadhel and Frances [34] in batch grinding tests proved that smaller
size media should have been preferred as the feed size to the mill got finer (Figure
2.25). They applied short and long grinding times and observed the changes in d50
at varying media size. Figure 2.25a illustrates test results obtained at short
grinding times. In this range (2.2-1.8) mm media size was found more effective
when compared to the other media size classes. This observation is the opposite
of what was seen with the finest media size (Figure 2.25b, 0.56-0.4 mm). It is
understood from the test works that there is an optimum ratio of Dball /Dparticle and
this has been a subject of many researchers.
Figure 2.25. Effect of media size (a) for short grinding times, (b) for longer grinding times [34].
Mankosa et al. [38] studied on determining the optimum ratio of Dball /Dparticle by
investigating the breakage rate of the grinding action (Figure 2.26). The studies
showed that breakage rate increased with increasing Dball/Dparticle ratio up to a point
that (20:1) media became too small to nip the particles. Zheng et al. [32] in their
study determined the optimum ratio of Dball/Dparticle as 12:1 to obtain efficient
grinding performance.

30
Figure 2.26. Effect of media size on breakage rate [38]
In stirred milling, major part of the energy is utilized in stirring and lifting the ball
charge. Therefore the change in media density influences the energy consumption
directly. In general, the use of denser media results in consuming more energy
compared to the lighter one [44]. Grinding media used for stirred milling can be
made up of various materials such as steel, slag, glass, ceramic etc. Zheng et al.
[32] investigated the operational differences between the steel and glass balls and
concluded that the use of steel balls resulted in obtaining better grinding
performance but consumed almost double of the energy utilized by the glass
beads. Mankosa et al. [38] also compared the performances of steel and glass
balls and found that the steel balls produced finer material. The benefits of using
higher density media were also reported by Farber et al. [37].
2.4.3. Media Filling
Media filling is a parameter affecting ball to material amount ratio, thus the product
fineness as well. Besides, the main effect of media filling is observed on the power
draw and the specific energy consumption. Generally, the mills are recommended
to be operated at maximum media fillings due to the improved grinding
performances. In order to prove the benefits of higher media fillings, Sadler III et
al. [36] changed the mill load gradually and measured the loss in each size fraction
for each case. They concluded that better grinding performances were achieved
when the mill was operated at higher media fillings (Figure 2.27). Similar results
were also reported by Persson and Forssberg [41] and Sivamohan and Vachot
[45].

31
Figure 2.27. Effect of mill charge on grinding performance [36]
2.4.4. Feed Rate
In any kind of grinding operation, specific energy is one of the most important
parameters related to the product fineness. The specific energy is a function of
feed rate, thus there is a direct correlation between the feed rate and the product
fineness as well. At the same media filling, it is expected that, decreasing the feed
rate increases the surface area of the product. Wang et al. [3] in their dry MaxxMill
studies (Figure 2.28) and Pilevneli et al. [35] in cement grinding tests investigated
the effects of feed rate on grinding performance and they concluded that feed rate
was inversely proportional to the product size.
Figure 2.28. Effect of feed rate on surface area of the product [3]
2.4.5. Mill Geometry
In a grinding process, the environment where grinding action takes place
influences the performance directly. In the literature some research studies
investigating the effects of mill geometry on stirred media mill performance are
reported.

32
Stender et al. [46] performed grinding tests at different mill geometries and media
sizes. The studies showed that the improved grinding performance was achieved
with the smallest grinding chamber (0.73 L) filled with fine media (355 µm). Zheng
et al. [32] in their study investigated the effects mill geometry on both torque (N.m)
of the stirrer and the product fineness (Figure 2.29). They performed various test
studies with different stirrer diameters (D) and mill diameters (T). It was revealed
that the diameter of stirrer affected the torque directly (Figure 2.29a). It was also
found that, reducing D/T ratio of mill resulted in obtaining coarser product (Figure
2.29b).
Figure 2.29. Effect of mill geometry on (a) the torque (b) the product fineness [32]
2.4.6. Rheology of the material (Grinding aids)
Grinding operation produces newly formed surfaces which are charged electrically.
Because of the electrical charges, the particles tend to agglomerate or coat on the
grinding media that lowers the efficiency of grinding process. Nowadays the
grinding chemicals have been widely used in various wet and dry grinding
applications to prevent agglomeration and coating on the media. Main function of
them is to neutralize the surface charges of particles [47; 48]. It was indicated by
some of the studies that the use of chemicals increased the overall throughput of
the process for a given product size by improving efficiency of the grinding and
classification operation [47].
Since the stirred media mills are used in ultrafine grinding applications, grinding
chemicals or surface modifiers are needed to carry out efficient grinding process.
In the literature, many studies explaining the effects of chemical on stirred milling
are reported. Kapur et al. [49] investigated the effects of chemicals on stirred
a
b

33
milling operation and concluded that the viscosity of the slurry was reduced
significantly with the use of chemicals. Zheng et al. [50] tested various types of
chemicals in limestone grinding with a stirred media mill. They concluded at the
same operating conditions that the surface area of the product could be doubled
with the use of proper chemical type. Choi et al. [51] in their stirred mill test works
showed that it was possible to reduce the utilized energy by 37% with the use of
grinding chemicals.
The operating and design parameters presented above mainly affect the specific
energy consumption of the grinding operation by influencing the motion of media
and suspension mixture inside the mill. In order to reveal the flow field
characteristics of the media and suspension, many studies have been performed
so far. In the following sections the theory behind the motion of media and
suspension in a stirred mill is presented.
2.5. Motion of Suspension and Single Grinding Media
2.5.1. Motion of Suspension
Blecher et al. [52] investigated the flow fields of fluid around an agitator under
laminar flow conditions (10≤Re≤2000). Figure 2.30 illustrates the results of the
calculations done in the non-dimensional r-z plane. The axis on the left lies to the
agitator shaft where the right axis is limited by the grinding wall. The bottom and
top boundaries of the figure represent the middle of the agitator disc and between
two discs respectively. As illustrated in Figure 2.30, with increasing radial distance
to the shaft, a velocity profile develops with decreasing values in z-direction. The
highest velocity gradients are found at the disc surface. When the profile on r-
direction is investigated, it is seen that, maximum speed occur at the outer radius
of the disc.

34
Figure 2.30. Flow field of fluid at Re=2000 [52]
In Figure 2.31, the streamlines investigating the motion of fluid is presented. It is
indicated that the fluid, which is under the influence of disc movement, is initially
directed towards the chamber wall then is diverted to the direction of the top
symmetry and finally flows back to the starting point. During the circulation of the
fluid, high gradient zones are observed at the disc surface, the chamber wall and
the gap between disc and wall.
Figure 2.31. Streamlines of the stirred fluid [52]
Theuerkauf and Schwedes [53] also investigated the flow field of fluid. In contrast
to studies conducted by Blecher et al. [52], the analysis were performed under
turbulent flow conditions. In Figure 2.32, the circumferential velocity gradients
calculated between two stirrer discs are illustrated. The solid line represents the
velocity of fluid. As seen from Figure 2.32, the velocity increases linearly until
R/Rtip=1. Then, a sudden decrease is observed and finally increases slightly again

35
at the zone of chamber wall due to the recirculating fluid between the wall and
stirrer.
Figure 2.32. Circumferential fluid velocity distributions at Re=16000 [53]
In Figure 2.33, radial and axial flow fields are given. The results imply that there
are mainly two high energy zones which are; around disc surface and at the
chamber wall. The studies also indicate that, within these zones, the velocity of
fluid does not exceed 24% of the stirrer speed.
Figure 2.33. Radial-axial fluid velocity distribution at Re=16000 [53]
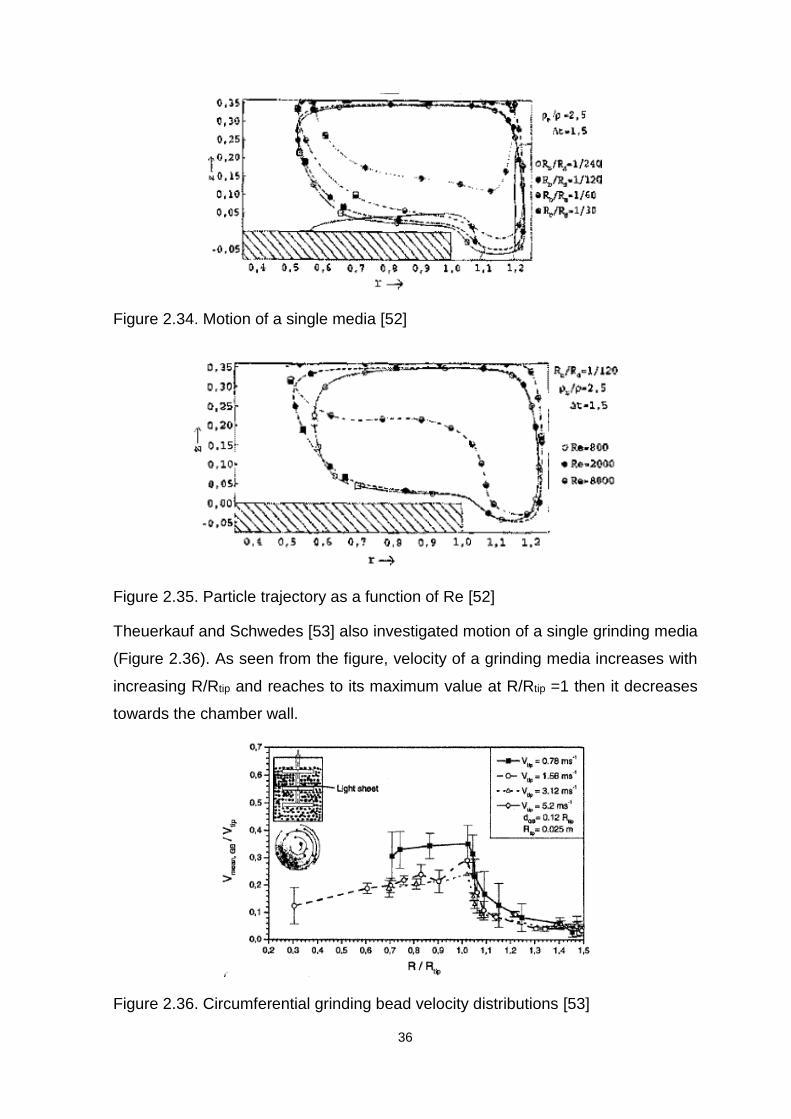
2.5.2. Motion of Single Grinding Media
In Figure 2.34, the study performed by Blecher et al. [52] investigating the motion
of different size of single media (Rball/Rattritor diameter) is illustrated. The studies
showed that the small size beads (Rb/Rd=1/240) followed a trajectory with high
energy zones in contrast to larger size beads. In Figure 2.35, the particle
trajectories as a function of Re number are illustrated. It is concluded that a
grinding media passes through the high energy zones (chamber wall and disc
surface) when Re number is between 800 and 2000.
36
Figure 2.34. Motion of a single media [52]
Figure 2.35. Particle trajectory as a function of Re [52]
Theuerkauf and Schwedes [53] also investigated motion of a single grinding media
(Figure 2.36). As seen from the figure, velocity of a grinding media increases with
increasing R/Rtip and reaches to its maximum value at R/Rtip =1 then it decreases
towards the chamber wall.
Figure 2.36. Circumferential grinding bead velocity distributions [53]

37
Eskin et al. [54] studied on analysing motion of a grinding media having different
densities with the aid of numerical calculations. It was concluded that the denser
media accumulated near the chamber wall while the lighter ones accumulated at
the centre of the chamber.
The motion analysis of media and suspension mixture emphasize the importance
of high energy zones. It is thought that better grinding performances are achieved
when most of the media passes through these zones. Blecher et al. [52] defined a
parameter called “motion index” that includes Reynold’s number, the size of media
and stirrer, the density of media and fluid parameters. They reported that for small
values of motion index, improved grinding performance was achieved owing to
having homogenously distributed media along the mill chamber. Conversely, it
was indicated that higher motion index values resulted in obtaining deteriorated
grinding performance.
2.6. Modelling Studies
For a better understanding of a grinding process it is useful to develop models
based on the flow characteristics of media and fluid. These models may then be
used to improve efficiency of grinding process. For this purpose, stressing models,
DEM (Discrete element method), CFD (Computational fluid dynamics) and PEPT
(Positron emission particle tracking) techniques have been developed to date.
2.6.1. DEM Models
Jayasundara et al. [55] had performed research studies on DEM modelling of
stirred mills. They characterized the particle flow in terms of microdynamic
variables (porosity, collision energy and collision frequency) and presented the
results as shown in Figure 2.37. Figure 2.37 indicates that at lower media fillings
and stirrer speeds, the particles are accumulated at the bottom of the chamber
therefore inefficient grinding environment is provided. On the other hand,
increasing either solid concentration or tip speed agitates the particles more
vigorously thus increases the probability of collision. Jayasundara et al. [55] also
examined the flow pattern of the particles and found that the particles near the
discs moved much faster than those around the chamber wall.

38
Figure 2.37. Axial view of mill chamber for different filling (Ø) and stirrer speed (s) a) Ø=40% s=300rpm b) Ø=60% s=300rpm c) Ø=60% s=800rpm [55]
Yang et al. [56] investigated the influences of operational conditions on the flow of
grinding media with the aid of DEM technique. The results showed that;
The lower media fillings resulted in accumulation of the media at the bottom
of the chamber.
Increasing the media filling increased flow velocity.
There was an optimum stirrer speed as further increase did not change the
flow velocity and energy dissipation.
Both tip speed and media filling had influence on power draw of the mill.
2.6.2. PEPT Technique
Positron Emission Particle Tracking (PEPT) method was developed to trace the
motion of a media in an IsaMill [57]. In this technique, glass or ceramic tracers are
made radioactive through bombardment in a cyclotron (Figure 2.38). Depending
on the activity of the tracer, stream lines are recorded every second and tracer
position is determined using triangulation routine [57].
PEPT technique was developed as an alternative method to DEM and in the
literature, results from comparison made between CFD, DEM and PEPT outputs
can be found [58].

39
Figure 2.38. PEPT camera [57]
2.6.3. Stressing Models
In stirred media mill, a grinding operation takes place between two grinding media
where the particles are stressed. However, the particles are stressed when they
are captured by the media and not carried by the fluid. Below, three cases of
particle stressing are listed;
Single particle stressing.
More than one particle is captured and all of them are stressed. In this case
the largest particle is subjected to the maximum stress.
A particle bed is captured and stressed.
Kwade [59] stated that the number of particles captured between two media was
function of solid concentration and particle size (x) and determined by ratio of
diameter of active volume between two grinding media (dact) (Figure 2.39) and
average distance between two particles in suspension.
Figure 2.39. Active volume [59]

40
In stressing models of stirred mill, two parameters come forward which are; the
intensity of stress and the number of stress events. In the next section
mathematical expressions of these parameters are presented.
2.6.3.1. Estimation of Stress Intensity
Kwade and Stender [60] reported that the stress intensity parameter was
influenced by the motion of grinding media which directly influences the grinding
performance of the mill. As explained in motion analysis section, grinding action
mainly takes place around stirrers and in the zone of chamber wall due to the
centrifugal action created by stirrer. As a result of this movement, media gain
kinetic energy and the theory relates stress intensity with the kinetic energy.
Kwade et al. [39] calculated stress intensity parameter as function of
circumferential speed of the discs, size and density of the media (Equation 2.1).
𝑆𝐼 = 𝐷𝑏3 ∗ (𝜌𝑏 − 𝜌) ∗ 𝑣𝑑
2 (2.1)
Where;
Db (m) : Size of the media
Vd (m/s) : Circumferential speed of the discs
ρb (t/m3) : Density of the media
ρ : Density of the material
In order to reveal the effects of stress intensity on grinding performance, Kwade et
al. [39] performed several studies with limestone at different stress intensity (SI)
and specific energy inputs. In Figure 2.40, change in median particle size as a
function of different operating conditions is presented. As seen from the figure, no
matter how much energy is applied, the trend of the curve does not change. The
median size decreases with increasing SI and reaches to a minimum point at a
certain level. Beyond this point the material starts to get coarser due to high
energy loses, therefore it is at the optimum value of stress intensity that efficient
operation is performed [46; 59; 61; 62; 63].

41
Figure 2.40. Product fineness as a function of stress intensity and specific energy [39]
2.6.3.2. Estimation of Number of Stress Events
Kwade [62] estimated number of stress events (Equation 2.2) as a function of
number of media contacts (Nc), the probability that a particle is caught and
stressed (Ps) and the number of product particles inside the mill (Np). Then the
mathematical expressions of each parameter were revealed.
𝑆𝑁 =𝑁𝑐𝑃𝑠
𝑁𝑝 (2.2)
The number of media contacts (Equation 2.3) is proportional to the number of
revolutions of the stirrer and number of grinding media in the chamber (NGM).
𝑁𝑐 ∝ 𝑛𝑡𝑁𝐺𝑀 ∝ 𝑛𝑡𝑉𝐺𝐶∅𝐺𝑀(1−𝜀)
𝜋
6𝑑𝐺𝑀3 (2.3)
Where;
n (s-1) : the number of revolutions of the stirrer per unit time
t (s) : the milling time

42
VGC (m3) : the volume of the grinding chamber
ØGM : the filling ratio of the grinding media
Ε : the porosity of the bulk of grinding media
dGM (m) : the diameter of the grinding media.
The probability of a particle to be caught and sufficiently stressed by grinding
media (Ps) depends both on material and the type of grinding process. In case of
grinding crystalline materials [62] the probability is proportional to the active
volume between two grinding media which is affected by the diameters of them
(Equation 2.4).
𝑃𝑠 ∝ 𝑑𝐺𝑀 (2.4)
As given in Equation 2.5, the number of product particles inside the mill (Np) is
proportional to the overall volume of them that is expressed as;
𝑁𝑃 ∝ 𝑉𝑃 = 𝑉𝐺𝐶(1 − ∅𝐺𝑀(1 − 𝜀))𝑐𝑉 (2.5)
When the equations of each parameter are put into Equation 2.2, Equation 2.6 is
obtained;
𝑆𝑁 ∝ 𝑛. 𝑡.∅𝐺𝑀(1−𝜀)
(1−∅𝐺𝑀(1−𝜀))𝑐𝑉
𝑥3
𝑑𝐺𝑀2 (2.6)
Where;
x : mean product size

43
In stirred milling, energy consumption of grinding operation correlates with stress
intensity and the number of stress events parameters (Equation 2.7). Kwade and
Stender [60] stated that constant grinding result, which is beneficial for scaling-up
of the mill, was achievable if the two of these parameters were kept constant.
Relations between these parameters are illustrated in Figure 2.41 and Figure 2.42.
𝐸 ∝ 𝑆𝐼. 𝑆𝑁 (2.7)
Figure 2.41 shows stress intensity-dependent change in energy utilization. The
points of signature plots produced at different stress intensity and energy levels for
a given median particle size (2 µm) shows that energy consumption decreases
until a certain value of stress intensity then it starts to increase [62]. The minimum
value of the curve is called as the optimum energy requirement for a specified
product size. Figure 2.42 illustrates the correlation between stress intensity and
stress number parameters. It indicates that these two parameters are inversely
proportional to each other. At very small stress intensities the trend tends to go
infinity indicating no evident comminution takes place.
Figure 2.41. Relation between stress intensity and specific energy [62]

44
Figure 2.42. Relation between stress intensity and stress number [62]
2.7. Scale-up of Stirred Mills
Scale-up of stirred mills is basically done with the data produced from grinding
tests performed with a small scale mill. As a result of the tests, calculated net
specific energy consumption is plotted against product size thus the material is
characterized in terms of energy-size reduction relationship. In the literature some
studies have been performed to compare the grinding results obtained from small
scale mill and the industrial one [64]. In Figure 2.43, grinding results of 4 L and
4000 L mill are given. It is understood that energy and size reduction relation of
the two mills are in the same trend. Consequently, scale-up of the mill is done from
small scale without any problem.
Figure 2.43. Energy consumption and P80 relation [64]

45
Curry et al. [65] also indicated that, scale-up procedure was applied successfully
from 4 L to 1000 L mill. Karbstein et al. [66] conducted several test works at
different mill chamber volumes and found that the grinding performances of
different mills were similar to each other (Figure 2.44). However the study reported
that, mill chamber volume should have been at least 1 L in order to produce
consistent results.
Figure 2.44. Grinding performance of different mill volumes [66]

46
3. EXPERIMENTAL STUDIES & INITIAL TESTWORKS
3.1. Description of the Experimental Apparatus
The experimental apparatus was the dry horizontal stirred mill. The dry horizontal
stirred mill used in this study was developed in a partnership with Netzsch-
Feinmahltechnik GmbH. Netzsch-Feinmahltechnik is the manufacturer of the
IsaMill® for wet grinding that had been applied in the fine grinding of platinum,
copper, zinc ores et cetera. Netzsch-Feinmahltechnik GmbH manufactures both
vertical and horizontal stirred mills, such as IsaMill®, however in this study
horizontal configuration was preferred due to its supposed operational benefits
explained in Section 2.3.
The structure of the dry machine is similar to the IsaMill®. Photographs of the key
components of the dry horizontal stirred mill used in the experiments are given in
Figure 3.1. A schematic of the equipment is provided in Figure 3.2. This is a novel
comminution device designed to produce fine particles from the feed in a dry
grinding environment. The key components for the operation of the mill are; control
panel, mill chamber, stirrer type and product separator. In this study, two types of
mill chambers having different volumes were used (Table 3.1). As given in Table
3.1, only the 23 L mill was built with a water jacket.
Figure 3.1. 23 L (on the left) and 42 L Mill (1-feed hopper, 2-control panel, 3-grinding chamber, 4-product outlet)
1 2
3
4
47
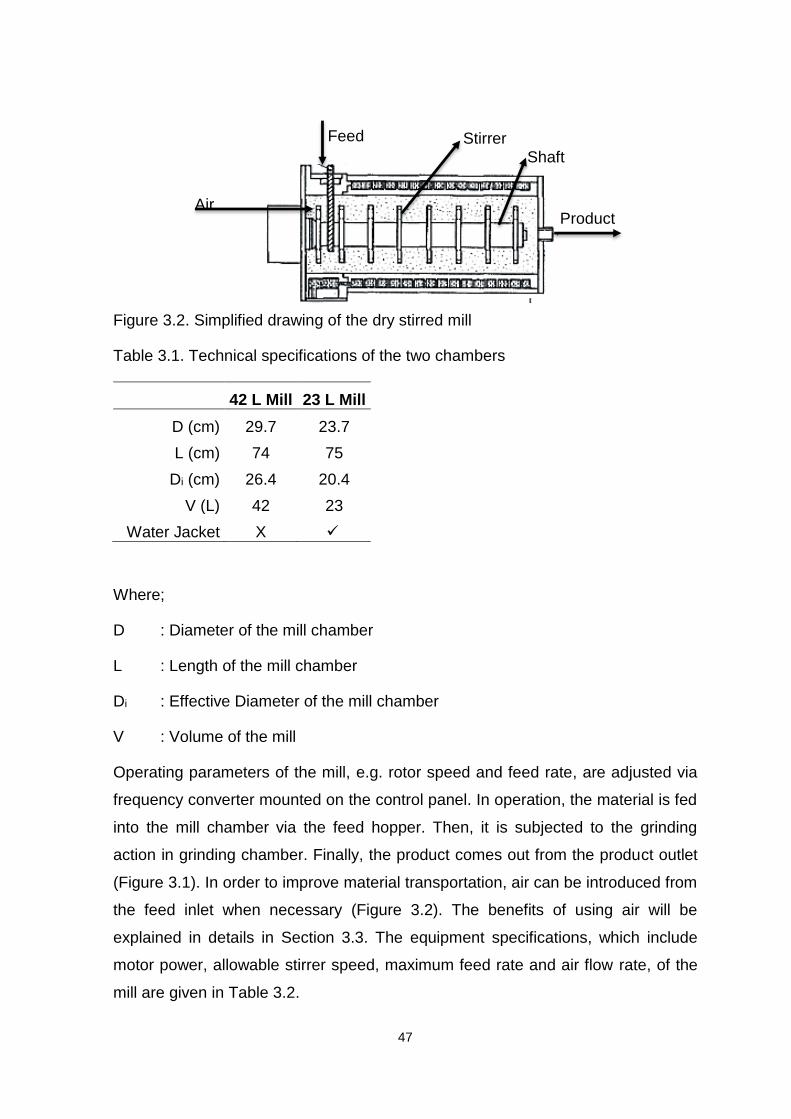
Figure 3.2. Simplified drawing of the dry stirred mill
Table 3.1. Technical specifications of the two chambers
42 L Mill 23 L Mill
D (cm) 29.7 23.7
L (cm) 74 75
Di (cm) 26.4 20.4
V (L) 42 23
Water Jacket X
Where;
D : Diameter of the mill chamber
L : Length of the mill chamber
Di : Effective Diameter of the mill chamber
V : Volume of the mill
Operating parameters of the mill, e.g. rotor speed and feed rate, are adjusted via
frequency converter mounted on the control panel. In operation, the material is fed
into the mill chamber via the feed hopper. Then, it is subjected to the grinding
action in grinding chamber. Finally, the product comes out from the product outlet
(Figure 3.1). In order to improve material transportation, air can be introduced from
the feed inlet when necessary (Figure 3.2). The benefits of using air will be
explained in details in Section 3.3. The equipment specifications, which include
motor power, allowable stirrer speed, maximum feed rate and air flow rate, of the
mill are given in Table 3.2.
Feed
Product Air
Stirrer Shaft

48
Table 3.2. Equipment specifications of the dry stirred mill for both chambers
Motor Power (kW) 18
Maximum Feed Rate (kg/h) 400
Stirrer Speed (m/s) 1.08 - 9.76
Maximum Air Flow rate (L/h) 1000
3.1.1. Internal Structure of Dry Horizontal Stirred Mill
A stirred mill, internally, is composed of a shaft on which the stirrers are mounted
and a product separator that lies at the end of the mill in order to keep the media
inside and discharge only the ground material. In this study, three types of stirrers
were used. Photographs of the stirrer types and product separator used in this
study are given in Figure 3.3 up to Figure 3.7.
Figure 3.3. The stirrer types 1-wing, 2-disc, 3-cross
Figure 3.4. Stirred mill with wing type stirrer
1
Discharge end
2
Wing Type Stirrer
3

49
Figure 3.5. Stirred mill with disc type stirrer
Figure 3.6. Stirred mill with cross type stirrer
Figure 3.7. Product separator
Discharge end
Disc Type Stirrer
Cross Type Stirrer

50
3.1.2. Power Draw Measurements
The literature reports that, power drawn by the stirred mill is influenced by media
density, media filling, media size, stirrer type, stirrer speed, grinding chemical
amount, pulp density and volume of the mill chamber parameters [67; 68; 69; 70].
In this section, power draw of the dry stirred mill was measured under different
conditions to investigate the effects of operating parameters.
The measured power draw of the mill is defined as gross power and it comprises
no load power (without media and material) together with the power consumed to
lift the media, material mixture. No load power is function of internal components’
specifications (shaft, stirrer type etc.). Therefore, a change in mill design affects
the no-load power directly. In order to have robust scaling-up operation, this no
load power is subtracted from gross power then a relationship between the net
specific energy consumption and size reduction (Equation 3.1, Equation 3.2) can
be evaluated. Such a finding is then used to calculate what size of mill motor is
required for a given size reduction at different throughputs.
Net Power Consumption (kW) = Gross Power-No Load Power (3.1)
Net Specific Energy Consumption (kWh/t) = Net Power/Throughput Rate (3.2)
The no load power measured at different type of stirrers are illustrated in Figure
3.8. No significant differences were observed between the stirrers tested at low
stirrer speeds. However above the speed of 6 m/s, disc type stirrer seems
advantageous as it draws slightly less power compared to the other types.
Therefore, the rest of the power measurements were performed with disc type
stirrer and the results are shown graphically in Figure 3.9 and Figure 3.10.

51
Figure 3.8. The influences of stirrer type on no load power draw
Figure 3.9 illustrates power draw measurements at different media fillings. The
following observations can be drawn:
Stirrer speed is directly proportional to power draw
As the media size decreases, less power is drawn by the mill for all
volumetric filling tested.
Figure 3.9. The influence of media size on power draw

52
When the measurements given in Figure 3.9 are classified for each media size,
Figure 3.10 is obtained. As seen from the figure, both media filling and stirrer
speed parameters are directly proportional to the power draw of the mill.
Figure 3.10. The influences of stirrer speed and media filling on power draw
3.2. Sampling & Material Characterization Studies
In order to carry out grinding tests with dry stirred mill, considerable amount of
sample was needed that could be collected directly from a cement grinding circuit.
In this context, a closed circuit grinding system was chosen (Figure 3.11) and
samples were collected with the aid of apparatus (Figure 3.12) prepared for
separator reject, final product and mill filter return streams. In this way, the mill
performance at varying feed size distribution was investigated as well. Sampling
studies were performed during CEM I 42.5R type cement and around 5 tons of
material was collected from each of the streams.

53
Figure 3.11. The flow sheet of the sampled cement grinding circuit
Figure 3.12. View of the sampler tool mounted on each stream
The typical size distributions and mean sizes of each stream are given in Figure
3.13 and Table 3.3 respectively. Additionally, the chemical compositions are given
in Table 3.4.
Figure 3.13. Typical size distributions of the sampled streams

54
Table 3.3. Mean size of each stream
d50 (µm)
Final Product 15
Mill Filter Return 25
Separator Reject 66
Table 3.4. The chemical composition of the sampled streams
Final Product Filter Return Separator Reject
CaO % 63.24 63.16 63.85
SiO2 % 19.65 20.10 20.61
Al2O3 % 4.91 5.70 5.88
Fe2O3 % 3.35 3.39 3.48
MgO % 2.00 2.31 2.27
SO3 % 3.04 2.21 1.62
K2O % 0.74 0.85 0.69
Na2O % 0.49 0.38 0.27
LOI % 2.62 1.90 1.29
Dry stirred mill test works commenced with the adjustment of operating conditions
evaluating the stirred mill performance and followed by sampling campaign around
the mill. Prior to sampling studies, steady state conditions of the mill were provided
that is, minimum fluctuations were observed in power draw and product tonnage.
Typical trends of the mill parameters until reaching the equilibrium stage is
illustrated in Figure 3.14.
Figure 3.14. The trends of the mill parameters until steady state condition
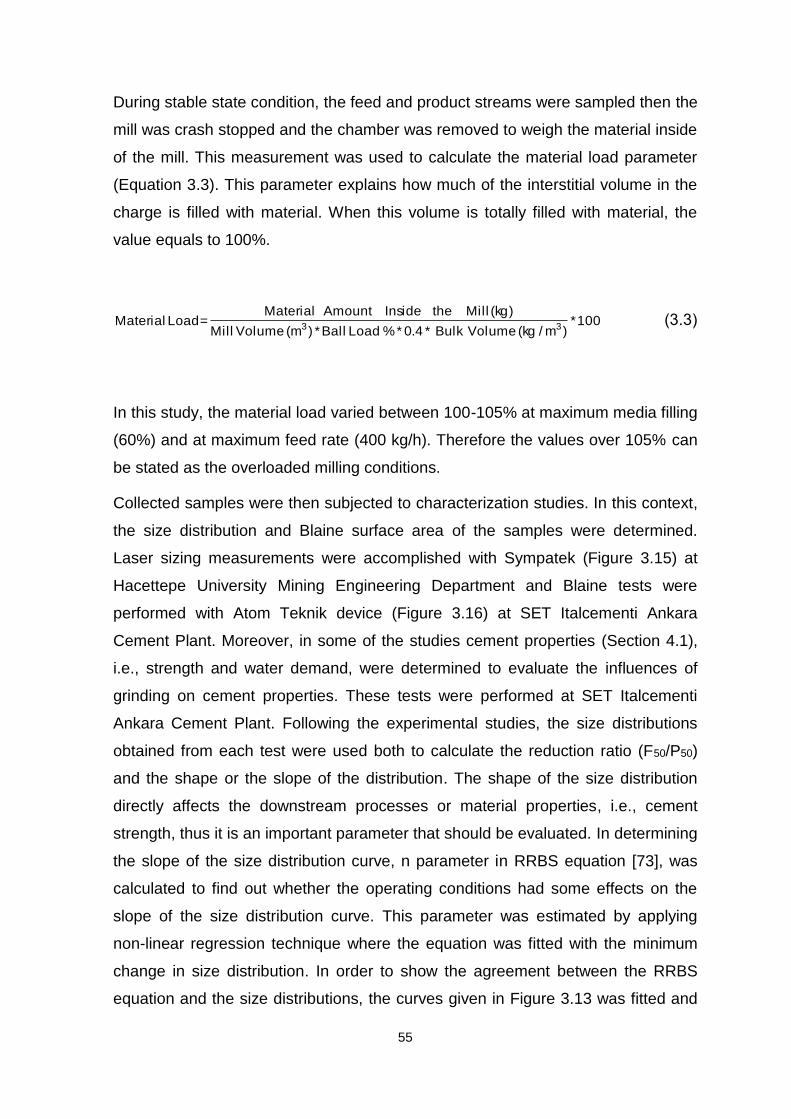
55
During stable state condition, the feed and product streams were sampled then the
mill was crash stopped and the chamber was removed to weigh the material inside
of the mill. This measurement was used to calculate the material load parameter
(Equation 3.3). This parameter explains how much of the interstitial volume in the
charge is filled with material. When this volume is totally filled with material, the
value equals to 100%.
100*)m/kg(VolumeBulk*4.0*%LoadBall*)m(VolumeMill
)kg(MilltheInsideAmountMaterial=LoadMaterial
33 (3.3)
In this study, the material load varied between 100-105% at maximum media filling
(60%) and at maximum feed rate (400 kg/h). Therefore the values over 105% can
be stated as the overloaded milling conditions.
Collected samples were then subjected to characterization studies. In this context,
the size distribution and Blaine surface area of the samples were determined.
Laser sizing measurements were accomplished with Sympatek (Figure 3.15) at
Hacettepe University Mining Engineering Department and Blaine tests were
performed with Atom Teknik device (Figure 3.16) at SET Italcementi Ankara
Cement Plant. Moreover, in some of the studies cement properties (Section 4.1),
i.e., strength and water demand, were determined to evaluate the influences of
grinding on cement properties. These tests were performed at SET Italcementi
Ankara Cement Plant. Following the experimental studies, the size distributions
obtained from each test were used both to calculate the reduction ratio (F50/P50)
and the shape or the slope of the distribution. The shape of the size distribution
directly affects the downstream processes or material properties, i.e., cement
strength, thus it is an important parameter that should be evaluated. In determining
the slope of the size distribution curve, n parameter in RRBS equation [73], was
calculated to find out whether the operating conditions had some effects on the
slope of the size distribution curve. This parameter was estimated by applying
non-linear regression technique where the equation was fitted with the minimum
change in size distribution. In order to show the agreement between the RRBS
equation and the size distributions, the curves given in Figure 3.13 was fitted and

56
the measured and calculated values were graphed for each stream (Figure 3.17).
The R2 of the fitting calculations was 0.998 for each of the cases thus it can be
concluded as RRBS equation can be used in assessing the width of the size
distribution curves.
Figure 3.15. Sympatek laser sizer
Figure 3.16. Atom teknik Blaine measurement device
Figure 3.17. The agreement between the measured and calculated size
distributions

57
3.3. The Observations during Initial Test Works
Since the dry horizontal stirred mill was newly introduced equipment into the
cement grinding area, some grinding problems occurred while conducting initial
test works. The studies performed to sort these problems out provided better
understanding of milling operation and in this section the
solutions/recommendations are explained plainly. As indicated in previous
sections, two different chamber designs were available within the thesis therefore
the solutions were developed for each of the designs. The adjusted milling
conditions throughout the studies are given in Table 3.5.
Table 3.5. The milling conditions of the initial test studies
Media Type Steel
Stirrer Type Disc
Media Size (mm) 4
Stirrer Speed (m/s) 4.34
Media Filling (%) 60
Feed Rate (kg/h) 250
3.3.1. Grinding Problems with 23 L Mill
As indicated in Section 3.1, the 23 L mill was manufactured with the water jacket
surrounding the chamber. Within the study, several test works proved that water
circulation from inside the water jacket improved the efficiency of grinding
operation. In this section, two of the case studies are presented which are;
grinding with d50 of 15 µm and d50 of 25 µm. In the first case study the final product
stream with d50 of 15 µm was tried to be ground through the mill at specified
milling conditions (Table 3.5). Initially, the water was not circulated inside the
jacket to observe what kind of operational difficulties could be encountered.
At start-up, the temperature of the mill chamber was around 25°C. After 15
minutes of grinding time it went up to 78°C. In the meantime, the amount of the
discharged material, in other words production rate of the mill, decreased
considerably although the feed rate of the mill was constant. It was certain that the
rise in temperature caused accumulation of the material inside the chamber and
consequently the production rate of the mill decreased evidently. In the end, power
draw of the mill exceeded 17 kW and got close to its installed power thus the mill

58
stopped itself due to the safety regulations. The change in the temperature and
power draw of the mill are illustrated graphically in Figure 3.18.
Figure 3.18. Graphical representation of the change in operational power and
chamber temperature of 23 L mill
After all, the mill chamber was removed to observe the mill inside, i.e., material
accumulation and coatings on the media, stirrers and chamber (Figure 3.19). As
can be seen from the figure, the material coated on the mill chamber wall and
internal parts reduced efficiency of the grinding operation. Such an inefficient
grinding environment made the transportation of the material through the mill
difficult and finally stopped the grinding operation. All of these symptoms implied
that temperature was an issue needed to be solved as it directly affected material
transportation along the mill.
Figure 3.19. Coatings on the internal parts and mill chamber
Due to the adverse effect of temperature on milling performance, another study
focussed on using water circulation in order to keep the chamber temperature at
constant level that would improve the process and provide a sustainable grinding
operation. In the case of circulating water, the maximum temperature measured on

59
the chamber was 46°C after 26 minutes of grinding time and the grinding operation
was performed without deteriorating the production rate of the mill that is, no
material accumulation inside the chamber was observed.
In the second case, the filter return stream with d50 of 25 µm was tried to be
ground. The similar problems to that of d50 of 15 µm were observed and then
solved in the same manner. All of the studies concluded that heating of the mill
chamber affected the material transportation adversely as it reduced the grinding
efficiency and the use of water jacketed chamber could be one of the solutions
ahead.
3.3.2. Grinding Problems with 42 L Chamber
The previous studies showed that the heating of the mill chamber caused serious
operational problems that should have been overcome to obtain a sustainable
grinding operation. As given previously, the 42 L mill chamber was manufactured
without water jacket. Therefore during the initial test studies, mill chamber
temperature increased from 25°C to 72°C that affected material transportation
along the mill adversely. Consequently, the production rate of the mill decreased in
spite of being operated at the same feed rate. Ultimately, the material accumulated
inside the mill chamber stopped the grinding operation. It was obvious that besides
the water jacketed chamber, another solution was necessary in order to improve
transportation behaviour of the bulk material.
In case of wet milling, water as a fluid carries the ground particles through the
discharge end thus the accumulation of the material is prevented. From this point
of view, either fluidizing the bulk material or the use of fluid was thought to be
beneficial for dry milling. In this context, the effects of grinding chemicals and air
supply were investigated. The grinding chemicals have been used in grinding
operations for many years. In brief, they neutralize the surfaces of the particles
thus the bulk material is fluidized. Their beneficial usage has been proved by many
studies in particular in dry grinding area (Section 2.4.6). Within the scope of the
thesis, the influences of grinding chemicals on grinding performance of the mill
were investigated. The preliminary test studies with chemicals on material with d50
of 25 µm and d50 of 15 µm showed that despite of increased temperature, the
power draw and the production rate of the mill were steady and the temperature
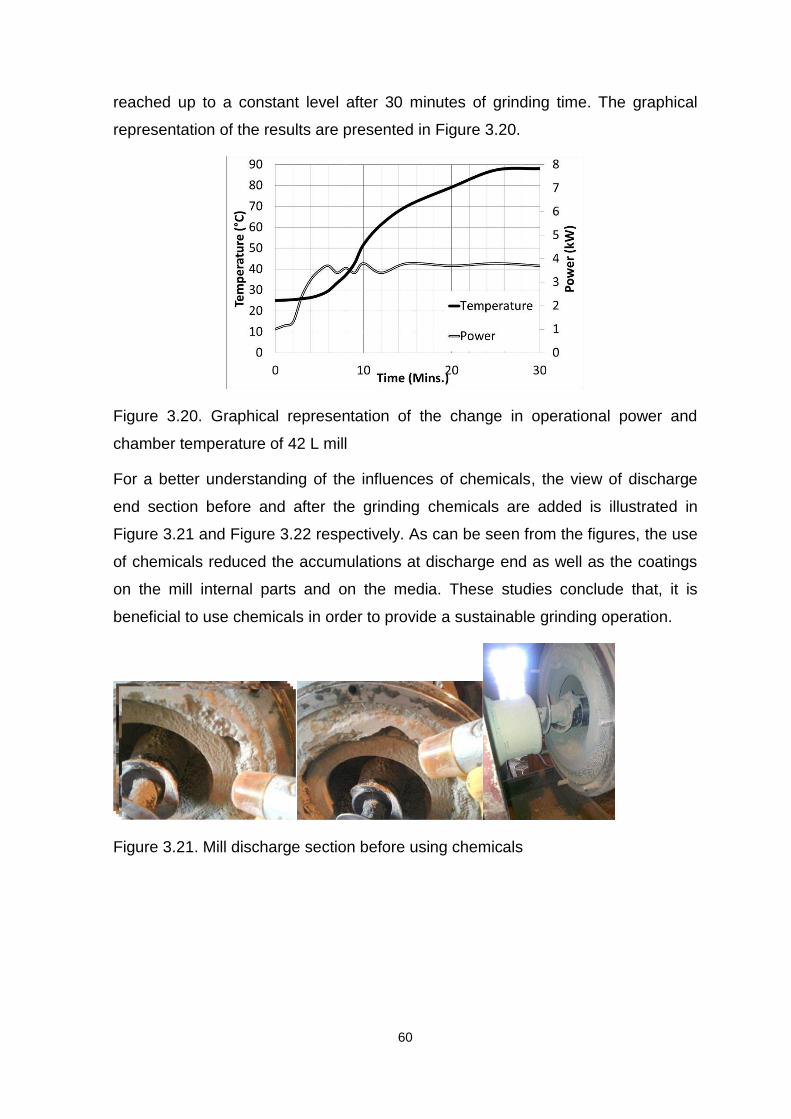
60
reached up to a constant level after 30 minutes of grinding time. The graphical
representation of the results are presented in Figure 3.20.
Figure 3.20. Graphical representation of the change in operational power and
chamber temperature of 42 L mill
For a better understanding of the influences of chemicals, the view of discharge
end section before and after the grinding chemicals are added is illustrated in
Figure 3.21 and Figure 3.22 respectively. As can be seen from the figures, the use
of chemicals reduced the accumulations at discharge end as well as the coatings
on the mill internal parts and on the media. These studies conclude that, it is
beneficial to use chemicals in order to provide a sustainable grinding operation.
Figure 3.21. Mill discharge section before using chemicals

61
Figure 3.22. The effect of chemicals on discharge end section, internal parts and
media
Throughout the initial test studies, there were some milling conditions that the use
of grinding chemicals alone did not provide any benefits regarding improvement in
transportation (Table 3.6) thus grinding operation could not be performed. The use
of fluid, in this case air, inside the mill was another solution developed to improve
transportation when the mill was operated with fine size media (3 mm). For this
purpose, air nozzle was placed to the feed inlet with the maximum flow rate of
1000 L/h. In case of supplying air from the feed inlet, the drawbacks arisen from
the use of fine media were overcome.
Table 3.6. The milling conditions of the test with 3 mm media
Media Type steel
Stirrer Type disc
Grinding Chemical (g/t) 500-1000
Feed Size, F50 (µm) 15.25
Stirrer Speed (m/s) 4.34
Media Filling (%) 60
Media Size (mm) 3
The benefits of using air were also observed when grinding relatively coarser
materials on which the use of grinding chemicals were not effective. The size
distributions and the mean sizes of the coarse materials are presented in Figure
3.23 and Table 3.7 respectively. The problem with the grinding of coarser material
was its interaction with grinding chemicals since no improved effects of chemicals
were observed therefore grinding operation could not be performed. In this case
air supply from the feed inlet improved the process and made it possible to grind
coarse particles as well.
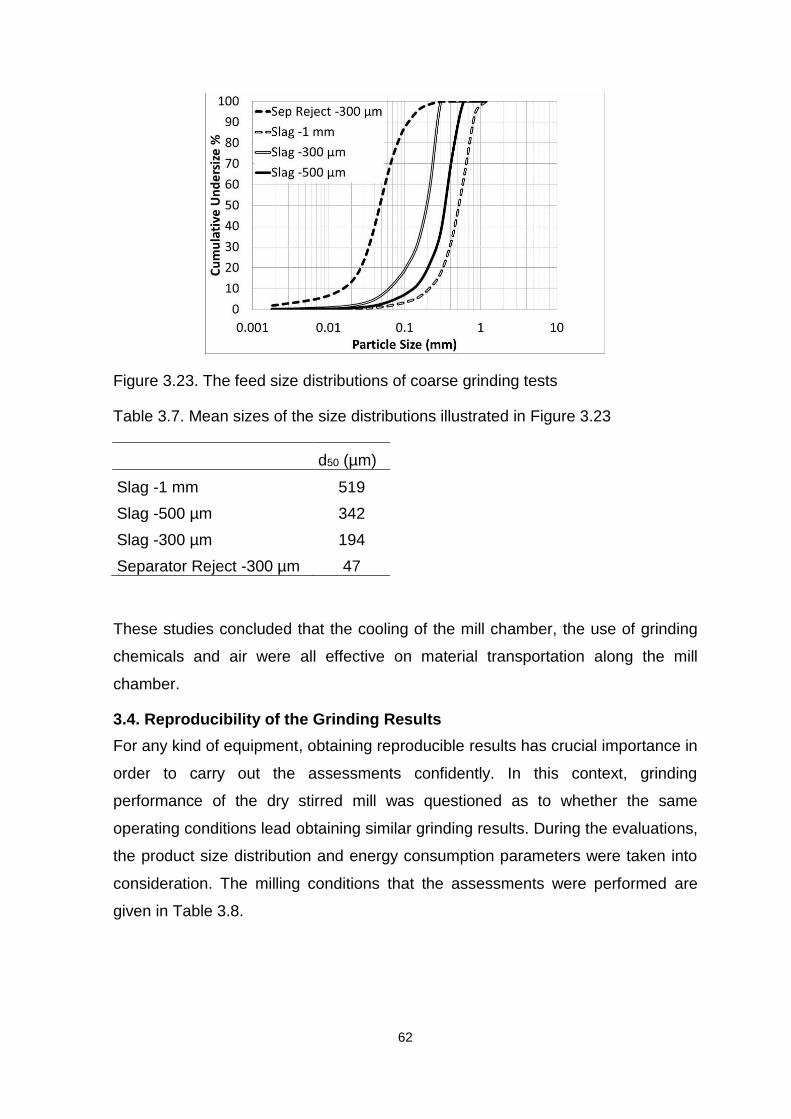
62
Figure 3.23. The feed size distributions of coarse grinding tests
Table 3.7. Mean sizes of the size distributions illustrated in Figure 3.23
d50 (µm)
Slag -1 mm 519
Slag -500 µm 342
Slag -300 µm 194
Separator Reject -300 µm 47
These studies concluded that the cooling of the mill chamber, the use of grinding
chemicals and air were all effective on material transportation along the mill
chamber.
3.4. Reproducibility of the Grinding Results
For any kind of equipment, obtaining reproducible results has crucial importance in
order to carry out the assessments confidently. In this context, grinding
performance of the dry stirred mill was questioned as to whether the same
operating conditions lead obtaining similar grinding results. During the evaluations,
the product size distribution and energy consumption parameters were taken into
consideration. The milling conditions that the assessments were performed are
given in Table 3.8.

63
Table 3.8. Milling conditions of the reproducibility test studies
Mill Volume (L) 42
Media Type Steel
Stirrer Type Disc
Media Size (mm) 4
Media Filling (%) 60
Stirrer Speed (m/s) 5.71
Feed Rate (kg/h) 320
Within the study, totally 3 grinding tests were carried out and the changes in size
distributions and energy consumptions were observed. The results given in Table
3.9 and Figure 3.24 indicate that the mill processing same feed material
characteristics, i.e., size distribution, chemical composition, produces similar
grinding results.
Table 3.9. Energy consumption of each test and mean sizes of products
Power (kW) Specific Energy Cons. (kWh/t) P50 (µm)
Test 1 5.6 17.5 11.89
Test 2 5.6 17.5 11.79
Test 3 5.66 17.7 12.07
Figure 3.24. The size distribution curves of each test

64
4. INFLUENCES of OPERATING and DESIGN PARAMETERS on GRINDING PERFORMANCE
In comminution power draw and energy utilizations are key features that needs to
be evaluated for a given device under different operating conditions. The other
important aspect that determines if the equipment can be successful in operation
is throughput. The objectives of this study that was carried out on the novel
horizontal stirred mill operation were to;
Evaluate the performance of the device in terms of energy utilisation.
Evaluate the influence of key operating and design variables such as, grinding
chemicals, air supply, stirrer speed, media filling, media size, throughput rate,
feed size, stirrer type and mill geometry, on the energy and grind size. Grinding
chemical and air supply mainly affect transportation through the mill and their
optimization is of critical importance (Section 3.3). Therefore, these parameters
were optimized initially and then the rest of the studies (stirrer speed, media
filling etc.) were carried out at optimized conditions. The test works presented
in this section were performed under the conditions given in Table 4.1.
Determine the optimum operating conditions of the device that minimum
energy is consumed for a given grind size.
Table 4.1. The milling conditions adjusted for performance tests
Mill Volume (L) 42
Media Type Steel
Stirrer Type Disc
4.1. The Effects of Grinding Chemicals
Referring to Section 2.4.6, the grinding chemicals neutralize the surface charges
of the particles thus the agglomerations and the coatings on the mill internal parts
are prevented and bulk material becomes fluidized. Ultimately an efficient milling
environment is obtained and grinding performance is improved.
The importance of using chemicals has been revealed in previous section. In
general, these chemicals provide efficient grinding environment. However, their
optimum use is of critical importance since some of the case studies have showed
that excessive use of them could influence the strength performance adversely as

65
a result of the set retarding-effect [71]. It is reported that this behaviour is observed
with some type of cements. Moreover, chemicals bring extra operating cost to the
operation therefore, their dosage and type are needed to be adjusted for the
material processed. In addition to their significant contribution on transportation of
the bulk material, the chemicals may also have an improved effect on strength
development of cement. Up to 10% development in ultimate strength of the
cement is achievable with the use of special chemicals [72].
Within the scope of this study, determining the most suited chemical for dry stirred
milling application was aimed. Three different chemicals varying in chemical
compositions were available and the test studies were carried out at different
chemical dosages to find out the optimum usage that benefitted most to cement
properties and milling performance. These chemicals were manufactured by
Chryso Company coded as EPCT-01, EPCT-02 and EPCT-04 which were
Triisopropanolamine (TIPA)-based, Triethanolamine (TEA)-based and Glycol-
based chemicals respectively. Following the grinding tests, performance of each
chemical was evaluated by considering their contribution to size reduction,
material amount inside the mill, surface area development, strength development
of cement as well as the water demand of cement mortar. The economic facts
should also have been considered while evaluating the performances of the
chemicals however, since they were produced for a special aim, their market
values were not estimated. The milling conditions adjusted during the chemical
tests are presented in Table 4.2.
Table 4.2. The milling conditions adjusted for chemical test
Media Size (mm) 4
Media Filling (%) 60
4.1.1. The tests with EPCT-04 (Glycol-based chemical)
The grinding tests with EPCT-04 were performed at three different chemical
dosages. The experimental conditions and the obtained results are given in Table
4.3. Figure 4.1 and Table 4.4 show the particle size distributions and the changes
in cement properties respectively.
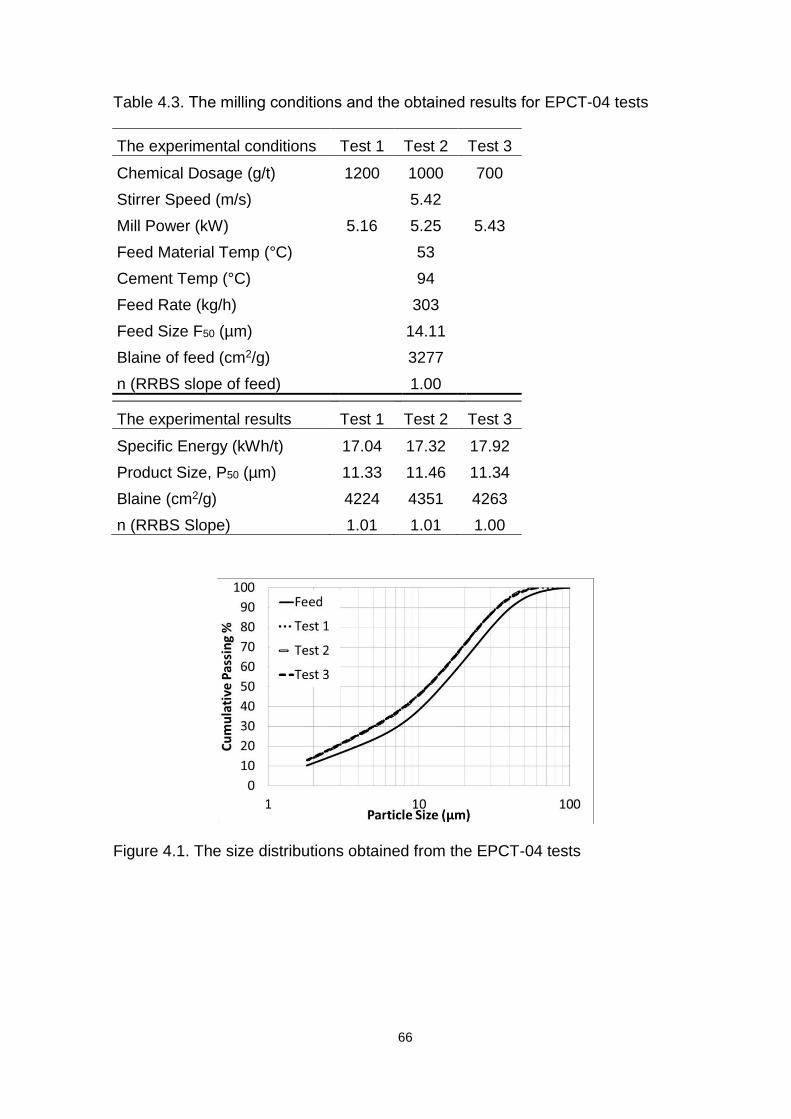
66
Table 4.3. The milling conditions and the obtained results for EPCT-04 tests
The experimental conditions Test 1 Test 2 Test 3
Chemical Dosage (g/t) 1200 1000 700
Stirrer Speed (m/s) 5.42
Mill Power (kW) 5.16 5.25 5.43
Feed Material Temp (°C) 53
Cement Temp (°C) 94
Feed Rate (kg/h) 303
Feed Size F50 (µm) 14.11
Blaine of feed (cm2/g) 3277
n (RRBS slope of feed) 1.00
The experimental results Test 1 Test 2 Test 3
Specific Energy (kWh/t) 17.04 17.32 17.92
Product Size, P50 (µm) 11.33 11.46 11.34
Blaine (cm2/g) 4224 4351 4263
n (RRBS Slope) 1.01 1.01 1.00
Figure 4.1. The size distributions obtained from the EPCT-04 tests

67
Table 4.4. Cement properties of EPCT-04 tests
2 Days Strength
(MPa)
7 Days Strength
(MPa)
28 Days Strength
(MPa) Water Demand %
Feed 29.6 40.8 49.6 28.2
700 g/t 31.0 40.8 52.3 29.2
1000 g/t 31.1 43.1 54.0 29.4
1200 g/t 30.0 41.7 53.1 29.2
The test results obtained from EPCT 04 were evaluated with regarding to changes
in the shape of size distribution curves and size reduction, energy consumptions
and cement properties. Changing the chemical dosage had no influence both on
the shape of product size distributions (no selective grinding of coarser particles
was observed) and size reduction performance of the mill. The main influence of
the chemical was observed on power draw or energy consumption of the mill.
From dosage of 700 g/t to 1000 g/t, energy saving around 3.3% was obtained.
From cement properties point of view, the strength of the cement mortar increased
as a result of the grinding operation. The highest increase was observed at the
dosage of 1000 g/t where the strength was improved by 8.87% with respect to
feed material. However, a further increase in chemical amount (1200 g/t) had an
adverse effect on strength (28 days) as it decreased by 1.7%. Finally, the water
demand of cement mortar increased as a function of grinding action but chemical
dosage had no influence on it.
4.1.2. The tests with EPCT-02 (Triethanolamine (TEA)-based chemical)
Grinding test studies with EPCT-02 were performed at two different dosages
(Table 4.5). The size distribution curves and cement properties of each test are
given in Figure 4.2 and Table 4.6 respectively.
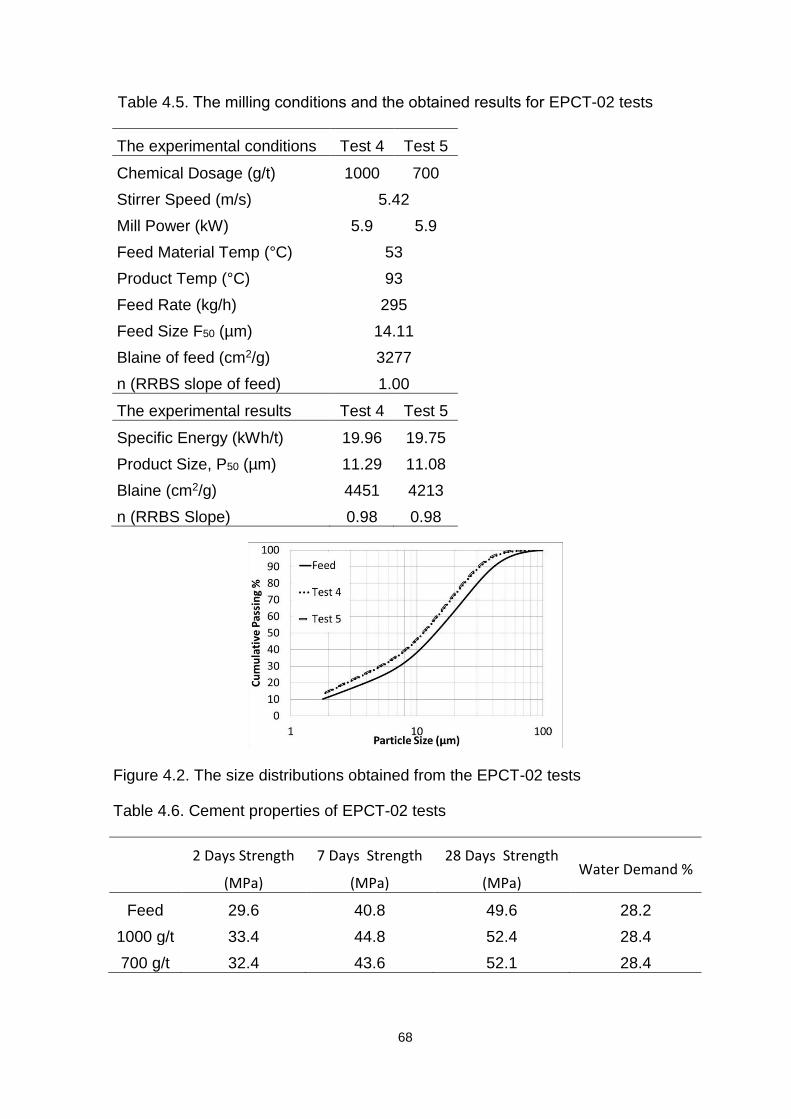
68
Table 4.5. The milling conditions and the obtained results for EPCT-02 tests
The experimental conditions Test 4 Test 5
Chemical Dosage (g/t) 1000 700
Stirrer Speed (m/s) 5.42
Mill Power (kW) 5.9 5.9
Feed Material Temp (°C) 53
Product Temp (°C) 93
Feed Rate (kg/h) 295
Feed Size F50 (µm) 14.11
Blaine of feed (cm2/g) 3277
n (RRBS slope of feed) 1.00
The experimental results Test 4 Test 5
Specific Energy (kWh/t) 19.96 19.75
Product Size, P50 (µm) 11.29 11.08
Blaine (cm2/g) 4451 4213
n (RRBS Slope) 0.98 0.98
Figure 4.2. The size distributions obtained from the EPCT-02 tests
Table 4.6. Cement properties of EPCT-02 tests
2 Days Strength
(MPa)
7 Days Strength
(MPa)
28 Days Strength
(MPa) Water Demand %
Feed 29.6 40.8 49.6 28.2
1000 g/t 33.4 44.8 52.4 28.4
700 g/t 32.4 43.6 52.1 28.4

69
The test results showed that, the feed and product size distribution were parallel to
each other. That is, n parameter was constant for each case. With regards to
cement properties, the strength of the ground material increased by 5.6% (1000
g/t) with respect to the feed material. Changing the chemical dosage did not affect
the size reduction performance of the mill as well as the strength development of
the cement mortar. Besides, water demand of the ground products was affected
slightly.
4.1.3. The tests with EPCT-01 (Triisopropanolamine (TIPA)-based chemical)
The grinding tests with EPCT-01 were performed at three different dosages. The
experimental conditions and the obtained results are given in Table 4.7. Figure 4.3
illustrates the feed and product size distributions and Table 4.8 presents the
strength developments of cement mortar.
Table 4.7. The milling conditions and the obtained results for EPCT-01 tests
The experimental conditions Test 6 Test 7 Test 8
Chemical Dosage (g/t) 1000 700 500
Stirrer Speed (m/s) 5.42
Mill Power (kW) 5.2 5.16 5.43
Feed Material Temp (°C) 53
Product Temp (°C) 92
Feed Rate (kg/h) 308
Feed Size, F50 (µm) 14.11
Blaine of feed (cm2/g) 3277
n (RRBS slope of feed) 1.00
The experimental results Test 6 Test 7 Test 8
Specific Energy (kWh/t) 16.88 16.78 17.63
Product Size, P50 (µm) 10.58 10.54 11.12
Blaine (cm2/g) 4208 4135 4026
n (RRBS Slope) 1.01 0.99 0.99

70
Figure 4.3. The size distributions obtained from the EPCT-01 tests
Table 4.8. The results of strength tests for EPCT-01
The results obtained from EPCT-01 tests showed that, the slope of the feed and
product size distributions were the same for each of the test works. Furthermore, it
was observed that changing chemical dosage had no influence on size reduction
performance of the mill. Despite of obtaining similar size reductions, the power
draw and the specific energy consumption of the mill changed considerably with
increasing chemical dosage. From 500 g/t to 700 g/t, energy saving around 4.8%
was obtained. Regarding to cement properties, the cement strength of each
ground product was increased at different rates with respect to feed material. The
highest increase in ultimate strength (28 days) was obtained with 18.75% at 700
g/t which was considerably higher than 500 g/t with 11.69% and close to 1000 g/t
with 17.94%. The tests with EPCT-01 also showed that the water demand of the
ground material changed slightly compared to feed material.
2 Days Strength (MPa)
7 Days Strength (MPa)
28 Days Strength (MPa)
Water Demand %
Feed 29.6 40.8 49.6 28.2
1000 31.7 46.6 58.5 28.6
700 30.9 46.3 58.9 28.2
500 30.8 44.2 55.4 28.2

71
4.1.4. Comparison of the Chemical Performances
The test studies performed with different types of chemicals indicated that there
were distinctive differences between them regarding to their provided energy
efficiency to the mill and improving cement properties. While comparing chemical
performances, the shape of product size distributions, specific energy
consumption of the mill, product fineness, cement strength development, water
demand of cement mortar parameters were taken into consideration. In Figure 4.4
and Figure 4.5, chemical performances at the same dosages are compared
graphically.
Figure 4.4. Performance assessments of the chemicals at 1000g/t
Figure 4.5. Performance assessments of the chemicals at 700g/t
As can be understood from the figures;
Regarding to the mill performance, no evident difference is observed
between 700 g/t and 1000 g/t for each of the chemicals. The specific energy
consumptions and product fineness are close to each other.
The chemicals have no effect on the shape of product size distributions
since calculated n parameters (Eq. 1.1) are the same for all.

72
EPCT-01 contributes more to energy saving operation of the mill compared
to EPCT-04 and EPCT-02.
When the strength development with respect to feed material are taken into
consideration, EPCT-01 has the highest rate with 17.94% at 1000 g/t and
18.75% at 700 g/t.
Finally, EPCT-02 changes the water demand of the cement mortar slightly
while EPCT-01 does not at 500 g/t and 700 g/t.
These assessments on chemical performances lead to the selection of EPCT-01
(TIPA-based chemical) type grinding chemical for dry horizontal stirred mill
application owing to its improving effects on energy efficiency of the mill and
cement properties. In the next study, the influences of different chemical dosages
on mill inside material amount were investigated with EPCT-01. In this context,
four test studies were arranged at varying dosages (0-1000 g/t) and the mill was
crash stopped at each case soon after the steady state conditions were provided.
Finally mill chamber was removed to weigh mill inside material. In this study, the
material with d50 of 20 µm was subjected to grinding tests and cement strengths
were not determined. The milling conditions adjusted during the tests are given in
Table 4.9.
Table 4.9. The milling conditions adjusted to measure mill inside material amount
with EPCT-01 chemical
Media Size (mm) 4
Media Filling (%) 50
Stirrer Speed (m/s) 4.34
As can be noticed from the table above, lower media filling and stirrer speed
conditions were adjusted in order not to cause any operational deficiency during
non-chemical test study. The test results given in Table 4.10 implies that grinding
chemical reduces the material amount inside the mill therefore, efficient grinding
conditions are provided and consequently specific energy consumption of the mill
is lowered. From 0 to 700 g/t, material amount is reduced by 34.5% and specific
energy saving of 7.5% is obtained however further increase is not beneficial (1000
g/t). The interaction of chemical with cement played an important role in obtaining

73
these results. It is thought that when the chemical is introduced into the system,
the material become fluidized initially then particles that are already in desired
fineness now discharges from the mill thus product gets finer. Owing to decreased
amount of mill inside material, the power and specific energy decreases as well
because of the less resistance on the discs and on the shaft.
Table 4.10. The change in specific energy consumption and material amount
inside the mill
Chemical Dosage (g/t)
Specific Energy (kWh/t)
Material Amount Inside the Mill (kg)
Mean Product Size, d50 (µm)
0 21.15 17.1 14.64
500 20.18 12.2 14.07
700 19.55 11.2 13.71
1000 19.31 11.3 13.65
It should be emphasized that, owing to its proven operational benefits, EPCT-01 at
the dosage of 700 g/t was used in the further studies.
4.2. The Effects of Air Flow Rate
As indicated previously, air supply into the mill improved material transportation
when using fine media size (3 mm) in the meantime when grinding coarser
material (>d50:47 µm). In order to investigate the influences of air flow rate on
grinding performance, series of grinding tests were performed. The test conditions
and the related results are given in Table 4.11 and Figure 4.6.
Table 4.11. The milling conditions and the obtained results for determining the
effects of air flow rate
The experimental conditions Test 9 Test 10 Test 11
Media Size (mm) 3
Media Filling (%) 50
Stirrer Speed (m/s) 4.34
Feed Rate (kg/h) 270
Feed size F50 (µm) 23.34
Chemical Dosage (g/t) 700
Air Amount (L/h) 0 500 1000

74
Table 4.11 (Cont.). The milling conditions and the obtained results for determining
the effects of air flow rate
The experimental results Test 9 Test 10 Test 11
Specific Energy (kWh/t) 9.78 9.67 9.77
Product d50 (µm) 19.1 19.27 19.11
Amount of material inside the mill (kg) 16.2 15.8 15.9
Figure 4.6. The size distributions obtained from the air flow rate tests
Test results given in Table 4.11 and Figure 4.6 implied that, increasing air flow rate
had no evident effect on milling performance since the same specific energy
consumptions and the product size distributions were obtained. The studies
conclude that, air supply improves the material transportation but it is not a
parameter influencing the grinding performance of the mill.
4.3. The Effects of Stirrer Speed
Referring to the Section 2.4.1, stirrer speed mainly increases the probability of
media to particle collision by creating high energy intensity environment. The test
conditions and test results for investigating the effects of stirrer speed are given in
Table 4.12, Figure 4.7 and Figure 4.8.

75
Table 4.12. The milling conditions and the obtained results for determining the
effects of stirrer speed
The experimental conditions Test 12 Test 13 Test 14 Test 15
Stirrer Speed (m/s) 2.17 3.25 4.34 6.5
Media Size (mm) 4
Media Filling (%) 60
Feed Rate (kg/h) 400
Feed Size, F50 (µm) 22.09
Blaine of feed (cm2/g) 2356
n (RRBS slope of feed) 1.02
The experimental results Test 12 Test 13 Test 14 Test 15
Specific Energy (kWh/t) 4.29 6.08 8.23 19.14
Product Size, P50 (µm) 18.73 18.27 17.55 14.92
Reduction Ratio 1.18 1.21 1.26 1.48
Blaine (cm2/g) 2514 2597 2613 2950
n (RRBS slope) 1.03 1.03 1.03 1.05
Amount of material inside the mill (kg)
19.2 19.52 19.61 N.D.*
Material Load (%) 102 104 104 N.D.*
* Not determined
Figure 4.7. The size distributions obtained from stirrer speed tests

76
Figure 4.8. The relationships between stirrer speed, product fineness and specific
energy developed from stirrer speed tests
Test results given in Table 4.12, Figure 4.7 and Figure 4.8 indicate that grinding at
lower stirrer speeds (Test 12 and Test 13) does not make evident contribution on
size reduction. Despite of the change in the specific energies (from 4.29 kWh/t to
6.08 kWh/t), the reduction ratios (1.18, 1.21) and the surface area measurements
are close to each other. This may be due to the smaller size of media, which is not
able to create high stress intensity environment. Jankovic [8] in zinc grinding tests
pointed out that stirrer speed was a parameter influencing the performance of
grinding operation of IsaMill®, however the effect was so small when finer media
was used (0.85-0.6 mm). In his study, 1.44 reduction ratio was obtained for both
3.6 m/s and 5.2 m/s stirrer speeds at an energy level of around 5 kWh/t. Jankovic
[8] also concluded that higher stirrer speeds were required to improve the grinding
efficiency of smaller sized media. Another conclusion at lower stirrer speed tests
is, the amount of material left inside the mill was not affected as the temperature of
mill chamber did not increase evidently (reached max 40°C).
In Figure 4.8 and Figure 4.7, distinctive difference in size distributions at stirrer
speeds of 4.34 m/s (Test 14) and 6.5 m/s (Test 15) can be seen. Therefore,
another test work was arranged to study the effects of maximum stirrer speed. The
test conditions and the related results for investigating the effects of maximum
stirrer speed are given in Table 4.13, Figure 4.10 and Figure 4.9.

77
Table 4.13. The milling conditions and the obtained results for determining the
effects of maximum stirrer speed
The experimental conditions Test 16 Test 17 Test 18 Test 19
Stirrer Speed (m/s) 4.34 6.5 8.67 9.76
Media Size (mm) 4
Media Filling (%) 60
Feed Rate (kg/h) 250
Feed Size, F50 (µm) 29.42
Blaine of feed (cm2/g) 1420
n (RRBS slope of feed) 1.02
The experimental results Test 16 Test 17 Test 18 Test 19
Specific Energy (kWh/t) 13.33 21.88 30.23 37.17
Product Size, P50 (µm) 19.61 17.98 17.14 16.32
Reduction Ratio 1.50 1.63 1.72 1.80
Blaine (cm2/g) 2380 2667 2764 2864
n (RRBS slope) 1.09 1.08 1.07 1.06
Amount of material inside the mill (kg)
19.7 19.8 20.93 21.46
Material Load (%) 105 105 111 114
Figure 4.9. The size distributions obtained from the maximum stirrer speed tests

78
Figure 4.10. The relationship between stirrer speed, product fineness and specific
energy developed from maximum stirrer speed tests
The results given in Table 4.13, Figure 4.10 and Figure 4.9 indicate that as the
stirrer speed is increased, both the specific energy consumption and the material
amount inside the mill increases. Figure 4.9 shows that, the change in size
distributions is becoming insignificant at higher stirrer speeds due to the inefficient
grinding operation. The Blaine surface area measurements also support this
finding.
The reduced energy efficiency at high stirrer speeds were observed by Zheng et
al. [32] who calculated the grinding efficiency from specific surface area
development, energy consumption and volume of the ground material. Fadhel and
Frances [34] also indicated that higher stirrer speeds did not make an evident
difference in terms of size reduction (median size) due to the inefficient grinding
conditions. Therefore, they recommended mills to be operated at an energy level
that was just enough to break the particles because the excess energy
transformed into heat reduced the efficiency of grinding. This behaviour has also
been encountered in this study. High stirrer speed increased the temperature of
the mill chamber (75°C at 8.67 m/s tip speed, 90°C at 9.76 m/s tip speed) which
affected the material load directly and reduced the efficiency of grinding. Although
the specific energy was changed considerably from 13.33 kWh/t to 37 kWh/t, the
size reduction value changed from 1.50 to 1.80 which was not noteworthy.
Stirrer speed tests showed that the slopes of feed and ground materials were quite
similar to each other. In contrast to IsaMill® operations where the product size

79
distribution becomes narrower due to the selective grinding of coarse particles, the
slope remained constant.
4.4. The Effects of Feed Rate
Referring to the Section 2.4.4, in any kind of grinding operation, specific energy is
one of the most important parameters related to the product fineness. Feed rate is
one of the parameters affecting energy consumption directly. The test conditions
and the related results for investigating the effects of feed rate are given in Table
4.14, Figure 4.11 and Figure 4.12.
Table 4.14. The milling conditions and the obtained results for determining the
effects of feed rate
The experimental conditions Test 20
Test 21
Test 22
Stirrer Speed (m/s) 4.34
Media Size (mm) 4
Media Filling (%) 60
Feed Rate (kg/h) 230 310 400
Feed Size, F50 (µm) 25.95
Blaine of Feed (cm2/g) 1780
n (RRBS slope of feed) 1.02
The experimental results
Test 20
Test 21
Test 22
Specific Energy (kWh/t) 15.33 11.9 8.8
Product Size, P50 (µm) 17.1 18.83 20.85
Reduction Ratio 1.51 1.38 1.24
Blaine (cm2/g) 2770 2571 2391
n (RRBS slope) 1.06 1.06 1.04
Amount of material inside the mill (kg) 13.68 15.26 19.43
Material Load (%) 73 81.4 104

80
Figure 4.11. The size distributions obtained from the feed rate tests
Figure 4.12. The relationships between feed rate, product fineness and specific
energy developed from feed rate tests
The feed rate has mainly two major effects on grinding performance which are; the
specific energy consumption and the product fineness. As can be understood from
Table 4.14, Figure 4.11 and Figure 4.12, the change in feed rate from 230 kg/h to
400 kg/h reduces the specific energy consumption from 15.33 kWh/t to 8.8 kWh/t
and at the same time decreases both the reduction ratio from 1.51 to 1.24 (Figure
4.11 and Figure 4.12) and Blaine values from 2770 cm2/g to 2391 cm2/g. The
difference in Blaine values is around 14%. The MaxxMill study performed by Wang
et al. [3] indicated that at 350 rpm stirrer speed, increasing feed rate from 300 kg/h
to 500 kg/h decreased the BET surface area (m2/g) by approximately 14%.
Dikmen [33], in wet stirred mill study, obtained coarser product when the feed rate
was changed from 557 kg/h to 916 kg/h.

81
Furthermore, test results indicate that the feed rate and the amount of material
inside the mill are directly proportional, i.e. the lower the feed rates, the lower the
amount of material left inside the mill. Test results also show that the slopes of the
feed and product size distributions are very close to each other.
4.5. The Effects of Media Filling
Referring to the Section 2.4.3, media filling is a parameter affecting ball to material
ratio, thus the product fineness as well. In this study, several test works were
performed in order to investigate the effect of media filling on grinding
performance. The test conditions and the related results for investigating the
effects of media filling are given in Table 4.15, Figure 4.13 and Figure 4.14.
Table 4.15. The milling conditions and the obtained results for determining the
effects of media filling
The experimental conditions Test 23 Test 24 Test 25 Test 26
Stirrer Speed (m/s) 4.34
Media Size (mm) 4
Media Filling (%) 30 40 50 60
Feed Rate (kg/h) 400
Feed Size F50 (µm) 26.78
Blaine of feed (cm2/g) 1851
n (RRBS slope of feed) 1.01
The experimental results Test 23 Test 24 Test 25 Test 26
Specific Energy (kWh/t) 4.26 5.29 6.67 8.8
Product Size, P50 (µm) 25.94 23.95 22.12 20.85
Reduction Ratio 1.03 1.12 1.21 1.28
Blaine (cm2/g) 1893 1952 2112 2357
n (RRBS slope) 1.01 1.03 1.03 1.04
Amount of material inside the mill (kg) 18.91 18.82 18.84 19.12
Material Load (%) 200 150 120 102

82
Figure 4.13. The size distributions obtained from the media filling tests
Figure 4.14. The relationships between media filling, product fineness and specific
energy developed from media filling tests
The test results shown in Table 4.15, Figure 4.13 and Figure 4.14 imply that there
is a systematic size reduction depending on the increase in media filling. It was
observed that, the change in media filling from 30% to 60% increased both the
specific energy consumption from 4.26 kWh/t to 8.8 kWh/t and the reduction ratio
from 1.03 to 1.28. In the meantime, the Blaine value was changed from 1893
cm2/g to 2357 cm2/g. Sivamohan and Vachot [45] found that the increase in media
filling from 29% to 57% increased the surface area from 2 m2/g to 6 m2/g. Persson
and Forssberg [41] investigated the effect of media level (centimetres) on specific
surface area (m2/g) and indicated that at constant specific energy (50 kWh/t) the

83
change in level from 40 cm to 60 cm produced material having higher surface area
(from 1 m2/g to 1.7 m2/g).
In this study it was also concluded that the change in media filling had no effect on
the slope of the product size distributions (constant n parameter).
In another study, series of test works were arranged to compare the grinding
performances of different media fillings (30%, 40% and 60%) separately. In these
tests, material with d50 of 57 µm was fed into the mill and the grinding tests were
conducted over a range of energy levels. Instead of presenting the operating
conditions of all the tests separately, the range of the parameters is given in Table
4.16. The test results are presented graphically in Figure 4.15.
Table 4.16. The milling conditions adjusted for 30%, 40% and 60% media filling
tests
The experimental conditions Value
Stirrer Speed (m/s) 2.17-6.50
Feed Rate (kg/h) 100-400
Figure 4.15. Comparison of grinding performances at different media fillings
Even though a wide range of milling conditions were arranged to perform the tests
at different specific energy levels, no considerable difference in size reductions
were obtained with 30% filling where only a small difference was observed with
40% filling. The test results conclude that 30% and 40% media fillings are not
energy efficient conditions. In other words, higher specific energies are required
for lower fillings to obtain the size reduction that higher media fillings (60%)
achieve. Similar results were also obtained by Sivamohan and Vachot [45] in
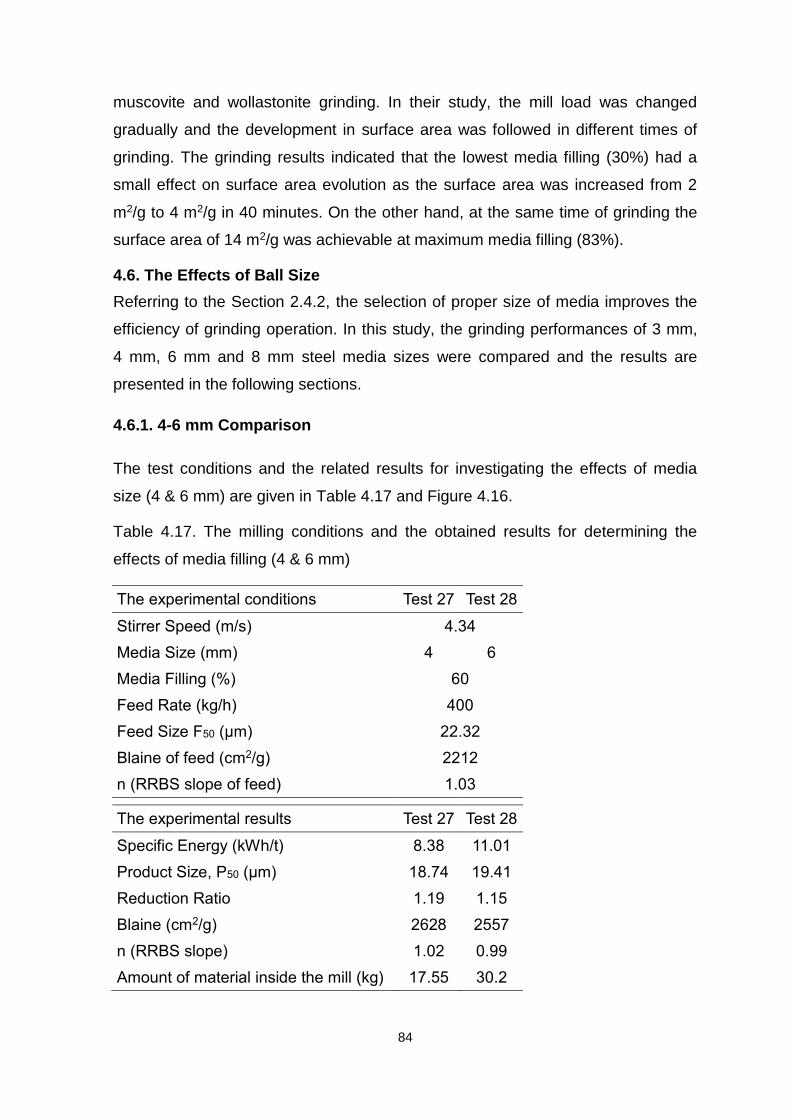
84
muscovite and wollastonite grinding. In their study, the mill load was changed
gradually and the development in surface area was followed in different times of
grinding. The grinding results indicated that the lowest media filling (30%) had a
small effect on surface area evolution as the surface area was increased from 2
m2/g to 4 m2/g in 40 minutes. On the other hand, at the same time of grinding the
surface area of 14 m2/g was achievable at maximum media filling (83%).
4.6. The Effects of Ball Size
Referring to the Section 2.4.2, the selection of proper size of media improves the
efficiency of grinding operation. In this study, the grinding performances of 3 mm,
4 mm, 6 mm and 8 mm steel media sizes were compared and the results are
presented in the following sections.
4.6.1. 4-6 mm Comparison
The test conditions and the related results for investigating the effects of media
size (4 & 6 mm) are given in Table 4.17 and Figure 4.16.
Table 4.17. The milling conditions and the obtained results for determining the
effects of media filling (4 & 6 mm)
The experimental conditions Test 27 Test 28
Stirrer Speed (m/s) 4.34
Media Size (mm) 4 6
Media Filling (%) 60
Feed Rate (kg/h) 400
Feed Size F50 (µm) 22.32
Blaine of feed (cm2/g) 2212
n (RRBS slope of feed) 1.03
The experimental results Test 27 Test 28
Specific Energy (kWh/t) 8.38 11.01
Product Size, P50 (µm) 18.74 19.41
Reduction Ratio 1.19 1.15
Blaine (cm2/g) 2628 2557
n (RRBS slope) 1.02 0.99
Amount of material inside the mill (kg) 17.55 30.2

85
Figure 4.16. The size distributions obtained from the media size tests (4 & 6 mm)
The test results presented in Table 4.17 and Figure 4.16 imply that 4 mm media
produces slightly finer product (with a reduction ratio of 1.19) by consuming 23.9%
less specific energy compared to 6 mm media size. It is clear that using finer
media brings energy efficiency.
4.6.2. 4-6-8 mm Comparison
In another test work, the grinding performances of 4 mm, 6 mm and 8 mm media
sizes were compared using relatively coarser material (feed size, F50:51.03 µm)
compared to Section 4.6.1. The test conditions and the related results for
investigating are given in Table 4.18 and Figure 4.17.
Table 4.18. The milling conditions and the obtained results for determining the
effects of media filling (4 & 6 & 8 mm)
The experimental conditions Test 29 Test 30 Test 31
Stirrer Speed (m/s) 5.42
Media Size (mm) 8 6 4
Media Filling (%) 50
Feed Rate (kg/h) 110
Feed Size F50 (µm) 51.03
Blaine of feed (cm2/g) 706
n (RRBS slope of feed) 0.84

86
Table 4.18 (Cont.). The milling conditions and the obtained results for determining
the effects of media filling (4 & 6 & 8 mm)
The experimental results Test 29 Test 30 Test 31
Specific Energy (kWh/t) 43.65 38.5 31.68
Product Size, P50 (µm) 21.09 22.25 22.66
Reduction Ratio 2.42 2.29 2.25
Blaine (cm2/g) 2333 2219 2180
n (RRBS slope) 1.05 1.03 1.02
Figure 4.17. The size distributions obtained from the media size tests (4 & 6 & 8
mm)
The test results given in Table 4.18 and Figure 4.17 show that although the
obtained size reductions are close to each other (2.42-2.25), the specific energy
consumptions vary considerably. In other words, at the same product d50’s, 27.4%
less energy was utilized by 4 mm media compared to 8 mm media. As a
conclusion, using finer media brings energy efficiency.
4.6.3. 4-3 mm Comparison
The tests have been performed so far showed that the finer media draws less
power, thus utilizes less specific energy. In order to find out the minimum media
size that could be used in dry stirred milling operation, another test work was
performed in which the grinding performances of 3 mm and 4 mm media sizes

87
were compared. The test conditions and the related results are given in Table 4.19
and Figure 4.18.
Table 4.19. The milling conditions and the obtained results for determining the
effects of media filling (4 & 3 mm)
The experimental conditions
Test 32 Test 33
Stirrer Speed (m/s) 4.34
Media Size (mm) 3 4
Media Filling (%) 50
Feed Rate (kg/h) 160
Feed Size F50 (µm) 21.02
Blaine of feed (cm2/g) 2340
n (RRBS slope of feed) 1.01
The experimental results Test 32 Test 33
Specific Energy (kWh/t) 16.38 16.65
Product Size, P50 (µm) 15.78 15.49
Reduction Ratio 1.33 1.36
Blaine (cm2/g) 2931 2968
n (RRBS slope) 1.04 1.04
Figure 4.18. The size distributions obtained from the media size tests (4 & 3 mm)
As a result of the studies, no difference is observed between 3 mm and 4 mm
media sizes in terms of their providing grinding performances, therefore it can be

88
concluded that the media size of 4 mm is the lowest practical limit for efficient
grinding operation.
The test results presented in previous sections (Section 4.6.1-Section 4.6.3)
indicate that as the media size decreases, less energy is utilized at the same
target size. The experimental results show that, approximately 23.9% less energy
is consumed when grinding F50 of 22.32 µm material and 27.4% energy saving is
achieved when grinding F50 of 51.03 µm in case of using finer media. Mankosa et
al. [38] also declared the energy efficiency of using finer media and indicated that
50% energy savings were achievable in producing 5 µm mean product size.
Jankovic [8] in his vertical stirred mill study found that it was possible to utilize 14%
less energy with finer media to grind F80 of 20 µm down to P80 of 10 µm. In some
of his tests, energy utilization of finer media reached one third of the coarser one.
Mende et al. [40] also indicated that the finer media utilized one fourth of the
energy consumed by the coarser one.
In this study, 4 mm media was found as the minimum size that affects the grinding
process. In the literature similar findings had been obtained. Schollbach [42]
declared that using too fine or too coarse media was not beneficial and concluded
that the effective media size was between 2.5 mm and 4 mm.
In this study, it should also be emphasized that the media size has no effect on
slope of the product size distributions. Feed and product size distributions are
parallel to each other.
4.7. The Effects of Feed Size Distribution
This section aimed at investigating the mill performance at varying feed size
distribution. In this context, sufficient amount of material collected from each
stream (Figure 3.11) was subjected to grinding test studies. As a result of the
studies, the performance of dry stirred milling on each stream was evaluated by
considering the energy consumption and size reduction relationship. Then the
obtained trends were compared with each other and the effects of feed fineness
on grinding performance were investigated.

89
4.7.1. Grinding Tests Performed with Final Product Stream
Final product stream has the finest size distribution of the entire grinding circuit.
The size distribution curve and the parameters related to it are given in Figure 4.19
and Table 4.20 respectively.
Figure 4.19. Whole size distribution of the final product stream
Table 4.20. Size distribution parameters of the final product stream
n (RRBS) 1.018
d50 (µm) 14.81
d80 (µm) 32.44
Mill conditions adjusted for grinding test studies are given in Table 4.21. Due to
insufficient amount of mono-size media, media mixture was prepared and filled
into the mill (Table 4.21).
Table 4.21. The milling conditions of the final product stream grinding tests
Mill Chamber Volume (L) 42
Media Type Steel
Stirrer Type Disc
Chemical Type EPCT-01
Chemical Amount (g/t) 700
Air Flowrate (L/h) 1000
Media Mixture (mm) 60% from 4 mm ; 40% from 3 mm

90
The test plan is given in Table 4.22. As can be seen from the table, the mill was
tried to be operated at higher media fillings (70%) to find out whether the improved
performance was obtained. The cross-marked tests shown in the table imply that
they are incomplete due to operational problems. The operating problems were
mainly due to high intense milling conditions, i.e., high media filling, high stirrer
speed, that increased mill chamber temperature so high that either the use of
grinding chemicals or air supply did not bring any benefits.
Table 4.22. Grinding test plan arranged for final product stream
The experimental results obtained from the grinding tests are presented in Table
4.23. As seen from the table, mean product size, n and specific energy parameters
were calculated for each case. Test results imply that specific energy and product
mean size (P50) parameters are inversely proportional to each other. Moreover, the
same n parameters for feed and product size distributions indicate that, they are
parallel to each other independently of any operating conditions. This behaviour of
the mill is completely different from the wet stirred mills (IsaMill®) where coarser
particles are ground selectively, thus steeper product size distribution is obtained.
Table 4.23. The experimental results obtained from final product grinding tests
Feed Rate (kg/h) Power (kW) Specific Energy
(kWh/t) P50
(µm) n
(RRBS)
Test 34 102.96 2.82 27.39 11.21 0.97
Test 35 96.00 4.22 43.96 9.37 0.954
Test 36 97.20 6.26 64.40 8.38 0.921
Test 37 262.80 2.72 10.35 12.57 1.035
Test 38 271.00 4.22 15.57 11.49 1.007
Test 39 266.40 6.26 23.50 10.19 0.954
Test 40 424.00 2.69 6.34 13.37 1.009
Test 41 418.00 4.32 10.33 12.60 1.001
Test 42 425.50 6.28 14.76 11.14 0.942
Feed Rate (kg/h) 4.34 m/s 6.5 m/s 9.76 m/s 4.34 m/s 6.5 m/s 9.76 m/s 4.34 m/s 6.5 m/s 9.76 m/s
400 T40 T41 T42 T47 T48 T18 T51 T26 T27
250 T37 T38 T39 T45 T46 T15 T50 T23 T24
100 T34 T35 T36 T43 T44 T12 T49 T20 T21
50% Filling %60 Filling %70 Filling

91
Table 4.23 (Cont.). The experimental results obtained from final product grinding
tests
Feed Rate (kg/h) Power (kW) Specific Energy
(kWh/t) P50
(µm) n
(RRBS)
Test 43 100.80 4.07 40.38 9.38 0.963
Test 44 102.96 7.15 69.44 8.05 0.913
Test 45 259.56 3.89 14.99 11.87 1.034
Test 46 266.76 6.23 23.35 10.64 0.987
Test 47 430.56 3.72 8.64 12.93 1.046
Test 48 416.88 6.2 14.87 11.51 1.004
Test 49 96.48 5.71 59.18 8.50 0.931
Test 50 271.44 5.31 19.56 10.68 0.993
Test 51 411.12 5.1 12.41 11.64 1.016
With the data produced throughout this study, the influences of operating
parameters grinding process were investigated as well. Figure 4.20 and Figure
4.21 show the relationships between the parameters. Figure 4.20 illustrates the
influences of feed rate and stirrer speed parameters on power draw of the mill. It
implies that power draw increases with increasing stirrer speed. Additionally, the
feed rate had an adverse effect on power draw, in particular when the mill was
operated at higher media fillings. The measurements at 50% filling indicated that
no matter how high the feed rate was adjusted, the power draws of each stirrer
speed were the same (Figure 4.20a). However this behaviour changed at 60%
filling (Figure 4.20b) and became more evident at 70% filling (Figure 4.20c). That
is, increase in feed rate decreased power consumption. When the media filling
reached to the level of 70%, change in feed rate from 100 kg/h to 400 kg/h
reduced the power drawn by the mill by 10.7%. Inverse relationship between feed
rate and power draw is also observed in tumbling mills. Austin et al. [74] stated
that low powder load, which was a function of feed rate, had given significantly
higher power than normal powder loads in tumbling mills.

92
Figure 4.20. Effect of feed rate and stirrer speed on power draw during grinding
tests with final product stream
Figure 4.21. Effect of media filling and stirrer speed on power draw during grinding
tests with final product stream
The relationships given in Figure 4.21 show that media filling and stirrer speed
parameters are directly proportional to power draw of the mill.
c. a. b.

93
Figure 4.22 illustrates energy and size reduction relationship of final product test
results. As can be seen from the figure, there is a steadily upward trend between
the parameters. Besides it is seen that grinding results of each media filling are in
the same trend.
Figure 4.22. Specific energy consumption and size reduction relationship
developed from grinding tests with final product stream
4.7.2. Grinding Tests Performed with Separator Reject Stream
Separator reject stream has relatively coarser material when compared to other
streams (filter return and final product). In Figure 4.23 and Table 4.24 particle size
distribution of the stream and the parameters defining the size distribution curve
are presented respectively.
Figure 4.23. Whole size distribution of the separator reject stream

94
Table 4.24. Size distribution parameters of the separator reject stream
n (RRBS) 1.573
d50 (µm) 66.19
d80 (µm) 120.84
Test studies on separator reject stream aimed at investigating the stirred mill
performance with relatively coarser material. In a typical cement grinding process,
high amount of material is recirculated back into the mill via separator reject
stream owing to its coarseness. Therefore, an energy-efficient stirred milling
operation on this stream is expected to improve overall circuit performance since
more fine material could be produced and sent directly to final product bin.
The milling conditions adjusted throughout the grinding tests are presented in
Table 4.25. Major difference compared to final product stream milling conditions
(Table 4.21) is; grinding chemicals were not added as it was proved that they were
ineffective within this particle size range.
Table 4.25. The milling conditions of the separator reject stream grinding tests
Mill Chamber Volume (L) 42
Media Type Steel
Stirrer Type Disc
Air Flowrate (L/h) 1000
Media Mixture (mm) 60% from 4mm ; 40% from 3mm
A comprehensive test plan arranged for separator reject stream are given in Table
4.26. This plan aimed at pushing the grinding limits of the mill so as to determine
operational boundaries. As can be noticed from the table, some of the milling
conditions (cross-marked on the table) resulted in stopping the grinding operation
owing to drastic increase in mill chamber temperature that ultimately influenced
material transportation adversely despite of using maximum available amount of
air.

95
Table 4.26. Grinding test plan arranged for separator reject stream
Experimental results obtained from the grinding tests are presented in Table 4.27.
As presented in the table, specific energy, mean product size and n parameters
were calculated for each of the test studies. Afterwards, the correlations between
the parameters were plotted. In other words, the effects of operating parameters
on power utilization and obtained size reduction values were examined.
Table 4.27. The experimental results obtained from separator reject grinding tests
Feed Rate (kg/h) Power (kW) Specific Energy
(kWh/t) P50
(µm) n
(RRBS)
Test 52 118.80 3.75 31.57 31.99 1.074
Test 53 123.12 5.7 46.30 28.30 0.988
Test 54 119.52 8.43 70.53 22.49 0.883
Test 55 251.28 4.43 17.63 47.20 1.322
Test 56 250.56 7.2 28.74 38.09 1.148
Test 57 252.72 9.55 37.79 31.28 1.021
Test 58 371.52 6.06 16.31 51.29 1.317
Test 59 119.52 5.37 44.93 20.55 0.979
Test 60 122.40 8.7 71.08 15.14 0.903
Test 61 252.72 5.94 23.50 32.13 1.104
Test 62 254.52 9.2 36.15 23.72 1.01
Test 63 380.16 6.71 17.65 39.27 1.201
Test 64 126.36 7.36 58.25 14.37 0.972
Test 65 250.56 7.67 30.61 24.44 1.031
Firstly, the change in n parameter was investigated to find out whether operating
conditions had influence on the shape of the product size distribution. The
calculations showed that, in contrast to the results obtained from the previous
studies, n parameter was influenced by operating conditions, i.e. feed rate, media
filling and stirrer speed. It decreases with increasing stirrer speed and media filling
Feed Rate (kg/h) 4.34 m/s 6.5 m/s 9.76 m/s 4.34 m/s 6.5 m/s 9.76 m/s 4.34 m/s 6.5 m/s 9.76 m/s
400 T58 T8 T9 T63 T17 T18 T25 T26 T27
250 T55 T56 T57 T61 T62 T15 T65 T23 T24
100 T52 T53 T54 T59 T60 T12 T64 T20 T21
50% Filling %60 Filling %70 Filling

96
owing to the fines production. Conversely, it increases with increasing feed rate.
The differences in n values are more obvious at 50% media filling condition. In this
case, n parameter ranges between 1.322 and 0.883.
In Figure 4.24 and Figure 4.25, the trends showing the correlations between the
parameters are illustrated. In Figure 4.24, the effects of feed rate and stirrer speed
parameters on power consumption are illustrated graphically. Similar to previous
observations, as the stirrer speed is increased more power is utilized by the mill.
On the other hand, feed rate parameter acts in a different manner compared to
final product test works. The trends imply that power consumption increases to
some extent when the mill is operated at higher feed rates.
In Figure 4.25, the trends showing the effects of media filling on power draw are
illustrated. As expected, media filling and power consumption parameters are
directly proportional to each other.
Figure 4.24. Effect of feed rate and stirrer speed on power draw during grinding
tests with separator reject stream

97
Figure 4.25. Effect of media filling and stirrer speed on power draw during grinding
tests with separator reject stream
Stirred mill performance on separator reject stream grinding can be summarized
by plotting obtained reduction ratio values against specific energy consumption
(Figure 4.26). Such a correlation enables calculating how much energy is
demanded for a given reduction ratio.
Figure 4.26. Specific energy consumption and size reduction relationship
developed from grinding tests with separator reject stream
As can be seen from Figure 4.26, degree of size reduction increases with specific
energy consumption. Moreover, it is obvious that, each of the media fillings has
different grinding performance. In other words, at the same degree of size
reduction less energy is consumed when the mill is operated at higher media
fillings [36; 41; 45].
4.7.3. Grinding Tests Performed with Mill Filter Return Stream
As explained in previous sections, the mill filters are used to collect already ground
particles from inside of the ball mill and to keep the temperature of the mill
chamber at a constant level. Mill filter stream has a size distribution that remains in

98
between separator reject and final product streams. In Figure 4.27 and Table 4.28
typical particle size distribution and parameters defining the size distribution curve
are presented respectively.
Figure 4.27. Whole size distribution of the mill filter return stream
Table 4.28. Size distribution parameters of the mill filter return stream
n (RRBS) 1.112
d50 (µm) 24.84
d80 (µm) 49.07
In general, the fineness of this material does not meet the final product
specifications therefore it is fed to the separator feed stream again. It is thought
that stirred mill application on this stream would be highly beneficial with regards
to reducing energy consumption of the overall grinding circuit by producing more
fines that can be sent directly to final product bin. Mill conditions adjusted during
grinding studies are presented in Table 4.29. As can be noticed, grinding chemical
together with air was supplied into the mill in order to provide efficient grinding
environment.

99
Table 4.29. The milling conditions of the mill filter return stream grinding tests
Mill Chamber Volume (L) 42
Media Type Steel
Stirrer Type Disc
Chemical Type EPCT-01
Chemical Amount (g/t) 700
Air Flowrate (L/h) 1000
Media Size (mm) 4
In contrast to test schedules arranged for final product and separator reject
streams, test works with filter return material were not performed systematically.
Therefore it is unlikely to present a testing matrix. With filter return stream, over 50
test works were carried out at different time intervals and milling conditions. These
test works comprise both investigating the effects of operating parameters
(presented in Section 4) and some additional studies evaluating the mill
performance. The range of experimental results obtained from the tests are given
in Table 4.30.
Table 4.30. The ranges of experimental results obtained from filter return grinding
tests
Ball Filling (%)
Tip Speed (m/s)
Feed Rate (kg/h)
Specific Energy
(kWh/t)
d50
(µm) No. of Tests
60 2.17-9.76 180-410 4.3-37 14-21 26
50 1.08-6.5 45-406 6.7-37.8 13-22 25
40 4.34-5.42 116-390 5.29-15.6 18-24 4
30 4.34-5.42 36-400 4.26-36.6 18-26 4
Considerable amount of data produced during the test studies enabled to examine
influences of operating parameters on power consumption of the mill. In Figure
4.28, effects of stirrer speed together with media filling on power consumption are
illustrated graphically. Similar to previous findings it is understood that stirrer
speed and power consumption are directly proportional to each other. Additionally

100
it is observed from the figure that media filling ratio directly affects power
consumption.
Figure 4.28. Effect of media filling and stirrer speed on power draw during grinding
tests with filter return stream
In Figure 4.29, relationship between size reduction and specific energy
consumption parameters at different media fillings are illustrated. As expected
there is a steadily upward trend between them that is, degree of size reduction
gets higher as the energy level increases. However as noticed from the figure,
each of the media fillings behaves in a different manner. The studies concluded
that 30% and 40% ball fillings are not efficient grinding conditions since higher size
reductions are obtained at 50% and 60% filling at the same energy level. When
the trends between 50% and 60% fillings are compared it is noticed that there is
no evident difference in terms of grinding performances. This behaviour is quite
similar to what was observed with final product test works (Section 4.7.1).
Figure 4.29. Specific energy consumption and size reduction relationship
developed from grinding tests with filter return stream

101
4.7.4. Performance Evaluation of Stirred Mill at Different Feed Fineness
Comprehensive test schedules arranged for each stream made it possible to
investigate the influences of feed size distribution on stirred mill grinding
performance. In general as particles get coarser, discontinuities they have
increase thus energy consumption to cause breakage action decreases. On the
other hand the number and size of the discontinuities decrease with increasing
fineness therefore applied stress should be increased gradually to cause breakage
action [75; 76; 77]. As a conclusion, fine material milling requires higher energy
inputs compared to coarse material to obtain same degree of size reduction.
Mill conditions of the grinding tests at each stream had been given in Sections
4.7.1, 4.7.2 and 4.7.3. As can be noticed, 50% and 60% ball filling conditions are
in common for each of the cases therefore grinding results gathered from these
test works were used to investigate the influences of feed size distribution. The
attention should be drawn to media size selected during grinding test works.
Grinding tests with separator reject and final product streams were carried out at
the same media composition (60% 4 mm and 40% 3 mm) in order to push the
limits of the mill (Table 4.21, Table 4.25) while filter return stream tests were
performed with mono-size (4 mm) media. It is thought that such a difference would
not contribute any significant changes in the grinding performances as previous
studies (Section 4.6) proved that 4 mm and 3 mm media sizes had the same
grinding performance regarding to size reduction and specific energy relationship.
In Figure 4.30, energy utilization and size reduction relationship of each grinding
stream is illustrated. Figure 4.30a and Figure 4.30b show 50% and 60% ball filling
conditions respectively.
Figure 4.30 Grinding performance of the dry stirred mill at varying feed size
a. b.

102
As can be seen from the figure, as the feed size gets coarser much more rapid
size reduction is obtained that directly affects the slope of the trend. The trend
obtained from the separator reject stream has higher slope compared to the rest.
The studies conclude that at the same degree of size reduction, less energy is
demanded by coarser material.
In the following study, energy consumptions of each of the feed sizes to achieve
the same degree of size reductions were evaluated. In Figure 4.31, graphical
representation of the results is illustrated. In this graph, mean feed sizes lie on the
x-axis, including final product, filter return and separator reject streams from left to
right, while their energy consumptions are on y-axis. At the same feed size,
increasing energy consumption increases the obtained size reduction as well.
Moreover, it is observed that for the size below F50 of 25 µm, the energy
consumption increases drastically. Therefore, this size can be specified as the
minimum feed d50 that efficient cement grinding takes place for a given milling
conditions.
Figure 4.31. Effect of feed size on dry stirred mill performance
In the literature, similar conclusions have been reported. Figure 4.32, represents
the work done by Yue and Klein [78]. In their study they used wet operated
horizontal stirred mill manufactured by Netzsch and performed cycle tests on
quartz with F80 of 83 µm. The study concluded that size reduction decreased with
feed size and got close to 1 at the end of the tests. Ultimately, they concluded that

103
for a given grinding condition grinding limit existed where no evident breakage
action occurred any further.
Figure 4.32. Effect of feed size on size reduction obtained [78]
In a stirred mill, like any kind of ball mills, the characteristic of media has a
prominent role on performance of grinding action. Among other properties such as
chemical composition, strength, wear etc. the selection of proper size of media
comes forward to achieve improved milling performance. In other words, the size
of media should be accordant with material feed size to carry out an efficient
grinding operation. In the literature many studies investigating the relationship
between ratio of media diameter (Dball) to material feed size (Dparticle) and specific
breakage rate of the mill have been reported so far.
Referring to Section 2.4.2, Mankosa et al. [38] in their study observed that
breakage rate increased with Dball/Dparticle ratio until 20:1 and beyond this point
breakage rate started decreasing. This behaviour was attributed to small size of
media that was barely able to nip the particles. In another study Zheng et al. [32]
specified Dball/Dparticle ratio of 12:1 as an optimum point that efficient grinding action
took place.
Within the scope of the thesis, F50 of 25 µm was determined as the optimum feed
size that efficient grinding took place (Figure 4.31). When the top size of this
material (150 µm) was divided by the media size used in grinding tests (4 mm), the
ratio of Dball/Dparticle was found as 27:1. The difference with the literature comes
from the mill design, material selection and media properties.
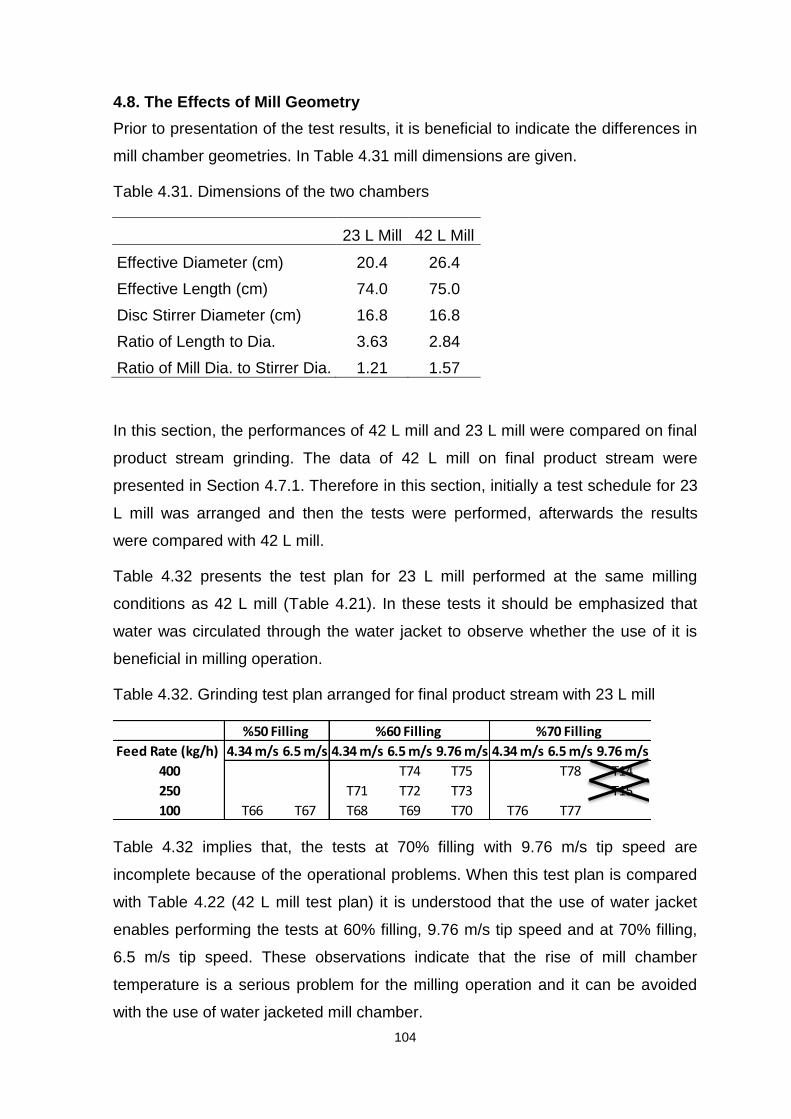
104
4.8. The Effects of Mill Geometry
Prior to presentation of the test results, it is beneficial to indicate the differences in
mill chamber geometries. In Table 4.31 mill dimensions are given.
Table 4.31. Dimensions of the two chambers
23 L Mill 42 L Mill
Effective Diameter (cm) 20.4 26.4
Effective Length (cm) 74.0 75.0
Disc Stirrer Diameter (cm) 16.8 16.8
Ratio of Length to Dia. 3.63 2.84
Ratio of Mill Dia. to Stirrer Dia. 1.21 1.57
In this section, the performances of 42 L mill and 23 L mill were compared on final
product stream grinding. The data of 42 L mill on final product stream were
presented in Section 4.7.1. Therefore in this section, initially a test schedule for 23
L mill was arranged and then the tests were performed, afterwards the results
were compared with 42 L mill.
Table 4.32 presents the test plan for 23 L mill performed at the same milling
conditions as 42 L mill (Table 4.21). In these tests it should be emphasized that
water was circulated through the water jacket to observe whether the use of it is
beneficial in milling operation.
Table 4.32. Grinding test plan arranged for final product stream with 23 L mill
Table 4.32 implies that, the tests at 70% filling with 9.76 m/s tip speed are
incomplete because of the operational problems. When this test plan is compared
with Table 4.22 (42 L mill test plan) it is understood that the use of water jacket
enables performing the tests at 60% filling, 9.76 m/s tip speed and at 70% filling,
6.5 m/s tip speed. These observations indicate that the rise of mill chamber
temperature is a serious problem for the milling operation and it can be avoided
with the use of water jacketed mill chamber.
Feed Rate (kg/h) 4.34 m/s 6.5 m/s 4.34 m/s 6.5 m/s 9.76 m/s 4.34 m/s 6.5 m/s 9.76 m/s
400 T74 T75 T78 T14
250 T71 T72 T73 T15
100 T66 T67 T68 T69 T70 T76 T77
%50 Filling %60 Filling %70 Filling

105
The experimental results obtained from grinding tests are presented in Table 4.33.
By using the given data, relationships investigating the effects of parameters on
power draw of the mill were developed.
Table 4.33. The experimental results obtained from final product grinding tests
with 23 L mill
Feed Rate (kg/h)
Power (kW)
Specific Energy (kWh/t)
P50 (µm)
n (RRBS)
Test 66 106.56 2.25 21.11 12.11 0.992
Test 67 101.16 3.2 31.63 11.22 0.961
Test 68 103.68 2.66 25.66 10.82 0.965
Test 69 102.24 4.2 41.08 10.05 0.94
Test 70 93.60 7.1 75.85 8.84 0.88
Test 71 259.20 2.49 9.61 12.88 0.996
Test 72 263.16 3.9 14.82 12.22 1.003
Test 73 262.80 6.31 24.01 11.44 0.972
Test 74 400.68 4.02 10.03 12.70 1.003
Test 75 380.52 6.1 16.03 12.40 0.992
Test 76 94.32 3.25 34.46 10.01 0.967
Test 77 95.04 6.4 67.34 8.59 0.899
Test 78 380.16 5.4 14.26 11.40 0.993
In Figure 4.33 and Figure 4.34 the influences of stirrer speed, media filling and
feed rate parameters on power draw are illustrated. The relationships given in
Figure 4.33a imply that as the stirrer speed increases power drawn by the mill
increases. Moreover, the adverse effect of feed rate on power draw can be
followed from the graph as well. In particular, at the tip speed of 9.76 m/s, a
noteworthy difference is observed between 100 kg/h and 390 kg/h. However, the
effect of feed rate becomes more evident when the media filling reaches to a level
of 70% (Figure 4.33b). In this case, power drawn by the mill is reduced by 15.3%
when the feed rate is changed from 95 kg/h to 380 kg/h. The cushioning effect of
material bed is thought to be effective in reducing the power draw of the mill. Test
results also indicate that the slopes of the feed and product size distributions are
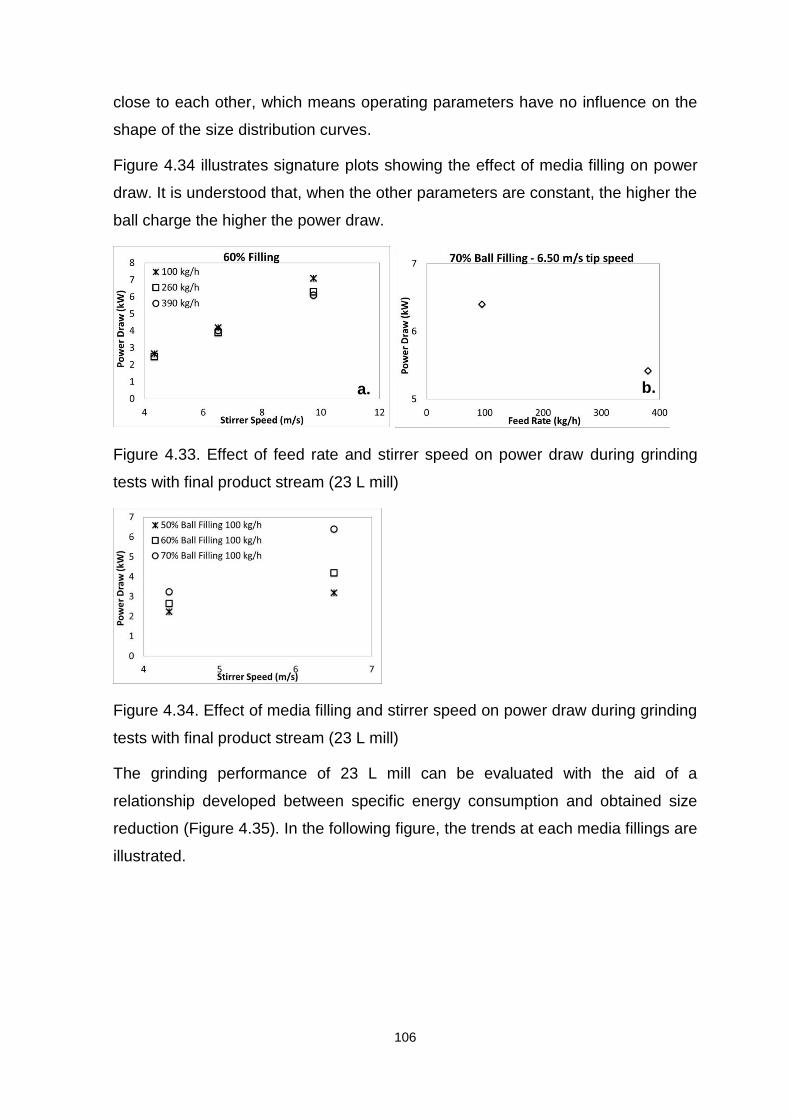
106
close to each other, which means operating parameters have no influence on the
shape of the size distribution curves.
Figure 4.34 illustrates signature plots showing the effect of media filling on power
draw. It is understood that, when the other parameters are constant, the higher the
ball charge the higher the power draw.
Figure 4.33. Effect of feed rate and stirrer speed on power draw during grinding
tests with final product stream (23 L mill)
Figure 4.34. Effect of media filling and stirrer speed on power draw during grinding
tests with final product stream (23 L mill)
The grinding performance of 23 L mill can be evaluated with the aid of a
relationship developed between specific energy consumption and obtained size
reduction (Figure 4.35). In the following figure, the trends at each media fillings are
illustrated.
a. b.

107
Figure 4.35. Specific energy consumption and size reduction relationship
developed from grinding tests with final product stream (23 L mill)
According to Figure 4.35, it is obvious that the grinding performances of each
media filling differ considerably. That is, at the same degree of size reduction (from
Test 67 to Test 78) 54.9% decrease in energy consumption is achievable at higher
media fillings. This behaviour of the mill is different from 42 L mill (Figure 4.22)
where different media fillings produce similar grinding results. Certainly, the use of
water jacketed chamber was the major factor that contributed obtaining these
results. It directly affects grinding performance of the mill.
The literature reports on discussing the influences of mill geometry on grinding
performance had previously been explained in Section 2.4.5. In this section, the
compatibility of the obtained results with the literature was also discussed. As
given in Table 4.31, mill length to mill diameter ratio and mill diameter to stirrer
diameter ratio of the two chambers are evidently different from each other and it is
thought that these differences affect grinding performance directly. Figure 4.36
illustrates the grinding results obtained from 42 L mill and 23 L mill test studies.
According to the figure, 42 L mill utilizes less energy compared to 23 L mill
operated at the same milling conditions. The difference in grinding performances
comes from the variations in mill design.

108
Figure 4.36. Comparison of grinding performances of the two mill chambers
Literature presented in Section 2.4.5 implies that changing aspect ratio of mill
internal parts and mill chamber has a considerable influence on grinding
performance. Test works performed by Zheng et al. [32] showed that as the ratio
of mill diameter to stirrer diameter decreased, milling operation displayed improved
performance. However, when the results obtained in this study are considered
(Figure 4.36) it is observed that better performance is obtained with higher ratio of
mill diameter to stirrer diameter. Such a conflict with the literature may either be
due to the differences in milling operations, as Zheng et al. [32] in their study used
batch operated wet mill, or different length to diameter ratios of the two mill
chambers hampered to observe the effect of mill diameter to stirrer diameter ratio
properly.
4.9. The Effects of Stirrer Type
No load power draws of each stirrer given in Section 3.1.2 implied that, the use of
disc type stirrer was advantageous over the other types in particular at higher
stirrer speeds. In this section the influences of the stirrer designs on grinding
performance are investigated. The milling conditions, the test plan and the related
results are given in Table 4.34, Table 4.35 and Table 4.36 respectively.

109
Table 4.34. The milling conditions of the stirrer type tests
Media Size (mm) 4 & 6 mixture
Feed Size F50 (µm) 66.17
The test plan arranged for the grinding tests are given in Table 4.35. Cross
marked tests in the table represents the conditions that the mill stopped due to
overheating of the mill chamber. From the table it can be distinguished that, the
grinding operation with disc type stirrer could be performed at intense milling
conditions since the tip speed could be adjusted up to 6.5 m/s without having any
operational difficulties. The test results are presented in Table 4.36.
Table 4.35. The test plan for determining the effects of stirrer type
60 % Media Filling
The Disc Type 3.25 m/s 4.34 m/s 6.5 m/s 9.76 m/s
400 kg/h T 83 X X
250 kg/h T 81 T 82 X
100 kg/h T 79 T 80 X
The Cross Type 3.25 m/s 4.34 m/s 6.5 m/s 9.76 m/s
400 kg/h T 87 X X X
250 kg/h T 86 T 85 X X
100 kg/h T 84 X X
The Wing Type 3.25 m/s 4.34 m/s 6.5 m/s 9.76 m/s
400 kg/h T 90 X X X
250 kg/h T 89 X X
100 kg/h T 88 X X

110
Table 4.36. The experimental results obtained from stirrer type tests at the same
milling conditions
The Disc Type T 79 T 80 T 81 T 82 T 83
Power (kW) 5.37 8.7 5.94 9.2 6.71
Feed Rate (kg/h) 119.52 122.4 252.72 254.52 380.16
Specific Energy (kWh/t) 44.93 71.08 23.50 36.15 17.65
Product d50 (µm) 20.55 15.14 32.13 23.72 39.27
The Cross Type T 84 T 85 T 86 T 87
Power (kW) 8.03 8.84 4.78 5.01
Feed Rate (kg/h) 114.84 263.52 256.32 385.92
Specific Energy (kWh/t) 69.92 33.55 18.65 12.98
Product d50 (µm) 18.17 28.44 37.61 41.93
The Wing Type T 88 T 89 T 90
Power (kW) 8.6 8.9 5.61
Feed Rate (kg/h) 108.36 257.76 382.32
Specific Energy (kWh/t) 79.37 34.53 14.67
Product d50 (µm) 16.19 26.04 38.40
By using the obtained results given above, the power draws of each stirrer type
were compared. The trends developed at the same milling conditions (60% media
filling, 4.23 m/s stirrer speed) indicate that the stirrers with edged shaped (wing
and cross types) consume more power compared to rounded shaped disc stirrer
(Figure 4.37). The differences in power draws come from the media movement
along the mill since more media is lifted by the edged shaped stirrers thus more
load is exerted by the shaft. As a conclusion, power draw of the disc type is found
to be the least among the stirrer designs. Such a finding emphasizes the
importance of stirrer design on the efficiency of grinding operation.

111
Figure 4.37. Comparison of power draws of each stirrer type at the same milling
conditions
In Figure 4.38, specific energy-size reduction relationship developed from the test
studies are illustrated. The trends indicate that, at higher energy levels (>20 kWh/t)
wing and cross type stirrers utilize more energy to achieve the same degree of
size reduction as the disc type. In other words, disc type stirrer provides higher
degree of size reduction at higher energy levels when compared to the others.
Figure 4.38. Comparison of grinding performances of each stirrer type at 60%
filling
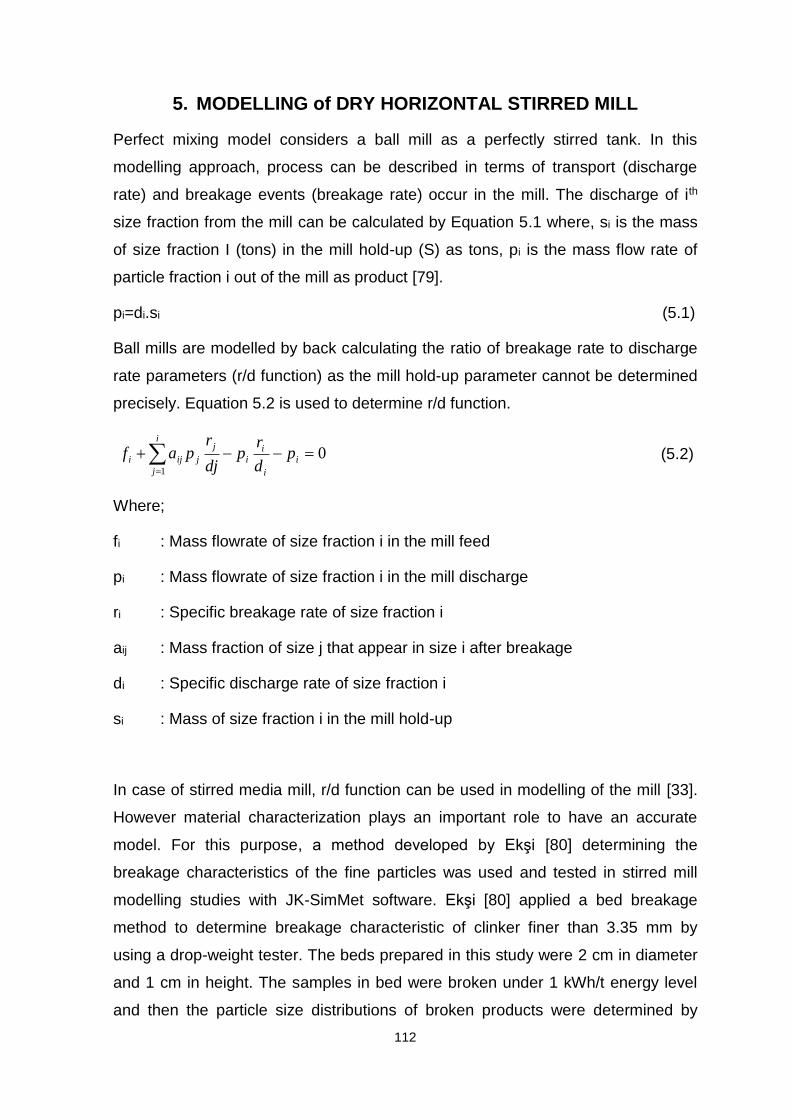
112
5. MODELLING of DRY HORIZONTAL STIRRED MILL
Perfect mixing model considers a ball mill as a perfectly stirred tank. In this
modelling approach, process can be described in terms of transport (discharge
rate) and breakage events (breakage rate) occur in the mill. The discharge of ith
size fraction from the mill can be calculated by Equation 5.1 where, si is the mass
of size fraction I (tons) in the mill hold-up (S) as tons, pi is the mass flow rate of
particle fraction i out of the mill as product [79].
pi=di.si (5.1)
Ball mills are modelled by back calculating the ratio of breakage rate to discharge
rate parameters (r/d function) as the mill hold-up parameter cannot be determined
precisely. Equation 5.2 is used to determine r/d function.
i
j
i
i
i
i
j
jiji pd
rp
dj
rpaf
1
0 (5.2)
Where;
fi : Mass flowrate of size fraction i in the mill feed
pi : Mass flowrate of size fraction i in the mill discharge
ri : Specific breakage rate of size fraction i
aij : Mass fraction of size j that appear in size i after breakage
di : Specific discharge rate of size fraction i
si : Mass of size fraction i in the mill hold-up
In case of stirred media mill, r/d function can be used in modelling of the mill [33].
However material characterization plays an important role to have an accurate
model. For this purpose, a method developed by Ekşi [80] determining the
breakage characteristics of the fine particles was used and tested in stirred mill
modelling studies with JK-SimMet software. Ekşi [80] applied a bed breakage
method to determine breakage characteristic of clinker finer than 3.35 mm by
using a drop-weight tester. The beds prepared in this study were 2 cm in diameter
and 1 cm in height. The samples in bed were broken under 1 kWh/t energy level
and then the particle size distributions of broken products were determined by

113
sieve analyses. Unbroken parts of the products were eliminated and then
converted into breakage distribution.
Within the stirred mill modelling studies, the breakage distributions of clinker
determined for (-0.850+0.600), (-0.150+0.102), (-0.102+0.072), mm size fractions
were used. These size fractions were selected by considering top size of the feed
materials came into the mill. The breakage distributions are presented in Table
5.1. The data sets were directly taken from Ekşi [80].
Table 5.1. The breakage distribution of (-0.850+0.600), (-0.150+0.102), (-
0.102+0.072) mm size fractions
Particle Size (mm)
(-0.850+0.600) mm
(-0.15+0.102) mm
(-0.102+0.072) mm
0.600 0.0000 0.0000 0.0000
0.425 0.3605 0.0000 0.0000
0.300 0.1558 0.0000 0.0000
0.212 0.1097 0.0000 0.0000
0.150 0.0947 0.0000 0.0000
0.102 0.0891 0.0000 0.0000
0.072 0.0557 0.5063 0.0000
0.050 0.0454 0.2155 0.5191
0.036 0.0289 0.1371 0.2036
0.025 0.0210 0.0697 0.1600
0.018 0.0110 0.0236 0.0640
0.012 0.0094 0.0200 0.0211
0.0086 0.0053 0.0093 0.0119
0.0044 0.0066 0.0109 0.0117
0.0026 0.0028 0.0031 0.0041
0.0018 0.0013 0.0014 0.0014
In modelling studies, r/d* functions were determined initially then correlated with
stirrer speed, feed rate, media filling and feed size distribution parameters. The
accuracy of the model fitting studies were measured by plotting the measured
cumulative passing percentages against the calculated values.

114
In stirred media mill, the breakage rate of the particles is mainly affected by stirrer
speed, media filling and media size while the discharge rate is influenced by
throughput of the mill. Figure 5.1 illustrates the influence of stirrer speed on r/d*
function of the mill. As can be seen from the figure, increasing stirrer speed
increases the breakage rate of the particles therefore finer product is obtained. It
should be emphasized that the tests were performed at the same feed rate thus
discharge rate was constant. The accuracy of the model fitting studies was
evaluated by drawing the measured and calculated size distributions (Figure 5.2).
Figure 5.1. Effect of stirrer speed on r/d* function
Figure 5.2. The measured and calculated size distributions of stirrer speed fitting
studies

115
Figure 5.3 shows the effect of feed rate on r/d function at constant stirrer speed,
media filling and media size. In other words, the investigations were carried out at
constant breakage rate of the particles. As can be seen from the figure, feed rate
influences the r/d* values slightly. That is, lower feed rate resulted in obtaining
higher r/d function owing to decreased discharge rate. The measured and
calculated particle size distributions are illustrated in Figure 5.4.
Figure 5.3. Effect of feed rate on r/d* function
Figure 5.4. The measured and calculated size distributions of feed rate fitting
studies

116
The effect of media filling on r/d function is illustrated in Figure 5.5. The tests were
performed at constant feed rate that is, discharge rate remained constant
throughout the studies. As can be seen from the figure, increase in the amount of
media in the mill increases the breakage rate gradually. As a result, finer product
is obtained. The results of the model fitting studies were evaluated by plotting the
measured and calculated size distributions (Figure 5.6).
Figure 5.5. Effect of media filling on r/d* function
Figure 5.6. The measured and calculated size distributions of media filling fitting
studies

117
Within the modelling studies, the effects of feed size distribution on r/d function
were also investigated (Figure 5.7). In r/d* calculations, the grinding tests
performed for three different size distributions at the same operating conditions,
i.e., 60% filling, 4.34 m/s stirrer speed, 4mm media size and 400 kg/h feed rate,
were taken into consideration. The graph illustrated below indicates that as the
feed gets coarser, r/d of the mill decreases. The figure also implies that, increase
in r/d value get slower below F50 of 25 µm size range. The measured and
calculated size distributions of the model fitting studies are illustrated in Figure 5.8.
Figure 5.7. Effect of feed size distribution on r/d* function
Figure 5.8. The measured and calculated size distributions of feed size fitting
studies

118
So far, the variations of r/d* values with operating parameters have been
presented. In the following study, a comparison between the r/d values of dry
stirred mill and 2nd chamber of various two-compartment ball mills during CEM I
42.5R production is presented. It is thought that such a comparison would be
beneficial to find out the effective grinding size for dry stirred mill technology. 2nd
chamber of the ball mill was chosen due to its fine grinding operations. Typically,
material with 80% passing size of 0.8 to 1 mm is processed in this chamber to
obtain a product with 80% passing size of 100 µm.
Within the study, ball mills having similar diameters and second compartment
lengths were chosen to be compared with stirred mill. In order to evaluate the
performance of the ball mills, extensive sampling campaigns were arranged by
Hacettepe University Mining Engineering Department. The samples were collected
from inside the 2nd chamber after the mills were crash-stopped following a steady
state condition. Technical specifications of the ball mills and size distributions of
2nd compartments are presented in Table 5.2 and in Figure 5.9 respectively.
Table 5.2. The specifications of the ball mills used in the study
Ball Mill #1 Ball Mill #2 Ball Mill #3
Production Type CEM I 42.5R
Bond Work Index of Clinker (kWh/t) 14.37 14.37 16.2
Diameter of the Mill (m) 3.66 3.66 3.4
Length of 2nd Chamber (m) 6.4 6.4 7
Ball Charge % 30.75 32.5 31
Median Ball Size (mm) 25 25 30

119
Figure 5.9. 2nd chamber feed and product size distributions of the ball mills
The 2nd compartment of the ball mills were modelled by using the breakage
distribution of clinker determined for (-1.7+1.18) mm size fraction as the feed
entered into these compartments had top size of 1.18 mm. The breakage
distribution is given in Table 5.3. The data sets were directly taken from Ekşi [80].
Table 5.3. The breakage distribution of (-1.7+1.18) mm size fraction
Particle Size (mm) Ball Mill (-1.7+1.18) mm
1.18 0.0000
0.85 0.3069
0.600 0.1355
0.425 0.0948
0.300 0.0934
0.212 0.0894
0.150 0.0630
0.102 0.0686
0.072 0.0455
0.050 0.0326
0.036 0.0197
0.025 0.0155
0.018 0.0099
0.012 0.0085
0.0086 0.0048
0.0044 0.0059
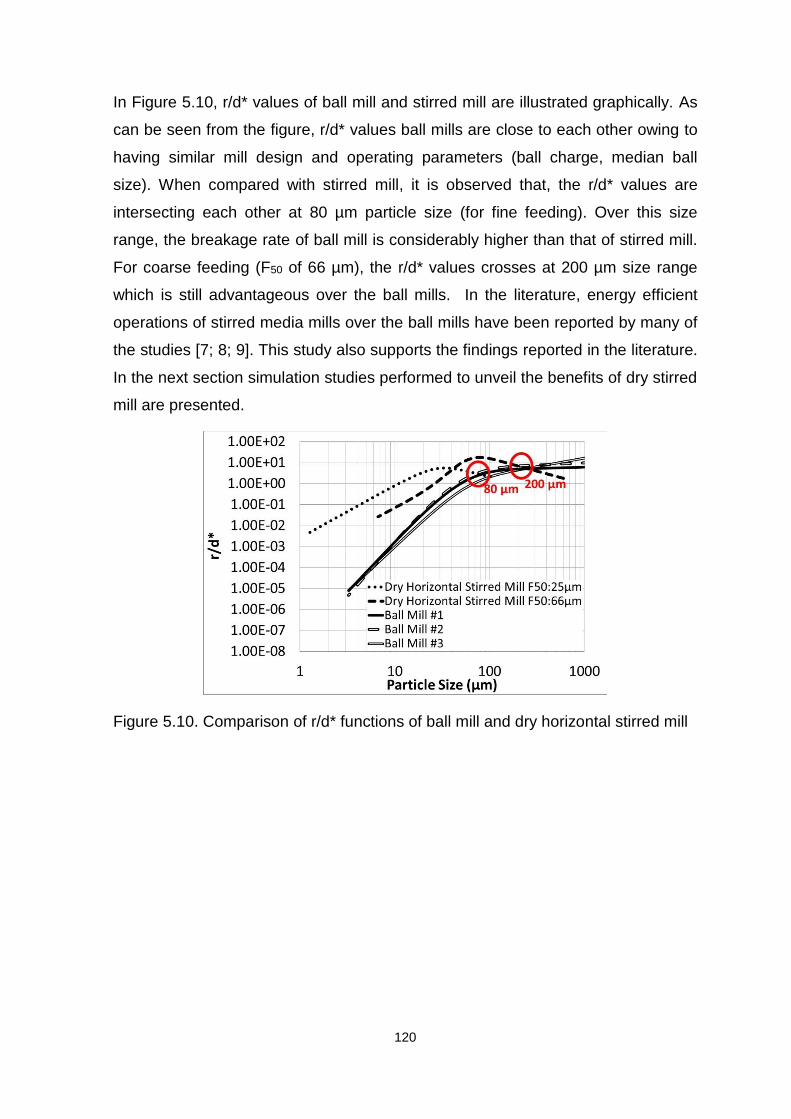
120
In Figure 5.10, r/d* values of ball mill and stirred mill are illustrated graphically. As
can be seen from the figure, r/d* values ball mills are close to each other owing to
having similar mill design and operating parameters (ball charge, median ball
size). When compared with stirred mill, it is observed that, the r/d* values are
intersecting each other at 80 µm particle size (for fine feeding). Over this size
range, the breakage rate of ball mill is considerably higher than that of stirred mill.
For coarse feeding (F50 of 66 µm), the r/d* values crosses at 200 µm size range
which is still advantageous over the ball mills. In the literature, energy efficient
operations of stirred media mills over the ball mills have been reported by many of
the studies [7; 8; 9]. This study also supports the findings reported in the literature.
In the next section simulation studies performed to unveil the benefits of dry stirred
mill are presented.
Figure 5.10. Comparison of r/d* functions of ball mill and dry horizontal stirred mill

121
6. SIMULATION STUDIES
Possible applications of dry stirred mill had previously been presented in Section
1. It is seen that wide range of applications would exist if stirred milling is found
viable in terms of energy consumption and size reduction performance. This
section aimed at evaluating the implementation of dry stirred mill into existing
cement grinding circuits with the aid of simulation techniques. For this purpose two
types of circuit designs were selected which were open circuit and closed circuit
operations. Initially, sampling campaigns was arranged around the circuits.
Afterwards, the samples were subjected to material characterization studies and
their particle size distributions were determined. Size distribution measurements
together with operating parameters were used to perform mass balancing studies.
Finally, model structures of each unit existing in the circuits were developed to
prepare a simulation platform for further studies.
6.1. Selected Circuit Configurations for Simulation Studies
The simplified flow sheets of the sampled circuits are illustrated in Figure 6.1 and
Figure 6.2. As seen from the figures, the assessments were done for both open
and closed circuit ball milling. These two grinding circuits, which are owned by a
cement plant, are operated in parallel to each other at the same cement quality
(CEM I 42.5R).
Figure 6.1. Closed circuit cement grinding operation sampled for simulation
studies

122
Figure 6.2. Open circuit cement grinding operation sampled for simulation studies
Figure 6.1 shows closed circuit cement grinding operation where a two-
compartment ball mill, mill filter and air separator are operated. On the other hand,
Figure 6.2 illustrates open circuit operation that is composed of single
compartment ball mill and mill filter. Technical specifications of the units are listed
in Table 6.1.
Table 6.1. Technical specifications of the units operating in Figure 6.1 and Figure
6.2
Open Circuit Ball Mill
Closed Circuit Ball Mill
Ball Mill
Ball Mill
Effective Diameter (m) 3.4
Effective Diameter (m) 3.4
Effective Length (m) 11
Length of 1st Chamber 4.25
Installed Motor Power (kW) 2000
Length of 2nd Chamber 7.0
Mill Filter Fan
Installed Motor Power (kW) 1696
Max. Air Quantity (m3/h) 35000
Mill Filter Fan
Fan Motor Power (kW) 40
Max. Air Quantity (m3/h) 35000
Fan Motor Power (kW) 55
Air Separator
Rotor Diameter (mm) 1860
Rotor Height (mm) 1150
Max. Rotor Velocity (rpm) 327
Installed Rotor Power (kW) 110
Max. Air Quantity (m3/h) 110000
Fan Motor Power (kW) 250

123
Prior to performing mass balancing studies followed by simulations, the sampling
campaigns around the circuits were arranged initially. Sampling survey is the
starting point of further studies therefore it should be performed carefully to
minimize errors that may occur in the following steps. In general, sampling study of
a grinding circuit is conducted at its optimum operating conditions. In other words,
the circuit is operated at its maximum allowable throughput rate that target
fineness is achieved.
Within the study, the circuits were operated around two hours until steady state
conditions were provided. Then each stream shown in the figures above was
sampled. Afterwards, the particle size distributions of the streams were determined
and then graphed to check whether the sampling surveys were performed reliably.
The mean values of operating conditions during sampling surveys are given in
Table 6.2. Moreover, Figure 6.3 and Figure 6.4 illustrate the measured size
distributions of closed circuit and open circuit milling respectively.
Table 6.2. Mean operating conditions during sampling surveys
Closed Circuit Milling Open Circuit Milling
Cement Production Type CEM I 42.5R CEM I 42.5R
Feed Rate (t/h) 34 27.4
Separator Reject Tonnage (t/h) 78 -
Separator Rotor (%) 77.6 -
Separator Rotor Power (kW) 82 -
Separator Air Fan Quantity (m3/h) 97000 -
Separator Air Fan Power (kW) 213 -
Mill Filter Fan Valve % 100 68
Mill Filter Fan Power (kW) 48 34
Mill Power (kW) 1467 1640
Elevator Amperage (A) 28.1 -
Chemical Name Sika 870 -
Chemical Dosage (g/t) 500 -
Cement Product Temperature (˚C) 103.5 113
Water Addition (L/h) - 779

124
Figure 6.3. Measured particle size distributions of the closed circuit sampling
campaign
Figure 6.4. Measured particle size distributions of the open circuit sampling
campaign
As seen from the figures above, the size distribution of each stream was
determined starting from their top size down to 1.8 µm. It is understood from the
figures that the sampling surveys were accomplished reliably as the obtained size
distributions around units are logical.

125
6.2. Mass Balance and Model Fitting of the Circuits
The measured particle size distributions were then used through the mass
balancing studies (with JK-Simmet) in order to calculate the flow rates of each
stream and to disperse errors that occurred during sampling campaigns. In Figure
6.5 and Figure 6.6, the flow rates of closed and open circuit milling are illustrated
respectively. Additionally Figure 6.7 and Figure 6.8 show comparison between
measured and calculated particle size distributions.
Figure 6.5. Calculated flow rates of closed circuit ball milling
Figure 6.6. Calculated flow rates of open circuit ball milling

126
Figure 6.7. Measured and calculated particle size distributions of closed circuit
milling
Figure 6.8. Measured and calculated particle size distributions of open circuit
milling
Good agreement between measured and calculated size distributions indicates
that the collected samples represent the milling conditions properly thus mass
balancing studies were performed with minimum error. Table 6.3 gives the
performances of the two circuit configurations with regards to energy consumption
and final product size.

127
Table 6.3. Performance evaluation of closed and open circuit ball milling
Closed Circuit
Milling Open Circuit
Milling
Total Power Utilization (kW) 1810 1674
Throughput Rate (t/h) 34 27.4
Specific Energy Consumption (kWh/t) 53.24 61.09
Final Product, P50 (µm) 13.74 15.68
Final Product, P80 (µm) 31.52 39.08
As can be understood from the table above, despite of being operated at the same
production types the production rates of the two circuits vary considerably. The
open circuit configuration is the more problematic one since there is a temperature
rising problem in the ball mill. The differences in product temperatures between
open and closed circuit can be followed from Table 6.2. The temperature problem
is due to the processed material and target fineness. In CEM I 42.5R type
production, 90% of the feed is composed of clinker having high temperature as it is
a product of pyrometallurgical operation (rotary kiln). Therefore it is inevitable to
obtain high product temperature levels as the feed material comes in ball mill is
already hot and target product is too fine for open circuit design. Because of that,
production rate is not allowed to be increased any further. In general, the
temperature in ball mills is controlled by providing sufficient amount of mill
ventilation however in open circuit designs ventilation directly affects the product
fineness. Therefore mill ventilation is limited with target fineness. Open circuit
design some drawbacks in cement production.
Mass balancing studies were followed by model fitting of each unit. For closed
circuit milling, model structures of ball mill and air separator were developed while
only ball mill model was fitted in open circuit milling. Within the study, ball mill
model was developed by using perfect mixing approach (Equations 5.1 and 5.2).
In Figure 6.9, back-calculated r/d parameters by using JK-SimMet software are
illustrated graphically.

128
Figure 6.9. r/d function of the ball mill in closed circuit (left) and open circuit (right)
Air separator model was fitted by using Whiten’s efficiency curve approach exist in
JK-SimMet. The mathematical expression of the equation, which uses overflow
efficiency of separation process, is given in Equation 6.1 [1].
(6.1)
Where;
X : d/d50c
d : Particle size
d50c : Corrected cut size
β : Parameter that controls the initial rise of the curve in fine sizes
α : Sharpness of separation
β* : Parameter that preserves the definition of d50c ; d=d50c when E=(1/2)C
C : Fraction subjected to real classification; (1-Bypass)
Eoa : The actual efficiency to overflow
The efficiency curve of air separator and back-calculated parameters are given in
Figure 6.10 and Table 6.4 respectively.
2)exp()exp(
1exp1*
*
X
XCEoa

129
Figure 6.10. Efficiency curve of air separator
Table 6.4. Efficiency curve parameters of air separation process
C 68.29
α 1.05
ß 1.58
d50c 0.04
ß* 2.82
6.3. Simulation Scenarios Prepared for Dry Stirred Mill Operation
6.3.1. The Use of Dry Horizontal Stirred Mill in Finish Grinding
The simulation scenario prepared for the finish grinding application was to push
the entire circuit to produce coarser product initially then performing final grinding
with a stirred media mill to achieve target fineness. While choosing the grind size
of closed cement grinding circuit, specific energy consumption of stirred media mill
was taken into consideration. In fact, it was aimed to consume around 8-10 kWh/t
of specific energy in stirred mill, which corresponds to RRd80 of 1.26 (Section
4.7.3, Figure 4.29), therefore the closed circuit system was pushed to produce P80
of 39 µm. Simulation studies showed that if the grinding circuit was operated at 50
t/h production rate, it would produce P80 of 39 µm (Figure 6.11). This size of
material was then fed to stirred mill to achieve target P80 of 31 µm (Figure 6.12).

130
Figure 6.11. The differences in product size distributions obtained from closed
circuit ball milling at different throughput rates
Figure 6.12. Simulation results of closed circuit operation
For closed circuit operation, another alternative including the use of a second
separator was developed. The second separator was commissioned ahead of the
existing one with the aim of collecting already finished particles and reducing the
work load of stirred mill. This alternative brings extra separator investment cost
however, leads to manufacturing of stirred mill with less capacity compared to the
previous one. The economic facts should be considered to find out which
alternative is feasible, either building a larger scale stirred mill (50 t/h) or
purchasing air separator and 30 t/h stirred mill. The simulation results are
illustrated in Figure 6.13. As can be seen from the figure, overall circuit production
rate was increased from 34 t/h to 55 t/h. With this alternative, 10% more increase

131
was achieved compared to the Figure 6.12. While assessing the energy
consumption of the circuit, motor size of the commissioned air separator was
considered as well. Half size of motor and fan of the existing separator was
thought to be sufficient.
Figure 6.13. Simulation results of closed circuit operation with double separator
The simulation study for open circuit operation was performed in the same
manner. Initially, the ball mill was simulated so as to produce P80 of 48 µm.
Simulation studies indicated that production rate of ball mill could be increased up
to 55 t/h (Figure 6.14 and Figure 6.15). Then the product of ball mill was fed to
stirred mill where desired product P80 of 39 µm was produced. In stirred media
milling operation size reduction of 1.24 was achieved that equalled to around 9
kWh/t specific energy consumption. Further assessments are presented in the
following tables.
Figure 6.14. The differences in product size distributions obtained from open
circuit ball milling at different throughput rates

132
Figure 6.15. Simulation results of open circuit operation
The practicability of stirred media milling operation was assessed by comparing
specific energy consumption of the entire circuit before and after the simulation
studies. In energy calculations, it was assumed that the power utilization of each
unit was independent of throughput rate. In other words, the same values of power
utilizations were used for simulated conditions. In addition to ball mill circuit,
specific energy of stirred milling was taken into consideration as well. As indicated
previously, 8-10 kWh/t of energy was required for stirred milling to obtain 1.24-1.27
of reduction ratio. Table 6.5 summarizes the obtained result from simulation
studies.
It is understood from Table 6.5 that the use of stirred media mill has brought two
main advantages which are; increased overall capacity and reduced specific
energy consumption. The calculations showed that 15.1% of energy saving was
achievable for closed circuit configuration where energy saving could reach up to
35.45% in open circuit design. With regards to capacity improvements, closed
circuit operation could increase its capacity by 47.06% while 103.7% increase is
possible for open circuit design (when compared with data in Table 6.2).
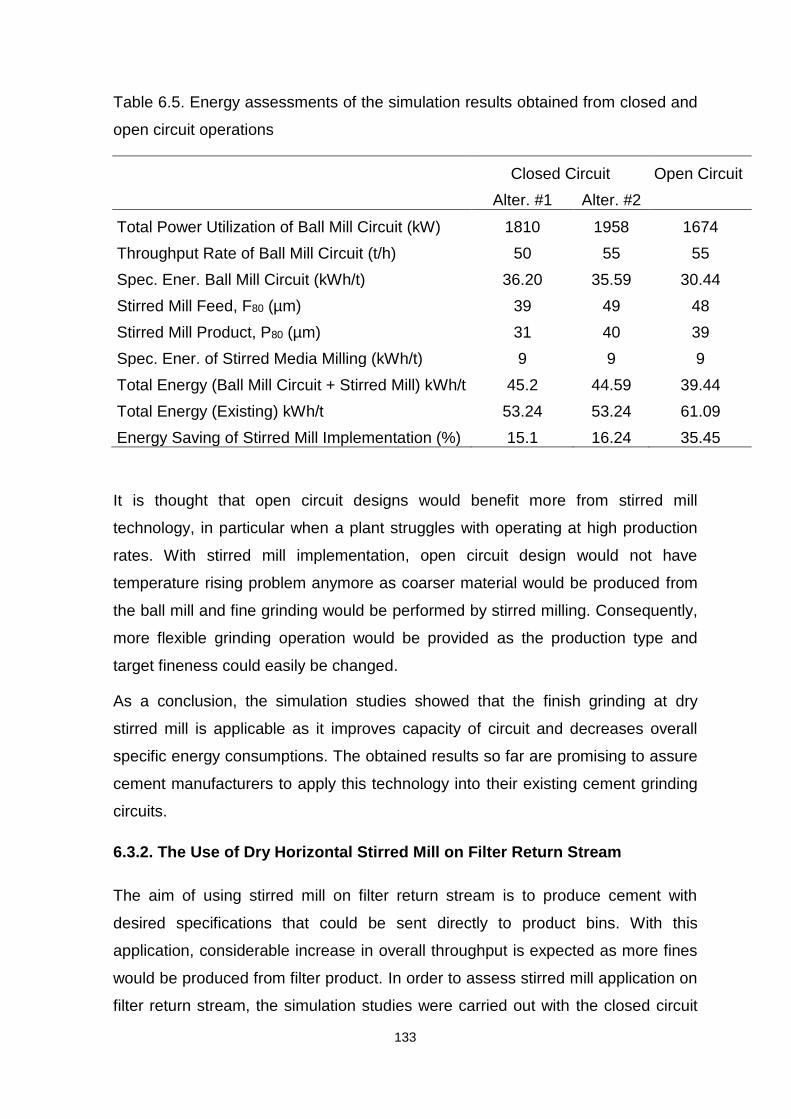
133
Table 6.5. Energy assessments of the simulation results obtained from closed and
open circuit operations
Closed Circuit Open Circuit
Alter. #1 Alter. #2
Total Power Utilization of Ball Mill Circuit (kW) 1810 1958 1674
Throughput Rate of Ball Mill Circuit (t/h) 50 55 55
Spec. Ener. Ball Mill Circuit (kWh/t) 36.20 35.59 30.44
Stirred Mill Feed, F80 (µm) 39 49 48
Stirred Mill Product, P80 (µm) 31 40 39
Spec. Ener. of Stirred Media Milling (kWh/t) 9 9 9
Total Energy (Ball Mill Circuit + Stirred Mill) kWh/t 45.2 44.59 39.44
Total Energy (Existing) kWh/t 53.24 53.24 61.09
Energy Saving of Stirred Mill Implementation (%) 15.1 16.24 35.45
It is thought that open circuit designs would benefit more from stirred mill
technology, in particular when a plant struggles with operating at high production
rates. With stirred mill implementation, open circuit design would not have
temperature rising problem anymore as coarser material would be produced from
the ball mill and fine grinding would be performed by stirred milling. Consequently,
more flexible grinding operation would be provided as the production type and
target fineness could easily be changed.
As a conclusion, the simulation studies showed that the finish grinding at dry
stirred mill is applicable as it improves capacity of circuit and decreases overall
specific energy consumptions. The obtained results so far are promising to assure
cement manufacturers to apply this technology into their existing cement grinding
circuits.
6.3.2. The Use of Dry Horizontal Stirred Mill on Filter Return Stream
The aim of using stirred mill on filter return stream is to produce cement with
desired specifications that could be sent directly to product bins. With this
application, considerable increase in overall throughput is expected as more fines
would be produced from filter product. In order to assess stirred mill application on
filter return stream, the simulation studies were carried out with the closed circuit

134
grinding operation (Figure 6.1), which was already model fitted. In addition to
existing models, the stirred mill model was introduced into the circuit with JK-
SimMet software. Stirred mill model was developed with the data produced from
Test 14 by using perfect mixing approach.
Once the model of each unit was developed, the studies focussed on simulating
the entire circuit at the same product fineness. Figure 6.16, Figure 6.17 and Table
6.6 summarize the results of simulation studies. As can be seen from the figure,
the production rate of 34 t/h (Figure 6.5) increased to 42 t/h at the same product
fineness in case stirred mill is used on filter return stream. According to the
calculations, dry stirred mill processes 14 t/h material.
Figure 6.16. The calculated flow rates of simulation studies
Figure 6.17. Product size distributions of the studies
The simulation results given in Table 6.6 imply that the use of stirred mill on filter
return stream contributes a 23.5% increase in production rate in the meantime

135
3.7% decrease in specific energy consumption of the grinding circuit. It seems the
stirred mill application is viable for filter return stream operations.
Table 6.6. Energy assessments of simulation results obtained from filter return
studies
Before
Simulation After
Simulation
Total Power Utilization of Ball Mill Circuit (kW) 1810 1810
Production Rate of the Circuit (t/h) 34 42
Final Product, P50 (µm) 14 14
Spec. Energy Consumption of Ball Mill Circuit (kWh/t) 53.24 43.09
Spec. Ener. Con. of Stirred Media Milling (kWh/t) - 8.2
Total Energy (Ball Mill Circuit + Stirred Mill) kWh/t 53.24 51.29

136
7. RESULTS and DISCUSSIONS
Within the context of the study, a dry horizontal stirred mill was developed, with the
partnership of Netzsch-Feinmahltechnik GmbH, to be used for cement grinding
purpose. As the dry horizontal stirred mill was newly developed technology, some
problems occurred owing to transportation difficulties of material along the mill,
then were solved with the use of water jacketed mill chamber, introduction of
grinding aids (adjusting the rheology of bulk material) and air supply from the feed
inlet. Ultimately, sustainable grinding operation was provided (Section 3.3). These
two parameters (grinding aid and air flow) were of crucial importance therefore
initial studies focussed on optimizing them. The results of the test studies were
presented in Section 4.1 and Section 4.2. After that, the rest of the test works
(stirrer speed, feed rate etc.) were performed at optimized conditions.
Stirred mill performance is affected by many parameters and in this study many of
them were investigated. The studies concluded that;
Increase of the stirrer speed produced finer material up to a point that further
addition of energy was converted into heat causing decreased efficiency of the
grinding operation.
Lower media fillings created inefficient grinding environment. In other words,
higher specific energies were required for lower media fillings to obtain higher size
reduction values.
The feed rate had mainly two major effects on grinding performance, which were
the specific energy consumption and the product fineness. Increasing feed rate
decreased specific energy consumption thus coarser product was obtained as
expected.
The selection of media size is another parameter affecting the grinding operation.
The experimental results showed that the use of finer media was advantageous
over the coarser one and 27% energy saving was achievable. Besides, it was
suggested that, with this design of the mill for cement grinding purpose, 4 mm
media size was the lowest limit as no difference in size reduction and energy
efficiency were observed compared to 3 mm media size.

137
The mill performance at varying feed size distribution was also investigated
(Section 4.7). The test results implied that obtained size reduction was much more
rapid for coarse grinding when compared with relatively fine feeding (Figure 4.30).
As a result of the test studies, F50 of 25 µm was determined as the optimum feed
size that efficient grinding took place (Figure 4.31). When the top size of this
material (150 µm) was divided by the media size used in grinding tests (4 mm),
Dball/Dparticle ratio was found as 27:1. The difference with the literature may be due
to mill design, material and media properties.
The studies showed that, the slope of the feed and product size distributions were
similar to each other for final product stream and filter return stream grinding. This
behaviour of the dry mill was different from IsaMill operations, where the
classification effect and the selective grinding of coarser particles were observed.
In contrast to results obtained from fine material test studies (final product and
filter return) separator reject stream test works indicated that that the slope of the
size distribution was affected by the operating parameters, i.e. feed rate, stirrer
speed, media filling. It is thought that further investigation would be beneficial to
understand whether the difference in n values of two size distributions, i.e. 1.3 and
0.8, have considerable effect on cement properties. Statistically there may not be
a significant difference between the two values however what really matter is its
effects on cement properties. In the literature some studies were carried out to
reveal the slope effect on cement strength [81; 82]. This was not in the scope of
this study.
Within the study, grinding performances of 42 L mill and 23 L mill were compared
on final product stream. The results concluded that 42 L mill utilized less energy
compared to 23 L mill operated at the same milling conditions. Furthermore the
benefits of using water circulation were revealed. It was understood that the use of
water jacketed mill chamber (23 L mill) enabled performing the tests at intense
conditions as well.
Stirrer design had effects on power draw thus specific energy consumption of the
mill. Within the study, the disc type stirrer was found to be an energy efficient
design in particular when operating at higher energy levels. However there could
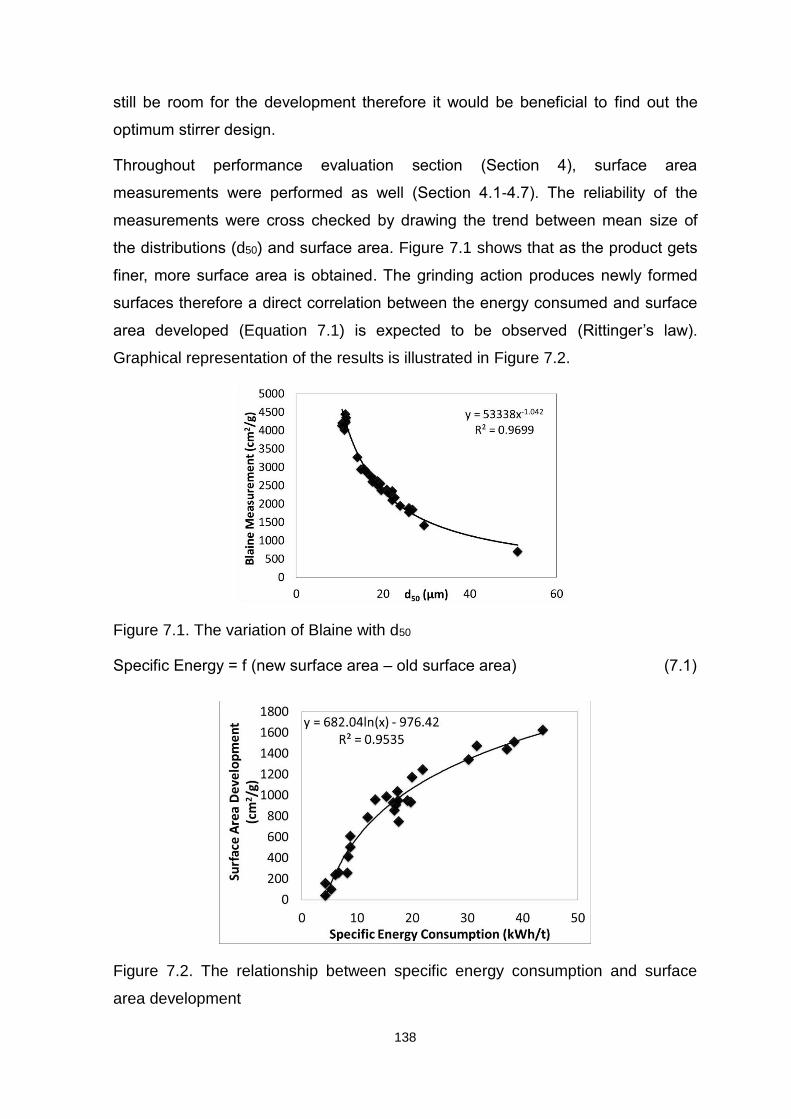
138
still be room for the development therefore it would be beneficial to find out the
optimum stirrer design.
Throughout performance evaluation section (Section 4), surface area
measurements were performed as well (Section 4.1-4.7). The reliability of the
measurements were cross checked by drawing the trend between mean size of
the distributions (d50) and surface area. Figure 7.1 shows that as the product gets
finer, more surface area is obtained. The grinding action produces newly formed
surfaces therefore a direct correlation between the energy consumed and surface
area developed (Equation 7.1) is expected to be observed (Rittinger’s law).
Graphical representation of the results is illustrated in Figure 7.2.
Figure 7.1. The variation of Blaine with d50
Specific Energy = f (new surface area – old surface area) (7.1)
Figure 7.2. The relationship between specific energy consumption and surface
area development

139
As can be seen from Figure 7.2, surface area and specific energy consumption
parameters are directly proportional to each other. Decreasing slope at higher
energy levels indicates that the mill is getting close to its grinding limits while trying
to produce more surfaces. Similar trend was also reported by Pilevneli [83] who
conducted a Ph. D thesis on fine cement grinding with a vertical stirred mill.
Within the thesis dry stirred mill model was developed with the perfect mixing
approach. In these studies, r/d* values were back calculated (with JKSimMet
software) for a given feed and product size distributions as well as the breakage
distribution, which was determined by a novel technique developed by Ekşi [80].
The studies correlating r/d values with operating parameters concluded that, at
constant throughput (constant discharge rate) increasing stirrer speed and media
filling increased the breakage rate of the particles as well. Additionally, increasing
feed rate and feeding coarser material resulted in obtaining lower r/d function.
Similar conclusions have also been reached by Dikmen [33] who conducted a Ph.
D thesis on modelling of wet stirred mill.
Within the scope of the thesis, simulation studies were performed to find out
whether the use of stirred mill in existing cement grinding circuits was viable. For
this purpose, cement plant having two different circuit designs, open and closed
circuit, producing the cement with the same quality figures was selected. Initially
the sampling campaigns then the material characterization studies were
performed. Afterwards, the circuits were mass balanced and the models of each
unit were developed. Once the models were developed, varieties of simulation
scenarios were prepared. The simulation studies concluded that, the use of stirred
media mill had brought two main advantages which were; increased overall
capacity and reduced specific energy consumption. The calculations on finish
grinding applications of stirred mill showed that 15.1% of energy saving was
achievable for closed circuit configuration where energy saving could reach up to
35.45% in open circuit design. With regards to capacity improvements, closed
circuit operation could increase its capacity by 47.06% while 103.7% increase is
possible for open circuit design. Another simulation study was performed on filter
return stream application of stirred mill. The results implied that stirred mill
contributed a 23.5% increase in production rate in the meantime 2.2% decrease in
specific energy consumption of the grinding circuit. With its current performance,

140
stirred mill operation in cement grinding circuit seemed viable. However, further
improvements in performance could lead to lower energy figures that makes the
use of stirred mill inevitable in the future.
Although the simulation results are promising it is thought that dry stirred mill
performance would be improved. In this context future studies will be focussing on;
Finding optimum mill geometry
Further improvement in material transportation
Finding optimum stirrer design
For both cement producers and machine manufacturers wear rate of internal
components e.g., shaft, stirrers, media, is of crucial importance since it brings
extra operational and maintenance costs. Therefore, the future studies should
present the wear measurements as well.
In the final study of the thesis, a scaling up procedure was developed between 23
L mill and 42 L mill. Scaling up defines the probability of obtaining the same
grinding results irrespective of the mill dimensions. Kwade and Stender [60]
reported that the same grinding performance, in other words constant grinding,
could be obtained when the two of the net specific energy, stress intensity and
stress number parameters are set constant. Within the study, this methodology
was verified. The adjusted milling conditions for scaling-up tests are given in Table
7.1.
Table 7.1. The milling conditions adjusted for constant grinding tests at different
mill geometries
Mill Volume (L) 23* and 42
Media Type Steel
Stirrer Type Disc
Chemical Type EPCT-01
Chemical Amount (g/t) 700
Air Flowrate (L/h) 1000
* Water was not circulated from 23 L mill chamber
The experimental conditions and the obtained results are given in Table 7.2. As
can be understood from the table, the test works were performed at two cases

141
having different specific energy values. Additionally, for each of the cases, the
tests carried out at the same stirrer speed, media size and media type indicating
stress intensity parameter was constant. In the meantime, the feed rate was
adjusted to achieve the same net specific energy values. As a conclusion, it is
expected that the fixed net specific energy and stress intensity could lead
obtaining the same grinding results. Figure 7.3 illustrates the feed and product size
distributions of each test works.
Table 7.2. The experimental conditions and the obtained results from scaling up
tests
Case #1 Case #2
The experimental conditions Test 1 Test 2 Test 3 Test 4
Mill Volume (L) 23 42 23 42
Stirrer Speed (m/s) 4.34 4.34
Media Size (mm) 6 6
Media Filling (%) 50 50
Feed Rate (kg/h) 154.4 266.4 66.6 112.3
Feed Size F50 (µm) 22.28 22.89
The experimental results Test 1 Test 2 Test 3 Test 4
Mill Power (kW) 2.26 3.15 2.32 3.2
No Load Power (kW) 1.12 1.12 1.12 1.12
Specific Energy (kWh/t) 14.64 11.82 34.83 28.49
Net Specific Energy (kWh/t) 7.38 7.62 18.02 18.52
Stress Intensity Const. Const. Const. Const.
Product Size, P50 (µm) 17.56 17.24 13.97 13.86
Amount of material inside the mill (kg) 12.5 17.68 11.3 12.5
Material Load (%) 80.73 114.18 72.98 80.73
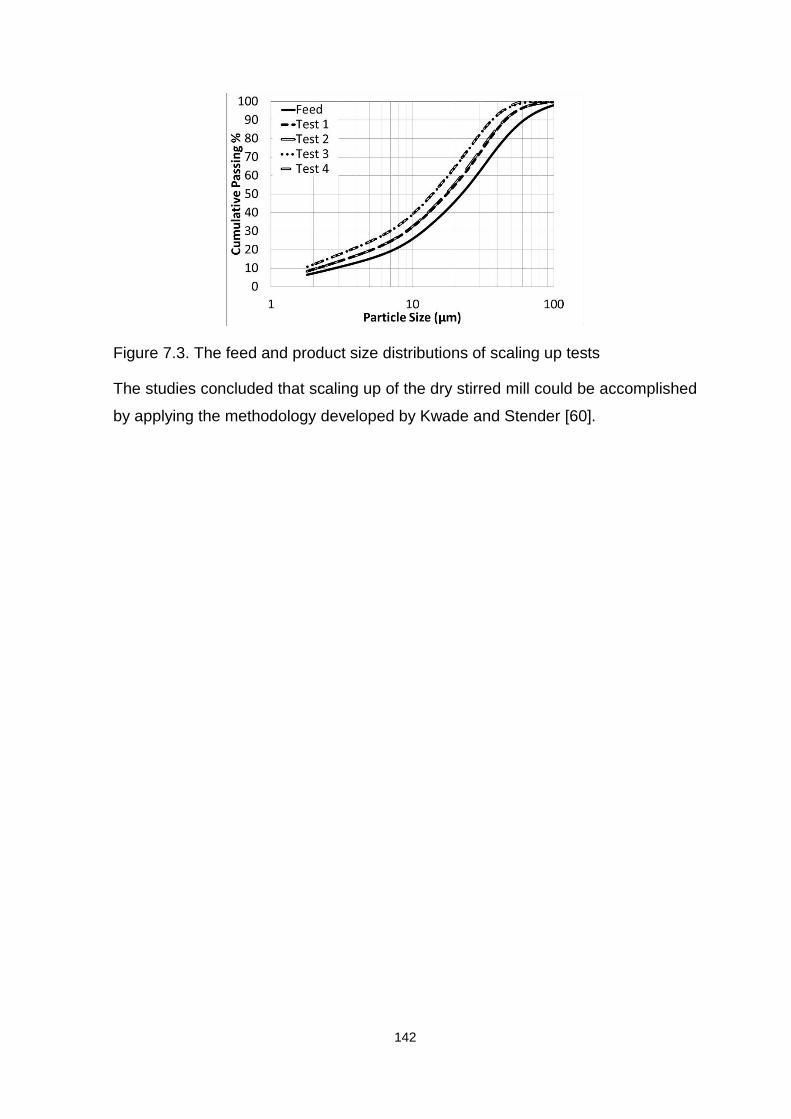
142
Figure 7.3. The feed and product size distributions of scaling up tests
The studies concluded that scaling up of the dry stirred mill could be accomplished
by applying the methodology developed by Kwade and Stender [60].

143
8. CONCLUSIONS
Within the thesis study, a prototype dry horizontal stirred mill manufactured
by Netzsch Feinmahltechnik GmbH was tested on cement grinding area.
Although the operational problems occurred during initial grinding studies,
they were overcome with the use of grinding chemical and air from the feed
inlet.
The studies showed that 18% improvement in product quality was
achievable provided that the proper chemical was selected and air flow was
adjusted.
The effects of operating conditions were investigated and compared with
the related literature.
Performance evaluation data produced with dry horizontal stirred mill was
used to optimize the milling conditions. Up to 27% saving in energy
consumption was obtained when operating conditions were adjusted
properly.
The dry horizontal stirred mill can be modelled with the perfect mixing
approach and the relationships between r/d* functions and operating
conditions can be developed.
Simulation studies performed at open and closed circuit configurations
where stirred mills were employed indicated that energy saving up to 35%
was achievable. The thesis study concluded that the dry horizontal stirred
mill application was viable with different cement grinding circuit
configurations.

144
REFERENCES
[1] Napier-Munn, T.J., Morrell, S., Morriison, R.D, Kojovic, T. (1996). Mineral
comminution circuits-Their operation and optimization. Brisbane: JKMRC
monograph series in mining and mineral processing.
[2] Young, J.D. and Gao, M. (2000). Performance of the IsaMills in the George
Fisher flowsheet. Seventh Mill Operators' Conference, October 12-14,
Kalgoorlie, Australia.
[3] Wang, Y., Forssberg, E., Sachweh, J. (2004). Dry fine comminution in a
stirred media mill-MaxxMill. International journal of Mineral Processing 74,
pp. 64-75.
[4] Stehr, N. (1988). Recent developments in stirred ball milling. International
Journal of Mineral Processing 22 (1-4), pp. 431-444.
[5] Schilling, E. R. and Yang, M. (2000). Attritor grinding mills and new
developments. Panamerican Coatings Conference (Mexico City).
[6] Sepulveda, J. L. (1981). A detailed study on stirred ball mill grinding. Ph. D
thesis, Department of Metallurgy and Metallurgical Engineering, The
University of Utah, the USA.
[7] Corrans, I. J. and Angove, J. E. (1991). Ultra fine milling for the recovery of
refractory gold. Minerals Engineering 4 (7-11), pp. 763-776.
[8] Jankovic, A. (2003). Variables affecting the fine grinding of minerals using
stirred mills. Minerals Engineering 16 (4), pp. 337-345.
[9] Keith, R. S. (1990). Hilton inaugurated a new step in Mt. Isa's future.
Engineering and Mining Journal 191 (10), pp. 32-35.
[10] Shi, F., Morrison, R., Cervelin, A., Burns, F., Musa, F. (2009). Comparsion
of energy efficiency between ball mills and stirred mills in coarse grinding.
Minerals Engineering 22 (7-8), pp. 673-680.
[11] Svedala. (1993). Energy-saving ultra fine grinding with SALA agitated mill.
Zement-Kalk-Gips 46 (9), pp. 600-601.

145
[12] Lofthhouse, C. H. and John, F. E. (1999). The Svedala detritor and the
metals industry. Minerals Engineering 12 (2), pp. 205-217.
[13] Jankovic, A. (1999). Mathematical modelling of stirred mills. Ph. D Thesis,
University of Queensland, JKMRC, Brisbane, Australia.
[14] Lynch, A. J. and Rowland, C. A. (2005). The history of grinding. Society for
Mining, Metallurgy and Exploration, Inc. (SME).
[15] Eirich Corp. (2013). TowerMill. http://www.eirich.com/en/tower-mill.
[16] Svedala. (1995). "SAM" The SALA agitated Mill. 2 pages.
[17] Metso. (2005c). Stirred Milling, Vertimill grinding mills & Stirred media
detritor. www.metsominerals.com, Brochure No: 2357-02-10 MBL.
[18] Allen, J. (2010). Advances in stirred milling: Improving profitability of copper
ore processing. Mining Weekly.
[19] Metso. (2005a). Vertimill, fine and ultra fine wet grinding.
www.metsominerals.com, Brochure No: 1727-04-05-MPR/York.
[20] Metso. (2005b). Stirred Media Detritor. www.metsominerals.com, Brochure
No: 340 02-02.
[21] Nassetti, G. and Hessling, G. (2003). Application of the MaxxMill fro the
final grinding of unglazed porcellanato tile mixes. Special reprint from the
technical magazine "cfi ceramic forum international" (1-2).
[22] Gerl, S. and Sachweh, J. (2007). Plant concepts for ultrafine dry grinding
with the agitated media mill MaxxMill®. Minerals Engineering 20 (4), pp.
327-333.
[23] Günter, H., Theisenn, W., Wetzel, D. (2000). MaxxMill - dry and wet
grinding with stirred ball mills in comparison with conventional tumbling
mills. Aufbereitungs Technik 41 (6), pp. 278-283.
[24] Durr, H. (1976). Patent No. U.S. Patent 3 957 210.
[25] Pease, J. D., Young, M. F., Curry, D. C. (2005). Fine grinding as enabling
technology - The IsaMill. Brisbane, Australia: Crushing and Grinding
Symposium.

146
[26] Gao, M., Young, M., Allum, P. (2002). IsaMill fine grinding technology and
its industrial applications at Mt. Isa Mines. Proceedings of the 34th annual
meeting of the Canadian Mineral Processors, Ottawa, Canada, pp. 171-
188.
[27] Way, H. (1997). Particle size reduction of ceramic powders using a small
media mill. Research and Development Department of Netzsch
Feinmahltechnik.
[28] Clark, L. (2007). Grinding comparison test of IsaMills with Tower Mills using
magnetite. Xstrata technology, Technical Notes.
[29] Burford, B. D. and Clark, L. (2007). IsaMill technology used in efficient
grinding circuits. VIII International Conference on Non-ferrous Ore
Processing. Wroclaw, Poland.
[30] Becker, M. and Schwedes, J. (1999). Comminution of ceramics in stirred
media mills and wear of grinding beads. Powder Technology 105 (1-3), pp.
374-381.
[31] Gao, M. and Forssberg, E. (1995). Prediction of product size distributions
for a stirred ball mill. Powder Technology 84 (2), pp. 101-106.
[32] Zheng, J., Harris, C. C., Somasundaran, P. (1996). A study on grinding and
energy input in stirred media mills. Powder Technology 86 (2), pp. 171-178.
[33] Dikmen, S. (2008). Modelling of the performance of stirred media mills in
regrinding circuits. Ankara, Turkey: Ph. D Thesis, Hacettepe University.
[34] Fadhel, H. and Frances, C. (2001). Wet batch grinding of alumina in a
stirred bead mill. Powder Technology 119 (2-3), pp. 257-268.
[35] Pilevneli, C. C., Kizgut, S., Toroglu, T., Cuhadaroglu, D., Yigit, E. (2004).
Open and closed circuit dry grinding of cement mill rejects in a pilot scale
vertical stirred mill. Powder Technolgy 139 (2), pp. 165-174.
[36] Sadler III, L. Y., Stanley, D. A, Brooks, D. R. (1975). Attrition mill operating
characteristics. Powder Technology 12 (1), pp. 19-28.

147
[37] Farber, Y. B., Durant, B., Bedesi, N. (2011). Effect of media size and
mechanical properties on milling efficiency and media consumption.
Minerals Engineering 24 (3-4), pp. 367-372.
[38] Mankosa, M. J., Adel, G. T., Yoon, R. H. (1986). Effect of media size in
stirred ball mill grinding of coal. Powder Technology 49 (1), pp. 75-82.
[39] Kwade, A., Blecher, L., Schwedes, J. (1996). Motion and stress intensity of
grinding beads in stirred media mill Part 2: Stress intensity and its effect on
comminution. Powder Technology 86 (1), pp. 69-76.
[40] Mende, S., Stenger, F., Peukert, W., Schwedes, J. (2004). Production of
sub micron particles by wet comminution in stirred media mills. Journal of
Materials Science 39 (16-17), pp. 5223-5226.
[41] Persson, H. and Forssberg, E. (1994). Fine grinding of a magnetite ore with
a stirred ball mill. Aufbereitungs Technik 35 (6), pp. 307-320.
[42] Schollbach, A. E. (1999). Influence of the grinding media size on
comminution in stirred ball mills with additional introduction of vibrations.
Aufbereitungs Technik 40 (6), pp. 259-267.
[43] Wang, Y. and Forssberg, E. (2000). Product size distribution in stirred
media mills. Minerals Engineering 13 (4), pp. 459-465.
[44] Gao, W. and Forssberg, E. (1993). A study on the effect of parameters in
stirred ball milling. International Journal of Mineral Processing 37 (1-2), pp.
45-59.
[45] Sivamohan, R. and Vachot, P. (1990). A comparative study of stirred and
vibratory mills for the fine grinding of muscovite, wollastonite and kaolinite.
Powder Technology 61 (2), pp. 518-523.
[46] Strasser, S., Somani, R. A., Dembla, A. K. (1997). Improvements in the
production of raw meal and cement by the combined use of roller press and
V-Separator. ZKG 3 (50) , 140-146.
[47] Klimpel, R. R. and Manfroy, W. (1978). Chemical grinding aids for
increasing throughput in the wet grinding of ores. Ind. Eng. Chem. Process
Des. Dev. 17 (4), pp. 518-523.

148
[48] Rehbinder, P. A., Kalinkovskaya, N. A. (1932). Decrease in the surface
energy of solid-bodies and the work of dispersion during formation of an
adsorption layer. J. Tech. Phys. USSR (2), p. 726-755.
[49] Kapur, P. C., Healy, T. W., Scales, P. J., Boger, D. V., Wilson, D. (1996).
Role of dispersant in kinetics and energetics of stirred ball mill grinding.
International Journal of Mineral Processing 47 (1-2), pp. 141-152.
[50] Zheng, J., Harris, C. C., Somasundaran, P. (1997). The effect of additives
on stirred media milling of limestone. Powder Technology 91 (3), pp. 173-
179.
[51] Choi, H., Lee, W., Kim, D. U., Kumar, S., Kim, S. S., Chung, H. S., Kim, J.
H., Ahn, Y. C. (2010). Effect of the grinding aids on the grinding energy
consumed during grinding of calcite in a stirred ball mill. Minerals
Engineering 23 (1), pp. 54-57.
[52] Blecher, L., Kwade, A., Schwedes, J. (1996). Motion and stress intensity of
grinding beads in stirred media mill. Part I: Energy density distribution and
motion of single grinding beads. Powder Technolgy 86 (1), pp. 59-68.
[53] Theuerkauf, J. and Schwedes, J. (2000). Investigation of Motion in Stirred
Media Mills. Chemical Engineering and Technology 23 (3), pp. 203-209.
[54] Eskin, D., Zhupanska, O., Hamey, R., Moudgil, B., Scarlett, B. (2005).
Microhydrodynamics of stirred media milling. Powder Technology 156 (23),
pp. 95-102.
[55] Jayasundara, C. T., Yang, R. Y., Yu, A. B., Curry, D. (2006). Discrete
particle simulation of particle flow in the IsaMill process. Industrial &
Engineering Chemistry Research 45 (18), pp. 6349-6359.
[56] Yang, R. Y., Jayasundara, C. T., Yu, A. B., Curry, D. (2006). DEM
simulation of the flow of grinding media in Isamill. Minerals Engineering 19
(10), pp. 984-994.
[57] Westhuizen, A. P., Govender, I., Mainza, A. N., Rubenstein, J. (2011).
Tracking the motion of media particles inside an IsaMill™ using PEPT .
Minerals Engineering 24 (3-4), pp. 195-204.

149
[58] Jayasundara, C. T., Yang, R. Y., Guo, B. Y., Yu, A. B., Govender, I.,
Mainza, A., Westhuizen, A., Rubenstein, J. (2010). CFD-DEM modelling of
particle flow in IsaMills – Comparison between simulations and PEPT
measurements. Minerals Engineering 24 (3-4), pp. 181-187.
[59] Kwade, A. (1999 (b)). Jayasundara, C. T., Yang, R. Y., Guo, B. Y., Yu, A.
B., Govender, I., Mainza, A., Westhuizen, A., Rubenstein, J. Powder
Technology, pp. 382-388.
[60] Kwade, A. and Stender, H. (1998). Constant grinding results at scale-up of
stirred media mills. Aufbereitungs Technik 39 (8), pp. 373-382.
[61] Jankovic, A. (2001). Media stress intensity analysis for vertical stirred mills.
Minerals Engineering (14 (10), pp. 1177-1186.
[62] Kwade, A. (1999 (a)). Wet comminution in stirred media mills — research
and its practical application. Powder Technology 105 (1-3), pp. 14-20.
[63] Kwade, A. (2003). A Stressing Model for the Description and Optimization
of Grinding Process. Chemical Engineering Technology 26 (2), pp. 199-
205.
[64] Weller, K. R., Gao, M., Bowen, P. (1999). “Scaling-Up Horizontal Stirred
Mills From a 4-Litre Test Mill. Powder Technology Symposium.
Pennsylvania State University, USA.
[65] Curry, D. C., Clark, L. W., Rule, C. (2005). Collaborative Technology
Development – Design and operation of the World’s largest stirred mill.
Randol Innovative Metallurgy Conference. Perth, Australia.
[66] Karbstein, H., Müller, F., Polke, R. (1996). Scale up for grinding in stirred
ball mills. Aufbereitungs Technik 37 (10), pp. 469-479.
[67] Gao, M-W., Forssberg, E., Welleri K. R. (1994). Power predictions for a pilot
scale stirred ball mill. Procc. XIII Europian Comminution Conference,
Stocholm, pp. 698-709.
[68] Herbst, J. A. and Sepulveda, J. L. (1978). Fundamentals of Fine and
Ultrafine Grinding in a Stirred Ball Mill. International Powder and Bulk Solids
Handling and Processing: Proceedings held Rosemount Illinois, pp. 452-
470.

150
[69] Tuzun, M. A. (1993). A detailed study on comminution in a vertical stirred
ball mill. South Africa: Ph. D Thesis, University of Nadal.
[70] Weit, H. and Schwedes, J. (1987). Scale-up of Power Consumption in
Agitated Ball Mills. Chemical Engineering Technology (10), pp. 398-404.
[71] Chryso. (2008). CHRYSO Cem AMT 2X, Technical grinding-aid.
uk.chryso.com/upload/t_documents/Fichier_L1/43002/CHRYSOAMT2X.pdf.
[72] Sottili, L. and Padovani, D. (2002). Effect of grinding aids in the cement
industry. Petrocem (pp. 1-16). Cement Additives Division-MAPEI Italy.
[73] Allen, T. (2003). Powder sampling and particle size determination first ed.
Elsevier Science 682 p.
[74] Austin, L. G., Klimpel, R. R., Luckie, P. T. (1984). Process engineering of
size reduction:Ball milling, 561 pages. Society of Mining Engineers of the
American Institute of Mining, Metallurgical and Petroleum Engineers.
[75] Krajcinovic, D. (1996). Damage mechanics. UK: Elsevier.
[76] Schönert, K. (1991). Advances in comminution fundamentals and impacts
on technology. Aufbereitungs Technik 32, pp. 487-494.
[77] Tavares, L. M. and King, R. P. (1988). Single-particle fracture under impact
loading. International Journal of Mineral Processing 54, pp. 1-28.
[78] Yue, J. and Klein, B. (2005). Particle breakage kinetics in horizontal stirred
mills. Minerals Engineering 18 (3), 325-331.
[79] Genc, O. (2008). An investigation on the effects of design and operational
parameters on grinding performance of multi-compartment ball mills used in
the cement industry. PhD Thesis, Mining Engineering Department,
University of Hacettepe, Ankara, Turkey.
[80] Eksi, D. (2011). Development of a test method for determination of
breakage behaviour of fine particles. Ankara, Turkey: MSc. Thesis,
Hacettepe University.
[81] Kuhlmann, K., Ellerbrock, H.-G., Sprung, S. (1985). Particle size distribution
and properties of cement. Zement-Kalk-Gips 85 (6), p. 136-144.

151
[82] Tsivilis, S., Tsimas, S., Benetatou, A., Haniotakis, E. (1990). Study on the
contribution of the fineness on cement strength. Zement-Kalk-Gips 43 (1),
p. 26-29.
[83] Pilevneli, C. C. (2003). Investigation of fine sized clinker grinding in a stirred
bead mill. Zonguldak, Turkey: Ph. D thesis, Zonguldan Karaelmas
University.

152
APPENDICES

153
Appendix-1. Cumulative passing size (%) of chemical tests (Section 4.1)
EPCT-04 EPCT-02 EPCT-01
Particle Size (µm) Feed
Test 1 Product
Test 2 Product
Test 3 Product
Test 4 Product
Test 5 Product
Test 6 Product
Test 7 Product
Test 8 Product
150 100.00 100.00 100.00 100.00 100.00 100.00 100.00 100.00 100.00
102 99.94 100.00 100.00 100.00 100.00 100.00 100.00 100.00 100.00
72 97.78 100.00 100.00 100.00 99.83 99.96 100.00 100.00 100.00
60 95.13 100.00 100.00 100.00 99.42 99.74 100.00 100.00 100.00
50 91.26 98.70 99.04 98.41 98.44 98.97 99.62 100.00 100.00
42 86.50 96.08 96.34 95.67 96.48 97.19 98.57 99.50 98.41
36 81.57 92.52 92.56 92.16 93.55 94.38 96.44 96.90 95.36
30 75.10 86.97 86.79 86.79 88.43 89.36 92.00 92.80 89.84
25 68.37 80.31 80.00 80.25 81.94 82.94 85.87 86.21 83.05
21 61.98 73.30 72.95 73.30 75.01 76.01 78.99 78.93 75.97
18 56.47 67.05 66.74 67.10 68.67 69.62 72.46 72.30 69.53
15 50.13 59.95 59.65 60.00 61.15 62.00 64.48 64.40 61.87
12 42.79 51.95 51.59 51.93 52.29 53.02 54.95 55.03 52.87
10 37.41 46.14 45.71 46.08 45.81 46.45 48.00 48.16 46.32
8.6 33.54 41.87 41.40 41.82 41.14 41.73 43.03 43.24 41.65
7.4 30.23 38.08 37.62 38.07 37.17 37.72 38.86 39.08 37.72
6.2 26.97 34.13 33.73 34.19 33.27 33.79 34.80 35.03 33.87
5.2 24.21 30.61 30.29 30.74 29.97 30.47 31.41 31.62 30.62
4.4 21.86 27.49 27.26 27.68 27.15 27.63 28.52 28.70 27.84
3.6 19.20 23.93 23.78 24.16 23.94 24.39 25.22 25.36 24.63
3 16.86 20.81 20.72 21.06 21.08 21.49 22.26 22.37 21.74
2.6 15.04 18.44 18.39 18.68 18.84 19.22 19.93 20.02 19.46
2.2 12.93 15.73 15.71 15.96 16.21 16.55 17.17 17.25 16.77
1.8 10.46 12.62 12.60 12.82 13.11 13.39 13.91 13.96 13.58
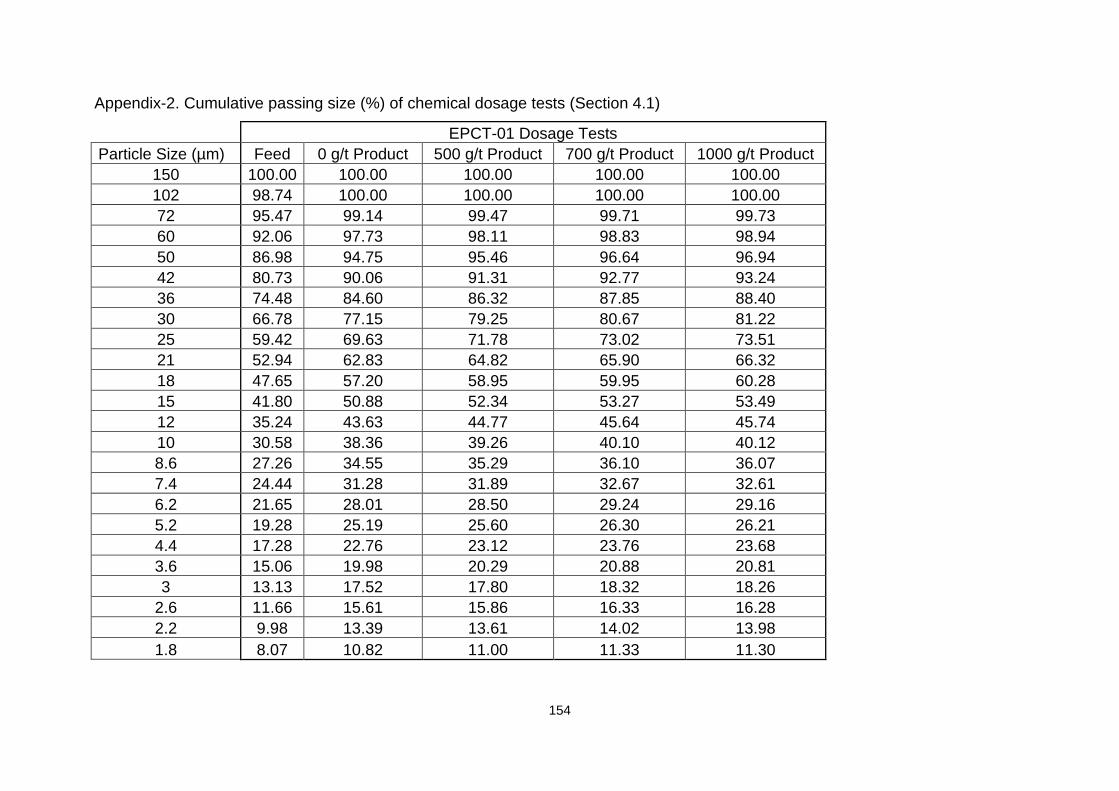
154
Appendix-2. Cumulative passing size (%) of chemical dosage tests (Section 4.1)
EPCT-01 Dosage Tests
Particle Size (µm) Feed 0 g/t Product 500 g/t Product 700 g/t Product 1000 g/t Product
150 100.00 100.00 100.00 100.00 100.00
102 98.74 100.00 100.00 100.00 100.00
72 95.47 99.14 99.47 99.71 99.73
60 92.06 97.73 98.11 98.83 98.94
50 86.98 94.75 95.46 96.64 96.94
42 80.73 90.06 91.31 92.77 93.24
36 74.48 84.60 86.32 87.85 88.40
30 66.78 77.15 79.25 80.67 81.22
25 59.42 69.63 71.78 73.02 73.51
21 52.94 62.83 64.82 65.90 66.32
18 47.65 57.20 58.95 59.95 60.28
15 41.80 50.88 52.34 53.27 53.49
12 35.24 43.63 44.77 45.64 45.74
10 30.58 38.36 39.26 40.10 40.12
8.6 27.26 34.55 35.29 36.10 36.07
7.4 24.44 31.28 31.89 32.67 32.61
6.2 21.65 28.01 28.50 29.24 29.16
5.2 19.28 25.19 25.60 26.30 26.21
4.4 17.28 22.76 23.12 23.76 23.68
3.6 15.06 19.98 20.29 20.88 20.81
3 13.13 17.52 17.80 18.32 18.26
2.6 11.66 15.61 15.86 16.33 16.28
2.2 9.98 13.39 13.61 14.02 13.98
1.8 8.07 10.82 11.00 11.33 11.30
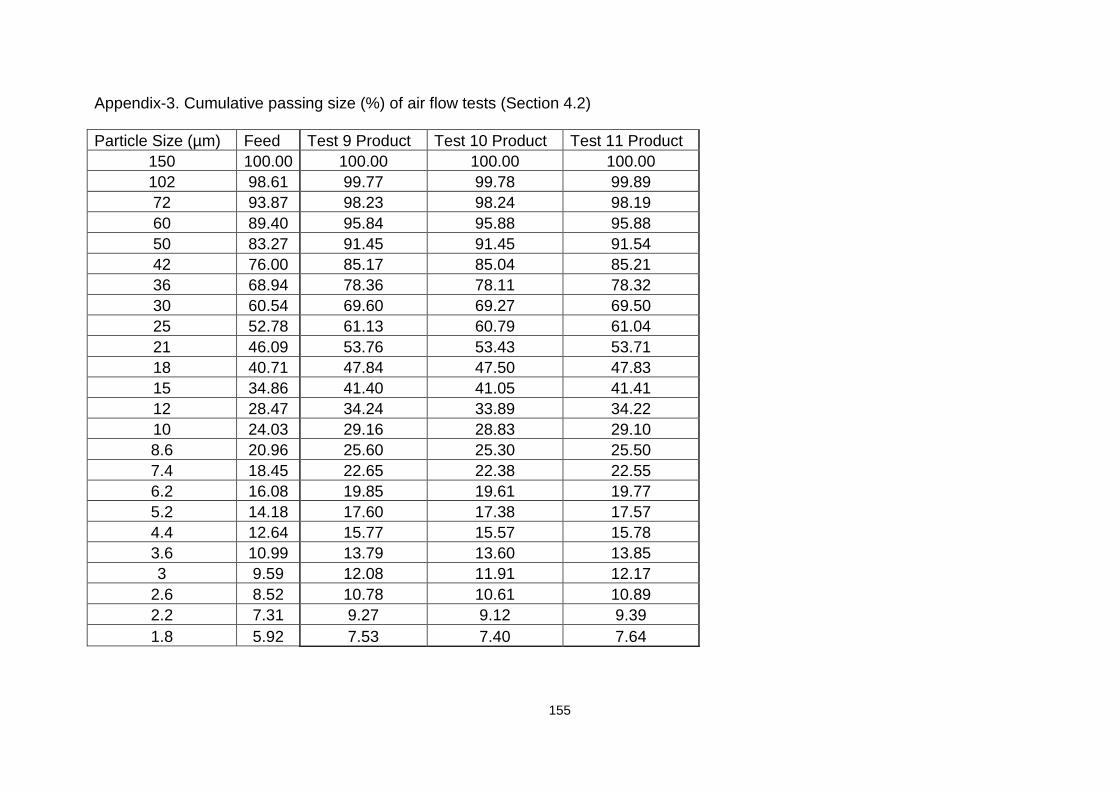
155
Appendix-3. Cumulative passing size (%) of air flow tests (Section 4.2)
Particle Size (µm) Feed Test 9 Product Test 10 Product Test 11 Product
150 100.00 100.00 100.00 100.00
102 98.61 99.77 99.78 99.89
72 93.87 98.23 98.24 98.19
60 89.40 95.84 95.88 95.88
50 83.27 91.45 91.45 91.54
42 76.00 85.17 85.04 85.21
36 68.94 78.36 78.11 78.32
30 60.54 69.60 69.27 69.50
25 52.78 61.13 60.79 61.04
21 46.09 53.76 53.43 53.71
18 40.71 47.84 47.50 47.83
15 34.86 41.40 41.05 41.41
12 28.47 34.24 33.89 34.22
10 24.03 29.16 28.83 29.10
8.6 20.96 25.60 25.30 25.50
7.4 18.45 22.65 22.38 22.55
6.2 16.08 19.85 19.61 19.77
5.2 14.18 17.60 17.38 17.57
4.4 12.64 15.77 15.57 15.78
3.6 10.99 13.79 13.60 13.85
3 9.59 12.08 11.91 12.17
2.6 8.52 10.78 10.61 10.89
2.2 7.31 9.27 9.12 9.39
1.8 5.92 7.53 7.40 7.64

156
Appendix-4. Cumulative passing size (%) of stirrer speed tests (Section 4.3)
Particle Size (µm) Feed
Test 12 Product
Test 13 Product
Test 14 Product
Test 15 Product
Test 16 Product
Test 17 Product
Test 18 Product
Test 19 Product
150 100.00 100.00 100.00 100.00 100.00 100.00 100.00 100.00 100.00
102 99.08 100.00 100.00 100.00 100.00 99.66 100.00 100.00 100.00
72 91.97 98.77 98.19 99.44 100.00 97.49 98.79 98.58 98.96
60 84.86 96.62 95.70 97.67 99.35 94.83 96.29 96.28 97.12
50 76.29 92.28 91.57 93.95 97.13 90.45 91.78 92.37 93.61
42 67.40 85.93 85.80 88.29 92.88 84.28 85.73 86.88 88.31
36 59.53 79.06 79.42 81.88 87.47 77.38 79.23 80.74 82.21
30 50.86 70.34 71.01 73.32 79.67 68.35 70.81 72.55 74.01
25 43.50 61.94 62.73 64.79 71.40 59.77 62.62 64.44 65.94
21 37.73 54.55 55.40 57.18 63.71 52.57 55.57 57.35 58.93
18 33.42 48.55 49.47 51.01 57.31 47.03 50.03 51.73 53.37
15 28.96 41.97 42.96 44.29 50.22 41.22 44.13 45.72 47.36
12 24.20 34.73 35.70 36.85 42.28 34.93 37.60 39.09 40.64
10 20.90 29.63 30.55 31.59 36.61 30.48 32.93 34.36 35.79
8.6 18.59 26.04 26.90 27.87 32.59 27.34 29.57 30.97 32.30
7.4 16.65 23.03 23.85 24.73 29.19 24.67 26.70 28.07 29.31
6.2 14.75 20.11 20.89 21.69 25.85 22.07 23.86 25.19 26.32
5.2 13.14 17.71 18.45 19.18 23.06 19.86 21.43 22.72 23.76
4.4 11.79 15.72 16.44 17.09 20.71 17.98 19.35 20.58 21.55
3.6 10.27 13.58 14.26 14.82 18.11 15.85 17.00 18.13 19.00
3 8.96 11.77 12.40 12.89 15.84 13.95 14.92 15.95 16.73
2.6 7.96 10.41 11.00 11.43 14.10 12.47 13.30 14.25 14.94
2.2 6.82 8.88 9.40 9.77 12.10 10.74 11.43 12.25 12.86
1.8 5.51 7.15 7.59 7.89 9.79 8.72 9.25 9.93 10.42

157
Appendix-5. Cumulative passing size (%) of feed rate tests (Section 4.4)
Particle Size (µm) Feed Test 20 Product Test 21 Product Test 22 Product
150 100.00 100.00 100.00 100.00
102 98.05 99.84 99.52 99.69
72 91.56 98.95 98.21 97.76
60 86.11 97.39 96.30 94.69
50 79.25 94.18 92.35 89.30
42 71.61 89.01 86.22 82.06
36 64.41 82.82 79.28 74.64
30 56.04 74.27 70.24 65.63
25 48.58 65.65 61.57 57.30
21 42.52 58.02 54.19 50.27
18 37.87 51.94 48.41 44.73
15 32.98 45.45 42.28 38.80
12 27.69 38.38 35.64 32.30
10 23.99 33.44 31.01 27.72
8.6 21.39 29.96 27.76 24.50
7.4 19.20 27.03 25.03 21.80
6.2 17.06 24.15 22.37 19.19
5.2 15.27 21.72 20.11 17.03
4.4 13.74 19.63 18.19 15.24
3.6 12.03 17.27 16.01 13.28
3 10.53 15.18 14.08 11.60
2.6 9.38 13.55 12.57 10.31
2.2 8.05 11.65 10.81 8.84
1.8 6.52 9.45 8.77 7.15

158
Appendix-6. Cumulative passing size (%) of media filling tests (Section 4.5)
Particle Size (µm) Feed Test 23 Product Test 24 Product Test 25 Product Test 26 Product
150 100.00 100.00 100.00 100.00 100.00
102 98.48 98.48 99.30 99.51 99.69
72 91.20 91.46 94.82 96.60 97.76
60 85.20 85.77 89.80 92.73 94.69
50 77.89 78.83 82.86 86.71 89.30
42 70.05 71.27 75.01 79.21 82.06
36 62.89 64.22 67.73 71.81 74.64
30 54.72 56.03 59.31 62.97 65.63
25 47.40 48.60 51.68 54.89 57.30
21 41.30 42.38 45.27 48.09 50.27
18 36.50 37.51 40.25 42.75 44.73
15 31.34 32.31 34.87 37.03 38.80
12 25.73 26.66 28.97 30.76 32.30
10 21.82 22.71 24.79 26.35 27.72
8.6 19.10 19.95 21.84 23.25 24.50
7.4 16.84 17.65 19.38 20.66 21.80
6.2 14.69 15.44 17.01 18.17 19.19
5.2 12.94 13.63 15.07 16.11 17.03
4.4 11.52 12.14 13.48 14.42 15.24
3.6 9.98 10.53 11.74 12.56 13.28
3 8.68 9.16 10.25 10.97 11.60
2.6 7.69 8.12 9.12 9.75 10.31
2.2 6.58 6.95 7.82 8.36 8.84
1.8 5.32 5.61 6.33 6.76 7.15

159
Appendix-7. Cumulative passing size (%) of media size tests (Section 4.6)
Particle Size (µm) Feed
Test 27 Product
Test 28 Product
Particle Size (µm) Feed
Test 29 Product
Test 30 Product
Test 31 Product
150 100.00 100.00 100.00
850 100.00 100.00 100.00 100.00
102 98.38 99.83 99.48
600 99.88 100.00 100.00 100.00
86 95.72 99.48 98.71
425 99.73 99.98 99.99 99.99
72 92.09 98.68 97.42
300 98.99 99.92 99.94 99.97
60 87.49 96.88 95.06
212 98.03 99.81 99.87 99.93
50 81.83 93.41 91.04
150 95.11 99.52 99.74 99.84
42 75.36 88.17 85.40
102 85.48 98.94 99.61 99.16
36 69.02 82.17 79.27
72 70.75 96.73 97.39 97.21
30 61.28 74.09 71.37
60 60.32 93.41 94.02 94.24
25 53.92 65.99 63.68
50 48.81 87.88 88.29 88.84
21 47.53 58.74 56.88
42 38.09 80.63 80.65 81.21
18 42.38 52.81 51.32
36 29.76 73.29 72.83 73.14
15 36.75 46.28 45.18
30 21.89 64.48 63.38 63.24
12 30.52 38.98 38.24
25 16.43 56.49 54.83 54.27
10 26.11 33.76 33.24
21 13.01 49.85 47.80 46.96
8.6 23.01 30.03 29.65
18 10.90 44.65 42.40 41.41
7.4 20.41 26.87 26.59
15 9.04 39.06 36.71 35.63
6.2 17.89 23.76 23.58
12 7.35 32.83 30.54 29.43
5.2 15.81 21.14 21.03
10 6.28 28.37 26.22 25.16
4.4 14.10 18.93 18.88
8.6 5.58 25.20 23.19 22.19
3.6 12.23 16.49 16.49
7.4 5.00 22.54 20.67 19.75
3 10.64 14.39 14.41
6.2 4.44 19.95 18.24 17.43
2.6 9.44 12.78 12.81
5.2 3.97 17.80 16.25 15.54
2.2 8.07 10.94 10.98
4.4 3.56 16.01 14.59 13.97
1.8 6.52 8.83 8.87
3 2.72 12.29 11.19 10.75

160
Appendix-7 (Cont.). Cumulative passing size (%) of media size tests (Section 4.6)
Particle Size (µm) Feed Test 32 Product Test 33 Product
150 100.00 100.00 100.00
102 100.00 100.00 100.00
72 96.98 99.81 99.69
60 92.89 99.01 98.84
50 86.87 96.84 96.76
42 80.00 92.66 92.76
36 73.40 87.08 87.32
30 65.19 78.77 79.15
25 57.12 69.96 70.47
21 49.97 61.89 62.52
18 44.20 55.30 55.99
15 38.00 48.14 48.82
12 31.31 40.25 40.89
10 26.70 34.69 35.30
8.6 23.50 30.78 31.36
7.4 20.81 27.51 28.05
6.2 18.22 24.34 24.84
5.2 16.07 21.72 22.17
4.4 14.29 19.52 19.92
3.6 12.36 17.09 17.43
3 10.73 14.98 15.26
2.6 9.50 13.35 13.58
2.2 8.11 11.46 11.66
1.8 6.53 9.28 9.44
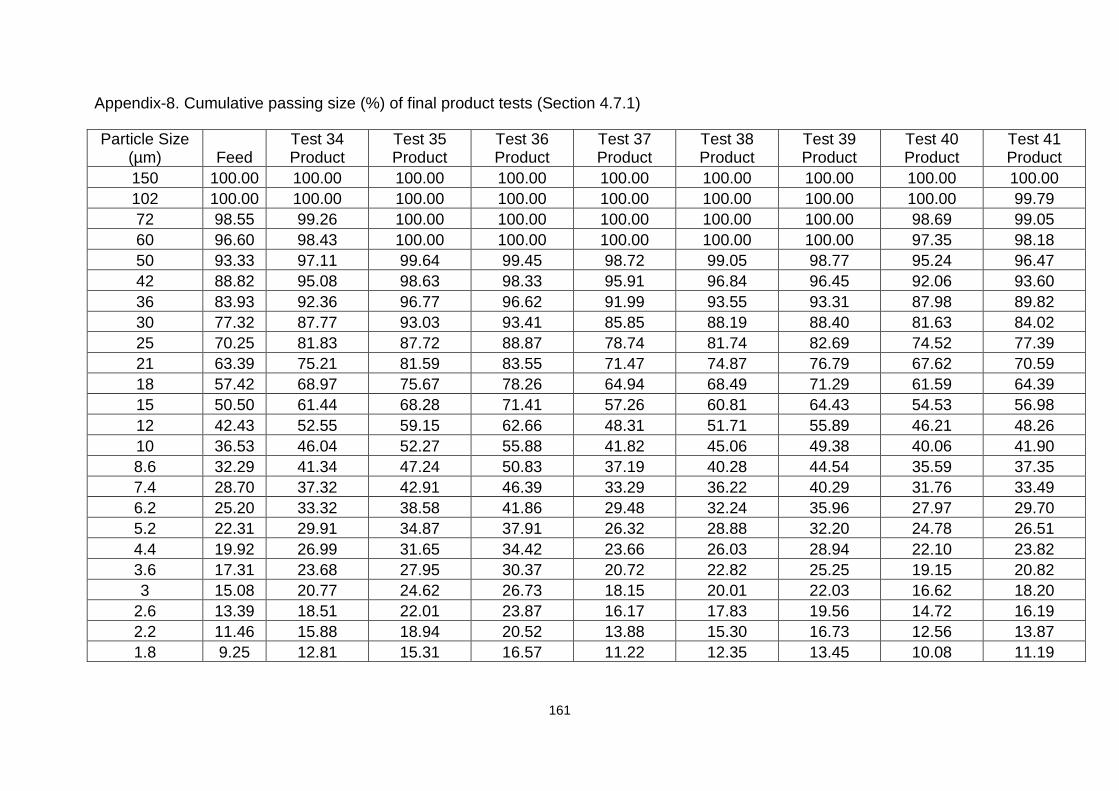
161
Appendix-8. Cumulative passing size (%) of final product tests (Section 4.7.1)
Particle Size (µm) Feed
Test 34 Product
Test 35 Product
Test 36 Product
Test 37 Product
Test 38 Product
Test 39 Product
Test 40 Product
Test 41 Product
150 100.00 100.00 100.00 100.00 100.00 100.00 100.00 100.00 100.00
102 100.00 100.00 100.00 100.00 100.00 100.00 100.00 100.00 99.79
72 98.55 99.26 100.00 100.00 100.00 100.00 100.00 98.69 99.05
60 96.60 98.43 100.00 100.00 100.00 100.00 100.00 97.35 98.18
50 93.33 97.11 99.64 99.45 98.72 99.05 98.77 95.24 96.47
42 88.82 95.08 98.63 98.33 95.91 96.84 96.45 92.06 93.60
36 83.93 92.36 96.77 96.62 91.99 93.55 93.31 87.98 89.82
30 77.32 87.77 93.03 93.41 85.85 88.19 88.40 81.63 84.02
25 70.25 81.83 87.72 88.87 78.74 81.74 82.69 74.52 77.39
21 63.39 75.21 81.59 83.55 71.47 74.87 76.79 67.62 70.59
18 57.42 68.97 75.67 78.26 64.94 68.49 71.29 61.59 64.39
15 50.50 61.44 68.28 71.41 57.26 60.81 64.43 54.53 56.98
12 42.43 52.55 59.15 62.66 48.31 51.71 55.89 46.21 48.26
10 36.53 46.04 52.27 55.88 41.82 45.06 49.38 40.06 41.90
8.6 32.29 41.34 47.24 50.83 37.19 40.28 44.54 35.59 37.35
7.4 28.70 37.32 42.91 46.39 33.29 36.22 40.29 31.76 33.49
6.2 25.20 33.32 38.58 41.86 29.48 32.24 35.96 27.97 29.70
5.2 22.31 29.91 34.87 37.91 26.32 28.88 32.20 24.78 26.51
4.4 19.92 26.99 31.65 34.42 23.66 26.03 28.94 22.10 23.82
3.6 17.31 23.68 27.95 30.37 20.72 22.82 25.25 19.15 20.82
3 15.08 20.77 24.62 26.73 18.15 20.01 22.03 16.62 18.20
2.6 13.39 18.51 22.01 23.87 16.17 17.83 19.56 14.72 16.19
2.2 11.46 15.88 18.94 20.52 13.88 15.30 16.73 12.56 13.87
1.8 9.25 12.81 15.31 16.57 11.22 12.35 13.45 10.08 11.19

162
Appendix-8 (Cont.). Cumulative passing size (%) of final product tests (Section 4.7.1)
Particle Size (µm)
Test 42 Product
Test 43 Product
Test 44 Product
Test 45 Product
Test 46 Product
Test 47 Product
Test 48 Product
Test 49 Product
Test 50 Product
Test 51 Product
150 100.00 100.00 100.00 100.00 100.00 100.00 100.00 100.00 100.00 100.00
102 100.00 100.00 100.00 100.00 100.00 100.00 100.00 100.00 100.00 100.00
72 100.00 100.00 100.00 99.82 99.98 100.00 100.00 100.00 100.00 100.00
60 100.00 100.00 99.95 99.23 99.73 100.00 99.46 99.68 99.65 99.33
50 98.74 99.52 99.81 98.06 98.95 98.06 98.23 98.88 98.75 97.91
42 96.14 98.61 99.37 96.14 97.47 94.90 96.11 97.83 97.22 95.73
36 92.35 96.98 98.29 93.31 95.09 91.01 93.16 96.45 94.90 92.77
30 86.34 93.46 95.58 88.13 90.49 84.88 88.11 93.82 90.49 87.67
25 79.72 88.22 91.22 81.40 84.31 77.67 81.74 89.99 84.60 81.32
21 73.30 82.02 85.74 74.30 77.66 70.49 74.98 85.19 78.07 74.56
18 67.63 75.93 80.13 67.77 71.47 64.06 68.68 79.95 71.79 68.22
15 60.82 68.31 72.85 59.87 63.87 56.31 60.94 72.60 63.95 60.44
12 52.63 59.07 63.73 50.44 54.63 47.17 51.65 62.94 54.53 51.20
10 46.54 52.21 56.93 43.58 47.80 40.62 44.90 55.65 47.69 44.51
8.6 42.09 47.22 51.98 38.71 42.89 36.03 40.10 50.39 42.82 39.76
7.4 38.23 42.91 47.69 34.63 38.72 32.21 36.07 45.92 38.69 35.72
6.2 34.30 38.56 43.30 30.69 34.61 28.53 32.15 41.52 34.59 31.72
5.2 30.86 34.79 39.43 27.44 31.14 25.47 28.87 37.75 31.09 28.30
4.4 27.85 31.49 36.00 24.71 28.18 22.89 26.08 34.43 28.05 25.38
3.6 24.39 27.68 32.01 21.66 24.82 20.00 22.92 30.54 24.58 22.08
3 21.33 24.29 28.39 18.99 21.83 17.48 20.12 26.99 21.51 19.22
2.6 18.96 21.64 25.50 16.92 19.48 15.54 17.94 24.17 19.13 17.03
2.2 16.23 18.57 22.06 14.52 16.75 13.31 15.40 20.82 16.38 14.54
1.8 13.06 14.97 17.98 11.73 13.53 10.74 12.44 16.85 13.18 11.67

163
Appendix-9. Cumulative passing size (%) of separator reject tests (Section 4.7.2)
Particle Size (µm) Feed
Test 52 Product
Test 53 Product
Test 54 Product
Test 55 Product
Test 56 Product
Test 57 Product
Test 58 Product
Test 59 Product
850 100.00 100.00 100.00 100.00 100.00 100.00 100.00 100.00 100.00
600 99.80 100.00 100.00 100.00 99.97 100.00 100.00 99.95 100.00
425 99.38 99.98 100.00 100.00 99.92 100.00 100.00 99.87 100.00
300 98.33 99.97 99.99 99.95 99.78 100.00 99.97 99.69 99.99
212 95.80 99.92 99.95 99.91 99.45 100.00 99.89 99.23 99.99
150 89.89 99.79 99.74 99.74 98.40 100.00 99.47 96.89 99.94
102 73.61 97.42 97.33 97.82 92.42 95.38 97.44 86.31 99.45
72 55.06 87.89 89.85 91.96 76.92 83.71 88.26 69.79 96.29
50 34.81 71.30 75.05 79.24 53.40 64.12 71.58 48.64 86.51
42 26.70 62.52 66.73 72.22 43.70 54.76 62.92 39.81 79.46
36 21.02 55.15 59.63 66.12 36.75 47.46 55.86 33.40 72.64
30 16.10 47.45 52.13 59.33 30.38 40.16 48.41 27.45 64.53
25 12.67 41.07 45.85 53.24 25.54 34.27 42.08 22.98 57.07
21 10.38 35.99 40.76 48.07 21.98 29.78 37.07 19.70 50.75
18 8.87 32.07 36.76 43.88 19.39 26.47 33.31 17.31 45.72
15 7.50 27.89 32.39 39.20 16.77 23.03 29.30 14.90 40.25
10 5.42 20.09 23.90 29.69 12.05 16.68 21.58 10.71 29.71
8.6 4.85 17.82 21.36 26.75 10.72 14.84 19.30 9.53 26.58
7.4 4.37 15.93 19.22 24.22 9.60 13.31 17.39 8.54 23.93
6.2 3.86 14.07 17.10 21.68 8.53 11.82 15.53 7.57 21.31
5.2 3.40 12.53 15.33 19.52 7.65 10.58 13.97 6.73 19.09
3.6 2.56 9.82 12.12 15.54 6.06 8.37 11.14 5.25 15.08
3 2.19 8.58 10.63 13.65 5.32 7.35 9.80 4.57 13.23
2.2 1.62 6.55 8.14 10.48 4.09 5.63 7.54 3.47 10.14

164
Appendix-9 (Cont.). Cumulative passing size (%) of separator reject tests (Section 4.7.2)
Particle Size (µm)
Test 60 Product
Test 61 Product
Test 62 Product
Test 63 Product
Test 64 Product
Test 65 Product
850 100.00 100.00 100.00 100.00 100.00 100.00
600 100.00 100.00 100.00 99.99 100.00 100.00
425 100.00 99.99 100.00 99.96 100.00 100.00
300 100.00 99.97 100.00 99.89 100.00 100.00
212 100.00 99.91 99.98 99.69 100.00 100.00
150 100.00 99.59 99.88 99.01 100.00 100.00
102 99.88 98.07 99.41 96.25 100.00 100.00
72 98.47 89.85 95.69 83.99 100.00 95.99
50 92.12 72.37 83.36 63.38 96.88 83.09
42 86.71 62.76 74.76 53.38 92.64 74.45
36 81.24 55.06 67.24 45.96 87.14 66.69
30 74.24 47.21 59.06 38.87 79.29 58.16
25 67.21 40.64 51.90 33.16 71.28 50.83
21 60.82 35.41 45.96 28.69 64.09 44.91
18 55.58 31.47 41.33 25.35 58.18 40.30
15 49.72 27.36 36.30 21.87 51.58 35.31
10 37.91 19.76 26.51 15.64 38.56 25.73
8.6 34.27 17.59 23.64 13.87 34.63 22.93
7.4 31.15 15.77 21.23 12.36 31.29 20.59
6.2 28.04 13.98 18.87 10.85 28.00 18.33
5.2 25.37 12.48 16.86 9.57 25.21 16.46
3.6 20.46 9.79 13.27 7.32 20.10 13.11
3 18.09 8.56 11.64 6.33 17.68 11.54
2.2 14.01 6.56 8.94 4.77 13.58 8.89

165
Appendix-10. Cumulative passing size (%) of mill geometry tests (Section 4.8)
Particle Size (µm) Feed
Test 66 Product
Test 67 Product
Test 68 Product
Test 69 Product
Test 70 Product
Test 71 Product
Test 72 Product
Test 73 Product
150 100.00 100.00 100.00 100.00 100.00 100.00 100.00 100.00 100.00
102 100.00 100.00 100.00 100.00 100.00 100.00 100.00 100.00 100.00
72 98.93 99.89 100.00 100.00 100.00 100.00 99.19 99.76 100.00
60 97.10 99.36 100.00 100.00 99.65 100.00 98.00 99.17 99.28
50 93.82 97.86 98.67 99.33 98.90 99.32 95.93 97.74 97.76
42 89.64 95.04 96.26 97.54 97.43 97.81 92.80 95.13 95.24
36 85.20 91.31 93.01 94.66 95.10 95.48 88.94 91.57 92.03
30 78.98 85.58 87.70 89.60 90.78 91.41 83.11 85.87 86.94
25 72.00 78.96 81.20 83.23 85.06 86.20 76.40 79.08 80.73
21 65.06 72.13 74.42 76.43 78.73 80.46 69.56 72.08 74.12
18 58.99 65.89 68.33 70.19 72.75 75.02 63.38 65.73 68.00
15 51.99 58.44 61.09 62.71 65.39 68.25 56.07 58.20 60.59
12 43.86 49.67 52.47 53.84 56.46 59.94 47.50 49.34 51.79
10 38.00 43.28 46.10 47.34 49.83 53.75 41.26 42.88 45.41
8.6 33.80 38.72 41.48 42.66 45.04 49.22 36.79 38.28 40.84
7.4 30.20 34.85 37.54 38.68 40.95 45.25 32.99 34.39 36.93
6.2 26.62 31.05 33.64 34.75 36.91 41.15 29.26 30.60 32.98
5.2 23.58 27.85 30.34 31.40 33.46 37.49 26.13 27.43 29.57
4.4 21.01 25.12 27.51 28.50 30.46 34.23 23.48 24.75 26.62
3.6 18.20 22.04 24.27 25.16 26.99 30.40 20.53 21.74 23.30
3 15.81 19.34 21.38 22.17 23.84 26.92 17.95 19.09 20.39
2.6 14.01 17.23 19.11 19.82 21.35 24.15 15.97 17.03 18.16
2.2 11.98 14.79 16.45 17.05 18.41 20.87 13.69 14.63 15.60
1.8 9.68 11.94 13.30 13.78 14.90 16.99 11.05 11.83 12.65

166
Appendix-10 (Cont.). Cumulative passing size (%) of mill geometry tests (Section 4.8)
Particle Size (µm) Test 74 Product Test 75 Product Test 76 Product Test 77 Product Test 78 Product
150 100.00 100.00 100.00 100.00 100.00
102 100.00 100.00 100.00 100.00 100.00
72 99.92 100.00 100.00 100.00 100.00
60 99.26 98.95 100.00 100.00 100.00
50 97.19 96.80 99.13 99.81 99.15
42 93.72 93.55 97.57 99.08 97.09
36 89.63 89.75 95.47 97.49 93.87
30 83.70 84.17 91.73 94.02 88.34
25 76.97 77.69 86.43 88.97 81.62
21 70.13 70.96 80.08 83.06 74.64
18 63.97 64.84 73.84 77.31 68.32
15 56.63 57.51 66.06 70.13 60.80
12 47.99 48.85 56.73 61.34 51.94
10 41.75 42.57 49.98 54.80 45.47
8.6 37.28 38.09 45.15 50.05 40.81
7.4 33.47 34.25 41.01 45.96 36.82
6.2 29.69 30.42 36.82 41.82 32.86
5.2 26.46 27.14 33.15 38.20 29.48
4.4 23.73 24.34 29.95 34.99 26.57
3.6 20.70 21.22 26.31 31.19 23.28
3 18.07 18.52 23.11 27.67 20.38
2.6 16.06 16.47 20.63 24.85 18.14
2.2 13.77 14.13 17.76 21.47 15.55
1.8 11.15 11.44 14.43 17.43 12.53

167
Appendix-11. Cumulative passing size (%) of stirrer type tests (Section 4.9)
Particle Size (µm) Feed
Test 79 Product
Test 80 Product
Test 81 Product
Test 82 Product
Test 83 Product
Test 84 Product
Test 85 Product
Test 86 Product
Test 87 Product
850 100.00 100.00 100.00 100.00 100.00 100.00 100.00 100.00 100.00 100.00
600 99.80 100.00 100.00 100.00 100.00 99.99 100.00 99.98 99.97 99.94
425 99.38 100.00 100.00 99.99 100.00 99.96 100.00 99.96 99.92 99.86
300 98.33 99.99 100.00 99.97 100.00 99.89 100.00 99.93 99.80 99.68
212 95.80 99.99 100.00 99.91 99.98 99.69 100.00 99.85 99.62 99.33
150 89.89 99.94 100.00 99.59 99.88 99.01 100.00 99.30 99.09 98.29
102 73.61 99.45 99.88 98.07 99.41 96.25 99.79 98.27 96.07 93.72
72 55.06 96.29 98.47 89.85 95.69 83.99 97.45 91.58 84.29 79.54
50 34.81 86.51 92.12 72.37 83.36 63.38 89.19 75.85 64.58 59.11
42 26.70 79.46 86.71 62.76 74.76 53.38 82.87 67.13 55.40 50.09
36 21.02 72.64 81.24 55.06 67.24 45.96 76.46 59.78 48.02 42.96
30 16.10 64.53 74.24 47.21 59.06 38.87 68.60 52.03 40.50 35.82
25 12.67 57.07 67.21 40.64 51.90 33.16 61.22 45.51 34.54 30.26
21 10.38 50.75 60.82 35.41 45.96 28.69 54.85 40.26 30.06 26.16
18 8.87 45.72 55.58 31.47 41.33 25.35 49.71 36.19 26.73 23.16
15 7.50 40.25 49.72 27.36 36.30 21.87 44.03 31.79 23.20 20.03
10 5.42 29.71 37.91 19.76 26.51 15.64 32.89 23.36 16.64 14.38
8.6 4.85 26.58 34.27 17.59 23.64 13.87 29.54 20.86 14.77 12.80
7.4 4.37 23.93 31.15 15.77 21.23 12.36 26.68 18.77 13.22 11.48
6.2 3.86 21.31 28.04 13.98 18.87 10.85 23.87 16.71 11.69 10.18
5.2 3.40 19.09 25.37 12.48 16.86 9.57 21.49 14.99 10.40 9.07
3.6 2.56 15.08 20.46 9.79 13.27 7.32 17.14 11.89 8.12 7.07
3 2.19 13.23 18.09 8.56 11.64 6.33 15.08 10.44 7.08 6.15
2.2 1.62 10.14 14.01 6.56 8.94 4.77 11.59 8.01 5.38 4.67

168
Appendix-11 (Cont.). Cumulative passing size (%) of stirrer type tests (Section 4.9)
Particle Size (µm) Test 88 Product Test 89 Product Test 90 Product
850 100.00 100.00 100.00
600 100.00 100.00 99.96
425 100.00 99.99 99.91
300 100.00 99.97 99.77
212 100.00 99.93 99.48
150 100.00 99.77 98.72
102 100.00 97.85 94.97
72 97.64 90.91 81.95
50 90.91 78.46 62.77
42 85.12 71.41 54.10
36 79.06 65.01 47.27
30 71.43 57.69 40.38
25 64.33 49.08 34.79
21 58.24 45.55 30.40
18 53.31 41.14 27.07
15 47.80 36.30 23.53
10 36.63 26.84 16.90
8.6 33.19 23.99 14.98
7.4 30.26 21.58 13.37
6.2 27.35 19.21 11.83
5.2 24.87 17.20 10.55
3.6 20.18 13.60 8.33
3 17.88 11.92 7.31
2.2 13.85 9.13 5.62
169
CURRICULUM VITAE
Personal Information
Name Surname : Okay Altun
Birth Place : Ankara
Marital Status : Married
E-mail : [email protected]
Address : Ümit Mahallesi Meksika Cad. 2449. Sokak Defne 9 No:3 Blok Daire No:40 Ümitköy Ankara
Education
High School : Ayrancı High School (1996-1999)
Graduate : Hacettepe University Mining Engineering Department (1999-2004)
Master of Science : Hacettepe University Mining Engineering Department (2004-2007)
Doctor of Philosophy : Hacettepe University Mining Engineering Department (2007-2013)
Language
English/86.25 ÜDS
Job Experience
Research Assistant at Hacettepe University Mining Engineering Department : 2005-2013
Area of Experience
Performance evaluation, modelling and simulation of wet and dry comminution circuits.
Developed Projects from the Thesis
Publications from the Thesis
Okay Altun, Hakan Benzer, Udo Enderle, 2013, Effects of operating parameters on the efficiency of dry stirred milling, Minerals Engineering 43-44, pp. 58-66

170
Presentations from the Thesis
Effects of operating parameters on the efficiency of dry stirred milling, Oral presentation, Comminution’ 2012, Cape Town, South Africa