Investigating the Relationship between Voluntary ...
27
Investigating the Relationship between Voluntary Disclosure and Financial Performance and Earnings Management (Emphasizing the Moderating Role of the Corporate Life Cycle) Seyyed Mohammad Hosseini Ph.D. Candidate, Department of Accounting, University of Mazandaran, Babolsar, Iran. (Email: [email protected]) Esfandyar Malekian* *Corresponding author, Prof., Department of Accounting, University of Mazandaran, Babolsar, Iran. (Email: ) Abstract This study aimed to investigate the relationship between voluntary disclosure and earnings management and financial performance during the life cycle of the listed companies in Tehran Stock Exchange. The statistical population of the study included all listed companies in Tehran Stock Exchange since 2013- 2018. In this study, earnings management, the financial performance of the companies (including return on equity, returns on assets, Tobin Q ratio, economic value-added, and refined economic value added) were the dependent variables, and the level of voluntary disclosure was the independent variable and the life cycle of the company was considered as the moderating variable. Also, in order to test the research hypotheses, a linear multivariate regression model using combined data was used. The results showed that earnings management and financial performance indicators have a significant relationship with voluntary disclosure over the life cycle. Accordingly, an increase in the level of voluntary disclosure increased the company's performance. Also, the results of the study indicated that the company's life cycle mediates the relationship between the level of voluntary disclosure and the company's performance. Keywords: Voluntary disclosure, earnings management, financial performance, life cycle. DOI: 10.22034/ijf.2020.249971.1158 © Iran Finance Association
Transcript of Investigating the Relationship between Voluntary ...

Investigating the Relationship between Voluntary Disclosure
and Financial Performance and Earnings Management
(Emphasizing the Moderating Role of the Corporate Life Cycle)
Seyyed Mohammad Hosseini
Ph.D. Candidate, Department of Accounting, University of Mazandaran, Babolsar, Iran.
(Email: [email protected])
Esfandyar Malekian*
*Corresponding author, Prof., Department of Accounting, University of Mazandaran, Babolsar,
Iran. (Email: )
Abstract
This study aimed to investigate the relationship between voluntary disclosure
and earnings management and financial performance during the life cycle of
the listed companies in Tehran Stock Exchange. The statistical population of
the study included all listed companies in Tehran Stock Exchange since 2013-
2018. In this study, earnings management, the financial performance of the
companies (including return on equity, returns on assets, Tobin Q ratio,
economic value-added, and refined economic value added) were the dependent
variables, and the level of voluntary disclosure was the independent variable
and the life cycle of the company was considered as the moderating variable.
Also, in order to test the research hypotheses, a linear multivariate regression
model using combined data was used. The results showed that earnings
management and financial performance indicators have a significant
relationship with voluntary disclosure over the life cycle. Accordingly, an
increase in the level of voluntary disclosure increased the company's
performance. Also, the results of the study indicated that the company's life
cycle mediates the relationship between the level of voluntary disclosure and
the company's performance.
Keywords: Voluntary disclosure, earnings management, financial performance,
life cycle.
DOI: 10.22034/ijf.2020.249971.1158 © Iran Finance Association
123
Investigating the Relationship between Voluntary Disclosure
Introduction
Users of corporate financial reports need quality financial information to make
purchasing, sales, performance appraisal, and other important economic
decisions. In general, investors invest in an entity when they first have
sufficient information about it. A strong reliance on the accounting figures, and
especially profits, provides strong incentives for the managers to manipulate
profits for their own benefits. This causes users to access incorrect information
and make wrong decisions based on it (Khodamipour et al., 2013). Therefore,
in every organization, providing voluntary information about identifying,
measuring, and disclosing accounting items in the financial statements attracts
investors, effectively helping to improve the financial situation and
management image of the company (Iatridis and Alexakis, 2012). In this
regard, voluntary disclosure of information by the companies can be seen as a
key concept to protect the interests of the shareholders against the discretion of
managers. Investors' better understanding of the manager in anticipating
economic changes increases the value of the company.
Therefore, managers can voluntarily provide their forecast information
about the future economic environment of the company and also provide
forecasts of earnings management increase the value of stocks and thus
increase the competitive position of the company in its related industry in the
capital market. However, in addition to having business benefits, voluntary
disclosure also imposes costs on the company. In this regard, the theory of
voluntary disclosure states that managers will disclose the information if the
benefits of disclosure outweigh its costs (Heitzman et al., 2010). Therefore,
voluntary disclosure of information by the company managers can affect their
performance and profitability. Another factor affecting the rate of voluntary
information disclosure is the life cycle of the business unit. According to this
theory, companies come into being one day like living beings and by going
through various stages of growth, maturity, and progress, they will reach a state
of decline and decline one day.
Utami and Inanga (2012) d v d d f s’ f y s to th g owth,
maturation, and decline stages. They concluded that maturing firms have less
information asymmetry than growing and declining firms. Companies that are
in the maturing stage are older than the companies in the growth stage and have
been carefully analyzed by the analysts and investors and are well known in the
market and therefore should have less information asymmetry, requiring less
voluntary disclosure. Therefore, the purpose of this study was to answer the
general question of whether voluntary disclosure affects financial performance

124
Iranian Journal of Finance, 2020, Vol. 4, No. 3
and earnings management and if different stages of the life cycle play a role in
this effect.
1.Theoretical foundations of research
Voluntary disclosure theory states that managers will disclose information
from the company they manage if the benefits of disclosure outweigh its costs.
Useful and relevant information provided through discretionary disclosure
improves the decision-making process of the investors and puts other users of
the company's information disclosure in a better position for allocating
financial resources (Kristendal and Bontis, 2007).
While the disclosure of the information is what society wants, the
interaction between costs and benefits can lead to the disclosure of certain
items; in such cases, the question arises as to whether disclosure should be
optional or mandatory. In the literature of accounting and economics, the view
has been supported that in terms of information asymmetry, the disclosure of
confidential information increases economic efficiency and the extent of this
efficiency and the final impact on the financial conditions significantly depends
on the information content of the disclosed material, method of disclosure, and
its use; Therefore, companies are expected to disclose information voluntarily
and incur direct and indirect costs of disclosure in return for the received
benefits (Ferguson, 2002). In other words, more voluntary disclosure will
enable investors to make better judgments about the company's financial
performance and to better identify the potential misuses of the resources by the
corporate executives through earnings management. It can also be said that
voluntary disclosure is similar to the channel through which the current and
potential shareholders obtain information about the value and performance of
the company and the relationship between individuals within and outside the
organization (Alves et al., 2015).
Also, providing voluntary information on the identification, measurement,
and disclosure of accounting items in the financial statements attracts investors
and effectively helps to improve the financial situation and management image
of the company (Iateridis and Alexakis, 2012). Another consequence of the
voluntary disclosure is the reduction of uncertainty, which in turn reduces the
need to monitor management activities and consequently reduces earnings
management and increases the firm's financial performance (Gietzmann and
Trombetta, 2003). Another effective factor in the relationship between
voluntary disclosure and financial performance is the business unit´s life cycle.
The theory of the company´s life cycle assumes that economic enterprises, like
all living things, have a life cycle. Companies at different stages of their life
125
Investigating the Relationship between Voluntary Disclosure
cycle (growth, maturity, and decline) have certain financial and economic
manifestations and behaviors. This means that the manager's behavior in the
voluntary disclosure of information, as well as the existence of corporate
governance mechanisms, are influenced by the life cycle stage in which the
company is.
There are two competing views in explaining the effect of the life cycle
on the voluntary disclosure of information. The first view states that the
companies in the growth phase tend to report lower quality information to
eliminate the risk of losing their competitive advantages, and after completing
their projects and entering the maturity stage, they increase the quality of their
information by increasing voluntary disclosure; the opposite view called the
signalling perspective, is based on the assumption that companies in the growth
phase tend to show their desired future growth opportunities and performance
through information disclosure, thereby increasing the quality of their
information (Bush et al., 2010).
Matured companies also have the ability to maintain a longer-term
presence in the market and are constantly and closely monitored by the analysts
and investors, having less information asymmetry and needing less information
disclosure.
Background
Wald et al. (2020) examined the effect of corporate governance on the
corporate financial performance in their study. Corporate governance
mechanisms of this study were board accountability index, audit committee
index, disclosure and transparency index. The results showed a significant
difference between India and the Persian Gulf countries in terms of financial
performance and corporate governance indicators. Ilhan et al. (2019) examined
the relationship between corporate governance and performance in the
emerging markets. Their results showed that increasing mutual ownership has a
negative relationship with accounting performance and private ownership leads
to improving the performance of the companies.
Pedersen et al. (2018) examined the relationship between business
innovation, sustainable performance, and increasing company value in the
fashion industry. They interviewed 492 Swedish corporate executives and
found that companies that are more innovative tend to disclose sustainable
performance more and ultimately have higher values. According to the theory
of stakeholders and resources, Haffar and Searcy expect a positive relationship
between the disclosure of sustainability information and the financial
126
Iranian Journal of Finance, 2020, Vol. 4, No. 3
performance and value of the firms; because resource-based perspective theory
states that a company has unique capabilities, and if exploited strategically, it
can gain a competitive advantage that will lead to the better financial
p fo I th st ho d s’ th o y, o p w th th st ho d s’
requirements improves the financial performance and value of the company.
Gorbel and Triki (2016) examined the consequences of the voluntary
disclosure on the Tanzania Stock Exchange. The researchers looked at the level
of profit smoothing in the companies and found that in the companies with
higher voluntary disclosure rates, the rate of change that managers make to
smooth profit is also reduced. Also, in companies with higher voluntary
disclosure level, decreasing smoothing level increases the value of the
company. Bazrafshan et al. (2016) conducted a study titled "The effect of
gs g t o th v of d s os d f p fo ”,
showing that there is a non-linear relationship between disclosure and adjusted
performance of the company.
Eugster and Wanger (2013) examined the quality of voluntary disclosure,
operating performance, and stock market evaluation. Operating performance is
measured by three criteria of net profit margin, earnings-to-equity ratio, and
sales growth. The results showed that there is a positive relationship between
operational performance criteria (as the independent variable) and voluntary
disclosure. Aviar et al. (2013) examined the relationship between company
characteristics and the level of voluntary disclosure of the companies in the
Turkish Stock Exchange. The results showed that there is a positive
relationship between firm size, audit firm size, independent board members,
and corporate ownership with the level of voluntary disclosure (as the
dependent variable). Also, there was no significant relationship between
profitability criteria and board size with the level of voluntary disclosure.
Ayatridis and Alexakis (2012) examined the motivations of the voluntary
disclosure and the differences between voluntary and involuntary disclosure in
the Athen Stock Exchange. Findings showed that voluntary disclosure indicates
higher profits and growth of the companies and reflects the "good news" of the
company. Also, according to the findings of this study, voluntary disclosure
has a negative relationship with earnings management. Jiao (2011) examined
the relationship between disclosure rankings and operating performance of the
companies. The results showed a positive relationship between disclosure
rankings (as the independent variable) with R&D performance measures, sales
growth, and net profit margin. Larijani et al. (2018) studied the relationship
between disclosure of internal control reports, agency costs, and earnings
management. The results show that there is no significant relationship between
127
Investigating the Relationship between Voluntary Disclosure
the disclosure of internal control reports and agency costs and between
earnings management and agency costs. Mirabbasi and Khazen (2017) studied
the effect of disclosure quality on the relationship between corporate
governance and earnings management. Findings showed that there is no
significant relationship between earnings management and disclosure quality.
Pourheidari et al. (2017) investigated the relationship between earnings
quality and the cost of capital with voluntary disclosure. The results showed
that there is a direct and significant relationship between high (low) profit
quality and higher (lower) disclosure by the companies. Pourzamani et al.
(2015) investigated the effect of company life cycle on the relationship
between disclosure quality and capital structure. Findings showed that in both
stages of growth and decline of the companies´ life cycle, there is a significant
relationship between the quality of accounting information disclosure and their
capital structure; while, such a relationship is not seen in the maturity stage.
Khodamipour et al. (2013) investigated the effect of disclosure quality on
various types of earnings management. Findings indicated a significant and
negative relationship between the quality level of disclosure and earnings
management of the accruals and actual earnings. Using the logit regression
model, the results also show a significant and negative relationship between
overall earnings management and the quality level of disclosure.
Research hypotheses
According to the theoretical foundations and literature, the hypotheses of this
research are expressed as follows:
H1: There is a significant correlation between voluntary disclosure and
earnings management criteria of the company during the life cycle of the
company.
H2: There is a significant correlation between voluntary disclosure and return
on equity (ROE) during the life cycle of the company.
H3: There is a significant correlation between voluntary disclosure and return
on assets (ROA) during the life cycle of the company.
H4: There is a significant correlation between voluntary disclosure and the
Tobin Q ratio during the life cycle of the company.
H5: There is a significant correlation between voluntary disclosure and
economic value added (EVA) during the life cycle of the company.
H6: There is a significant correlation between voluntary disclosure and refined
economic value added (REVA) during the life cycle of the company.
128
Iranian Journal of Finance, 2020, Vol. 4, No. 3
Methodology
This study was cross-sectional, correlation and post-event. The analysis of the
collected data was done in three stages; first, the research data were collected
from Rahavard Novin Software and the official website of Tehran Stock
Exchange, as well as the published financial statements of the sample
companies using differentiating variables classified into the stages of growth,
maturity, and decline; in the last stage, the research hypotheses were tested
using statistical methods of correlation analysis and cross-sectional regression.
The statistical population in the study included all listed companies in the
Tehran Stock Exchange that have been the members of the Tehran Stock
Exchange since 2013 or before. The following criteria were used to select the
appropriate sample by the systematic random sampling method:
1. The companies were not part of the investment or financial intermediaries,
holdings, banks and leasing companies.
2. The company's fiscal year ended in the last winter month.
3. Financial information of the companies in the study period was available.
4. The companies' stocks were traded continuously in Tehran Stock Exchange
with no trading stop for more than 1 month.
According to the above conditions, 110 companies (770 companies -
years) were selected as the statistical sample of the study.
1. Research patterns and variables
The model for testing research hypotheses was tested using the Dixon (2011)
life cycle criteria based on the following regression model:
{ ∑
(1)
Where, the variables of this study were divided into four groups of dependent,
independent, moderator, and control variables.
2. Independent variable
Voluntary Disclosure of Information (DSCORE): For calculating the
independent variable, a collection of recommended voluntary disclosure items
was collected and then scored to calculate the independent variable by studying
many sources, including the research conducted by the academics and
professionals, reading the guidelines of various professional associations, and
the opinion of the financial experts.

129
Investigating the Relationship between Voluntary Disclosure
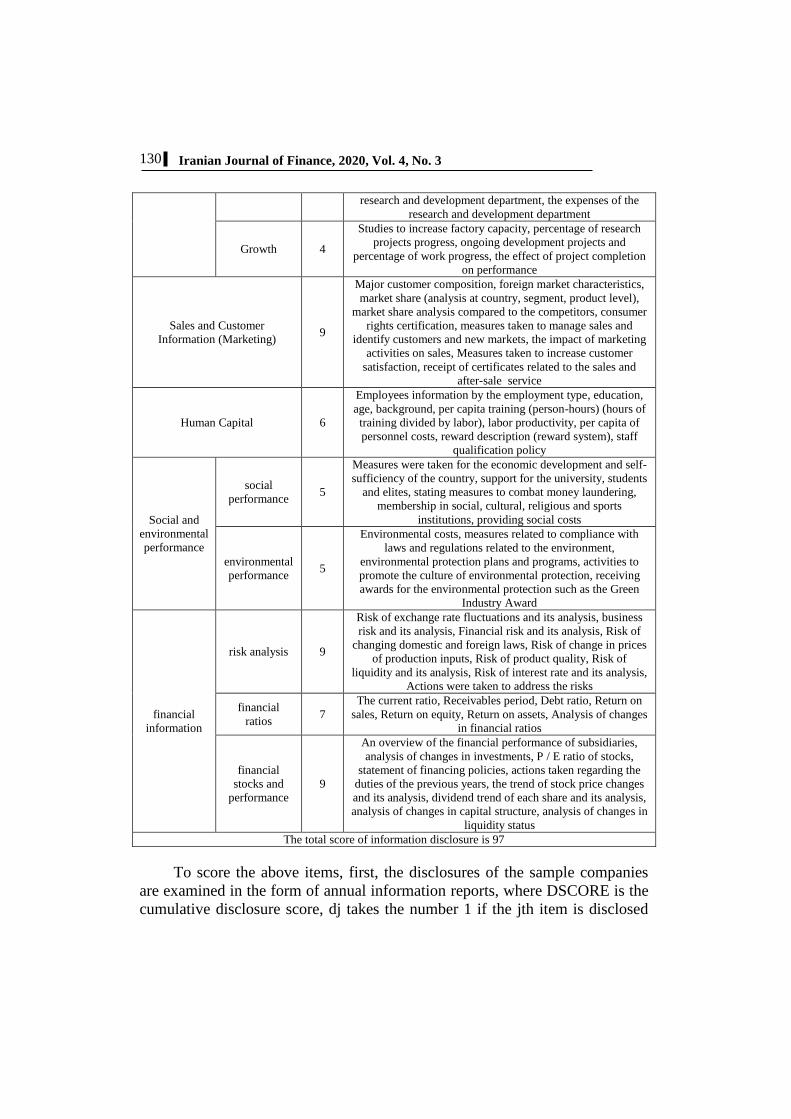
Table 1. Designed scoring form
Indices score
rate
Dimensions of optional
disclosure
Summary of the company's activity history, diagram of the
company's organizational structure, explanation of the scope
of the company's business activities, the company's position
in the industry in an analytical manner, an overview of the
most important events of the past year (s), statement of the
major company risks
6 general
information
information
background
Expressing the general goals and strategies of the company
and business sectors, Expressing production strategies,
Expressing financial and investment strategies, Expressing
marketing strategies, Organizational culture,
5 company
strategy
Important performance and achievements of the company,
statement of legal claims and its status, time definition and
determination for each goal of the company (planning to
achieve goals), planned actions to achieve goals in the
coming years, actions were taken during the year to achieve
goals
5 Policies and
actions
Future Plans for quantitative and qualitative product
development, future plans in the field of technology, future
plans for marketing network expansion, future research and
development projects, future plans for marketing network
expansion, plans for expanding product exports in the coming
years, future plans for performance improvement and
profitability increase
6 Future perspective
List of board members and statement of their educational and
professional records, list of executive directors and statement
of their educational and professional records, membership of
board members in the board of directors of other companies,
number of shares held by board members,
number of shares held by executives, Managing Director and
former members of the Board of Directors, number of annual
meetings of the Board of Directors and the presence of
members, issues to be considered in the meetings of the
Board of Directors and their approvals, salaries and
benefits/remuneration of board members, salaries and
benefits of CEOs, remuneration policy for CEOs and board
members
11
Company
board
information Corporate
governance
and internal
processes
Measures are taken to eliminate valueless activities, using
new management accounting techniques in production,
describing production technology and comparing it with
competitors, measures to improve the quality of production
processes, measures to reduce costs and cost of goods,
measures taken to improve and develop suppliers, providing
production productivity ratios
7 Internal
processes
The main actions of the research and development unit and
the laboratory unit of the company, the achievements of the 3 innovation
innovation &
growth
130
Iranian Journal of Finance, 2020, Vol. 4, No. 3
research and development department, the expenses of the
research and development department
Studies to increase factory capacity, percentage of research
projects progress, ongoing development projects and
percentage of work progress, the effect of project completion
on performance
4 Growth
Major customer composition, foreign market characteristics,
market share (analysis at country, segment, product level),
market share analysis compared to the competitors, consumer
rights certification, measures taken to manage sales and
identify customers and new markets, the impact of marketing
activities on sales, Measures taken to increase customer
satisfaction, receipt of certificates related to the sales and
after-sale service
9 Sales and Customer
Information (Marketing)
Employees information by the employment type, education,
age, background, per capita training (person-hours) (hours of
training divided by labor), labor productivity, per capita of
personnel costs, reward description (reward system), staff
qualification policy
6 Human Capital
Measures were taken for the economic development and self-
sufficiency of the country, support for the university, students
and elites, stating measures to combat money laundering,
membership in social, cultural, religious and sports
institutions, providing social costs
5 social
performance
Social and
environmental
performance Environmental costs, measures related to compliance with
laws and regulations related to the environment,
environmental protection plans and programs, activities to
promote the culture of environmental protection, receiving
awards for the environmental protection such as the Green
Industry Award
5 environmental
performance
Risk of exchange rate fluctuations and its analysis, business
risk and its analysis, Financial risk and its analysis, Risk of
changing domestic and foreign laws, Risk of change in prices
of production inputs, Risk of product quality, Risk of
liquidity and its analysis, Risk of interest rate and its analysis,
Actions were taken to address the risks
9 risk analysis
financial
information
The current ratio, Receivables period, Debt ratio, Return on
sales, Return on equity, Return on assets, Analysis of changes
in financial ratios
7 financial
ratios
An overview of the financial performance of subsidiaries,
analysis of changes in investments, P / E ratio of stocks,
statement of financing policies, actions taken regarding the
duties of the previous years, the trend of stock price changes
and its analysis, dividend trend of each share and its analysis,
analysis of changes in capital structure, analysis of changes in
liquidity status
9
financial
stocks and
performance
The total score of information disclosure is 97
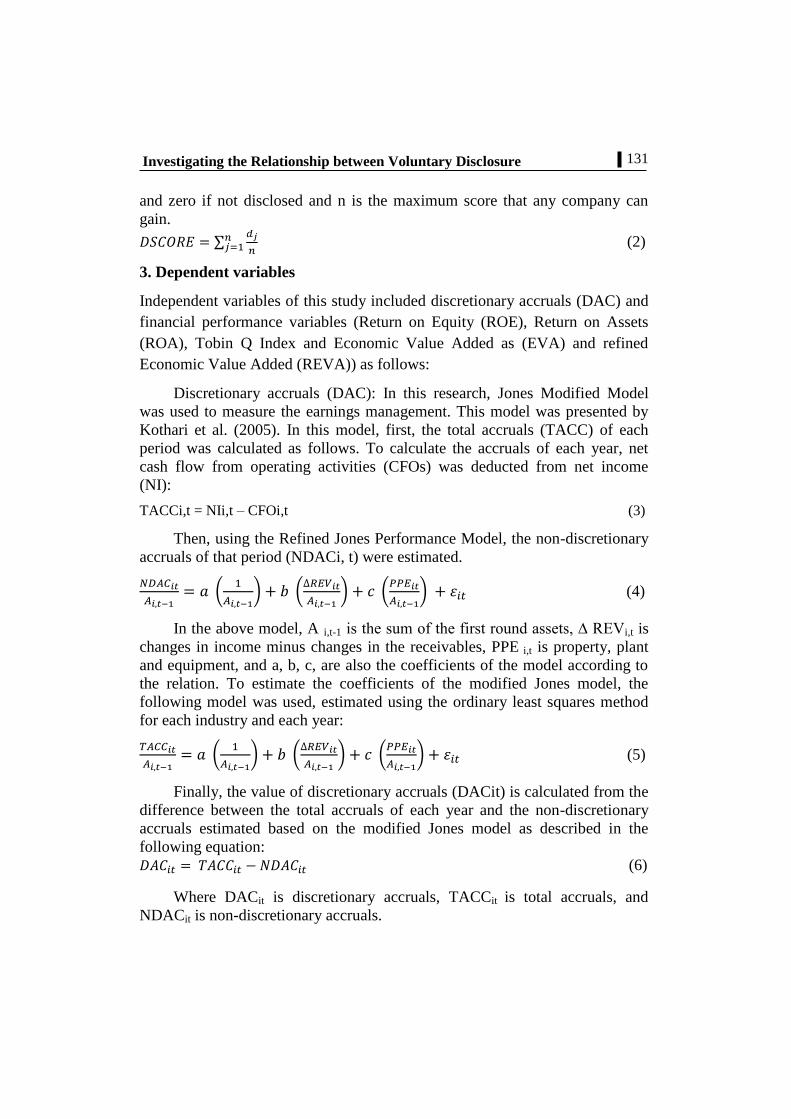
To score the above items, first, the disclosures of the sample companies
are examined in the form of annual information reports, where DSCORE is the
cumulative disclosure score, dj takes the number 1 if the jth item is disclosed
131
Investigating the Relationship between Voluntary Disclosure
and zero if not disclosed and n is the maximum score that any company can
gain.
∑
(2)
3. Dependent variables
Independent variables of this study included discretionary accruals (DAC) and
financial performance variables (Return on Equity (ROE), Return on Assets
(ROA), Tobin Q Index and Economic Value Added as (EVA) and refined
Economic Value Added (REVA)) as follows:
Discretionary accruals (DAC): In this research, Jones Modified Model
was used to measure the earnings management. This model was presented by
Kothari et al. (2005). In this model, first, the total accruals (TACC) of each
period was calculated as follows. To calculate the accruals of each year, net
cash flow from operating activities (CFOs) was deducted from net income
(NI):
TACCi,t = NIi,t – CFOi,t (3)
Then, using the Refined Jones Performance Model, the non-discretionary
accruals of that period (NDACi, t) were estimated.
(
) (
) (
) (4)
In the above model, A i,t-1 s th s of th f st o d ss ts, ∆ REVi,t is
changes in income minus changes in the receivables, PPE i,t is property, plant
and equipment, and a, b, c, are also the coefficients of the model according to
the relation. To estimate the coefficients of the modified Jones model, the
following model was used, estimated using the ordinary least squares method
for each industry and each year:
(
) (
) (
) (5)
Finally, the value of discretionary accruals (DACit) is calculated from the
difference between the total accruals of each year and the non-discretionary
accruals estimated based on the modified Jones model as described in the
following equation: (6)
Where DACit is discretionary accruals, TACCit is total accruals, and
NDACit is non-discretionary accruals.

132
Iranian Journal of Finance, 2020, Vol. 4, No. 3
Various criteria can be introduced to evaluate financial performance. In
this study, the criteria of return on equity (ROE), return on assets (ROA), P / E
ratio, economic value added(EVA), and refined economic value added (REVA)
were used to measure performance estimated as follows:
Return on Equity (ROE): Net operating profit after tax divided by the total
equity
Return on Assets (ROA): Net operating profit after tax divided by total assets
TOBIN Q: The market value of the company divided by the total assets
(7)
Where,
COMVAL: Normal stock market value at the end of the year
SBOND: Book value of the long-term debt at the end of the year
STDEBT: Book value of the short-term debt at the end of the year
SRC: The book value of the company's total assets at the end of the year
Economic Value Added (EVA): The following formula was used to calculate
EVA:
EVA = )ROIC – WACC × ( Capital Empoyed (8)
Where,
EVA: Economic Value Added
ROIC: Return on invested capital
WACC: Weighted average cost of capital
Employed capital: Employed capital
Method of calculating ROIC
To calculate ROIC, operating profit after tax is divided into the book value of
the used capital (total equity + liabilities)
(9)
Method of calculating WACC
The minimum rate of return that the company must obtain so that the value of
the company does not change is WACC.
(
) (
) (10)
Where,
WACC: Weighted average cost of capital
: Market value of equity
Market value of debts
: Capital cost return of equity
Debt capital cost rate:
T: The tax rate

133
Investigating the Relationship between Voluntary Disclosure
Method of calculating REVA
REVA is the residual net profit that is obtained after deducting the opportunity
cost of investors at market value from the net operating profit after tax,
calculated as follows (Stewart, 2000):
(11)
Where,
REVA: Refined economic value added
WACC :Weighted average cost of capital
: Market value of the company at the beginning of year t (end of
year1-t)
Dummy variable
Company life cycle dummy (Clc-Dum): In this study, Dickinson (2011)
method was used to measure the company life cycle. To separate the stages of
the company's life cycle, he created patterns of positive and negative signs of
the three (operating, investment and financing) categories of cash flow
statements. His strategy for identifying life cycles is based on the hypothesis
that companies' cash reflects their financial results (e.g. differences in
profitability, growth, and risk) at different stages of their life cycle
distinctively, so that each stage has a specific pattern of net cash flows. He
states that the company is in the emerging stage if the cash flow from
operations and investment is negative while the cash flow from financing is
positive (CFO <0, CFI <0, CFF> 0); the company is in the growth stage if
cash flows from operations and financing are positive while cash flows from
investments are negative (CFO> 0, CFI <0, CFF> 0); the company is in the
maturity stage if the cash flow from investment and operations is negative and
the cash flow from operations is positive (CFO> 0, CFI <0, CFF <0); the
company is in decline stage If cash flow from operations is negative, cash flow
from the investment is positive and cash flow from financing is positive,
g t v o o (CFO <0), CFI> 0, CFF ≤o ≥0 ); the remaining states are
classified under the decline stage 2; and since the life cycle has five stages,
four dummy variables are used to operate it.
In order to test the research hypotheses for the four stages of emergence,
growth, maturity and decline, a dummy variable was used such that if the
company qualifies for each of the stages it equals to 1 and otherwise zero.
Also, due to the inactivity of the transaction (buying and selling) or the
emerging companies being non-stock in the Tehran Stock Exchange, the life
cycle was defined as three stages of growth, maturity and decline and the
emergence stage was omitted.

134
Iranian Journal of Finance, 2020, Vol. 4, No. 3
4. Control variables
Based on the previous studies, two variables of the company size and financial
leverage were used as the control variables in this study.
Company Size: Company size has a significant and positive relationship with
the level of disclosure. In other words, larger companies have a higher level of
disclosure compared to smaller companies (Wang and Mack, 2003). The cost-
effectiveness of the disclosure costs for these companies can be an explanation
for their behavior.
Leverage: By increasing the number of debts, companies try to reduce the
uncertainty of creditors and meet their information needs by increasing
disclosure (Wallace, 1995). Therefore, a significant relationship between
financial leverage and the level of voluntary disclosure of the companies can be
expected. Financial leverage is obtained by dividing total debts into the
company's assets.
Research Findings
1.Descriptive statistics
To review and analyze the statistics of the descriptive data, the studied
variables have been calculated and shown in Table 2. It is seen that the level of
voluntary disclosure varies from 12% to 51%; since its median rate is 34% and
its average is 35%, the distribution is almost symmetric.
Table 2. Statistical indicators related to the research variables
Sd Mean Median Max Min Variable
0.0721 0.3521 0.3425 0.5121 0.1232 Level of voluntary disclosure
0.0625 -0.0521 -0.3251 11.2154 -3.5015 Earnings management
0.4215 0.3213 0.5512 0.6801 -0.6425 ROE
0.0492 0.2536 0.1625 0.4123 -0.0752 ROA
0.2452 0.2513 0.1413 1.7822 0.0512 Q Tobin
499..1 4997..1 4991941 1.9..12 79.141 EVA
499..4 4999.2. 499211. 1.97..1 99.41. REVA
0.2127 0.7123 0.7215 1.0000 0.0000 Percentage of major
shareholders ownership
0.2335 0.6309 0.6215 0.9999 0.0000 Management ownership
1.4215 11.9821 11.9214 18.2421 9.2142 Company size
0.1532 0.6192 0.6231 0.9421 0.0491 Financial leverage
To test the research hypotheses, all companies were divided into three
groups of growth, maturity, and decline based on the life cycle of the
companies and then the research model was fitted. Also, before fitting the

135
Investigating the Relationship between Voluntary Disclosure
research model, F-Limer diagnostic test was required to select among the
common composite data models against the panel data model with the fixed
effects. Their results and goodness of fit of the model to test the hypotheses are
presented in Table 3.
The purpose of the first hypothesis was to examine the relationship
between voluntary disclosure and corporate earnings management metrics over
the life cycle of the firm. According to the results of Table (3), the significance
of the whole regression was confirmed because the significance level of the
Fisher's statistic was 0.000; also, according to the results of the F-Limer test,
since the significance level of this test in all three stages of growth (0.000),
maturity, (0.000), and decline (0.000) was less than 5%, the intercepts´
homogeneity was rejected and it was necessary to use the panel data method in
estimating the model. According to the results of Hausman test, since the
significance level of this test in all three stages (growth (0.004), maturity
(0.008) and decline (0.000)) was less than 5%, in estimating the model, the
fixed effects method was used. According to the value of T statistic and its
probability (growth, (0.000), maturity, (0.000) and decline, (0.000) at 5% error
level, there was a significant relationship between voluntary disclosure and
earnings management throughout the life cycle. Also, the Durbin-Watson value
in all three stages of growth (1.887), maturity (2.247), and decline (2.134) was
1.5 to 2.5, respectively, indicating the absence of autocorrelation error in the
model. Comparing obtained determination coefficients for three stages of
growth (23%), maturity (28%), and decline (25%) indicated that voluntary
disclosure capacity is greater in the maturity stage than in the growth and
decline phases, and companies are more inclined to voluntarily disclose
information at this stage.
Table 3. Results of the voluntary disclosure hypothesis test and the company's earnings
management criteria over the life cycle
Variables
Growth Maturity Recession
coeffi
cients
t
statisti
cs
Signifi
cance
level
coeffi
cients
t
statisti
cs
Sign
ifica
nce
leve
l
coeffi
cients
t
statisti
cs
Signifi
cance
level
Voluntary
disclosure -0.053 -9.706 0.000 -0.063
-
11.64
7
0.00
0 -0.048 -8.735 0.000
company size -0.072 -7.200 0.000 -0.086 -8.640 0.00
0 -0.065 -6.480 0.000
Financial leverage 0.017 3.952 0.000 0.020 4.743 0.00
0 0.015 3.557 0.000

136
Iranian Journal of Finance, 2020, Vol. 4, No. 3
Industry 1 0.015 1.581 0.114 0.018 1.897 0.13
7 0.014 1.423 0.103
Industry 2 0.023 1.973 0.049 0.028 2.368 0.05
9 0.021 1.776 0.044
Industry 3 -0.008 -0.804 0.422 -0.010 -0.964 0.50
6 -0.008 -0.723 0.380
Industry 4 0.006 0.599 0.549 0.007 0.719 0.65
9 0.005 0.539 0.494
Industry 5 0.015 1.521 0.129 0.018 1.825 0.15
4 0.013 1.369 0.116
Fixed value -0.023 -0.984 0.125 -0.028 -1.181 0.15
0 -0.021 -0.886 0.113
Determination
coefficient 0.235 0.282 0.254
Modified
determination
coefficient
0.224 0.268 0.241
Durbin- Watson 1.887 2.264 2.038
Fisher F statistics 32.202 38.642 34.778
Significance level 0.000 0.000 0.000
Limer F statistics 1.872 2.247 2.134
Significance level 0.000 0.000 0.000
Hausman test 17.215 20.658 19.626
Significance level 0.004 0.008 0.000
Source: Research findings
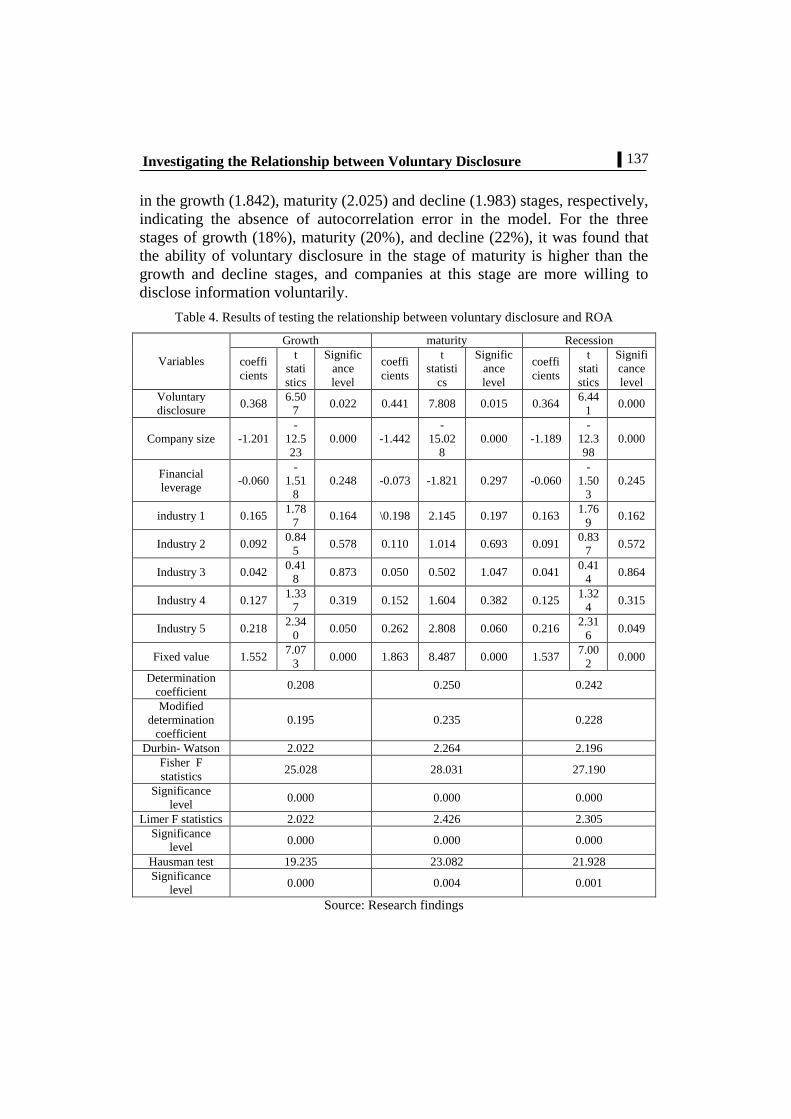
The purpose of the H2 was to examine the relationship between voluntary
disclosure and ROE over the life cycle of the company. According to the
results of Table (4), the significance of the whole regression was confirmed
because the significance level of the Fisher's F statistic was 0.000; also
according to the results of F-Limer test, since the significance level of this test
in all three stages (growth, 0.000, maturity, 0.000 and decline, 0.000) was less
than 5%, the intercepts´ homogeneity was rejected and it was necessary to use
the panel data method in estimating the model. According to the results of
Hausman test, since the significance level of this test in all three stages
(growth, 0.000, maturity, 0.000 and decline, 0.000) was less than 5%, the fixed
effects method was used in estimating the model. According to the calculated t
statistic and its probability (growth, 0.049, maturity, 0.000 and decline, 0.170)
at 5% error level, the significant correlation between the ratio of non-executive
board members and voluntary disclosure was confirmed only in the maturation
stage. Also, at the error level of 5%, the ratio of non-executive board members
to voluntary disclosure in the growth and decline stages was not confirmed. In
addition, the Watson-Durbin value in all three stages was between 1.5 and 2.5
137
Investigating the Relationship between Voluntary Disclosure
in the growth (1.842), maturity (2.025) and decline (1.983) stages, respectively,
indicating the absence of autocorrelation error in the model. For the three
stages of growth (18%), maturity (20%), and decline (22%), it was found that
the ability of voluntary disclosure in the stage of maturity is higher than the
growth and decline stages, and companies at this stage are more willing to
disclose information voluntarily.
Table 4. Results of testing the relationship between voluntary disclosure and ROA
Variables
Growth maturity Recession
coeffi
cients
t
stati
stics
Signific
ance
level
coeffi
cients
t
statisti
cs
Signific
ance
level
coeffi
cients
t
stati
stics
Signifi
cance
level
Voluntary
disclosure 0.368
6.50
7 0.022 0.441 7.808 0.015 0.364
6.44
1 0.000
Company size -1.201
-
12.5
23
0.000 -1.442
-
15.02
8
0.000 -1.189
-
12.3
98
0.000
Financial
leverage -0.060
-
1.51
8
0.248 -0.073 -1.821 0.297 -0.060
-
1.50
3
0.245
industry 1 0.165 1.78
7 0.164 \0.198 2.145 0.197 0.163
1.76
9 0.162
Industry 2 0.092 0.84
5 0.578 0.110 1.014 0.693 0.091
0.83
7 0.572
Industry 3 0.042 0.41
8 0.873 0.050 0.502 1.047 0.041
0.41
4 0.864
Industry 4 0.127 1.33
7 0.319 0.152 1.604 0.382 0.125
1.32
4 0.315
Industry 5 0.218 2.34
0 0.050 0.262 2.808 0.060 0.216
2.31
6 0.049
Fixed value 1.552 7.07
3 0.000 1.863 8.487 0.000 1.537
7.00
2 0.000
Determination
coefficient 0.208 0.250 0.242
Modified
determination
coefficient
0.195 0.235 0.228
Durbin- Watson 2.022 2.264 2.196
Fisher F
statistics 25.028 28.031 27.190
Significance
level 0.000 0.000 0.000
Limer F statistics 2.022 2.426 2.305
Significance
level 0.000 0.000 0.000
Hausman test 19.235 23.082 21.928
Significance
level 0.000 0.004 0.001
Source: Research findings
138
Iranian Journal of Finance, 2020, Vol. 4, No. 3
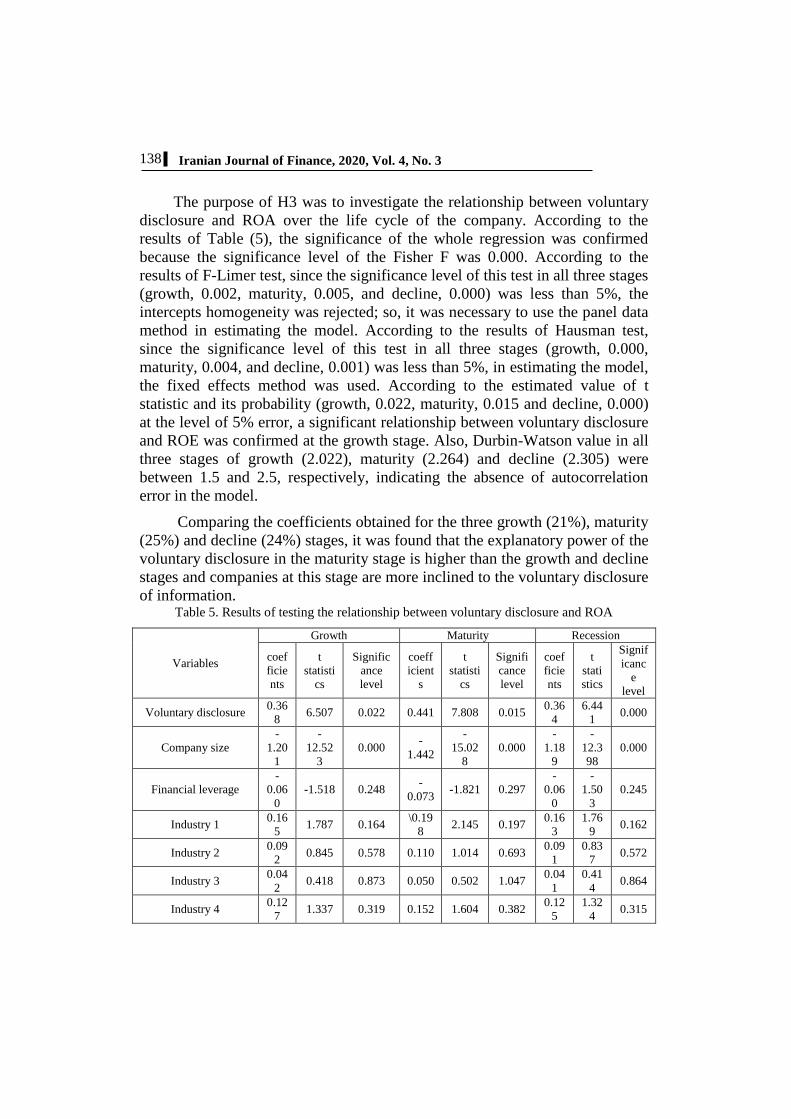
The purpose of H3 was to investigate the relationship between voluntary
disclosure and ROA over the life cycle of the company. According to the
results of Table (5), the significance of the whole regression was confirmed
because the significance level of the Fisher F was 0.000. According to the
results of F-Limer test, since the significance level of this test in all three stages
(growth, 0.002, maturity, 0.005, and decline, 0.000) was less than 5%, the
intercepts homogeneity was rejected; so, it was necessary to use the panel data
method in estimating the model. According to the results of Hausman test,
since the significance level of this test in all three stages (growth, 0.000,
maturity, 0.004, and decline, 0.001) was less than 5%, in estimating the model,
the fixed effects method was used. According to the estimated value of t
statistic and its probability (growth, 0.022, maturity, 0.015 and decline, 0.000)
at the level of 5% error, a significant relationship between voluntary disclosure
and ROE was confirmed at the growth stage. Also, Durbin-Watson value in all
three stages of growth (2.022), maturity (2.264) and decline (2.305) were
between 1.5 and 2.5, respectively, indicating the absence of autocorrelation
error in the model.
Comparing the coefficients obtained for the three growth (21%), maturity
(25%) and decline (24%) stages, it was found that the explanatory power of the
voluntary disclosure in the maturity stage is higher than the growth and decline
stages and companies at this stage are more inclined to the voluntary disclosure
of information. Table 5. Results of testing the relationship between voluntary disclosure and ROA
Variables
Growth Maturity Recession
coef
ficie
nts
t
statisti
cs
Signific
ance
level
coeff
icient
s
t
statisti
cs
Signifi
cance
level
coef
ficie
nts
t
stati
stics
Signif
icanc
e
level
Voluntary disclosure 0.36
8 6.507 0.022 0.441 7.808 0.015
0.36
4
6.44
1 0.000
Company size
-
1.20
1
-
12.52
3
0.000 -
1.442
-
15.02
8
0.000
-
1.18
9
-
12.3
98
0.000
Financial leverage
-
0.06
0
-1.518 0.248 -
0.073 -1.821 0.297
-
0.06
0
-
1.50
3
0.245
Industry 1 0.16
5 1.787 0.164
\0.19
8 2.145 0.197
0.16
3
1.76
9 0.162
Industry 2 0.09
2 0.845 0.578 0.110 1.014 0.693
0.09
1
0.83
7 0.572
Industry 3 0.04
2 0.418 0.873 0.050 0.502 1.047
0.04
1
0.41
4 0.864
Industry 4 0.12
7 1.337 0.319 0.152 1.604 0.382
0.12
5
1.32
4 0.315
139
Investigating the Relationship between Voluntary Disclosure
Industry 5 0.21
8 2.340 0.050 0.262 2.808 0.060
0.21
6
2.31
6 0.049
Fixed value 1.55
2 7.073 0.000 1.863 8.487 0.000
1.53
7
7.00
2 0.000
Determination
coefficient 0.208 0.250 0.242
Modified
determination
coefficient
0.195 0.235 0.228
Durbin- Watson 2.022 2.264 2.196
Fisher F statistics 25.028 28.031 27.190
Significance level 0.000 0.000 0.000
Limer F statistics 2.022 2.426 2.305
Significance level 0.000 0.000 0.000
Hausman test 19.235 23.082 21.928
Significance level 0.000 0.004 0.001
Source: Research findings
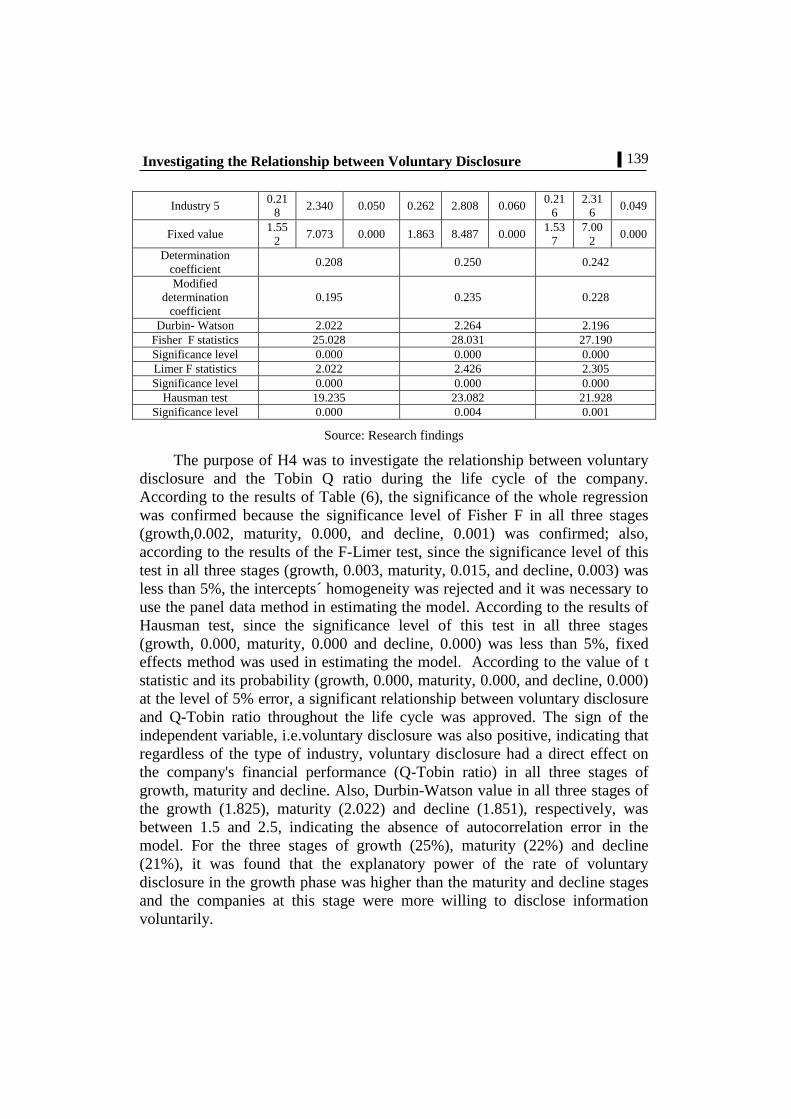
The purpose of H4 was to investigate the relationship between voluntary
disclosure and the Tobin Q ratio during the life cycle of the company.
According to the results of Table (6), the significance of the whole regression
was confirmed because the significance level of Fisher F in all three stages
(growth,0.002, maturity, 0.000, and decline, 0.001) was confirmed; also,
according to the results of the F-Limer test, since the significance level of this
test in all three stages (growth, 0.003, maturity, 0.015, and decline, 0.003) was
less than 5%, the intercepts´ homogeneity was rejected and it was necessary to
use the panel data method in estimating the model. According to the results of
Hausman test, since the significance level of this test in all three stages
(growth, 0.000, maturity, 0.000 and decline, 0.000) was less than 5%, fixed
effects method was used in estimating the model. According to the value of t
statistic and its probability (growth, 0.000, maturity, 0.000, and decline, 0.000)
at the level of 5% error, a significant relationship between voluntary disclosure
and Q-Tobin ratio throughout the life cycle was approved. The sign of the
independent variable, i.e.voluntary disclosure was also positive, indicating that
regardless of the type of industry, voluntary disclosure had a direct effect on
the company's financial performance (Q-Tobin ratio) in all three stages of
growth, maturity and decline. Also, Durbin-Watson value in all three stages of
the growth (1.825), maturity (2.022) and decline (1.851), respectively, was
between 1.5 and 2.5, indicating the absence of autocorrelation error in the
model. For the three stages of growth (25%), maturity (22%) and decline
(21%), it was found that the explanatory power of the rate of voluntary
disclosure in the growth phase was higher than the maturity and decline stages
and the companies at this stage were more willing to disclose information
voluntarily.

140
Iranian Journal of Finance, 2020, Vol. 4, No. 3
Table 6. Results of testing the relationship between voluntary disclosure and Tobin Q ratio
Variables
Growth Maturity Decline
Coeffici
ents
t
statisti
cs
Sig
level
Coeffici
ents
t
statisti
cs
Sig
level
Coeffic
ients
t
statisti
cs
Sig
leve
l
Voluntary
disclosure 0.368 6.507 0.000 0.441 7.808
0.00
0 0.364 6.441
0.00
0
Company size -1.201
-
12.52
3
0.000 -1.442
-
15.02
8
0.00
0 -1.189
-
12.398
0.00
0
Financial
leverage -0.060 -1.518 0.248 -0.073 -1.821
0.29
7 -0.060 -1.503
0.24
5
Industry 1 0.165 1.787 0.164 0.198 2.145 0.19
7 0.163 1.769
0.16
2
Industry 2 0.092 0.845 0.578 0.110 1.014 0.69
3 0.091 0.837
0.57
2
Industry 3 0.042 0.418 0.873 0.050 0.502 1.04
7 0.041 0.414
0.86
4
Industry 4 0.127 1.337 0.319 0.152 1.604 0.38
2 0.125 1.324
0.31
5
Industry 5 0.218 2.340 0.050 0.262 2.808 0.06
0 0.216 2.316
0.04
9
Fixed value 1.552 7.073 0.000 1.863 8.487 0.00
0 1.537 7.002
0.00
0
Determination
coefficient 0.251 0.222 0.215
Modified
determination
coefficient
0.241 0.213 0.207
Durbin- watson 1.825 2.022 1.851
Fisher F
statistics 22.124 25.235 20.126
Significance
level 0.002 0.000 0.001
Limer F
statistics 2.136 2.532 1.898
Significance
level 0.003 0.015 0.003
Hausman test 18.232 21.235 19.265
Significance
level 0.000 0.000 0.000
Source: Research findings
H5 aimed to examine the relationship between voluntary disclosure and
EVA of the companies during their life cycles. According to the results of
Table (7), the significance of the whole regression was confirmed because the
significance level of Fisher F in the life cycle (growth, 0.002), (maturity,
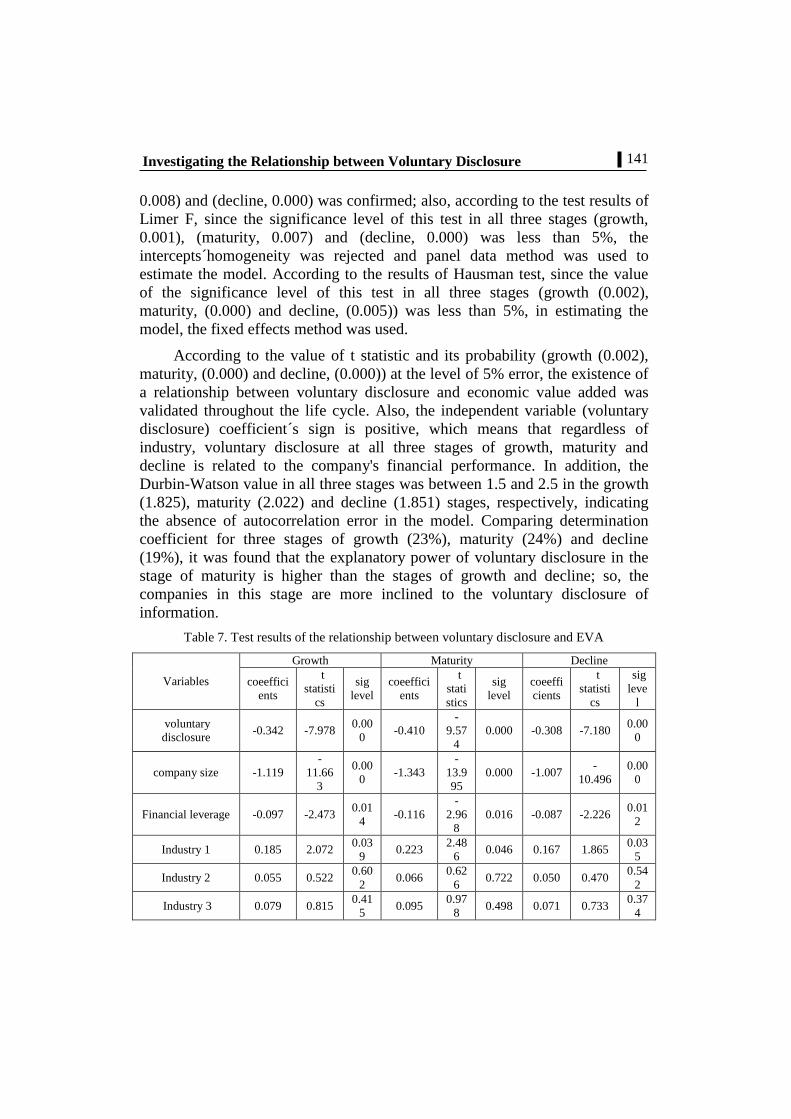
141
Investigating the Relationship between Voluntary Disclosure
0.008) and (decline, 0.000) was confirmed; also, according to the test results of
Limer F, since the significance level of this test in all three stages (growth,
0.001), (maturity, 0.007) and (decline, 0.000) was less than 5%, the
intercepts´homogeneity was rejected and panel data method was used to
estimate the model. According to the results of Hausman test, since the value
of the significance level of this test in all three stages (growth (0.002),
maturity, (0.000) and decline, (0.005)) was less than 5%, in estimating the
model, the fixed effects method was used.
According to the value of t statistic and its probability (growth (0.002),
maturity, (0.000) and decline, (0.000)) at the level of 5% error, the existence of
a relationship between voluntary disclosure and economic value added was
validated throughout the life cycle. Also, the independent variable (voluntary
disclosure) coefficient´s sign is positive, which means that regardless of
industry, voluntary disclosure at all three stages of growth, maturity and
decline is related to the company's financial performance. In addition, the
Durbin-Watson value in all three stages was between 1.5 and 2.5 in the growth
(1.825), maturity (2.022) and decline (1.851) stages, respectively, indicating
the absence of autocorrelation error in the model. Comparing determination
coefficient for three stages of growth (23%), maturity (24%) and decline
(19%), it was found that the explanatory power of voluntary disclosure in the
stage of maturity is higher than the stages of growth and decline; so, the
companies in this stage are more inclined to the voluntary disclosure of
information.
Table 7. Test results of the relationship between voluntary disclosure and EVA
Variables
Growth Maturity Decline
coeeffici
ents
t
statisti
cs
sig
level
coeeffici
ents
t
stati
stics
sig
level
coeeffi
cients
t
statisti
cs
sig
leve
l
voluntary
disclosure -0.342 -7.978
0.00
0 -0.410
-
9.57
4
0.000 -0.308 -7.180 0.00
0
company size -1.119
-
11.66
3
0.00
0 -1.343
-
13.9
95
0.000 -1.007 -
10.496
0.00
0
Financial leverage -0.097 -2.473 0.01
4 -0.116
-
2.96
8
0.016 -0.087 -2.226 0.01
2
Industry 1 0.185 2.072 0.03
9 0.223
2.48
6 0.046 0.167 1.865
0.03
5
Industry 2 0.055 0.522 0.60
2 0.066
0.62
6 0.722 0.050 0.470
0.54
2
Industry 3 0.079 0.815 0.41
5 0.095
0.97
8 0.498 0.071 0.733
0.37
4

142
Iranian Journal of Finance, 2020, Vol. 4, No. 3
Industry 4 0.094 1.018 0.30
9 0.113
1.22
2 0.371 0.084 0.916
0.27
8
Industry 5 0.171 1.885 0.05
0 0.205
2.26
2 0.060 0.154 1.696
0.04
5
fixed value 1.806 7.838 0.00
0 2.167
9.40
5 0.000 1.625 7.054
0.00
0
determination
coefficient 0.231 0.243 0.193
modified
determination
coefficient
21.983 23.038 18.288
Durbin-Watson 1.852 1.952 1.852
Fisher F 23.215 22.128 21.215
sig level 0.002 0.008 0.000
Limer F statistics 1.720 2.064 1.805
sig level 0.001 0.007 0.000
Hausman test 17.215 19.232 18.214
sig level 0.002 0.000 0.005
Source:Research findings
The purpose of H6 was to investigate the relationship between voluntary
disclosure and refined economic value added (REVA) over the life cycle of the
company. According to the results of Table 8, the significance of the whole
regression was confirmed because the significance level of Fisher F in all three
stages (growth, 0.005, maturity, 0.007, and decline, 0.002) was supported;
also, according to the results of F-Limer test, since the significance level of this
test in all three stages (growth, 0.005, maturity, 0.017, and decline, 0.011) was
less than 5%, the intercepts´ homogeneity was rejected; then, the panel data
method was used in estimating the model. According to the results of Hausman
test, since the significance level of this test in all three stages (growth, 0.011,
maturity, 0.032, and decline, 0.015) was less than 5%, the fixed effects method
was used in estimating the model. According to the estimated t value and its
related probabilities (growth, 0.000, maturity, 0.000, and decline, 0.000) at the
level of 5% error, the relationship between voluntary disclosure and refined
added economic value (REVA) was validated throughout the life cycle. Also,
the sign of the independent variable coefficient, i.e. voluntary disclosure was
positive, meaning that regardless of the industry, voluntary disclosure at all
three stages of growth, maturity and decline was correlated with financial
performance.
In addition, Durbin- Watson value in all three stages was between 1.5 and
2.5 in the stages of growth (1.863), maturity (1.722), and decline (1.912),
respectively, indicating the absence of autocorrelation error in the model. For
the three stages of growth (20%), maturity (26%), and decline (19%), it was
found that the explanatory power of voluntary disclosure in the maturity stage
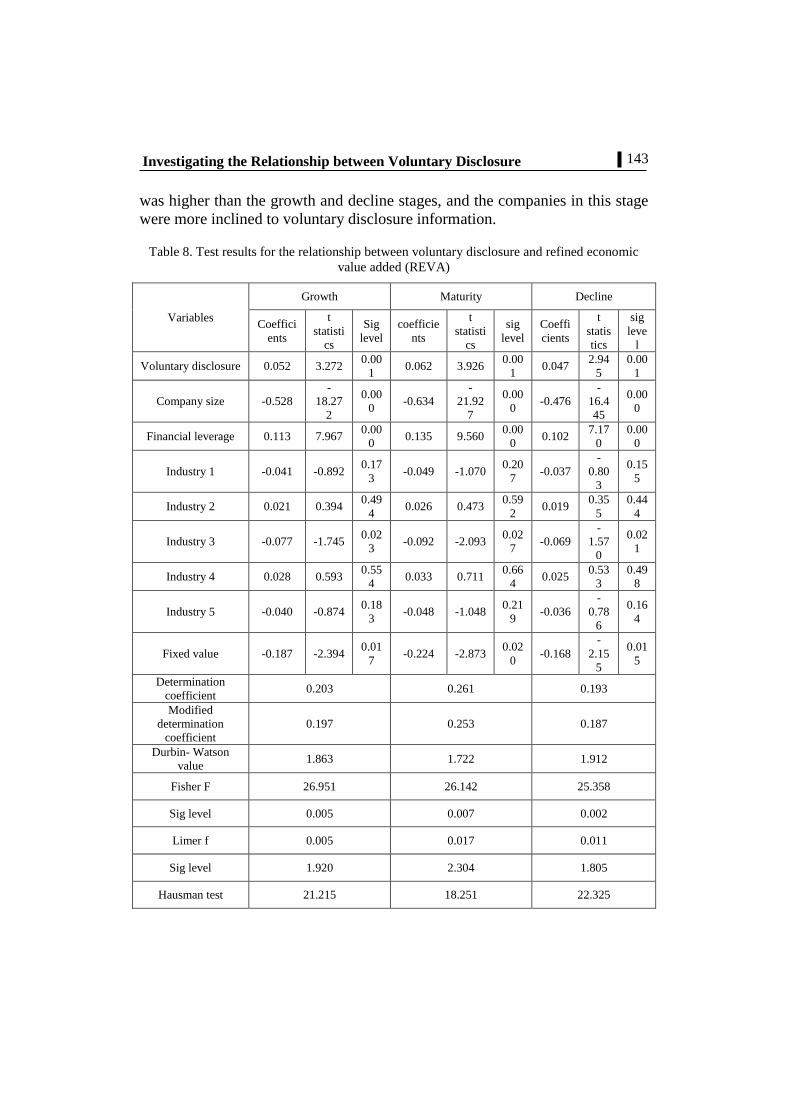
143
Investigating the Relationship between Voluntary Disclosure
was higher than the growth and decline stages, and the companies in this stage
were more inclined to voluntary disclosure information.
Table 8. Test results for the relationship between voluntary disclosure and refined economic
value added (REVA)
Variables
Growth Maturity Decline
Coeffici
ents
t
statisti
cs
Sig
level
coefficie
nts
t
statisti
cs
sig
level
Coeffi
cients
t
statis
tics
sig
leve
l
Voluntary disclosure 0.052 3.272 0.00
1 0.062 3.926
0.00
1 0.047
2.94
5
0.00
1
Company size -0.528
-
18.27
2
0.00
0 -0.634
-
21.92
7
0.00
0 -0.476
-
16.4
45
0.00
0
Financial leverage 0.113 7.967 0.00
0 0.135 9.560
0.00
0 0.102
7.17
0
0.00
0
Industry 1 -0.041 -0.892 0.17
3 -0.049 -1.070
0.20
7 -0.037
-
0.80
3
0.15
5
Industry 2 0.021 0.394 0.49
4 0.026 0.473
0.59
2 0.019
0.35
5
0.44
4
Industry 3 -0.077 -1.745 0.02
3 -0.092 -2.093
0.02
7 -0.069
-
1.57
0
0.02
1
Industry 4 0.028 0.593 0.55
4 0.033 0.711
0.66
4 0.025
0.53
3
0.49
8
Industry 5 -0.040 -0.874 0.18
3 -0.048 -1.048
0.21
9 -0.036
-
0.78
6
0.16
4
Fixed value -0.187 -2.394 0.01
7 -0.224 -2.873
0.02
0 -0.168
-
2.15
5
0.01
5
Determination
coefficient 0.203 0.261 0.193
Modified
determination
coefficient
0.197 0.253 0.187
Durbin- Watson
value 1.863 1.722 1.912
Fisher F 26.951 26.142 25.358
Sig level 0.005 0.007 0.002
Limer f 0.005 0.017 0.011
Sig level 1.920 2.304 1.805
Hausman test 21.215 18.251 22.325
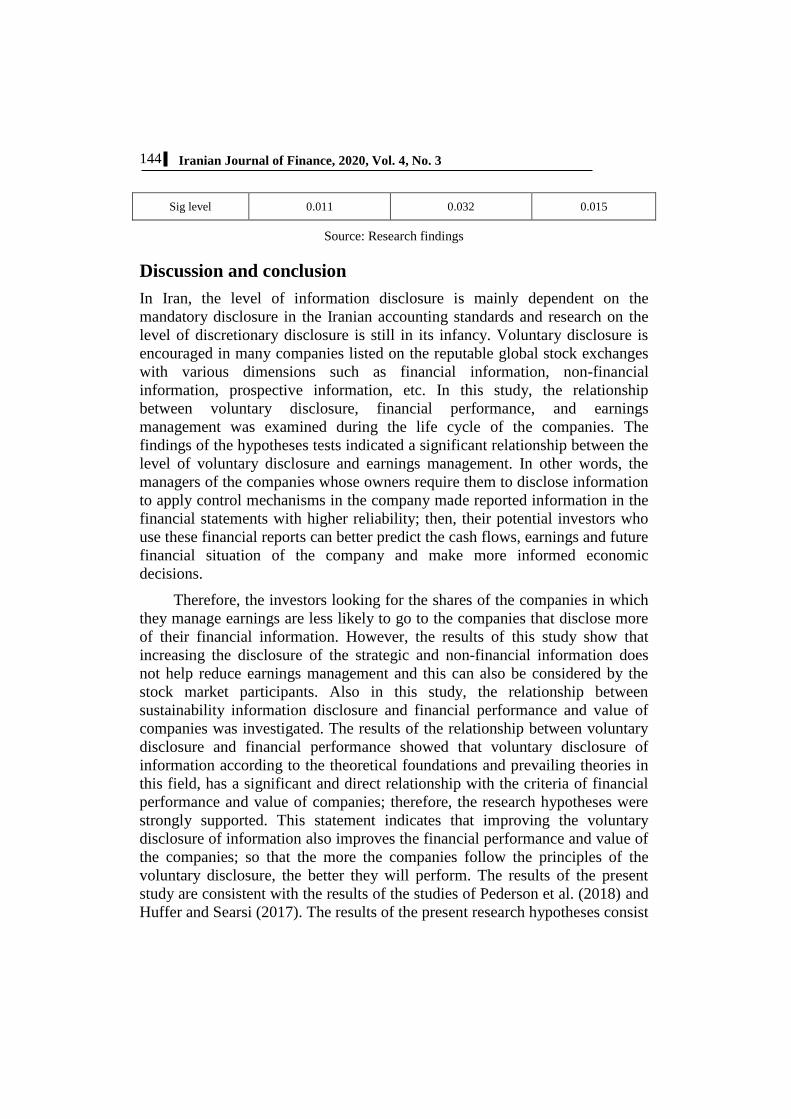
144
Iranian Journal of Finance, 2020, Vol. 4, No. 3
Sig level 0.011 0.032 0.015
Source: Research findings
Discussion and conclusion
In Iran, the level of information disclosure is mainly dependent on the
mandatory disclosure in the Iranian accounting standards and research on the
level of discretionary disclosure is still in its infancy. Voluntary disclosure is
encouraged in many companies listed on the reputable global stock exchanges
with various dimensions such as financial information, non-financial
information, prospective information, etc. In this study, the relationship
between voluntary disclosure, financial performance, and earnings
management was examined during the life cycle of the companies. The
findings of the hypotheses tests indicated a significant relationship between the
level of voluntary disclosure and earnings management. In other words, the
managers of the companies whose owners require them to disclose information
to apply control mechanisms in the company made reported information in the
financial statements with higher reliability; then, their potential investors who
use these financial reports can better predict the cash flows, earnings and future
financial situation of the company and make more informed economic
decisions.
Therefore, the investors looking for the shares of the companies in which
they manage earnings are less likely to go to the companies that disclose more
of their financial information. However, the results of this study show that
increasing the disclosure of the strategic and non-financial information does
not help reduce earnings management and this can also be considered by the
stock market participants. Also in this study, the relationship between
sustainability information disclosure and financial performance and value of
companies was investigated. The results of the relationship between voluntary
disclosure and financial performance showed that voluntary disclosure of
information according to the theoretical foundations and prevailing theories in
this field, has a significant and direct relationship with the criteria of financial
performance and value of companies; therefore, the research hypotheses were
strongly supported. This statement indicates that improving the voluntary
disclosure of information also improves the financial performance and value of
the companies; so that the more the companies follow the principles of the
voluntary disclosure, the better they will perform. The results of the present
study are consistent with the results of the studies of Pederson et al. (2018) and
Huffer and Searsi (2017). The results of the present research hypotheses consist

145
Investigating the Relationship between Voluntary Disclosure
with the view that the companies in the growth stage tend to report information
with lower quality for eliminating the risk of losing their competitive
advantage and after completing the growth stage and entering the maturity
stage, their information quality increases. But it disagrees with the opposite
view, called signaling view that the companies in the growth stage tend to
show their desired future growth opportunities and performance through their
quality information, thereby increasing the quality of their information.
According to the obtained information during this study, the following
topics are suggested for future research in line with the subject of this research:
A) Considering that in the present study only several financial performance
variables were considered, it is suggested that this issue is taken into account
by considering other characteristics of financial performance, financial
information, etc.
B) Other measurement criteria can be used to measure the level of voluntary
disclosure and earnings management.
C) The effect of voluntary disclosure can be examined on conservatism over
the life cycle.
D) The effect of voluntary disclosure on the management of working capital
should be studied over the life cycle.
E) The effect of voluntary disclosure on the corporate governance practices
over the life cycle can be examined as well.
146
Iranian Journal of Finance, 2020, Vol. 4, No. 3
References
Alves, H, S., Canadas, N., & Rodrigues, A, M. (2015). Voluntary disclosure,
information asymmetry and the perception of governance quality: An analysis using a
structural equation model. Tekhne, 13(1), 66-79. Amoozesh, N, Moeinfar, Z., & Mousavi, Z. (2013). Evaluation of the
relationship between disclosure quality and corporate governance quality in Tehran
Stock Exchange, Universal Journal of Marketing and Business Research, 2(1), 16-22.
Bazrafshan, E., Kandelousi, A. S., & Hooy, C. W. (2016). The impact of
earnings management on the extent of disclosure and true financial performance:
Evidence from listed firms in Hong Kong. The British Accounting Review, 48 (2),
206-219.
Bolo, Q., & Ebrahimi Meymand, M. (2011). Relationship between
management structure and quality of disclosure in the Tehran Stock Exchange.
Journal of Financial Accounting, 3 (12), 50-69 (in Persian).
Bushee, B.J., Core, J.E., Guay, W., & Hamm, S.J (2010). The role of the
business press as an information intermediary. Journal of Accounting Research. 48
(1), 1–19.
Dickinson, V. (2011). Cash flow patterns as a proxy for the firm life cycle. The
Accounting Review. 86 (6): 1969-1994.
Didar, Hamzeh; Mansourfar, Gh., & Zare, E.(2017). Investigating the
effect of corporate governance quality on the quality of disclosure with
emphasis on the moderating role of product market competition in the listed
companies in the Tehran Stock Exchange, Financial Accounting Research, 9
(31), 11-97 (in Persian).
Eugster, F., & Wanger, A, F. (2013). Voluntary Disclosure Quality, Operating
Performance, and Stock Market Valuations, http://papers. ssrn. com/sol3/papers.
cfm?abstract_id=1879804.
Ferguson, M. J., Lam, K. C., & Lee, G. M. (2002). Voluntary disclosure by
state-owned enterprises listed on the stock exchange of Hong Kong. Journal of
International Financial Management and Accounting, 13(2), 125-152.
Ghorbel, H. & Triki, F.(2016). The Consequences of Voluntary Information
Disclosure on FirmValue: Case of Tunisian listed firms. Research Journal of Finance
and Accounting, 7 (6),153-163.
147
Investigating the Relationship between Voluntary Disclosure
Gietzmann, M. & Trombetta, M. (2003). Disclosure interactions: accounting
policy choice and voluntary disclosure effects on the cost of rising outside capital.
Accounting & Business Research, 33(3), 187-205. Haffar, M., & Searcy, C.(2017). Classification of trade-offs encountered in
the practice of corporate sustainability. Journal of business ethics, 140(3), 495-
522.
Heitzman, S., Wasley, C. & Zimmerman., J.(2010). The joint effect of
materiality thresholds and voluntary disclosure incentives on firms disclosure
decisions. Journal of Accounting and Economics, 49(1), 109-132.
Ho, P., & Taylor, G. (2013). Corporate governance and different types of
voluntary disclosure. Pacific Accounting Review, 25 (1), 4-29.
Iatridis, G., & Alexakis, P. (2012). Evidence of voluntary accounting disclosures
in the Athens Stock Market. Review of Accounting and Finance, 11 (1), 73 - 92.
Ilhan Ciftcia, I., Tatoglub, Ekrem., Woodc, G., Demirbagc, M., & Zaim, S.
(2019). Corporate governance and firm performance in emerging markets: Evidence
Journal of International Business Review, 28, 90–103.
Jiao, Y. (2011). Corporate disclosure, market valuation, and firm performance,
Financial Management, 40(3), 647-676.
Khodamipour, A., Khorshidi, A., &Shirzad, A.(2013). The effect of
disclosure quality on various types of earnings management. Accounting and
Auditing Reviews, 4 (20), 21-38 (in Persian).
Kothari, S.P., Leone, A.J. & Wasley, C.E. (2005). Performance matched
discretionary accruals measures. Journal of Accounting and Economics, 39(1): 163–
197.
Larijani, A., and Rahmani, A. (2018). Relationship between disclosure of
internal control reports, agency costs and earnings management. Journal of
Management Accounting and Auditing Knowledge, 7 (25), 29-40 (in Persian).
Lokman, N., Cotter, J., & Mula, J. (2012). Corporate governance quality,
incentive factors and voluntary corporate governance disclosures in annual reports of
Malaysian publicly listed companies, Corporate Ownership and Control, 10(1), 329-
352.
Mirabbasi, S.J., & Khazen, A. (2017). The effect of disclosure quality on
the relationship between corporate governance and earnings management in the
listed companies of the Tehran Stock Exchange. Modaber Management
Research Institute, 1 (4), 1-28 (in Persian).
Parsian, H., Kazemi, H., & Rezazadeh, J.(2018). Identifying the
components of voluntary disclosure between the corporate governance system
and information asymmetry in operating companies in the Tehran Stock
Exchange. Journal of Financial Economics, 12 (43), 107-132 (in Persian).

148
Iranian Journal of Finance, 2020, Vol. 4, No. 3
Pedersen, E. R. G., Gwozdz, W., & Hvass, K. K. (2018). Exploring the
relationship between business model innovation, corporate sustainability, and
organisational values within the fashion industry. Journal of Business Ethics, 149(2),
267-284.
Pourheidari, O., Yusufzadeh, Y.,& Azami, Z. (2017). Investigating the
relationship between profit quality and cost of capital with voluntary disclosure.
Journal of Financial Accounting Knowledge, 4 (12), 1-20 (in Persian).
Pourzamani, Z., Jamshidi, Sh. (2015). Investigating the effect of company life
cycle on the relationship between disclosure quality and capital structure. Accounting
and Management Knowledge, 4 (13), 55-66 (in Persian).
Utami, S, R., & Inanga, E, L.(2012). The Relationship between Capital Structure
and the Life, International Research Journal of Finance and Economics Cycle of Firms
in the Manufacturing Sector of Indonesia, 8(1), 69-91.
Uyar, A., Kilic, M., & Bayyurt, N. (2013). Association between firm
characteristics and corporate voluntary disclosure: Evidence from Turkish listed
companies. http://www. redalyc. org/articulo. oa?id=54929516007.
Waleed, M., Al-ahdala, M., &Alsamhib, M, I .(2020). The impact of corporate
governance on the financial performance of Indian and GCC listed firms: An
empirical investigation. Journal of Research in International Business and Finance. 51
(1), 4 -13.
Wallace, R. S. O., & Naser, K. (1995). Firm-specific determinants of the
comprehensiveness of mandatory disclosures in the corporate annual reports of firms
listed on the stock exchange of Hong Kong. Journal of Accounting and Public Policy,
14(1), 311-368.
Wang, L. L., & Mak, Y. T. (2003). Corporate governance and voluntary
disclosure. Journal of Accounting and Public Policy, 22 (4), 325-45.
Bibliographic information of this paper for citing:
Hosseini, Seyyed Mohammad & Malekian, Esfandyar (2020). Investigating the
Relationship between Voluntary Disclosure and Financial Performance and Earnings
Management (Emphasizing the Moderating Role of the Corporate Life Cycle). Iranian
Journal of Finance, 4(3), 122-148.
Copyright © 2020, Seyyed Mohammad Hosseini and Esfandyar Malekian