Investa Office Sustainability Report 2016
21
SUSTAINABILITY REPORT JUNE 30 2016 I O M
-
Upload
brendan-yusof -
Category
Documents
-
view
21 -
download
2
Transcript of Investa Office Sustainability Report 2016

SUSTAINABILITY REPORT JUNE 30 2016
I O M

Deliver ing sustainabi l i t y through a high per formance integrated plat form
OVERVIEW
Introduction 04FY16 highlights 06 From the CEO 08
OUR BUSINESS About Investa Office 10Our impact 12Our people 14Our community 16
OUR STRATEGY The pillars of our strategy 18First choice for tenants 20Leadership in responsible investment 22Research and innovation 24Optimising operational performance 28
OUR PERFORMANCE Operational performance 30Environmental footprint 34
OUR REPORTING Methodology and approach 36Independent assurance 38Glossary 39Contact details 40
03IOM 2016 Sustainability ReportIOM 2016 Sustainability Report 02OVERVIEW

Investa’s sustainability strategy manages the risks and opportunities stemming from environmental, social and governance (ESG) matters, ensuring Investa retains its global leadership position. The strategy is guided by four key pillars, prioritising; tenant engagement & collaboration, research & innovation, the optimisation of building operational performance and the highest standards of corporate governance and ethical conduct.
These pillars are detailed on page 18 of this report.
With a proven track record of more than ten years of continual per formance improvement, Investa remains a global leader in sustainabi l i t y.
THIS YEAR’S HIGHLIGHTS
Showcasing Investa’s business activities in FY16.
OUR STRATEGY
Outlining the key pillars of activity delivering customer service, governance, management and performance.
OUR REPORTING
Learn more about Investa’s robust reporting approach, methodology and data assurance.
OUR BUSINESS
About the business approach and structure of Investa Office Management, including community and employee engagement.
OUR PERFORMANCE
Focusing on active management of buildings, continuing to deliver resource efficiency and environmental improvements.
06
18
36
10
30
04 05
IOM 2016 Sustainability Report 04 IOM 2016 Sustainability Report 05OVERVIEW
O V E R V I E W O V E R V I E W| || || || |

Investa uses global benchmarks and consumption intensity metrics to gauge performance, with FY16’s results adding to Investa’s proud history of strong performance, community engagement and global leadership.
Ever mindful of our social corporate responsibility, Investa continues to be committed to actively engaging with, and supporting our communities. Our partnerships enable us to have a greater positive impact across Australia.
FY16 Highl ights
Both Investa Funds were listed as GRESB Green Stars in FY16
56%
REDUCTIONS ON EMISSIONS INTENSITY
ON 2004 LEVELS
of women are in senior management roles
1stFIRST AUSTRALIAN PROPERTY GROUP TO COMMIT TO SETTING A SCIENCE BASED EMISSIONS REDUCTION TARGET
CARBON EMISSIONS INTENSITY (kg.CO₂/sqm/yr)
5 starNSCA SAFETY RATING
IOF again recognised on the CDP Climate Disclosure A List
164149
141128 127
110 105 100 94 87 8474 72
FY 04
FY 05
FY 06
FY 07
FY 08
FY 09
FY 10
FY 11
FY 12
FY 13
FY 14
FY 15
FY 16
total funds donated in FY16
>$159k 39%
staff access flexible work arrangements
70%
4.65 3.77
13,894REDUCTION IN
WATER USE SINCE 2004
TONNES OF CARBON SAVED BY TRI-GEN
SINCE 2011
47%
0.24NABERS STARS
0.08NABERS STARS
06 07
0706IOM 2016 Sustainability Report IOM 2016 Sustainability ReportOVERVIEW
| || || || |

As CEO of Investa, I am proud to look back on FY16 as a year of challenge, growth, and ultimately colossal achievement.
It’s with great pride that we release our FY16 Sustainability Report. As CEO of Investa, I am proud to look back on FY16 as a year of challenge, growth and ultimately colossal achievement. Our accomplishments this year are a clear demonstration of our ambitions to continually reset the benchmark in customer service, performance and leadership in the office market nationally. It’s been a year of significant evolution for us, successfully navigating a new business structure and welcoming a new long term owner. With this new ownership, comes fresh opportunity to grow and thrive as the First Choice in Australian Office.
Our customer centric approach continued to deliver significant outcomes for our tenants, with the INSITE tenant engagement program and portal now embedded in 13 assets nationally. Our continued focus on innovation saw the initial roll out of the SAMBA (Sentient Ambient Monitoring of Buildings in Australia) device in partnership with the University of Sydney. SAMBA data enables us to work with our tenants directly to enhance the comfort of their
employees by improving the indoor environment quality, contributing to enhanced productivity and employee engagement.
Building upon the successes of SAMBA and INSITE, Invesa continues to address our environmental impact and this year, we are thrilled to announce another 3% reduction on our emissions intensity statistic. This takes us to a total 56% reduction since 2004, when as a first mover in the industry, we began recording our data. FY16 was a significant year for action on climate change, with the Paris Agreement1 convening 196 countries to commit to a 2 degree future. In response, Investa developed a bespoke carbon reduction strategy and committed to set, science based targets to achieve our objectives.
Long-term diligence and innovation in environmental management continues to pay financial and environmental dividends for our tenants and investors. At Investa, we pride ourselves on our responsible investment credentials, and once again we’ve delivered outstanding results. Both IOF
and ICPF were again rated Green Stars by the Global Real Estate Sustainability Benchmark (GRESB), and IOF was one of two ASX listed funds to be recognised on CDP’s Climate Leadership A-List.
We have continued to build working partnerships to expand our influence and impact. Our collaboration with partners in the Australian Business Roundtable for Disaster Resilience and Safer Communities continued to advocate to government for cost-effective resilience solutions. Our ongoing partnership with the Sir David Martin Foundation enabled fund raising of $265,000 to assist Triple Care Farm, an award winning residential rehabilitation facility for youth at risk.
I’m incredibly proud of our achievements across the business this year, and am very much looking forward to the evolution of Investa in FY17.
JONATHAN CALLAGHAN CEO INVESTA OFFICE
Investa manages assets worth more than $10 billion on behalf of over 14,000 institutional and retail investors. Investa’s in house management platform ensures a holistic approach to ESG matters, with sustainability permeating all
facets of business performance. This inclusive approach solidifies Investa’s position as one of Australia’s leading commercial real estate companies and a global leader in responsible investment.
EMBEDDING SUSTAINABLE MANAGEMENT Jonathan Cal laghan
REAL ESTATE OPERATIONS (R
EO)
INVESTA’S MANAGEMENT
PLATFORM
REAL ESTATE SERVIC
ES (RES)
Lega
l, IT a
nd
Compli
ance
Finance, Tax
and Treasury
HumanResources
Development
CapitalTransactionsMarketing
Rese
arch
Proj
ects
and
Tech
nica
lSe
rvice
s
Sustainability,
Safety and
Environment
Real Estate ServicesAsset ManagementProperty ManagementFacilities Management
Funds ManagementPortfolio Management
Investor Relations
CORPORATE
FUNDS MANAGEMENT
1 The Paris Agreement is the world’s first globally agreed international treaty committing to reduce carbon emissions, signed under the UN Framework Convention on Climate Change.
08 09
IOM 2016 Sustainability Report 08 IOM 2016 Sustainability Report 09
Letter from the CEO
OVERVIEW
| || || || |

SYDNEY, NSW
17 Assets
444,019.58M2 Total Lettable Area
4.73 Stars Weighted Portfolio Nabers Energy Rating
3.54 Stars Weighted Portfolio Nabers Water Rating
S
S
CANBERRA, ACT
1 Asset
14,155M2 Total Lettable Area
5 Stars Weighted Portfolio Nabers Energy Rating
4.5 Stars Weighted Portfolio Nabers Water Rating
CC
NORTH SYDNEY, NSW
4 Assets
91,452.82M2 Total Lettable Area
4.86 Stars Weighted Portfolio Nabers Energy Rating
3.75 Stars Weighted Portfolio Nabers Water Rating
S
MELBOURNE, VIC
8 Assets
312,550.08M2 Total Lettable Area
Nabers Energy Rating4.03 Stars Weighted Portfolio
3.8 Stars Weighted Portfolio Nabers Water Rating
M
M
PERTH, WA
3 Assets
87,932M2 Total Lettable Area
4.8 Stars Weighted Portfolio Nabers Energy Rating
3.9 Stars Weighted Portfolio Nabers Water Rating
P
P
BRISBANE, QLD
8 Assets
159,332M2 Total Lettable Area
4.82 Stars Weighted Portfolio Nabers Energy Rating
4.07 Stars Weighted Portfolio Nabers Water Rating
B
About Investa Office
OUR BUSINESS
WEIGHTED AVERAGE NABERS ENERGY / WATER
NABERS ENERGYWEIGHTEDAVERAGE
B
QLDWA
NSW
VIC
TAS
ACT
NT
SA
3.77
4.65
NABERS WATERWEIGHTEDAVERAGE
10 11
1110IOM 2016 Sustainability Report IOM 2016 Sustainability Report
| || || || |

As a commercial real estate company, we recognise our impact is broader than our buildings. Year on year, we seek to quantify the social, environmental and financial impact of our operations.
$10.3bAUM
SUSTAINABLE SUPPLY CHAIN
NABERS ENERGY
NABERS WATER
200
TALENTED STAFF
IN CHARITABLE DONATIONS
OPEX & CAPEX INVESTED INTO AUSTRALIAN
ECONOMY
$159k
$365m 4.65
3.77
12 13
12 13IOM 2016 Sustainability Report IOM 2016 Sustainability Report
Our impact
OUR BUSINESS
14,000+
INVESTORS (approx.)
775+
TENANCIES ACROSS 20 INDUSTRIES
| || || || |

Investa continues to promote flexible work arrangements with over two thirds of employees enjoying flexibility – either through formally arranged channels, or informally agreed to with managers at work. Research conducted by the World Green Building Council and the British Council for Offices has found that flexible working helps staff feel more in control of their workload, and engenders trust and loyalty, thus resulting in increased productivity. The comfort of our staff at their place of work is incredibly important to Investa and we will continue to promote these practices to ensure all staff are able to work productively and effectively.
PROFILING OUR PEOPLE
EMPLOYEES ENJOY FLEXIBLE WORK ARRANGEMENTS
70%
TRAVEL TO WORK
<30 mins 30-60 mins <60 mins
32% 39% 29%
3% 25% 67%5%
10.6%
>50% >65%
39%
OVER HALF OUR WORKFORCE ARE PARENTS
2/3 OF OUR WORKFORCE ARE AGED UNDER 44
SENIOR MANAGERS ARE FEMALE
INVESTA TURNOVER
Aust. Property Industry turnover = 13.8%
14 15
75%
51%
30%
19%
of employees take sustainable forms of
transport to and from work
Employees have informal flexible work arrangements
Do not access flexible work arrangements
Employees have formal flexible work arrangements
14 15IOM 2016 Sustainability Report IOM 2016 Sustainability Report
Our people
OUR BUSINESS
| || || || |

Investa employees and our families are fully engaged in volunteering programmes to support our communities across Australia.
A particular focus for Investa is homelessness in our communities, and in FY16 we have sought to partner with organisations such as the Sir David Martin Foundation and the Property Industry Foundation to have a positive impact on the cities in which we work. In addition to our partnerships, our teams select programmes that matter to them, such as Australia’s Biggest Morning Tea, The Salvation Army and Earth Hour. Collectively we raised over $159,000 to support charity programmes in our community. Beyond our own fundraising, we were able to work with our partners to enable over $265,000 of additional donations.
The Red Shield Appeal helps The Salvation Army to assist more than one million people a year, providing food vouchers for families in crisis, education for youths at risk, accommodation for homeless, recovery programs for people battling addictions, emergency services when disasters strike and telephone counselling for people in distress.
Investa directly supported the launch of the Red Shield Appeal in Brisbane. We look forward to supporting the Red Shield Appeal launch again on March 29th 2017.
PIF’s mission is to make a tangible difference to the serious and persistent problem of youth homelessness by partnering with respected charities to build safe environments and support charity managed initiatives focused on education, employment and wellbeing. This year, Investa continued to support several PIF events including the regatta, Property Ball, and National Hard Hat campaign to contribute >$54,000. Investa has directly raised >$300,000 since 2014 for PIF.
Launched in 2007, Earth Hour is now celebrated in over 172 countries and over 7,000 cities and towns worldwide. Investa continues to support Earth Hour to increase awareness around climate change and the need for energy efficiency. Every year we work with our tenants to ‘switch off for good’, not just for one hour to blacken the city. On March 16th, we switched off the lights, and saved 21 tonnes of carbon.
SALVATION ARMY RED SHIELD APPEAL
PROPERTY INDUSTRY FOUNDATION (PIF)
EARTH HOUR
After a successful event in 2014, Investa was proud to again partner with the Sir David Martin Foundation to support the Investa Abseil for Youth fundraiser at 1 Market Street, Sydney. The Sir David Martin Foundation is a non-profit organisation that supports a range of projects assisting young people in overcoming drug and alcohol addictions.
Now in its seventh year, Abseil for Youth has raised over $1.7 million in funding to run the Triple Care Farm, a holistic treatment center for youths affected by drug abuse and mental illness.
This year, our event enabled the foundation to raise more than $265,000. Triple Care Farm not only helps the young people, but also their families, friends and broader communities.
Click here to find out more about the Sir David Martin Triple Care Farm and here to watch highlights from the 2015 event.
ABSEIL FOR YOUTH
Our community
$159k
$1.7m
21tonnes
total funds raised in FY16
RAISED TO DATE
OF CARBON SAVED IN ONE HOUR IN 2016
$265kTOTAL RAISED IN FY15
134VOLUNTEER HOURS
$100kRAISED BY STAFF IN 2015
16 17
16 17IOM 2016 Sustainability Report IOM 2016 Sustainability ReportOUR BUSINESS
| || || || |
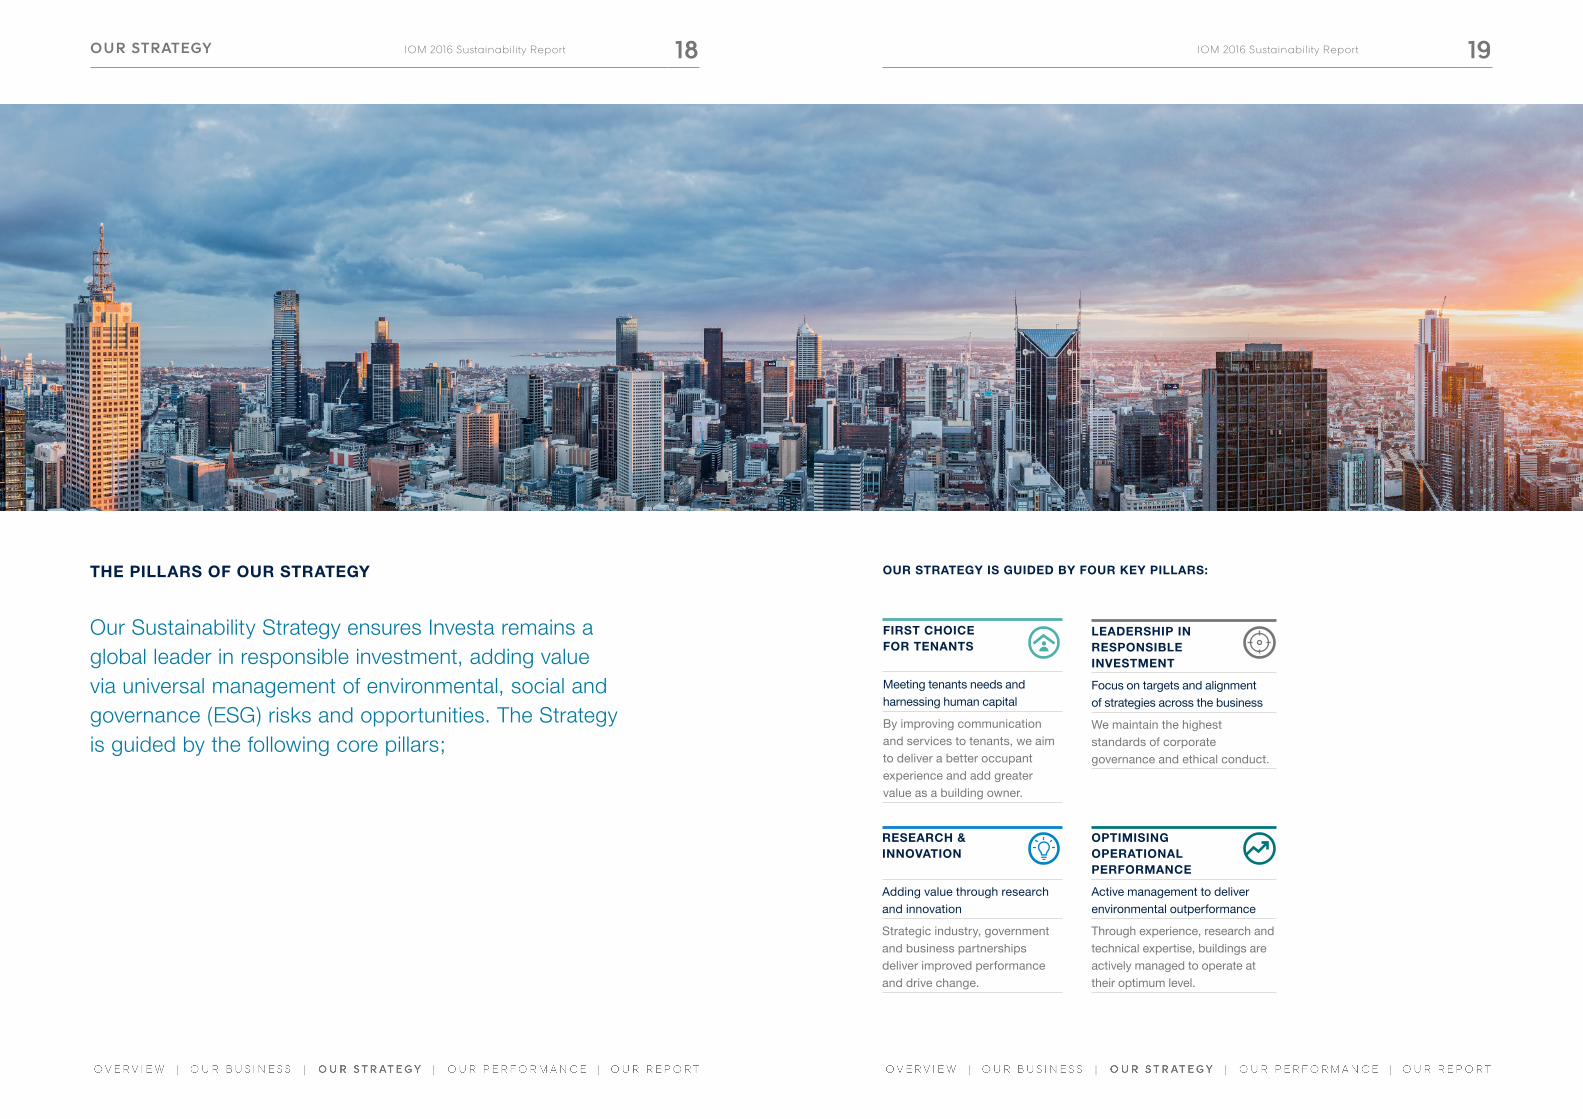
THE PILLARS OF OUR STRATEGY
LEADERSHIP IN RESPONSIBLE INVESTMENT
Focus on targets and alignment of strategies across the business
We maintain the highest standards of corporate governance and ethical conduct.
FIRST CHOICE FOR TENANTS
Meeting tenants needs and harnessing human capital
By improving communication and services to tenants, we aim to deliver a better occupant experience and add greater value as a building owner.
OPTIMISING OPERATIONAL PERFORMANCE
Active management to deliver environmental outperformance
Through experience, research and technical expertise, buildings are actively managed to operate at their optimum level.
Our Sustainability Strategy ensures Investa remains a global leader in responsible investment, adding value via universal management of environmental, social and governance (ESG) risks and opportunities. The Strategy is guided by the following core pillars;
OUR STRATEGY IS GUIDED BY FOUR KEY PILLARS:
RESEARCH & INNOVATION
Adding value through research and innovation
Strategic industry, government and business partnerships deliver improved performance and drive change.
18 19
18 19IOM 2016 Sustainability Report IOM 2016 Sustainability ReportOUR STRATEGY
| || || || |

35+
13 101 TRIFR: Total Recordable Injury Frequency Rate is calculated as the number of Recordable Injuries^ per million hours of work undertaken. ^ Recordable Injury: A Recordable Injury is any injury requiring medical treatment (other than medical observation), and any injuries requiring alternative duties to be provided to allow a worker to return to work. This statistic includes injuries sustained by staff, workers (including contractors), building occupants or the public visiting our buildings.
2 LTIFR: Lost Time Injury Frequency Rate is calculated as the number of injuries resulting in a worker not being able to return to work the day following the incident.
First choice for tenants
INSITE provides tenants exclusive access to a range of services, events, news, information and offers online. Launched nationally in 2015 as part of Investa’s customer centric focus, the program enhances the building’s occupant and tenant experience, creating a greater sense of community by providing opportunities for occupants to interact with one another and with Investa’s Real Estate Service Teams.
INSITE promotes active forms of transport for tenants commuting to and from the CBD. Tenants are
provided with information on healthy living, transport maps and tours of the on-site end of trip facilities that can be used by cyclists and active building users.
Underpinned by an integrated tenant service portal and onsite concierge service, tenants can use INSITE to access a range of time saving services such as dry cleaning, catering, airport transfers, meeting rooms and more. Tenants can also co- ordinate groups and meet-ups and access building news, performance data and exclusive offers and promotions.
INSITE IN ACTION
KEY STATS
1,668SERVICES ORDERED TO DATE
EVENTS HELD NATIONALLY
SERVICES AVAILABLE VIA INSITE
INVESTA BUILDINGSNATIONALLY
TRIFR of 4.7
LTIFR of 1.4COMPARED TO 0 IN FY15
COMPARED TO 4.1 IN FY15
KEY STATS
20 21
Investa Office’s safety platform underwent further review through FY16. Improvements to our system included certification of the Investa Safety Health and Environment Management System for the operation of commercial office buildings, as compliant to AS/NZS 4801:2001 Occupational Health and Safety Management Systems.
All staff participated in the formal safety awareness training program and Investa Office’s audit compliance score against the National Safety Council of Australia (NSCA) 5 Star criteria; remains a
5 Star Rating with our compliance score increasing from 97.9% to 98.1%.
During FY16 over 1.47 million hours of work were undertaken by staff and contractors across buildings managed by Investa. During this period there were 155 incidents reported, seven of which resulted in medical treatment (TRIFR1 of 4.7 compared to 4.1 in FY15). There were two incidents which resulted in lost time (LTIFR2 of 1.4).
WORKPLACE HEALTH & SAFETY
98.1%
NSCA compliance score up from 97.9%
in FY15
UP FROM 97.9% IN FY15
20 21IOM 2016 Sustainability Report IOM 2016 Sustainability ReportOUR STRATEGY
| || || || |
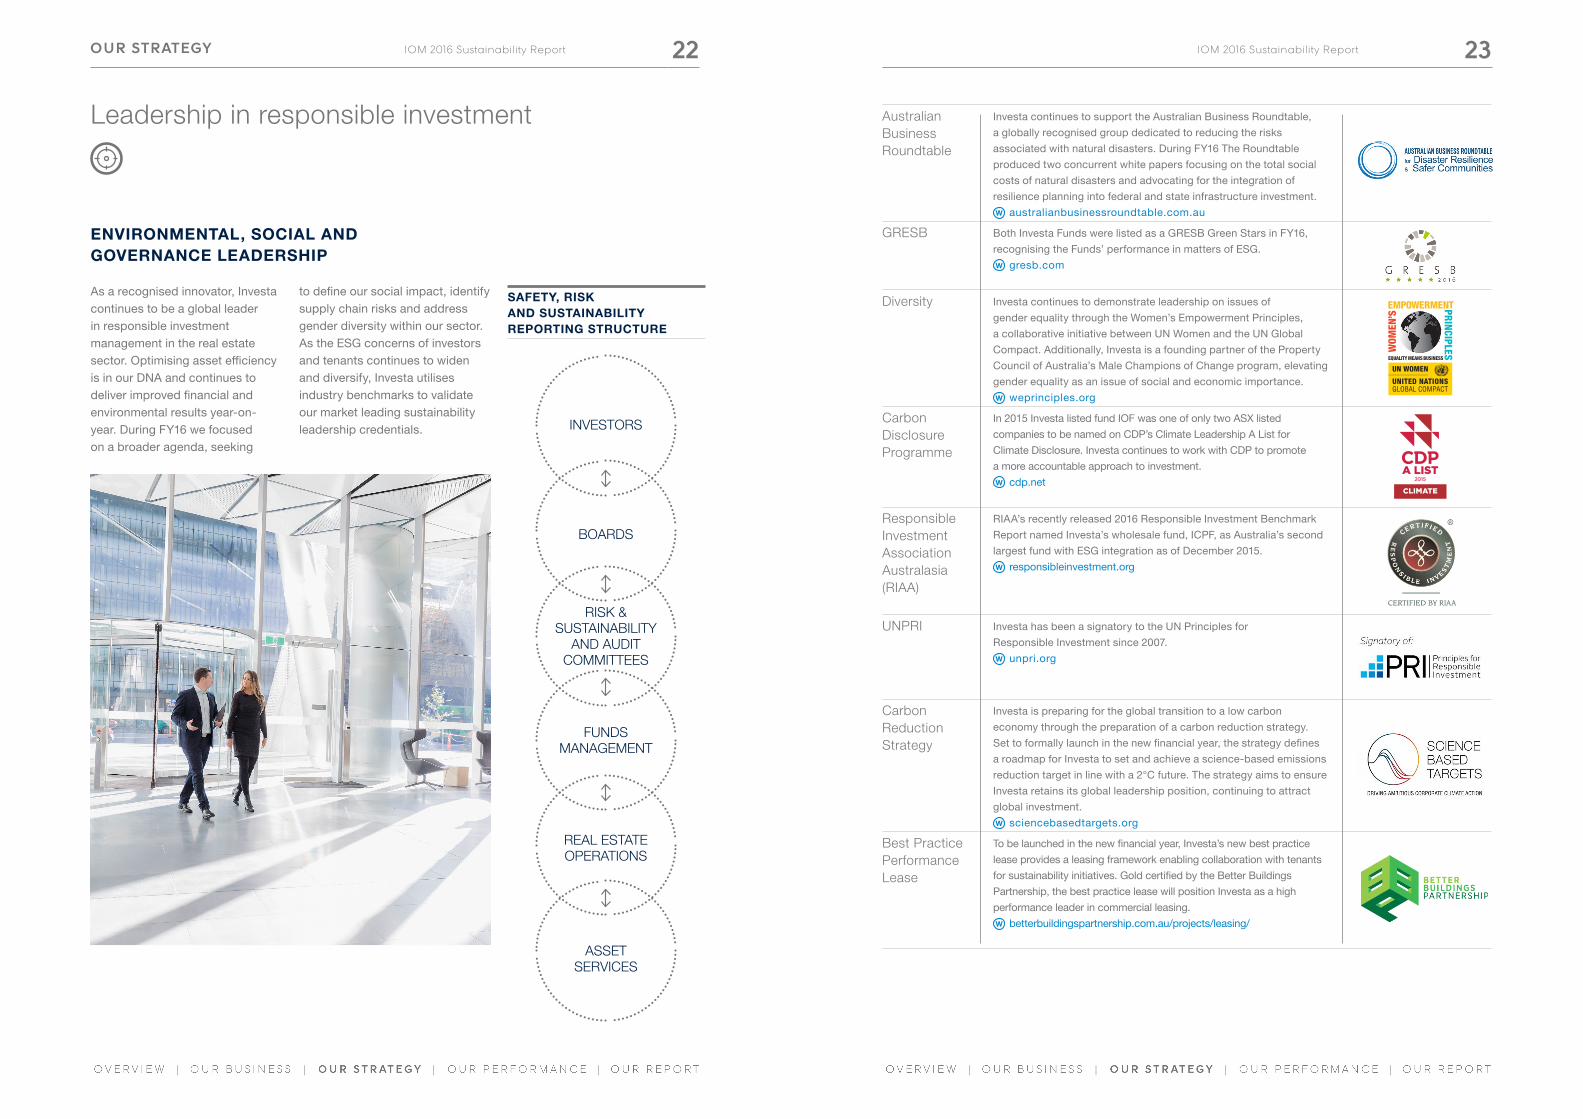
As a recognised innovator, Investa continues to be a global leader in responsible investment management in the real estate sector. Optimising asset efficiency is in our DNA and continues to deliver improved financial and environmental results year-on- year. During FY16 we focused on a broader agenda, seeking
to define our social impact, identify supply chain risks and address gender diversity within our sector. As the ESG concerns of investors and tenants continues to widen and diversify, Investa utilises industry benchmarks to validate our market leading sustainability leadership credentials.
Leadership in responsible investment
ENVIRONMENTAL, SOCIAL AND GOVERNANCE LEADERSHIP
Australian Business Roundtable
Investa continues to support the Australian Business Roundtable, a globally recognised group dedicated to reducing the risks associated with natural disasters. During FY16 The Roundtable produced two concurrent white papers focusing on the total social costs of natural disasters and advocating for the integration of resilience planning into federal and state infrastructure investment. W australianbusinessroundtable.com.au
GRESB Both Investa Funds were listed as a GRESB Green Stars in FY16, recognising the Funds’ performance in matters of ESG. W gresb.com
Diversity Investa continues to demonstrate leadership on issues of gender equality through the Women’s Empowerment Principles, a collaborative initiative between UN Women and the UN Global Compact. Additionally, Investa is a founding partner of the Property Council of Australia’s Male Champions of Change program, elevating gender equality as an issue of social and economic importance. W weprinciples.org
Carbon Disclosure Programme
In 2015 Investa listed fund IOF was one of only two ASX listed companies to be named on CDP’s Climate Leadership A List for Climate Disclosure. Investa continues to work with CDP to promote a more accountable approach to investment.W cdp.net
Responsible Investment Association Australasia (RIAA)
RIAA’s recently released 2016 Responsible Investment Benchmark Report named Investa’s wholesale fund, ICPF, as Australia’s second largest fund with ESG integration as of December 2015.W responsibleinvestment.org
UNPRI Investa has been a signatory to the UN Principles forResponsible Investment since 2007.W unpri.org
Carbon Reduction Strategy
Investa is preparing for the global transition to a low carbon economy through the preparation of a carbon reduction strategy. Set to formally launch in the new financial year, the strategy defines a roadmap for Investa to set and achieve a science-based emissions reduction target in line with a 2°C future. The strategy aims to ensure Investa retains its global leadership position, continuing to attract global investment.W sciencebasedtargets.org
Best Practice Performance Lease
To be launched in the new financial year, Investa’s new best practice lease provides a leasing framework enabling collaboration with tenants for sustainability initiatives. Gold certified by the Better Buildings Partnership, the best practice lease will position Investa as a high performance leader in commercial leasing.W betterbuildingspartnership.com.au/projects/leasing/
2015
INVESTORS
BOARDS
RISK & SUSTAINABILITY
AND AUDIT COMMITTEES
FUNDS MANAGEMENT
ASSET SERVICES
REAL ESTATE OPERATIONS
SAFETY, RISK AND SUSTAINABILITY REPORTING STRUCTURE
22 23
22 23IOM 2016 Sustainability Report IOM 2016 Sustainability ReportOUR STRATEGY
| || || || |

2015 represented a landmark moment in the global response to climate change, with 196 Nations gathering in Paris to negotiate the world’s first global agreement committing to curb carbon emissions. With the largest gathering of Heads of State since the conclusion of the Second World War, Parties committed to limit global warming to a maximum of 2°C above pre-industrial levels, pursuing efforts to limit the temperature increase to 1.5°C.
Investa Sustainability Coordinator, Ian Lieblich attended the Conference where the business community, and in particular those representing the built environment, had a strong presence. The Conference was the first of its kind to hold a Buildings Day, a day dedicated to the impact the built environment can have on reducing global emissions.
The business community has begun to shift towards low carbon investment, headlined by collaborations such as the Breakthrough Energy Coalition and Green Infrastructure Investment Coalition, featuring some of the world’s wealthiest entrepreneurs and financial institutions, committing to financing low carbon activities.
Investa is determined to going above and beyond existing expectations, committing to setting a Science Based Emissions Reduction Target in line with the climate science needed to achieve a 2°C future.
The notion that the global economy is at loggerheads with the environment has been firmly dismissed by the Paris Agreement. Considering Investa’s proud history having already reduced carbon emissions intensity by 56% since 2004, we are excited about this transition to a low-carbon economy and look forward to our continued leadership in the ESG space.
THE PARIS AGREEMENT
196
2°C
COUNTRIES
Commit to the ParisAgreement
with reference to 1.5°C
KEY STATS
Leadership and innovation
24 25
25IOM 2016 Sustainability Report24IOM 2016 Sustainability ReportOUR STRATEGY
| || || || |

This year Investa commenced a programme to define a carbon reduction strategy. Spurred by the impact of COP21, Investa sought to produce an appropriate response, ensuring we remain a sector leader and an attractive global investment option in a low carbon economy.
Simultaneously, the Australian Sustainable Built Environment Council facilitated an industry wide research piece1 on the capability of the property industry to meet the requirements of the Paris agreements. Concluding that the entire Australian property industry is capable of achieving a carbon neutral position by 2050, the report provided Investa with a level of confidence in setting a carbon reduction strategy.
Investa is broadly recognised for clear and transparent reporting, and consistently delivered results. Our proven track record of a 57% emissions intensity reduction on 2004 levels demonstrates a long term commitment to efficiency and reducing our impact. This identifiable characteristic led the team to seek a scientific framework to set carbon reduction targets.
Science Based Carbon Reduction Targets2 are a framework supported by the Carbon Disclosure Project, UN Global Compact, WWF and the World Resources Institute. Targets adopted by companies to reduce CO2 emissions are considered “science-based” if they are in line with the level of decarbonisation
required to keep global temperature increases below 2°C compared to pre-industrial temperatures.
Science Based Targets offer several frameworks to model an organisation’s pathway. Investa has committed to set, and is currently working through the framework to define authentic science based targets, supported by a work plan of carbon reduction programmes. To achieve our targets, we intend to focus on operational efficiency, building materiality, energy production and energy procurement.
Investa continues to work with The University of Sydney’s Indoor Environmental Quality Lab to develop ground-breaking new technology that will track indoor climate within Australian workplaces. Built on revolutionary sensor technology, The University of Sydney’s SAMBA (Sentient Ambient Monitoring of Buildings in Australia) device was developed to capture a range of parameters including air temperature, radiant
heat, air movement, humidity, light, sound, carbon dioxide, carbon monoxide, along with various pollutants emitted from building materials, such as volatile organic compounds.
Investa’s cornerstone research partnership is currently being trialled in one building in Sydney, and will be rolled out as more units become available.
Since 2012, the Australian Business Roundtable for Disaster Resilience and Safer Communities has generated research to advocating to government for the prioritisation of mitigation expenditure in Australia, to further the national interest and achieve an improved economic return.
During FY16 the Roundtable produced two concurrent white papers focusing on the total social
costs of natural disaster and advocating for the integration of resilience planning into federal and state infrastructure investment.
The Roundtable was acknowledged with a Certificate of Distinction in the prestigious 2015 United Nations Sasakawa Awards for Risk Reduction in Japan in March 2015, the first private sector group to do so in the 29 year history of the awards.
W australianbusinessroundtable.com.au
CARBON STRATEGY SAMBA RESEARCH PARTNERSHIP
AUSTRALIAN BUSINESS ROUNDTABLE FOR DISASTER RESILIENCE AND SAFER COMMUNITIES
Leadership and innovation
1 Low Carbon, High Performance, 2016, Australian Sustainable Built Environment Council, http://www.asbec.asn.au/publications/ 2 Science Based Targets; http://sciencebasedtargets.org/ 3 Fifth Assessment Report (AR5), IPCC 2014; https://www.ipcc.ch/report/ar5/
COO Jason Leong, (far left), representing Investa at Parliament House on behalf of the Australian Business Roundtable. From left, Jason Leong, Investa, Peter Harmer, IAG, Peter Hanlon, Westpac, Noel Clement, Australian Red Cross, Paul O’Sullivan, Chairman Optus, Heinrich Eder, Muniche RE.
26 27
26 27IOM 2016 Sustainability Report IOM 2016 Sustainability ReportOUR STRATEGY
| || || || |
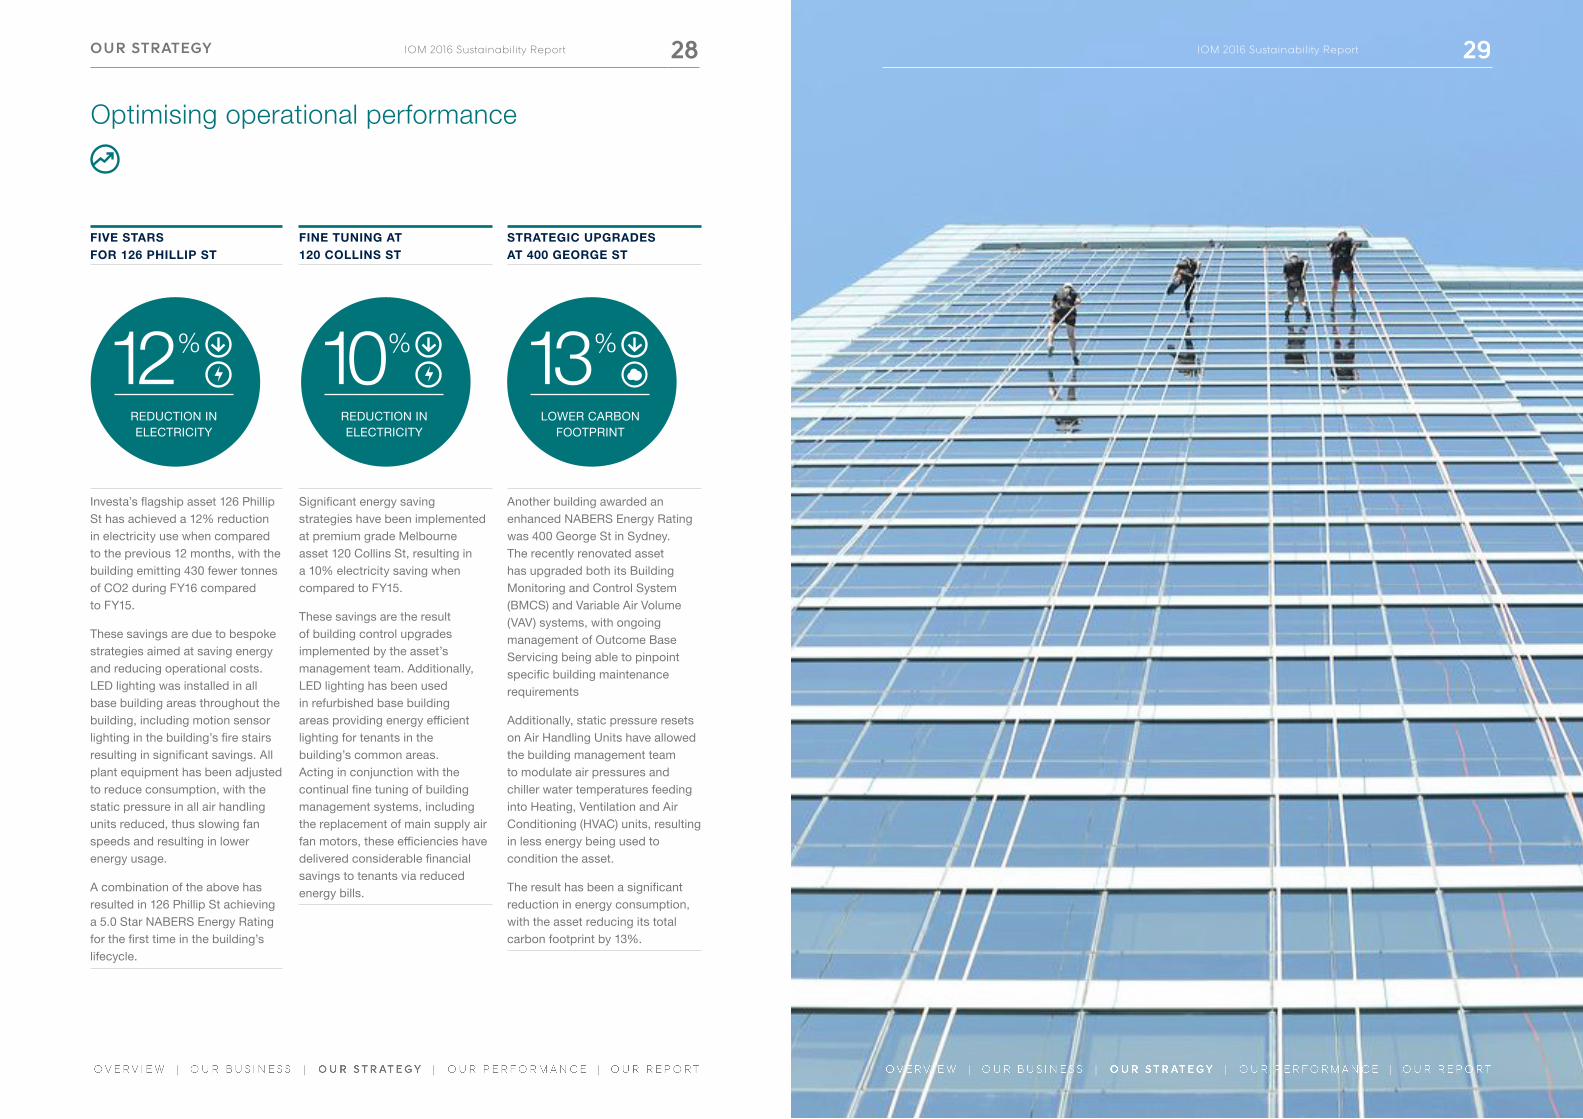
Optimising operational performance
FINE TUNING AT 120 COLLINS ST
Significant energy saving strategies have been implemented at premium grade Melbourne asset 120 Collins St, resulting in a 10% electricity saving when compared to FY15.
These savings are the result of building control upgrades implemented by the asset’s management team. Additionally, LED lighting has been used in refurbished base building areas providing energy efficient lighting for tenants in the building’s common areas. Acting in conjunction with the continual fine tuning of building management systems, including the replacement of main supply air fan motors, these efficiencies have delivered considerable financial savings to tenants via reduced energy bills.
FIVE STARS FOR 126 PHILLIP ST
Investa’s flagship asset 126 Phillip St has achieved a 12% reduction in electricity use when compared to the previous 12 months, with the building emitting 430 fewer tonnes of CO2 during FY16 compared to FY15.
These savings are due to bespoke strategies aimed at saving energy and reducing operational costs. LED lighting was installed in all base building areas throughout the building, including motion sensor lighting in the building’s fire stairs resulting in significant savings. All plant equipment has been adjusted to reduce consumption, with the static pressure in all air handling units reduced, thus slowing fan speeds and resulting in lower energy usage.
A combination of the above has resulted in 126 Phillip St achieving a 5.0 Star NABERS Energy Rating for the first time in the building’s lifecycle.
STRATEGIC UPGRADES AT 400 GEORGE ST
Another building awarded an enhanced NABERS Energy Rating was 400 George St in Sydney. The recently renovated asset has upgraded both its Building Monitoring and Control System (BMCS) and Variable Air Volume (VAV) systems, with ongoing management of Outcome Base Servicing being able to pinpoint specific building maintenance requirements
Additionally, static pressure resets on Air Handling Units have allowed the building management team to modulate air pressures and chiller water temperatures feeding into Heating, Ventilation and Air Conditioning (HVAC) units, resulting in less energy being used to condition the asset.
The result has been a significant reduction in energy consumption, with the asset reducing its total carbon footprint by 13%.
12%
REDUCTION IN ELECTRICITY
10%
REDUCTION IN ELECTRICITY
13%
LOWER CARBON FOOTPRINT
28 29
29IOM 2016 Sustainability Report28IOM 2016 Sustainability ReportOUR STRATEGY
| || || || |

OUR PERFORMANCE
Investa’s intensity metrics represent the electricity, gas, water and carbon emissions efficiency of buildings owned or managed by Investa Office. They are calculated as units per square metre of net lettable building floor area allowing for like-for-like comparison between years.
NABERS RATINGS
NABERS is a national rating system measuring the energy efficiency and water use of Australian buildings and their impact on the environment.
Conducted by independent government auditors, assets are rated on a six star scale, with 1 star representing poor performance, 3, average performance and 6 stars being market leading.
Reporting rules are provided online at W investa.com.au/sustainability/results/2015-sustainability-report
CY04 CY12 FY13 FY14 FY15 FY16ELECTRICITY
Buildings in program with continuous statistics 23 32 34 32 39 29Floor area (NLA) of buildings with continuous statistics 463,150 731,832 868,113 844,997 1,019,786 816,670
Metred electricity consumption (MWh) 62,746 68,941 77,516 72,932 80,912 62,681Consumption intensity (kWh/sqm/yr) 135 94 89 86 79 77
CY04 CY12 FY13 FY14 FY15 FY16GAS
Buildings in programme with continuous statistics 22 23 26 25 28 21Floor area (NLA) of buildings with continuous statistics 615,511 618,423 697,262 681,202 762,149 591,083
Metred gas consumption (GJ) 85,253 44,003 50,586 50,244 50,611 50,808Consumption intensity (MJ/sqm/yr) 139 71 73 74 66 86
CY04 CY12 FY13 FY14 FY15 FY16WATER
Buildings in program with continuous statistics 37 33 34 32 39 29Floor area (NLA) of buildings with continuous statistics 801,143 738,591 868,113 844,997 1,019,786 816,670
Metred water consumption (kL) 928,635 484,043 597,986 550,420 652,117 501,931Consumption intensity (L/sqm/yr) 1,159 689 651 650 639 615
CO2 EMISSIONS CY04 CY12 FY13 FY14 FY15 FY16
Carbon emissions intensity (kg.CO2/sqm/yr) 164 87 84 81 74 72
3%
Carbon emissions intensity reduction on FY15 baseline
5%
Water intensity reduction on FY15 baseline
43%
38%
Electricity intensity reduction on FY04 baseline
Gas intensity reduction on FY04 baseline
Weighted National Average CY04 CY12 FY13 FY14 FY15 FY16
NABERS RATINGS
NABERS Energy Rating 2.6 4.22 4.32 4.28 4.41 4.65
NABERS Water Rating 3 3.49 3.67 3.60 3.69 3.77
10 assets
improved their NABERS Energy Ratings
9 assets
improved their NABERS Water Ratings
30 31
30 31IOM 2016 Sustainability Report IOM 2016 Sustainability ReportOUR PERFORMANCE
Operational performance
| || || || |

WASTE & RECYCLING
Investa reports waste stemming from both the day-to-day general operations of tenancies (Office Operational Waste) and waste resulting from refurbishments, tenancy interior fit-outs and other projects (Construction and Demolition Waste).
Investa is working to reduce the amount of waste going to landfill alongside the City of Sydney’s Better Building Partnership’s Waste Technical Working Group.
TO BE DESIGNED
OFFICE OPERATIONAL WASTE
FY15 FY16
Tonnes % Tonnes %Waste to Landfill 2,869 53% 3907.5 57%
Waste Recycled 2,544 47% 2939.7 43%
Food Waste 81 1% 66.78 1%
Paper and Cardboard 1,372 25% 1577.1 23%
Other Recycling 1091 20% 1295.7 19%
Total Waste 5,413 100% 6847.2 100%
CONSTRUCTION AND DEMOLITION WASTE
FY15 FY16
Tonnes % Tonnes %Waste to Landfill 19 6% 521.58 13%
Waste Recycled 279 94% 3482.2 87%
Total Waste 298 100% 4003.8 100%
32 33
32IOM 2016 Sustainability Report 33Investa Office Sustainability Report FY16OUR PERFORMANCE
|| || || ||

FY14 FY15 FY16 REDUCTIONEMISSIONS (T.CO2)
ICPF 20,352 20,978 18,559 2,419
IOF 23,544 26,855 19,960 6,895
Other Mandates 25,875 21,036 19,977 1,059
Total 69,771 68,869 58,496 10,373
FY14 FY15 FY16 REDUCTIONWATER (KL)
ICPF 146,267 165,990 151,967 14,023
IOF 218,454 239,550 185,630 53,920
Other Mandates 251,916 174,832 164,337 10,495
Total 616,637 580,372 501,934 78,438
FY15 FY16ICPF
Natural Gas 739.18 4.28% 825.58 4.45%
Electricity 16076.82 93.05% 17244.05 92.92%
Trigeneration 462.00 2.67% 489.16 2.64%
Total 17278.00 100% 18558.80 100%
FY15 FY16IOF
Natural Gas 803.39 3.71% 737.25 3.69%
Electricity 20505.14 94.67% 18,689.79 93.64%
Trigeneration 351.31 1.62% 532.68 2.67%
Total 21659.84 100% 19959.72 100%
FY15 FY16OTHER MANDATES
Natural Gas 1055.33 3.33% 1048.19 5.25%
Electricity 30075.64 94.82% 18156.11 90.88%
Trigeneration 587.81 1.85% 773.01 3.87%
Total 31718.78 100% 19977.32 100%
FOOTPRINT
EMISSIONS BY RESOURCE
Environmental footprint
KEY:
C: Not reported as management control of the building is assigned to the tenant under the terms of the lease
D: Gas is not used at this site
E: Excludes assets not owned/managed for the duration of the reporting period, including buildings under construction
H: Not reported as externally managed and outside of operational control
AUSTRALIAN PORTFOLIO ENVIRONMENTAL PERFORMANCE STATISTICSIn addition to recording intensity
statistics, Investa supplies footprint data, representing the total environmental footprint of the assets under management. The total emissions of the group have then been broken down into resource use, allowing tenants and investors to better gauge the source of the carbon emissions resulting from Investa’s portfolios.
EL
EC
TR
ICIT
Y
(kW
h/s
qm
)
GA
S
(MJ
/sq
m)
EM
ISS
ION
S(k
g.C
O2₂-
e/s
qm
)
WA
TE
R
(L/s
qm
)
NA
BE
RS
E
NE
RG
Y
(Sta
rs)
NA
BE
RS
W
AT
ER
(S
tars
)
BUILDING
295 Ann St & 232 Adelaide St, Brisbane 67.0 D 53.4 579.3 5.0 4.5
10-20 Bond St, Sydney H H H H 5.5 4.0
628 Bourke St, Melbourne 56.4 84.0 68.7 431.8 4.5 4.0
737 Bourke St, Melbourne 43.1 95.3 54.1 426.4 4.5 3.5
20 Bridge St, Sydney 91.6 16.5 78.4 972.3 4.0 2.0
133 Castlereagh St, Sydney 104.1 16.8 77.2 413.8 5.0 4.5
151 Clarence St, Sydney E E E E E E
567 Collins St, Melbourne E E E E E E
120 Collins St, Melbourne 81.9 148.2 101.5 442.5 3.0 3.0
595 Collins St, Melbourne 54.0 153.8 69.6 620.7 4.5 3.0
140 Creek St, Brisbane 67.0 D 53.4 579.3 4.5 3.5
231 Elizabeth St, Sydney 104.7 100.9 93.9 679.2 5.0 4.0
242 Exhibition St, Melbourne 86.3 95.3 103.7 374.6 4.0 4.5
239 George St & 15 Adelaide St, Brisbane 79.1 D 63.0 649.7 4.5 4.0
388 George St, Sydney H H H H 4.5 4.0
400 George St, Sydney 96.2 35.5 84.6 651.2 4.5 4.0
420 George St, Sydney E E E E 5.0 3.5
201 Kent St, Sydney 69.4 51.0 61.4 788.5 5.0 3.0
347 Kent St, Sydney 98.1 D 83.1 1,102.8 4.0 3.0
135 King St, Sydney 83.4 77.4 74.7 710.1 4.5 3.5
383 La Trobe St, Melbourne C C C C C C
1 Market St, Sydney 84.9 91.0 76.6 706.3 4.5 3.5
60 Martin Place, Sydney E E E E E E
40 McDougall St, Milton 86.1 D 68.6 419.5 3.5 4.5
105-151 Miller St, North Sydney 72.2 91.8 65.9 757.4 5.0 3.5
16-18 Mort St, Canberra 47.5 168.6 48.9 394.5 5.0 4.5
40 Mount St, North Sydney 56.2 48.6 40.9 540.6 5.5 4.0
6 O’Connell St, Sydney 69.2 103.0 63.9 661.4 4.5 4.0
111 Pacific Hwy, North Sydney 79.9 173.6 76.6 566.1 4.0 3.5
126 Phillip St, Sydney 81.0 67.1 65.6 990.7 5.0 3.0
130 Pitt St, Sydney 71.2 D 60.3 629.9 5.0 3.5
222 Pitt St, Sydney 63.9 50.0 56.7 589.0 5.0 4.0
259 Queen St, Brisbane 65.2 D 52.0 491.4 5.0 4.0
66 St Georges Tce, Perth 61.7 16.8 47.7 469.0 3.5 3.0
250 St Georges Tce, Perth H H H H 5.0 4.0
800 Toorak Rd, Melbourne C C C C C C
179 Turbot St, Brisbane 64.2 D 51.2 652.5 5.5 4.0
99 Walker St, North Sydney 82.6 D 70.1 580.2 4.5 4.0
836 Wellington St, West Perth 47.3 14.6 36.7 471.7 5.5 4.5
TOTAL 77 86 72 615 4.65 3.77
34 35
34 35IOM 2016 Sustainability Report IOM 2016 Sustainability ReportOUR PERFORMANCE
| || || || |

WHY WE REPORT
Investa Office publically reports against a range of financial, social, governance and environmental metrics and approaches that broadly address noted global emerging trends or are of material interest to our investors, customers, partners, stakeholders and employees. Investa regularly undertakes stakeholder engagement surveys to refine the business and reporting approach, surveying customers and occupants, influences, potential customers and external influencers, in addition to employees of the business. Investa has a long track record of transparency and prides itself on allowing interested parties to access full data sets in order to draw their own conclusions about company performance.
FY16 REPORT FRAMEWORK
The information and corresponding time period presented in this report is for the Australian financial year 2016 (FY16). A 12 month period of business activities is covered – 1st July 2015 to 30th June 2016. To allow for timely collection of billing data from utilities, the periods for reporting environmental performance data are FY16: 1st April 2015 – 31st March 2016.
Methodology and approach
36 37
37IOM 2016 Sustainability Report36IOM 2016 Sustainability ReportOUR REPORTING
| | | | | | | |

TERM MEANING
AUM Assets Under Management.CBD Central Business District refers to the business and financial area of an
Australian state capital city.Investa Property Group (“The Group”)
Investa Property Group (The Group) is one of Australia’s largest unlisted owners and managers of quality real estate controlling assets worth more than $10.3 billion AUM across the commercial, industrial and residential sectors.
Investa Office (“Investa”)
Investa Office (Investa) is one of Australia’s largest owners and managers and provides an integrated property platform incorporating property services, funds, portfolio and asset management, development and sustainability.
IOF Investa Office Fund, which comprises of the AJO Fund and the PCP Trust, is an ASX-listed Real Estate Investment Trust which is included in the S&P/ASX 100 index.
ICPF Investa Commercial Property Fund is a core prime unlisted office fund for institutional investors, concentrating on premium grade office assets in major Australian CBD markets.
NABERS National Australian Built Environment Ratings System, is a national rating system that measures the environmental performance of Australian buildings, tenancies, homes, shopping centres and hotels.
NLA Net Lettable Area.sqm Square metres (m²).tCO2-e Tonnes of carbon dioxide equivalent is a distinct measure for describing
how much global warming a given type and amount of greenhouse gas may cause, using the functionally equivalent amount or concentration of carbon dioxide (CO2-e) as the reference.
MANAGEMENT STATEMENT
Investa has been publishing sustainability reports since 2003 as a way of communicating our sustainability performance to our stakeholders. The focus of our performance measures continues to be our environmental metrics, and all 13 of our previous reports are available to stakeholders at W investa.com.au/sustainability/results/2016-sustainability-report
The environmental data has been prepared in accordance with our Reporting Rules for both Volume and Intensity, which are available at W investa.com.au/sustainability/results/2016-sustainability-report
INDEPENDENT ASSURANCE
Investa Office Management Pty Ltd, on behalf of Investa Office, has engaged KPMG to provide limited assurance on selected performance data for the year ended 31 March 2016. KPMG has provided assurance on the following consolidated data;
• Electricity consumption intensity (kWh/sqm);• Gas consumption intensity (MJ/sqm);• Carbon emissions intensity (emissions from electricity and gas use)
(kg.CO2-e/sqm);• Water consumption intensity (L/sqm); and• Net Lettable Area, the floor area of buildings in the dataset.
KPMG’s engagement is consistent with the scope of work performed in prior periods and has been conducted in accordance with the Australian Standard on Assurance Engagements ASAE 3000 and ASAE 3410. KPMG’s assurance statement, including the selected performance data and the relevant reporting criteria, can be found online: W investa.com.au/sustainability/results/2016-sustainability-report
Independant assurance Glossary
38 39
38 39IOM 2016 Sustainability Report IOM 2016 Sustainability ReportOUR REPORTING
| | | | | | | |

If you have any questions about this report or would like further information about Investa Office, go to [email protected]
W investa.com.au/2016-sustainability-report
Investa Office Management Pty Ltd Level 6, Deutsche Bank Place 126 Phillip Street Sydney NSW 2000
T +61 2 8226 9300 F +61 2 9844 9300
Contact details
40 41
41IOM 2016 Sustainability Report40IOM 2016 Sustainability ReportOUR REPORTING
| | | | | | | |