Inventory Management for the Reduction of Material ... · PDF fileInventory Management for the...
6
Inventory Management for the Reduction of Material Shortage Problem for Pasteurized Sugarcane Juice: The Case of a Beverage Company Roongrat Pisuchpen Faculty of Engineering, Industrial Engineering, Kasetsart University, Bangkok, Thailand Email: [email protected] Papatsaraporn Rienthong Faculty of Engineering, Engineering Management Program, Kasetsart University, Bangkok, Thailand Email: [email protected] Abstract—This research is intended to study the techniques of forecasting seasonal customers’ needs of sugar cane juice by using time series analysis. The results of the forecast are the quantities of overall sales of the 12 months from January 2016 to December 2016, calculated to seek for seasonal sugarcane juice and related trends by concerning the limits of manufacturing capacity, costs, and related services to save costs and generate profits. The calculation for the incurring expenditures from the process of ordering raw materials and improper inventory management is done by using Linear Programming. The study seeks the lowest total cost of 5,707,362 THB. When comparing the new results with the old system, 428,381.20 THB/year will be saved in terms of freezing storage . Index Terms—forecasting, inventory management, linear programming I. INTRODUCTION Nowadays, the economy is in a recession and unstable stage due to external factors, which inhibit small, medium and large industries from developing and improving the quality of their products and services. However, if the industries are only thinking of quality competition, they will not be able to maintain their current business. Therefore, it is essential they consider other factors altogether such as product price, and punctual and quick shipping of their goods. Additionally, they need to manufacture products that meet customer’s needs and expectations while managing costs in order to maximize profits. They also need to increase sales, reduce costs and improve product quality and punctual delivery of products due to the fact that it is difficult to increase sales under the current economic recession. The Beverage Company is the one processing seasonal agricultural products. Oversupply or undersupply of raw materials can affect the profits. As a result, inventory Manuscript received March 28, 2017; revised June 24, 2017. management is necessary to produce the amount of goods necessary to be able to supply the market throughout the year while incurring the lowest storage cost. Currently, the company is aiming for inventory storage of 1,000 CC. pasteurized sugar cane juice because of the sales and its physical characteristics of long storage period. Generally, pasteurized sugar cane juice can be kept for 20 days under the temperature of 4°C or for 1 year under -18°C. Nevertheless, the cost for the storage has increased every year to meet the demand of the goods. The management of frozen goods is not yet optimized, resulting in high cost of purchasing raw materials during the period from July to October. To solve the inventory problem, the forecast is a tool that can help improve the management of raw materials. Linear Program is applied to determine an adequate stock of processed goods in order to fulfill sales throughout the year under the constraint of a daily product. The Purposes of the research are as follows: 1. To forecast customer demand by using the time series analysis for the optimized sales of pasteurized sugar cane juice. 2. To calculate the inventory storage to meet customers’ demand to yield the lowest cost of production. 3. To find the most proper procedures to order raw materials and proper management of inventory storage by using Linear Program under constraints the seasonal demand. II. LITERATURE REVIEW Donselaar et al. [1] show the difference between quick and slow perishable goods in order to understand some important parameters. The difference between those goods is product lifetime; easily perishable goods have shorter lifetime. Easily perishable goods have 30 day lifetime, which depends on sales, and logistics of the goods in different terms such as average weekly sales, the coefficient of deviation of weekly sale, the frequency of International Journal of Life Sciences Biotechnology and Pharma Research Vol. 6, No. 1, June 2017 1 ©2017 Int. J. Life Sci. Biotech. Pharm. Res. doi: 10.18178/ijlbpr.6.1.1-6
Transcript of Inventory Management for the Reduction of Material ... · PDF fileInventory Management for the...

Inventory Management for the Reduction of
Material Shortage Problem for Pasteurized
Sugarcane Juice: The Case of a Beverage
Company
Roongrat Pisuchpen Faculty of Engineering, Industrial Engineering, Kasetsart University, Bangkok, Thailand
Email: [email protected]
Papatsaraporn Rienthong Faculty of Engineering, Engineering Management Program, Kasetsart University, Bangkok, Thailand
Email: [email protected]
Abstract—This research is intended to study the techniques
of forecasting seasonal customers’ needs of sugar cane juice
by using time series analysis. The results of the forecast are
the quantities of overall sales of the 12 months from January
2016 to December 2016, calculated to seek for seasonal
sugarcane juice and related trends by concerning the limits
of manufacturing capacity, costs, and related services to
save costs and generate profits. The calculation for the
incurring expenditures from the process of ordering raw
materials and improper inventory management is done by
using Linear Programming. The study seeks the lowest total
cost of 5,707,362 THB. When comparing the new results
with the old system, 428,381.20 THB/year will be saved in
terms of freezing storage.
Index Terms—forecasting, inventory management, linear
programming
I. INTRODUCTION
Nowadays, the economy is in a recession and unstable
stage due to external factors, which inhibit small, medium
and large industries from developing and improving the
quality of their products and services. However, if the
industries are only thinking of quality competition, they
will not be able to maintain their current business.
Therefore, it is essential they consider other factors
altogether such as product price, and punctual and quick
shipping of their goods. Additionally, they need to
manufacture products that meet customer’s needs and
expectations while managing costs in order to maximize
profits. They also need to increase sales, reduce costs and
improve product quality and punctual delivery of
products due to the fact that it is difficult to increase sales
under the current economic recession.
The Beverage Company is the one processing seasonal
agricultural products. Oversupply or undersupply of raw
materials can affect the profits. As a result, inventory
Manuscript received March 28, 2017; revised June 24, 2017.
management is necessary to produce the amount of goods
necessary to be able to supply the market throughout the
year while incurring the lowest storage cost.
Currently, the company is aiming for inventory storage
of 1,000 CC. pasteurized sugar cane juice because of the
sales and its physical characteristics of long storage
period. Generally, pasteurized sugar cane juice can be
kept for 20 days under the temperature of 4° C or for 1
year under -18° C. Nevertheless, the cost for the storage
has increased every year to meet the demand of the goods.
The management of frozen goods is not yet optimized,
resulting in high cost of purchasing raw materials during
the period from July to October. To solve the inventory
problem, the forecast is a tool that can help improve the
management of raw materials. Linear Program is applied
to determine an adequate stock of processed goods in
order to fulfill sales throughout the year under the
constraint of a daily product.
The Purposes of the research are as follows:
1. To forecast customer demand by using the time
series analysis for the optimized sales of pasteurized
sugar cane juice.
2. To calculate the inventory storage to meet
customers’ demand to yield the lowest cost of production.
3. To find the most proper procedures to order raw
materials and proper management of inventory storage by
using Linear Program under constraints the seasonal
demand.
II. LITERATURE REVIEW
Donselaar et al. [1] show the difference between quick
and slow perishable goods in order to understand some
important parameters. The difference between those
goods is product lifetime; easily perishable goods have
shorter lifetime. Easily perishable goods have 30 day
lifetime, which depends on sales, and logistics of the
goods in different terms such as average weekly sales, the
coefficient of deviation of weekly sale, the frequency of
International Journal of Life Sciences Biotechnology and Pharma Research Vol. 6, No. 1, June 2017
1©2017 Int. J. Life Sci. Biotech. Pharm. Res.doi: 10.18178/ijlbpr.6.1.1-6

shipping, product lifetime, the average size of package as
a consumer unit, the minimum storage of products, the
agricultural forecast, the relation among other activities
that can’t be anticipated such as drought, famine or flood.
In the past, the shipping process relied on 2 factors: first,
farmers needed to develop agriculture for a short term
because it would be slower in a long biological term for
production. Second, as for the planting cycle, the
production was evaluated monthly or annually in terms of
quantity and quality in a year which fluctuates
accordingly to seasons [2].
The process to forecast sales and production to
increase the possibility of forecasts for other beverage
industries should be both long and short in terms of the
source of information and responsibility to the forecast as
shown in figure1.
To summarize, wine production [2] needs study and
application of forecast of long and short term. According
to the study of subjective and scientific methods, they
both are involved with the forecast of the productivity of
grapes in order to be more precise. Nevertheless,
quantitative study should be conducted by using other
additional factors. This study also displays the whole
picture and constraints of qualitative study.
Ahumada and Villalobos [3] introduced a model for
planning on a short term decision for the fresh food
industry. The development of this application offers high
incomes to farmers. The production and the extension of
the harvesting season from the plan clearly shows a
significant saving on the fresh food management, higher
wages and more product shipping for farmers.
Inventory can be categorized into 4 groups: raw
materials and pieces of them that are ordered, inventory
from the production process, finished products and
inventory of raw materials that are tools for maintenance
[4].
III. EXPERIMENTS
According to the whole purposes of this research, it is
for improving the standards and the methods of proper
control of inventory to reduce oversupply and
undersupply of pasteurized sugarcane juice.
A. Collection of Quantitative Data
The sales of 1,000cc Pasteurized sugarcane juice had
been collected from January 2011 to December 2015 and
arranged onto Microsoft Excel
B. To Forecast the Main Raw Material and the Demand
of Customer for Planning the Productivity is a 1
Year Term
The methods of forecast are (1) Simple Moving
Average (2) Simple Exponential Smoothing (3) Double
Exponential Smoothing (4) Holt-Winters Smoothing and
Decomposition Method. Each method is conducted with
Minitab Program. The forecast can be analyzed to find an
optimized method by checking Mean Absolute Deviation,
(MAD), Mean Absolute Percentage Error (MAPE) and
Mean Squared Deviation (MSD)
The outcome from comparing each forecast methods of
fresh sugarcane juice and 1,000cc Pasteurized sugarcane
juice is shown in Table I and Table II.
TABLE I. COMPARISON OF EACH FORECAST METHOD OF USING FRESH SUGARCANE AS A RAW MATERIAL
(Method) values used for (Mean Absolute
Deviation: MAD)
(Mean Square Deviation:
MSD)
(Mean Absolute
Percentage Error: MAPE)
(Single Moving Average)
2 months 10958 216624820 24
3 months 11519 219643192 24
6 months 12648 247066829 28
12 months 12558 253052803 29
(Single
Exponential Smoothing)
(Alpha) = 0.448180 10880 196407969 24
(Double
Exponential Smoothing)
(Alpha) = 0.851223 10979 225135254 25
(Gamma) = 0.018680
(Classical
Decomposition Method) -
Additive Decomposition
with trend
8628 145562068 21
(Classical
Decomposition Method) -
Multiplicative
Decomposition
with trend
8724 148746022 21
(Winters Method)
- Additive
(Alpha) = 0.1
10359 172384761 26 (Gamma) = 0.1
(Delta) = 0.1
(Winters Method) - Multiplicative
(Alpha) = 0.1 9135 141449803 22
International Journal of Life Sciences Biotechnology and Pharma Research Vol. 6, No. 1, June 2017
2©2017 Int. J. Life Sci. Biotech. Pharm. Res.
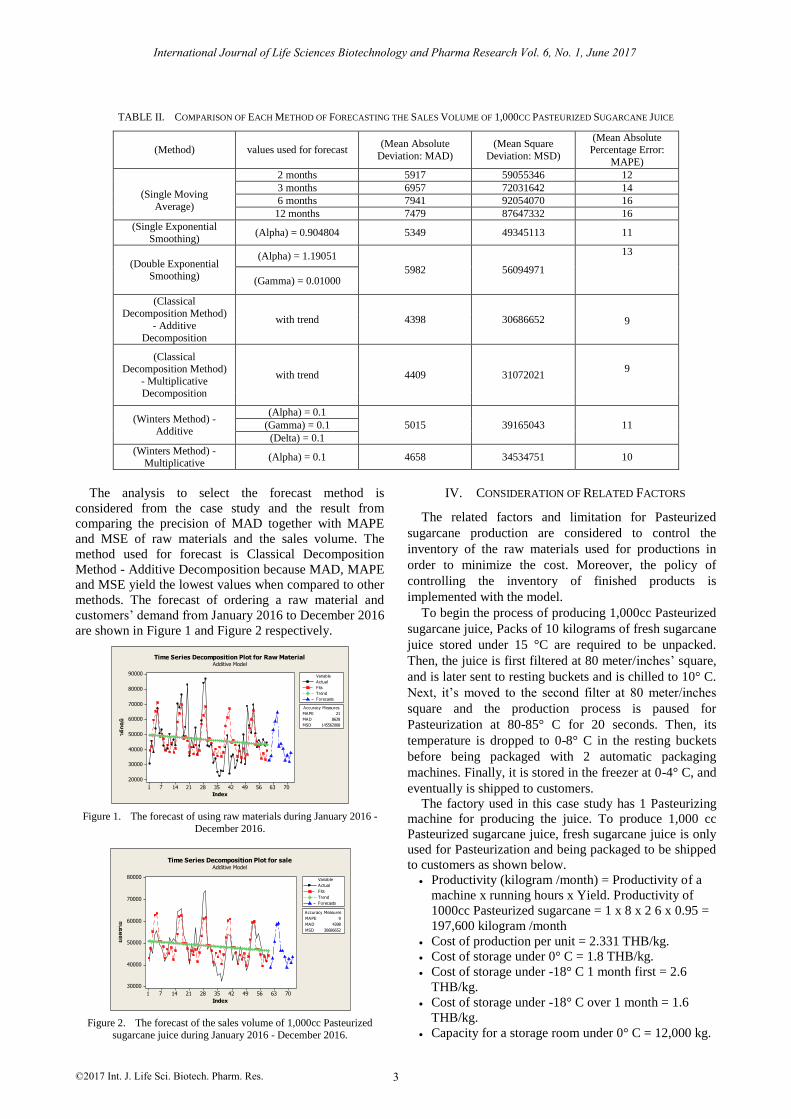
TABLE II. COMPARISON OF EACH METHOD OF FORECASTING THE SALES VOLUME OF 1,000CC PASTEURIZED SUGARCANE JUICE
(Method) values used for forecast (Mean Absolute
Deviation: MAD)
(Mean Square
Deviation: MSD)
(Mean Absolute Percentage Error:
MAPE)
(Single Moving
Average)
2 months 5917 59055346 12
3 months 6957 72031642 14
6 months 7941 92054070 16
12 months 7479 87647332 16
(Single Exponential
Smoothing) (Alpha) = 0.904804 5349 49345113 11
(Double Exponential Smoothing)
(Alpha) = 1.19051
5982 56094971
13
(Gamma) = 0.01000
(Classical
Decomposition Method)
- Additive
Decomposition
with trend 4398 30686652
9
(Classical Decomposition Method)
- Multiplicative Decomposition
with trend 4409 31072021 9
(Winters Method) - Additive
(Alpha) = 0.1
5015 39165043 11 (Gamma) = 0.1
(Delta) = 0.1
(Winters Method) - Multiplicative
(Alpha) = 0.1 4658 34534751 10
The analysis to select the forecast method is
considered from the case study and the result from
comparing the precision of MAD together with MAPE
and MSE of raw materials and the sales volume. The
method used for forecast is Classical Decomposition
Method - Additive Decomposition because MAD, MAPE
and MSE yield the lowest values when compared to other
methods. The forecast of ordering a raw material and
customers’ demand from January 2016 to December 2016
are shown in Figure 1 and Figure 2 respectively.
70635649423528211471
90000
80000
70000
60000
50000
40000
30000
20000
Index
วั
ตถั
ดั
บ
MAPE 21
MAD 8628
MSD 145562068
Accuracy Measures
Actual
Fits
Trend
Forecasts
Variable
Time Series Decomposition Plot for Raw MaterialAdditive Model
Figure 1. The forecast of using raw materials during January 2016 -
December 2016.
70635649423528211471
80000
70000
60000
50000
40000
30000
Index
ยอดขาย
MAPE 9
MAD 4398
MSD 30686652
Accuracy Measures
Actual
Fits
Trend
Forecasts
Variable
Time Series Decomposition Plot for saleAdditive Model
Figure 2. The forecast of the sales volume of 1,000cc Pasteurized sugarcane juice during January 2016 - December 2016.
IV. CONSIDERATION OF RELATED FACTORS
The related factors and limitation for Pasteurized
sugarcane production are considered to control the
inventory of the raw materials used for productions in
order to minimize the cost. Moreover, the policy of
controlling the inventory of finished products is
implemented with the model.
To begin the process of producing 1,000cc Pasteurized
sugarcane juice, Packs of 10 kilograms of fresh sugarcane
juice stored under 15 °C are required to be unpacked.
Then, the juice is first filtered at 80 meter/inches’ square,
and is later sent to resting buckets and is chilled to 10° C.
Next, it’s moved to the second filter at 80 meter/inches
square and the production process is paused for
Pasteurization at 80-85° C for 20 seconds. Then, its
temperature is dropped to 0-8° C in the resting buckets
before being packaged with 2 automatic packaging
machines. Finally, it is stored in the freezer at 0-4° C, and
eventually is shipped to customers.
The factory used in this case study has 1 Pasteurizing
machine for producing the juice. To produce 1,000 cc
Pasteurized sugarcane juice, fresh sugarcane juice is only
used for Pasteurization and being packaged to be shipped
to customers as shown below.
Productivity (kilogram /month) = Productivity of a
machine x running hours x Yield. Productivity of
1000cc Pasteurized sugarcane = 1 x 8 x 2 6 x 0.95 =
197,600 kilogram /month
Cost of production per unit = 2.331 THB/kg.
Cost of storage under 0° C = 1.8 THB/kg.
Cost of storage under -18° C 1 month first = 2.6
THB/kg.
Cost of storage under -18° C over 1 month = 1.6
THB/kg.
Capacity for a storage room under 0° C = 12,000 kg.
International Journal of Life Sciences Biotechnology and Pharma Research Vol. 6, No. 1, June 2017
3©2017 Int. J. Life Sci. Biotech. Pharm. Res.

Beginning inventory Quantity Dec15 = 3,094 kg.
Raw material cost per unit (Nov-Jun) = 7 THB/kg.
Raw material cost per unit (Jul-Oct) = 8 THB/kg.
Demand for raw materials = The sales forecast for
2016
The ability to find raw materials = The Forecasts
Raw material 2016
Form of storage; first come first served (FIFO)
V. FINDING THE RESULT BY USING LINEAR PROGRAM
Related variables: i = month
Di = sales volume/sales volume prediction (kilogram)
X1i = productivity (kilogram)
I0i = volume of beginning inventory (kilogram)
Ii = volume of end inventory (kilogram)
SSi = volume of spare inventory (kilogram)
Y1i = volume of storage under 0-4 ° C
Y2i = volume of freezing storage (kilogram)
C1i = cost of production per unit (baht/kilogram)
P1i = cost of raw material per unit (baht/kilogram)
E1i = expenditure per unit (baht/kilogram)
C2i = cost of storage under 0-4 ° C (baht/kilogram)
C3i = cost of freezing storage under -18° C (baht/kilogram)
C3ai = cost of freezing storage, first month (baht/kilogram)
C3bi = cost of freezing storage, the next month (baht/kilogram)
TC1 = Total cost of production
TC2 = Total cost of storage under 0-4° C
TC3 = Total cost of freezing storage under -18° C
Z = Total cost (baht/kilogram)
C = productivity (kilogram)
Ri = forecast of raw materials (kilogram)
S = area for the factory (kilogram)
The program covers the related factors and constraints
to find the optimized volume of inventory to minimize
the cost, as follows; Formulate a mathematic model
shows the target of the optimum volume of production
and storage for the lowest total cost or closest to the
actual plausible volume.
Min Z= the total cost of production + the total cost of
storage.
= [(the cost of product per unit + the expenditure
of production per unit) x productivity] + [the cost of
storage per unit (4 °C) x end product] + [the cost of
storage per unit (-18 °C) x the volume of frozen products]
Min Z= TC1i + TC2i + TC3i (1)
= C1iX1i+ C2iY1i+ C3iY2i (2)
= [(P1i + E1i) x X1i] + [(C2i x Y1i)] + [(C3i x Y2i)] (3)
with -safety stock (SSi) = Y1i
-inventory (end product) Ii = Y1i + Y2i
-the cost of freezing storage C3i can be
subdivided into C3ai and C3bi
If Y2i = 0, it means there is no freezing storage. Ii = Y1i (or
SSi) = I0i + X1i - Di yields
If Y2i ≠ 0, it means there is freezing storage which can be
subdivided into 2 cases as follow:
1. Y2i > Y2(i-1) indicates that there is an increasing freezing
storage from the previous month yielding this equation:
Min Z= [(P1i + E1i) x X1i] + [(C2i x Y1i)] + [(C3ai x (Y2i –
Y2(i-1))] + [(C3bi x (Y2(i-1))]
2. Y2i ≤ Y2(i-1) indicates that there is the freezing storage of
the previous month was used yielding an equation as
Min Z = [(P1i + E1i) x X1i] + [(C2i x Y1i)] +[(C3bi x (Y2i)]
** Ii > Y1i (or SSi) so, Ii - Y1i = Y2i
- Safety Stock (SSi or Yi) >= average sales volume daily
x3
-Safety Stock (SSi or Yi) <= the size of freezing room for
inventory storage of 12,000 kilogram
-freezing inventory (Ifi) >= 0
Limitation in equation
-productivity of fresh sugarcane juice (Xi) >= 0
-productivity of fresh sugarcane juice (Xi) <= productivity
of 197,600 kilogram per month
During July to October period, the raw materials give
less fresh sugarcane than other period. The limitation is
the undersupply problem leads to insufficient sales
volume. The constraints of searching for the raw
materials are:
-productivity of fresh sugarcane juice (Xi) during July to
October <= capability of searching for the raw materials
(forecast of the raw materials*(2/3))
Constraints on inventory
-Beginning inventory (I0i) >= 0
-End inventory(Ii) >= 0
VI. RESEARCH AND PROCEDURES
This research is intended to find the optimized volume of production and inventory storage to meet customers’ demand with the goal of reaching the lowest cost. Calculate the inventory management is done by using Linear Programming with the results shown in Table III. As for the condition and constraints, the calculation for the optimized use of the raw materials and optimized story to meet customers’ needs is that input raw materials is equal to productivity without inventory storage because the product is easily perishable, which can be stocked as spare inventory at least 3 days.
The limitation is the undersupply problem during July to October that leads to insufficient sales volume. 12,000 kilograms of inventory a day can be stored either by chilling it at 0-4° C or freezing at -18° C. At 0-4° C Pasteurized sugarcane juice lasts 20 days while at -18° C it lasts 1 year with the same physical characteristics. The lowest total yielded cost is 5,707,362.29 baht.
Furthermore, the new policies are analyzed with Sensitivity Analysis of the total cost as follow.
A. The Change in Price of Raw Materials in Each
Period
Figure 3. The sensitivity analysis of the total cost to the change in price of raw materials in each period.
61
International Journal of Life Sciences Biotechnology and Pharma Research Vol. 6, No. 1, June 2017
4©2017 Int. J. Life Sci. Biotech. Pharm. Res.

Sensitivity Analysis of the total cost which is
calculated from the cost of production and storage shows
2 periods of change in cost of raw materials: November-
June and July-October. It is found that the total cost
increases in both periods; however, the change in cost
during November to July has more effect on the total cost
as forecast as there is more order of raw materials.
TABLE III. SALES AND STORAGE VOLUME IN 2016
B. The Change in Purchase of Raw Materials during
July to October
Figure 4. Sensitivity analysis of the total cost to the change in volume of purchase of raw materials during July to October.
Besides, sensitivity analysis of the total cost to the
change in volume of purchase of raw materials during
July to October shows that if the company can manage to
get 40% more of raw materials within the period, it can
save 156,330 baht of the cost annually. If 80%, 253,388
baht per year will be saved, which covers the whole
monthly sales and decreases the cost of freezing storage.
C. The Change in Size of a Chilling Room
Although the size of the room during July to August is
the same, it can’t lower the cost; if the capacity of storage
increases from 12,000 kilograms to 18,000 kilograms, the
cost saved is a little, only 4,800 baht.
From Sensitivity Analysis of the total cost to the 3
changes as mentioned above, it is found that the change
in the purchase of raw materials during July to August
has the biggest impact to the total cost. If the company
can manage to purchase more raw materials during that
period, it can save more cost up to 100,000 baht without
extending or increasing the number of freezing rooms.
VII. CONCLUSIONS
The study demonstrates the quantitative data and the
forecast of factors of productions and yields during 12
months of which the problem of managing the volume of
inventory of raw materials is too much, and the storage is
not compatible with the production and the management
of inventory. This case study uses the techniques of
forecast, the research of processing and simulated
situations to manage the inventory of raw materials to
decrease related expenditures and to provide the
optimized outcome. The study seeks the lowest total cost
of 5,707,362 THB.
REFERENCES
[1] K. V. Donselaar, T. V. Woensel, R. Broekmeulen, and J. Fransoo, “Inventory control of perishables in supermarkets,” International
Journal of Production Economics, vol. 104, no. 2, pp. 462-472, 2006.
[2] S. Steinhagen, J. Darroch, and B. Bailey, “Forecasting in the wine
industry: An exploratory study,” International Journal of Wine Marketing, vol.10, no. 1, pp. 13-24, 1998.
[3] O. Ahumada and J. R. Villalobos, “Operational model for planning the harvest and distribution of perishable agricultural
products,” International Journal of Production Economics. vol.
133, no. 2, pp. 677-687, 2011. [4] J. Zabawa and B. Mielczarek, “Tools of Monte Carlo simulation in
inventory management problems,” in Proc. 21st European Conference on Modelling and Simulation, European Council for
Modeling and Simulation, Czech Republic, 2007, pp. 56-61.
International Journal of Life Sciences Biotechnology and Pharma Research Vol. 6, No. 1, June 2017
5©2017 Int. J. Life Sci. Biotech. Pharm. Res.

Roongrat Pisuchpen received her
Bachelor of Engineering in Industrial
Engineering from Kasetsart University
(Thailand), Master of Engineering in
Industrial and Systems Engineering and
PhD in Industrial and Systems
Engineering from Asian Institute of
Technology (Thailand). Currently, she is
an Associate Professor in Industrial
Engineering at Engineering Faculty, Kasetsart University in
Bangkok. Her main research interests include Petri Net models,
simulation modeling and analysis, and applications of
operations research.
Papatsaraporn Rienthong received her
Bachelor of Industrial Engineering,
from the University of Mahidol, Master
of Engineering in Engineering
Management, from Kasetsart University
(Thailand). Her work experience in
2009-2013, she was Logistic planner in
planning department at Thai Beverage
Logistic Co., Ltd., Bangkok, Thailand.
At present, she was Assistant Manager
at Numaoyraimaijon Co., Ltd., Ratchaburi, Thailand.
International Journal of Life Sciences Biotechnology and Pharma Research Vol. 6, No. 1, June 2017
6©2017 Int. J. Life Sci. Biotech. Pharm. Res.